Attached files
| file | filename |
|---|---|
| 8-K - FORM 8-K - GEORESOURCES INC | d8k.htm |
| EX-99.1 - PRESS RELEASE - GEORESOURCES INC | dex991.htm |
 GeoResources, Inc
Corporate Profile
October 2010
Exhibit 99.2 |
 2
Forward-Looking Statements
Information
herein
contains
forward-looking
statements
that
involve
significant
risks
and
uncertainties,
including
our
need
to
replace
production
and
acquire
or
develop
additional
oil
and
gas
reserves,
intense
competition
in
the
oil
and
gas
industry,
our
dependence
on
our
management,
volatile
oil
and
gas
prices
and
costs,
with
hedging
activities
and
uncertainties
of
our
oil
and
gas
estimates
of
proved
reserves
and
reserve
potential,
all
of
which
may
be
substantial.
In
addition,
all
statements
or
estimates
made
by
the
Company,
other
than
statements
of
historical
fact,
related
to
matters
that
may
or
will
occur
in
the
future
are
forward-looking
statements.
Readers
are
encouraged
to
read
our
December
31,
2009
Annual
Report
on
Form
10-K
and
Form
10-K/A
and
any
and
all
of
our
other
documents
filed
with
the
SEC
regarding
information
about
GeoResources
for
meaningful
cautionary
language
in
respect
of
the
forward-looking
statements
herein.
Interested
persons
are
able
to
obtain
free
copies
of
filings
containing
information
about
GeoResources,
without
charge,
at
the
SEC’s
internet
site
(http://www.sec.gov).
There
is
no
duty
to
update
the
statements
herein. |
 3
Key Investment Highlights
Value Creation
Significant Bakken and Eagle Ford upside
Strategically located in high Rate of Return Resource plays
High Level of operating control
Significant Bakken Exposure
24,000 net operated acres
13,000 net non-op acres
37,000 TOTAL ACRES
Rapidly expanding Eagle Ford Position
11,000 net acres
Commitment for additional leases
Solid Proved Reserve and Production
Base
24 Mmboe proved reserves (as of 7/1/10)
are 56% oil
5,158 BOE/d average 1H:2010 |
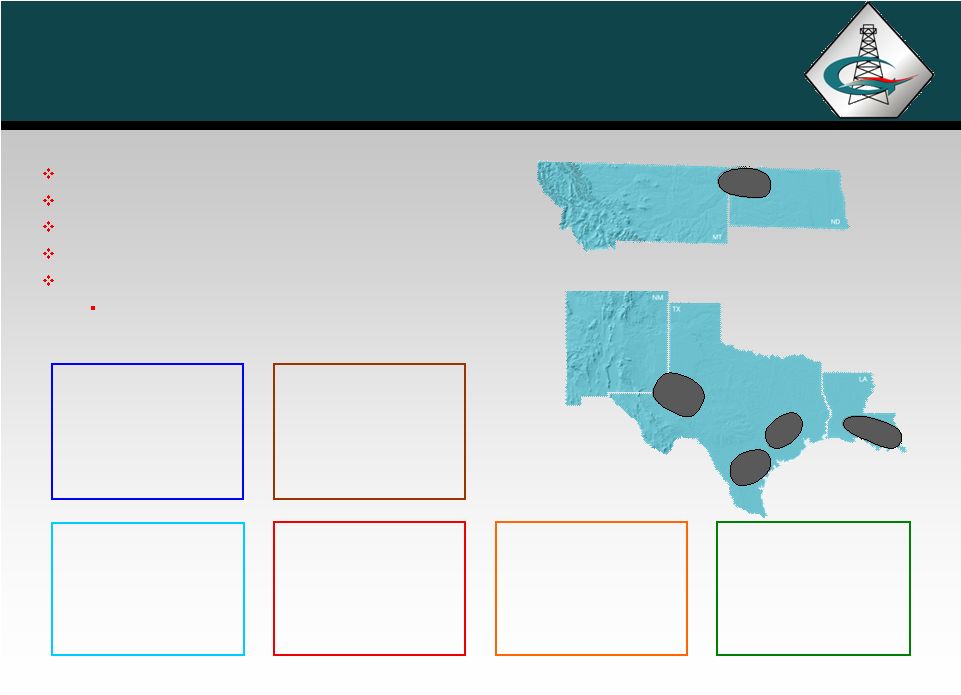
 4
Geographic
Overview
(1)
Represents the Company’s average production rate YTD June 30,
2010. (2)
Acreage information estimated as of June 30, 2010.
(3)
Map depicts focus areas and excludes minor value properties.
.
4
Company
Highlights
37,000 net
acres in Bakken
11,000 net
acres in Eagle
Ford
Proved Reserves (MMBOE)
24.0
Oil
56%
Proved Developed
73%
PV 10% (millions)
$384
Production (BOEpd)
(1)
5,158
Oil
54%
Operated
80%
Gross Acreage
(2)
526,374
Net Acreage
(2)
239,770 |
 5
Proved
Reserves
(MMBOE)
(2)
Average
Daily
Production
(BOEpd)
Reserves
and Production
Current
Proved
Reserves
–
24.0
MMBOE
(1)
(1) Excludes partnership interests. (2) 2006 –
2009 proved reserves based on SEC guidelines.
(3) 2008 Reserves reflect lower prices and divestitures. (4)
7/1/10 strip prices based on NYMEX strip as of 6/30/10. |
 Oil Weighted
Development
GeoResources
Asset Overview
6 |
   7
Bakken Shale Overview
150,000 (37,000 net) acres in the Bakken Shale
50,000 (24,000 net) operated acres
100,000 (13,000 net) non-operated acres
Bakken Operated Project
50,000 acres in Williams County, ND
Retained 47.5% WI and operations
24,000 net acres
Drilling started in September 2010
Bakken Non-Operated Project
Partnered with Slawson Exploration
100,000 acres in Mountrail Co., ND
10-18% WI
13,000 net acres
Currently three rigs operating by Slawson
72 Slawson-operated wells drilled to date
Plan to drill 100 wells in the next 2 years
CANADA
ND
MT
50 miles
Williams
County
Parshall
Sanish
7 |
 Bakken
Shale Operated
Williams County, ND Acreage
8
24,000 Net Acres with 47.5% WI
and Operations
Drilling Carlson #1-11H (640 ac
unit) as the 1
st
of 3 wells to be
drilled in 2010
Impressive Offsetting Activity
•
7 nearest southern offsets
have NDIC-reported initial
rates of 1,181-1,947
BOPD
•
5 rigs drilling within or
immediately south of AMI
8 |
 9
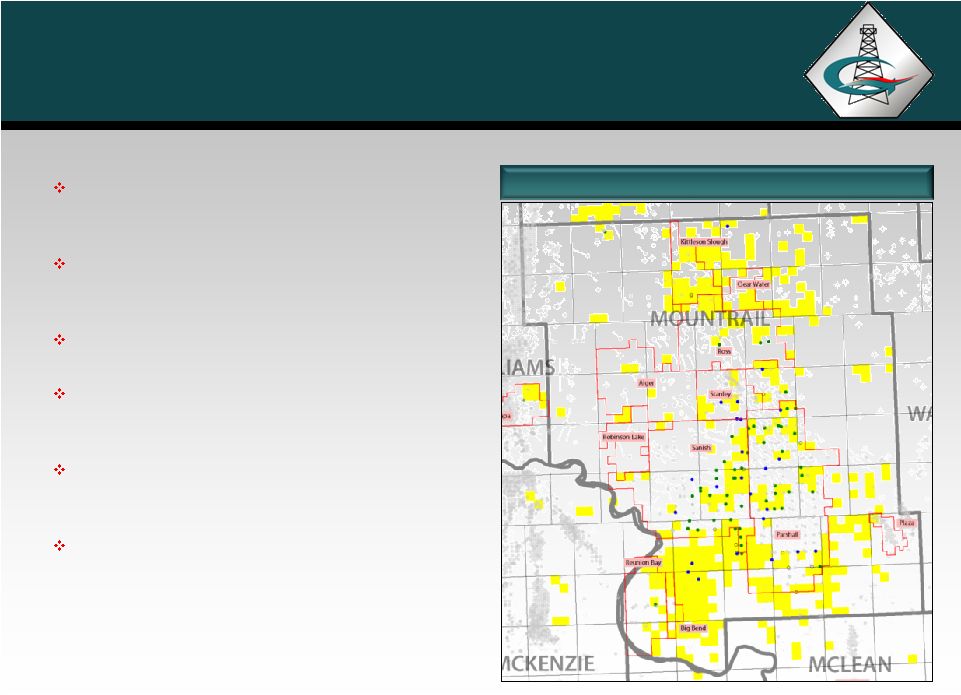
Bakken Shale
Non-operated
Bakken Shale
Note: Yellow-highlighted areas represent the Company’s acreage
position. Partnered with experienced operator -
Slawson Exploration
Working interests ranging from 10% to 18%
in 100,000 acres
13,000 net acres
Slawson has three rigs running currently and
has drilled 72 wells
Slawson drilling Three Forks well with
encouraging offset results by EOG & Whiting
Slawson plans to drill 100 wells in the next 24
months
9 |
 Eagle
Ford 10
Eagle Ford AMI
140,000 acre AMI
22,000 acres (11,000 net)
GEOI retains 50% WI and
operations
Strong industry partner
purchased 50% of acreage
Will fund six horizontal
wells
Joint commitment for
additional leasing |
 Eagle
Ford AMI 11
Eagle Ford AMI
•
Volatile oil / gas condensate window
•
On strike with Gonzales Co. activity
•
Could spud first well before yr-end
2010
•
Offset operator activity
•
Magnum Hunter recently frac’d
their 1
st
well in Gonzales Co.
•
EOG has multiple completions in
Gonzales Co. with Initial Rates
up to 2000 bopd
/ 1.8 MMCFPD
•
Clayton Williams has completed
2 wells to the NE in Burleson Co. |
 Additional Assets |
 13
Giddings Field –
Austin Chalk
68,000 Acres (29,000 net acres)
16 wells drilled –
100% success
20 additional drilling locations
WI ranges from 37% -
53%
Operate majority of Giddings asset
Majority of acreage Held-by-
Production
Eastern Giddings Development Area
Eastern acreage in Grimes and
Montgomery Counties is dry gas
Western acreage is liquids-rich gas
and condensate
Longstreet 1H Produced 1.0 BCFG
in 67 days
Additional Upside Includes:
Yegua and Georgetown potential
Rate increase potential from slick
water fracture stimulations
Eagle Ford AMI announced SW of
Giddings acreage
13
APACHE
APACHE
APACHE
APACHE
APACHE
CWEI
CWEI
MAGNUM-HUNTER
Lee
Washington
Waller
Fayette
Austin
Colorado
Milam
Brazos
Grimes
Burleson
Giddings Field Acreage
Eagle Ford AMI |
 14
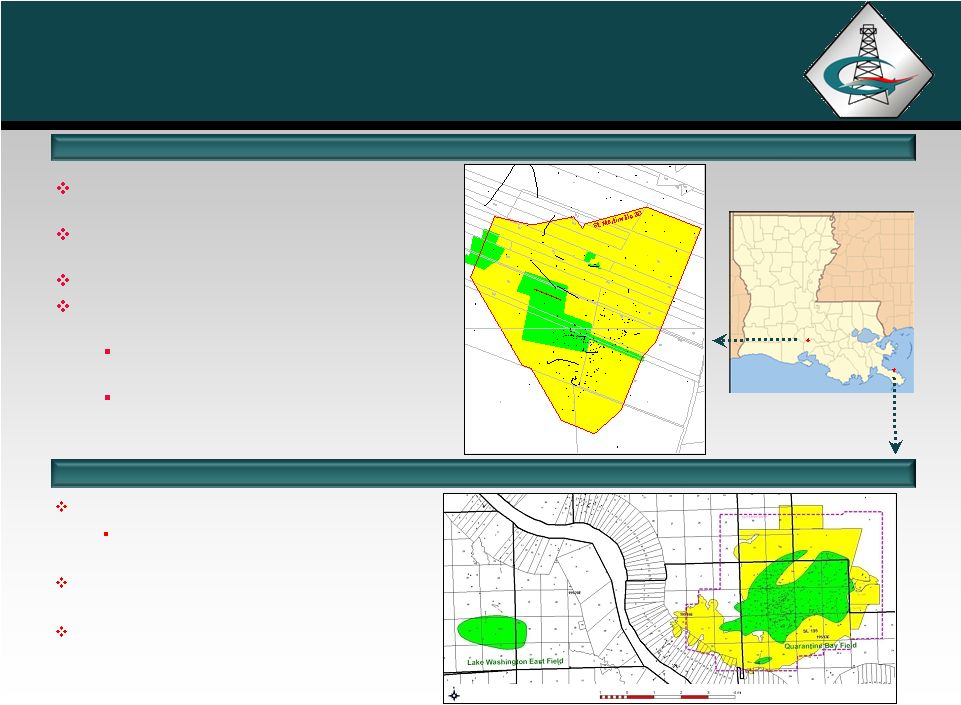
Louisiana -
Louisiana -
St. Martinville & Quarantine Bay
St. Martinville & Quarantine Bay
534 net acres of owned minerals
(green)
2,585 net acres of HBP or leased
(yellow)
Average WI 97% & NRI 91%
Main objectives Miocene age multi-
sand oil, from 3,000’
–
7,000’
Cumulative shallow production of
15.2 MMBO and 16.6 BCFG
Most recent STD of Kansas #7 is
250 MBO with well cost of $1.0
million.
LOUISIANA
Quarantine Bay Field
St. Martinville Field
14,000 gross acres
7% WI above 10,500’
and a 33% WI
below 10,500’
Cumulative production of 180 MMBO and
285 BCF
Shallow zone behind pipe potential
(<10,500’) and significant deeper exploration
potential (11-23,000’)
14
126
1
1
1
2
3
4
5
3-1
2
1
1
2
1
1
2
1
2
3
3
3ST1
2
1
1
2
1
1
1
1
1
2
1
1
1
2
3
1
5
3
4
1
1
41
211
1
1
1
³
2
1
2
1
1
1
1B
6A
1211
33
2
4
1
1
4
1
5
3
2
¹
1
11
9A
14A
15A
11A32A
10A
13A
12A
3A
5A
4A
16A24A
17A
7A
2
1
4C
1
2
1
3
1
2
2
1
1
1
5
7D
6D
8A
6
1
2
1
3
7
5
4
1C
1
1D
1
1
1
1A
2A
18A31A
19A
1
20A
21A
22A
1
1
2
23A
1
8
9
3
2
10
11
1
3
¹1²
12
13
1
1
25A
1
2
3
1
14
4
15
16
1
1
2
17
6
13
6
2
18
1
21²3
3
19
1E
20
4
26A
2
27A
¹
28A
1
23
5E
21
2
1
29A
8D
1
1
2
30A
1
1D
2
9D
33A
6
22
1
34A
35A
7
8
1
10D
4
37A
38A
41A
36A
39A
40A
1
5
7
42A
43A
1
1
1
7
8
9
2E
44A
1
1
1
45A
4
5
1
1
1
46A
47A(2)
1
6
48A
49A
50A
54
1
51A
52A
1
2
7
53
1
A-53 |
 Financial Overview |
 16
2H:2010 Development Program
Project
Budgeted
Comments
$(Millions)
Bakken
Operated
$6.9
3 wells
Non-Operated
10.3
18 -
20 wells
Rip-Rap
1.3
Initial well Montana
St. Martinville
4.2
4 wells
$22.7
2H:2010 Drilling Budget
Project Inventory Allows Flexibility
Weighted towards oil and liquids
Oil and gas projects in inventory
Exploration and development
projects in inventory
Held by long-term leases or
production
Current Allocations Favors Lower-
Risk, High Cash Flow Oil Projects
Capital Allocations
16 |
 17
EBITDAX
Debt / EBITDAX
Can fund current CapEx
with cash flow and debt capacity
Conservative use of leverage to maintain strong balance sheet
$145 Million borrowing base
EBITDAX :
2
nd
Quarter = $17.7 Million
YTD 2010 = $35.6 Million
Annualized = $71.2 Million
Total debt of $65.0 million proforma
October 2010
Strong Financial Position |
 APPENDIX |
 19
Net Asset Value
Net Asset Value
(1)
Nymex
strip pricing at June 30, 2010.
(2)
At June 30, 2010, excluding derivative financial instruments.
(3)
Assumed $2,000 per net acre for Bakken
& Eagle Ford acreage plus book value at 6/30/10 for other areas.
(4)
Proforma
–
October 2010.
($ in millions)
PV-10
(1)
% of Total
Proved Reserves:
Proved Developed Producing
246.0
$
64.1%
Proved Developed Non-Producing
63.0
16.4%
Proved Undeveloped
74.8
19.5%
Total Proved PV-10 Value
383.8
$
100.0%
Plus:
Working Capital
(2)
18.4
$
Unproved Property
(3)
96.2
Partnership Value
16.8
Less:
Total Debt
(4)
(65.0)
Total Net Asset Value
450.2
$
Shares Outstanding (thousands)
19,713
Net Asset Value Per Share
22.84
$
June 30, 2010
19 |
 20
Management History
2004-2007
Southern Bay Energy, LLC
Gulf Coast, Permian Basin
REVERSE MERGED INTO
GEORESOURCES, INC.
2000-2007
Chandler Energy, LLC
Williston Basin, Rockies
ACQUIRED BY
GEORESOURCES, INC.
1988-2000
Chandler Company
Rockies, Williston Basin
MERGED INTO
SHENANDOAH THEN SOLD
TO QUESTAR
1992-1996
Hampton Resources Corp
Gulf Coast
SOLD TO BELLWETHER
EXPLORATION
Preferred investors –
30% IRR
Initial investors –
7x return
1997-2001
Texoil
Inc.
Gulf Coast, Permian Basin
SOLD TO OCEAN ENERGY
Preferred investors –
2.5x return
Follow-on investors –
3x return
Initial investors –
10x return
2001-2004
AROC Inc.
Gulf Coast, Permian Basin, Mid-Con.
DISTRESSED ENTITY LIQUIDATED
FOR BENEFIT OF INITIAL
SHAREHOLDERS
Preferred investors –
17% IRR
Initial investors –
4x return
Track record of profitability and liquidity
Extensive industry and financial relationships
Significant technical and financial experience
Long-term repeat shareholders
Cohesive management and technical staff
Team has been together for up to 21
years through multiple entities |
 21
Proved Reserves
Proved Reserves by Category
Proved Reserves by Area
Partnership
Proved
% of
Interests
Total Proved
% of Total
Area
MMBOE
Proved
MMBOE
MMBOE
Reserves
Central and South Texas
9.1
37.9%
1.5
10.6
41.4%
Williston
6.7
27.9%
0.0
6.7
26.2%
Louisiana
3.8
15.8%
0.0
3.8
14.8%
Other
4.4
18.4%
0.1
4.5
17.6%
Total
24.0
100.0%
1.6
25.6
100.0%
($ in millions)
Oil
Gas
Total
% of
Corporate Interests
MMBO
BCF
MMBOE
Total
PV-10
PDP
8.3
37.4
14.6
60.8%
$246.0
PDNP
2.1
5.4
3.0
12.5%
63.0
PUD
3.1
20.3
6.4
26.7%
74.8
Total Proved Corporate Interests
13.5
63.1
24.0
100.0%
383.8
Partnership Interests
0.1
9.1
1.6
16.8
Total Proved Corporate and Partnerships
13.6
72.2
25.6
$400.6
21 |
 22
Production and operating costs
Historical Production Data
Historical Operating Netback Data
YTD 2010
(1)
2nd
Qtr 2010
2009
2008
Oil Production (MBbls)
504
255
851
743
Gas Production (MMCF)
2,580
1,300
4,944
2,962
Total Production (Mboe)
934
472
1,675
1,237
Avg. Daily Production (Boe/d)
5,158
5,184
4,589
3,388
YTD 2010
(1)
2nd
Qtr 2010
2009
2008
($ per BOE)
Revenue
$56.72
$55.94
$48.01
$76.50
Less:
LOE
$10.94
11.00
$11.20
$18.53
G&A
4.13
4.32
5.07
5.80
Other Field Level Opex
(2)
4.10
3.80
3.84
8.92
Total Field Level Operating Costs
$19.17
$19.12
$20.11
$33.25
Field Level Operating Netback
$37.55
$36.82
$27.90
$43.25
22
(1)
June 30, 2010.
(2)
Represents severance tax expense and re-engineering and workover expense.
|
 23
Income Statement
Historical Operating Data
($ in millions except per share data)
YTD 2010
2nd Qtr. 2010
2009
2008
Key Data:
Average realized oil price ($/Bbl)
70.55
$
70.48
$
61.09
$
82.42
$
Avg. realized natural gas price ($/Mcf)
5.25
$
4.90
$
3.97
$
8.12
$
Oil production (MBbl)
504
255
851
743
Natural gas production (MMcf)
2,580
1,300
4,944
2,962
Total revenue
53.0
$
26.4
$
80.4
$
94.6
$
Net income before tax
17.2
$
7.3
$
14.8
$
21.3
$
Net income after tax
10.5
$
4.4
$
9.8
$
13.5
$
Net income per share (basic)
0.53
$
0.23
$
0.59
$
0.87
$
EBITDAX
35.6
$
17.7
$
48.2
$
54.2
$
23 |
 24
Hedging Strategy
Oil Hedges
GEOI uses commodity price risk management in order to execute its business plan
throughout commodity price cycles.
Overall, about 67% of production is hedged for 2010 and 58% is hedged for
2011. Natural
gas
hedges
include
hedge
volumes
intended
to
cover
GEOI’s
share
of
partnership
production.
Term of hedges is July 1, 2010 through December 31, 2012.
Natural Gas Hedges
24 |
 25
Additional Disclosures
25 |