Attached files
| file | filename |
|---|---|
| 8-K - CURRENT REPORT - CEDAR FAIR L P | d8k.htm |
 1
Exhibit 99 |
 2
Forward Looking Statements
Some
slides
and
comments
included
here,
particularly
related
to
estimates,
comments
on
expectations
about
future
performance
or
business
conditions,
may
contain
forward
looking
statements.
These
statements
may
involve
risks
and
uncertainties
that
are
difficult
to
predict,
may
be
beyond
our
control
and
could
cause
actual
results
to
differ
materially
from
those
described
in
such
statements.
Although
we
believe
that
the
expectations
reflected
in
such
forward-looking
statements
are
reasonable,
we
can
give
no
assurance
that
such
expectations
will
prove
to
be
correct.
Important
factors,
including
those
listed
under
Item
1A
in
the
Partnership’s
Form
10-K,
could
adversely
affect
our
future
financial
performance
and
cause
actual
results
to
differ
materially
from
our
expectations. |
 3
Richard Kinzel
Chairman, President and Chief Executive Officer
Cedar Fair Entertainment Company
Peter Crage
Corporate VP of Finance and Chief Financial Officer
Cedar Fair Entertainment Company
Speakers |
 4
AGENDA
Investment Highlights
YTD Financial Results
2010 Outlook
Long-Term Strategy
Growth Goals & Catalysts
Key Metrics
Capital Structure
Cash Flows
Distribution Strategy
Q&A |
 5
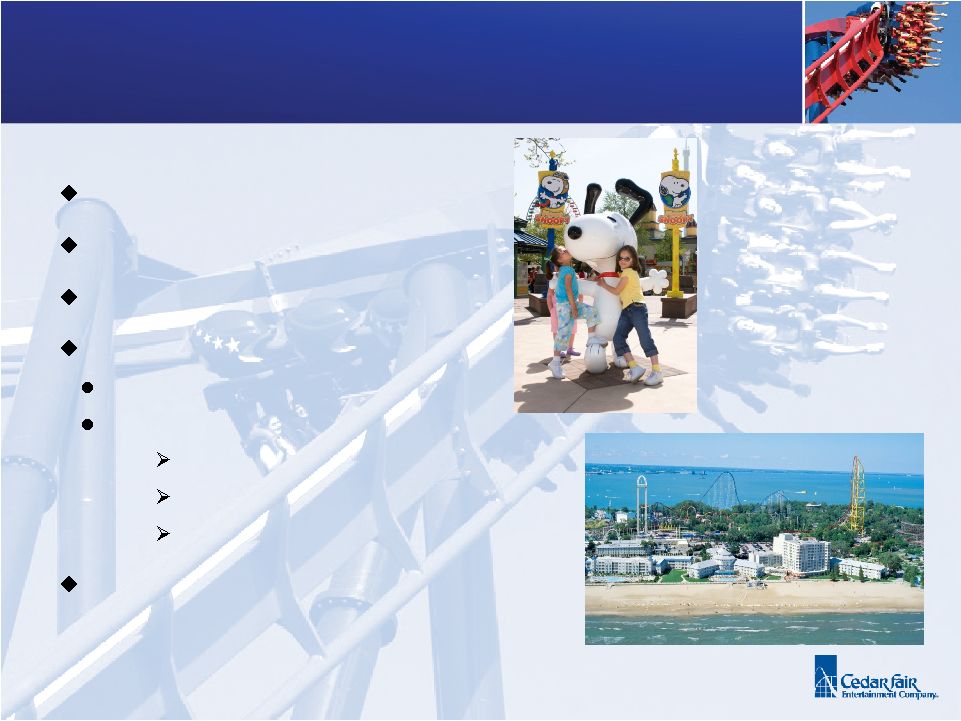
Investment Highlights
Recognized innovative leader in regional amusement parks, water
parks, resorts and active entertainment
Attractive park locations and diverse geographical footprint
High-margin industry niche with significant barriers to entry
Strong and distinctive brands known for high-quality, pristine parks
with cutting-edge attractions
Consistently voted “Best in Class”
Proven and stable business model that consistently generates a
healthy revenue stream and strong cash flows in all economic
climates
A “Total Return”
investment
Growth strategy designed to increase revenues, adjusted EBITDA and
cash flows while further reducing debt
Experienced and proven management team focused on sustainable
long-term value creation for unitholders |
 6
Overview of Financial Results
Year-to-Date Performance (unaudited)
Cedar Fair reports strong summer season operating results
In millions, except per capita amounts
9/5/2010
9/6/2009
Change
% Change
Total revenues
$ 824
$ 792
$ 32
4.0%
Attendance
18.8
17.9
0.9
5.0%
Average in-park guest per
capita spending
$ 39.28
$ 39.75
$ (0.47)
-1.2%
Out-of-park revenues
$ 87
$ 82
$ 5
6.1% |
 7
Financial Highlights (through Sept. 5, 2010)
Southern Region Parks
In-park revenues up 9%
Attendance up 444k visits
World-class roller coasters introduced at
Kings Dominion and Carowinds
Northern Region Parks
In-park revenues up 3%
Attendance up 83k visits
Out-of-park revenues up more than 10%
Western Region Parks
In-park revenues up 3%
Attendance up 378k visits
Successful change to season pass
strategy –
volume approach
Positive response to the Planet Snoopy
children’s areas introduced at various
parks across all regions |
 8
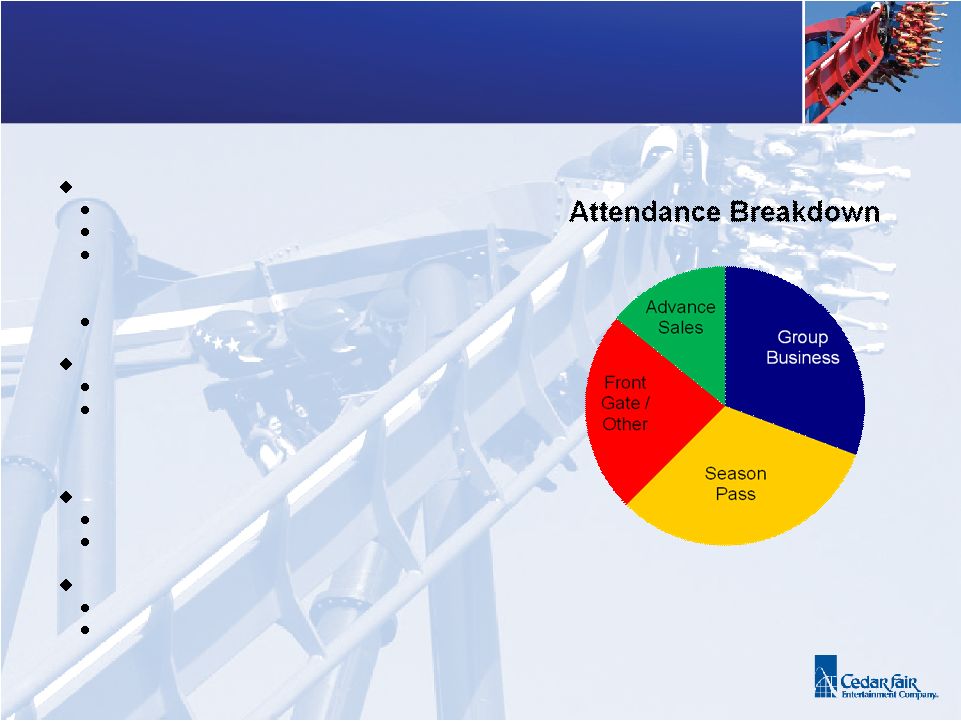
Financial Highlights (through Sept. 5, 2010)
Season Pass Sales/Visits
Revenues from pass sales up ~$16 million
Season pass visits up 870k
Results driven by “value price”
marketing
campaign geared towards families and
targeted capital expenditures
High perceived value
Group Business
365k visit increase
Return of group business due to stabilizing
economy and favorable, albeit modest,
employment trends
Advanced Sales
Up slightly year-over-year
Online promotions to create urgency
Front Gate/Other
Down 395k visits
Successfully converted portion of visitors to
season pass business and some to
advanced sales |
 9
2010 Outlook
Reaffirm 2010 Company
Guidance
Revenues between $940 million
and $965 million
Adjusted EBITDA, excluding one-
time costs, between $320 million
and $340 million
Cash interest costs ~$130
million
Cash taxes of $20 million to
$23 million
2010 Capital Expenditures ~$85
million |
 10
2010 Outlook
Other Fall Special Events Include:
Rev3 Triathlon Event at Cedar Point
Christian Music Concerts at Cedar Point and
Carowinds
Cheerleading Events at Kings Dominion,
Carowinds and California’s Great America
Approx. 15% of Operating Season Still Remaining (as of September 5,
2010) Award Winning Halloween Events
Several parks charge separate gate
admission |
 11
Long-Term Financial Goals
Grow revenues by 10% to 14% by 2015
(~2.3% CAGR)
Grow adjusted EBITDA by 10% to 14%
by 2015 (~2.3% CAGR)
Achieve free cash flows of $120 million to
$140 million on an annual basis during
2012 to 2015
Reduce Consolidated Leverage Ratio to
4.0x in 2013
Provide for a responsible, sustainable
and growing distribution to unitholders
Goal of $1.25 to $1.75 per limited partner
unit (“LP unit”) by 2015
Represents a10%-14% annual yield based
on today’s market price
Our proven and stable business model should allow us to:
|
 12
Long-Term Growth Strategy
Steadily grow attendance and revenues
through continued investment in trend-
setting new rides and attractions along
with new targeted marketing programs
Maintain strict controls over operating
costs while maintaining “best-in-class”
visitor experience
Further reduction of debt through the
prudent use of excess cash flows
Provides balance sheet flexibility to take
advantage of growth opportunities in the
future |
 13
Achieving Long-Term Growth
Create Value
Trademark new rides and attractions
Unique experience customer cannot
recreate at home
Increased focus on special events
Create Urgency
“Limited Time”
offers
Text message offers when inside park
Goal: Grow revenues by 10% to 14% by 2015 (~2.3% CAGR)
Create Buzz
Media placement
Online social networks (Facebook,
Twitter)
Digital marketing (blogs, text messaging)
Extend Customers’
Stay
Market competitive renovations to
existing hotels
Consideration of accommodations /
resort development at other parks where
appropriate |
 14
Achieving Long-Term Growth
Revenue Growth
Expanding market share and
visitor spend
Strict cost controls
Proven history of controlling
operating costs
Low corporate overhead
Remain focused on our four
cornerstones: Safety,
Cleanliness, Courtesy and
Service –
wrapped in Integrity
Maintain operating margins
between 34% and 36%
Goal: Grow adjusted EBITDA by 10% to 14% by 2015 (~2.3% CAGR)
|
 15
Achieving Long-Term Growth
Adjusted EBITDA
CAGR of ~2.3% to 2015 required to meet cash flow goals
Cash FOR:
Cash Interest Expense
2011
~$160
million
(due
to
“old”
swaps
which
mature
in
2011
and
2012)
2012
and
beyond
$110
million
to
$120
million
Capital Expenditures
2011 expected to be approximately $75 million to $80 million
Future average annual spend approximately $80 million to $90 million
Cash Taxes
Approximately $15 million to $20 million on an annual basis starting with
2011 Goal: Achieve free cash flows of $120 million to $140 million on an
annual basis during 2012 to 2015 |
 16
Achieving Long-Term Growth
We have stabilized our capital structure:
Long-term debt includes:
$1,175 million senior secured term loan (matures Dec 2016)
$405 million senior unsecured notes (matures Dec 2018)
$260
million
available
through
a
senior
secured
revolving
credit
facility
(matures Jul 2015)
Reduce Leverage Ratios
Reduced through growth in adjusted EBITDA and reduction of debt through the use
of excess cash flow
Senior secured leverage ratio reduced to sub-3.0x in 2013 (currently at
3.6x) Consolidated Leverage Ratio reduced to 4.0x in 2013 (currently at
4.9x) Interest Rates
Guideline: ~60/40 fixed/variable
Current swaps expire in Oct. 2011 ($1.0 billion) and Feb. 2012 ($268
million) Recently entered into $600 million of forward starting swaps
Begins October 2011, matures in December 2015
Fixes LIBOR at an average rate of 2.6%
Goal: Reduce Consolidated Leverage Ratio to 4.0x in 2013
|
 17
Achieving Long-Term Growth
Excess Cash Flow Treatment per Credit Agreement
50% available
senior secured leverage ratio is >3.25x
75% available
senior secured leverage ratio is 2.75x to 3.25x
100%
available
senior
secured
leverage
ratio
is
<2.75x
Cedar Fair remains committed to issuing a distribution on an annual basis
Provide
for
a
responsible,
sustainable
and
growing
distribution
to
unitholders
beginning
today
Represents a 10%-14% annual yield beginning 2015 based on current unit
price Stabilizing the capital structure has put us in a position to reward unit
holders as we execute on our plan: |
 18
Achieving Long-Term Growth
Stabilizing the capital structure has put us in a position to reward unit holders
as we execute on our plan:
Declaring 2010 distribution of $0.25 per unit
Payable on December 15, 2010 to unitholders
of record on December 3, 2010
24
th
consecutive year Cedar Fair has paid a distribution
2011 Distribution
$20 million available for distributions under current senior secured credit
agreement Additional $20 million available for distributions if senior
secured leverage ratio below 3.0x 2012 Distribution and Beyond
Plan to steadily increase distribution on an annual basis
Goal: $1.25 -
$1.75 annual distribution per LP unit by 2015 |
 19
Investment Highlights
Recognized innovative leader in regional amusement parks, water
parks, resorts and active entertainment
Attractive park locations and diverse geographical footprint
High-margin industry niche with significant barriers to entry
Strong and distinctive brands known for high-quality, pristine parks
with cutting-edge attractions
Consistently voted “Best in Class”
Proven and stable business model that consistently generates a
healthy revenue stream and strong cash flows in all economic
climates
A “Total Return”
investment
Growth strategy designed to increase revenues, adjusted EBITDA and
cash flows while further reducing debt
Experienced and proven management team focused on sustainable
long-term value creation for unitholders |
 20
Q&A |