Attached files
| file | filename |
|---|---|
| 8-K - OCT 4, 2010 8-K - PIONEER NATURAL RESOURCES CO | oct48k.htm |

Hart Energy’s
Developing Unconventional Gas
Conference
October 5, 2010
Developing Unconventional Gas
Conference
October 5, 2010
EXHIBIT 99.1

2
Forward-Looking Statements
Except for historical information contained herein, the statements, charts and graphs
in this presentation are forward-looking statements that are made pursuant to the Safe
Harbor Provisions of the Private Securities Litigation Reform Act of 1995. Forward-
looking statements and the business prospects of Pioneer are subject to a number of
risks and uncertainties that may cause Pioneer's actual results in future periods to
differ materially from the forward-looking statements. These risks and uncertainties
include, among other things, volatility of commodity prices, product supply and
demand, competition, the ability to obtain environmental and other permits and the
timing thereof, other government regulation or action, the ability to obtain approvals
from third parties and negotiate agreements with third parties on mutually acceptable
terms, international operations and associated international political and economic
instability, litigation, the costs and results of drilling and operations, availability of
equipment, services and personnel required to complete the Company’s operating
activities, access to and availability of transportation, processing and refining
facilities, Pioneer's ability to replace reserves, implement its business plans or
complete its development activities as scheduled, access to and cost of capital, the
financial strength of counterparties to Pioneer’s credit facility and derivative contracts
and the purchasers of Pioneer’s oil, NGL and gas production, uncertainties about
estimates of reserves and resource potential and the ability to add proved reserves in
the future, the assumptions underlying production forecasts, quality of technical data,
environmental and weather risks, including the possible impacts of climate change, and
acts of war or terrorism. These and other risks are described in Pioneer's 10-K and 10-
Q Reports and other filings with the Securities and Exchange Commission. In addition,
Pioneer may be subject to currently unforeseen risks that may have a materially
adverse impact on it. Pioneer undertakes no duty to publicly update these statements
except as required by law.

3
Returning to Our Texas Roots
Dallas
San Antonio
Houston
Barnett
Combo
Combo
Spraberry
Eagle Ford
Shale
Shale

PXD - Largest Spraberry Acreage Holder and Producer
PXD Acreage
(~900,000 Acres;
~75% HBP)
~75% HBP)
All Others
(~800,000 Acres)
75 miles
PERMIAN
BASIN
24 MM acres
20,000+ Drilling Locations
Spraberry Field Gross Production by Operator
(MBOED)1
(MBOED)1
1) Based on 2009 data from Railroad Commission of Texas

History of Spraberry Trend Completions
2010+
2008 - 09
2000s
1980 - 90s
1950 - 70s
Drilling deeper and adding fracture stimulation stages have added
production and improved recoveries
production and improved recoveries
Average
Cased Depth
of Wellbore
Cased Depth
of Wellbore
Fracture
Stimulation
Stages
Stimulation
Stages
Dean
Limestone Pay
Sandstone Pay
Non-Organic Shale Non-Pay
Organic Rich Shale Pay
Increasing to 40 Rigs by 2012 - Accelerating Spraberry Development
6
Spraberry Net Production1
(MBOED)
(MBOED)
2010
|
Wells
|
~440
|
|
|
~700
|
~1,000
|
~1,000
|
38 - 44
48 - 54
60 - 66
1) Reflects planned drilling program and expiration of VPP commitments
+2% vs.
Q4 2009
Q4 2009
+4% vs.
Q1 2010
Q1 2010

7
§ Gross resource potential of play: ~150 TCF1
§ >100 rigs currently running in the play
Eagle Ford Shale: Largest U.S. Oil Discovery Since Prudhoe Bay
Oil Window
Map source: PXD
1) Source: Tudor, Pickering, Holt & Co.
PXD Acreage Area

8
Pioneer’s History in the Eagle Ford Shale
§ Re-completed several vertical wells in late
2006 in the Eagle Ford zone of interest
2006 in the Eagle Ford zone of interest
§ Play “exploded” with several key horizontal
wells tested at high rates in 2008/2009
wells tested at high rates in 2008/2009
§ Drilled 20 wells (15 with pilots & full suite of
logs)
logs)
§ Cut over 1,000 feet of core
§ Shot >2,000 sq miles of 3-D seismic
§ Joint venture with Reliance
§ Drilling with 5 rigs; planning to be at 14 rigs by
2012
2012
§ Constructing midstream facilities
Exploration
Appraisal
Development

9
Early Vertical Recompletions Encouraging
Perfs
§ 2006 Re-Completion Program
– Rolf 2-6: 2,500 lbs proppant à 50 MCFPD (dry gas)
– Wernli 1-4: 45,000 lbs proppant à 200 MCFPD (dry gas)
– Menn 1: 190,000 lbs proppant à 550 MCFPD (wet gas)
§ Results
– Larger frac was more productive
– Liquids are present
– Fracture gradient >0.9 psi/ft (higher than expected)
– Pore pressure >0.7 psi/ft (abnormally high)
Menn 1
Menn 1

Charles Riedesel
4,500 ft lateral
4 MM lbs proppant in 14 stages
IP: 15.7 MMCFEPD
w/ 680 BBL condensate
Horizontal Wells Deliver True Potential
Riedesel
Base Eagle Ford From 3D Seismic
Top Eagle Ford
Menn 1
Riedesel
Menn 1
Eagle
Ford
Shale
Ford
Shale
§ IP of 15.7 MMCFEPD was ~30x
more productive than vertical
completion in Menn 1 using
~20x more proppant
more productive than vertical
completion in Menn 1 using
~20x more proppant
10
Drilling Results Leader in Eagle Ford Shale
PXD 3-D Seismic
Coverage :
>2,000 sq. miles
Coverage :
>2,000 sq. miles
Dry Gas
Window
Window
Condensate
Window
Window
Oil
Window
Sinor #5
Crawley #1
11
Edwards
shelf margin
shelf margin
Riedesel #1
Play Leading IP’s:
Handy #1 19.9 MMCFEPD (75% Liquids)
Crawley #1 17.0 MMCFPD (Dry Gas)
Riedesel #1 15.7 MMCFEPD (55% Liquids)
Chestnutt #1 15.6 MMCFEPD (45% Liquids)
Sinor #5 11.3 MMCFEPD (55% Liquids)
30 Miles
Handy #1
Chestnutt #1

80% of Pioneer’s Acreage in Condensate Window
80% of Pioneer’s Acreage in Condensate Window
6 miles
NW
Handy
Riedesel
Chesnutt
SE
13,400 ft
13,200 ft
13,000 ft
Top
Eagle Ford
Base
Sligo
Margin
14,000 ft
13,800 ft
13,600 ft
Yield
285
285
BBL/MM
Eagle Ford
Yield
55
55
BBL/MM
Yield
115
BBL/MM
Yield
211
211
BBL/MM
Pioneer Well
Pioneer Well
Austin Chalk
Yield
16
16
BBL/MM
Pioneer Well
Condensate window contains high-value liquids with
stronger EURs from gas depletion drive
stronger EURs from gas depletion drive
Dry
Gas
Gas
Condensate Window
12

Eagle Ford Shale Joint Venture Highlights
§ Sold 45% of PXD’s interest in ~212 M net acres in the Eagle Ford Shale to
Reliance Industries Ltd. (RIL) for ~$1.15 B
Reliance Industries Ltd. (RIL) for ~$1.15 B
– Effective June 1, 2010
– $266 MM in cash received upfront
– $879 MM in drilling carry; RIL funding 75% of PXD’s share of well costs until
drilling carry has been fully utilized (~4 years)
drilling carry has been fully utilized (~4 years)
– RIL participating in midstream development as a 49.9% partner
§ Created area of mutual interest (AMI) for expected future acreage acquisitions
– AMI includes acreage in 6 South Texas counties
– PXD is sole leasing agent
– RIL has option to acquire 45% of PXD’s interest in new acreage at terms
similar to those agreed to by PXD and the leaseholder
similar to those agreed to by PXD and the leaseholder
§ PXD continues as operator
– PXD 42% WI, RIL 41% WI and other working interest owners 17% WI (average
within AMI)
within AMI)
13
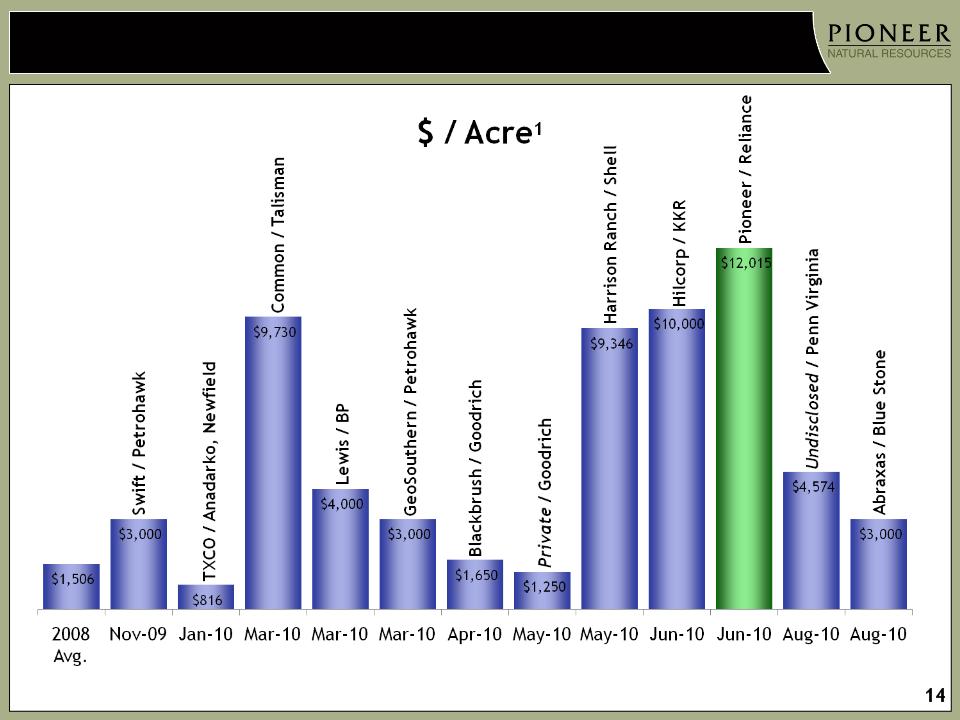
Pioneer Has Received Highest Acreage Value
1) Source: Raymond James
2) Source: Madison Williams
2
Eagle Ford Shale Joint Venture Development Plan
|
Year-end
Rig Count |
7
|
|
10
|
14
|
14
|
Gross Wells
15
Over 700 MMBOE Net Resource Potential from ~2,000 drilling locations

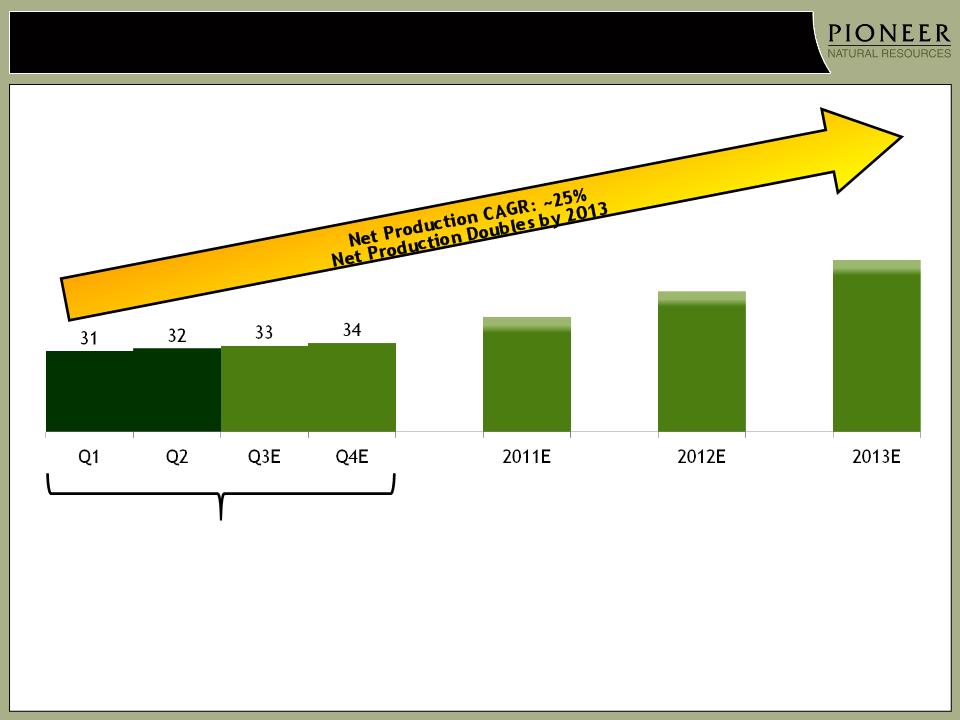
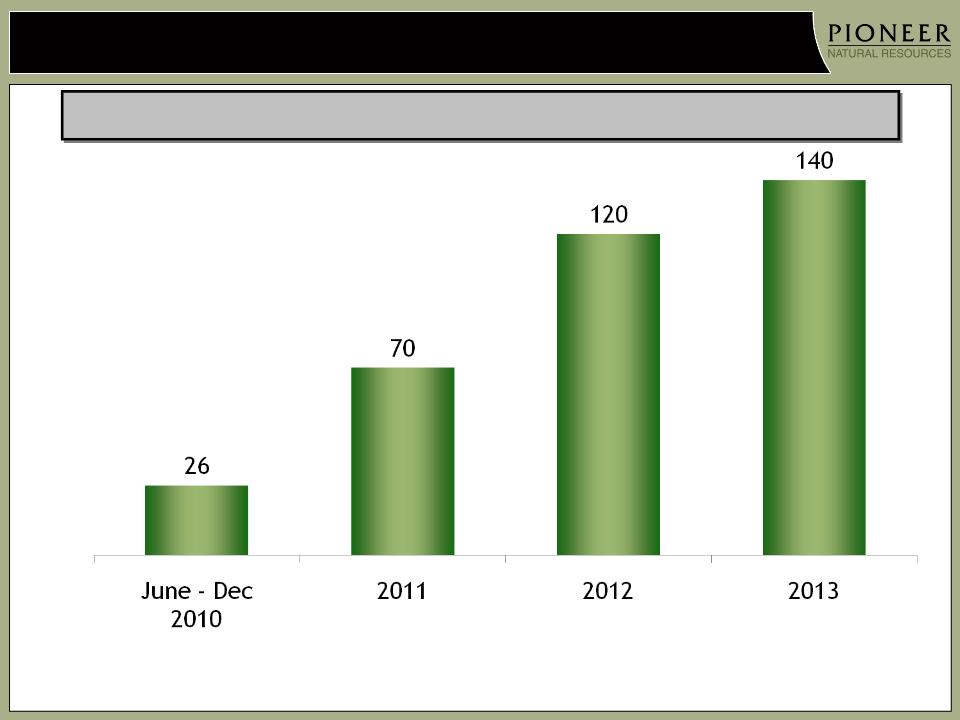
Significant Eagle Ford Shale Production Ramp-up
16
Eagle Ford Net Production1
(MBOEPD)
(MBOEPD)
2010
10 - 13
19 - 24
32 - 41
1) Reflects planned drilling program and working interest of 42%
Midstream
connections
begin
connections
begin
|
Gross Wells
|
|||
|
26
(June - Dec)
|
70
|
120
|
140
|
RIL JV
effective June
1st
effective June
1st
YE exit rate
~5 MBOEPD
~5 MBOEPD

17
Eagle Ford Shale Production Breakdown
30%
NGL*
NGL*
50%
Gas
Gas
20%
Condensate
20%
NGL*
NGL*
30%
Gas
Gas
100%
Gas
Gas
50%
Condensate
*NGLs are 50% ethane, 25% propane, 15% butanes and 10% heavier liquids
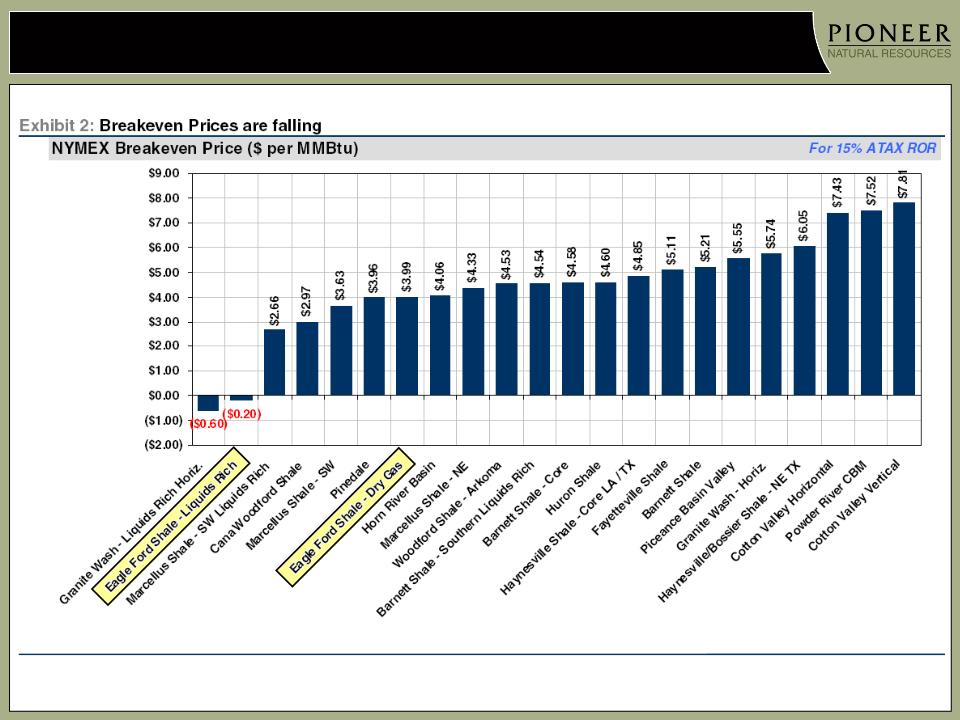
Higher Condensate / NGL Yields Result in Low Breakeven Gas Price for Eagle Ford Shale
18
Assumes condensate yield of 25%, NGL yield of ~85 BBL/MM, $80/BBL oil price and NGL price 45% of oil
Source: Credit Suisse

|
Strip Case (August)
|
Oil
|
Gas
|
|
2010 (August-Dec)
|
|
|
|
2011
|
$ 86.24
|
$ 5.17
|
|
2012
|
|
.
|
|
2013
|
|
|
|
2014+
|
$ 88.77
|
$ 5.82
|
NGL % of WTI
~60% IRR
at NGL Prices
50% of WTI
at NGL Prices
50% of WTI
High Condensate Yield
200 BBL / MMCF
200 BBL / MMCF
Low Condensate Yield
60 BBL / MMCF
60 BBL / MMCF
~85% IRR
at NGL Prices
50% of WTI
at NGL Prices
50% of WTI

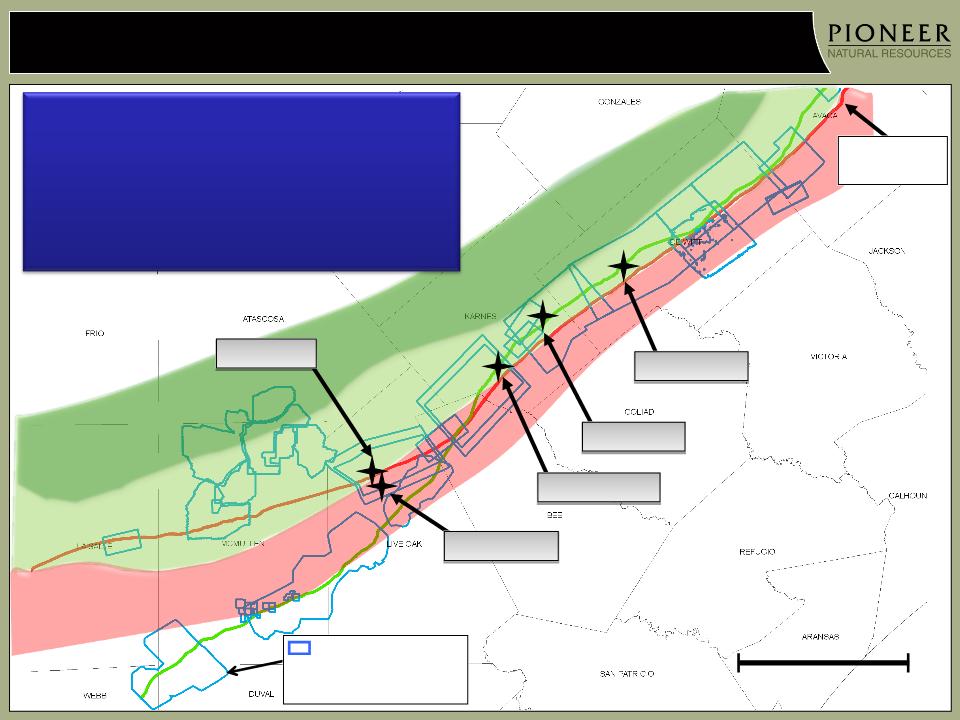
Eagle Ford Shale Operational Update
§ 5 wells currently producing
§ 5 wells completed and awaiting central gathering
facility construction; expect to be online during Q4
facility construction; expect to be online during Q4
§ 5 wells awaiting completion; expect to be online
during Q4 following completion of gathering facilities
during Q4 following completion of gathering facilities
§ Running 5 rigs; will increase to 7 rigs by YE 2010
§ Contracted dedicated third-party frac fleet (Q1 2011);
purchasing Company-owned frac fleet (Q2 2011)
purchasing Company-owned frac fleet (Q2 2011)
§ Midstream construction underway
§ Negotiating third-party processing agreements
Awaiting Completion

Eagle Ford
Shale
Upstream
Shale
Upstream
•Production
from Drilling
from Drilling
– Rich or Dry
Gas
Gas
–Condensate
PXD/RIL Joint Venture
21
Fractionation
•NGLs separated
into ethane,
propane, butanes
and pentanes+
into ethane,
propane, butanes
and pentanes+
Eagle Ford Shale Joint Venture Midstream Plan
Midstream
Central
Gathering
Facilities
Central
Gathering
Facilities
•Gather gas and
condensate
condensate
•Separate gas and
condensate
condensate
•Treat gas
•Stabilize
condensate
condensate
•Cost ~$300 MM
through 2013
(PXD’s share)
through 2013
(PXD’s share)
Processing
•Separate NGLs
from rich gas
from rich gas
•Negotiating
agreements
with 3rd parties
to process gas
agreements
with 3rd parties
to process gas
Condensate sold
Dry Gas sold
Production
Rich Gas
NGLs
3rd Party
NGL components sold

Eagle Ford Shale Midstream Development Plan
§ 14 Central Gathering Facilities
§ 250 miles of pipeline
§ Cost: ~$300 MM through 2013 (PXD’s share)
§ Provides enhanced control and efficiencies
for marketing of upstream production
for marketing of upstream production
§ Potential for 3rd party business
Gathering Pipeline

Significant Surplus Capacity to Process PXD’s Eagle Ford Shale Production
23
Pioneer Acreage
Midstream - To Transport and
Process Wet Gas1
Process Wet Gas1
Existing Processing Capacity:
~3 BCF/D
~3 BCF/D
Surplus Processing Capacity:
0.75 - 1.0 BCF/D
0.75 - 1.0 BCF/D
Fractionation - To Process NGLs2
Mont Belvieu
Existing Capacity: ~700 MBPD
Proposed Expansion: ~150 MBPD
Refinery Capacity - To Process
Condensate3
Condensate3
Corpus Christi: ~725 MBPD
Port Arthur: ~950 MBPD
Houston Area: >2 MMBPD
South Texas Pipelines - Wet & Dry Gas
1) Copano, DCP, Enterprise, Kinder-Morgan
2) ConocoPhillips, Enterprise, Oneok/DCP, Targa/BP
3) BP, Citgo, ExxonMobil, Shell, Valero

Operating Cash Flow Expected to Double by 2013
Billions1
24
1) Based on August strip pricing and includes derivative positions as of July 20, 2010
Additional Cash Flow
From Deepwater
GOM Refund
From Deepwater
GOM Refund

PXD Stock Price Performance vs. Peers Since 12/31/07
25

The Shale Gas Revolution
Haynesville
Fayetteville
New Albany
Floyd-Neal
Marcellus/
Devonian/Utica
Woodford
Barnett-
Woodford
Eagle Ford
Barnett
Lewis
Cody
Niobrara
Mulky
Bakken
Antrim
Baxter-Mancos
Mowry
Gammon
Mancos
Pierre
Total Potential
Natural Gas
Resources:
Natural Gas
Resources:
Source: Potential Gas Committee Report, June 2009
26

Promote Using More Natural Gas
ABUNDANT
DOMESTIC
CLEAN
JOBS
And Natural Gas is Available Now!
27

How We Use Natural Gas
Source: EIA, Natural Gas Year In Review, 2009
How Natural Gas is Used Today
3% Transportation
28

Today’s Electricity Mix
Source: EIA, 2009 Annual Energy Review
1% other non-renewable
EIA expects demand for electricity to grow ~1% per year and that
250 gigawatts of new generating capacity will be needed by 2035.
29

Natural Gas is Cleaner for Power Generation
Compared to coal, natural gas…
Reduces CO2 emissions
Reduces NOx emissions
Virtually Eliminates SO2 Emissions
Virtually Eliminates Particulate Emissions
50%
80%
99.96%
99.74%
Completely Eliminates Mercury Emissions
100%
30
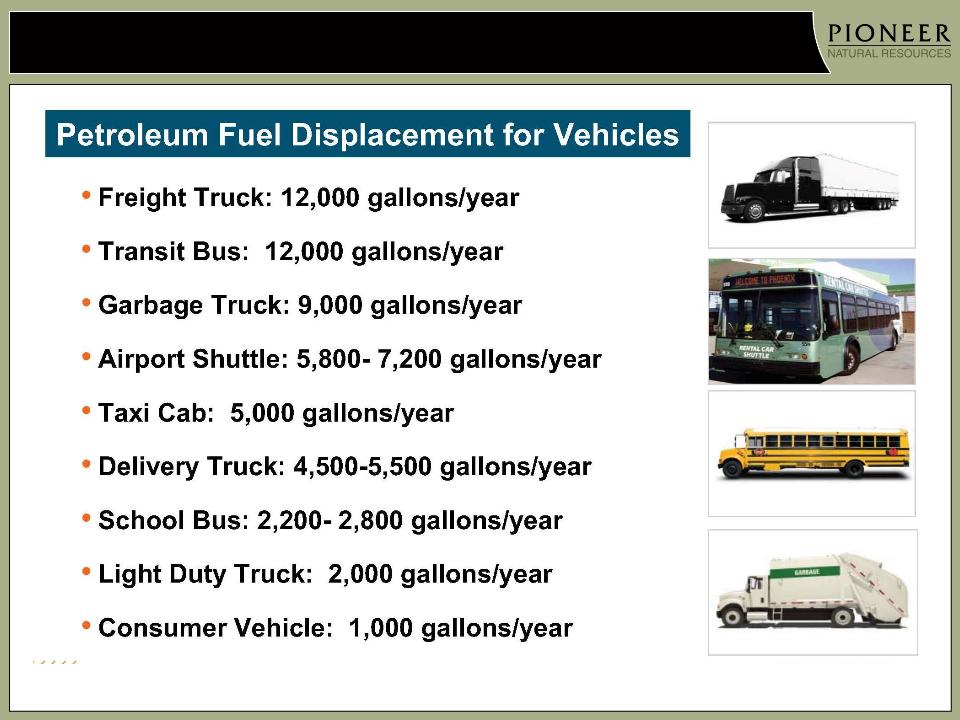
Natural Gas for Transportation
Source: NGVAmerica
31
Our Dependence on Foreign Oil
§ We imported 3,540,500,000 barrels in 2009
• That’s 9,700,000 barrels per day
§ We paid out
$208,894,495,000
for imported oil in 2009
• That’s $572,000,000 per day
• Or $680 for each person
in America
in America
§ Among the top countries we import from:
Venezuela, Saudi Arabia, Nigeria, Russia, Algeria, Angola
and Iraq
and Iraq
$208,894,495,000
32

Natural Gas is Cleaner for Vehicles
§ Compared to gasoline or diesel, NGVs:
Reduce CO2 emissions
Reduce CO emissions
Reduce NOx emissions
Reduce Particulate Matter emissions
Reduce VOC emissions
20-30%
70-90%
75-95%
90%
89%
33

Infrastructure: Refueling Stations
• ~ 10,000 natural gas vehicles in U.S. today
• ~ 1,600 natural gas fueling stations
• NGV fueling infrastructure is growing:
‒ cleaner, more affordable fleets
‒ governments concerned about air quality
‒ more commitment to reduce reliance on
foreign oil
foreign oil
• Public access to refueling is expanding:
‒ South Coast Air Quality Management District and UPS completing 700-mile
natural gas corridor from Las Vegas to Ontario, California
natural gas corridor from Las Vegas to Ontario, California
‒ Utah Governor Jon Huntsman has designated I-15 from Idaho to Arizona as a
natural gas vehicle corridor
natural gas vehicle corridor
‒ Seattle is among a growing number of cities making fueling stations for
municipal fleets available to the public
municipal fleets available to the public
Texas should take the lead as Top Natural Gas Producing State
Texas Clean Transportation Triangle
34
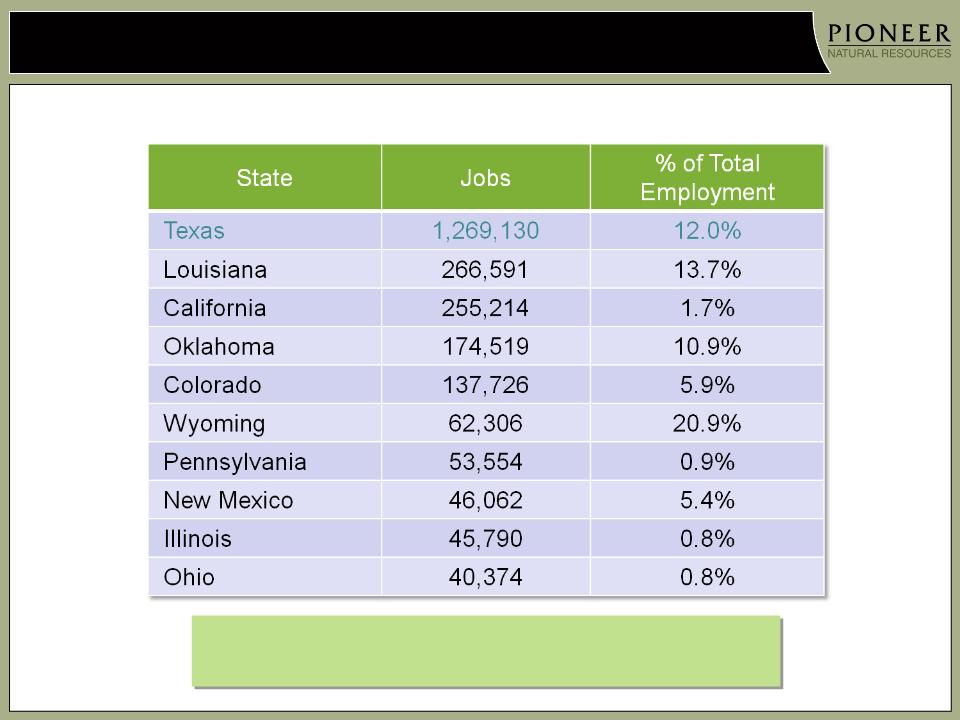
Jobs Across the Country
Top 10 States for Natural Gas Jobs
Source: IHS Global
Insight, 2009
Insight, 2009
31 states have more than 10,000 jobs tied to natural gas
More jobs being added every year
35

Protecting Natural Gas Operations
36

ANGA Members
37

Natural Gas
The Natural Choice Now.
www.anga.us
twitter @ANGAus
twitter @ANGAus
38

39
Certain Reserve Information
Cautionary Note to U.S. Investors --The U.S. Securities and Exchange Commission (the
"SEC") prohibits oil and gas companies, in their filings with the SEC, from disclosing
estimates of oil or gas resources other than “reserves,” as that term is defined by the
SEC. In this presentation, Pioneer includes estimates of quantities of oil and gas using
certain terms, such as “resource potential,” “EUR” or other descriptions of volumes of
reserves, which terms include quantities of oil and gas that may not meet the SEC’s
definitions of proved, probable and possible reserves, and which the SEC's guidelines
strictly prohibit Pioneer from including in filings with the SEC. These estimates are by
their nature more speculative than estimates of proved reserves and accordingly are
subject to substantially greater risk of being recovered by Pioneer. U.S. investors are
urged to consider closely the disclosures in the Company’s periodic filings with the SEC,
available from the Company at 5205 N. O'Connor Blvd., Suite 200, Irving, Texas 75039,
Attention Investor Relations, and the Company’s website at www.pxd.com. These filings
also can be obtained from the SEC by calling 1-800-SEC-0330.