Attached files
Table of Contents
UNITED STATES
SECURITIES AND EXCHANGE COMMISSION
Washington, D.C. 20549
FORM 10-K
(Mark One)
| x | ANNUAL REPORT PURSUANT TO SECTION 13 OR 15(d) OF THE SECURITIES EXCHANGE ACT OF 1934 |
For the fiscal year ended July 31, 2010
OR
| ¨ | TRANSITION REPORT PURSUANT TO SECTION 13 OR 15(d) OF THE SECURITIES EXCHANGE ACT OF 1934 |
For the transition period from to .
Commission File Number: 000-27273
SYCAMORE NETWORKS, INC.
(Exact name of registrant as specified in its charter)
| Delaware | 04-3410558 | |
| (State or other jurisdiction of incorporation or organization) |
(I.R.S. Employer Identification No.) |
220 Mill Road
Chelmsford, Massachusetts 01824
(Address of principal executive office)
(978) 250-2900
(Registrant’s telephone number, including area code)
Securities registered pursuant to Section 12(b) of the Act:
| Title of Each Class | Name of Each Exchange on which Registered | |
| COMMON STOCK $0.001 PAR VALUE | THE NASDAQ STOCK MARKET |
Securities registered pursuant to Section 12(g) of the Act: NONE
Indicate by check mark if the Registrant is a well-known seasoned issuer, as defined in Rule 405 of the Securities Act: Yes ¨ No x
Indicate by check mark if the Registrant is not required to file reports pursuant to Section 13 or Section 15(d) of the Act: Yes ¨ No x
Indicate by check mark whether the Registrant: (1) has filed all reports required to be filed by Section 13 or 15(d) of the Securities Exchange Act of 1934 during the preceding 12 months (or for such shorter period that the registrant was required to file such reports), and (2) has been subject to such filing requirements for the past 90 days. Yes x No ¨
Indicate by check mark whether the registrant has submitted electronically and posted on its corporate Web site, if any, every Interactive Data File required to be submitted and posted pursuant to Rule 405 of Regulation S-T (§232.405 of this chapter) during the preceding 12 months (or for such shorter period that the registrant was required to submit and post such files). Yes ¨ No ¨
Indicate by check mark if disclosure of delinquent filers pursuant to Item 405 of Regulation S-K (§229.405 of this chapter) is not contained herein, and will not be contained, to the best of Registrant’s knowledge, in definitive proxy or information statements incorporated by reference in Part III of this Form 10-K or any amendment to this Form 10-K x
Indicate by check mark whether the Registrant is a large accelerated filer, an accelerated filer, a non-accelerated filer, or a smaller reporting company. See the definitions of “large accelerated filer,” “accelerated filer” and “smaller reporting company” in Rule 12b-2 of the Exchange Act.
| Large Accelerated Filer ¨ | Accelerated Filer x | Non-accelerated Filer ¨ | Smaller reporting company ¨ |
Indicate by check mark whether the registrant is a shell company (as defined in Rule 12b-2 of the Exchange Act). Yes ¨ No x
The aggregate market value of voting stock held by non-affiliates of the Registrant as of January 23, 2010 was approximately $387,315,026.
As of September 21, 2010 there were 28,432,272 shares outstanding of the Registrant’s common stock, $0.001 par value.
Table of Contents
DOCUMENTS INCORPORATED BY REFERENCE
PART III—Portions of the definitive Proxy Statement for the 2010 Annual Meeting of Stockholders to be held on January 4, 2011 are incorporated by reference into Part III (Items 10, 11, 12, 13 and 14) to this Annual Report on Form 10-K.
| Part I | ||||
| Item 1. |
3 | |||
| Item 1A. |
11 | |||
| Item 1B. |
24 | |||
| Item 2. |
24 | |||
| Item 3. |
24 | |||
| Item 4. |
26 | |||
| Part II | ||||
| Item 5. |
27 | |||
| Item 6. |
30 | |||
| Item 7. |
Management’s Discussion and Analysis of Financial Condition and Results of Operations |
31 | ||
| Item 7A. |
46 | |||
| Item 8. |
47 | |||
| Item 9. |
Changes in and Disagreements with Accountants on Accounting and Financial Disclosure |
76 | ||
| Item 9A. |
76 | |||
| Item 9B. |
77 | |||
| Part III | ||||
| Item 10. |
78 | |||
| Item 11. |
78 | |||
| Item 12. |
Security Ownership of Certain Beneficial Owners and Management and Related Stockholder Matters |
78 | ||
| Item 13. |
Certain Relationships and Related Transactions and Director Independence |
78 | ||
| Item 14. |
78 | |||
| Part IV | ||||
| Item 15. |
79 | |||
2
Table of Contents
PART I
| ITEM 1. | BUSINESS |
General
We develop and market Intelligent Bandwidth Management solutions for fixed line and mobile network operators worldwide and provide services associated with such products. Our current and prospective customers include domestic and international wireline and wireless network service providers, utility companies, large enterprises, multiple systems operators and government entities (collectively referred to as “service providers”). Our existing bandwidth management portfolio of optical switches, multiservice cross-connects and multiservice access platforms serve applications that extend across the network infrastructure, from multiservice access and regional backhaul to the optical core. We also are in the process of developing and marketing a mobile broadband optimization solution designed to help mobile operators reduce congestion in mobile access networks. We believe our products enable network operators to efficiently and cost-effectively provision and manage network capacity to support a wide range of converged services such as voice, video and data. As used in this report, “Sycamore,” “we,” “us,” or “our” refers collectively to Sycamore Networks, Inc. (the “Company”) and its subsidiaries.
We incorporated under the laws of the State of Delaware on February 17, 1998 and shipped our first product in May 1999. We completed our initial public offering on October 21, 1999 and a follow-on public offering on March 14, 2000. Our principal executive offices are located at 220 Mill Road, Chelmsford, Massachusetts 01824. Our telephone number is (978) 250-2900, and our website address is www.sycamorenet.com.
On July 13, 2010, we announced the introduction of IQstreamTM, a mobile broadband optimization solution that helps operators reduce congestion in mobile backhaul networks caused by rising demand for Internet video and other rich media subscriber content. IQstream is designed to lower the cost of delivering mobile data services by freeing up capacity in the cost-sensitive access network. We expect IQstream to be generally available by the end of the calendar year 2010.
We file annual reports on Form 10-K, quarterly reports on Form 10-Q, and current reports on Form 8-K with the Securities and Exchange Commission (the “SEC”). These reports, any amendments to these reports, proxy and information statements and certain other documents we file with the SEC are available through the SEC’s website at www.sec.gov or free of charge on our website as soon as reasonably practicable after we file the documents with the SEC. The public may also read and copy these reports and any other materials we file with the SEC at the SEC’s Public Reference Room at 100 F Street, NE, Washington, D.C. 20549. You may obtain information on the operation of the Public Reference Room by calling the SEC at 1-800-SEC-0330.
Sycamore Market Focus
Our products serve two market areas within the networking industry, bandwidth management and mobile broadband optimization, enabling wireline and wireless service providers to deliver voice, data and video services to business and residential customers.
Bandwidth Management Market
Telecom transmission networks require the interconnection of multiple segments of the communications infrastructure to support end-to-end networking services. These segments range from multiservice access and metro to regional backhaul and the fiber optic core. This communications infrastructure enables service providers to deliver a range of voice, video, and data services to business and residential customers. Bandwidth management solutions help service providers distribute, manage and scale service bandwidth in specific segments or across multiple segments of the telecom transmission infrastructure.
The global bandwidth management market is largely determined by the purchasing power and behavior of a small number of large service providers. Beginning as early as 2001, the bandwidth management market has
3
Table of Contents
been affected by industry consolidation and a global trend among the larger service providers to reduce the number of communications equipment suppliers in their networks. As a result of this industry structure, the market for these products has been subject to concentration of purchasing power, extreme pricing pressure and competitive leverage for incumbent equipment suppliers with broad product lines and scale.
While complex, transmission networks today are mostly composed of products utilizing industry standards, and typically entail long decision and deployment cycles. We believe that, by and large, core transmission networks have already been built, and there will be few, if any, meaningful new large scale transmission networks deployed in the coming years. Although some opportunities may emerge as service providers consider migrating existing bandwidth management networks to next-generation transmission platforms, given the industry structure, the uncertainty of the timing of the emergence of this opportunity, and the magnitude of the investment required, we will not be focusing our future investments in this direction.
Mobile Broadband Optimization Market
End-to-end mobile broadband network architectures are comprised of different network segments. These network segments include radio access, backhaul and the mobile core. As a result of worldwide growth in mobile broadband services, the widespread adoption of powerful new mobile devices and increased demand for bandwidth-intensive content such as Internet video, mobile broadband networks around the world are experiencing significant congestion, especially in the backhaul segment.
The backhaul segment of the mobile network connects mobile base stations (i.e., the site of radio towers) to local traffic aggregation hubs over transmission facilities such as copper, fiber or microwave. In mobile data networks, the backhaul segment serves as a critical gateway to mobile core networks and content providers such as Internet news and media sites. While innovations in radio technology have increased the data rates between subscriber handsets and radio towers, the backhaul links that connect to the mobile core have failed to keep pace with radio capacity, resulting in critical traffic bottlenecks that impact network costs and service quality.
Adding capacity to backhaul networks to alleviate congestion can typically require significant time and cost, and can also include significant complexity such as negotiating rights of way to lay fiber or acquiring new spectrum to increase microwave capacity. We believe that adding capacity alone will not solve the critical issue of backhaul congestion, and the attendant implications for mobile operators’ service profitability and network performance.
Mobile broadband optimization solutions allow mobile operators to reduce congestion, improve operational efficiencies and enhance the delivery of high-quality mobile data content to consumers. We believe that optimization solutions that focus on reducing mobile data content traversing the backhaul without impacting service quality represent an emerging market opportunity.
Sycamore Solutions
Intelligent Bandwidth Management
Our existing portfolio of Intelligent Bandwidth Management solutions, which include our optical switching and multiservice access products, serves bandwidth management applications in the transmission layer of service provider networks. Traditional transmission technologies and equipment can, in certain applications, impose limitations on a service provider’s ability to support different traffic types, maximize available network capacity or cost-efficiently scale service bandwidth to support increased bandwidth demands. Key benefits of Sycamore’s Intelligent Bandwidth Management solutions include improved utilization of network capacity, improved service resiliency and increased operational efficiencies.
As a result of the industry trends and structure impacting the bandwidth management market, we believe that significant new opportunities for our existing bandwidth management products are limited. In addition, we
4
Table of Contents
believe these opportunities will continue to be impacted by constraints in capital spending resulting from the current economic downturn and customer plans to migrate to next-generation transmission solutions. As a result, we believe that opportunities for revenue growth in this area of our business will remain limited going forward. Our investments in this part of our business will remain focused on supporting customers with sustaining engineering efforts, including targeted, incremental feature development tied to tangible revenue opportunities.
Mobile Broadband Optimization
Mobile broadband is a new area of focus for Sycamore. We believe that mobile broadband will continue to grow in the future and provide a broad range of business opportunities, including opportunities for optimization solutions that allow operators to significantly lower the cost of delivering mobile broadband services by reducing congestion in the high-cost access network.
We believe that optimization solutions that focus on reducing mobile data content traversing the backhaul without impacting service quality represent an emerging market opportunity. IQstream, Sycamore’s content-based optimization solution, targets congestion in mobile backhaul networks. IQstream is designed to lower the cost of delivering mobile data services by freeing up capacity in the cost-sensitive access network and help operators deliver a superior quality of experience to their subscribers. Our solution uses dynamic optimization algorithms to determine the most efficient way to deliver mobile content across backhaul networks, and provides a cost-efficient alternative to adding capacity by leveraging existing access infrastructure. We expect IQstream to be generally available by the end of the calendar year 2010.
Sycamore’s Products and Services
Intelligent Bandwidth Management
Our Intelligent Bandwidth Management products include optical switches, multiservice cross-connects, multiservice access platforms and associated network management software. These products support a variety of bandwidth management functions including grooming, access concentration and circuit provisioning.
Our SN 16000, SN 3000 and SN 9000 optical switches enable scalable, high-capacity bandwidth management in regional and core networks. These products share the same optical signaling, routing and management software across each platform to support flexible service delivery and resilient protection options from the metro edge to the optical core. Our SILVX® network management system provides comprehensive performance management and provisioning capabilities for our optical switching platforms.
Our scalable DNX cross-connect platforms for traffic aggregation and grooming handle narrowband to broadband switching and transport, and are architected for resiliency and modular growth. ENvision Plus network management software provides sophisticated provisioning, path protection and disaster recovery.
Our IAB-3000 integrated access bank and the SPS-1000 signal processing system add cost-effective flexibility and capability to DNX-based access networks and support voice and data integration at end-user sites and in telemetry applications.
Deployed at mobile base stations, our DNX-1u access gateway simplifies RAN backhaul transport, with integrated telemetry and remote IP management features to improve site visibility and control.
Mobile Broadband Optimization
Our IQstream Mobile Broadband Optimization solution is designed to help operators address the service challenges posed by rapid mobile data growth in the high-cost access network by reducing the traffic traversing the backhaul. IQstream reduces congestion caused by increased demand for bandwidth-intensive content such as Internet video. IQstream is designed to provide the following benefits:
| • | enhanced delivery of rich media content, particularly video; |
5
Table of Contents
| • | improved quality of experience for mobile subscribers during peak usage periods; and |
| • | reduced capital and operational costs. |
The IQstream solution utilizes a suite of unique data optimization algorithms and techniques collectively referred to as Adaptive Content OptimizationTM. These optimization algorithms and techniques dynamically adapt to changing traffic patterns, including peak usage periods and unexpected traffic spikes driven by flash crowds simultaneously trying to access, for example, the same content during a major world event. IQstream’s Adaptive Content Optimization engine continuously optimizes the transport of mobile data across the backhaul network, allowing mobile operators to more efficiently absorb peak usage demand and unpredictable flash events.
Our solution is designed to allow operators to meet subscriber expectations for a high-quality mobile experience, while alleviating network capacity constraints and lowering the cost of delivering mobile broadband services. IQstream Adaptive Content Optimization software runs on standards-based processing platforms that reside at mobile base stations and traffic aggregation hubs. We expect IQstream to be generally available by the end of the calendar year 2010.
Services
Our product offerings also include a broad portfolio of post-sales customer support services such as network planning and deployment, logistics, product training, software updates, online technical assistance and maintenance contracts.
Competition
We believe the number of significant opportunities for bandwidth management products worldwide has become limited. Competition for these opportunities is intense and includes considerable pricing pressure. Based on the current level of spending by service providers and the trend among the larger service providers to reduce the number of communications equipment suppliers in their networks, we expect that competition will continue to be intense for optical switching and multiservice access opportunities.
Competitors in the optical switching space include large incumbent suppliers of network infrastructure equipment and optical networking equipment such as Alcatel-Lucent, Ciena Corporation, Cisco Systems, Inc., Sony Ericsson Mobile Communications AG, Fujitsu Limited, Huawei Technologies Corporation, Nokia Siemens Networks and Tellabs, Inc. Competition in the multiservice access space is equally intense, with a highly fragmented group of suppliers that includes Tellabs, Alcatel-Lucent, Adtran, Inc. and Kentrox, Inc. Many of our established competitors in the bandwidth management market have longer operating histories and greater financial, technical, sales, marketing, manufacturing and field resources than we do and are able to devote greater resources to the research and development of new products. In addition, these competitors generally have broader product lines which allow them the flexibility to price their products more aggressively and absorb the significant cost structure associated with research and development across their entire business. Most of our competitors also have more extensive customer bases and broader customer relationships than we do, including relationships with our prospective customers in their local geographies. In addition, some of these competitors are located in geographies with lower cost infrastructures than ours. In order to compete effectively, our products must:
| • | provide a cost-competitive solution that enables service providers to efficiently deploy and manage bandwidth services; |
| • | lower a service provider’s cost of building and operating their communications infrastructure; |
| • | provide extremely high network reliability; and |
| • | interoperate with existing network devices. |
At present, we believe there are no direct technology competitors in content-based optimization solutions focused on the backhaul network. Competition in the backhaul segment of mobile networks, where Sycamore’s
6
Table of Contents
IQstream Mobile Broadband Optimization solution is targeted, typically consists of alternative technologies focused on increasing capacity rather than solutions designed to optimize and reduce content transiting the backhaul. These alternative technologies include fiber optic transmission, pseudo-wire, Ethernet private lines and packet-based microwave. In addition, we may compete with, and in some cases complement, mobile core-based optimization solutions. These mobile core-based solutions include Internet offload, policy management, caching, session optimization and deep packet inspection.
Sycamore’s Strategy
Our strategy involves prudently managing future development in our existing portfolio of Intelligent Bandwidth Management products in light of expected challenging market conditions and limited growth opportunities while continuing to increase investments in research and development and sales and marketing efforts in the area of mobile broadband optimization, which we believe represents an emerging market opportunity. We believe that market conditions for our existing Intelligent Bandwidth Management products are unlikely to meaningfully improve and, as a result, our investments in this part of our business will remain focused on supporting customers with sustaining engineering efforts, including targeted, incremental feature development tied to tangible revenue opportunities.
In addition, we will continue to consider strategic options that may serve to enhance stockholder value. These strategic options include, but are not limited to: acquisitions of, or mergers or other business combinations with companies with complementary technologies or companies in other market segments; the sale or spin-off of certain assets; strategic alliances with, or investments in, other entities; the discontinuation or divestiture of certain products; and recapitalization alternatives, including stock buybacks, cash distributions or cash dividends.
Customers
Our current and prospective customers include domestic and international wireline and wireless network service providers, utility companies, large enterprises, multiple systems operators and government entities. We expect that our revenue will continue to be highly concentrated in a relatively small number of customers.
During the year ended July 31, 2010, three customers, Verizon Communications, Inc., Sprint Government Systems Division (as a reseller to the federal government) and Sprint Nextel Corporation, accounted for 13%, 12% and 12% of our revenue, respectively. During the year ended July 31, 2009, two customers, Verizon Communications, Inc. and Sprint Nextel Corporation, accounted for 19% and 12% of our revenue, respectively. During the year ended July 31, 2008, two customers, Sprint Nextel Corporation and Nokia Siemens Networks, accounted for 23% and 22% of our revenue, respectively. International revenue was 38% of total revenue during the year ended July 31, 2010, compared to 35% during the year ended July 31, 2009 and 48% during the year ended July 31, 2008. See “Concentrations and Significant Customer Information” and “Segment Information” in Note 2 to “Notes to Consolidated Financial Statements” and Item 1A. “Risk Factors” for additional details.
Our contracts with customers typically include the purchase of our hardware products, right to use fees, the license of our SILVX or ENvision Plus network management systems, and in some cases, maintenance and support services. These contracts include terms and conditions, including payment, delivery and termination that we believe are customary and standard in our industry. None of our customers are contractually committed to purchase any minimum quantities of products from us and orders are generally cancelable prior to shipment. In addition, government entities may terminate their contracts with any party at any time. As a result, we do not disclose our order backlog, since we believe that our order backlog at any particular date is not necessarily indicative of actual revenue for any future period.
Sales and Marketing
We sell our products worldwide through a direct sales force that includes a local presence in select international markets. In certain markets we utilize strategic distribution partners, resellers or independent sales
7
Table of Contents
consultants. We continue to pursue relationships with such partners to expand access to sales and marketing opportunities for both our Intelligent Bandwidth Management and Mobile Broadband Optimization solutions.
Our sales and pre-sales engineering teams work collaboratively with both current and prospective customers to identify applications and configure solutions that help optimize their networks. The sales cycle for our products typically tends to be long due to extensive pre-sales testing and evaluation required for the types of network solutions that we sell.
We also provide comprehensive post-sales customer support offerings including network planning and deployment, logistics, product training, online technical assistance and maintenance contracts. Our customer support organization also leverages a network of highly qualified service partners to extend our reach and capabilities.
In support of our sales efforts, we conduct a variety of outbound marketing programs to position and promote market awareness of our products and solutions. These programs may include web marketing, tradeshows and events, email marketing, media communications and advertising.
Research and Development
As a result of challenging market conditions and limited growth opportunities for our portfolio of existing Intelligent Bandwidth Management products, our research and development efforts in this area are primarily focused on supporting customers with sustaining engineering efforts, including targeted, incremental feature development tied to tangible revenue opportunities. In addition, as previously discussed, we will not be focusing on the development of next-generation transmission platforms for service providers. At the same time, we have increased our research and development investments in the area of mobile broadband optimization, which we believe represents an emerging market opportunity.
Our research and development expenses were $31.7 million, $50.1 million and $47.4 million for the years ended July 31, 2010, 2009 and 2008, respectively. All of our costs related to research and development have been expensed as incurred.
Proprietary Rights and Licensing
Our success and ability to compete are dependent on our ability to develop and maintain the proprietary aspects of our technology and to operate without infringing on the proprietary rights of others. We rely on a combination of patent, trademark, trade secret and copyright law and contractual restrictions to protect the proprietary aspects of our technology. We license software to our customers pursuant to signed or shrink-wrapped license agreements, which impose certain restrictions on the licensee’s ability to utilize the software. Our practice is to require employees and consultants to execute non-disclosure and proprietary rights agreements upon commencing employment or consulting with us. Despite our efforts to protect our proprietary rights, unauthorized parties may attempt to copy aspects of our products or to obtain and use information that we regard as proprietary. We enforce our intellectual property rights vigorously against infringement or misappropriation.
We license third party software, including certain technologies that are (i) embedded into our Intelligent Bandwidth Management hardware platforms, Mobile Broadband Optimization products, and SILVX and ENvision Plus network management systems; (ii) used internally by us as hardware design tools; and (iii) used internally by us as software development tools. We also utilize publicly available technology. The majority of our licensed third party software have perpetual terms but will generally terminate after an uncured breach of the agreement by us. We believe, based upon past experience and standard industry practice, that such licenses generally could be obtained on commercially reasonable terms in the future. Nonetheless, there can be no assurance that the necessary licenses would be available on acceptable terms, if at all.
8
Table of Contents
As of July 31, 2010, we had received 38 United States patents and had pending 9 United States patent applications. Of the United States patents that have been issued, the earliest any will expire is February 2019. As of July 31, 2010, we had 7 allowed or registered United States trademarks and 17 allowed or registered foreign trademarks. All of the registered United States trademarks have a duration of ten years from the date of application, the earliest of which will expire, if not renewed, in February 2011.
Manufacturing
We source our proprietary products, original equipment manufacturers products and standards-based processing platforms through a variety of suppliers.
We utilize contract manufacturers, who provide manufacturing services, including material procurement and handling, printed circuit board assembly, mechanical assembly and direct shipment to our customers. We design, specify and monitor all of the tests performed by contract manufacturers to meet our internal and external quality standards for our proprietary products. We work closely with our contract manufacturers to manage costs and delivery times. Our contract manufacturing agreements generally have indefinite terms and are cancelable by either party upon written notice.
We utilize original equipment manufacturers that have made available to us existing products in order to provide our customers with complete product solutions. We verify the test methodology used by original equipment manufacturers to meet our internal and external quality standards. We also ensure that our original equipment manufacturers are compliant with global standards for quality, environmental responsibility and employee welfare. Our original equipment manufacturer agreements are focused on providing continuation of supply over an indefinite period and are cancelable through narrowly defined conditions.
We utilize commercially available standards-based processing platforms for integration with our software applications. These platforms are selected by an interdisciplinary team for performance, reliability and commercial availability. Our supply agreements for these platforms consider continuation of supply and are cancelable through narrowly defined conditions.
We believe that our sourcing strategy enables us to deliver products more quickly and allows us to focus on our core competencies, including research and development, sales and customer service.
We have limited internal manufacturing operations. Our internal manufacturing operations primarily consist of quality assurance for materials and components, final testing, assembly and shipment of selected products, and depot repair of products. We also use a limited number of other manufacturers to supply certain non-significant product sub-assemblies and components.
Our products utilize hundreds of individual component parts, some of which are customized for our products. Electronic and optical component suppliers in the specialized, high technology end of the optical communications industry are generally not as plentiful or, in some cases, as reliable, as component suppliers in more mature industries. We work closely with our strategic component suppliers to either secure a long-term supply source or to pursue new component technologies that could either reduce cost or enhance the performance of our products. The discontinuation by suppliers of strategic components could require us to incur additional costs to redesign, qualify new products, or to invest in inventory to ensure continuation of supply for the life cycle of the product. Conversely, the loss of supply of key components could cause us to end-of-life or discontinue certain products.
Employees
As of July 31, 2010, we employed 287 persons. None of our employees are currently represented by a collective bargaining unit. We believe our relations with our employees are good.
9
Table of Contents
Executive Officers of the Registrant
Set forth below is information concerning our current executive officers and their ages as of July 31, 2010.
| Name |
Age | Position | ||
| Daniel E. Smith |
60 | President, Chief Executive Officer and Director | ||
| Paul F. Brauneis |
65 | Chief Financial Officer, Vice President, Finance and Administration, and Treasurer | ||
| John E. Dowling |
57 | Vice President, Operations | ||
| John B. Scully |
48 | Vice President, Worldwide Sales and Support | ||
| Kevin J. Oye |
52 | Vice President, Systems and Technology | ||
| Alan R. Cormier |
59 | General Counsel and Secretary | ||
Daniel E. Smith has served as our President, Chief Executive Officer and as a member of our Board of Directors since October 1998. From October 2007 to November 2007, Mr. Smith also served as our interim principal financial officer. From June 1997 to July 1998, Mr. Smith was Executive Vice President and General Manager of the Core Switching Division of Ascend Communications, Inc., a provider of wide area network switches and access data networking equipment. Mr. Smith was also a member of the board of directors of Ascend Communications, Inc. during that time. From April 1992 to June 1997, Mr. Smith served as President and Chief Executive Officer and a member of the board of directors of Cascade Communications Corp.
Paul F. Brauneis has served as our Chief Financial Officer, Vice President of Finance and Administration and Treasurer since November 2007. From May 2006 to October 2007, Mr. Brauneis served as Executive Vice President of Finance and Administration, Chief Financial Officer and Treasurer of Cantata Technology, a communications equipment supplier. From January 2000 to May 2006, Mr. Brauneis served as Senior Vice President of Finance and Administration and Chief Financial Officer of Avici Systems, Inc., a provider of data networking equipment. Prior to that, Mr. Brauneis held senior financial management positions at Wang Global Corporation (formerly Wang Laboratories, Inc.), BBN Corporation, SoftKey International, Inc. (formerly Spinnaker Software Corporation), and M/A-Com, Inc.
John E. Dowling has served as our Vice President of Operations since August 1998. From July 1997 to August 1998, Mr. Dowling served as Vice President of Operations of Aptis Communications, a manufacturer of carrier-class access switches for network service providers. Mr. Dowling served as Vice President of Operations of Cascade Communications Corp. from May 1994 to June 1997.
John B. Scully has served as our Vice President of Worldwide Sales and Support since September 2006. From January 1998 to September 2006, Mr. Scully served as Vice President of Worldwide Sales and Support for Eastern Research. Mr. Scully served as Vice President of Sales for Test Link/Tel Link from 1997 to 1998. Prior to that, he spent several years in senior sales positions at Madge Networks/Teleos, Datatel, Cray Communications and Data Decisions.
Kevin J. Oye has served as our Vice President of Systems and Technology since November 2001. From October 1999 through October 2001, Mr. Oye served as our Vice President of Business Development. From March 1998 to October 1999, Mr. Oye served as Vice President of Strategy and Business Development at Lucent Technologies, Inc. and from September 1993 to March 1998, Mr. Oye served as the Director of Strategy, Business Development, and Architecture at Lucent Technologies, Inc. From June 1980 to September 1993, Mr. Oye held various positions with AT&T Bell Laboratories where he was responsible for advanced market planning as well as development and advanced technology management.
Alan R. Cormier has served as our General Counsel and Secretary since November 2006. From December 2004 to October 2006, Mr. Cormier served as our General Counsel and Assistant Secretary. From July 2000
10
Table of Contents
through March 2004 he was Vice President, General Counsel and Secretary of Manufacturers’ Services Limited, a contract manufacturing company. Mr. Cormier served, from January 2000 through July 2000, as Vice President, General Counsel and Clerk of Dynamics Research Corporation, a provider of information technology, engineering, logistics and other consulting services to federal and state agencies. Prior to that, he spent several years in senior positions in the legal department of Wang Global Corporation (formerly Wang Laboratories, Inc.).
| ITEM 1A. | RISK FACTORS |
Set forth below and elsewhere in this report and in other documents we file with the SEC are descriptions of the risks and uncertainties that could cause our actual results to differ materially from the results contemplated by the forward looking statements contained in this report.
Our results may be adversely affected by unfavorable conditions in the telecommunications industry and the economy in general.
We expect industry and economic conditions to affect our business in many ways, including the following:
| • | our current and prospective customers may make limited capital expenditures; |
| • | consolidation of our customers may cause delays, disruptions or reductions in their capital spending plans as well as increase their relative purchasing power in any negotiation; |
| • | we will continue to have limited ability to forecast the volume and product mix of our sales; |
| • | we will experience a continuing high level of competition as a result of limited demand which may cause downward pressure on the pricing of our products resulting in reduced gross margins and constrained revenue growth; |
| • | many of our competitors have broader product lines than we do, which allows them the flexibility to price their products more aggressively; |
| • | new competitive entrants may be located in geographies with lower cost structures than ours allowing them a greater degree of price flexibility; |
| • | we will need to continue to balance our initiatives to manage our operating costs against the need to keep pace with technological advances; |
| • | the convergence of service provider network architectures on more common and undifferentiated solutions versus technical innovation may create new competitive challenges; |
| • | intense competition may enable customers to demand more favorable terms and conditions of sales including extended payment terms; and |
| • | any bankruptcies or weakening financial condition of any of our customers may require us to write off amounts due from prior sales. |
These factors could have an adverse impact on our revenue, operating results and financial condition.
In the near term, our business will continue to depend on our Intelligent Bandwidth Management products for a significant portion of our revenue, and our business, revenue and financial condition may suffer if demand for our Intelligent Bandwidth Management products significantly declines.
We currently derive the vast majority of our revenue from sales of our Intelligent Bandwidth Management products, which include our optical switching and multiservice access products. Revenues for these products, and in particular for our optical switching products, have declined in recent years, and as a result our investments in this part of our business are focused primarily on sustaining engineering efforts, including targeted, incremental feature development tied to tangible revenue opportunities. Despite challenging market conditions and limited
11
Table of Contents
opportunities for our Intelligent Bandwidth Management products, we expect these products will continue to account for a significant portion of our revenue in the near term, and continued customer acceptance of these products is therefore critical to our success. As a result, factors adversely affecting the pricing of, or demand for, these products could cause a significant decrease in our revenues and/or profitability. These factors include, but are not limited to, the following:
| • | our decision not to focus our investments on the development of next-generation transmission platforms for service providers; |
| • | the adoption of, or shifts to, new network architectures or industry standards by customers; |
| • | the development of more advanced technologies or additional features by competitors; |
| • | a decision by the Company not to develop certain features or enhancements requested by current or prospective customers, or to end-of-life or discontinue certain products; and |
| • | difficulties associated with obtaining component parts for the products. |
Any one of these factors alone or in combination could result in a significant reduction in orders from our customers or the loss of existing or prospective customers, which could materially reduce our revenue and adversely affect our business, operating results and financial condition.
Our business and financial condition may suffer if we are unable to develop and market our IQstream solution as we expect.
During the fourth quarter of fiscal 2010, we announced the introduction of our IQstream Mobile Broadband Optimization solution. Our decision to introduce IQstream was based on our belief that there is an emerging market opportunity. However, investments in new technology are inherently speculative and the market for IQstream is as yet unproven. New technology initiatives like IQstream require significant developmental resources, capital expenditures and management attention. In order for IQstream to compete effectively, we must deliver a technologically advanced product that is superior in meeting the needs of customers, promote the market for IQstream, and effectively market and sell our solution to mobile operators. There can be no assurance that IQstream will receive sufficient customer acceptance and if the market for IQstream does not develop and grow substantially, it could have a material adverse effect on our operating results, revenues, margins and profitability. Further, even if IQstream initially obtains market acceptance, we may not be able to effectively enhance or support the product or successfully respond on a timely basis to products introduced into the marketplace by competitors. The failure of IQstream to be accepted by, or compete effectively in, the market could have a material adverse effect on our business, operations and financial condition.
If we fail to bring IQstream to market on a timely basis, or IQstream fails to achieve market acceptance, our business may suffer.
There can be no assurance that we will be able to develop, market or sell our IQstream solution in a timely manner. Historically, service providers have been relatively slow to deploy new, complex products in their networks, and the sales cycle for these products tends to be long and unpredictable due to the lengthy customer evaluation and approval process required before products can be deployed in operators’ networks. Accordingly, we have limited or no control over the pace at which mobile operators will adopt our IQstream solution in their networks, if at all. In addition, our ability to realize revenue from IQstream depends on, among other things, our ability to meet current and future product development goals and successfully complete lab and field tests with prospective customers. We may encounter technical or other problems in connection with the development of IQstream that could result in delayed deployment of, or inability to introduce, IQstream into operators’ networks. Development and deployment delays could result from numerous factors, including, but not limited to, the following:
| • | unanticipated engineering difficulties; |
12
Table of Contents
| • | the timing and level of research and development expenses; |
| • | changing market or competitive product requirements; |
| • | stringent and/or unique technical requirements of customers; |
| • | failure of our suppliers to meet our technical and commercial requirements; |
| • | integration and interoperability challenges; and |
| • | claims of infringement of third-party intellectual property. |
Our sales and operating results may be adversely affected if we are unable to bring IQstream to market in a timely manner, if customers delay purchases, or if acceptance of IQstream is slower than expected or to a smaller degree than expected, if at all. Any delay in the development, testing, marketing, customer acceptance or deployment of IQstream could result in such products missing an emerging market opportunity.
Industry consolidation may lead to increased competition and may harm our business.
The communications industry has experienced significant consolidation and we expect this trend to continue. Over the past several years, a number of larger communications service providers and network equipment suppliers have completed merger transactions which have had a significant impact on the telecommunications industry. Such consolidation among our customers may cause delays or reductions in their capital expenditure plans and may cause increased competitive pricing pressures as the number of available customers declines and their relative purchasing power increases in relation to suppliers. Consolidation may also result in service providers substantially reducing the number of suppliers in their networks or choosing to standardize on a certain vendor’s networking platform. In addition, consolidation among network equipment suppliers may result in stronger competitors and a change in our relative market position. Any of these factors could adversely affect our business.
We may experience risks in our investments due to changes in the market, which could adversely affect the value or liquidity of our investments.
As of July 31, 2010, we had $104.4 million in cash and cash equivalents plus $532.5 million in short-term and long-term investments in marketable securities. We maintain a portfolio of cash equivalents and short-term and long-term investments in a variety of securities which may include commercial paper, certificates of deposit, money market funds and government debt securities. These available-for-sale investments are subject to interest rate risk and may decline in value if market interest rates increase. These investments are subject to general credit, liquidity, market and interest rate risks. As a result, we may experience a reduction in value or loss of liquidity of our investments. In addition, should any investment cease paying or reduce the amount of interest paid to us, our interest income would suffer. These market risks associated with our investment portfolio may have a negative adverse effect on our results of operations, liquidity and financial condition.
We must continue to effectively manage our investments in product development to succeed in existing and new markets for our products.
The markets for our products are characterized by rapidly changing technology, frequent introductions of new products and evolving customer requirements. Customers continuously demand new features for existing products as well as new technologies and solutions. Due to challenging market conditions and limited opportunities for our Intelligent Bandwidth Management products, we will not be focusing our investments on the development of next-generation transmission platforms for service providers, and our research and development efforts in this area of our business will remain focused on supporting customers with sustaining engineering efforts, including targeted, incremental feature development tied to tangible revenue opportunities. As a result, we may fail to develop, or choose not to develop, new features or products requested by current and prospective customers. In addition, reduced demand for our Intelligent Bandwidth Management products and/or
13
Table of Contents
competitive pressures may cause us to alter our investment in, or discontinue or divest our interests in certain product lines. Such actions could have an adverse impact on our future revenue and results of operations. Managing our efforts to keep pace with new technologies and reduce operating expense is difficult and there is no assurance that we will be successful. We also have made significant investments in our IQstream solution, and we expect our decision to focus our future development efforts on the mobile broadband market will continue to require significant expenditures, a substantial portion of which will be incurred before any significant revenue related to the products is realized, if at all. Until such time, or if we fail to generate sufficient revenue from our other products and services, we may incur net losses. We cannot assure you that our revenue will increase or that we will generate sufficient revenue to achieve or sustain operating profitability.
Restructuring activities could disrupt our business and affect our results of operations.
We have previously taken steps, including workforce reductions, facilities consolidations, office closures and internal reorganizations to reduce the size and cost structure of our operations to better align our resources with market opportunities. We cannot assure that we will realize all of the anticipated benefits of any past restructuring efforts or that we will not further reduce or otherwise adjust our workforce or exit, or dispose of, certain businesses or products. Any decision to further limit investment in, or to exit, or dispose of businesses may result in the recording of additional charges. We also cannot predict whether any future restructuring or streamlining of operations will adversely affect our ability to retain key employees, the loss of which, in turn, could adversely affect our operating results. Further, in the event that market conditions improve or our IQstream solution achieves market acceptance faster than we expect, we may not have the appropriate level of resources and personnel to appropriately react to the increase in customer demand. If we cannot effectively manage our cost structure while continuing to invest in growth opportunities, we may fail to meet strategic and market expectations, which could have an adverse affect on our business, operating results and financial condition.
Intense competition could adversely affect our sales and profitability.
Competition for limited bandwidth management opportunities is intense and continues to be dominated by large, incumbent equipment suppliers. Competition is generally based upon a combination of price, established customer relationships, broad product portfolios, large service and support teams, technology, functionality and scalability. Large companies, such as Alcatel-Lucent, Ciena, Huawei, Ericsson and Tellabs have historically dominated the bandwidth management market and may be in a better position to take advantage of the trend among larger service providers to reduce the number of communications suppliers in their networks. Many of our competitors in this market have longer operating histories and greater financial, technical, sales, marketing and manufacturing resources than we do and are able to devote greater resources to research and development of new products. Most of these competitors also have long-standing existing relationships with our current and prospective customers and often deploy aggressive pricing tactics in order to compete with our products. Our competitors may develop new technologies that compete with our products or even render our products less desirable or even obsolete. Moreover, many of these competitors have more diverse product lines which allow them the flexibility to price their products more aggressively.
Competition in the mobile broadband optimization market varies depending on which segment of the mobile network the products serve. Competition in the backhaul segment of the network, where Sycamore’s IQstream Mobile Broadband Optimization solution is targeted, largely consists of alternative technologies focused on increasing capacity rather than solutions designed to optimize and reduce content transiting the backhaul. Widespread and increasing adoption of open industry standards and the presence of large, incumbent equipment suppliers in service provider networks, however, may make it easier for providers of alternative or complementary technologies to introduce new products or add features to existing products that compete directly with IQstream. We may not be able to compete effectively against competitors in this market or to capture meaningful market share, and our business could be harmed if competitors introduce products and services that provide greater performance, offer additional features and functionality, or are more reliable or less expensive than our Mobile Broadband Optimization solutions.
14
Table of Contents
As a result of intense competition in the markets we serve, we expect to encounter competitive tactics such as the following:
| • | price discounting; |
| • | early announcements of competing products and other marketing efforts; |
| • | customer financing assistance; |
| • | complete solution sales from one single source; |
| • | bundling multi-vendor solution integration services with turnkey network operating service offerings; |
| • | marketing and advertising assistance; and |
| • | intellectual property infringement allegations. |
These tactics may be effective in a highly concentrated customer base like ours. Our customers are under increasing pressure to deliver their services at the lowest possible cost. As a result, product pricing is an important factor in customer decisions. In certain cases, our larger competitors have more diverse product lines that allow them the flexibility to price their products more aggressively and absorb the significant cost structure associated with research and development across their entire business. If we are unable to offset any reductions in the average selling price of our products by a reduction in the cost of our products, our gross margins will be adversely affected.
If we are unable to compete successfully against our current and future competitors, we could experience revenue reductions, order cancellations, lost customer opportunities and reduced gross margins, any one of which could have a material adverse effect on our business, operating results and financial condition.
Substantially all of our revenue is generated from a limited number of customers, and our success depends on increasing both direct sales and indirect sales through distribution channels to a limited number of service providers.
A significant portion of our revenue is generated from a limited number of customers and that trend is likely to continue. The loss of any one of these customers or any substantial reduction in orders by any one of these customers could materially and adversely affect our business, operating results and financial condition. None of our customers are contractually committed to purchase any minimum quantities of products from us and orders are generally cancelable prior to shipment. We expect that our revenue will continue to depend on sales of our products to a limited number of customers. While expanding our customer base is a key objective, at the present time, the number of prospective customer opportunities for our Intelligent Bandwidth Management products is limited. In addition, we believe that the communications industry will continue in a consolidation phase which may further reduce the number of prospective customers, slow purchases and delay network deployment decisions.
Our direct sales efforts primarily target service providers, many of which have already made significant investments in their networking infrastructures. In addition, we utilize channel relationships with distribution partners including resellers, distributors and systems integrators for the sale of our products to service providers, including government entities and utility operators. We have entered into agreements with several distribution partners, some of which also sell products that compete with our products. We cannot be certain that we will be able to retain or attract distribution partners on a timely basis or at all, or that the distribution partners will devote adequate resources to selling our products. Since we have only limited experience in developing and managing such channels, the extent to which we will be successful is uncertain. If we are unable to develop and manage new channels of distribution to sell our products to service providers, or if our distribution partners are unable to convince service providers to deploy our networking solutions, our business, operating results and financial condition will be materially adversely affected.
15
Table of Contents
Through our resellers, we generate a portion of our revenue from government entities and the loss or decline of existing or future government entity funding could adversely affect our revenue and cash flows.
These government entities may be subject to budget cuts, budgetary constraints, a discontinuation of funding or changes in the political or regulatory environment that may cause the entities to terminate projects, divert funds or delay implementation or expansion. A significant reduction or delay in orders by one or more of these entities could materially reduce our revenue and cash flows. As with most government contracts, these entities may terminate the contracts at any time without cause. Additionally, government contracts are generally subject to audits and investigations by government entities. If the results of these audits or investigations are negative, our reputation could be damaged, contracts could be terminated or significant penalties could be assessed. If a contract is terminated for any reason, our ability to fully recover certain amounts may be impaired resulting in a material adverse impact on our business, operating results and financial condition.
Certain larger customers may have substantial negotiating leverage, which may require that we agree to terms and conditions that may negatively impact our results of operations.
Large communications providers, key resellers and government entities, who make up a large part of our current business, have substantial purchasing power and potential leverage in negotiating contractual arrangements with us. As we seek to do business with such larger customers, we may be required to agree to unfavorable contractual arrangements, which may include (i) higher discounts, (ii) development of additional features, (iii) penalty clauses or (iv) other onerous terms and conditions which may affect the timing of revenue recognition, our financial condition and/or our reported results of operations.
We may experience difficulties identifying, analyzing and consummating strategic alternatives, and any such alternatives may not lead to the achievement of desired results.
As part of our business strategy, we regularly examine strategic alternatives that may enhance stockholder value. These alternatives may include the acquisition of, strategic investments in, or joint ventures in, adjacent or complementary businesses, products, services, or technologies or potential asset sales or divestitures of all or a portion of our interests in some product lines. We cannot assure that we will be able to identify suitable third parties for these transactions. If we are unable to identify suitable third parties for strategic transactions, we may not be able to capitalize on market opportunities with existing and new customers, which may inhibit our ability to gain market share. If we divest or otherwise exit certain portions of our business, we may not realize the benefits of any such activity, which could adversely affect our business, financial condition and results of operations. We also may be required to record additional expenses for items such as workforce reduction costs, closure of excess facilities and excess inventory and/or equipment write-offs. Any strategic decision will involve risks and uncertainties and present challenges in implementation and integration. As a result, any such business arrangement may not lead to increased stockholder value and, whether or not we pursue any strategic alternatives, the value of our shares may decrease.
Any acquisition, merger or strategic investment we make could disrupt our business and materially harm our financial condition.
As part of our business strategy, we consider acquisitions and strategic investments including those in complementary companies, products or technologies, or in adjacent market segments and otherwise. We may consider such acquisitions or strategic investments to add complementary products and services, expand the markets we serve and diversify our customer base. Any decision regarding an acquisition or strategic investment would be subject to inherent risk, and we cannot guarantee that we will be able to identify appropriate opportunities, successfully negotiate economically beneficial terms, successfully integrate any acquired business, retain key employees, successfully market and sell products of the acquired business or achieve the anticipated synergies or benefits of any acquisition or strategic investment which may be selected. Further, in the event of an acquisition, merger or strategic investment, we may:
| • | issue stock that would dilute our current stockholders’ holdings; |
16
Table of Contents
| • | consume cash, which would reduce the amount of cash available for other purposes and the interest income we generate from our cash; |
| • | incur debt or assume liabilities; |
| • | increase our ongoing operating expenses and level of capital expenditures; |
| • | record goodwill and intangible assets subject to impairment testing and potential periodic impairment charges; |
| • | incur amortization expenses related to certain intangible assets; |
| • | incur large and immediate write-offs; or |
| • | become subject to litigation. |
Our ability to achieve the anticipated benefits of any acquisition, merger or strategic investment will also involve certain other risks, including, but not limited to, the following:
| • | problems combining the purchased operations, technologies or products; |
| • | difficulty in marketing and selling products of an acquired business; |
| • | unanticipated costs or liabilities; |
| • | diversion of management’s attention from other business issues and opportunities; |
| • | disruption to in-process product development initiatives; |
| • | adverse effects on existing business relationships with suppliers and customers; |
| • | problems entering markets in which we have no or limited prior experience; |
| • | problems with integrating employees, including issues related to unionized employees; and |
| • | additional regulatory compliance issues. |
We cannot assure you that we will be able to successfully integrate any businesses, products, technologies or personnel resulting from a future business combination and any failure to do so could disrupt our business and seriously harm our financial condition.
Current economic and market conditions make forecasting difficult.
Current economic and market conditions together with the inherent inconsistent and unpredictable ordering patterns of our customers have limited our ability to forecast the volume and product mix of our sales, making it difficult to provide estimates of revenue and operating results. We continue to have limited visibility into the capital spending plans of our current and prospective customers. Fluctuations in our revenue can lead to even greater fluctuations in our operating results. Our planned expense levels depend in part on our expectations of future revenue. As a result, it is difficult to forecast revenue and operating results. If our revenue and operating results are below the expectations of our investors and market analysts, it could cause a decline in the price of our common stock.
The unpredictability of our quarterly results may adversely affect our common stock price.
In general, our revenue and operating results in any reporting period may fluctuate significantly due to a variety of factors including, but not limited to, the following:
| • | fluctuation in demand for our products; |
| • | the timing, volume and product mix of sales of our products; |
| • | changes in customer requirements, including delays or order cancellations; |
| • | the introduction of new products by us or our competitors; |
17
Table of Contents
| • | changes in the price or availability of components for our products; |
| • | the timing of revenue recognition and deferred revenue; |
| • | readiness of customer sites for installation; |
| • | changes in our pricing policies or the pricing policies of our competitors; |
| • | satisfaction of contractual customer acceptance criteria and related revenue recognition issues; |
| • | manufacturing and shipment delays; and |
| • | general economic conditions as well as those specific to the telecommunications and related industries. |
We believe that quarter-to-quarter comparisons of our operating results are not a good indication of our future performance. You should not rely on our results for any one quarter as an indication of our future performance. The factors discussed above are extremely difficult to predict and impact our revenue and operating results. In addition, our ability to forecast our future business has been significantly impaired by economic and market conditions. As a result, we believe that our revenue and operating results are likely to continue to vary significantly from quarter to quarter and may cause our stock price to fluctuate.
Customer purchase decisions have historically taken a long period of time. We believe that some customers who make a decision to deploy our products will expand their networks slowly and deliberately. In addition, we could receive purchase orders on an irregular and unpredictable basis. Because of the nature of our business, we cannot predict these sales and deployment cycles. The long sales cycles, as well as our expectation that customers may tend to issue large purchase orders sporadically with short lead times, may cause our revenue and results of operations to vary significantly and unexpectedly from quarter to quarter. As a result, our future operating results may be below our expectations or those of public market analysts and investors, and our revenue may decline or recover at a slower rate than anticipated by us or analysts and investors. In either event, the price of our common stock could decrease.
We utilize contract manufacturers to supply our products, and any disruption in these relationships may cause us to fail to meet our customers’ demands and may damage our customer relationships.
We have limited internal manufacturing capabilities. We outsource the manufacturing of our proprietary products to contract manufacturers who manufacture our products in accordance with our specifications and fill orders on a timely basis. We may not be able to manage our relationships with our contract manufacturers effectively, and our contract manufacturers may not meet our future requirements for quality or timely delivery. Our contract manufacturers also build products for other companies, and we cannot be assured that they will have sufficient quantities of inventory available to fill our customer orders or that they will allocate their internal resources or capacity to fill our orders on a timely basis. Unforecasted customer demand may increase the cost to build our products due to fees charged to expedite production and other related charges.
The contract manufacturing industry is a highly competitive, capital-intensive business with relatively low profit margins, and in which acquisition or merger activity is relatively common. Qualifying a new contract manufacturer or new facility and commencing volume production is expensive and time consuming, and could result in a significant interruption in the supply and/or quality of our products. If we are required or choose to change contract manufacturers for any reason, our revenue, gross margins and customer relationships could be adversely affected.
We and our product suppliers typically rely on single or limited sources for supply of certain components and our business may be seriously harmed if the availability of supply of any of these components is disrupted.
We and our product suppliers purchase several key components from single or limited sources. These key components include commercial digital signal processors, central processing units, field programmable gate
18
Table of Contents
arrays, switch fabric and optical transceivers. We generally purchase our key components on a purchase order basis and have no long-term contracts for these components. In the event of a disruption in supply of key components including, but not limited to, production disruptions, low yield or discontinuance of manufacture, we may not be able to develop an alternate source in a timely manner or on acceptable terms. Any such failure could impair our ability to deliver products to customers or require us to purchase additional excess inventory, which would adversely affect our revenue and operating results.
In addition, our reliance on key component suppliers exposes us to potential supplier production difficulties or quality variations. The loss of a source of supply for key components or a disruption in the supply chain could require us to incur additional costs to redesign products that use those components or cause us to end-of-life or discontinue those products. Also, electronic products are experiencing shorter product life cycles which may require us to build inventories to forecasted sales demand rather than to order levels.
During the past several years, component suppliers have planned their production capacity to better match demand. If the demand for certain components increases beyond the component supplier’s planned production capacity, there may be component shortages which may increase procurement costs. In addition, consolidation in the component industry could result in reduced competition for supply of key components and higher component prices. If any of these events occurred, our revenue and operating results could be adversely affected.
Our inability to anticipate inventory requirements may result in inventory charges or delays in product shipments.
During the normal course of business, we may provide purchase orders to our contract manufacturers for up to six months prior to scheduled delivery of products to our customers. If we overestimate our product requirements, the contract manufacturers may assess cancellation penalties or we may have excess inventory which could negatively impact our gross margins. If we underestimate our product requirements, the contract manufacturers may have inadequate inventory that could interrupt manufacturing of our products and result in delays in shipment to our customers. We also could incur additional charges to expedite the manufacture of our products to meet our customer deployment schedules. If we over or underestimate our product requirements, our revenue and gross profit may be impacted.
Product performance problems could adversely affect our revenue, operating results and financial condition.
If our products do not meet our customers’ performance or reliability requirements, our relationships with current and prospective customers may be adversely affected. The design, development and deployment of our products often involve problems with software, components, manufacturing processes and interoperability with other network elements. If we are unable to identify and fix errors or other problems, or if our customers experience interruptions or delays that cannot be promptly resolved, we could experience:
| • | loss of revenue or delay in revenue recognition or accounts receivable collection; |
| • | loss of customers and market share; |
| • | inability to attract new customers or achieve market acceptance; |
| • | diversion of development and other resources; |
| • | increased service, warranty and insurance costs; and |
| • | legal actions by our customers. |
These factors may adversely impact our revenue, operating results and financial condition. In addition, our products are often critical to the performance of our customers’ networks. Generally, we seek to limit liability in our customer agreements. If we are not successful in limiting our liability, or these contractual limitations are not enforceable or if we are exposed to product liability claims that are not covered by insurance, a successful claim could harm our business.
19
Table of Contents
The global nature of our business exposes us to multiple risks.
International sales have historically represented a significant amount of our total sales including 38% of total revenue for fiscal 2010 and 35% of total revenue for fiscal 2009. We have a substantial international customer base and we are subject to foreign exchange translation risk to the extent that our revenue is denominated in currencies other than the U.S. dollar. Doing business internationally requires significant management attention and financial resources to successfully develop direct and indirect sales channels and to support customers in international markets. In addition, we have a research and development facility in Shanghai, China, which conducts a significant amount of our research and development activities. We may not be able to maintain or expand international market demand for our products.
In addition, our business derived from international operations is subject to inherent risks, including:
| • | greater difficulty in accounts receivable collection and longer collection periods; |
| • | difficulties and costs of staffing, managing and conducting foreign operations in compliance with local laws and customs; |
| • | reliance on distribution partners for the resale of our products in certain markets and for certain types of product offerings, such as the integration of our products into third-party product offerings; |
| • | the need to work with third parties in certain countries to perform installation and obtain customer acceptance may impact the timing of revenue recognition; |
| • | the need to maintain staffing, or to work with third parties, to provide service and support in international locations; |
| • | the impact of slowdowns or recessions in economies outside the United States; |
| • | unexpected changes in regulatory requirements, including trade and environmental protection measures and import and licensing requirements; |
| • | obtaining export licensing authority on a timely basis and maintaining ongoing compliance with import, export and re-export regulations; |
| • | certification requirements; |
| • | currency fluctuations; |
| • | reduced protection for intellectual property rights in some countries; |
| • | potentially adverse tax consequences; and |
| • | political and economic instability, particularly in emerging markets. |
These factors may adversely impact our revenue, operating results and financial condition.
Environmental regulations could harm our operating results.
We may be subject to various state, federal and international laws and regulations governing the environment, including those restricting the presence of certain substances in electronic products such as, but not limited to, the European Union Directive entitled, “The Restriction of the Use of Certain Hazardous Substances in Electrical and Electronic Equipment”. Environmental laws and regulations can vary from jurisdiction to jurisdiction and often make producers financially responsible for the collection, treatment, recycling and ultimate disposal of their products. We will need to ensure that we comply with all applicable environmental laws and regulations as they are enacted, and that our component suppliers also comply on a timely basis with such laws and regulations. If we are not in compliance with such legislation, our customers may refuse to purchase our products or we may be unable to ship products to certain markets, which would have a material adverse effect on our business, financial condition and results of operations.
20
Table of Contents
We could incur substantial costs in connection with our compliance with environmental laws and regulations, and we could also be subject to governmental fines, penalties and liability to our customers if we were found to be in violation of these laws. If we have to make significant capital expenditures to comply with environmental laws, or if we are subject to significant capital expenses in connection with a violation of these laws, our financial condition or operating results could suffer. Additionally, we could be forced to write off inventory that is found not to be compliant with evolving environmental regulations.
If we are unable to retain and recruit key personnel, our business may be harmed.
We depend on the continued services of our executive officers and other key engineering, sales, marketing and support personnel, who have critical industry experience and relationships that we rely on to implement our business strategy, many of whom would be difficult to replace. None of our officers or key employees is bound by an employment agreement for any specific term. We do not have “key person” life insurance policies or similar perquisites covering any of our employees.
Virtually all of our key employees have been granted share-based awards that are intended to represent an integral component of their compensation package. These share-based awards may not provide the intended incentive to our employees if our stock price fails to appreciate, experiences significant volatility or if a failure to make our SEC filings on a timely basis prevents our employees from receiving or exercising stock options. The loss of the services of any of our key employees, the inability to attract and retain qualified personnel in the future, or delays in hiring qualified personnel could delay the development and introduction of our products, and negatively impact our ability to sell and support our products.
Adverse resolution of disputes, litigation and claims may harm our business, operating results or financial condition.
We are a defendant in an Initial Public Offering securities lawsuit and a party to other litigation and claims in the normal course of our business, and we may be named in additional litigation. The highly technical nature of our products makes them susceptible to allegations of patent infringement. Litigation is by its nature uncertain and unpredictable and there can be no assurance that the ultimate resolution of such claims will not exceed the amounts accrued for such claims, if any. Litigation can be expensive, lengthy, and disruptive to normal business operations. An unfavorable resolution of a legal matter could have a material adverse affect on our business, operating results, or financial condition. For additional information regarding certain lawsuits and other disputes in which we are involved, see Part I, Item 3 “Legal Proceedings”.
Our ability to compete and pursue strategic alternatives could be jeopardized if we are unable to protect our intellectual property rights or are determined to have infringed upon the intellectual property rights of others.
We rely on a combination of patent, copyright, trademark and trade secret laws and restrictions on disclosure to protect our intellectual property rights. We also enter into confidentiality or license agreements with our employees, consultants and corporate partners and control access to and distribution of our products, documentation and other proprietary information. Despite our efforts to protect our proprietary rights, unauthorized parties may attempt to copy or otherwise obtain and use our products or technology. Monitoring unauthorized use of our products is difficult and we cannot be certain that the steps we have taken will prevent unauthorized use of our technology, particularly in foreign countries where the laws may not protect our proprietary rights as fully as in the United States. In addition, United States patent laws may not effectively protect our proprietary rights at the outset due to the lengthy process required to obtain a patent. If competitors are able to use our technology, our ability to compete and pursue strategic alternatives effectively could be harmed. Litigation may be necessary to enforce our intellectual property rights. Any such litigation could result in substantial costs and diversion of resources and could have a material adverse affect on our business, operating results and financial condition.
21
Table of Contents
Our industry is characterized by the existence of a large number of patents and frequent claims and related litigation regarding patents and other intellectual property rights. In the course of our business, we may receive claims of infringement or otherwise become aware of potentially relevant patents or other intellectual property rights held by other parties. We evaluate the validity and applicability of these intellectual property rights, and determine in each case whether we must negotiate licenses or cross-licenses to incorporate or use the proprietary technologies in our products.
Any parties asserting that our products infringe upon their proprietary rights would require us to defend ourselves, and possibly our customers, manufacturers or suppliers against the alleged infringement. Regardless of their merit, these claims could result in costly litigation and subject us to the risk of significant liability for damages. Such claims would likely be time consuming and expensive to resolve, would divert management time and attention and would put us at risk to:
| • | stop selling, incorporating or using our products that incorporate the challenged intellectual property; |
| • | obtain from the owner of the intellectual property right a license to sell or use the relevant technology, which license may not be available on reasonable terms, or at all; |
| • | redesign those products that use such technology; or |
| • | accept a return of products that use such technologies. |
If we are forced to take one or more of the foregoing actions, our business may be seriously harmed.
In addition, we license public domain software and proprietary technology from third parties for use in our existing products, as well as new product development and enhancements. We cannot be assured that such licenses will be available to us on commercially reasonable terms in the future, if at all. The inability to maintain or obtain any such license required for our current or future products and enhancements could require us to substitute technology of lower quality or performance standards or at greater cost, either of which could adversely impact the competitiveness of our products.
Adverse outcomes resulting from examination of our tax returns could adversely affect our results.
We are subject to the continuous examination of our tax returns by the Internal Revenue Service and other tax authorities. We regularly assess the likelihood of adverse outcomes resulting from these examinations to determine the adequacy of our provisions. While we believe that we have adequately provided for our tax liabilities, it is possible that the amount paid upon resolution of issues raised may differ from the amount provided. Differences between the reserves for tax contingencies and the amounts owed by us are recorded in the period they become known. The ultimate outcome of these tax contingencies could have a material effect on our financial position, results of operations or cash flows.
Utilization of our net operating loss and tax credit carryovers could be subject to significant limitations pursuant to Section 382 of the Internal Revenue Code.
The Company has significant federal and state net operating loss and tax credit carryovers. Our ability to utilize our net operating losses may be subject to limitations pursuant to the ownership change rules of Section 382 of the Internal Revenue Code, as amended. The occurrence of ownership changes, as defined in Section 382, is not controlled by the Company, and could significantly limit the amount of net operating loss carryovers and research and development credits that can be utilized annually to offset future taxable income.
Matters related to the investigations into our historical stock option granting practices and the resulting restatements of our previously issued financial statements may result in additional litigation, regulatory proceedings and government enforcement actions.
Although on July 9, 2008, we entered into an agreement with the SEC settling the civil charges contained in the SEC’s complaint, without admitting or denying such charges, our historical stock option granting practices
22
Table of Contents
and the initial restatement and further restatement of our previously issued financial statements may expose us to additional risks associated with litigation, regulatory proceedings and government enforcement actions. For more information regarding our current litigation and related inquiries, please see Part I, Item 3—“Legal Proceedings” as well as the other risk factors related to litigation set forth herein.
No assurance can be given regarding the potential costs or outcomes from any new litigation, regulatory proceedings or government enforcement actions relating to our past stock option practices. The resolution of these matters may be time consuming, expensive, and may distract management from the conduct of our business. The SEC enforcement action may damage our reputation and negatively impact our ability to renew or enter into new contracts with commercial and government customers. Further, as a result of our settlement with the SEC, we will be unable to utilize a “short form” registration statement on Form S-3 until July 10, 2011, which is three years from the settlement of the SEC enforcement action. This could adversely affect our financial condition or our ability to pursue specific strategic alternatives, such as strategic acquisitions.
Our stock price may be volatile.
Historically, the market for technology stocks has been extremely volatile. Our common stock has experienced, and may continue to experience, substantial price volatility. The occurrence of any one or more of the factors noted above could cause the market price of our common stock to fluctuate. In addition, the following factors could cause the market price of our common stock to fluctuate:
| • | loss of a major customer; |
| • | significant changes or slowdowns in the funding and spending patterns of our current and prospective customers; |
| • | the addition or departure of key personnel; |
| • | variations in our quarterly operating results; |
| • | announcements by us or our competitors of significant contracts, new products or product enhancements; |
| • | failure by us to meet product milestones; |
| • | acquisitions, distribution partnerships, joint ventures or capital commitments; |
| • | regulatory changes in telecommunications; |
| • | variations between our actual results and the published expectations of securities analysts; |
| • | changes in financial estimates by securities analysts; |
| • | sales of our common stock or other securities in the future; |
| • | changes in market valuations of networking and telecommunications companies; |
| • | fluctuations in stock market prices and volumes and; |
| • | announcements or implementation of any capital restructuring, such as stock buybacks or significant cash distributions. |
In addition, the stock market in general, and the NASDAQ Stock Market and technology companies in particular, have experienced extreme price and volume fluctuations that have often been unrelated or disproportionate to the operating performance of such companies. These broad market and industry factors may materially adversely affect the market price of our common stock, regardless of our actual operating performance. In the past, following periods of volatility in the market price of a company’s securities, securities class action litigation has often been instituted against such companies.
23
Table of Contents
Significant insider ownership, provisions of our charter documents and provisions of Delaware law may limit stockholders’ ability to influence key transactions, including changes of control.
As of July 31, 2010, our officers, directors and entities affiliated with them, in the aggregate, beneficially owned approximately 32% of our outstanding common stock. These stockholders, if acting together, would be able to significantly influence matters requiring approval by our stockholders, including the election of directors and the approval of mergers or other business combination transactions. In addition, provisions of our amended and restated certificate of incorporation, by-laws, and Delaware law could make it more difficult for a third party to acquire us, even if doing so would be beneficial to certain stockholders.
| ITEM 1B. | UNRESOLVED STAFF COMMENTS |
None.
| ITEM 2. | PROPERTIES |
As of July 31, 2010, we lease one facility in Chelmsford, Massachusetts, containing a total of approximately 114,000 square feet. In Mount Laurel, New Jersey, we currently lease one facility containing a total of approximately 5,000 square feet, in Wallingford, Connecticut, we currently lease one facility containing a total of approximately 15,000 square feet and in Shanghai, China, we currently lease one facility containing a total of approximately 37,000 square feet. These facilities consist of offices and engineering laboratories used for research and development, administration, sales and customer support, ancillary light manufacturing, storage and shipping activities. We also maintain smaller offices to provide sales and customer support at various domestic and international locations. We anticipate that our remaining current facilities are adequate and suitable for our needs during fiscal 2011.
We also own a parcel of undeveloped land, containing approximately 102 acres, in Tyngsborough, Massachusetts.
| ITEM 3. | LEGAL PROCEEDINGS |
IPO Allocation Case
Beginning on July 2, 2001, several purported class action complaints were filed in the United States District Court for the Southern District of New York against the Company and several of its officers and directors (the “Individual Defendants”) and the underwriters for the Company’s initial public offering on October 21, 1999. Some of the complaints also include the underwriters for the Company’s follow-on offering on March 14, 2000. An amended complaint, which is the operative complaint, was filed on April 19, 2002 on behalf of persons who purchased the Company’s common stock between October 21, 1999 and December 6, 2000. The amended complaint alleges claims against the Company, several of the Individual Defendants and the underwriters for violations under Sections 11 and 15 of the Securities Act of 1933, as amended (the “Securities Act”), primarily based on the assertion that the Company’s lead underwriters, the Company and several of the Individual Defendants made material false and misleading statements in the Company’s Registration Statements and Prospectuses filed with the Securities and Exchange Commission, or the SEC, in October 1999 and March 2000 because of the failure to disclose (a) the alleged solicitation and receipt of excessive and undisclosed commissions by the underwriters in connection with the allocation of shares of common stock to certain investors in the Company’s public offerings and (b) that certain of the underwriters allegedly had entered into agreements with investors whereby underwriters agreed to allocate the public offering shares in exchange for which the investors agreed to make additional purchases of stock in the aftermarket at pre-determined prices. It also alleges claims against the Company, the Individual Defendants and the underwriters under Sections 10(b) and 20(a) of the Securities Exchange Act of 1934, as amended (the “Exchange Act”), primarily based on the assertion that the Company’s lead underwriters, the Company and the Individual Defendants defrauded investors by participating in a fraudulent scheme and by making materially false and misleading statements and omissions of material fact during the period in question. The amended complaint seeks damages in an unspecified amount.
24
Table of Contents
The action against the Company is being coordinated with approximately three hundred other nearly identical actions filed against other companies. Due to the large number of nearly identical actions, the court has ordered the parties to select up to twenty “test” cases. The Company’s case has been selected as one such test case. As a result, among other things, the Company will be subject to broader discovery obligations and expenses in the litigation than non-test case issuer defendants.
On October 9, 2002, the court dismissed the Individual Defendants from the case without prejudice. This dismissal disposed of the Section 15 and Section 20(a) claims without prejudice, because these claims were asserted only against the Individual Defendants. On October 13, 2004, the court denied the certification of a class in the action against the Company with respect to the Section 11 claims alleging that the defendants made material false and misleading statements in the Company’s Registration Statement and Prospectuses. The certification was denied because no class representative purchased shares between the date of the IPO and January 19, 2000 (the date unregistered shares entered the market), and thereafter suffered a loss on the sale of those shares. The court certified a class in the action against the Company with respect to the Section 10(b) claims alleging that the Company and the Individual Defendants defrauded investors by participating in a fraudulent scheme and by making materially false and misleading statements and omissions of material fact during the period in question. On December 5, 2006, the Second Circuit vacated the district court’s class certification decision. On April 6, 2007, the Second Circuit panel denied a petition for rehearing filed by the plaintiffs, but noted that the plaintiffs could ask the district court to certify a more narrow class than the one that was rejected.
On August 14, 2007, the plaintiffs filed a Second Amended Class Action complaint against the Company. The Company and the underwriters filed separate motions to dismiss the amended complaint on November 14, 2007. On March 26, 2008, the Court denied the motion to dismiss the Section 10(b) claims but dismissed certain Section 11 claims against the Company. On June 5, 2008, the Court dismissed the remaining Section 11 claims against the Company in response to a motion for partial reconsideration.
The parties in the approximately 300 coordinated cases, including the Company’s case, reached a settlement. The insurers for the issuer defendants in the coordinated cases will make the settlement payment on behalf of the issuers, including the Company. On October 5, 2009, the Court granted final approval of the settlement. A group of three objectors filed a petition to the Second Circuit seeking permission to appeal the District Court’s final approval order on the basis that the settlement class is broader than the class previously rejected by the Second Circuit in its December 5, 2006 order vacating the District Court’s order certifying classes in the focus cases. Plaintiffs filed an opposition to the petition. Six notices of appeal to the Second Circuit have also been filed by different groups of objectors. Subject to court approval, the objectors to the settlement will file their briefs in the Second Circuit no later than October 6, 2010, and answering briefs will be due no later than February 3, 2011.
Due to the inherent uncertainties of litigation, the Company cannot accurately predict the ultimate outcome of the matter. If the settlement does not survive appeal, the litigation continues, and the Company is found liable, the Company is unable to estimate or predict the potential damages that might be awarded, whether such damages would be greater than the Company’s insurance coverage, and whether such damages would have a material impact on our results of operations or financial condition in any future period.
Derivative Lawsuits
In October 2007, a purported Sycamore Networks, Inc. stockholder filed a complaint for violation of Section 16 of the Securities Exchange Act of 1934, which prohibits short-swing trading, against the Company’s Initial Public Offering underwriters. The complaint, Vanessa Simmonds v. Morgan Stanley, et al., in District Court for the Western District of Washington (“District Court”) seeks recovery of short-swing profits. On April 28, 2008, the district court established a briefing schedule for motions to dismiss and ruled that all discovery be stayed pending resolution of the motions to dismiss. The District Court found the motions
25
Table of Contents
appropriate for oral argument which was held on January 6, 2009. On March 16, 2009, the District Court issued an order dismissing the case. On March 31, 2009, the plaintiff appealed. Briefing before the Ninth Circuit was complete as of November 17, 2009. Oral argument has been scheduled for October 5, 2010. The Company is named as a nominal defendant. No recovery is sought from the Company in this matter.
Other Matters
From time to time the Company is a party to litigation and other disputes which it considers routine and incidental to its business. Our management does not expect the results of any of these actions to have a material adverse effect on the Company’s business, results of operations or financial condition.
| ITEM 4. | [REMOVED AND RESERVED] |
None
26
Table of Contents
PART II
| ITEM 5. | MARKET FOR REGISTRANT’S COMMON EQUITY, RELATED STOCKHOLDER MATTERS AND ISSUER PURCHASES OF EQUITY SECURITIES |
Market for Common Stock
Our common stock is traded on the NASDAQ Global Select Market under the symbol “SCMR”. The following table sets forth, for the periods indicated, the high and low closing sale prices as reported on the NASDAQ Global Select Market for Sycamore’s common stock. All historical prices have been adjusted for the 1-for-10 reverse stock split, which was effective at the close of business on December 21, 2009.
| Fiscal year 2010: |
||||||
| High | Low | |||||
| Fourth Quarter ended July 31, 2010 |
$ | 23.28 | $ | 16.35 | ||
| Third Quarter ended April 24, 2010 |
21.70 | 19.06 | ||||
| Second Quarter ended January 23, 2010 |
30.00 | 19.75 | ||||
| First Quarter ended October 24, 2009 |
33.70 | 27.90 | ||||
| Fiscal year 2009: |
||||||
| High | Low | |||||
| Fourth Quarter ended July 31, 2009 |
$ | 36.00 | $ | 28.20 | ||
| Third Quarter ended April 25, 2009 |
30.10 | 23.50 | ||||
| Second Quarter ended January 24, 2009 |
33.40 | 24.20 | ||||
| First Quarter ended October 25, 2008 |
36.60 | 24.50 | ||||
As of September 21, 2010, there were approximately 686 stockholders of record.
Dividend Policy
On December 15, 2009, the Company made a cash distribution to its stockholders of $1.00 per share of its common stock, par value $0.001, amounting to $284.3 million in the aggregate (or $10.00 per share of common stock after giving effect to the reverse stock split). Any future determination to pay cash dividends or cash distributions will be at the discretion of the board of directors and will be dependent upon our financial condition, results of operations, capital requirements, general business condition and such other factors as the board of directors may deem relevant.
Equity Compensation Plan Information
The following table sets forth certain information as of July 31, 2010 with respect to compensation plans under which shares of our common stock may be issued:
| (a) | (b) | (c) | |||||
| Plan Category |
Number of Securities to be Issued upon Exercise of Outstanding Options |
Weighted Average Exercise Price of Outstanding Options |
Number of Securities Remaining Available for Future Issuance under Equity Compensation Plans (Excluding Securities Reflected in Column (a)) | ||||
| Equity Compensation Plans Approved by Security Holders |
1,995,224 | $ | 33.16 | 3,057,101 | |||
| Equity Compensation Plans Not Approved by Security Holders |
— | — | — | ||||
| Total |
1,995,224 | $ | 33.16 | 3,057,101 | |||
27
Table of Contents
Purchase of Equity Securities
In the three months ended July 31, 2010, the following shares of common stock were surrendered to the Company:
| Total shares surrendered * |
Average price paid per share | ||||
| April 25, 2010 – May 22, 2010 |
101 | $ | — | ||
| May 23, 2010 – June 19, 2010 |
— | — | |||
| June 20, 2010 – July 31, 2010 |
— | — | |||
| Total |
101 | $ | — | ||
| * | Surrendered to the Company by departing employees for no consideration pursuant to preexisting contractual rights. |
The Company has not publicly announced any programs to repurchase shares of its common stock.
28
Table of Contents
STOCK PERFORMANCE GRAPH
The following graph compares the yearly percentage change in the cumulative total stockholder return on the Company’s Common Stock during the period from July 31, 2005 through July 31, 2010, with the cumulative total return on the S&P 500 and the Nasdaq Telecommunications Index. The comparison assumes $100 was invested on July 31, 2005 in the Company’s Common Stock and in each of the foregoing indices and assumes reinvestment of dividends, if any. The performance shown is not necessarily indicative of future performance.
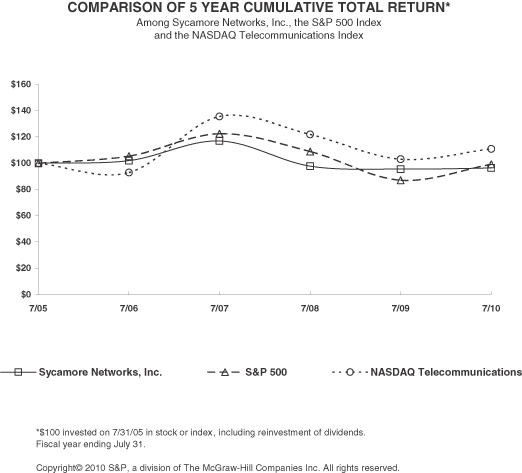
29
Table of Contents
| ITEM 6. | SELECTED FINANCIAL DATA |
The following selected financial data has been derived from our consolidated financial statements and should be read in conjunction with the consolidated financial statements and notes thereto and with “Item 7.—Management’s Discussion and Analysis of Financial Condition and Results of Operations” and other financial data included elsewhere in this report. The historical results are not necessarily indicative of results to be expected for any future period.
| For the years ended July 31, | ||||||||||||||||||||
| 2010 | 2009 | 2008 | 2007 | 2006 | ||||||||||||||||
| (in thousands, except per share data) | ||||||||||||||||||||
| Consolidated Statement of Operations Data: |
||||||||||||||||||||
| Revenue |
$ | 68,617 | $ | 67,357 | $ | 115,496 | $ | 156,048 | $ | 87,395 | ||||||||||
| Cost of revenue |
30,954 | 38,469 | 62,565 | 88,210 | 43,942 | |||||||||||||||
| Gross profit |
37,663 | 28,888 | 52,931 | 67,838 | 43,453 | |||||||||||||||
| Operating expenses: |
||||||||||||||||||||
| Research and development |
31,685 | 50,134 | 47,397 | 45,912 | 31,377 | |||||||||||||||
| Sales and marketing |
10,942 | 14,551 | 21,041 | 23,712 | 11,690 | |||||||||||||||
| General and administrative |
9,098 | 8,198 | 15,980 | 28,684 | 11,634 | |||||||||||||||
| Asset impairments |
1,076 | 24,209 | 4,446 | 17,268 | — | |||||||||||||||
| In-process research and development |
— | — | — | 12,400 | — | |||||||||||||||
| Restructuring charges |
5,625 | 3,600 | 2,368 | 1,486 | — | |||||||||||||||
| Litigation settlement |
— | — | — | — | 750 | |||||||||||||||
| Reserve for contingencies |
— | — | — | (2,184 | ) | 6,847 | ||||||||||||||
| Total operating expenses |
58,426 | 100,692 | 91,232 | 127,278 | 62,298 | |||||||||||||||
| Loss from operations |
(20,763 | ) | (71,804 | ) | (38,301 | ) | (59,440 | ) | (18,845 | ) | ||||||||||
| Interest and other income, net |
5,592 | 18,000 | 38,784 | 47,089 | 39,063 | |||||||||||||||
| Income (loss) before income taxes |
(15,171 | ) | (53,804 | ) | 483 | (12,351 | ) | 20,218 | ||||||||||||
| Income tax expense (benefit) |
(366 | ) | (232 | ) | 597 | 854 | 830 | |||||||||||||
| Net income (loss) |
$ | (14,805 | ) | $ | (53,572 | ) | $ | (114 | ) | $ | (13,205 | ) | $ | 19,388 | ||||||
| Basic net income (loss) per share |
$ | (0.52 | ) | $ | (1.89 | ) | $ | (0.00 | ) | $ | (0.47 | ) | $ | 0.70 | ||||||
| Diluted net income (loss) per share |
$ | (0.52 | ) | $ | (1.89 | ) | $ | (0.00 | ) | $ | (0.47 | ) | $ | 0.69 | ||||||
| Shares used in per-share calculation—basic |
28,422 | 28,359 | 28,248 | 27,959 | 27,778 | |||||||||||||||
| Shares used in per-share calculation—diluted |
28,422 | 28,359 | 28,248 | 27,959 | 28,120 | |||||||||||||||
| As of July 31, | ||||||||||||||||||||
| 2010 | 2009 | 2008 | 2007 | 2006 | ||||||||||||||||
| (in thousands) | ||||||||||||||||||||
| Consolidated Balance Sheet Data: |
||||||||||||||||||||
| Cash, cash equivalents and investments |
$ | 636,877 | $ | 926,808 | $ | 941,834 | $ | 924,751 | $ | 985,137 | ||||||||||
| Working capital |
560,969 | 627,352 | 828,128 | 910,171 | 828,858 | |||||||||||||||
| Total assets |
671,020 | 971,813 | 1,022,463 | 1,033,070 | 1,018,052 | |||||||||||||||
| Total stockholders’ equity |
644,003 | 940,425 | 987,375 | 973,049 | 975,706 | |||||||||||||||
| Cash distribution paid per common share |
$ | 10.00 | ||||||||||||||||||
All periods presented have been adjusted for the 1-for-10 reverse stock split. See note 2.
30
Table of Contents
| ITEM 7. | MANAGEMENT’S DISCUSSION AND ANALYSIS OF FINANCIAL CONDITION AND RESULTS OF OPERATIONS |
The following discussion and analysis should be read in conjunction with “Item 6.—Selected Financial Data” and our consolidated financial statements and the related notes thereto included elsewhere in this report. Except for the historical information contained herein, we wish to caution you that certain matters discussed in this report constitute forward-looking statements that involve risks and uncertainties. Our actual results could differ materially from those stated or implied in forward-looking statements due to a number of factors, including, without limitation, those risks and uncertainties discussed under the heading “Item 1A.—Risk Factors” contained in this Form 10-K and any other reports filed by us from time to time with the Securities and Exchange Commission. We disclaim any intention or obligation to update or revise any forward-looking statements, whether as a result of new information, future results or otherwise. Forward-looking statements include statements regarding our expectations, beliefs, intentions or strategies regarding the future and can be identified by forward-looking words such as “anticipate,” “believe,” “could,” “estimate,” “expect,” “intend,” “may,” “should,” “will,” and “would” or similar words.
Executive Summary
We develop and market Intelligent Bandwidth Management solutions for fixed line and mobile network operators worldwide and provide services associated with such products. Our current and prospective customers include domestic and international wireline and wireless network service providers, utility companies, large enterprises, multiple systems operators and government entities (collectively referred to as “service providers”). Our existing bandwidth management portfolio of optical switches, multiservice cross-connects and multiservice access platforms serve applications that extend across the network infrastructure, from multiservice access and regional backhaul to the optical core. We also are in the process of developing and marketing a mobile broadband optimization solution designed to help mobile operators reduce congestion in mobile access networks. We believe our products enable network operators to efficiently and cost-effectively provision and manage network capacity to support a wide range of converged services such as voice, video and data.
Total revenue for fiscal 2010 was $68.6 million, an increase of 2% compared to fiscal 2009. Total revenue for fiscal 2009 was $67.4 million, a decrease of 42% compared to fiscal 2008. Our net loss for fiscal 2010 was $14.8 million compared to a net loss for fiscal 2009 of $53.6 million.
On December 15, 2009, the Company made a cash distribution to its stockholders of $1.00 per share of its common stock, par value $0.001, amounting to $284.3 million in the aggregate (or $10.00 per share of common stock after giving effect to the following reverse stock split) and, at the close of business on December 21, 2009, the Company effected a 1-for-10 reverse stock split of its common stock whereby every ten shares of its issued and outstanding common stock at the effective time were combined into one share of common stock. All periods presented in this report have been adjusted to give effect to the reverse stock split. As a result of having an accumulated deficit, the cash distribution has been recorded as a reduction to additional paid in capital.
We believe that significant new opportunities for our existing bandwidth management products are limited and that these opportunities will continue to be impacted by constraints in capital spending resulting from the current economic downturn and customer plans to migrate to next-generation transmission solutions. As a result, we believe that opportunities for revenue growth in this area of our business will remain limited going forward and our investments in this part of our business will remain focused on supporting customers with sustaining engineering efforts, including targeted, incremental feature development tied to tangible revenue opportunities. In addition, we will not be focusing on the development of next-generation transmission platforms for service providers. At the same time, we have increased our research and development investments in the area of mobile broadband optimization, which we believe represents an emerging market opportunity.
During the fourth quarter of fiscal 2010, we announced the introduction of IQstream, a mobile broadband optimization solution designed to help operators reduce congestion in mobile backhaul networks caused by rising
31
Table of Contents
demand for Internet video and other rich media subscriber content. IQstream is designed to lower the cost of delivering mobile data services by freeing up capacity in the cost-sensitive access network. We expect IQstream to be generally available by the end of the calendar year 2010.
In addition, we will continue to consider strategic options that may serve to enhance stockholder value. These strategic options include, but are not limited to: acquisitions of, or mergers or other business combinations with, companies with complementary technologies or companies in other market segments; the sale or spin-off of certain assets; strategic alliances with, or investments in, other entities; the discontinuation or divestiture of certain products; and recapitalization alternatives, including stock buybacks, cash distributions or cash dividends.
Our total cash, cash equivalents and investments were $636.9 million at July 31, 2010. Included in this amount were cash and cash equivalents of $104.4 million. We intend to fund our operations, including fixed commitments under operating leases, and any required capital expenditures for the foreseeable future using our existing cash, cash equivalents and investments. We believe that, based on our business plans and current conditions, our existing cash, cash equivalents and investments will be sufficient to satisfy our anticipated cash requirements for at least the next twelve months. We also believe that our current cash, cash equivalents and investments will enable us to pursue the strategic options discussed above.
As of July 31, 2010, Sycamore and its subsidiaries employed 287 persons, a net decrease of 118 persons from the 405 persons employed on July 31, 2009.
Critical Accounting Policies and Estimates
Our discussion and analysis of our financial condition and results of operations are based upon our consolidated financial statements. The preparation of these financial statements and related disclosures in conformity with accounting principles generally accepted in the United States of America requires us to make judgments, assumptions and estimates that affect the reported amounts of assets, liabilities, revenue and expenses and disclosure of contingent assets and liabilities. On an ongoing basis, we evaluate these estimates, including those relating to revenue recognition, investments, warranty obligations, inventory valuation, litigation and other contingencies, intangible assets and goodwill and share-based compensation expense. Estimates are based on our historical experience and other assumptions that we consider reasonable under the circumstances, the results of which form the basis for making judgments about the carrying values of assets and liabilities that are not readily apparent from other sources. Actual results may differ from these estimates. Differences between our estimates and the actual results are reflected in the results of operations for the period in which the estimate is changed.
We believe that the following critical accounting policies affect the most significant judgments, assumptions and estimates we use in preparing our consolidated financial statements. Changes in these estimates can affect materially the amount of our reported net income or loss.
Revenue Recognition
For arrangements where software is more than incidental to the functionality of the product, the Company recognizes revenue when all of the following criteria are met: the Company has persuasive evidence of an arrangement with a customer; the Company delivers the products; the fee is fixed or determinable; and collection is probable. Evidence of an arrangement generally consists of sales contracts or agreements and customer purchase orders. Product delivery occurs when title and risk of loss are transferred to the customer. If uncertainties exist regarding customer acceptance, the Company recognizes revenue when all uncertainties are resolved. The Company assesses whether the sales price is fixed or determinable based on payment terms and whether the sales price is subject to refund or adjustment. Collectability is assessed based on the creditworthiness of the customer as determined by credit checks and the customer’s payment history to the Company.
32
Table of Contents
For arrangements which include the delivery of multiple elements, revenue is allocated for all elements based on vendor-specific objective evidence, or VSOE, of fair value. VSOE is generally the price charged when that element is sold separately or the price is established by management having the relevant authority.
In situations where VSOE exists for all elements (delivered and undelivered), the Company allocates the total revenue to be earned under the arrangement among the various elements, based on their relative fair value. For transactions where VSOE exists only for the undelivered elements, the Company uses the residual method and defers the full fair value of the undelivered elements and recognizes the difference between the total arrangement fee and the amount deferred as revenue. If VSOE does not exist for undelivered items that are services, then the entire arrangement fee is recognized ratably over the remaining service period. If VSOE does not exist for undelivered elements that are specified products or features, all revenue is deferred until the earlier of the delivery of all elements or the point at which VSOE for the undelivered elements is determined.
Revenue from installation or other services is recognized as work is performed or ratably over the service period.
For arrangements in which the software component was incidental to the functionality of the product, the Company recognizes revenue when it is realized or realizable and earned. We consider revenue to be realized or realizable and earned when all of the following criteria are met: persuasive evidence of an arrangement exists; delivery has occurred or services have been rendered; the price to the buyer is fixed or determinable; and collectability is reasonably assured. In instances where final acceptance of the product, system, or solution is specified by the customer, revenue is deferred until all acceptance criteria have been met.
When an arrangement in which the software component was incidental to the functionality of the product and that involved multiple elements, the entire fee from the arrangement was allocated to each respective element based on its relative fair value and recognized when revenue recognition criteria for each element was met. Fair value for each element was established based on the sales price charged when the same element was sold separately. If fair value did not exist for any undelivered element, revenue was not recognized until the earlier of (i) the delivery of the undelivered element or (ii) fair value of the undelivered element existed, unless the undelivered element was a service, in which case revenue was recognized as the service was performed once the service was the only undelivered element.
As discussed in the Recent Accounting Pronouncements section, the accounting for the Company’s revenue arrangement will change in fiscal year 2011 with the adoption of the new guidance.
Investments
Our investments are classified as available-for-sale and are recorded at fair value with any unrealized gain or loss recorded as an element of stockholders’ equity. The fair value of investments is determined based on quoted market prices at the reporting date for those instruments. We evaluate our investments for potential impairment on a quarterly basis and would recognize an impairment charge should a decline in the fair value of investments below the related cost basis be judged to be other-than-temporary. The primary factors that are considered in assessing the nature of the impairment include; (i) the credit quality of the underlying security, (ii) the extent to which and time period during which the fair value of the investment has been below cost, (iii) the expected holding or recovery period for the investment, (iv) the Company’s intent to hold each investment until recovery and the likelihood that the Company will not be required to sell the security prior to recovery, and (v) the existence of evidence of default by the issuer.
Warranty Obligations
We accrue for warranty costs at the time revenue is recognized based on contractual rights and on the historical rate of claims and costs to provide warranty services. If we experience a change in warranty claims that
33
Table of Contents
vary from historical experience in our costs to provide warranty services, we may be required to adjust our warranty accrual. A change in the warranty accrual will impact our gross margin.
Inventory
We continuously monitor inventory balances and record inventory provisions for any excess of the cost of the inventory over its estimated market value, based on assumptions about future demand, manufacturing quantities and market conditions. While such assumptions may change from period to period, we measure the net realizable value of inventories using the best information available as of the balance sheet date. If actual market conditions are less favorable than those projected, or we experience a higher incidence of inventory obsolescence because of rapidly changing technology and customer requirements, additional inventory provisions may be required. Once inventory has been written down to its estimated net realizable value, its carrying value can not be increased due to subsequent changes in demand forecasts. Accordingly, if inventory previously written down to its net realizable value is subsequently sold, gross profit margins would be favorably impacted.
Litigation and Other Contingencies
We are subject to various claims, litigation and other disputes, as well as potential liabilities associated with various tax matters. Periodically, we review the status of each significant matter and assess our potential financial exposure. If the potential loss from any claim or legal proceeding is considered probable and the amount can be estimated, we accrue a liability for the estimated loss. Because of uncertainties related to these matters, accruals, if any, are based only on the most current and dependable information available at any given time. As additional information becomes available, we may reassess the potential liability from pending claims, litigation and tax matters and the probability of claims being successfully asserted against us. As a result, it may be necessary to revise our estimates related to these pending claims, litigation and other disputes and potential liabilities associated with various tax matters. Such revisions in the estimates of the potential liabilities are reflected in our results of operations in the period of change and could have a material impact on our consolidated results of operations, financial position and cash flows in the future.
Goodwill, Intangible Assets, and Other Long-lived Assets
Goodwill is subject to annual impairment testing as well as testing upon the occurrence of any event that indicates a potential impairment. We also review other long-lived assets, including purchased intangibles, for impairment whenever events or changes in circumstances indicate that the carrying amount of the assets or asset group may not be recoverable. The carrying value and ultimate realization of these assets is dependent upon estimates of future results and cash flows that our single reporting unit expects to generate from their use. If our expectations of future results and cash flows are significantly diminished, intangible assets, other long-lived assets and goodwill may be impaired and the resulting charge to operations may be material. When we determine that the carrying value of intangibles or other long-lived assets may not be recoverable based upon the existence of one or more indicators of impairment, we use the projected undiscounted cash flow method to determine whether an impairment exists, and then measure the impairment using discounted cash flows. To measure impairment for goodwill, we compare the fair value of our single reporting unit by measuring discounted cash flows to the book value of the reporting unit. Goodwill would be impaired if the resulting implied fair value of goodwill was less than the recorded book value of the goodwill.
The estimation of useful lives and expected cash flows require us to make significant judgments regarding future periods that are subject to some factors outside of our control. Changes in these estimates can result in significant revisions to the carrying value of these assets and may result in material charges to the results of operations.
The Company had elected to perform its annual goodwill impairment testing on the last business day of our fiscal month June, or more often if events or circumstances indicate that there may be impairment. Reporting units are defined as operating segments or one level below an operating segment, referred to as a component. The
34
Table of Contents
Company had determined that our single reporting unit is a component of our one operating segment. The Company allocated goodwill to the reporting unit at the time of acquisition. The estimated fair value of our reporting unit is based on a discounted cash flow model derived from internal earnings and external market forecasts. Assumptions in estimating future cash flows are subject to a high degree of judgment and complexity.
During the fourth quarter of fiscal 2009, and in connection with the preparation of its revised plan for fiscal 2010 and its outlook beyond, the Company updated its estimates of future demand for its core and access products. The revised outlook resulted in a projection of lower discounted cash flows. The combination of current business, economic and market conditions, together with our current estimate of future demand and the resultant cost reduction actions initiated during our fourth quarter, combined to give rise to an impairment in the carrying value of the Company’s goodwill and intangible assets during the fourth quarter of fiscal 2009. The Company recorded an impairment charge of $24.2 million related to the entire carrying value of goodwill of $20.3 million, the remaining carrying value of identified intangible assets of $2.8 million and $1.1 million related to certain fixed assets. During fiscal 2010, the Company recorded an impairment charge of $1.1 million related to certain fixed assets. These fixed assets were no longer being utilized by the Company.
Share-Based Compensation Expense
We account for share-based compensation expense for all share-based payment awards made to employees and directors based on estimated fair values. We have estimated the fair value of share-based options on the date of grant using the Black Scholes pricing model, which is affected by our stock price as well as assumptions regarding a number of complex and subjective variables. These variables include our expected stock price volatility over the term of the awards, actual and projected employee option exercise behaviors, risk free interest rate and expected dividends. We are also required to estimate forfeitures at the time of grant and revise those estimates in subsequent periods if actual forfeitures differ from those estimates.
Results of Operations
Fiscal Years ended July 31, 2010 and 2009
Revenue
The following table presents product and service revenue (in thousands, except percentages):
| Year Ended July 31, | Variance in Dollars |
Variance in Percent |
|||||||||||
| 2010 | 2009 | ||||||||||||
| Revenue |
|||||||||||||
| Product |
$ | 44,655 | $ | 42,571 | $ | 2,084 | 5 | % | |||||
| Service |
23,962 | 24,786 | (824 | ) | (3 | %) | |||||||
| Total revenue |
$ | 68,617 | $ | 67,357 | $ | 1,260 | 2 | % | |||||
Total revenue increased in fiscal 2010 compared to fiscal 2009. Product revenue consists primarily of sales of our Intelligent Bandwidth Management solutions. Product revenue increased in fiscal 2010 compared to fiscal 2009 primarily due to increased sales for our optical switches offset by decreased sales of our multiservice cross-connect products. Service revenue consists primarily of fees for services relating to the maintenance of our products, installation services and training. Service revenue decreased in fiscal 2010 compared to fiscal 2009 primarily due to a decrease in the level of installation and training revenues offset by a slight increase in maintenance revenue.
For fiscal 2010, three customers accounted for 13%, 12% and 12% of revenue, or a combined 37% of our total revenue. Two customers accounted for 19% and 12% of revenue in fiscal 2009, or a combined 31% of our total revenue. International revenue represented 38% of revenue in fiscal 2010, compared to 35% of revenue in fiscal 2009. We expect future revenue will continue to be highly concentrated in a relatively small number of
35
Table of Contents
customers. The timing of customer deployments in any given quarter may cause shifts in both the number of customers comprising greater than 10% of our revenue and in the percentage mix of domestic and international revenue. The loss of any one of these customers or any substantial reduction or delay in orders by any one of these customers could materially adversely affect our business, financial condition and results of operations.
Gross profit
The following table presents gross profit for product and services (in thousands, except percentages):
| Year Ended July 31, | ||||||||
| 2010 | 2009 | |||||||
| Gross profit: |
||||||||
| Product |
$ | 22,700 | $ | 14,361 | ||||
| Service |
14,963 | 14,527 | ||||||
| Total |
$ | 37,663 | $ | 28,888 | ||||
| Gross profit: |
||||||||
| Product |
51 | % | 34 | % | ||||
| Service |
62 | % | 59 | % | ||||
| Total |
55 | % | 43 | % | ||||
Product gross profit
Cost of product revenue consists primarily of amounts paid to third-party contract manufacturers for purchased materials and services, internal manufacturing costs as well as provisions for warranty and rework costs and adjustments which may be required to reduce inventories to their lower of cost or market. Product gross profit increased $8.3 million in fiscal 2010 compared to fiscal 2009. The increase was primarily due to lower inventory provisions, more favorable warranty experience, a more favorable mix of products sold and lower fixed manufacturing expenses. Product gross profit was affected in fiscal 2010 by net inventory provisions of $0.9 million compared to fiscal 2009 net inventory provisions of $3.5 million to adjust inventory carrying values to their lower of cost or market based on anticipated future usage. Product gross profit was affected in fiscal 2009 by restructuring costs of $0.4 million associated with certain workforce reductions and facility costs. Product gross profit may fluctuate from period to period due to revenue fluctuation, volume, pricing pressures resulting from intense competition in our industry as well as the enhanced negotiating leverage of certain larger customers. In addition, product gross profit may be affected by changes in the mix of products sold, channels of distribution, overhead absorption, sales discounts, increases in labor costs, excess inventory and obsolescence charges, increases in component pricing or other material costs, the introduction of new products or the entry into new markets with different pricing and cost structures.
Service gross profit
Cost of service revenue consists primarily of costs of providing services under customer service contracts which include salaries and related expenses and other fixed costs. Service gross profit and gross profit percentage increased in fiscal 2010 compared to fiscal 2009. The year over year dollar and percentage increases relate to a favorable shift in the mix of higher margin maintenance and support services rendered during fiscal 2010 compared to installation and training services.
As most of our service cost of revenue is fixed, increases or decreases in revenue will have a significant impact on service gross profit. Service gross profit may be affected in future periods by various factors including, but not limited to, the change in mix between technical support services and advanced services, competitive and economic pricing pressures, the enhanced negotiating leverage of certain larger customers, maintenance contract renewals and the timing of renewals.
36
Table of Contents
Operating Expenses
The following table presents operating expenses (in thousands, except percentages):
| Year Ended July 31, | Variance in Dollars |
Variance in Percent |
|||||||||||
| 2010 | 2009 | ||||||||||||
| Research and development |
$ | 31,685 | $ | 50,134 | $ | (18,449 | ) | (37 | )% | ||||
| Sales and marketing |
10,942 | 14,551 | (3,609 | ) | (25 | %) | |||||||
| General and administrative |
9,098 | 8,198 | 900 | 11 | % | ||||||||
| Asset impairments |
1,076 | 24,209 | (23,133 | ) | (96 | )% | |||||||
| Restructuring expenses |
5,625 | 3,600 | 2,025 | 56 | % | ||||||||
| Total operating expenses |
$ | 58,426 | $ | 100,692 | $ | (42,266 | ) | (42 | )% | ||||
Research and Development Expenses
Research and development expenses consist primarily of salaries, other employee related expenses and prototype costs relating to design, development, testing and enhancements of our products. Research and development expenses decreased by approximately $18.4 million in fiscal 2010 compared to fiscal 2009. The decrease was primarily due to lower net personnel costs of $13.7 million related to workforce reductions in the fourth quarter of fiscal 2009 and first quarter of fiscal 2010. The decrease was also due to lower fixed and allocated costs of $5.1 million resulting from cost containment actions. These decreases were partially offset by increased personnel costs and discretionary spending related to our new product initiatives.
Sales and Marketing Expenses
Sales and marketing expenses consist primarily of salaries, commissions and related expenses, amortization of customer evaluation inventory and other sales and marketing support expenses. Sales and marketing expenses decreased by approximately $3.6 million in fiscal 2010 compared to fiscal 2009. The decrease was primarily due to lower personnel expenses of $2.6 million resulting from the cost reduction actions and reductions in other discretionary spending initiated over the past year.
Within our existing spending levels, we continue to allocate sales and marketing resources to those geographic regions where we see the most attractive opportunities.
General and Administrative Expenses
General and administrative expenses consist primarily of salaries and related expenses, professional fees and other general corporate expenses and, in prior year periods, amortization of intangible assets. General and administrative costs are net of insurance recoveries associated with the Company’s now concluded stock option investigation.
General and administrative expenses increased by approximately $0.9 million in fiscal 2010 compared to fiscal 2009. The increase in general and administrative expenses was primarily due to an insurance recovery of $3.7 million in fiscal 2009 compared to $0.2 million in fiscal 2010, which had the effect of reducing general and administrative expenses in fiscal 2009. The impact of the lower insurance recoveries was partially offset by a decrease in personnel expenses of $1.0 million resulting from the cost reductions initiated over the past year and a decrease in the amortization of intangible assets of $1.2 million due to the full write-off of such assets in the fourth quarter of fiscal 2009.
Asset Impairments
In conjunction with the workforce reduction and early lease termination plans initiated during fiscal 2009 and fiscal 2010, the Company recorded an asset impairment charge of $1.1 million during the first quarter of fiscal 2010 related to certain fixed assets. These fixed assets were no longer being utilized by the Company.
37
Table of Contents
During the fourth quarter of fiscal 2009, and in connection with the preparation of its revised plan for fiscal 2010 and its outlook beyond, the Company updated its estimates of future demand for its core and access products. The revised outlook resulted in a projection of lower discounted cash flows. Accordingly, the Company conducted an assessment for impairment for its long-lived assets in the fourth quarter of fiscal 2009.
As of June 20, 2009, the last day of our fiscal month June, the Company performed its annual goodwill assessment based on its revised outlook and discounted cash flow analysis. The assessment indicated that the reporting unit’s fair value was less than its carrying value, including goodwill. The subsequent step required that a valuation be conducted, similar to a purchase price allocation done in connection with an acquisition, in order to determine the implied fair value of goodwill. Since the Company operates as a single operating unit, the fair value of the intangible assets was determined as part of this valuation. The result of the valuations determined that the reporting unit’s goodwill and intangible assets were impaired, resulting in a non-cash impairment charge of $20.3 million for goodwill and $2.8 million for intangible assets. In addition, certain fixed assets were also impaired, resulting in an additional non-cash impairment charge of $1.1 million.
Restructuring
In conjunction with the workforce reduction and early lease termination plans initiated in fiscal 2009, certain additional actions were implemented in fiscal 2010. These actions were taken to further re-align our cost structure, pace our development more closely in line with customer requirements and to better position the Company for success in the longer-term. During fiscal 2010, the Company recorded a restructuring charge of $5.7 million, of which $5.6 million was charged to operating expense and $0.1 million to cost of product revenue. This charge relates to (i) employee separation packages including severance pay, benefits continuation and outplacement costs amounting to $3.2 million, of which $3.1 million was charged to operating expense and $0.1 million to cost of product revenue, (ii) a $1.9 million charge for a termination agreement related to our Moorestown, New Jersey facility, and (iii) a $0.6 million charge related to the consolidation of our Chelmsford, Massachusetts facility for rent associated with the portion of the facility that is no longer being used.
During fiscal 2009, the Company recorded restructuring charges of $4.0 million, of which $3.6 million was charged to operating expense and $0.4 million to cost of product revenue. The charges included workforce reductions primarily in sales, marketing, manufacturing and general administrative functions during the first and second quarters of fiscal 2009 totaling $1.1 million ($0.8 million operating expense and $0.3 million cost of product revenue). In the fourth quarter of fiscal 2009, the Company announced further workforce reductions. Certain of those workforce reductions, primarily affecting research and development, were completed during the fourth quarter of fiscal 2009 resulting in a charge of $2.3 million. The charge for workforce reductions primarily related to employee separation packages, which include severance pay, benefits continuation and outplacement costs. In addition, the Company revised its estimate of rent and other facility costs associated with the consolidation of its New Jersey facility resulting in a charge of $0.6 million. The aggregate fourth quarter fiscal 2009 charge was $2.9 million ($2.8 million charged to operating expense and $0.1 million charged to cost of product revenue).
As of July 31, 2010, remaining restructuring payments associated with these actions were $0.5 million.
There can be no assurances that similar actions may not be required in the future.
Interest and Other Income, Net
The following table presents interest and other income, net (in thousands, except percentages):
| Year Ended July 31, | Variance in Dollars |
Variance in Percent |
|||||||||||
| 2010 | 2009 | ||||||||||||
| Interest and other income, net |
$ | 5,592 | $ | 18,000 | $ | (12,408 | ) | (69 | %) | ||||
38
Table of Contents
Interest income decreased in fiscal 2010 compared to fiscal 2009. The decrease was primarily due to lower interest rates in fiscal 2010 when compared to fiscal 2009 and a lower average investment balance as a result of the cash distribution that was paid on December 15, 2009.
Income Tax Expense
Income tax benefit of $0.4 million was recorded in fiscal 2010 versus an income tax benefit of $0.2 million in fiscal 2009. The fiscal 2010 tax benefit reflects the tax effect of the November 2009 enactment of the Home Ownership and Business Assistance Act of 2009. The new law provides for the utilization of 100% (previously 90%) of certain net operating loss carrybacks against alternative minimum taxable income and results in an aggregate refund of alternative minimum tax paid of $0.8 million for fiscal 2006 and fiscal 2007. The fiscal 2009 tax benefit reflects the benefit from the refundable federal research and development credit and a $0.3 million benefit from the reversal of the accumulated deferred tax liability recognized from the impairment of the indefinite lived intangible assets. The benefit in both years was partially offset by income tax expense in certain states and profitable foreign jurisdictions.
As a result of having realized substantial accumulated net operating losses, the Company determined that it is more likely than not that our deferred tax assets may not be realized. Therefore, we maintain a full valuation allowance. If the Company generates sustained future taxable income against which these tax attributes may be applied, some or all of the net operating loss carryforwards may be utilized and the valuation allowance reversed. If the valuation allowance is reversed, portions would be recorded as an increase to paid-in capital and the remainder would be recorded as a reduction in income tax expense.
Fiscal Years ended July 31, 2009 and 2008
Revenue
The following table presents product and service revenue (in thousands, except percentages):
| Year Ended July 31, | Variance in Dollars |
Variance in Percent |
|||||||||||
| 2009 | 2008 | ||||||||||||
| Revenue |
|||||||||||||
| Product |
$ | 42,571 | $ | 89,181 | $ | (46,610 | ) | (52 | %) | ||||
| Service |
24,786 | 26,315 | (1,529 | ) | (6 | %) | |||||||
| Total revenue |
$ | 67,357 | $ | 115,496 | $ | (48,139 | ) | (42 | %) | ||||
Total revenue decreased in fiscal 2009 compared to fiscal 2008. Product revenue consists primarily of sales of our Intelligent Bandwidth Management solutions. Product revenue decreased in fiscal 2009 compared to fiscal 2008 primarily due to deteriorating market and economic conditions, which created a slowdown in capital spending by service providers in general and, more specifically, a significant reduction in the level of orders from two customers. Service revenue consists primarily of fees for services relating to the maintenance of our products, installation services and training. Service revenue decreased in fiscal 2009 compared to fiscal 2008 primarily due to a decrease in the level of installation and training revenues offset by a slight increase in maintenance revenue.
For fiscal 2009, two customers accounted for 19% and 12% of revenue, or a combined 31% of our total revenue. Two customers accounted for 23% and 22% of revenue in fiscal 2008, or a combined 45% of our total revenue. International revenue represented 35% of revenue in fiscal 2009, compared to 48% of revenue in fiscal 2008.
39
Table of Contents
Gross profit
The following table presents gross profit for product and services (in thousands, except percentages):
| Year Ended July 31, | ||||||||
| 2009 | 2008 | |||||||
| Gross profit: |
||||||||
| Product |
$ | 14,361 | $ | 39,310 | ||||
| Service |
14,527 | 13,621 | ||||||
| Total |
$ | 28,888 | $ | 52,931 | ||||
| Gross profit: |
||||||||
| Product |
34 | % | 44 | % | ||||
| Service |
59 | % | 52 | % | ||||
| Total |
43 | % | 46 | % | ||||
Product gross profit
Product gross profit decreased in fiscal 2009 compared to fiscal 2008. The decrease was primarily due to a lower level of revenue in fiscal 2009. The revenue decline was driven by market and economic conditions which led to a general decline in capital spending by service providers and, more specifically, a reduction in the level of orders, primarily from two major customers. Product gross profit was also affected by net inventory provisions of $3.5 million recorded in fiscal 2009 to adjust inventory carrying values to their lower of cost or market based on anticipated future usage, and restructuring costs of $0.4 million associated with certain workforce reductions and facility costs.
Service gross profit
Service gross profit and gross profit percentage increased in fiscal 2009 compared to fiscal 2008. The year over year dollar and percentage increases related to a favorable shift in the mix of higher margin maintenance and support services rendered during fiscal 2009 compared to installation and training services.
Operating Expenses
The following table presents operating expenses (in thousands, except percentages):
| Year Ended July 31, | Variance in Dollars |
Variance in Percent |
|||||||||||
| 2009 | 2008 | ||||||||||||
| Research and development |
$ | 50,134 | $ | 47,397 | $ | 2,737 | 6 | % | |||||
| Sales and marketing |
14,551 | 21,041 | (6,490 | ) | (31 | %) | |||||||
| General and administrative |
8,198 | 15,980 | (7,782 | ) | (49 | %) | |||||||
| Asset impairments |
24,209 | 4,446 | 19,763 | 445 | % | ||||||||
| Restructuring expenses |
3,600 | 2,368 | 1,232 | 52 | % | ||||||||
| Total operating expenses |
$ | 100,692 | $ | 91,232 | $ | 9,460 | 10 | % | |||||
Research and Development Expenses
Research and development expenses increased by approximately $2.7 million in fiscal 2009 compared to fiscal 2008 primarily related to increased personnel costs and higher depreciation expense associated with the expansion of our Shanghai facility. At the beginning of fiscal 2009, we anticipated significant year over year growth in spending for domestic development and expansion of our Shanghai development center and initiated certain incremental investments. In light of economic and market conditions, which emerged during our first quarter, we slowed our expected pace of development expenditures. As the fiscal year progressed, we recognized
40
Table of Contents
that market conditions had worsened and had given rise to a global economic slowdown in which cutbacks in capital spending by service providers were generally occurring and expected to continue for some time. In response to these conditions we proceeded cautiously with development spending with a more measured approach to future offerings. At the beginning of the fourth quarter of fiscal 2009, we initiated actions to reduce our workforce and other costs over several quarters. Workforce reductions were then implemented during the fourth quarter with further reductions implemented at the beginning of fiscal 2010. Due to the timing of the initiated actions, research and development expenses in fiscal 2009 increased, primarily personnel costs, over the fiscal 2008 level.
Sales and Marketing Expenses
Sales and marketing expenses decreased by approximately $6.5 million in fiscal 2009 compared to fiscal 2008. The decrease was primarily due to workforce reductions initiated early in fiscal 2009, as well as lower commission expense on lower revenue, decreased spending for trade shows and lower amortization of customer evaluation equipment.
General and Administrative Expenses
General and administrative expenses decreased approximately $7.8 million in fiscal 2009 compared to fiscal 2008. General and administrative expenses include costs and cost recoveries associated with the now concluded stock option investigation. Cost recoveries in fiscal 2009 totaled $3.7 million, while related costs in fiscal 2008 were $1.4 million. Amortization of purchased intangibles in fiscal 2009 was $1.2 million below fiscal 2008. The remaining year over year reduction relates to workforce and other cost reductions implemented in early fiscal 2009.
Asset Impairments
During the fourth quarter of fiscal 2009, and in connection with the preparation of its revised plan for fiscal 2010 and its outlook beyond, the Company updated its estimates of future demand for its core and access products. The revised outlook resulted in a projection of lower discounted cash flows. At the time the Company was continuing with its plan to streamline operations and to pace development efforts with a more measured approach toward future offerings, while maintaining the resources to meet customer commitments and advance selective new opportunities. Accordingly, the Company conducted an assessment for impairment for its long-lived assets in the fourth quarter of fiscal 2009.
As of June 20, 2009, the last day of our fiscal month June, the Company performed its annual goodwill assessment based on its revised outlook and discounted cash flow analysis. The assessment indicated that the reporting unit’s fair value was less than its carrying value, including goodwill. The subsequent step required that a valuation be conducted, similar to a purchase price allocation done in connection with an acquisition, in order to determine the implied fair value of goodwill. Since the Company operates as a single operating unit, the fair value of the intangible assets was determined as part of this valuation. The result of the valuations determined that the reporting unit’s goodwill and intangible assets were impaired, resulting in a non-cash impairment charge of $20.3 million for goodwill and $2.8 million for intangible assets. In addition, certain fixed assets were also impaired, resulting in an additional non-cash impairment charge of $1.1 million.
Restructuring
During fiscal 2009, the Company recorded restructuring charges of $4.0 million of which $3.6 million was charged to operating expense and $0.4 million to cost of product revenue. The charges included workforce reductions primarily in sales, marketing, manufacturing and general administrative functions during the first and second quarters of fiscal 2009 totaling $1.1 million ($0.8 million operating expense and $0.3 million cost of product revenue). In the fourth quarter of fiscal 2009, the Company announced further workforce reductions. Certain of those workforce reductions, primarily affecting research and development, were completed during the
41
Table of Contents
fourth quarter of fiscal 2009 resulting in a charge of $2.3 million. The charge for workforce reductions primarily related to employee separation packages, which include severance pay, benefits continuation and outplacement costs. In addition, the Company revised its estimate of rent and other facility costs associated with the consolidation of its New Jersey facility resulting in a charge of $0.6 million. The aggregate fourth quarter fiscal 2009 charge was $2.9 million ($2.8 million charged to operating expense and $0.1 million charged to cost of product revenue).
During the first quarter of 2008, we completed a consolidation of our Moorestown, New Jersey facility and recorded a restructuring charge of $2.0 million. This consolidation was in conjunction with the decision in the fourth quarter of fiscal 2008 to reduce our workforce across the Company. We completed these actions to better align development resources with future growth opportunities, further improve operational efficiencies, and capitalize on additional acquisition synergies. As a result of these actions, we recorded a restructuring charge related to rent and other facility charges related to our Moorestown facility. The charge in the first quarter of fiscal 2008 also included severance costs related to several employees affected by the fourth quarter fiscal 2007 workforce reduction who were placed on transition programs and whose employment was terminated in the first quarter of fiscal 2008. In the third quarter of fiscal 2008 we recorded an additional restructuring charge related to the consolidation of our Moorestown facility of $0.4 million. The charge was based on a revised lower estimate of future sublease income and a lease termination fee.
Interest and Other Income, Net
The following table presents interest and other income, net (in thousands, except percentages):
| Year Ended July 31, | Variance in Dollars |
Variance in Percent |
|||||||||||
| 2009 | 2008 | ||||||||||||
| Interest and other income, net |
$ | 18,000 | $ | 38,784 | $ | (20,784 | ) | (54 | %) | ||||
Interest income decreased in fiscal 2009 compared to fiscal 2008 primarily due to declining interest rates during the year.
Income Tax Expense
Income tax benefit of $0.2 million was recorded in fiscal 2009 versus an income tax expense of $0.6 million in fiscal 2008. The decrease primarily resulted from a $0.3 million benefit from the new refundable federal research and development credit and a $0.3 million benefit from the reversal of the accumulated deferred tax liability recognized from the impairment of the indefinite lived intangible assets.
Liquidity and Capital Resources
Year Ended July 31, 2010
Total cash, cash equivalents and investments were $636.9 million at July 31, 2010 compared to $926.8 million at July 31, 2009. Included in the July 31, 2010 balances were cash and cash equivalents of $104.4 million, compared to $347.7 million at July 31, 2009. The decrease in cash and cash equivalents of $243.3 million was primarily attributable to cash used in financing activities of $284.1 million and cash used in operating activities of $4.2 million, partially offset by cash provided by investing activities of $45.0 million.
Net cash provided by investing activities was $45.0 million and consisted of net maturities of investments of $45.8 million offset by purchases of property and equipment of $0.8 million.
Net cash used in operating activities was $4.2 million. Net loss was $14.8 million and included non-cash charges including share-based compensation of $3.3 million, an inventory provision of $0.9 million, depreciation and amortization of $6.4 million, and asset impairment charges of $1.1 million. Accounts receivable increased to $14.2 million at July 31, 2010 from $12.9 million at July 31, 2009. The increase was primarily due to an increase
42
Table of Contents
in sales in the fourth quarter of 2010. Our accounts receivable and days sales outstanding are impacted primarily by the timing of shipments, collections performance and timing of support contract renewals. Inventory levels decreased to $11.2 million at July 31, 2010 from $16.1 million at July 31, 2009. The decrease was primarily due to the timing of shipments. Deferred revenue decreased to $14.8 million at July 31, 2010 from $15.5 million at July 31, 2009. The decrease resulted from slightly lower deferred product shipments and the timing of service billings. Accrued restructuring costs decreased to $0.5 million from $2.5 million at July 31, 2009. During fiscal 2010 the company recorded a restructuring charge of $5.7 million and made cash payments of $7.7 million associated with restructuring activities.
For the year ended July 31, 2010, net cash used in financing activities was $284.1 million. On December 15, 2009, the Company made a cash distribution to its stockholders of $1.00 per share of its common stock, par value $0.001, amounting to $284.3 million in the aggregate (or $10.00 per share of common stock after giving effect to the following reverse stock split) and, at the close of business on December 21, 2009, the Company effected a 1-for-10 reverse stock split of its common stock whereby every ten shares of its issued and outstanding common stock at the effective time were combined into one share of common stock. All periods presented in this report have been adjusted to give effect to the reverse stock split. As a result of having an accumulated deficit, the cash distribution has been recorded as a reduction to additional paid in capital. The cash distribution was offset by $0.2 million of proceeds from stock option exercises.
Our primary source of liquidity comes from our cash, cash equivalents and investments, which totaled $636.9 million as of July 31, 2010. Our investments are classified as available-for-sale and consist of securities that are readily convertible to cash, including certificates of deposits and government securities. As of July 31, 2010, $450.7 million of investments with maturities of less than one year were classified as short-term investments. Based on our current expectations, we anticipate that some portion of our existing cash and cash equivalents and investments may be consumed by operations. Our accounts receivable, while not considered a primary source of liquidity, represent a concentration of credit risk because the accounts receivable balance at any point in time typically consists of a relatively small number of customer account balances. As of July 31, 2010, more than 59% of our accounts receivable balance was attributable to three of our customers. As of July 31, 2010, we do not have any outstanding debt or credit facilities, and do not anticipate entering into any debt or credit agreements in the foreseeable future. Our fixed commitments for cash expenditures consist primarily of payments under operating leases and inventory purchase commitments. We do not currently have any material commitments for capital expenditures, or any other material commitments aside from operating leases for our facilities and inventory purchase commitments. We currently intend to fund our operations, including our fixed commitments under operating leases, and any required capital expenditures using our existing cash, cash equivalents and investments.
We believe that our current cash, cash equivalents and investments will be sufficient to satisfy our anticipated cash requirements for at least the next twelve months. We will continue to consider appropriate action with respect to our cash position in light of present and anticipated business needs as well as providing a means by which our stockholders may realize value in connection with their investment.
Commitments, Contractual Obligations and Off-Balance Sheet Arrangements
At July 31, 2010, our future contractual obligations, which consist of contractual commitments for operating leases and inventory and other purchase commitments, were as follows (in thousands):
| Total | Less than 1 Year |
1-3 Years | 3-5 Years | Thereafter | |||||||||||
| Operating leases |
$ | 3,204 | $ | 1,770 | $ | 1,434 | $ | — | $ | — | |||||
| Inventory and other purchase commitments |
5,048 | 5,048 | — | — | — | ||||||||||
| Total |
$ | 8,252 | $ | 6,818 | $ | 1,434 | $ | — | $ | — | |||||
43
Table of Contents
Payments made under operating leases will be accounted for as rent expense for the facilities currently being utilized, or as a reduction of the restructuring liability for payments relating to excess facilities. Payments made for inventory purchase commitments will initially be capitalized as inventory, and will subsequently be charged to cost of revenue as the inventory is sold or otherwise disposed of.
Reserves for unrecognized tax benefits of $1.6 million have not been included in the above table because the periods of cash settlement with the respective tax authority cannot be reasonably estimated.
Recent Accounting Pronouncements
In December 2007, the FASB issued a new pronouncement on business combinations. This pronouncement replaces the old business combination pronouncement and provides greater consistency in the accounting and financial reporting of business combinations. The pronouncement requires the acquiring entity in a business combination to recognize all assets acquired and liabilities assumed in the transaction at fair value, establishes the acquisition-date fair value as the measurement objective for all assets acquired and liabilities assumed, establishes principles and requirements for how an acquirer recognizes and measures any non-controlling interest in the acquiree and the goodwill acquired, and requires the acquirer to disclose the nature and financial effect of the business combination. Among other changes, this statement also requires that “negative goodwill” be recognized in earnings as a gain attributable to the acquisition without first reducing other acquired assets, that acquisition-related costs are to be recognized separately from the acquisition and expensed as incurred and that any deferred tax benefits resulting from a business combination are to be recognized in income from continuing operations in the period of the combination. This pronouncement is effective for business combinations for which the acquisition date is on or after the beginning of the first annual reporting period beginning on or after December 15, 2008 and as a result, the Company adopted the pronouncement in the first quarter of fiscal 2010 and it did not have a material impact on our consolidated financial statements.
In April 2009, the FASB issued new guidance on accounting for assets acquired and liabilities assumed in a business combination that arise from contingencies. This new guidance amends the prior guidance for the initial recognition and measurement, subsequent measurement and accounting, and disclosures for assets and liabilities arising from contingencies in business combinations. The new guidance eliminates the distinction between contractual and non-contractual contingencies. The new guidance is effective for contingent assets and contingent liabilities acquired in business combinations for which the acquisition date is on or after the beginning of the first annual reporting period beginning on or after December 15, 2008 and as a result, the Company adopted the new guidance in the first quarter of fiscal 2010 and it did not have a material impact on our consolidated financial statements.
In February 2008, the FASB issued new guidance that delays fair value accounting for all nonfinancial assets and nonfinancial liabilities, except those that are recognized or disclosed at fair value in the financial statements on at least an annual basis until 2009. The Company adopted fair value accounting beginning August 1, 2008 and deferred the application of fair value accounting for nonfinancial assets and liabilities until August 1, 2009. The Company adopted fair value accounting for nonfinancial assets and liabilities in the first quarter of fiscal 2010 and it did not have a material impact on our consolidated financial statements.
In September 2009, the Emerging Issues Task Force issued new guidance pertaining to the accounting for revenue arrangements with multiple deliverables. The new guidance addresses how to determine whether an arrangement involving multiple deliverables contains more than one unit of accounting, and how the arrangement consideration should be allocated among the separate units of accounting. The new guidance is effective for fiscal years beginning after June 15, 2010 and may be applied retrospectively or prospectively for new or materially modified arrangements. In addition, early adoption is permitted. The new guidance is applicable to the Company and will be effective beginning August 1, 2010. The Company has evaluated this new guidance and believes it will not have a material impact on our consolidated financial statements.
44
Table of Contents
In September 2009, the Emerging Issues Task Force issued new guidance that changes the accounting model for revenue arrangements that include both tangible products and software elements that are “essential to the functionality” and removes these products from the scope of current software revenue guidance. The new guidance shall be applied on a prospective basis for revenue arrangements entered into or materially modified in fiscal years beginning on or after June 15, 2010. Earlier application is permitted as of the beginning of a company’s fiscal year provided the company has not previously issued financial statements for any period within that year. An entity shall not elect early application of this guidance unless it also elects early application of the new rule pertaining to accounting for revenue arrangements with multiple deliverables. The new guidance is applicable to the Company and will be effective beginning August 1, 2010. The Company has evaluated this new guidance and believes it will not have a material impact on our consolidated financial statements.
In January 2010, the FASB issued new guidance on the disclosures of fair value measurements. This new guidance amends the authoritative guidance for fair value measurements and disclosures by adding new disclosure requirements with respect to transfers in and out of Levels 1 and 2 fair value measurements, as well as by requiring gross basis disclosures for purchases, sales, issuances, and settlements included in the reconciliation of Level 3 fair value measurements. This new guidance also amends the authoritative guidance by providing clarifications to existing disclosure requirements. The new disclosures and clarifications of existing disclosures are effective for interim and annual reporting periods beginning after December 15, 2009, except for the disclosures about purchases, sales, issuances, and settlements in the roll forward of activity in Level 3 fair value measurements which are effective for fiscal years beginning after December 15, 2010 and for interim periods within those fiscal years. Early adoption is permitted. We adopted this new guidance, including the guidance related to the disclosures about purchases, sales, issuances, and settlements in the roll forwards of activity in Level 3 fair value measurements, beginning in the third quarter of 2010 fiscal year. The adoption of this guidance did not have a material impact on our financial position or results of operations.
45
Table of Contents
| ITEM 7A. | QUANTITATIVE AND QUALITATIVE DISCLOSURES ABOUT MARKET RISK |
Interest Rate Sensitivity
The primary objective of our current investment activities is to preserve investment principal while maximizing income without significantly increasing risk. We maintain a portfolio of cash equivalents and short-term and long-term investments in a variety of securities which may include commercial paper, certificates of deposit, money market funds and government debt securities. These available-for-sale investments are subject to interest rate risk and may decline in value if market interest rates increase. If market interest rates increased immediately and uniformly by 10 percent from levels at July 31, 2010, the fair value of the portfolio would decline by approximately $0.2 million. We have the ability to hold our fixed income investments until maturity, and therefore do not expect our operating results or cash flows to be affected to any significant degree by the effect of a sudden change in market interest rates on our investment portfolio.
Exchange Rate Sensitivity
While the majority of our operations are based in the United States, our business is global, with international revenue representing 38% of total revenue in fiscal 2010. We expect that international sales may continue to represent a significant portion of our revenue. Generally, sales outside of the United States are denominated in US dollars. In the future, to the extent that sales outside of the United States might be denominated in local currencies, exchange rate fluctuations in foreign currencies may have an impact on our financial results, although to date such impact has not been material. We are prepared to hedge against fluctuations in foreign currencies if the exposure is material, although we have not engaged in hedging activities to date.
46
Table of Contents
| ITEM 8. | FINANCIAL STATEMENTS AND SUPPLEMENTARY DATA |
INDEX TO CONSOLIDATED FINANCIAL STATEMENTS
| 48 | ||
| 49 | ||
| Consolidated Statements of Operations for the years ended July 31, 2010, 2009 and 2008 |
50 | |
| 51 | ||
| Consolidated Statements of Cash Flows for the years ended July 31, 2010, 2009 and 2008 |
52 | |
| 53 | ||
47
Table of Contents
Report of Independent Registered Public Accounting Firm
To the Board of Directors and Shareholders of
Sycamore Networks, Inc.:
In our opinion, the accompanying consolidated balance sheets and the related consolidated statements of operations, of stockholders’ equity and comprehensive income (loss) and of cash flows present fairly, in all material respects, the financial position of Sycamore Networks, Inc. at July 31, 2010 and 2009, and the results of their operations and their cash flows for each of the three years in the period ended July 31, 2010 in conformity with accounting principles generally accepted in the United States of America. Also in our opinion, the Company maintained, in all material respects, effective internal control over financial reporting as of July 31, 2010, based on criteria established in Internal Control—Integrated Framework issued by the Committee of Sponsoring Organizations of the Treadway Commission (COSO). The Company’s management is responsible for these financial statements, for maintaining effective internal control over financial reporting and for its assessment of the effectiveness of internal control over financial reporting, included in Management’s Report on Internal Control over Financial Reporting appearing under Item 9A. Our responsibility is to express opinions on these financial statements and on the Company’s internal control over financial reporting based on our integrated audits. We conducted our audits in accordance with the standards of the Public Company Accounting Oversight Board (United States). Those standards require that we plan and perform the audits to obtain reasonable assurance about whether the financial statements are free of material misstatement and whether effective internal control over financial reporting was maintained in all material respects. Our audits of the financial statements included examining, on a test basis, evidence supporting the amounts and disclosures in the financial statements, assessing the accounting principles used and significant estimates made by management, and evaluating the overall financial statement presentation. Our audit of internal control over financial reporting included obtaining an understanding of internal control over financial reporting, assessing the risk that a material weakness exists, and testing and evaluating the design and operating effectiveness of internal control based on the assessed risk. Our audits also included performing such other procedures as we considered necessary in the circumstances. We believe that our audits provide a reasonable basis for our opinions.
A company’s internal control over financial reporting is a process designed to provide reasonable assurance regarding the reliability of financial reporting and the preparation of financial statements for external purposes in accordance with generally accepted accounting principles. A company’s internal control over financial reporting includes those policies and procedures that (i) pertain to the maintenance of records that, in reasonable detail, accurately and fairly reflect the transactions and dispositions of the assets of the company; (ii) provide reasonable assurance that transactions are recorded as necessary to permit preparation of financial statements in accordance with generally accepted accounting principles, and that receipts and expenditures of the company are being made only in accordance with authorizations of management and directors of the company; and (iii) provide reasonable assurance regarding prevention or timely detection of unauthorized acquisition, use, or disposition of the company’s assets that could have a material effect on the financial statements.
Because of its inherent limitations, internal control over financial reporting may not prevent or detect misstatements. Also, projections of any evaluation of effectiveness to future periods are subject to the risk that controls may become inadequate because of changes in conditions, or that the degree of compliance with the policies or procedures may deteriorate.
/s/ PricewaterhouseCoopers LLP
Boston, Massachusetts
September 24, 2010
48
Table of Contents
CONSOLIDATED BALANCE SHEETS
(in thousands, except par value)
| July 31, 2010 |
July 31, 2009 |
|||||||
| ASSETS | ||||||||
| Current assets: |
||||||||
| Cash and cash equivalents |
$ | 104,416 | $ | 347,696 | ||||
| Short-term investments |
450,722 | 273,387 | ||||||
| Accounts receivable, net of allowance for doubtful accounts of $72 at July 31, 2010 and July 31, 2009 |
14,168 | 12,860 | ||||||
| Inventories |
11,175 | 16,058 | ||||||
| Prepaid expenses and other current assets |
1,873 | 2,388 | ||||||
| Total current assets |
582,354 | 652,389 | ||||||
| Property and equipment, net |
6,569 | 13,342 | ||||||
| Long-term investments |
81,739 | 305,725 | ||||||
| Other assets |
358 | 357 | ||||||
| Total assets |
$ | 671,020 | $ | 971,813 | ||||
| LIABILITIES AND STOCKHOLDERS’ EQUITY | ||||||||
| Current liabilities: |
||||||||
| Accounts payable |
$ | 2,891 | $ | 2,364 | ||||
| Accrued compensation |
2,767 | 2,715 | ||||||
| Accrued warranty |
1,720 | 2,866 | ||||||
| Accrued expenses |
1,437 | 1,859 | ||||||
| Accrued restructuring costs |
498 | 2,509 | ||||||
| Deferred revenue |
10,930 | 11,003 | ||||||
| Other current liabilities |
1,142 | 1,721 | ||||||
| Total current liabilities |
21,385 | 25,037 | ||||||
| Long term deferred revenue |
3,918 | 4,530 | ||||||
| Long term liabilities |
1,714 | 1,821 | ||||||
| Total liabilities |
27,017 | 31,388 | ||||||
| Commitments and contingencies (Notes 6 and 13) |
||||||||
| Stockholders’ equity: |
||||||||
| Preferred stock, $.01 par value; 5,000 shares authorized, none issued and outstanding at July 31, 2010 and July 31, 2009 |
— | — | ||||||
| Common stock, $.001 par value; 250,000 shares authorized, 28,431 and 28,424 shares issued at July 31, 2010 and July 31, 2009, respectively |
28 | 28 | ||||||
| Additional paid-in capital |
1,759,520 | 2,040,317 | ||||||
| Accumulated deficit |
(1,116,160 | ) | (1,101,355 | ) | ||||
| Accumulated other comprehensive income |
615 | 1,435 | ||||||
| Total stockholders’ equity |
644,003 | 940,425 | ||||||
| Total liabilities and stockholders’ equity |
$ | 671,020 | $ | 971,813 | ||||
The accompanying notes are an integral part of the consolidated financial statements.
49
Table of Contents
CONSOLIDATED STATEMENTS OF OPERATIONS
(in thousands, except per share amounts)
| Year Ended July 31, | ||||||||||||
| 2010 | 2009 | 2008 | ||||||||||
| Revenue |
||||||||||||
| Product |
$ | 44,655 | $ | 42,571 | $ | 89,181 | ||||||
| Service |
23,962 | 24,786 | 26,315 | |||||||||
| Total revenue |
68,617 | 67,357 | 115,496 | |||||||||
| Cost of revenue |
||||||||||||
| Product |
21,955 | 28,210 | 49,871 | |||||||||
| Service |
8,999 | 10,259 | 12,694 | |||||||||
| Total cost of revenue |
30,954 | 38,469 | 62,565 | |||||||||
| Gross profit |
37,663 | 28,888 | 52,931 | |||||||||
| Operating expenses: |
||||||||||||
| Research and development |
31,685 | 50,134 | 47,397 | |||||||||
| Sales and marketing |
10,942 | 14,551 | 21,041 | |||||||||
| General and administrative |
9,098 | 8,198 | 15,980 | |||||||||
| Goodwill impairment |
— | 20,334 | — | |||||||||
| Asset impairments |
1,076 | 3,875 | 4,446 | |||||||||
| Restructuring charges |
5,625 | 3,600 | 2,368 | |||||||||
| Total operating expenses |
58,426 | 100,692 | 91,232 | |||||||||
| Loss from operations |
(20,763 | ) | (71,804 | ) | (38,301 | ) | ||||||
| Interest and other income, net |
5,592 | 18,000 | 38,784 | |||||||||
| Income (loss) before income taxes |
(15,171 | ) | (53,804 | ) | 483 | |||||||
| Income tax expense (benefit) |
(366 | ) | (232 | ) | 597 | |||||||
| Net loss |
$ | (14,805 | ) | $ | (53,572 | ) | $ | (114 | ) | |||
| Net loss per share: |
||||||||||||
| Basic |
$ | (0.52 | ) | $ | (1.89 | ) | $ | (0.00 | ) | |||
| Diluted |
$ | (0.52 | ) | $ | (1.89 | ) | $ | (0.00 | ) | |||
| Weighted average shares outstanding: |
||||||||||||
| Basic |
28,422 | 28,359 | 28,248 | |||||||||
| Diluted |
28,422 | 28,359 | 28,248 | |||||||||
| Cash distribution paid per common share |
$ | 10.00 | ||||||||||
The accompanying notes are an integral part of the consolidated financial statements.
50
Table of Contents
CONSOLIDATED STATEMENTS OF STOCKHOLDERS’ EQUITY
AND COMPREHENSIVE INCOME (LOSS)
(in thousands)
| Common Stock | Additional Paid-in Capital |
Accumulated Deficit |
Treasury Stock | Accumulated Other Comprehensive Income (Loss) |
Total Stockholders’ Equity |
|||||||||||||||||||||||
| Shares | Amount | Shares | Amount | |||||||||||||||||||||||||
| Balance, July 31, 2007 |
28,004 | $ | 28 | $ | 2,020,976 | $ | (1,047,669 | ) | — | $ | — | $ | (286 | ) | $ | 973,049 | ||||||||||||
| Net loss |
— | — | — | (114 | ) | — | — | — | (114 | ) | ||||||||||||||||||
| Unrealized gain on investments |
— | — | — | — | — | — | 342 | 342 | ||||||||||||||||||||
| Total comprehensive income |
228 | |||||||||||||||||||||||||||
| Issuance of common stock under employee and director stock plans |
319 | — | 9,816 | — | — | — | — | 9,816 | ||||||||||||||||||||
| Treasury stock purchases |
— | — | — | — | 5 | — | — | — | ||||||||||||||||||||
| Cash settlement of stock awards |
— | — | (210 | ) | — | — | — | — | (210 | ) | ||||||||||||||||||
| Share-based compensation expense |
64 | — | 4,492 | — | — | — | — | 4,492 | ||||||||||||||||||||
| Balance, July 31, 2008 |
28,387 | $ | 28 | $ | 2,035,074 | $ | (1,047,783 | ) | 5 | $ | — | $ | 56 | $ | 987,375 | |||||||||||||
| Net loss |
— | — | — | (53,572 | ) | — | — | — | (53,572 | ) | ||||||||||||||||||
| Unrealized gain on investments |
— | — | — | — | — | — | 1,379 | 1,379 | ||||||||||||||||||||
| Total comprehensive loss |
(52,193 | ) | ||||||||||||||||||||||||||
| Issuance of common stock under employee and director stock plans |
39 | — | 557 | — | — | — | — | 557 | ||||||||||||||||||||
| Treasury stock purchases |
— | — | — | — | 17 | — | — | — | ||||||||||||||||||||
| Treasury stock retirement |
(2 | ) | — | — | — | (22 | ) | — | — | — | ||||||||||||||||||
| Share-based compensation expense |
— | — | 4,686 | — | — | — | — | 4,686 | ||||||||||||||||||||
| Balance, July 31, 2009 |
28,424 | $ | 28 | $ | 2,040,317 | $ | (1,101,355 | ) | — | $ | — | $ | 1,435 | $ | 940,425 | |||||||||||||
| Net loss |
— | — | — | (14,805 | ) | — | — | — | (14,805 | ) | ||||||||||||||||||
| Unrealized gain (loss) on investments |
— | — | — | — | — | — | (820 | ) | (820 | ) | ||||||||||||||||||
| Total comprehensive loss |
(15,625 | ) | ||||||||||||||||||||||||||
| Issuance of common stock under employee and director stock plans |
13 | — | 233 | — | — | — | — | 233 | ||||||||||||||||||||
| Cash distribution |
— | — | (284,320 | ) | — | — | — | — | (284,320 | ) | ||||||||||||||||||
| Treasury stock purchases |
— | — | — | — | 6 | — | — | — | ||||||||||||||||||||
| Treasury stock retirement |
(6 | ) | — | — | — | (6 | ) | — | — | — | ||||||||||||||||||
| Share-based compensation expense |
— | — | 3,290 | — | — | — | — | 3,290 | ||||||||||||||||||||
| Balance, July 31, 2010 |
28,431 | $ | 28 | $ | 1,759,520 | $ | (1,116,160 | ) | — | $ | — | $ | 615 | $ | 644,003 | |||||||||||||
The accompanying notes are an integral part of the consolidated financial statements.
51
Table of Contents
CONSOLIDATED STATEMENTS OF CASH FLOWS
(in thousands)
| Year Ended July 31, | ||||||||||||
| 2010 | 2009 | 2008 | ||||||||||
| Cash flows from operating activities: |
||||||||||||
| Net loss |
$ | (14,805 | ) | $ | (53,572 | ) | $ | (114 | ) | |||
| Adjustments to reconcile net loss to net cash provided by (used in) operating activities: |
||||||||||||
| Depreciation and amortization |
6,393 | 12,021 | 12,819 | |||||||||
| Share-based compensation |
3,290 | 4,686 | 4,491 | |||||||||
| Goodwill impairment |
— | 20,334 | — | |||||||||
| Asset impairments |
1,076 | 3,875 | 4,446 | |||||||||
| Adjustments to provisions for excess and obsolete inventory |
905 | 3,477 | 3,697 | |||||||||
| Loss on disposal of equipment |
24 | 15 | 54 | |||||||||
| Restructuring charges |
— | — | 1,149 | |||||||||
| Changes in operating assets and liabilities: |
||||||||||||
| Accounts receivable |
(1,308 | ) | (4,081 | ) | 21,742 | |||||||
| Inventories |
3,734 | 3,751 | (6,486 | ) | ||||||||
| Prepaid expenses and other current assets |
514 | 584 | 266 | |||||||||
| Deferred revenue |
(685 | ) | (3,608 | ) | 4,702 | |||||||
| Accounts payable |
527 | (129 | ) | (11,072 | ) | |||||||
| Accrued expenses and other liabilities |
(1,867 | ) | (1,762 | ) | (16,810 | ) | ||||||
| Accrued restructuring costs |
(2,011 | ) | 1,828 | (1,204 | ) | |||||||
| Net cash provided by (used in) operating activities |
(4,213 | ) | (12,581 | ) | 17,680 | |||||||
| Cash flows from investing activities: |
||||||||||||
| Purchases of property and equipment |
(811 | ) | (4,381 | ) | (11,885 | ) | ||||||
| Purchases of investments |
(427,294 | ) | (830,137 | ) | (799,126 | ) | ||||||
| Proceeds from maturities and sales of investments |
473,125 | 694,316 | 1,033,045 | |||||||||
| Net cash provided by (used in) investing activities |
45,020 | (140,202 | ) | 222,034 | ||||||||
| Cash flows from financing activities: |
||||||||||||
| Payment of cash distribution to common stockholders |
(284,320 | ) | — | — | ||||||||
| Proceeds from issuance of common stock, net |
233 | 557 | 10,946 | |||||||||
| Net cash provided by (used in) financing activities |
(284,087 | ) | 557 | 10,946 | ||||||||
| Net increase (decrease) in cash and cash equivalents |
(243,280 | ) | (152,226 | ) | 250,660 | |||||||
| Cash and cash equivalents, beginning of year |
347,696 | 499,922 | 249,262 | |||||||||
| Cash and cash equivalents, end of year |
$ | 104,416 | $ | 347,696 | $ | 499,922 | ||||||
| Supplemental cash flow information: |
||||||||||||
| Cash paid for income taxes |
$ | 323 | $ | 378 | $ | 354 | ||||||
The accompanying notes are an integral part of the consolidated financial statements.
52
Table of Contents
NOTES TO CONSOLIDATED FINANCIAL STATEMENTS
1. Description of Business
We develop and market Intelligent Bandwidth Management solutions for fixed line and mobile network operators worldwide and provide services associated with such products. Our current and prospective customers include domestic and international wireline and wireless network service providers, utility companies, large enterprises, multiple systems operators and government entities (collectively referred to as “service providers”). Our existing bandwidth management portfolio of optical switches, multiservice cross-connects and multiservice access platforms serve applications that extend across the network infrastructure, from multiservice access and regional backhaul to the optical core. We also are in the process of developing and marketing a mobile broadband optimization solution designed to help mobile operators reduce congestion in mobile access networks. We believe our products enable network operators to efficiently and cost-effectively provision and manage network capacity to support a wide range of converged services such as voice, video and data. As used in this report, “Sycamore,” “we,” “us,” or “our” refers collectively to Sycamore Networks, Inc. (the “Company”) and its subsidiaries.
2. Summary of Significant Accounting Policies
The accompanying financial statements reflect the application of certain significant accounting policies as described below. The Company believes these accounting policies are critical because changes in such estimates can materially affect the amount of the Company’s reported net income or loss.
Cash Distribution and Reverse Stock Split
On December 15, 2009, the Company made a cash distribution to its stockholders of $1.00 per share of its common stock, par value $0.001, amounting to $284.3 million in the aggregate (or $10.00 per share of common stock after giving effect to the following reverse stock split) and, at the close of business on December 21, 2009, the Company effected a 1-for-10 reverse stock split of its common stock whereby every ten shares of its issued and outstanding common stock at the effective time were combined into one share of common stock. All periods presented in this report have been adjusted to give effect to the reverse stock split. As a result of having an accumulated deficit, the cash distribution has been recorded as a reduction to additional paid in capital.
In connection with the reverse stock split, the number of shares of common stock authorized under Company’s Amended and Restated Certificate of Incorporation was reduced from 2.5 billion to 250 million shares, without any change in par value per share of common stock. The number of shares of the Company’s authorized preferred stock was not changed in connection with the reverse stock split and remains at 5 million shares.
Principles of Consolidation
The consolidated financial statements include the accounts of the Company and its subsidiaries. All significant intercompany accounts and transactions have been eliminated.
Cash Equivalents and Investments
Cash equivalents are short-term, highly liquid investments with original or remaining maturity dates of three months or less at the date of acquisition. Cash equivalents are carried at cost plus accrued interest, which approximates fair market value. The Company’s investments are classified as available-for-sale and are recorded at fair value with any unrealized gain or loss recorded as an element of stockholders’ equity. The fair value of investments is determined based on quoted market prices at the reporting date for those instruments. The Company would recognize an impairment charge when a decline in the fair value of its investments below the
53
Table of Contents
cost basis is judged to be other-than-temporary. The Company considers various factors in determining whether to recognize an impairment charge, including the length of time and extent to which the fair value has been less than the Company’s cost basis, the financial condition and near-term prospects of the investee, and the Company’s intent and ability to hold the investment for a period of time sufficient to allow for any anticipated recovery in market value. As of July 31, 2010 and 2009, aggregate cash and cash equivalents and short and long term investments consisted of (in thousands):
| July 31, 2010: | |||||||||||||
| Amortized Cost |
Gross Unrealized Gains |
Gross Unrealized Losses |
Fair
Market Value | ||||||||||
| Cash and cash equivalents |
$ | 104,416 | $ | — | $ | — | $ | 104,416 | |||||
| Government securities |
531,560 | 903 | (2 | ) | 532,461 | ||||||||
| Total |
$ | 635,976 | $ | 903 | $ | (2 | ) | $ | 636,877 | ||||
| July 31, 2009: | |||||||||||||
| Amortized Cost |
Gross Unrealized Gains |
Gross Unrealized Losses |
Fair
Market Value | ||||||||||
| Cash and cash equivalents |
$ | 347,696 | $ | — | $ | — | $ | 347,696 | |||||
| Government securities |
577,398 | 1,767 | (53 | ) | 579,112 | ||||||||
| Total |
$ | 925,094 | $ | 1,767 | $ | (53 | ) | $ | 926,808 | ||||
At July 31, 2010, contractual maturities of the Company’s investment securities were as follows (in thousands):
| Amortized Cost |
Fair
Market Value | |||||
| Less than one year |
$ | 450,145 | $ | 450,722 | ||
| Due in one to three years |
81,415 | 81,739 | ||||
| Total |
$ | 531,560 | $ | 532,461 | ||
The following tables provide the breakdown of the investments with unrealized losses at July 31, 2010 and 2009 (in thousands):
| July 31, 2010 | ||||||||||||||||||||
| Less than 12 Months | 12 Months or Greater | Total | ||||||||||||||||||
| Fair Market Value |
Gross Unrealized Losses |
Fair Market Value |
Gross Unrealized Losses |
Fair Market Value |
Gross Unrealized Losses |
|||||||||||||||
| Government securities |
$ | 15,591 | $ | (2 | ) | $ | — | $ | — | $ | 15,591 | $ | (2 | ) | ||||||
| Total |
$ | 15,591 | $ | (2 | ) | $ | — | $ | — | $ | 15,591 | $ | (2 | ) | ||||||
| July 31, 2009 | ||||||||||||||||||||
| Less than 12 Months | 12 Months or Greater | Total | ||||||||||||||||||
| Fair Market Value |
Gross Unrealized Losses |
Fair Market Value |
Gross Unrealized Losses |
Fair Market Value |
Gross Unrealized Losses |
|||||||||||||||
| Government securities |
$ | 91,457 | $ | (53 | ) | $ | — | $ | — | $ | 91,457 | $ | (53 | ) | ||||||
| Total |
$ | 91,457 | $ | (53 | ) | $ | — | $ | — | $ | 91,457 | $ | (53 | ) | ||||||
Inventories
Inventories are stated at the lower of cost (first-in, first-out basis) or market (net realizable value).
54
Table of Contents
Revenue Recognition
For arrangements where software is more than incidental to the functionality of the product, the Company recognizes revenue when all of the following criteria are met: the Company has persuasive evidence of an arrangement with a customer; the Company delivers the products; the fee is fixed or determinable; and collection is probable. Evidence of an arrangement generally consists of sales contracts or agreements and customer purchase orders. Product delivery occurs when title and risk of loss are transferred to the customer. If uncertainties exist regarding customer acceptance, the Company recognizes revenue when all uncertainties are resolved. The Company assesses whether the sales price is fixed or determinable based on payment terms and whether the sales price is subject to refund or adjustment. Collectability is assessed based on the creditworthiness of the customer as determined by credit checks and the customer’s payment history to the Company.
For arrangements which include the delivery of multiple elements, revenue is allocated for all elements based on vendor-specific objective evidence, or VSOE, of fair value. VSOE is generally the price charged when that element is sold separately or the price is established by management having the relevant authority.
In situations where VSOE exists for all elements (delivered and undelivered), the Company allocates the total revenue to be earned under the arrangement among the various elements, based on their relative fair value. For transactions where VSOE exists only for the undelivered elements, the Company uses the residual method and defers the full fair value of the undelivered elements and recognizes the difference between the total arrangement fee and the amount deferred as revenue. If VSOE does not exist for undelivered items that are services, then the entire arrangement fee is recognized ratably over the remaining service period. If VSOE does not exist for undelivered elements that are specified products or features, all revenue is deferred until the earlier of the delivery of all elements or the point at which VSOE for the undelivered elements is determined.
Revenue from installation or other services is recognized as work is performed or ratably over the service period.
For arrangements in which the software component was incidental to the functionality of the product, the Company recognizes revenue when it is realized or realizable and earned. We consider revenue to be realized or realizable and earned when all of the following criteria are met: persuasive evidence of an arrangement exists; delivery has occurred or services have been rendered; the price to the buyer is fixed or determinable; and collectability is reasonably assured. In instances where final acceptance of the product, system, or solution is specified by the customer, revenue is deferred until all acceptance criteria have been met.
When an arrangement in which the software component was incidental to the functionality of the product and that involved multiple elements, the entire fee from the arrangement was allocated to each respective element based on its relative fair value and recognized when revenue recognition criteria for each element was met. Fair value for each element was established based on the sales price charged when the same element was sold separately. If fair value did not exist for any undelivered element, revenue was not recognized until the earlier of (i) the delivery of the undelivered element or (ii) fair value of the undelivered element existed, unless the undelivered element was a service, in which case revenue was recognized as the service was performed once the service was the only undelivered element.
As discussed in the Recent Accounting Pronouncements section, the accounting for the Company’s revenue arrangement will change in fiscal year 2011 with the adoption of the new guidance.
Share-Based Compensation
We account for share-based compensation expense for all share-based payment awards made to employees and directors based on estimated fair values. We have estimated the fair value of share-based options on the date of grant using the Black Scholes pricing model, which is affected by our stock price as well as assumptions regarding a number of complex and subjective variables. These variables include our expected stock price
55
Table of Contents
volatility over the term of the awards, actual and projected employee option exercise behaviors, risk free interest rate and expected dividends. We are also required to estimate forfeitures at the time of grant and revise those estimates in subsequent periods if actual forfeitures differ from those estimates.
Goodwill
Goodwill is the amount by which the cost of acquired net assets exceeds the fair value of those net assets on the date of acquisition. The Company allocates goodwill to reporting units at the time of acquisition and bases that allocation on which reporting units will benefit from the acquired assets and liabilities. A reporting unit is defined as an operating segment or one level below an operating segment, referred to as a component. The Company had determined that it currently operates as a single reporting unit. The Company assesses goodwill for impairment on an annual basis on the last business day of June or more frequently when events and circumstances occur indicating that the recorded goodwill may be impaired. If the book value of its reporting unit exceeds its fair value, the implied fair value of goodwill is compared with the carrying amount of goodwill. If the carrying amount of goodwill exceeds the implied fair value, an impairment loss is recorded equal to that excess.
Intangible Assets
Intangible assets resulting from the acquisition of Eastern Research Inc. are accounted for using the purchase method of accounting and are estimated by management based on the fair value of assets acquired. These intangible assets include acquired technology, customer relationships and trademark. Intangible assets are amortized from one to ten years on a straight-line basis which represents the estimated periods of benefit.
Impairment of Long-Lived Assets
The Company evaluates the recoverability of its long-lived assets whenever events and changes in circumstances indicate that the carrying amount of an asset may not be fully recoverable. This periodic review may result in an adjustment of estimated depreciable lives or asset impairment. When indicators of impairment are present, the carrying values of the asset are evaluated in relation to its operating performance and future undiscounted cash flows of the underlying business. If the future undiscounted cash flows are less than the book value, impairment exists. The impairment is measured as the difference between the book value and the fair value of the underlying asset. Fair values are based on estimates of market prices and assumptions concerning the amount and timing of estimated future cash flows and assumed discount rates, reflecting varying degrees of perceived risk.
Property and Equipment
Property and equipment is stated at cost and depreciated over the estimated useful lives of the assets using the straight-line method, based upon the following asset lives:
| Computer and telecommunications equipment |
2 to 3 years | |
| Computer software |
3 years | |
| Furniture and office equipment |
5 years | |
| Leasehold improvements |
Shorter of lease term or useful life of asset |
The cost of significant additions and improvements is capitalized and depreciated while expenditures for maintenance and repairs are charged to expense as incurred. Costs related to internal use software are capitalized. Upon retirement or sale of an asset, the cost and related accumulated depreciation of the assets are removed from the accounts and any resulting gain or loss is reflected in the determination of net income or loss.
Research and Development and Software Development Costs
All research and development costs are expensed as incurred. Software development costs incurred prior to the establishment of technological feasibility are charged to expense. Technological feasibility is demonstrated
56
Table of Contents
by the completion of a working model. Software development costs incurred subsequent to the establishment of technological feasibility would be capitalized until the product is available for general release to customers and amortized based on the greater of (i) the ratio that current gross revenue for a product bears to the total of current and anticipated future gross revenue for that product or (ii) the straight-line method over the remaining estimated life of the product. To date, the period between achieving technological feasibility and the general availability of the related products has been short and software development costs qualifying for capitalization have not been material. Accordingly, the Company has not capitalized any software development costs.
Income Taxes
Income taxes are accounted for under the liability method. Under this method, deferred tax assets and liabilities are recorded based on temporary differences between the financial statement amounts and the tax bases of assets and liabilities measured using enacted tax rates in effect for the year in which the differences are expected to reverse. The Company periodically evaluates the realization of its net deferred tax assets and records a valuation allowance if, based on the weight of available evidence, it is more likely than not that some or all of the deferred tax assets will not be realized.
We account for uncertain tax positions in accordance with generally accepted accounting principles. These standards clarify the accounting for uncertainty in income taxes by prescribing the minimum recognition threshold a tax position must meet before being recognized in the Company’s financial statements. Generally, recognition is limited to situations where, based solely on the technical merits of the tax position, the Company has determined that the tax position is more likely than not to be sustained on audit.
Use of Estimates
The preparation of financial statements in conformity with accounting principles generally accepted in the United States of America requires management to make estimates and assumptions that affect the reported amounts of assets and liabilities at the dates of the financial statements and the reported amounts of revenue and expenses during the reporting period. Actual results could differ from these estimates.
Concentrations and Significant Customer Information
Financial instruments which potentially subject the Company to concentrations of credit risk consist principally of cash equivalents, investments and accounts receivable. The Company invests its excess cash primarily in deposits with commercial banks, high-quality corporate securities and U.S. government securities. For the year ended July 31, 2010, three customers accounted for 13%, 12% and 12% of the Company’s revenue. For the year ended July 31, 2009, two customers accounted for 19% and 12% of the Company’s revenue. For the year ended July 31, 2008, two customers accounted for 23% and 22% of the Company’s revenue. The Company generally does not require collateral for sales to customers, and the Company’s accounts receivable balance at any point in time typically consists of a relatively small number of customer account balances. At July 31, 2010 more than 59% of the Company’s accounts receivable balance was attributable to three customers. At July 31, 2009 more than 67% of the Company’s accounts receivable balance was attributable to five customers.
57
Table of Contents
Allowance for Doubtful Accounts
The Company evaluates its outstanding accounts receivable balances on an ongoing basis to determine whether an allowance for doubtful accounts should be recorded. In fiscal 2008, the Company recorded a $4.1 million write off of a previously reserved bad debt. Activity in the Company’s allowance for doubtful accounts is summarized as follows (in thousands):
| Year Ended July 31, | ||||||||||
| 2010 | 2009 | 2008 | ||||||||
| Beginning balance |
$ | 72 | $ | 72 | $ | 4,132 | ||||
| Write off |
— | — | (4,060 | ) | ||||||
| Ending balance |
$ | 72 | $ | 72 | $ | 72 | ||||
Other Comprehensive Income (Loss)
The Company reports comprehensive income (loss) in accordance with generally accepted accounting principles. For all periods presented, the unrealized gain or loss on investments is recorded as a component of stockholders’ equity, and was the primary difference between reported net income (loss) and total comprehensive income (loss).
Net Loss Per Share
Basic and diluted net loss per share is computed by dividing the net loss for the period by the weighted average number of common shares outstanding during the period less unvested restricted stock. The following table sets forth the computation of basic and diluted net loss per share (in thousands, except per share data):
| Year Ended July 31, | ||||||||||||
| 2010 | 2009 | 2008 | ||||||||||
| Net loss |
$ | (14,805 | ) | $ | (53,572 | ) | $ | (114 | ) | |||
| Denominator: |
||||||||||||
| Weighted-average shares of common stock outstanding |
28,432 | 28,393 | 28,297 | |||||||||
| Weighted-average shares subject to repurchase |
(10 | ) | (34 | ) | (49 | ) | ||||||
| Shares used in per-share calculation—basic |
28,422 | 28,359 | 28,248 | |||||||||
| Weighted-average shares of common stock outstanding |
28,422 | 28,359 | 28,248 | |||||||||
| Weighted common stock equivalents |
— | — | — | |||||||||
| Shares used in per-share calculation—diluted |
28,422 | 28,359 | 28,248 | |||||||||
| Net loss per share: |
||||||||||||
| Basic |
$ | (0.52 | ) | $ | (1.89 | ) | $ | (0.00 | ) | |||
| Diluted |
$ | (0.52 | ) | $ | (1.89 | ) | $ | (0.00 | ) | |||
All periods presented have been adjusted for the 1-for-10 reverse stock split.
Options to purchase 2.3 million, 2.1 million and 2.2 million shares of common stock have not been included in the computation of diluted net loss per share for the years ended July 31, 2010, 2009 and 2008 because their effect would have been antidilutive.
Segment Information
The Company has determined that it currently conducts its operations in one business segment. For the year ended July 31, 2010, the geographical distribution of revenue was as follows: United States—62%, Korea—13%,
58
Table of Contents
and all other countries—25%. For the year ended July 31, 2009, the geographical distribution of revenue was as follows: United States—65%, Netherlands—13%, and all other countries—22%. For the year ended July 31, 2008, the geographical distribution of revenue was as follows: United States—52%, South Africa—20%, Netherlands—11%, and all other countries—17%. Long-lived assets consisting of property and equipment are primarily located in the United States and China.
Recent Accounting Pronouncements
In December 2007, the FASB issued a new pronouncement on business combinations. This pronouncement replaces the old business combination pronouncement and provides greater consistency in the accounting and financial reporting of business combinations. The pronouncement requires the acquiring entity in a business combination to recognize all assets acquired and liabilities assumed in the transaction at fair value, establishes the acquisition-date fair value as the measurement objective for all assets acquired and liabilities assumed, establishes principles and requirements for how an acquirer recognizes and measures any non-controlling interest in the acquiree and the goodwill acquired, and requires the acquirer to disclose the nature and financial effect of the business combination. Among other changes, this statement also requires that “negative goodwill” be recognized in earnings as a gain attributable to the acquisition without first reducing other acquired assets, that acquisition-related costs are to be recognized separately from the acquisition and expensed as incurred and that any deferred tax benefits resulting from a business combination are to be recognized in income from continuing operations in the period of the combination. This pronouncement is effective for business combinations for which the acquisition date is on or after the beginning of the first annual reporting period beginning on or after December 15, 2008 and as a result, the Company adopted the pronouncement in the first quarter of fiscal 2010 and it did not have a material impact on our consolidated financial statements.
In April 2009, the FASB issued new guidance on accounting for assets acquired and liabilities assumed in a business combination that arise from contingencies. This new guidance amends the prior guidance for the initial recognition and measurement, subsequent measurement and accounting, and disclosures for assets and liabilities arising from contingencies in business combinations. The new guidance eliminates the distinction between contractual and non-contractual contingencies. The new guidance is effective for contingent assets and contingent liabilities acquired in business combinations for which the acquisition date is on or after the beginning of the first annual reporting period beginning on or after December 15, 2008 and as a result, the Company adopted the new guidance in the first quarter of fiscal 2010 and it did not have a material impact on our consolidated financial statements.
In February 2008, the FASB issued new guidance that delays fair value accounting for all nonfinancial assets and nonfinancial liabilities, except those that are recognized or disclosed at fair value in the financial statements on at least an annual basis until 2009. The Company adopted fair value accounting beginning August 1, 2008 and deferred the application of fair value accounting for nonfinancial assets and liabilities until August 1, 2009. The Company adopted fair value accounting for nonfinancial assets and liabilities in the first quarter of fiscal 2010 and it did not have a material impact on our consolidated financial statements.
In September 2009, the Emerging Issues Task Force issued new guidance pertaining to the accounting for revenue arrangements with multiple deliverables. The new guidance addresses how to determine whether an arrangement involving multiple deliverables contains more than one unit of accounting, and how the arrangement consideration should be allocated among the separate units of accounting. The new guidance is effective for fiscal years beginning after June 15, 2010 and may be applied retrospectively or prospectively for new or materially modified arrangements. In addition, early adoption is permitted. The new guidance is applicable to the Company and will be effective beginning August 1, 2010. The Company has evaluated this new guidance and believes it will not have a material impact on our consolidated financial statements.
In September 2009, the Emerging Issues Task Force issued new guidance that changes the accounting model for revenue arrangements that include both tangible products and software elements that are “essential to the functionality” and removes these products from the scope of current software revenue guidance. The new
59
Table of Contents
guidance shall be applied on a prospective basis for revenue arrangements entered into or materially modified in fiscal years beginning on or after June 15, 2010. Earlier application is permitted as of the beginning of a company’s fiscal year provided the company has not previously issued financial statements for any period within that year. An entity shall not elect early application of this guidance unless it also elects early application of the new rule pertaining to accounting for revenue arrangements with multiple deliverables. The new guidance is applicable to the Company and will be effective beginning August 1, 2010. The Company has evaluated this new guidance and believes it will not have a material impact on our consolidated financial statements.
In January 2010, the FASB issued new guidance on the disclosures of fair value measurements. This new guidance amends the authoritative guidance for fair value measurements and disclosures by adding new disclosure requirements with respect to transfers in and out of Levels 1 and 2 fair value measurements, as well as by requiring gross basis disclosures for purchases, sales, issuances, and settlements included in the reconciliation of Level 3 fair value measurements. This new guidance also amends the authoritative guidance by providing clarifications to existing disclosure requirements. The new disclosures and clarifications of existing disclosures are effective for interim and annual reporting periods beginning after December 15, 2009, except for the disclosures about purchases, sales, issuances, and settlements in the roll forward of activity in Level 3 fair value measurements which are effective for fiscal years beginning after December 15, 2010 and for interim periods within those fiscal years. Early adoption is permitted. We adopted this new guidance, including the guidance related to the disclosures about purchases, sales, issuances, and settlements in the roll forwards of activity in Level 3 fair value measurements, beginning in the third quarter of 2010 fiscal year. The adoption of this guidance did not have a material impact on our financial position or results of operations.
3. Inventories
Inventories consisted of the following at July 31, 2010 and 2009 (in thousands):
| 2010 | 2009 | |||||
| Raw materials |
$ | 4,939 | $ | 6,755 | ||
| Work in process |
833 | 500 | ||||
| Finished goods |
5,403 | 8,803 | ||||
| Total |
$ | 11,175 | $ | 16,058 | ||
4. Property and Equipment
Property and equipment consisted of the following at July 31, 2010 and 2009 (in thousands):
| 2010 | 2009 | |||||||
| Computer software and equipment |
$ | 66,939 | $ | 70,088 | ||||
| Land |
3,000 | 3,000 | ||||||
| Furniture and office equipment |
2,187 | 2,198 | ||||||
| Leasehold improvements |
5,983 | 7,852 | ||||||
| 78,109 | 83,138 | |||||||
| Less accumulated depreciation |
(71,540 | ) | (69,796 | ) | ||||
| Total |
$ | 6,569 | $ | 13,342 | ||||
Depreciation expense was $6.1 million, $10.4 million and $9.1 million for the years ended July 31, 2010, 2009 and 2008, respectively.
The Company owns approximately 102 acres of land in Tyngsborough, Massachusetts.
60
Table of Contents
The Company is required to test certain long-lived assets when indicators of impairment are present. In conjunction with the workforce reduction and early lease termination plans initiated during the past year the Company recorded an asset impairment charge of $1.1 million in fiscal 2010 related to certain fixed assets. These fixed assets were no longer being utilized by the Company.
During the fourth quarter of fiscal 2009, the Company updated its estimates of future demand for its core and access products. The revised outlook resulted in a projection of lower discounted cash flows. The Company concluded an assessment for impairment should be conducted for its long-lived assets in the fourth quarter of fiscal 2009. The Company determined that the carrying value of certain fixed assets exceeded their fair value. As a result, the Company recorded an impairment charge of $1.1 million in the fourth quarter of fiscal 2009 to write down certain fixed assets to their estimated fair value.
5. Goodwill and Intangible Assets
As a result of its acquisition of Eastern Research, Inc. in fiscal year 2007, the Company recorded goodwill in the amount of $20.3 million. This amount represented the remaining excess of the total purchase price of the Eastern Research acquisition over the fair value of the net assets acquired. The Company subsequently tested goodwill for impairment on an annual basis, which we have determined to be the last business day of our fiscal month June each year. The Company also tests goodwill between annual tests if an event occurs or circumstances change that indicate that the fair value of the reporting unit may be below its carrying value. The Company also reviews other long-lived assets, including purchased intangibles, for impairment whenever events or changes in circumstances indicate that the carrying amount of the assets or asset group may not be recoverable.
Goodwill impairment is determined using a two-step process. The first step involves a comparison of the estimated fair value of a reporting unit to its carrying amount, including goodwill. In performing the first step, the Company determines the fair value of a reporting unit using a discounted cash flow (“DCF”) analysis. Determining fair value requires the exercise of significant judgment, including judgments about appropriate discount rates, perpetual growth rates, and the amount and timing of expected future cash flows. Discount rates are based on a weighted average cost of capital (“WACC”), which represents the average rate a business must pay its providers of debt and equity. The WACC used to test goodwill is derived from a group of comparable companies. The cash flows employed in the DCF analysis are derived from internal earnings and forecasts and external market forecasts. If the estimated fair value of the reporting unit exceeds its carrying amount, goodwill of the reporting unit is not impaired and the second step of the impairment test is not necessary. If the carrying amount of the reporting unit exceeds its estimated fair value, then the second step of the goodwill impairment test must be performed. The second step of the goodwill impairment test compares the implied fair value of the reporting unit’s goodwill with its carrying amount of goodwill to measure the amount of impairment loss, if any. The implied fair value of goodwill is determined in the same manner as the amount of goodwill recognized in a business combination, whereby the estimated fair value of the reporting unit is allocated to all of the assets and liabilities of that unit (including any unrecognized intangible assets) as if the reporting unit had been acquired in a business combination and the fair value of the reporting unit was the purchase price paid. If the carrying amount of the reporting unit’s goodwill exceeds the implied fair value of that goodwill, an impairment loss is recognized in an amount equal to that excess.
During the fourth quarter of fiscal 2009, and in connection with the preparation of its revised plan for fiscal 2010 and its outlook beyond, the Company updated its estimates of future demand for its core and access products. The revised outlook resulted in a projection of lower discounted cash flows. Accordingly, the Company determined that for its single reporting unit the carrying amount of its net assets exceeded its fair value, indicating that a potential impairment existed. After completing the second step of the goodwill impairment test, the Company recorded a goodwill impairment charge during the fourth quarter of 2009 of $20.3 million.
61
Table of Contents
The changes in the carrying amount of goodwill during the year ended July 31, 2009 were as follows:
| 2009 | |||
| Beginning balance |
20,334 | ||
| Goodwill impairment |
20,334 | ||
| Adjustments to previously recorded goodwill |
— | ||
| Ending balance |
$ | 0 | |
There was no impairment of goodwill in fiscal 2008.
Intangible Assets
The Company is required to test certain long-lived assets when indicators of impairment are present. Long-lived assets are grouped with other assets and liabilities at the lowest level for which identifiable cash flows are largely independent of the cash flows of other assets and liabilities. During the fourth quarter of fiscal 2009, the Company updated its estimates of future demand for its core and access products. The revised outlook resulted in a projection of lower discounted cash flows. The Company concluded an assessment for impairment should be conducted for its intangible assets in the fourth quarter of fiscal 2009. The Company tested the long-lived assets in question for recoverability by comparing the sum of the undiscounted cash flows attributable to each respective asset group to their carrying amounts, and determined that the carrying amounts were not recoverable. Management then evaluated the fair values of each long-lived asset of the potentially impaired long-lived asset group to determine the amount of the impairment, if any. The fair value of each intangible asset was based primarily on an income approach, which is a present value technique used to measure the fair value of future cash flows produced by the asset. The Company estimated future cash flows over the remaining useful life of each intangible asset. As a result of this analysis, the Company determined that its intangible assets related to completed technology and customer relationships had carrying values that exceeded their estimated fair values. As a result, an intangible asset impairment charge of $2.8 million was recorded in the fourth quarter of fiscal 2009.
During the fourth quarter of fiscal 2008, the Company incurred an intangible asset impairment charge of $4.4 million related to previously acquired DNX technology and customer relationships. The impairment charge was primarily related to lower than previously estimated revenues from our DNX products.
Components of the Company’s acquired intangible assets as of July 31, 2009 are comprised of the following:
| July 31, 2009 | ||||||||||||||
| Gross | Impairment Charges |
Accumulated Amortization |
Net | |||||||||||
| Trademarks |
$ | 400 | $ | — | $ | (400 | ) | $ | — | |||||
| Customer relationships |
4,522 | (1,619 | ) | (2,903 | ) | — | ||||||||
| Technology |
5,032 | (1,197 | ) | (3,835 | ) | — | ||||||||
| Total |
$ | 9,954 | $ | (2,816 | ) | $ | (7,138 | ) | $ | — | ||||
Amortization expense of purchased intangible assets was $1.2 million and $3.0 million for the years ended July 31, 2009 and 2008.
62
Table of Contents
6. Commitments
Operating Leases
Rent expense under operating leases was $2.0 million, $2.3 million and $2.6 million for the years ended July 31, 2010, 2009 and 2008, respectively. At July 31, 2010, future minimum lease payments under all non-cancelable operating leases are as follows (in thousands):
| 2011 |
$ | 1,770 | |
| 2012 |
1,434 | ||
| 2013 |
— | ||
| 2014 |
— | ||
| Thereafter |
— | ||
| Total future minimum lease payments |
$ | 3,204 | |
There is also $5.0 million in inventory and other purchase commitments which apply to fiscal year 2011.
7. Income Taxes
The following table presents the components of our provision (benefit) for income taxes (in thousands):
| July 31, | |||||||||||
| 2010 | 2009 | 2008 | |||||||||
| Current: |
|||||||||||
| Federal |
$ | (611 | ) | $ | (145 | ) | $ | 176 | |||
| State |
14 | (2 | ) | 67 | |||||||
| Foreign |
289 | 334 | 185 | ||||||||
| (308 | ) | 187 | 428 | ||||||||
| Deferred: |
|||||||||||
| Federal |
— | (296 | ) | 155 | |||||||
| State |
— | (28 | ) | 14 | |||||||
| Foreign |
(58 | ) | (95 | ) | — | ||||||
| (58 | ) | (419 | ) | 169 | |||||||
| Total tax provision (benefit) |
$ | (366 | ) | $ | (232 | ) | $ | 597 | |||
A reconciliation between the statutory federal income tax rate and the Company’s effective tax follows (in thousands):
| July 31, | ||||||||||||
| 2010 | 2009 | 2008 | ||||||||||
| Statutory federal income tax (benefit) |
$ | (5,310 | ) | $ | (18,830 | ) | $ | 169 | ||||
| State taxes, net of federal benefit |
(485 | ) | (1,172 | ) | 73 | |||||||
| Research and development credits |
(281 | ) | (155 | ) | (216 | ) | ||||||
| Valuation allowance |
6,101 | 13,224 | 239 | |||||||||
| Non-deductible goodwill impairment |
— | 6,513 | — | |||||||||
| Federal tax refund |
(831 | ) | — | — | ||||||||
| Other |
440 | 188 | 332 | |||||||||
| Tax expense (benefit) |
$ | (366 | ) | $ | (232 | ) | $ | 597 | ||||
63
Table of Contents
The components of the Company’s net deferred tax assets at July 31, 2010 and 2009 are as follows (in thousands):
| 2010 | 2009 | |||||||
| Deferred tax assets: |
||||||||
| Net operating loss |
$ | 280,357 | $ | 272,769 | ||||
| Credit carryforwards |
22,060 | 22,604 | ||||||
| Restructuring and related accruals |
4,492 | 5,340 | ||||||
| Accrued expenses |
1,012 | 1,740 | ||||||
| Share based compensation expense |
6,917 | 37,065 | ||||||
| Capital loss |
1,778 | 2,163 | ||||||
| Depreciation |
6,114 | 5,556 | ||||||
| Other, net |
6,429 | 6,488 | ||||||
| Total net deferred tax assets |
329,159 | 353,725 | ||||||
| Valuation allowance |
(329,005 | ) | (353,630 | ) | ||||
| Net deferred tax assets |
$ | 154 | $ | 95 | ||||
Substantially all of the income (loss) before income taxes as shown in the Consolidated Statement of Operations for the years ended July 31, 2010, 2009 and 2008 is derived in the United States. Certain foreign wholly owned subsidiary companies are compensated on a cost plus basis resulting in the recognition of foreign taxable income and tax expense.
During the years ended July 31, 2010, 2009 and 2008 the Company did not record a current tax benefit for the net operating losses due to the Company’s substantial losses.
At July 31, 2010, the Company had federal and state net operating loss (“NOL”) carryforwards of approximately $784.9 million and $231.0 million, respectively. The federal and state net operating loss carryforwards will expire at various dates through 2030. The Company also has federal and state research and development credit carryforwards of approximately $11.2 million and $10.6 million, respectively, which begin to expire in 2020 and 2014, respectively.
The occurrence of ownership changes, as defined in Section 382 of the Internal Revenue Code, as amended, is not controlled by the Company, and could significantly limit the amount of net operating loss carryforwards and research and development credits that can be utilized annually to offset future taxable income.
The Company has evaluated the positive and negative evidence bearing upon the realization of its deferred tax assets and has established a valuation allowance of approximately $329.0 million and $353.6 million as of July 31, 2010 and July 31, 2009, respectively, for such assets, which are comprised principally of net operating loss carryforwards, research and development credits and stock based compensation. The Company recorded a decrease to the valuation allowance of $24.6 million for the year ended July 31, 2010 and an increase of $12.2 million for the years ended July 31, 2009, which offset the change in the net deferred tax assets. The decrease in the valuation allowance for the year ended July 31, 2010 was primarily related to a reduction in the stock based compensation deferred tax asset. The increase in the valuation allowances for the year ended July 31, 2009 was the result of significant realized net operating losses, increased non deductible reserves and tax credits balances.
As a result of the fiscal year 2007 acquisition of Eastern Research, the Company had recorded a valuation allowance in excess of its net deferred tax assets. The excess was computed based on the difference between the book and tax basis of indefinite lived intangible assets that was not expected to reverse during the net operating loss carryforward period. For the fiscal year ended July 31, 2009, the Company wrote off its indefinite lived intangibles resulting in a $0.3 million deferred tax benefit from the reversal of the accumulated deferred tax liability.
64
Table of Contents
Included in the net operating loss carryforwards are stock option deductions of approximately $125.0 million. The benefits of these stock option deductions approximate $47.8 million and will be credited to additional paid-in capital when realized or recognized. As of July 31, 2010, the Company had net operating loss carryforwards of approximately $6.1 million related to the exercise of stock options subsequent to the adoption of fair value accounting. This amount represents the excess benefit and has not been included in the gross deferred tax asset reflected for net operating losses. The benefit of approximately $2.3 million will be credited to additional paid-in capital when the Company recognizes a cash savings.
As of July 31, 2010, the total amount of unrecognized tax benefits is $1.6 million. If recognized, the entire amount would impact the Company’s effective tax rate.
A reconciliation of the beginning and ending amount of gross unrecognized tax benefits is as follows (in thousands):
| 2010 | 2009 | 2008 | |||||||
| Beginning balance |
$ | 1,349 | $ | 1,191 | $ | 928 | |||
| Increase for prior years |
— | — | — | ||||||
| Increase for current year |
219 | 158 | 263 | ||||||
| Reductions related to settlement with tax authorities |
— | — | — | ||||||
| Reductions related to expiration of statute of limitations |
— | — | — | ||||||
| Ending balance |
$ | 1,568 | $ | 1,349 | $ | 1,191 | |||
As of July 31, 2010, the total amount of accrued interest and penalties is $0.4 million. As of July 31, 2009, the Company had accrued $0.3 million of interest and penalties related to uncertain tax positions. The Company accounts for interest and penalties related to uncertain tax positions as part of its provision for federal, international, and state income taxes. During fiscal 2011 it is reasonably possible that we may recognize between $0.0 million and $0.2 million of previously unrecognized tax benefits related to various foreign tax positions.
8. Stockholders’ Equity
Preferred Stock
The Company’s Board of Directors (the “Board”) has the authority to issue up to 5,000,000 shares of preferred stock without stockholder approval in one or more series and to fix the rights, preferences, privileges and restrictions of ownership. No shares of preferred stock were outstanding at July 31, 2010 or July 31, 2009.
Common Stock
The Company is authorized to issue up to 250,000,000 shares of its common stock. The holders of the common stock are entitled to one vote for each share held. The Board may declare dividends from legally available funds, subject to any preferential dividend rights of any outstanding preferred stock and restrictions under the Company’s loan agreements, if any. Holders of the common stock are entitled to receive all assets available for distribution on the dissolution or liquidation of the Company, subject to any preferential rights of any outstanding preferred stock.
65
Table of Contents
9. Share-Based Compensation
The following table presents share-based compensation expense included in the Company’s consolidated statements of operations for the years ended July 31, 2010, 2009 and 2008 (in thousands):
| July 31, | ||||||||||
| 2010 | 2009 | 2008 | ||||||||
| Cost of product revenue |
$ | 237 | $ | 300 | $ | 346 | ||||
| Cost of service revenue |
272 | 294 | 279 | |||||||
| Research and development |
1,092 | 2,007 | 1,767 | |||||||
| Sales and marketing |
924 | 1,183 | 1,124 | |||||||
| General and administrative |
765 | 902 | 975 | |||||||
| Share-based compensation expense before tax |
3,290 | 4,686 | 4,491 | |||||||
| Income tax benefit |
— | — | (148 | ) | ||||||
| Net compensation expense |
$ | 3,290 | $ | 4,686 | $ | 4,343 | ||||
The Company estimates the fair value of stock options using the Black-Scholes valuation model. Key input assumptions used to estimate the fair value of stock options include the exercise price of the award, the expected option term, the expected volatility of the Company’s stock over the option’s expected term, the risk-free interest rate over the option’s expected term, and the Company’s expected annual dividend yield. The Company believes that the valuation technique and the approach utilized to develop the underlying assumptions are appropriate in calculating the fair values of the Company’s stock options granted in fiscal 2010, 2009 and 2008. Estimates of fair value are not intended to predict actual future events or the value ultimately realized by persons who receive equity awards.
The fair value of each option grant was estimated on the grant date using the Black-Scholes option-pricing model with the following assumptions:
| July 31, | |||||||||
| 2010 | 2009 | 2008 | |||||||
| Expected option term (1) |
5.2 years | 5.9 years | 5.9 years | ||||||
| Expected volatility factor (2) |
39.2 | % | 43.1 | % | 46.0 | % | |||
| Risk-free interest rate (3) |
2.2 | % | 2.2 | % | 3.8 | % | |||
| Expected annual dividend yield |
0.0 | % | 0.0 | % | 0.0 | % | |||
| (1) | The expected option term for the first quarter of fiscal 2008 were determined using the simplified method for estimating expected option life, which qualify as “plain-vanilla” options. |
| (2) | The stock volatility for each grant is measured using the weighted average of historical daily price changes of the Company’s common stock over the most recent period equal to the expected option life of the grant, adjusted for activity which is not expected to occur in the future. |
| (3) | The risk-free interest rate for periods equal to the expected term of the share option is based on the U.S. Treasury yield curve in effect at the time of grant. |
Stock Incentive Plans
The Company has outstanding equity awards issued under several equity plans, including legacy equity plans and equity plans assumed as result of previous acquisitions, including the 1999 Stock Incentive Plan (the “1999 Plan”), the Eastern Research, Inc. Stock Option Plan, and the 1999 Non-employee Director Stock Option Plan (the “1999 Director Plan”). Each of these equity incentive plans remains in effect and has awards outstanding. New equity awards are issued under the Company’s 2009 Stock Incentive Plan (the “2009 Plan”) and the Company’s 2009 Non-employee Director Stock Option Plan (the “2009 Director Plan”).
66
Table of Contents
2009 Stock Incentive Plan
The 2009 Plan was approved by the Company’s Board on November 10, 2008 and became effective upon the approval of the Company’s stockholders on January 6, 2009. The 2009 plan has a ten year term. The 2009 Plan reserves 2,800,000 shares of common stock for issuance of awards, subject to increase by the number of shares granted under the Company’s 1998 and 1999 Plans that are not exercised or are forfeited, lapse or expire to the extent such shares would otherwise again have been available for issuance under such plans. In addition, any shares subject to an award granted under the 2009 Plan that are not exercised or are forfeited, lapse or expire also will be available for future grants of awards under the 2009 Plan. The number of shares available for issuance under the 2009 Plan is subject to adjustment in the event of a merger, stock split, stock dividend, and certain other changes in capitalization.
The 2009 Plan authorizes grants of awards including incentive stock options, nonqualified stock options, restricted stock, restricted stock units, performance awards and other awards to officers, directors, employees and consultants of the Company. Subject to certain restrictions, the Compensation Committee of the Board has broad discretion to: (i) interpret and construe the relevant provisions of the 2009 Plan; (ii) to determine which individuals are eligible to receive awards under the Plan; and (iii) to determine the terms and conditions for awards under the Plan, including the number of shares, vesting conditions and any required service criteria. Under the 2009 Plan, stock options may not be granted with an exercise price less than the fair market value of the underlying shares of commons stock on the date of grant. Option awards have a maximum term of ten years and generally vest over a three to five year period. Certain change in control transactions may cause awards granted under the 2009 Plan to vest at an accelerated rate unless the awards are assumed or substituted for in connection with the transaction. As of July 31, 2010 a total of 2,975,324 shares were available for grant under the 2009 Plan.
2009 Non-employee Director Stock Option Plan
On January 6, 2009, the Company’s stockholders also approved the Company’s 2009 Director Plan, which is a formula plan to provide stock options to the Company’s non-employee directors. Each non-employee director, upon initial appointment as a director, is granted an option to purchase 9,000 shares of common stock which vests over three years and, immediately following each annual meeting of stockholders, is automatically granted an option to purchase 3,000 shares of common stock which vests on the earlier of the next annual meeting of stockholders or one year. These stock options are the only awards that may be granted to non-employee directors under the 2009 Director Plan.
The 2009 Director Plan reserves 120,000 shares of common stock for issuance of awards, subject to increase by the number of shares granted under the Company’s 1999 Director Plan that are not exercised, expire or otherwise terminate to the extent such shares would otherwise again be available for issuance under the 1999 Director Plan. In addition, shares subject to an option granted under the 2009 Director Plan that are not exercised, expire or otherwise terminate without delivery of any common stock subject thereto also will be available for future grants of stock options under the 2009 Director Plan. Our Compensation Committee of the Board administers the 2009 Director Plan and, subject to certain restrictions contained in the Plan, has the power to construe it and to adopt rules and regulations for the administration of the Plan. Stock options under the 2009 Director Plan have a maximum ten year term and may not be granted with an exercise price less than the fair market value of the underlying shares of common stock on the date of grant. Certain change in control transactions will cause awards granted under the 2009 Plan to vest at an accelerated rate unless the awards are assumed or substituted for in connection with the transaction. At July 31, 2010, 81,777 shares were available for grant under the 2009 Director Plan.
67
Table of Contents
Stock Option Activity
Stock option activity under all of the Company’s stock plans during the year ended July 31, 2010 is summarized as follows:
| Number of Shares |
Weighted Average Exercise Price |
Weighted Average Contractual Term (Years) | ||||||
| Outstanding at July 31, 2009 |
2,765,243 | $ | 42.34 | 4.0 | ||||
| Options granted |
33,282 | 20.09 | ||||||
| Options exercised |
(22,523 | ) | 22.34 | |||||
| Options canceled |
(780,778 | ) | 65.43 | |||||
| Outstanding at July 31, 2010 |
1,995,224 | $ | 33.16 | 4.12 | ||||
| Options vested and expected to vest |
1,982,504 | $ | 33.23 | 4.10 | ||||
| Options exercisable at end of period |
1,741,893 | $ | 34.46 | 3.63 | ||||
In accordance with the provisions of the Company’s stock plans, an equitable adjustment was made to all outstanding option awards to give effect to the December 15, 2009 cash distribution to its common stockholders. Accordingly, no stock compensation charge was recorded in connection with the adjustment. On December 21, 2009, the Company effected a 1-for-10 reverse stock split of its common stock whereby every ten shares of its issued and outstanding common stock at the effective time were combined into one share of common stock. The stock option table has been adjusted to reflect both the equitable adjustment and the 1-for-10 reverse stock split.
The weighted average fair value of stock options granted on dates of grant was $12.91, $12.50 and $18.00 during fiscal years 2010, 2009 and 2008, respectively.
The intrinsic value of stock options exercised, calculated as the difference between the market value of the shares on the exercise date and the exercise price of the option, was $0.2 million, $0.7 million and $2.8 million for fiscal years 2010, 2009 and 2008, respectively.
The total cash received from employees as a result of employee stock option exercises during fiscal years 2010, 2009 and 2008 was $0.2 million, $0.6 million and $10.9 million, respectively.
As of July 31, 2010, there was $2.4 million of total unrecognized compensation cost related to nonvested, share-based compensation arrangements granted under the Company’s stock plans. That cost is expected to be recognized over a weighted-average period of 2 years.
Restricted Stock
Restricted stock may be issued to employees, officers, directors and consultants of the Company. The vesting period is generally three to five years. The Company issued 66 thousand shares of restricted stock during the year ended July 31, 2008, and no restricted stock during the years ended July 31, 2010 and 2009.
68
Table of Contents
The following table summarizes the status of the Company’s nonvested restricted shares since July 31, 2009:
| Number of Shares |
Weighted Average Fair Value | |||||
| Nonvested at July 31, 2009 |
25,544 | $ | 37.10 | |||
| Granted |
— | — | ||||
| Vested |
(15,181 | ) | 37.06 | |||
| Forfeited |
(6,394 | ) | 37.00 | |||
| Nonvested at July 31, 2010 |
3,969 | $ | 37.44 | |||
The restricted stock table has been adjusted to reflect the 1-for-10 reverse stock split.
The total fair value of shares vested during fiscal 2010, 2009 and 2008 was approximately $562 thousand, $760 thousand and $553 thousand, respectively.
Treasury Stock
Treasury stock relates to the repurchase upon employee terminations of unvested shares of restricted stock and options exercised prior to vesting. The shares of treasury stock held are either retired or reissued upon the exercise of options or the issuance of other share-based equity awards. At July 31, 2010 the Company held no shares of treasury stock and also repurchased 6,394 shares and retired 6,394 shares of treasury stock at its acquisition cost of $0.
10. Employee Benefit Plan
The Company sponsors a defined contribution plan covering substantially all of its domestic employees which is designed to be qualified under Section 401(k) of the Internal Revenue Code. Eligible employees are permitted to contribute to the 401(k) plan through payroll deductions within statutory and plan limits. Company matching contributions of $0.1 million, $0.7 million and $0.8 million were made to the plan during fiscal 2010, 2009 and 2008, respectively. Effective January 2, 2010, the plan was amended to change the Company’s matching contribution to a discretionary matching contribution. No discretionary matching contribution has been made since the amendment.
11. Restructuring Charges
In conjunction with the workforce reduction and early lease termination plans initiated in fiscal 2009, certain additional actions were implemented in fiscal 2010. These actions were taken to further re-align our cost structure, pace our development more closely in line with customer requirements and to better position the Company for success in the longer-term. During fiscal 2010, the Company recorded a restructuring charge of $5.7 million, of which $5.6 million was charged to operating expense and $0.1 million to cost of product revenue. This charge relates to (i) employee separation packages including severance pay, benefits continuation and outplacement costs amounting to $3.2 million, of which $3.1 million was charged to operating expense and $0.1 million to cost of product revenue, (ii) a $1.9 million charge for a termination agreement related to our Moorestown, New Jersey facility, and (iii) a $0.6 million charge related to the consolidation of our Chelmsford, Massachusetts facility for rent associated with the portion of the facility that is no longer being used.
During fiscal 2009, the Company recorded restructuring charges of $4.0 million, of which $3.6 million was charged to operating expense and $0.4 million to cost of product revenue. The charges included workforce reductions primarily in sales, marketing, manufacturing and general administrative functions during the first and second quarters of fiscal 2009 totaling $1.1 million ($0.8 million operating expense and $0.3 million cost of
69
Table of Contents
product revenue). In the fourth quarter of fiscal 2009, the Company announced further workforce reductions. Certain of those workforce reductions, primarily affecting research and development, were completed during the fourth quarter of fiscal 2009 resulting in a charge of $2.3 million. The charge for workforce reductions primarily related to employee separation packages, which include severance pay, benefits continuation and outplacement costs. In addition, the Company revised its estimate of rent and other facility costs associated with the consolidation of its New Jersey facility resulting in a charge of $0.6 million. The aggregate fourth quarter fiscal 2009 charge was $2.9 million ($2.8 million charged to operating expense and $0.1 million charged to cost of product revenue).
During the first quarter of 2008, we completed a consolidation of our Moorestown, New Jersey facility and recorded a restructuring charge of $2.0 million. This consolidation was in conjunction with the decision in the fourth quarter of fiscal 2008 to reduce our workforce across the Company. We completed these actions to better align development resources with future growth opportunities, further improve operational efficiencies, and capitalize on additional acquisition synergies. As a result of these actions, we recorded a restructuring charge related to rent and other facility charges related to our Moorestown facility. The charge in first quarter of fiscal 2008 also includes severance costs related to several employees affected by the fourth quarter fiscal 2007 workforce reduction who were placed on transition programs and whose employment was terminated in the first quarter of fiscal 2008. In the third quarter of fiscal 2008 we recorded an additional restructuring charge related to the consolidation of our Moorestown facility of $0.4 million. The charge was based on a revised lower estimate of future sublease income and a lease termination fee.
As of July 31, 2010, remaining future cash payments primarily associated with facility related actions approximated $0.5 million and consist primarily of lease payments to be made over the next two years. A rollforward of the restructuring accrual is summarized below (in thousands):
| Accrual Balance at July 31, 2008 |
Additions | Payments | Accrual Balance at July 31, 2009 |
|||||||||||||
| Workforce reduction |
$ | 23 | $ | 3,452 | $ | 1,628 | $ | 1,847 | ||||||||
| Facility consolidations and certain other costs |
658 | 532 | 528 | 662 | ||||||||||||
| Total |
$ | 681 | $ | 3,984 | $ | 2,156 | $ | 2,509 | ||||||||
| Accrual Balance at July 31, 2009 |
Additions | Adjustments | Payments | Accrual Balance at July 31, 2010 | ||||||||||||
| Workforce reduction |
$ | 1,847 | $ | 3,427 | $ | (187 | ) | $ | 5,087 | $ | — | |||||
| Facility consolidations and certain other costs |
662 | 2,468 | — | 2,632 | 498 | |||||||||||
| Total |
$ | 2,509 | $ | 5,895 | $ | (187 | ) | $ | 7,719 | $ | 498 | |||||
12. Fair Value Measurements
The fair value measurement rules establish a fair value hierarchy which requires an entity to maximize the use of observable inputs and minimize the use of unobservable inputs when measuring fair value. The standard describes three levels of inputs that may be used to measure fair value:
| Level 1 | Quoted prices in active markets for identical assets or liabilities as of the reporting date. Active markets are those in which transactions for the asset and liability occur in sufficient frequency and volume to provide pricing information on an ongoing basis. | |
| Level 2 | Observable inputs other than Level 1 prices, such as quoted prices for similar assets or liabilities; quoted prices in markets that are not active; or other inputs that are observable or can be corroborated by observable market data for substantially the full term of the assets or liabilities. |
70
Table of Contents
| Level 3 | Unobservable inputs that are supported by little or no market activity and that are significant to the fair value of the assets or liabilities. |
Assets and liabilities of the Company measured at fair value on a recurring basis as of July 31, 2010, are summarized as follows (in thousands):
| Description |
July 31, 2010 | Fair Value Measurements at Reporting Date Using | ||||||||||
| Quoted Prices in Active Markets for Identical Assets (Level 1) |
Significant Other Observable Inputs (Level 2) |
Significant
Unobservable Inputs (Level 3) | ||||||||||
| Assets |
||||||||||||
| Cash Equivalents |
$ | 104,416 | $ | 104,416 | $ | — | $ | — | ||||
| Government obligations |
532,461 | 532,461 | — | — | ||||||||
| Total Assets |
$ | 636,877 | $ | 636,877 | $ | — | $ | — | ||||
Cash Equivalents
Cash equivalents of $104.4 million consisting of money market funds and federal government and government agency obligations are classified within Level 1 of the fair value hierarchy because they are valued using quoted market prices in active markets.
Government obligations
Available-for-sale securities of $532.5 million consisting of federal government and government agency obligations are classified within Level 1 of the fair value hierarchy because they are valued using quoted market prices in active markets.
13. Commitments and Contingencies
Litigation
IPO Allocation Case
Beginning on July 2, 2001, several purported class action complaints were filed in the United States District Court for the Southern District of New York against the Company and several of its officers and directors (the “Individual Defendants”) and the underwriters for the Company’s initial public offering on October 21, 1999. Some of the complaints also include the underwriters for the Company’s follow-on offering on March 14, 2000. An amended complaint, which is the operative complaint, was filed on April 19, 2002 on behalf of persons who purchased the Company’s common stock between October 21, 1999 and December 6, 2000. The amended complaint alleges claims against the Company, several of the Individual Defendants and the underwriters for violations under Sections 11 and 15 of the Securities Act of 1933, as amended (the “Securities Act”), primarily based on the assertion that the Company’s lead underwriters, the Company and several of the Individual Defendants made material false and misleading statements in the Company’s Registration Statements and Prospectuses filed with the Securities and Exchange Commission, or the SEC, in October 1999 and March 2000 because of the failure to disclose (a) the alleged solicitation and receipt of excessive and undisclosed commissions by the underwriters in connection with the allocation of shares of common stock to certain investors in the Company’s public offerings and (b) that certain of the underwriters allegedly had entered into agreements with investors whereby underwriters agreed to allocate the public offering shares in exchange for which the investors agreed to make additional purchases of stock in the aftermarket at pre-determined prices. It also alleges claims against the Company, the Individual Defendants and the underwriters under Sections 10(b) and 20(a) of the Securities Exchange Act of 1934, as amended (the “Exchange Act”), primarily based on the assertion that the Company’s lead underwriters, the Company and the Individual Defendants defrauded investors by participating
71
Table of Contents
in a fraudulent scheme and by making materially false and misleading statements and omissions of material fact during the period in question. The amended complaint seeks damages in an unspecified amount.
The action against the Company is being coordinated with approximately three hundred other nearly identical actions filed against other companies. Due to the large number of nearly identical actions, the court has ordered the parties to select up to twenty “test” cases. The Company’s case has been selected as one such test case. As a result, among other things, the Company will be subject to broader discovery obligations and expenses in the litigation than non-test case issuer defendants.
On October 9, 2002, the court dismissed the Individual Defendants from the case without prejudice. This dismissal disposed of the Section 15 and Section 20(a) claims without prejudice, because these claims were asserted only against the Individual Defendants. On October 13, 2004, the court denied the certification of a class in the action against the Company with respect to the Section 11 claims alleging that the defendants made material false and misleading statements in the Company’s Registration Statement and Prospectuses. The certification was denied because no class representative purchased shares between the date of the IPO and January 19, 2000 (the date unregistered shares entered the market), and thereafter suffered a loss on the sale of those shares. The court certified a class in the action against the Company with respect to the Section 10(b) claims alleging that the Company and the Individual Defendants defrauded investors by participating in a fraudulent scheme and by making materially false and misleading statements and omissions of material fact during the period in question. On December 5, 2006, the Second Circuit vacated the district court’s class certification decision. On April 6, 2007, the Second Circuit panel denied a petition for rehearing filed by the plaintiffs, but noted that the plaintiffs could ask the district court to certify a more narrow class than the one that was rejected.
On August 14, 2007, the plaintiffs filed a Second Amended Class Action complaint against the Company. The Company and the underwriters filed separate motions to dismiss the amended complaint on November 14, 2007. On March 26, 2008, the Court denied the motion to dismiss the Section 10(b) claims but dismissed certain Section 11 claims against the Company. On June 5, 2008, the Court dismissed the remaining Section 11 claims against the Company in response to a motion for partial reconsideration.
The parties in the approximately 300 coordinated cases, including the Company’s case, reached a settlement. The insurers for the issuer defendants in the coordinated cases will make the settlement payment on behalf of the issuers, including the Company. On October 5, 2009, the Court granted final approval of the settlement. A group of three objectors filed a petition to the Second Circuit seeking permission to appeal the District Court’s final approval order on the basis that the settlement class is broader than the class previously rejected by the Second Circuit in its December 5, 2006 order vacating the District Court’s order certifying classes in the focus cases. Plaintiffs filed an opposition to the petition. Six notices of appeal to the Second Circuit have also been filed by different groups of objectors. Subject to court approval, the objectors to the settlement will file their briefs in the Second Circuit no later than October 6, 2010, and answering briefs will be due no later than February 3, 2011.
Due to the inherent uncertainties of litigation, the Company cannot accurately predict the ultimate outcome of the matter. If the settlement does not survive appeal, the litigation continues, and the Company is found liable, the Company is unable to estimate or predict the potential damages that might be awarded, whether such damages would be greater than the Company’s insurance coverage, and whether such damages would have a material impact on our results of operations or financial condition in any future period.
Derivative Lawsuits
In October 2007, a purported Sycamore Networks, Inc. stockholder filed a complaint for violation of Section 16 of the Securities Exchange Act of 1934, which prohibits short-swing trading, against the Company’s Initial Public Offering underwriters. The complaint, Vanessa Simmonds v. Morgan Stanley, et al., in District
72
Table of Contents
Court for the Western District of Washington (“District Court”) seeks recovery of short-swing profits. On April 28, 2008, the district court established a briefing schedule for motions to dismiss and ruled that all discovery be stayed pending resolution of the motions to dismiss. The District Court found the motions appropriate for oral argument which was held on January 6, 2009. On March 16, 2009, the District Court issued an order dismissing the case. On March 31, 2009, the plaintiff appealed. Briefing before the Ninth Circuit was complete as of November 17, 2009. Oral argument has been scheduled for October 5, 2010. The Company is named as a nominal defendant. No recovery is sought from the Company in this matter.
Other Matters
From time to time the Company is a party to litigation and other disputes which it considers routine and incidental to its business. Our management does not expect the results of any of these actions to have a material adverse effect on the Company’s business, results of operations or financial condition.
Guarantees
As of July 31, 2010, the Company’s guarantees requiring disclosure consist of its accrued warranty obligations, indemnifications for intellectual property infringement claims and indemnifications for officers and directors.
In the normal course of business, the Company may also agree to indemnify other parties, including customers, lessors and parties to other transactions with the Company, with respect to certain matters. The Company has agreed to hold these other parties harmless against losses arising from a breach of representations or covenants, or other claims made against certain parties. These agreements may limit the time within which an indemnification claim can be made and the amount of the claim. It is not possible to determine the maximum potential amount under these indemnification agreements due to the limited history of prior indemnification claims and the unique facts and circumstances involved in each particular agreement. Historically, payments made by the Company under these agreements have not had a material impact on the Company’s operating results or financial position. Accordingly, the Company has not recorded a liability for these agreements at July 31, 2010 or July 31, 2009 as the Company believes the fair value is not material.
The Company has agreed to indemnify its officers and directors for certain events or occurrences arising as a result of the officer or director serving in such capacity. The maximum potential amount of future payments the Company could be required to make under these indemnification agreements is not limited; however, the Company has directors and officers insurance coverage that reduces its exposure and may enable the Company to recover a portion of any future amounts paid. The Company did not incur any expense under these arrangements in fiscal year 2010 and has incurred expenses under these agreements of $0.01 million and $2.1 million for fiscal years 2009 and 2008 respectively, on behalf of eligible persons for legal fees incurred by them in connection with the stock option investigations, the resulting restatement of previously issued financial statements and the subsequent inquiry by the SEC and DOJ of information and documentation related thereto. Due to the Company’s inability to estimate its liabilities in connection with these agreements, the Company has not recorded a liability for these agreements at July 31, 2010 or July 31, 2009. The Company maintains insurance policies whereby certain payments may be recoverable subject to the terms and conditions provided in such policies. The Company received $0.2 and $3.7 million in recoveries under such policies for fiscal year 2010 and 2009.
Warranty Liability
The Company records a warranty liability for parts and labor on its products at the time revenue is recognized. Warranty periods are generally three years from installation date. The estimate of the warranty liability is based primarily on the Company’s historical experience in product failure rates and the expected material and labor costs to provide warranty services.
73
Table of Contents
The following table summarizes the activity related to the product warranty liability (in thousands):
| Year Ended July 31, | ||||||||
| 2010 | 2009 | |||||||
| Beginning Balance |
$ | 2,866 | $ | 3,829 | ||||
| Accruals for warranties during the period |
447 | 332 | ||||||
| Settlements |
(103 | ) | (536 | ) | ||||
| Adjustments |
(1,490 | ) | (759 | ) | ||||
| Ending Balance |
$ | 1,720 | $ | 2,866 | ||||
14. Selected Quarterly Financial Data (Unaudited)
| Consolidated Statement of Operations Data: | ||||||||||||||||
| (in thousands, except per share amounts) | ||||||||||||||||
| October 24, 2009 |
January 23, 2010 |
April 24, 2010 |
July 31, 2010 |
|||||||||||||
| Revenue |
$ | 15,624 | $ | 16,174 | $ | 14,587 | $ | 22,232 | ||||||||
| Cost of revenue |
7,847 | 6,879 | 6,057 | 10,171 | ||||||||||||
| Gross profit |
7,777 | 9,295 | 8,530 | 12,061 | ||||||||||||
| Operating expenses: |
||||||||||||||||
| Research and development |
8,672 | 7,761 | 7,783 | 7,469 | ||||||||||||
| Sales and marketing |
2,585 | 2,759 | 2,729 | 2,869 | ||||||||||||
| General and administrative |
2,308 | 2,444 | 2,221 | 2,125 | ||||||||||||
| Asset impairment |
1,076 | — | — | — | ||||||||||||
| Restructuring |
5,228 | (88 | ) | 510 | (25 | ) | ||||||||||
| Total operating expenses |
19,869 | 12,876 | 13,243 | 12,438 | ||||||||||||
| Loss from operations |
(12,092 | ) | (3,581 | ) | (4,713 | ) | (377 | ) | ||||||||
| Interest and other income, net |
1,820 | 1,641 | 1,108 | 1,023 | ||||||||||||
| Income (loss) before income taxes |
(10,272 | ) | (1,940 | ) | (3,605 | ) | 646 | |||||||||
| Income tax expense (benefit) |
120 | (727 | ) | 116 | 125 | |||||||||||
| Net income (loss) |
$ | (10,392 | ) | $ | (1,213 | ) | $ | (3,721 | ) | 521 | ||||||
| Basic and diluted net income (loss) per share |
$ | (0.37 | ) | $ | (0.04 | ) | $ | (0.13 | ) | $ | 0.02 | |||||
74
Table of Contents
| Consolidated Statement of Operations Data: | ||||||||||||||||
| (in thousands, except per share amounts) | ||||||||||||||||
| October 25, 2008 |
January 24, 2009 |
April 25, 2009 |
July 31, 2009 |
|||||||||||||
| Revenue |
$ | 15,431 | $ | 11,698 | $ | 22,983 | $ | 17,245 | ||||||||
| Cost of revenue |
9,358 | 8,504 | 10,413 | 10,194 | ||||||||||||
| Gross profit |
6,073 | 3,194 | 12,570 | 7,051 | ||||||||||||
| Operating expenses: |
||||||||||||||||
| Research and development |
11,455 | 12,912 | 13,042 | 12,725 | ||||||||||||
| Sales and marketing |
4,074 | 3,644 | 3,648 | 3,185 | ||||||||||||
| General and administrative |
1,735 | 1,518 | 2,320 | 2,625 | ||||||||||||
| Asset impairment |
— | — | — | 24,209 | ||||||||||||
| Restructuring |
628 | 189 | — | 2,783 | ||||||||||||
| Total operating expenses |
17,892 | 18,263 | 19,010 | 45,527 | ||||||||||||
| Loss from operations |
(11,819 | ) | (15,069 | ) | (6,440 | ) | (38,476 | ) | ||||||||
| Interest and other income, net |
5,994 | 5,026 | 3,831 | 3,149 | ||||||||||||
| Loss before income taxes |
(5,825 | ) | (10,043 | ) | (2,609 | ) | (35,327 | ) | ||||||||
| Income tax expense (benefit) |
(46 | ) | 88 | 123 | (397 | ) | ||||||||||
| Net loss |
$ | (5,779 | ) | $ | (10,131 | ) | $ | (2,732 | ) | $ | (34,930 | ) | ||||
| Basic and diluted net loss per share |
$ | (0.20 | ) | $ | (0.36 | ) | $ | (0.10 | ) | $ | (1.23 | ) | ||||
All periods presented have been adjusted for the 1-for-10 reverse stock split.
Quarterly basic and diluted net income (loss) per share may not add up to the annual amount due to rounding.
15. Subsequent Events
The Company evaluated its events and transactions subsequent to its July 31, 2010 balance sheet date and determined that there were no significant subsequent events to report.
75
Table of Contents
| ITEM 9. | CHANGES IN AND DISAGREEMENTS WITH ACCOUNTANTS ON ACCOUNTING AND FINANCIAL DISCLOSURE |
None.
| ITEM 9A. | CONTROLS AND PROCEDURES |
Evaluation of Disclosure Controls and Procedures. Our management (with the participation of our Chief Executive Officer and Chief Financial Officer) evaluated the effectiveness of our disclosure controls and procedures (as defined in Rules 13a-15(e) and 15d-15(e) under the Securities Exchange Act of 1934, as amended (the “Exchange Act”)), as of July 31, 2010. Disclosure controls and procedures are designed to ensure that information required to be disclosed by the Company in the reports it files or submits under the Exchange Act is recorded, processed, summarized and reported on a timely basis and that such information is accumulated and communicated to management, including the Chief Executive Officer and Chief Financial Officer, as appropriate, to allow timely decisions regarding required disclosure. Based on this evaluation, our Chief Executive Officer and Chief Financial Officer concluded that these disclosure controls and procedures are effective and designed to ensure that the information required to be disclosed in our reports filed or submitted under the Exchange Act is recorded, processed, summarized and reported within the requisite time periods.
Limitations on Effectiveness of Controls. Our management has concluded that our disclosure controls and procedures and internal controls provide reasonable assurance that the objectives of our control system are met. However, our management (including our Chief Executive Officer and Chief Financial Officer) does not expect that the disclosure controls and procedures or internal controls will prevent all error and/or fraud. A control system, no matter how well designed and operated, can provide only reasonable, not absolute, assurance that the objectives of the control system are met. Further, the design of a control system must reflect the fact that there are resource constraints, and the benefits of controls must be considered relative to their costs. Due to the inherent limitations in all control systems, no evaluation of controls can provide absolute assurance that all control issues, errors and instances of fraud, if any, within the company have been or will be detected. These inherent limitations include the realities that judgments in decision making can be faulty and that breakdowns can occur because of simple errors or mistakes. Additionally, controls can be circumvented by the individual acts of some persons, by collusion of two or more people, or by management override of the control. The design of any system is also based in part upon certain assumptions about the likelihood of future events, and there can be no assurances that any design will succeed in achieving its stated goals under all potential future conditions. Because of the inherent limitations in a cost-effective control system, misstatements due to error or fraud may occur and may not be detected.
Management’s Report on Internal Control over Financial Reporting. Our management is responsible for establishing and maintaining adequate internal control over financial reporting. Internal control over financial reporting is defined in Rules 13a-15(f) and 15d-15(f) promulgated under the Exchange Act as a process designed by, or under the supervision of, the Company’s Chief Executive Officer and Chief Financial Officer and effected by the Company’s Board of Directors, management and other personnel, to provide reasonable assurance regarding the reliability of financial reporting and the preparation of financial statements for external purposes in accordance with generally accepted accounting principles and includes those policies and procedures that:
| • | Pertain to the maintenance of records that in reasonable detail accurately and fairly reflect the transactions and dispositions of the assets of the Company; |
| • | Provide reasonable assurance that transactions are recorded as necessary to permit preparation of financial statements in accordance with generally accepted accounting principles, and that receipts and expenditures of the Company are being made only in accordance with authorizations of management and directors of the Company; and |
| • | Provide reasonable assurance regarding prevention or timely detection of unauthorized acquisition, use or disposition of the Company’s assets that could have a material effect on the financial statements. |
76
Table of Contents
Because of its inherent limitations, internal control over financial reporting may not prevent or detect misstatements. Projections of any evaluation of effectiveness to future periods are subject to the risk that controls may become inadequate because of changes in conditions, or that the degree of compliance with the policies or procedures may deteriorate.
Our management assessed the effectiveness of our internal control over financial reporting as of July 31, 2010. In making this assessment, our management used the criteria set forth by the Committee of Sponsoring Organizations of the Treadway Commission (COSO) in Internal Control—Integrated Framework.
Based on our assessment, management concluded that, as of July 31, 2010, our internal control over financial reporting was effective based on those criteria.
The Company’s independent registered public accounting firm, PricewaterhouseCoopers LLP, has audited the effectiveness of the company’s internal control over financial reporting as July 31, 2010, as stated in their report that appears on page 48 of this Form 10-K.
Changes in Internal Control over Financial Reporting. There was no change in our internal control over financial reporting (as defined in Rules 13a-15(f) and 15d-15(f) under the Exchange Act) during our fourth fiscal quarter that has materially affected, or is reasonably likely to materially affect, our internal control over financial reporting.
| ITEM 9B. | OTHER INFORMATION |
None
77
Table of Contents
PART III
| ITEM 10. | DIRECTORS, EXECUTIVE OFFICERS AND CORPORATE GOVERNANCE |
The information set forth under the heading “Executive Officers of the Registrant” in Part I hereof and set forth under the captions “Election of Directors” and “Section 16(a) Beneficial Ownership Reporting Compliance” appearing in the Company’s definitive Proxy Statement for the 2010 Annual Meeting of Stockholders to be held on January 4, 2011, which will be filed with the Securities and Exchange Commission not later than 120 days after July 31, 2010, is incorporated herein by reference.
We have adopted a business code of ethics and corporate governance that applies to all executive officers, directors and employees of the Company, which is available on our website at www.sycamorenet.com. Copies are also available in print to stockholders upon request to Sycamore Networks, Inc., Attn: Secretary, 220 Mill Road, Chelmsford, MA 01824. We intend to satisfy the disclosure requirement under Item 10 of Form 8-K regarding an amendment to, or waiver from, a provision of the business code of ethics and corporate governance by posting such information on our website, at the address specified above, unless a Form 8-K is otherwise required by applicable rules of the NASDAQ Stock Market.
| ITEM 11. | EXECUTIVE COMPENSATION |
The information appearing under the heading “Executive Officers of the Registrant” in Part I hereof and set forth under the captions “Executive Compensation,” “Compensation Committee Interlocks and Insider Participation,” and “Compensation Committee Report” in the Company’s definitive Proxy Statement for the 2010 Annual Meeting of Stockholders to be held on January 4, 2011, which will be filed with the Securities and Exchange Commission not later than 120 days after July 31, 2010, is incorporated herein by reference.
| ITEM 12. | SECURITY OWNERSHIP OF CERTAIN BENEFICIAL OWNERS AND MANAGEMENT AND RELATED STOCKHOLDER MATTERS |
The information set forth under the heading “Equity Compensation Plan Information” in Part II hereof and under the captions “Security Ownership of Certain Beneficial Owners and Management” and “Executive Compensation” appearing in the Company’s definitive Proxy Statement for the 2010 Annual Meeting of Stockholders to be held on January 4, 2011, which will be filed with the Securities and Exchange Commission not later than 120 days after July 31, 2010, is incorporated herein by reference.
| ITEM 13. | CERTAIN RELATIONSHIPS AND RELATED TRANSACTIONS, AND DIRECTOR INDEPENDENCE |
The information under the captions “Certain Relationships and Related Transactions” and “Director Independence” appearing in the Company’s definitive Proxy Statement for the 2010 Annual Meeting of Stockholders to be held on January 4, 2011, which will be filed with the Securities and Exchange Commission not later than 120 days after July 31, 2010, is incorporated herein by reference.
| ITEM 14. | PRINCIPAL ACCOUNTANT FEES AND SERVICES |
The information set forth under the captions “Principal Accounting Fees and Services” and “Audit Committee Pre-Approval Policy” appearing in the Company’s definitive Proxy Statement for the 2010 Annual Meeting of Stockholders to be held on January 4, 2011, which will be filed with the Securities and Exchange Commission not later than 120 days after July 31, 2010, is incorporated herein by reference.
78
Table of Contents
PART IV
| ITEM 15. | EXHIBITS AND FINANCIAL STATEMENT SCHEDULES |
| (a) 1. | Financial Statements |
The financial statements listed in the accompanying Index to Consolidated Financial Statements on page 47 are filed as part of this report.
| 2. | Financial Statement Schedules |
None
| 3. | Exhibits |
| Number |
Exhibit Description | |
| 2.1 | Agreement and Plan of Merger, dated April 12, 2006 and amended and restated as of August 3, 2006, by and among Sycamore Networks, Inc., Bach Group LLC, Allen Organ Company, MusicCo, LLC, LandCo Real Estate, LLC, AOC Acquisition, Inc. and the Representative of the Holders of Capital Stock of Allen Organ Company. (15) | |
| 3.1 | Amended and Restated Certificate of Incorporation of the Company (3) | |
| 3.2 | Certificate of Amendment to the Amended and Restated Certificate of Incorporation of the Company (3) | |
| 3.3 | Certificate of Amendment to the Amended and Restated Certificate of Incorporation of the Company (5) | |
| 3.4 | Certificate of Amendment to the Amended and Restated Certificate of Incorporation of the Company (21) | |
| 3.5 | Amended and Restated By-Laws of the Company (17) | |
| 4.1 | Specimen common stock certificate | |
| 4.2 | See Exhibits 3.1, 3.2, 3.3 and 3.4 for provisions of the Certificate of Incorporation and By-Laws of the Registrant defining the rights of holders of common stock of the Company (3)(5) | |
| *10.1 | 1998 Stock Incentive Plan, as amended (1) | |
| *10.2 | 1999 Non-Employee Directors’ Stock Option Plan (17) | |
| *10.3 | 1999 Stock Incentive Plan, as amended (17) | |
| *10.4 | 2009 Non-Employee Directors’ Stock Option Plan (19) | |
| *10.5 | 2009 Stock Incentive Plan (19) | |
| *10.6 | Form of Indemnification Agreement between Sycamore, the Directors of Sycamore Networks, Inc. and Executive Officers of Sycamore Networks, Inc., dated as of November 17, 1999, October 15, 2002, October 5, 2004, January 11, 2005, September 6, 2007, August 1, 2007, November 13, 2007 or December 11, 2007 (2) | |
| *10.7 | Form of Amended Change in Control Agreement between Sycamore Networks, Inc. and Executive Officers of Sycamore Networks, Inc. dated as of December 18, 2008 (18) | |
| *10.8 | Sirocco Systems, Inc. 1998 Stock Plan (4) | |
| +10.9 | Manufacturing Services Agreement between Sycamore Networks, Inc. and Plexus Services Corp. (7) | |
79
Table of Contents
| Number |
Exhibit Description | |
| 10.10 | Lease Agreement between Sycamore Networks, Inc. and New Boston Mill Road Limited Partnership dated March 8, 2000 (3) | |
| +10.11 | Reseller Agreement dated January 6, 2004 between Sycamore Networks, Inc. and Sprint (8) | |
| +10.12 | Exhibit I dated February 25, 2004 to the Reseller Agreement dated January 6, 2004 between Sycamore Networks, Inc. and Sprint (9) | |
| +10.13 | Master Purchase Agreement for Technical Equipment and Related Services dated April 22, 2004 between Sycamore Networks, Inc. and Sprint/United Management Company, including Amendment No. 1 dated June 29, 2004 and Amendment No. 2 dated July 19, 2004 (10) | |
| +10.14 | Amendment No. 1 to Manufacturing Services Agreement between Sycamore Networks, Inc. and Plexus Services Corp. dated July 26, 2004 (10) | |
| *10.15 | Letter Agreement between Sycamore Networks, Inc. and Alan Cormier (11) | |
| +10.16 | Agreement for the Provision of Hardware, Software, Training, Support and Maintenance and Project Management Services to Vodafone Limited between Vodafone Limited and Sycamore Networks, Inc. dated November 16, 2000, as amended by amendments 1 through 5 (11) | |
| +10.17 | Amendment No. 2 dated March 29, 2005, and effective as of October 1, 2004, to the Reseller Agreement dated January 6, 2004 between Sycamore Networks, Inc. and Sprint (12) | |
| +10.18 | Amendment No. 3 dated June 16, 2005 to the United States Reseller Agreement between Sycamore Networks, Inc. and Sprint Communications Company, L.P. Government Systems Division dated January 6, 2004 (13) | |
| +10.19 | Amendment No. 4 dated June 1, 2005 to the United States Reseller Agreement between Sycamore Networks, Inc. and Sprint Communications Company, L.P. Government Systems Division dated January 6, 2004 (13) | |
| +10.20 | Agreement for the Provision of Hardware, Software, Training, Support and Maintenance and Project Management Services to Vodafone Libertel N.V. dated June 12, 2002 (13) | |
| +10.21 | Amendment No. 1 dated February 2, 2004 to Agreement for the Provision of Hardware, Software, Training, Support and Maintenance and Project Management Services to Vodafone Libertel N.V. dated June 12, 2002 (13) | |
| +10.22 | Purchase Agreement between Sycamore Networks Inc., Chelmsford, MA, USA and Siemens AG Munich, Germany dated June 13, 2002, as amended as of August 8, 2005 (14) | |
| *10.23 | Letter Agreement between Sycamore Networks, Inc. and John B. Scully dated September 6, 2006. (16) | |
| *10.24 | Relocation Offer and Agreement between Sycamore Networks, Inc. and John B. Scully dated May 4, 2007. (16) | |
| *10.25 | Relocation Offer and Agreement between Sycamore Networks, Inc. and John B. Scully dated January 26, 2009 (20) | |
| +10.26 | First Amendment to Lease between Sycamore Networks, Inc. and Lakn Marlton Associates, LLC dated February 14, 2006. (16) | |
| 10.27 | Eastern Research, Inc. Stock Option Plan (16) | |
| *10.28 | Amendment Number 1 to the Non-Qualified Stock Option Agreement with Kevin Oye, dated April 29, 2002 (16) | |
| 10.29 | Letter Agreement between Sycamore Networks, Inc. and Paul F. Brauneis dated October 12, 2007 (17) | |
80
Table of Contents
| Number |
Exhibit Description | |
| 21.1 | List of subsidiaries | |
| 23.1 | Consent of PricewaterhouseCoopers LLP | |
| 24.1 | Power of Attorney (see signature page) | |
| 31.1 | Certification of Chief Executive Officer pursuant to Rule 13a-14(a) under the Securities Exchange Act of 1934 as adopted pursuant to Section 302 of the Sarbanes-Oxley Act of 2002 | |
| 31.2 | Certification of Chief Financial Officer pursuant to Rule 13a-14(a) under the Securities Exchange Act of 1934 as adopted pursuant to Section 302 of the Sarbanes-Oxley Act of 2002 | |
| 32.1 | Certification of Chief Executive Officer pursuant to 18 U.S.C Section 1350 as adopted pursuant to Section 906 of the Sarbanes-Oxley Act of 2002 | |
| 32.2 | Certification of Chief Financial Officer pursuant to 18 U.S.C Section 1350 as adopted pursuant to Section 906 of the Sarbanes-Oxley Act of 2002 | |
| (1) | Incorporated by reference to Sycamore Networks, Inc.’s Registration Statement on Form S-1 (Registration Statement No. 333-84635) filed with the Commission on August 6, 1999, as amended. |
| (2) | Incorporated by reference to Sycamore Networks, Inc.’s Quarterly Report on Form 10-Q for the quarterly period ended October 30, 1999 filed with the Commission on December 13, 1999. |
| (3) | Incorporated by reference to Sycamore Networks, Inc.’s Registration Statement on Form S-1 (Registration Statement No. 333-30630) filed with the Commission on February 17, 2000, as amended. |
| (4) | Incorporated by reference to Sycamore Networks, Inc.’s Annual Report on Form 10-K for the annual period ended July 31, 2000 filed with the Commission on October 24, 2000. |
| (5) | Incorporated by reference to Sycamore Networks, Inc.’s Quarterly Report on Form 10-Q for the quarterly period ended January 27, 2001 filed with the Commission on March 13, 2001. |
| (6) | Incorporated by reference to Sycamore Networks, Inc.’s Quarterly Report on Form 10-Q for the quarterly period ended April 28, 2001 filed with the Commission on June 12, 2001. |
| (7) | Incorporated by reference to Sycamore Networks, Inc.’s Annual Report on Form 10-K for the annual period ended July 31, 2003 filed with the Commission on October 21, 2003. |
| (8) | Incorporated by reference to Sycamore Networks, Inc.’s Quarterly Report on Form 10-Q for the quarterly period ended January 24, 2004 filed with the Commission on February 12, 2004. |
| (9) | Incorporated by reference to Sycamore Networks, Inc.’s Quarterly Report on Form 10-Q for the quarterly period ended April 24, 2004 filed with the Commission on May 13, 2004. |
| (10) | Incorporated by reference to Sycamore Networks, Inc.’s Annual Report on Form 10-K for the annual period ended July 31, 2004 filed with the Commission on August 23, 2004. |
| (11) | Incorporated by reference to Sycamore Networks, Inc.’s Quarterly Report on Form 10-Q for the quarterly period ended January 29, 2005 filed with the Commission on February 25, 2005. |
| (12) | Incorporated by reference to Sycamore Networks, Inc.’s Quarterly Report on Form 10-Q for the quarterly period ended April 30, 2005 filed with the Commission on September 12, 2005, as amended. |
| (13) | Incorporated by reference to Sycamore Networks, Inc.’s Annual Report on Form 10-K for the annual period ended July 31, 2005 filed with the Commission on October 11, 2005, as amended. |
| (14) | Incorporated by reference to Sycamore Networks, Inc.’s Quarterly Report on Form 10-Q for the quarterly period ended October 29, 2005 filed with the Commission on November 29, 2005. |
| (15) | Incorporated by reference to Sycamore Networks, Inc.’s Current Report on Form 8-K filed with the Commission on August 4, 2006. |
| (16) | Incorporated by reference to Sycamore Networks, Inc.’s Annual Report on Form 10-K for the annual period ended July 31, 2006 filed with the Commission on June 21, 2007. |
| (17) | Incorporated by reference to Sycamore Networks, Inc.’s Quarterly Report on Form 10-Q for the quarterly period ended October 27, 2007 filed with the Commission on November 28, 2007. |
| (18) | Incorporated by reference to Sycamore Networks, Inc.’s Current Report on Form 8-K filed with the Commission on December 23, 2008. |
81
Table of Contents
| (19) | Incorporated by reference to Sycamore Networks, Inc.’s Registrations Statement on Form S-8 (Registration Statement No. 333-1569599) filed with the Commission on January 6, 2009. |
| (20) | Incorporated by reference to Sycamore Networks, Inc.’s Annual Report on Form 10-K for the annual period ended July 31, 2009 filed with the Commission on September 29, 2009. |
| (21) | Incorporated by reference to Sycamore Networks, Inc.’s Current Report on Form 8-K filed with the Commission on December 21, 2009. |
| * | Denotes a management contract or compensatory plan or arrangement. |
| + | Confidential treatment granted for certain portions of this Exhibit pursuant to Rule 24b-2 of the Securities Exchange Act of 1934, which portions are omitted and filed separately with the Securities and Exchange Commission. |
| (b) | Exhibits |
The Company hereby files as part of this Form 10-K the exhibits listed in the Exhibit Index beginning on page 79.
| (c) | Financial Statement Schedules: |
None
82
Table of Contents
SIGNATURES
Pursuant to the requirements of Section 13 or 15(d) of the Securities Exchange Act of 1934, the registrant has duly caused this report to be signed on its behalf by the undersigned, thereunto duly authorized, in the City of Chelmsford, Commonwealth of Massachusetts, on this 24th day of September 2010.
| SYCAMORE NETWORKS, INC. | ||
| By: | /s/ DANIEL E. SMITH | |
| Daniel E. Smith | ||
| President and Chief Executive Officer | ||
83
Table of Contents
POWER OF ATTORNEY AND SIGNATURES
Know all persons by these presents, that each person whose signature appears below constitutes and appoints Gururaj Deshpande, Daniel E. Smith and Paul F. Brauneis, jointly and severally, his or her attorneys-in-fact, each with the power of substitution, for him or her in any and all capacities, to sign any amendments to this Annual Report on Form 10-K, and to file the same, with exhibits thereto and other documents in connection therewith, with the Securities and Exchange Commission, hereby ratifying and confirming all that each of said attorneys-in-fact, or his or her substitute or substitutes, may do or cause to be done by virtue hereof.
Pursuant to the requirements of the Securities Act, this Annual Report on Form 10-K has been signed below by the following persons in the capacities and on the dates indicated.
| Signature |
Title |
Date | ||
| /s/ GURURAJ DESHPANDE Gururaj Deshpande |
Chairman of the Board of Directors | September 24, 2010 | ||
| /s/ DANIEL E. SMITH Daniel E. Smith |
President, Chief Executive Officer and Director | September 24, 2010 | ||
| /s/ PAUL F. BRAUNEIS Paul F. Brauneis |
Chief Financial Officer, Vice President, Finance and Administration, and Treasurer (Principal Financial and Accounting Officer) |
September 24, 2010 | ||
|
Craig Benson |
Director | September 24, 2010 | ||
| /s/ ROBERT E. DONAHUE Robert E. Donahue |
Director | September 24, 2010 | ||
| /s/ JOHN W. GERDELMAN John W. Gerdelman |
Director | September 24, 2010 | ||
84