Attached files
Table of Contents
As filed with the U.S. Securities and Exchange Commission on September 20, 2010
Registration No. 333-169356
UNITED STATES
SECURITIES AND EXCHANGE COMMISSION
Washington, D.C. 20549
Amendment No. 1 to
Form S-1
REGISTRATION STATEMENT
UNDER
THE SECURITIES ACT OF 1933
Kraton Performance Polymers, Inc.
(Exact name of Registrant as specified in its charter)
| Delaware | 2821 | 20-0411521 | ||
| (State or other jurisdiction of incorporation or organization) |
(Primary Standard Industrial Classification Code Number) |
(I.R.S. Employer Identification Number) |
15710 John F. Kennedy Blvd.
Suite 300
Houston, TX 77032
Telephone: (218) 504-4700
(Address including zip code, telephone number, including area code, of Registrant’s Principal Executive Offices)
Stephen W. Duffy, Esq.
General Counsel
Kraton Performance Polymers, Inc.
15710 John F. Kennedy Blvd.
Suite 300
Houston, Texas 77032
Telephone: (281) 504-4700
Telecopy: (281) 504-4743
(Name, address including zip code, telephone number, including area code, of agent for service)
Copies To:
| William F. Gorin, Esq. Duane McLaughlin, Esq. Cleary Gottlieb Steen & Hamilton LLP One Liberty Plaza New York, New York 10006 Telephone: (212) 225-2000 Telecopy: (212) 225-3999 |
Peter Labonski, Esq. Keith Halverstam, Esq. Latham & Watkins LLP 885 Third Avenue New York, New York 10022 Telephone: (212) 906-1200 Telecopy: (212) 751-4864 |
Approximate date of commencement of proposed sale to the public: As soon as practicable after the effective date hereof.
If any of the securities being registered on this form are to be offered on a delayed or continuous basis pursuant to Rule 415 under the Securities Act, check the following box. ¨
If this form is filed to register additional securities for an offering pursuant to Rule 462(b) under the Securities Act, check the following box and list the Securities Act registration statement number of the earlier effective registration statement for the same offering. ¨
If this form is a post-effective amendment filed pursuant to Rule 462(c) under the Securities Act, check the following box and list the Securities Act registration statement number of the earlier effective registration statement for the same offering. ¨
If this form is a post-effective amendment filed pursuant to Rule 462(d) under the Securities Act, check the following box and list the Securities Act registration statement number of the earlier effective registration statement for the same offering. ¨
Indicate by check mark whether the registrant is a large accelerated filer, an accelerated filer, a non-accelerated filer, or a smaller reporting company. See the definitions of “large accelerated filer,” “accelerated filer” and “smaller reporting company” in Rule 12b-2 of the Exchange Act (Check one):
| Large accelerated filer ¨ |
Accelerated filer ¨ | |
| Non-accelerated filer x |
Smaller reporting company ¨ | |
| (Do not check if a smaller reporting company) | ||
The Registrant hereby amends this Registration Statement on such date or dates as may be necessary to delay its effective date until the Registrant shall file a further amendment which specifically states that this Registration Statement shall thereafter become effective in accordance with Section 8(a) of the Securities Act of 1933 or until the Registration Statement shall become effective on such date as the Commission, acting pursuant to said Section 8(a), may determine.
CALCULATION OF REGISTRATION FEE
| Title of each class of securities to be registered (1) |
Amount to be registered (1) |
Proposed maximum offering price per share (2) |
Proposed maximum aggregate offering price (1)(2) |
Amount of registration fees (3) | ||||
| Common stock, $0.01 par value per share |
9,200,000 | $27.49 | $252,908,000 | $18,032.34 | ||||
| (1) | Includes 1,200,000 shares that the underwriters have an option to purchase from the selling stockholders to cover over-allotments, if any. |
| (2) | Estimated solely for the purpose of calculating the registration fee, based on the average of the high and low prices of the registrant’s common stock on September 10, 2010, pursuant to Rule 457(c) promulgated under the Securities Act of 1933, as amended. |
| (3) | Previously paid. |
Table of Contents
The information in this prospectus is not complete and may be changed. We may not sell these securities until the registration statement filed with the Securities and Exchange Commission is effective. This prospectus is not an offer to sell these securities and it is not soliciting an offer to buy these securities in any jurisdiction where the offer or sale is not permitted.
SUBJECT TO COMPLETION, DATED SEPTEMBER 20, 2010
Prospectus
8,000,000 Shares

Kraton Performance Polymers, Inc.
Common Stock
The selling stockholders identified in this prospectus are offering all of the shares offered hereby and will receive all of the proceeds from this offering. We will not receive any proceeds from this offering. See “Principal and Selling Stockholders.”
Our common stock is listed on the New York Stock Exchange under the symbol “KRA.” On September 17, 2010 the closing price of our common stock as reported on the New York Stock Exchange was $29.72.
The selling stockholders have granted the underwriters the right to purchase up to 1,200,000 shares of common stock at the offering price less the underwriting discount if the underwriters sell more than 8,000,000 shares of common stock in this offering. The underwriters can exercise this right at any time and from time to time, in whole or in part, within 30 days after this offering.
Investing in our common stock involves a high degree of risk. See “Risk Factors” beginning on page 17.
| Price to Public |
Underwriting Discounts and Commissions |
Proceeds, Before Expenses, to the Selling Stockholders | |||||||
| Per Share |
$ | $ | $ | ||||||
| Total |
$ | $ | $ | ||||||
Delivery of the shares of common stock will be made on or about , 2010.
Neither the Securities and Exchange Commission nor any state securities commission has approved or disapproved these securities or determined if this prospectus is truthful or complete. Any representation to the contrary is a criminal offense.
| Credit Suisse | BofA Merrill Lynch | Morgan Stanley | Oppenheimer & Co. |
| KeyBanc Capital Markets |
UBS Investment Bank | |
The date of this prospectus is , 2010.
Table of Contents
We are responsible for the information contained and incorporated by reference in this prospectus. We have not authorized anyone to give you any other information, and we take no responsibility for any other information that others may give you. This document may only be used where it is legal to sell these securities. The information in this document may only be accurate on the date of this document.
Information contained in our web site does not constitute part of this prospectus.
The Kraton name, our logo and other trademarks mentioned in this prospectus are the property of their respective owners.
We obtained the industry and market data used throughout this prospectus from our own internal estimates and research as well as from industry and general publications and from research, surveys and studies conducted by third parties.
| Page | ||
| 1 | ||
| 17 | ||
| 32 | ||
| 34 | ||
| 35 | ||
| 36 | ||
| 37 | ||
| 38 | ||
| Management’s Discussion and Analysis of Financial Condition and Results of Operations |
40 | |
| 64 | ||
| 69 | ||
| 89 | ||
| 98 | ||
| 122 | ||
| 125 | ||
| 128 | ||
| 131 | ||
| 135 | ||
| Certain United States Federal Income Tax Considerations for Non-U.S. Holders |
137 | |
| 140 | ||
| 148 | ||
| 148 | ||
| 148 | ||
| 149 | ||
| F-1 |
Table of Contents
The following summary includes basic information about our company and this offering. It may not contain all of the information that is important to you. For a more comprehensive understanding of our company and this offering, you should read this entire prospectus.
In this prospectus, unless we indicate otherwise or the context requires:
| • | “Kraton Performance Polymers,” “our company,” “we,” “our,” “ours,” and “us” refer to Kraton Performance Polymers, Inc. and its consolidated subsidiaries; |
| • | “Kraton” refers to Kraton Polymers LLC; and |
| • | the “SBC industry” refers to the elastomeric styrenic block copolymers industry and does not include the high styrene or rigid SBC business. |
Our Company
General
We believe we are the world’s leading producer of styrenic block copolymers (SBCs) as measured by 2009 sales revenue. We market our products under the widely recognized Kraton® brand. SBCs are highly-engineered synthetic elastomers that we invented and commercialized almost 50 years ago, which enhance the performance of numerous end use products, imparting greater flexibility, resilience, strength, durability and processability. We focus on the end use markets we believe offer the highest growth potential and greatest opportunity to differentiate our products from competing products. Within these end use markets, we believe that we provide our customers with a broad portfolio of highly-engineered and value-enhancing polymers that are critical to the performance of our customers’ products. We seek to maximize the value of our product portfolio by introducing innovations that command premium pricing and by consistently upgrading from lower margin products. As the industry leader, we believe we maintain significant competitive advantages, including an almost 50-year proven track record of innovation; world-class technical expertise; customer, geographical and end use market diversity; and industry-leading customer service capabilities. These advantages are supported by a global infrastructure and a long history of successful capital investments and operational excellence.
Our SBC products are found in many everyday applications, including disposable baby diapers, the rubberized grips of toothbrushes, razor blades, power tools and in asphalt formulations used to pave roads. We believe that there are many untapped uses for our products, and we will continue to develop new applications for SBCs. We also develop, manufacture and market niche, non-SBC products that we believe have high growth potential, such as isoprene rubber latex, or IRL. IRL is a highly-engineered, reliable synthetic substitute for natural rubber latex. We believe the versatility of IRL offers significant opportunities for new, high-margin applications. Our IRL products, which are used in applications such as surgical gloves and condoms, have not been found to contain the proteins present in natural latex and are, therefore, not known to cause allergies. We believe we produce the highest purity IRL globally and that we are the only significant third-party supplier of the product. Our IRL business has grown at a compound annual growth rate of 28.8%, based on revenues, from 2007 to the end of 2009.
We currently offer approximately 800 products to more than 700 customers in over 60 countries worldwide, and we manufacture our polymers at five manufacturing facilities on four continents, including our flagship plant in Belpre, Ohio, the most diversified SBC plant in the world. Our facility in Japan is operated by an unconsolidated manufacturing joint venture. Our products are typically developed using our proprietary, and in many cases patent-protected, technology and require significant engineering, testing and certification. In 2009, we were awarded 94 patents for new products or applications and at December 31, 2009, we had approximately 1,000 granted patents and approximately 381 pending patent applications. We are widely regarded as the
1
Table of Contents
industry’s leading innovator and cost-efficient manufacturer in our end use markets. We work closely with our customers to design products that meet application-specific performance and quality requirements. We expect these innovations to drive our organic growth, sustain our leadership position, expand our market share, improve our margins and produce a high return on invested capital. For example, in 2008, we developed a family of environmentally-friendly products which provide an alternative to materials like polyvinyl chloride, or PVC, for medical packaging applications and wire and cable applications in electronics and automobiles.
Over the past several years, we have implemented a range of strategic initiatives designed to enhance our profitability and end use market position. These include fixed asset investments to expand our capacity in high value products, to enhance productivity at our existing facilities and to significantly reduce our fixed cost structure through headcount reductions, system upgrades and production line closures at our facility in Pernis, the Netherlands. During this period, we have shifted our portfolio to higher-margin products, substantially exited low-margin businesses such as footwear and implemented smart pricing strategies that have improved our overall margins and return on invested capital. We believe these initiatives provide us with a strong platform to drive growth, create significant operating leverage and position us to benefit from volume recovery in our end use markets.
We believe that starting in late 2008 the global economic downturn, and associated reduction in customer and end user inventory levels, caused an unprecedented slowdown across the industry. We experienced a decline in sales volume across all of our end use markets, including the traditionally more stable consumer and medical applications markets. We believe that a significant factor in this decline was inventory de-stocking. Our first and second quarter 2009 sales volumes were 39% and 24%, respectively, less than our sales volumes in the comparable 2008 quarters. The trend began to reverse itself in June 2009, as demand patterns began to shift towards recovery such that our third quarter 2009 sales volume was 10% less than the sales volume in the third quarter of 2008 and our fourth quarter 2009 sales volume was 16% above the sales volume in the fourth quarter of 2008. More recently, we have seen demand returning to more normal levels, with first-half 2010 sales volume up 34% compared to the first-half of 2009.
We generated total operating revenue of $968.0 million and $604.8 million for the twelve and six months ended December 31, 2009 and June 30, 2010, respectively, on volume of 260.3 kilotons and 159.1 kilotons, respectively. For the same periods, we generated net loss of $0.29 million and net income of $58.4 million, and Adjusted EBITDA of $91.4 million and $105.6 million, respectively. We define Adjusted EBITDA and reconcile it to net income in footnote 3 under “—Summary of Consolidated Financial Information and Other Data.” We report under one operating segment.
2
Table of Contents
Our Industry Focus
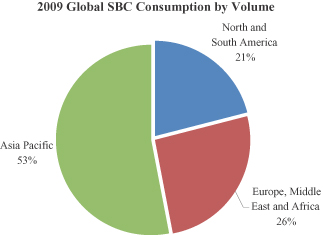
The global demand for SBCs in 2009 exceeded 1,400 kilotons, resulting in sales of approximately $3.3 billion. According to management estimates, SBC demand for non-footwear applications grew at a compound annual growth rate of approximately 6.5% between 2001 and 2009. In 2008 and the first-half of 2009, the SBC market demand was negatively impacted by the global economic downturn. According to management estimates, prior to the economic downturn, SBC demand for non-footwear applications grew at a compound annual growth rate of approximately 9.0% between 2001 and 2007, or approximately 2.7 times global real GDP.
Source: Management Estimates
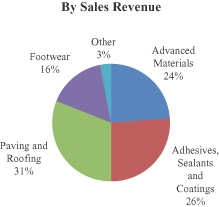
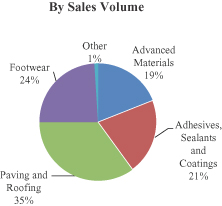
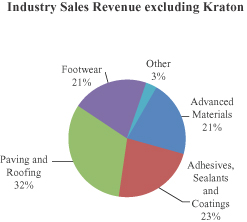
SBCs are primarily sold into four end uses: (1) Advanced Materials (compounding, personal care and polymer systems); (2) Adhesives, Sealants and Coatings; (3) Paving and Roofing; and (4) Footwear. Due to the higher selling prices in the Advanced Materials, Adhesives, Sealants and Coatings and Paving and Roofing end uses relative to the Footwear end use, the market share by end use on a revenue basis is meaningfully different than on a volume basis.
2009 Global SBC Consumption by End Use Market (1)
|
|
| (1) | Does not include Kraton Emerging Businesses volume or revenue. |
Source: Management Estimates
3
Table of Contents
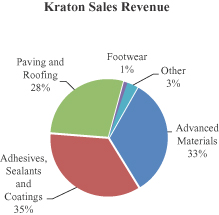
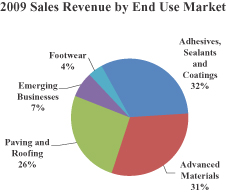
Kraton focuses on the high-value end use markets.
2009 Global SBC Consumption by End Use Market—Kraton vs. Industry (1)
|
|
| (1) | Does not include Kraton Emerging Businesses revenue. |
Source: Management Estimates
There are two major types of SBCs: hydrogenated styrenic block copolymers, or HSBCs, and unhydrogenated styrenic block copolymers, or USBCs.
HSBCs. HSBC products are significantly more complex to produce than USBC products and, consequently, generate higher margins and generally command selling prices between two and three times those for USBCs. We believe our 45% global end use market share of 2009 HSBC sales revenue leads the industry and is more than twice the size of our closest competitor. The HSBC class of products, which is typically more durable than USBC products, is primarily used in higher value-added Advanced Materials and Adhesives, Sealants and Coatings applications. We estimate that HSBCs accounted for approximately 21% of worldwide SBC industry sales revenue in 2009.
HSBCs are primarily used in our Advanced Materials and Adhesives, Sealants and Coatings end use markets, to impart improved performance characteristics such as:
| • | stretch properties in disposable diapers and adult incontinence products; |
| • | soft feel in numerous consumer products such as the handles for razor blades, power tools and automobile interiors; |
| • | impact resistance for demanding engineering plastic applications; |
| • | flexibility for wire and cable plastic outer layers; and |
| • | improved flow characteristics for many industrial and consumer sealants and lubricating fluids. |
USBCs. We believe that our 25% global market share of 2009 USBC sales revenue, excluding Footwear, leads the industry, and is approximately 1.3 times that of our closest competitor in terms of 2009 sales revenue. In 2009, we estimate that USBCs represented approximately 79% of worldwide SBC industry sales revenues and were used primarily in Footwear, Paving and Roofing and Adhesives, Sealants and Coatings end use.
USBCs are used in our Advanced Materials, Adhesives Sealants and Coatings and Paving and Roofing end use markets in a range of products to impart desirable characteristics, such as:
| • | resistance to temperature and weather extremes in roads and roofing; |
4
Table of Contents
| • | resistance to cracking, reduced sound transmission and better drainage in porous road surfaces; |
| • | impact resistance for consumer plastics; and |
| • | increased processing flexibility in materials used in disposable diapers and adhesive applications, such as packaging tapes and labels. |
Our End Use Markets
We believe we hold the number one global market position, based on 2009 sales revenue, in each of our targeted end use markets. We have aligned our commercial activities to serve four core end use markets that we believe have the highest growth and profitability potential: (1) Advanced Materials; (2) Adhesives, Sealants and Coatings; (3) Paving and Roofing; and (4) Emerging Businesses category.
The following table describes our core end use markets together with other end use markets and their approximate relative sizes:
| End Use Markets |
Revenue Mix (1) |
Our
End Use Market Position (2) |
Our
End Use Market Share (2) |
Our Relative End Use Market Share (3) |
Industry Compound Annual Growth Rate (4) |
Selected Applications/Products | |||||||||
| Advanced Materials |
31 | % | #1 | 36 | % | 2.0X | 7.4 | % | Soft touch for consumer products (tooth brushes and razor blades) and power tools Impact resistant engineering plastics Automotive components Elastic films for disposable diapers and adult incontinence branded products Skin care products and lotions Disposable food packaging Medical packaging films and tubing, often as alternatives to PVC | ||||||
| Adhesives, Sealants and Coatings |
32 | % | #1 | 34 | % | 1.9X | 5.9 | % | Tapes and labels Non-woven and industrial adhesives Industrial and consumer weather sealants | ||||||
| Paving and Roofing |
26 | % | #1 | 24 | % | 1.6X | 6.5 | % | Asphalt modification for performance roadways Asphalt modification for roofing felts and shingles | ||||||
| Emerging Businesses (5) |
7 | % | N/A | N/A | N/A | 26.8 | % | Surgical gloves Condoms | |||||||
| Other Markets (6) |
4 | % | N/A | N/A | N/A | N/A | Lubricants and fuel additives High styrenics packaging Footwear | ||||||||
5
Table of Contents
| (1) | Based on 2009 sales of $920.4 million (excludes by-product sales which are reported as other revenues). |
| (2) | Management estimates, based on 2009 sales. |
| (3) | Management estimates, versus next largest competitor based on 2009 sales. |
| (4) | Management estimates of volume growth, 2001 to 2009, except for Emerging Businesses, which is 2005 to 2009. |
| (5) | The Emerging Businesses end use market includes our IR and IRL business. We believe that we are the only major third-party supplier of IR and IRL, and therefore end use market position, end use market share and relative end use market share metrics are not meaningful. |
| (6) | Our Other Markets end use market is not directly comparable to our four core end use markets because it includes a mix of products ranging from lubricants and fuel additives to high styrenics packaging to footwear products. Therefore, we cannot estimate end use market position, end use market share, relative end use market share or industry compound annual growth rate. |
Our Competitive Strengths
We believe the following competitive strengths help us to sustain our market leadership position and contribute to our ability to generate superior margins and strong cash flow. We expect these strengths to support our growth in the future:
The Market Leader in SBCs
We believe we hold the number one global market position, based on 2009 sales revenue, in each of our four core end use markets, with sales of approximately $920.4 million and sales volumes of approximately 260.3 kilotons, excluding by-products, for the year ended December 31, 2009. We generated approximately 96% of our 2009 product sales revenues in our four core end use markets. Our Belpre, Ohio facility is the most diversified SBC plant in the world, and we believe our Wesseling, Germany, facility is world scale and cost efficient. As the pioneer of SBCs almost 50 years ago, we believe our Kraton® brand is widely recognized for our industry leadership, and we are particularly well regarded for our process technology expertise and long track record of market-driven innovation.
Growth Through Innovation and Technological Know-how
SBC production and product development requires complex and specific expertise, which we believe many of our competitors are unable to replicate. As the industry pioneer, Kraton maintains a constant focus on enhancing the value-added attributes of our products and on developing new applications for SBCs. At December 31, 2009, we had approximately 1,000 granted patents and approximately 381 pending patent applications. Our “Vision 20/20” program targets generating 20% of sales revenues from new products or applications introduced in the prior five years. In 2009, we generated 12.4% of our sales from innovation driven revenue. We believe that our new product innovation will allow us to drive increases in our volume, expand unit contribution margins (the excess of the sale price of a unit of product over the variable cost to produce that unit) and increase our customers’ reliance on Kraton’s products and technical expertise. For example, for the twelve months ended December 31, 2009, our Emerging Businesses end use market, which includes IR and IRL, represented 7.0% of sales revenues. Furthermore, our IRL business has grown at a compound annual growth rate of 28.8%, based on sales revenue, from 2007 to 2009 and is earning a unit contribution margin in excess of the company as a whole.
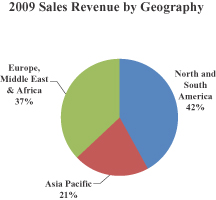
Diverse Global Manufacturing Capabilities and End Use Market Exposures
We manufacture our polymers at five manufacturing facilities on four continents (North America, Europe, South America and Asia) producing what we believe to be the highest quality grades available of USBCs; HSBCs and high purity IRL. We believe we are the only SBC producer with this breadth of technical capabilities and global footprint, selling approximately 800 products to more than 700 customers in over 60 countries
6
Table of Contents
worldwide. Since 2003, we have successfully completed plant expansions totaling 60 kilotons of capacity at a total cost of less than $50 million, giving us a total capacity of approximately 420 kilotons. Our manufacturing and product footprint allow revenue diversity, both geographically and by end use market. We believe our scale and footprint make us an attractive customer for our monomer suppliers, which in turn, allows us to offer a high degree of supply security to customers.
|
|
Source: Management Estimates
Long-Standing, Strong Customer Relationships Supported by Leading Service-Offering
We sell our products to over 700 customers, many of which we have had relationships with for 15 years or more. Our customers are broad-based, with no single customer accounting for more than 5% of our sales revenue in 2009. Our top 10 customers represented 26% of sales revenue in 2009. Our customers’ manufacturing processes are typically calibrated to the performance specifications of our products. Given the technical expertise and investment required to develop these formulations and the lead times required to replace them, we believe our customers face high switching costs. We believe our customers view our products as being high value-added, even though our products generally represent a small proportion of the overall cost of the finished product. Leveraging our global infrastructure, we believe we offer our customers a best-in-class service level that aligns us to their respective business models, through “on demand” order delivery and product development specifically designed for each customer’s needs.
Experienced Management Team with a Track Record of Growth and Productivity Improvements
Our senior management team has an average industry experience of approximately 25 years, most of which has been with some of the world’s leading companies, including General Electric, Koch Industries and Chevron Phillips Chemical. Since early 2008, when the current executive team was put in place, we have instituted a number of strategic initiatives designed to enhance productivity, reduce costs and capital intensity, expand margins and drive innovation-led growth.
Our Business Strategy
Building on these competitive strengths, we are focused on achieving profitable top-line growth and improving margins through the introduction of highly-engineered, high value-added products to drive strong and sustainable cash flow.
7
Table of Contents
Drive Growth and Margin Expansion Through Innovation
We have an almost 50-year track record of innovation dating back to our development of the first SBCs. Our research and development effort is focused on end use markets and new product developments that we believe offer high growth as well as opportunities to develop highly-differentiated products for our customers, thus yielding higher margin potential. We work very closely with our longstanding customer base to produce products that address their specific technical requirements. For example, to address an industry trend to provide an alternative to PVC in applications such as medical packaging and wire and cable, we have developed and commercialized a series of custom-designed polymers and compounds. In addition to this innovation-led growth, we believe that there are a number of end use market dynamics that will also drive growth in our business such as the general demand by customers for higher value-added product performance characteristics.
Pursue “Smart Pricing”
In late 2007, we undertook a comprehensive review of our entire product portfolio, including both product-specific and customer-specific profitability analyses. As a result, we took a variety of actions including reducing or eliminating our exposure to lower margin business and increasing our prices to reflect the significant value-added benefits of our products to our customers’ products. For example, since the end of 2007, we have increased our unit contribution margins by approximately 50%. We will continue to pursue pricing strategies that reflect the contribution to the end product of our high value and complex product offerings for which limited substitutes exist.
Invest in Key Growth Initiatives
We expect 2010 capital expenditures will be approximately $50.0 million to $55.0 million. Included in our 2010 capital expenditure estimate is approximately $9.0 million for the second phase of the Belpre systems and control upgrades, approximately $11.0 million to replace IR production from our Pernis facility, approximately $6.0 million for the IRL expansion and approximately $5.0 million for building upgrades at our Belpre facility. Through the six months ended June 30, 2010, capital expenditures were $19.4 million.
Continue to Pursue Operational Efficiencies
We have a history of implementing continuous process and cost improvement plans that have resulted in a significant reduction in our cost position and an improvement in the way we run our business. Since the beginning of 2007, we have implemented cost saving initiatives that have reduced costs by over $55 million, on an annual basis. In addition, as of December 31, 2009 we shut down IR production in our Pernis facility, which we expect will result in annual cost savings of approximately $12.0 million beginning in January 2010. Through these actions, we have created substantial operating leverage in our business model. We believe this demonstrates our management team’s ability to successfully manage the business in a downturn and position us for significant growth and margin expansion in a global economic recovery. For a discussion of the costs associated with the Pernis exit, see “Management’s Discussion and Analysis of Financial Condition and Results of Operations—Recent Developments.”
Recent Developments
Project Assessment Underway for Additional HSBC Capacity in Asia. As a result of growth in Kraton’s differentiated grades of HSBCs globally, we see the need for additional manufacturing capacity. We are continuing to expand and strengthen our presence in Asia, and thus we believe Kraton’s regional, and global, business would benefit from such increased capacity. By committing the necessary resources, technology and capital, this would represent the next logical step to grow our position in the Asia Pacific region, in support of application and technology developments for Kraton’s leading, proprietary, SBC formulations. The anticipated 30 kiloton HSBC
8
Table of Contents
manufacturing facility would employ Kraton’s latest state-of-the-art technology for producing HSBCs and, we believe will set a new global standard for manufacturing cost and product quality, further demonstrating our commitment to our business, the region, and our customers. Our site-selection team is expected to make its recommendation to management by December 2010 by which time we will be in a better position to render a final project decision. While it is too early to estimate the expected cost of the new facility, we anticipate that construction could commence in the first half of 2012 with start-up occurring as early as the second half of 2013.
Shanghai Office. We have relocated our Shanghai office to a facility that is double the size of the previous location, in order to better accommodate our ongoing increase in staff and in-house capabilities. Our Shanghai staff has nearly doubled since 2006. The new facility also includes a multi-functional customer service center and a dedicated training facility.
New Innovation. In August 2010, we announced that our roof coating formulation containing Kraton G1643 exceeds requirements of the ASTM International D6083 standard specification that is recognized in the elastomeric roof coating market. ASTM International D6083 is an industry standard that establishes minimum performance levels in the following areas: viscosity, weight and volume solids; mechanical properties; adhesion; low temperature flexibility after accelerated weathering; tear resistance; permeation and water swelling; and fungi resistance. This gives innovators an opportunity to more effectively compare a polymer against other polymers for use in roof coating formulations. This SBC-based polymer has a proven track record of improving the performance of roof coatings because it adds superior water resistance, improved adhesion, and increased elongation to formulations. It can be used to help lower volatile organic compounds (VOCs) in a solvented formulation, which have significant vapor pressures that can affect the environment and human health. In addition, our tested formulation can be used under the EPA’s regulation for thermoplastic rubber coatings and mastic. A roof coating formulation containing Kraton G1643 can reduce the total cost of installation and provide fast cure coatings that will work better in cold, humid or wet conditions. Elastomeric roof coatings made with Kraton polymers will stand up better to ponding water, and provide excellent adhesion to all types of roofing substrates. Roof coatings made with Kraton G1643 are an excellent choice for low slope roofs, or high traffic areas, and will provide excellent reflectance to reduce energy costs and extend the life of a roof.
In July 2010, we announced the addition of Kraton D1183 BT, a new SIS grade, to our line of polymers for use in applications where softness, ease-in-processing and high temperature resistance are essential. Kraton D1183 BT is suitable for use in many adhesive applications including thermal printing labels, high temperature resistant labels, elastic labels and diaper tabs. It is an excellent choice for adhesives in hygiene applications and its shear strength is particularly good at 37 degrees Celsius. Moreover, it offers economically attractive adhesive formulations, and gives formulators the ability to dilute it further to obtain the equivalent performance levels of competing products, which can result in cost-savings. It can also achieve significantly higher cohesive strength and higher temperature resistance without the use of expensive endblock resins. Therefore, Kraton D1183 BT is not only economically attractive, but also substantially stronger and offers a wider formulating space. Prior to the commercialization of Kraton D1183 BT, innovators used low-coupled SIS block copolymers to impart softness to end-products. Although they offered improved adhesion on open and porous substrates and good label die-cutting performance, they often lacked cohesion, which hampered their use in applications where higher shear and temperature resistance were required. In comparison, Kraton D1183 BT is a 40% diblock SIS, which shows superior performance to low-coupled SIS block copolymers and is therefore the polymer of choice for these applications.
In May 2010, we announced the addition of Kraton DX405 to our product line of polymers for Adhesives, Sealants, and Coatings. This technology will allow our customers to more efficiently and expediently manufacture products that are stronger and softer. DX405 has a low styrene content, which promotes ease of processing, low viscosity, and the attainment of lower application temperatures. This adds efficiency and
9
Table of Contents
simplification to the manufacturing process, which shortens batch times, increases extrusion rates and improves productivity. DX405 has a wide formulation window and its versatility makes it suitable for solvent-based compositions, hot melt adhesives, and sealant applications. It can be formulated with other polymers, resins, fillers, pigments, oils, thickeners, waxes and stabilizers to obtain a desired balance of properties.
Polyisoprene Rubber Manufacturing at Belpre, Ohio. We plan to invest approximately $27.0 million in our Belpre, Ohio facility to enable production of IR. We will convert existing USBC capacity to allow us to swing production from USBC products to the production of IR. Plant modifications and upgrades commenced in the third quarter of 2010 with the new IR production capabilities expected to be completed by mid-2011.
Isoprene Rubber Latex Capacity Expansion at Paulinia, Brazil. We plan to invest approximately $10.0 million to debottleneck and expand IRL capacity at our Paulinia, Brazil, facility. We commenced spending on this initiative in the third quarter of 2010 with the project expected to be completed by mid-2011. When combined with the capacity that is contractually available to us at a third party site in Japan, this debottlenecking project will represent an estimated 33% increase in our total IRL capacity.
European Office Consolidation. We are consolidating our transactional functions as well as much of our European management to a new European central office in Amsterdam, the Netherlands. We believe that with this initiative we will achieve greater operating efficiency as well as service improvements by consolidating core competencies and further exploiting the advantages of our new global ERP system rolled out in 2009. We anticipate minimal impact on existing customer relationships and no interruption in customer service during the gradual implementation of this transition plan. We expect to incur approximately $5.0 million to $6.0 million of restructuring costs, largely in the second half of 2010 as a result of this consolidation. We expect operating cost reductions of more than $2.0 million on an annual basis starting in 2012 as a result of this consolidation.
Corporate and Other Information
We conduct our business through a Delaware limited liability company, Kraton Polymers LLC (“Kraton”), and its consolidated subsidiaries. Prior to our initial public offering, Kraton’s parent company was Polymer Holdings LLC, a Delaware limited liability company. On December 16, 2009, Polymer Holdings LLC, or Polymer Holdings, was converted from a Delaware limited liability company to a Delaware corporation and renamed Kraton Performance Polymers, Inc., which remains Kraton’s parent company. Trading in our common stock on the New York Stock Exchange commenced on December 17, 2009 under the symbol “KRA.” On December 22, 2009, we completed our initial public offering.
Our principal executive offices are located at 15710 John F. Kennedy Boulevard, Suite 300, Houston, Texas 77032, and our telephone number is (281) 504-4700. Our corporate web site address is www.kraton.com. We do not incorporate the information contained on, or accessible through, our corporate web site into this prospectus, and you should not consider it part of this prospectus.
Principal Stockholders
Prior to this offering, certain affiliates of TPG Capital, L.P., which we refer to collectively as “TPG,” owned approximately 36.90% of our common stock and certain affiliates of J.P. Morgan Partners, LLC, which we refer to collectively as “JPMP,” owned approximately 24.60% of our common stock. After the sale of our common stock by TPG and JPMP in this offering, TPG will own 21.52% of our common stock (approximately 19.21% pursuant to a full exercise of the underwriters’ over-allotment option) and JPMP will own 14.34% of our common stock (approximately 12.81% pursuant to a full exercise of the underwriters’ over-allotment option), and together TPG and JPMP will own approximately 35.86% of our common stock (approximately 32.02% pursuant to a full exercise of the underwriters’ over-allotment option).
10
Table of Contents
TPG Capital, L.P.
TPG is a leading private investment firm with approximately $47 billion of assets under management as of June 30, 2010. The firm was founded in 1992 and is led by David Bonderman and James G. Coulter. Through its global buyout platform, TPG Capital, the firm generally makes significant investments in companies through acquisitions and restructurings across a broad range of industries throughout North America, Europe, Asia and Australia. Notable investments include Alltel Corp., Avaya, Inc., Burger King Holdings, Inc., Continental Airlines, Inc., Energy Future Holdings Corp. (formerly, TXU Corp.), Graphic Packaging International Corp., Grohe AG, Harrah’s Entertainment, Inc., J Crew Group, Inc., Neiman Marcus Group, Inc., ON Semiconductor Corp., Seagate Technology, Shenzhen Development Bank Co., Ltd. and Texas Genco, LLC.
J.P. Morgan Partners
J.P. Morgan Partners, LLC is a private equity division of JPMorgan Chase & Co. (NYSE: JPM), one of the largest financial institutions in the United States. JPMP has invested over $15 billion worldwide in industrial, consumer, media, energy, financial services, healthcare and technology companies since its inception in 1984. In August 2006, the buyout and growth equity investment professionals of JPMP separated from JPMorgan Chase & Co. and formed CCMP Capital Advisors, LLC, or CCMP Capital, a global private equity firm specializing in buyout and growth equity investments. CCMP Capital has offices in New York, Texas and London. CCMP Capital advises JPMP on its portfolio of private equity investments, including the investment in our company; other notable investments include AMC Entertainment, Inc., Aramark Holdings Corporation, Grupo Corporative Ono, S.A., Jetro JMDH Holdings, Inc., Noble Environmental Power, LLC, QCE Holdings, LLC (Quiznos Sub), Warner Chilcott Holdings Co. and PQ Corporation.
11
Table of Contents
The Offering
| Common stock offered by the selling stockholders |
8,000,000 shares. |
| Use of proceeds |
The selling stockholders will receive all of the proceeds from this offering and we will not receive any proceeds from the sale of shares in this offering. |
| Principal and selling stockholders |
TPG and JPMP are our principal stockholders and the only selling stockholders in this offering. Upon completion of this offering, TPG will own 21.52% of our common stock and JPMP will own 14.34% of our common stock. Together, TPG and JPMP will own approximately 35.86% of our common stock. See “Principal and Selling Stockholders.” |
| Underwriters’ option to purchase additional shares |
The selling stockholders may sell up to 1,200,000 additional shares if the underwriters exercise their over-allotment option. |
| Dividend policy |
We have not previously declared or paid any dividends or distributions on our common stock. We currently expect to retain future earnings, if any, for use in the operation and expansion of our business and do not anticipate paying any cash dividends in the foreseeable future. We are currently prohibited from paying cash dividends on our common stock by the covenants in the senior secured credit facility and may be further restricted by the terms of future debt or preferred securities. See “Dividend Policy.” |
| Risk factors |
Investing in our common stock involves a high degree of risk. See “Risk Factors” for a discussion of factors you should carefully consider before deciding to invest in our common stock. |
| New York Stock Exchange symbol |
“KRA” |
Except as otherwise noted, all information in this prospectus:
| • | excludes 3,604,484 shares of common stock reserved for future issuance under the Polymer Holdings LLC 2009 Equity Incentive Plan; and |
| • | assumes the underwriters do not exercise their over-allotment option. |
12
Table of Contents
Summary of Consolidated Financial Information and Other Data
The table below sets forth our summary consolidated historical financial data for the periods indicated. The summary consolidated historical financial data presented below for the years ended December 31, 2009, 2008 and 2007 and as of December 31, 2009 and 2008 have been derived from our audited consolidated financial statements, which are included elsewhere in this prospectus. The summary consolidated historical financial data for the six months ended June 30, 2010 and 2009 and as of June 30, 2010 have been derived from our unaudited condensed consolidated financial statements, which are included elsewhere in this prospectus. The unaudited condensed consolidated financial statements include, in the opinion of management, all adjustments, consisting only of normal recurring adjustments, that management considers necessary for the fair presentation of the condensed consolidated financial information set forth in those statements. Results of operations for the interim periods are not necessarily indicative of the results that might be expected for any other interim period or for an entire year.
The summary consolidated financial information and other data presented below should be read in conjunction with the information contained in “Management’s Discussion and Analysis of Financial Condition and Results of Operations,” the audited consolidated financial statements and the notes thereto and the unaudited condensed consolidated financial statements and the notes thereto, which are included elsewhere in this prospectus.
| Year ended December 31, | Six months ended June 30, | |||||||||||||||||
| 2009 | 2008 | 2007 | 2010 | 2009 | ||||||||||||||
| (In thousands, except per share data) | (unaudited) | |||||||||||||||||
| Consolidated Statements of Operations Data: |
||||||||||||||||||
| Operating Revenues |
||||||||||||||||||
| Sales |
$ | 920,362 | $ | 1,171,253 | $ | 1,066,044 | $ | 604,818 | $ | 411,607 | ||||||||
| Other (1) |
47,642 | 54,780 | 23,543 | — | 17,172 | |||||||||||||
| Total operating revenues |
968,004 | 1,226,033 | 1,089,587 | 604,818 | 428,779 | |||||||||||||
| Cost of Goods Sold |
792,472 | 971,283 | 938,556 | 446,578 | 384,085 | |||||||||||||
| Gross Profit |
175,532 | 254,750 | 151,031 | 158,240 | 44,694 | |||||||||||||
| Operating Expenses |
||||||||||||||||||
| Research and development expenses |
21,212 | 27,049 | 24,865 | 11,556 | 10,040 | |||||||||||||
| Selling, general and administrative |
79,504 | 101,431 | 69,020 | 43,834 | 36,303 | |||||||||||||
| Depreciation and amortization of identifiable intangibles |
66,751 | 53,162 | 51,917 | 23,015 | 25,106 | |||||||||||||
| Total operating expenses |
167,467 | 181,642 | 145,802 | 78,405 | 71,449 | |||||||||||||
| Gain on Extinguishment of Debt |
23,831 | — | — | — | 23,831 | |||||||||||||
| Earnings of Unconsolidated Joint Venture (2) |
403 | 437 | 626 | 236 | 176 | |||||||||||||
| Interest Expense, Net |
33,956 | 36,695 | 43,484 | 12,336 | 16,738 | |||||||||||||
| Income (Loss) Before Income Taxes |
(1,657 | ) | 36,850 | (37,629 | ) | 67,735 | (19,486 | ) | ||||||||||
| Income Tax Expense (Benefit) |
(1,367 | ) | 8,431 | 6,120 | 9,345 | 1,160 | ||||||||||||
| Net Income (Loss) |
$ | (290 | ) | $ | 28,419 | $ | (43,749 | ) | $ | 58,390 | $ | (20,646 | ) | |||||
| Earnings (Loss) per common share (3) |
||||||||||||||||||
| Basic |
$ | (0.01 | ) | $ | 1.46 | $ | (2.26 | ) | $ | 1.90 | $ | (1.06 | ) | |||||
| Diluted |
$ | (0.01 | ) | $ | 1.46 | $ | (2.26 | ) | $ | 1.88 | $ | (1.06 | ) | |||||
| Weighted average common shares outstanding (3) |
||||||||||||||||||
| Basic |
19,844 | 19,406 | 19,375 | 30,751 | 19,409 | |||||||||||||
| Diluted |
19,844 | 19,483 | 19,375 | 31,023 | 19,409 | |||||||||||||
13
Table of Contents
| (1) | Other revenues include the sale of by-products generated in the production of polyisoprene rubber, or IR, and styrene-isoprene-styrene, or SIS. |
| (2) | Represents our 50% joint venture interest in Kraton JSR Elastomers K.K., which is accounted for using the equity method of accounting. |
| (3) | See Note 12 to our audited consolidated financial statements and Note 7 to our unaudited condensed consolidated financial statements, which are included elsewhere in this prospectus. |
| December 31, | June 30, 2010 | ||||||||
| 2009 | 2008 | ||||||||
| (In thousands) | (unaudited) | ||||||||
| Balance Sheet Data |
|||||||||
| Cash and cash equivalents |
$ | 69,291 | $ | 101,396 | $ | 39,405 | |||
| Total assets |
974,499 | 1,031,874 | 997,179 | ||||||
| Total debt |
$ | 384,979 | $ | 575,316 | $ | 383,827 | |||
| Fiscal Year | Six months ended June 30, | ||||||||||||||
| 2009 | 2008 | 2007 | 2010 | 2009 | |||||||||||
| (In thousands) | (unaudited) | ||||||||||||||
| Other Data |
|||||||||||||||
| EBITDA (1)(2) |
$ | 99,050 | $ | 126,707 | $ | 57,772 | $ | 103,086 | $ | 22,358 | |||||
| Adjusted EBITDA (3) |
91,359 | 152,048 | 68,310 | 105,647 | 3,189 | ||||||||||
| (1) | EBITDA represents net income before interest, taxes, depreciation and amortization. We present EBITDA because it is used by management to evaluate operating performance. We consider EBITDA an important supplemental measure of our performance and believe it is frequently used by investors and other interested parties in the evaluation of companies in our industry. |
| We also use EBITDA for the following purposes: a portion of our executive compensation plan is based on our EBITDA performance (with certain adjustments) and the senior secured credit facilities and the senior subordinated notes use EBITDA (with additional adjustments) to measure our compliance with covenants such as leverage and interest coverage ratios. |
| EBITDA has limitations as an analytical tool, and you should not consider it in isolation, or as a substitute for analysis of our results as reported under generally accepted accounting principles in the United States (“GAAP”). Some of these limitations are: |
| • | EBITDA does not reflect our cash expenditures, or future requirements for capital expenditures or contractual commitments; |
| • | EBITDA does not reflect changes in, or cash requirements for, our working capital needs; |
| • | EBITDA does not reflect the significant interest expense, or the cash requirements necessary to service interest or principal payments, on our debt; |
| • | although depreciation and amortization are non-cash charges, the assets being depreciated and amortized will often have to be replaced in the future, and EBITDA does not reflect any cash requirements for such replacements; and |
| • | other companies in our industry may calculate EBITDA differently than we do, limiting its usefulness as a comparative measure. |
| Because of these and other limitations, EBITDA should not be considered as a measure of discretionary cash available to us to invest in the growth of our business. We compensate for these limitations by relying primarily on our GAAP results and using EBITDA and Adjusted EBITDA only supplementally. See the condensed consolidated statements of cash flows included in the condensed consolidated financial statements included elsewhere in this prospectus. |
14
Table of Contents
| (2) | We reconcile Net Income/(Net Loss) to EBITDA as follows: |
| Fiscal Year | Six months ended June 30, | |||||||||||||||||
| 2009 | 2008 | 2007 | 2010 | 2009 | ||||||||||||||
| (In thousands) | ||||||||||||||||||
| Net Income/(Net Loss) |
$ | (290 | ) | $ | 28,419 | $ | (43,749 | ) | $ | 58,390 | $ | (20,646 | ) | |||||
| Add (deduct) |
||||||||||||||||||
| Interest expense, net |
33,956 | 36,695 | 43,484 | 12,336 | 16,738 | |||||||||||||
| Income tax expense (benefit) |
(1,367 | ) | 8,431 | 6,120 | 9,345 | 1,160 | ||||||||||||
| Depreciation and amortization expenses |
66,751 | 53,162 | 51,917 | 23,015 | 25,106 | |||||||||||||
| EBITDA (a) |
$ | 99,050 | $ | 126,707 | $ | 57,772 | 103,086 | 22,358 | ||||||||||
| (a) | EBITDA in fiscal year 2009 was negatively impacted by approximately $17.6 million due to the sale of inventory produced when raw material costs were higher than the then current replacement cost. Conversely, EBITDA in fiscal year 2008 was positively impacted by approximately $37.1 million due to the sale of inventory produced when raw material costs were lower than the then current replacement cost. |
| EBITDA in the six months ended June 30, 2010 was positively impacted by approximately $21.9 million due to the sale of inventory produced when raw material costs were lower than the then current replacement cost. Conversely, EBITDA in the six months ended June 30, 2009 was negatively impacted by approximately $43.6 million due to the sale of inventory produced when raw material costs were higher than the then current replacement cost. |
| (3) | We present Adjusted EBITDA as a further supplemental measure of our performance and because we believe these additional adjustments provide additional and helpful information to investors and other interested parties evaluating our performance. We prepare Adjusted EBITDA by adjusting EBITDA to eliminate the impact of a number of items we do not consider indicative of our ongoing operating performance. We explain how each adjustment is derived and why we believe it is helpful and appropriate in the subsequent footnotes. You are encouraged to evaluate each adjustment and the reasons we consider it appropriate for supplemental analysis. As an analytical tool, Adjusted EBITDA is subject to all the limitations applicable to EBITDA. In addition, in evaluating Adjusted EBITDA, you should be aware that in the future we may incur expenses similar to the adjustments in this presentation. Our presentation of Adjusted EBITDA should not be construed as an inference that our future results will be unaffected by unusual or non-recurring items. |
We further reconcile EBITDA to Adjusted EBITDA as follows:
| Fiscal Year | Six months ended June 30, | ||||||||||||||||
| 2009 | 2008 | 2007 | 2010 | 2009 | |||||||||||||
| (In thousands) | (unaudited) | ||||||||||||||||
| EBITDA (a) |
$ | 99,050 | $ | 126,707 | $ | 57,772 | $ | 103,086 | $ | 22,358 | |||||||
| Add (deduct): |
|||||||||||||||||
| Sponsor fees and expenses |
2,000 | 2,000 | 2,000 | — | 1,000 | ||||||||||||
| Restructuring and related charges (b) |
9,677 | 13,671 | 5,633 | 790 | 1,107 | ||||||||||||
| Other non-cash expenses (c) |
4,463 | 9,670 | 2,905 | 1,771 | 2,555 | ||||||||||||
| Gain on extinguishment of debt (d) |
(23,831 | ) | — | — | — | (23,831 | ) | ||||||||||
| Adjusted EBITDA (a) |
$ | 91,359 | $ | 152,048 | $ | 68,310 | $ | 105,647 | $ | 3,189 | |||||||
| (a) | EBITDA and Adjusted EBITDA in fiscal year 2009 were negatively impacted by approximately $17.6 million due to the sale of inventory produced when raw material costs were higher than the then current replacement cost. Conversely EBITDA and Adjusted EBITDA in fiscal year 2008 were positively impacted by approximately $37.1 million due to the sale of inventory produced when raw material costs were lower than the then current replacement cost. |
15
Table of Contents
| EBITDA and Adjusted EBITDA in the six months ended June 30, 2010 were positively impacted by approximately $21.9 million due to the sale of inventory produced when raw material costs were lower than the then current replacement cost. Conversely EBITDA and Adjusted EBITDA in the six months ended June 30, 2009 were negatively impacted by approximately $43.6 million due to the sale of inventory produced when raw material costs were higher than the then current replacement cost. |
| (b) | 2009 costs consist principally of the costs to exit our Pernis facility and the one-time cost to terminate the sponsor management fee arrangement; 2008 costs consist primarily of severance and retention costs associated with the restructuring of our Westhollow Technical Center and our research and technical services organizations, senior management changes in the first quarter and workforce reductions in the fourth quarter; and 2007 costs are primarily costs in connection with the shutdown of our SIS plant in Pernis. Costs for six months ended June 30, 2010 consist primarily of legal and consulting fees associated with the restructuring of our European organization. All periods, including six months ended June 30, 2009, reflect costs associated with evaluating merger and acquisition transactions and potential debt refinancing. |
| (c) | For 2009, 2008 and 2007, consists primarily of non-cash compensation, asset impairment charges and losses on the sale of fixed assets. For 2008 and 2009, also reflects the non-cash adjustment to lower inventory from first in first out cost to market value. For six months ended June 30, 2010 and 2009, consists primarily of non-cash compensation. For six months ended June 30, 2009, also reflects the non-cash inventory impairment to lower inventory from first-in first-out cost to market value and losses on the sale of fixed assets. |
| (d) | For 2009 and six months ended June 30, 2009, reflects the non-recurring cash gain related to the repurchases of bonds. |
| Restructuring and related charges discussed above were recorded in the Consolidated Statements of Operations, as follows. |
| Fiscal Year | Six months ended June 30, | ||||||||||||||
| 2009 | 2008 | 2007 | 2010 | 2009 | |||||||||||
| (In thousands) | |||||||||||||||
| Cost of goods sold |
$ | 6,747 | $ | 355 | $ | 2,438 | $ | — | $ | 200 | |||||
| Research and development |
$ | — | $ | 2,430 | $ | 345 | $ | — | $ | — | |||||
| Selling, general and administrative |
$ | 2,930 | $ | 10,886 | $ | 2,850 | $ | 790 | $ | 907 | |||||
| Total restructuring and related charges |
$ | 9,677 | $ | 13,671 | $ | 5,633 | $ | 790 | $ | 1,107 | |||||
16
Table of Contents
Buying shares of our common stock involves risk. You should consider carefully the risks and uncertainties described below, together with all of the other information in this prospectus, including the financial statements and the related notes included elsewhere in this prospectus, before deciding to purchase shares of our common stock.
Risk Factors Relating to our Business
Conditions in the global economy and capital markets may adversely affect the company’s results of operations, financial condition and cash flows.
Our products are sold in markets that are sensitive to changes in general economic conditions, such as automotive and construction products. Downturns in general economic conditions can cause fluctuations in demand for our products, product prices, volumes and margins. A decline in the demand for our products or a shift to lower-margin products due to deteriorating economic conditions could adversely affect sales of our products and our profitability and could also result in impairments of certain of our assets.
Our business and operating results were affected by the global recession, dislocations in the housing and commercial real estate markets, fluctuating commodity prices, volatile exchange rates and other challenges currently affecting the global economy and our customers. Although the effects of the global recession on our business appear to have eased, there can be no assurance that this trend will continue. If the global recession continues for significant future periods or significantly worsens, our results of operations, financial condition and cash flows could be materially adversely affected.
LyondellBasell Industries provides significant operating and other services under agreements that are important to our business. The failure of LyondellBasell to perform its obligations, or the termination of these agreements, could adversely affect our operations.
We have operating and service agreements with LyondellBasell Industries, or LyondellBasell, that are important to our business. We are a party to:
| • | operating agreements pursuant to which LyondellBasell (in Berre, France, and Wesseling, Germany) operate and maintain our European manufacturing facilities and employs and provides almost all of the staff for those facilities; |
| • | site services, utilities, materials and facilities agreements pursuant to which LyondellBasell provides utilities and site services to our European manufacturing facilities; and |
| • | lease agreements pursuant to which we lease our European manufacturing sites from LyondellBasell. |
In January 2009, the U.S. operations of LyondellBasell along with one of its European holding companies, Basell Germany Holdings GmbH, filed for voluntary reorganization under Chapter 11 of the U.S. Bankruptcy Code. Its Chapter 11 reorganization plan was confirmed by the bankruptcy court in April 2010, and LyondellBasell has emerged from bankruptcy. LyondellBasell is one of our major suppliers of raw materials and also operates our facilities at Berre, France, and Wesseling, Germany. LyondellBasell’s emergence from bankruptcy and any resulting restructuring of LyondellBasell’s operations could adversely affect LyondellBasell’s ability to provide services to us. To date, our operations have not been negatively impacted and we do not anticipate any such negative impact. However, we cannot predict the effect, if any, that LyondellBasell’s bankruptcy or emergence from bankruptcy will ultimately have upon our business in general, or our relationship with LyondellBasell in particular.
Under the terms of the above agreements, either party is permitted to terminate the applicable agreement in a variety of situations. Should LyondellBasell fail to provide these services or should any operating agreement be terminated, we would be forced to obtain these services from third parties or provide them ourselves. Similarly, if in connection with or independent from the termination of an operating agreement, LyondellBasell terminates a facility lease, we would be forced to relocate our manufacturing facility. From time to time, as part of our
17
Table of Contents
ongoing business operations, we discuss potential changes in the terms of our various agreements with LyondellBasell, based upon changes in market conditions or other factors. Any agreed changes to any of these contractual arrangements are not binding until the execution of formal documentation. The failure of LyondellBasell to perform its obligations under, or the termination of, any of these agreements could adversely affect our operations and, depending on market conditions at the time of any such termination, we may not be able to enter into substitute arrangements in a timely manner, or on terms as favorable to us.
Under certain of these agreements, we are required to indemnify LyondellBasell in certain circumstances, including in certain circumstances for loss and damages resulting from LyondellBasell’s negligence in performing their obligations.
The failure of our raw materials suppliers to perform their obligations under long-term supply agreements, or our inability to replace or renew these agreements when they expire, could increase our cost for these materials, interrupt production or otherwise adversely affect our results of operations.
Our manufacturing processes use three primary raw materials: styrene, butadiene and isoprene. We use styrene in the production of most of our polymer products. We use butadiene in the production of SBS (styrene-butadiene-styrene) grades of USBCs and SEBS (styrene-ethylene-butylene-styrene) grades of HSBCs. We use isoprene in the production of SIS (styrene-isoprene-styrene) grades of USBCs, SEPS (styrene-ethylene-propylene-styrene) grades of HSBCs and polyisoprene rubber, or IR. We have entered into long-term supply agreements with Shell Chemicals L.P., or Shell Chemicals, LyondellBasell and others to supply our raw material needs in the United States and Europe. As these contracts expire, we may be unable to renew these contracts or obtain new long-term supply agreements on terms favorable to us, which may significantly impact our operations.
Isoprene is primarily produced and consumed by manufacturers, captively for the production of IR, which is primarily used in the manufacture of rubber tires. As a result, there is limited non-captive isoprene available for purchase in the markets in which we operate. Future isoprene requirements for our IR products will be met by our overall isoprene sourcing strategies. We may not be able to obtain isoprene required for our operations on terms favorable to us or at all.
In addition, most of our long-term contracts contain provisions that allow our suppliers to limit the amount of raw materials shipped to us below the contracted amount in certain circumstances. During 2009, butadiene producers had limited supply at times due to raw material shortages and operational problems, and we have satisfied our butadiene needs by supplementing with spot market purchases. If we are required to obtain alternate sources for raw materials because a supplier is unwilling or unable to perform under raw material supply agreements or if a supplier terminates its agreements with us, we may not be able to obtain these raw materials from alternative suppliers in a timely manner or be able to enter into long-term supply agreements on terms as favorable to us. A lack of availability of raw materials could have an adverse effect on our results of operations.
If the availability of isoprene is limited, we may be unable to produce some of our products in quantities demanded by our customers, which could have an adverse effect on our sales of products requiring isoprene.
Isoprene is not widely available, and the few isoprene producers tend to use their production for captive manufacturing purposes or sell only limited quantities into the world chemicals market. The major producers of isoprene are Goodyear, Shell Chemicals L.P., Nippon Zeon, Braskem, several Chinese producers and various Russian manufacturers. Currently, we source our isoprene requirements for the United States and Europe from a portfolio of suppliers. In Japan, we obtain the majority of our isoprene requirements from JSR Corporation, or JSR, on a commercial supply basis and from alternative suppliers as needed. In Brazil, isoprene is obtained from a local third party supplier. These suppliers may not be able to meet our isoprene requirements, and we may not be able to obtain substitute supplies of isoprene from alternative suppliers in a timely manner or on favorable terms.
18
Table of Contents
Because there is limited non-captive isoprene availability, the market for isoprene is thin and prices are particularly volatile. Prices for isoprene are determined by the supply and prices of natural and synthetic rubber, crude oil and natural gas prices and existing supply and demand in the market. Market prices for isoprene increased significantly during the second half of 2008 as energy prices peaked in the third quarter. Following the collapse of energy prices in late 2008, isoprene pricing declined in the first quarter of 2009, increased during the second quarter of 2009, stabilized, then increased again in the fourth quarter of 2009. Isoprene pricing continued to increase through the first quarter of 2010 then leveled off in the second quarter of 2010.
In the past, a significant factor contributing to higher prices was the extreme tightness in the market caused by operational problems of some key producers and reduced availability of crude C5 inputs for the extraction units. Although improved producer operation mitigated this risk in 2008, weak ethylene demand and light (ethane versus naphtha) ethylene inputs have limited isoprene production for some of the suppliers. In addition to this limit due to ethylene inputs, operational problems could return in the future. A lack of availability of isoprene could have an adverse effect on our results of operations if we are unable to produce products containing isoprene.
If the availability of butadiene is limited, we may be unable to produce some of our products in quantities demanded by our customers, which could have an adverse effect on plant utilization and our sales of products requiring butadiene.
The North American market is structurally short of butadiene and has relied on imports of crude C4 and/or butadiene to balance demand. Historically, the European market has been better balanced and provided exports to North America. Currently, our butadiene requirements in the United States are satisfied by several suppliers, and LyondellBasell is our major butadiene supplier in Europe. In January 2009, the U.S. operations of LyondellBasell along with one of its European holding companies, Basell Germany Holdings GmbH, filed for voluntary reorganization under Chapter 11 of the U.S. Bankruptcy Code. Its Chapter 11 reorganization plan was confirmed by the bankruptcy court in April 2010, and LyondellBasell has emerged from bankruptcy. To date, LyondellBasell’s emergence from bankruptcy has not negatively impacted our supply of butadiene in Europe. The quantity of butadiene available in any one region is dependent on the cracking inputs of olefins plants, ethylene demand, inter-regional demand for butadiene and demand for other oil derivatives. Suppliers may not be able to meet our butadiene requirements, and we may not be able to obtain substitute supplies of butadiene from alternative suppliers in a timely manner or on favorable terms.
Increases in the costs of our raw materials could have an adverse effect on our financial condition and results of operations if those costs cannot be passed onto our customers.
Our results of operations are directly affected by the cost of our raw materials. Our three principal raw materials (styrene, butadiene, and isoprene) together represented approximately 43% and 54% of our total cost of goods sold in fiscal year 2009 and for the six months ended June 30, 2010, respectively. Because of the significant portion of our cost of goods sold represented by these three monomers, our gross profit and margins could be adversely affected by changes in the cost of these raw materials if we are unable to pass the increases on to our customers.
Our end use markets are highly competitive, and we may lose market share to other producers of styrenic block copolymers or to producers of other products that can be substituted for our products.
Our industry is highly competitive and we face significant competition from large international producers, as well as from smaller regional competitors. Our competitors may improve their competitive position in our core end use markets by successfully introducing new products, improving their manufacturing processes or expanding their capacity or manufacturing facilities. If we are unable to keep pace with our competitors’ product and manufacturing process innovations, our financial condition and results of operations could be materially adversely affected.
19
Table of Contents
Our most significant competitors are Asahi Chemical, Chi Mei, Dexco Polymers, Dynasol Elastomers, Korea Kumho P.C., Kuraray Company, Lee Chang Yung, LG Chemical, Polimeri Europa, Sinopec, Taiwan Synthetic Rubber Corporation and Zeon Corporation. Kuraray Company, Dynasol Elastomers, Korea Kumho P.C. and Sinopec have all expanded HSBC capacity over the last three years. Several competitors, including Dynasol, Lee Chang Yung and Sinopec, have expanded USBC capacity over the last three years.
In addition, competition between styrenic block copolymers and other products within the end use markets in which we compete is intense. Increased competition from existing or newly developed non-SBC products may reduce demand for our products in the future and our customers may decide on alternate sources to meet their requirements.
| • | In the Advanced Materials end use market, our products compete against a wide variety of chemical and non-chemical alternatives, including thermoplastic vulcanizates, ethylene propylene diene monomer rubber, known as EPDM, thermoplastic polyolefin elastomers and thermoplastic polyurethanes, known as TPUs. The choice between these materials is influenced by performance characteristics, ease of use, desired aesthetics and total end-product cost. In addition, competing materials include spandex, natural rubber, polyvinyl chloride polymers and compounds, polyolefins, polyethylene terephthalate, known as PET, nylon and polycarbonate, based on performance, ease of use, desired aesthetics and total end-product cost. |
| • | In the Adhesives, Sealants and Coatings end use market, SBC products primarily compete with acrylics, silicones, solvent-based rubber systems and thermoplastic polyolefin elastomers. The choice between these materials is influenced by bond strength, specific adhesion, consistent performance to specification, processing speed, hot-melt application, resistance to water and total end-product cost. |
| • | In the Paving and Roofing end use market, our products primarily compete with atactic polypropylene, styrene butadiene rubber and unmodified asphalts. The choice between these materials is influenced by total end-product performance, cost and ease of use. |
If we are unable to successfully compete with other producers of styrenic block copolymers or if other products can be successfully substituted for our products, our sales may decline.
If we are not able to continue the technological innovation and successful commercial introduction of new products, our customers may turn to other producers to meet their requirements.
Our industry and the end use markets into which we sell our products experience periodic technological change and ongoing product improvements.
In addition, our customers may introduce new generations of their own products or require new technological and increased performance specifications that would require us to develop customized products. Innovation or other changes in our customers’ product performance requirements may also adversely affect the demand for our products. Our future growth will depend on our ability to gauge the direction of the commercial and technological progress in all key end use markets, and upon our ability to successfully develop, manufacture and market products in such changing end use markets. We need to continue to identify, develop and market innovative products on a timely basis to replace existing products in order to maintain our profit margins and our competitive position. We may not be successful in developing new products and technology that successfully compete with such materials and our customers may not accept any of our new products. If we fail to keep pace with evolving technological innovations or fail to modify our products in response to our customers’ needs, then our business, financial condition and results of operations could be adversely affected as a result of reduced sales of our products.
Our business relies on intellectual property and other proprietary information, and our failure to protect our rights could harm our competitive advantages with respect to the manufacturing of some of our products.
Our success depends to a significant degree upon our ability to protect and preserve our intellectual property and other proprietary information of our business. However, we may be unable to prevent third parties from using our intellectual property and other proprietary information without our authorization or independently
20
Table of Contents
developing intellectual property and other proprietary information that is similar to ours, particularly in those countries where the laws do not protect our proprietary rights to the same degree as in the United States. The use of our intellectual property and other proprietary information by others could reduce or eliminate any competitive advantage we have developed, cause us to lose sales or otherwise harm our business. If it becomes necessary for us to litigate to protect these rights, any proceedings could be burdensome and costly, and we may not prevail. In addition, we acquired a significant number of patents from Shell Chemicals L.P., or Shell Chemicals. Pursuant to the agreements with Shell Chemicals relating to their contribution of these patents to us and our ownership of these patents, Shell Chemicals retained for itself fully-transferable and exclusive licenses to their use outside of the elastomers business, as well as fully-transferable non-exclusive licenses within the field of elastomers for certain limited uses in non-competing activities. Shell Chemicals is permitted to sublicense these rights. Shell Chemicals also retains the right to enforce these patents outside the elastomers field and recover any damages resulting from these actions.
Any patents, issued or applied for, may not provide us with any competitive advantage and may be challenged by third parties. Our competitors also may attempt to design around our patents or copy or otherwise obtain and use our intellectual property and other proprietary information. Moreover, our competitors may already hold or have applied for patents in the United States or abroad that, if enforced or issued, could possibly prevail over our patent rights or otherwise limit our ability to manufacture or sell one or more of our products in the United States or abroad. From time to time, we oppose the issuance of patent applications in the United States and other jurisdictions that we consider overbroad or otherwise invalid in order to maintain the necessary freedom to operate fully in our various business lines without the risk of being sued for patent infringement. In general, competitors or other parties may, from time to time, assert issued patents or other intellectual property rights against us. If we are legally determined, at some future date, to infringe or violate the intellectual property rights of another party, we may have to pay damages, stop the infringing use, or attempt to obtain a license agreement with the owner of such intellectual property. With respect to our pending patent applications, we may not be successful in securing patents for these claims. Our failure to secure these patents may limit our ability to protect inventions that these applications were intended to cover. In addition, the expiration of a patent can result in increased competition with consequent erosion of profit margins.
It is our policy to enter into confidentiality agreements with our employees and third parties to protect our unpatented proprietary manufacturing expertise, continuing technological innovation and other trade secrets, but our confidentiality agreements could be breached or may not provide meaningful protection for our trade secrets or proprietary manufacturing expertise. Adequate remedies may not be available in the event of an unauthorized use or disclosure of our trade secrets and manufacturing expertise. Violations by others of our confidentiality agreements and the loss of employees who have specialized knowledge and expertise could harm our competitive position and cause our sales and operating results to decline as a result of increased competition. In addition, others may obtain knowledge of our trade secrets through independent development or other access by legal means.
We have registered and applied for certain service marks and trademarks, and will continue to evaluate the registration of additional service marks and trademarks, as appropriate. The applicable governmental authorities may not approve our pending applications. A failure to obtain trademark registrations in the United States and in other countries could limit our ability to obtain and retain our trademarks and impede our marketing efforts in those jurisdictions. Moreover, third parties may seek to oppose our applications or otherwise challenge the resulting registrations. In the event that our trademarks are successfully challenged, we could be forced to rebrand our products, which could result in loss of brand recognition and could require us to devote resources to advertising and marketing new brands.
The failure of our patents, trademarks or confidentiality agreements to protect our intellectual property and other proprietary information, including our processes, apparatuses, technology, trade secrets, trade names and proprietary manufacturing expertise, methods and compounds, could have a material adverse effect on our competitive advantages over other producers.
21
Table of Contents
Our products may infringe the intellectual property rights of others, which may cause us to incur unexpected costs or prevent us from selling our products.
We continually seek to improve our business processes and develop new products and applications. Many of our competitors have a substantial amount of intellectual property that we must continually monitor to avoid infringement. Although it is our policy and intention not to infringe valid patents, we cannot guarantee that our processes and products do not and will not infringe issued patents (whether present or future) or other intellectual property rights belonging to others, including, without limitation, situations in which our products, processes or technologies may be covered by patent applications filed by other parties in the United States or abroad. From time to time, we oppose patent applications that we consider overbroad or otherwise invalid in order to maintain the necessary freedom to operate fully in our various business lines without the risk of being sued for patent infringement. If, however, patents are subsequently issued on any such applications by other parties, or if patents belonging to others already exist that cover our products, processes or technologies, we could, possibly, be liable for infringement or have to take other remedial or curative actions to continue our manufacturing and sales activities with respect to one or more products. We may also be subject to legal proceedings and claims in the ordinary course of our business, including claims of alleged infringement of the patents, trademarks and other intellectual property rights of third parties by us or our licensees in connection with their use of our products. Intellectual property litigation is expensive and time-consuming, regardless of the merits of any claim, and could divert our management’s attention from operating our business. If we were to discover that our processes, technologies or products infringe the valid intellectual property rights of others, we might need to obtain licenses from these parties or substantially re-engineer our products in order to avoid infringement. We may not be able to obtain the necessary licenses on acceptable terms, or at all, or be able to re-engineer our products successfully. Moreover, if we are sued for infringement and lose, we could be required to pay substantial damages and/or be enjoined from using or selling the infringing products or technology. Any of the foregoing could cause us to incur significant costs and prevent us from selling our products.
Our business is subject to seasonality that may affect our quarterly operating results and impact the market price of our common stock.
Seasonal changes and weather conditions typically affect the Paving and Roofing end use market. In particular, sales volumes for paving products generally rise in the warmer months and generally decline during the colder months of fall and winter. Roofing product sales volumes tend to be more consistent throughout the year. Abnormally cold or wet seasons may cause reduced purchases from our Paving and Roofing customers. However, because seasonal weather patterns are difficult to predict, we cannot accurately estimate fluctuations in our quarterly Paving and Roofing sales in any given year. If Paving and Roofing results cause our operating results to fall below the periodic expectations of financial analysts or investors, the market price of our common stock may decline.
Our substantial level of indebtedness could adversely affect our financial condition and prevent us from fulfilling our obligations under the senior secured credit facility and the senior subordinated notes.
We have substantial indebtedness. As of June 30, 2010, our total indebtedness was $383.8 million. Our indebtedness consists principally of the senior secured credit facility, which had $220.6 million outstanding as of June 30, 2010, and the 8.125% Senior Subordinated Notes due 2014, or the senior subordinated notes, which had $163.0 million outstanding as of June 30, 2010. The senior secured credit facility is payable in consecutive equal quarterly installments in an aggregate annual amount equal to 1.0% of the original principal amount and with the remaining balance payable in four equal quarterly installments commencing on September 30, 2012 and ending on May 12, 2013. The senior subordinated notes mature on January 14, 2014. In addition, subject to restrictions in the senior secured credit facility and the indenture governing the senior subordinated notes, Kraton and its subsidiaries may incur additional indebtedness.
As a result of our substantial indebtedness:
| • | our ability to obtain additional financing for working capital, capital expenditures, debt service requirements or other general corporate purposes may be impaired; |
22
Table of Contents
| • | we must use a substantial portion of our cash flow to pay principal of and interest on our indebtedness which will reduce the funds available to us for other purposes; |
| • | we are more vulnerable to economic downturns and adverse industry conditions; |
| • | our ability to capitalize on business opportunities and to react to competitive pressures, as compared to our competitors, may be compromised; and |
| • | our ability to borrow additional funds or to refinance indebtedness may be limited. |
The ability for us to pay principal of and interest on indebtedness, fund working capital, and make anticipated capital expenditures depends on our future performance, which is subject to general economic conditions and other factors, some of which are beyond our control. There can be no assurance that our business will generate sufficient cash flow from operations or that future borrowings will be available under the senior secured revolving credit facility to fund liquidity needs in an amount sufficient to enable us to service indebtedness. Furthermore, if we decide to undertake additional investments in existing or new facilities, this will likely require additional capital, and there can be no assurance that this capital will be available.
Our debt instruments, including the senior secured credit facility and the indenture governing the senior subordinated notes, impose significant operating and financial restrictions on us.
The senior secured credit facility and the indenture governing the senior subordinated notes impose significant operating and financial restrictions on us. These restrictions limit our ability, the ability of Kraton and the ability of its subsidiaries to, among other things:
| • | incur additional indebtedness; |
| • | pay dividends or make certain other restricted payments and investments; |
| • | create liens or other encumbrances; and |
| • | transfer or sell certain assets or merge or consolidate with another entity. |
These restrictions could limit our ability to plan for or react to market conditions or meet extraordinary capital needs or otherwise restrict corporate activities. Our ability to comply with these covenants may be affected by events beyond our control, and any material deviations from our forecasts could require us to seek waivers or amendments of covenants, alternative sources of financing or reductions in expenditures. We may not be able to obtain such waivers, amendments or alternative financings, or if we obtain them, they may not be on terms acceptable to us.
A deterioration in our results of operations may cause us not to be in compliance with the financial covenants in the senior secured credit facility. Under the terms of the senior secured credit facility, as amended, we are subject to certain financial covenants, including maintenance of a minimum interest rate coverage ratio and a maximum leverage ratio. Our ability to continue to comply with the financial ratios is subject to changes in our results of operations and financial position including but not limited to: the prices for raw materials; the sales of products; our ability to successfully implement selected selling price increases; our ability to reduce costs; and our availability of cash to reduce existing indebtedness. We generated a net loss of $0.3 million, net income of $28.4 million and a net loss of $43.7 million for the years ended December 31, 2009, 2008 and 2007, respectively. For the six months ended June 30, 2010, we generated net income of $58.4 million. Our earnings were insufficient to cover our fixed charges for the year ended December 31, 2007 by approximately $37.6 million. As of June 30, 2010, we were in compliance with the applicable financial ratios in the senior secured credit facility. We may not be able to maintain these ratios or avail ourselves of the equity cure provisions of the senior secured credit facility in future periods.
A breach of any of the covenants or restrictions contained in any of our existing or future financing agreements and instruments, including our inability to comply with the required financial covenants in the senior
23
Table of Contents
secured credit facility, could result in an event of default under those agreements. In addition, under the senior credit facility, an event of default would result upon the occurrence of a “change of control.” A “change of control” is defined to include, once TPG and JPMP and their affiliates collectively own capital stock representing less than 35% of the voting power represented by our issued and outstanding capital stock, the acquisition by any person or group of an equal or greater percentage of our voting power. Such a default could allow the lenders under our financing agreements to discontinue lending, to accelerate the related debt and to declare all borrowings outstanding thereunder to be due and payable. In addition, the lenders could terminate any commitments they had made to supply us with further funds.
We may be liable for damages based on product liability claims brought against our customers in our end use markets.
Many of our products provide critical performance attributes to our customers’ products that are sold to consumers who could potentially bring product liability suits in which we could be named as a defendant. The sale of these products involves the risk of product liability claims. If a person were to bring a product liability suit against one of our customers, this customer may attempt to seek contribution from us. A person may also bring a product liability claim directly against us. A successful product liability claim or series of claims against us in excess of our insurance coverage for payments, for which we are not otherwise indemnified, could have a material adverse effect on our financial condition or results of operations. While we endeavor to protect ourselves from such claims and exposures in our contractual negotiations, there can be no assurance that our efforts in this regard will ultimately protect us from any such claims.
As a global business, we are exposed to local business risks in different countries, which could have a material adverse effect on our financial condition or results of operations.
We have significant operations in foreign countries, including manufacturing facilities, research and development facilities, sales personnel and customer support operations. Currently, we operate, or others operate on our behalf, facilities in Brazil, Germany, France and Japan, in addition to our operations in the United States. Our offshore operations are subject to risks inherent in doing business in foreign countries, including, but not necessarily limited to:
| • | new and different legal and regulatory requirements in local jurisdictions; |
| • | export duties or import quotas; |
| • | domestic and foreign customs and tariffs or other trade barriers; |
| • | potential staffing difficulties and labor disputes; |
| • | managing and obtaining support and distribution for local operations; |
| • | increased costs of transportation or shipping; |
| • | credit risk and financial conditions of local customers and distributors; |
| • | potential difficulties in protecting intellectual property; |
| • | risk of nationalization of private enterprises by foreign governments; |
| • | potential imposition of restrictions on investments; |
| • | potentially adverse tax consequences, including imposition or increase of withholding and other taxes on remittances and other payments by subsidiaries; |
| • | foreign currency exchange restrictions and fluctuations; and |
| • | local political and social conditions, including the possibility of hyperinflationary conditions and political instability in certain countries. |
24
Table of Contents
We may not be successful in developing and implementing policies and strategies to address the foregoing factors in a timely and effective manner at each location where we do business. Consequently, the occurrence of one or more of the foregoing factors could have a material adverse effect on our international operations or upon our financial condition and results of operations.
Chemical manufacturing is inherently hazardous, which could result in accidents that disrupt our operations or expose us to significant losses or liabilities.
The hazards associated with chemical manufacturing and the related storage and transportation of raw materials, products and wastes exist in our operations and the operations of other occupants with whom we share manufacturing sites. These hazards could lead to an interruption or suspension of operations and have an adverse effect on the productivity and profitability of a particular manufacturing facility or on us as a whole. These potential risks include, but are not necessarily limited to:
| • | pipeline and storage tank leaks and ruptures; |
| • | explosions and fires; |
| • | inclement weather and natural disasters; |
| • | terrorist attacks; |
| • | mechanical failure; and |
| • | chemical spills and other discharges or releases of toxic or hazardous substances or gases. |
These hazards may result in personal injury and loss of life, damage to property and contamination of the environment, which may result in a suspension of operations and the imposition of civil or criminal penalties, including governmental fines, expenses for remediation and claims brought by governmental entities or third parties. The loss or shutdown of operations over an extended period at our Belpre facility, which is our largest manufacturing facility, or any of our other major operating facilities could have a material adverse effect on our financial condition and results of operations. Although we maintain property, business interruption and casualty insurance of the types and in the amounts that we believe are customary for the industry, we are not fully insured against all potential hazards incidental to our business.
Regulation of our employees’ exposure to butadiene could require material expenditures or changes in our operations.
Butadiene is a known carcinogen in laboratory animals at high doses and is being studied for its potential adverse health effects. The Occupational Safety and Health Administration limits the permissible employee exposure to butadiene. Future studies on the health effects of butadiene may result in additional regulations or new regulations in Europe that further restrict or prohibit the use of, and exposure to, butadiene. Additional regulation of butadiene could require us to change our operations, and these changes could affect the quality of our products and materially increase our costs.
Compliance with extensive environmental, health and safety laws could require material expenditures, changes in our operations or site remediation.
Materials such as styrene, butadiene and isoprene, which are used in the manufacture of our products, can represent potentially significant health and safety concerns. Our products are also used in a variety of end uses that have specific regulatory requirements such as those relating to products that have contact with food or medical end uses.
We use large quantities of hazardous substances and generate hazardous wastes in our manufacturing operations. Consequently, our operations are subject to extensive environmental, health and safety laws and regulations at both the national and local level in multiple jurisdictions. Many of these laws and regulations have become more stringent over time and the costs of compliance with these requirements may increase, including
25
Table of Contents
costs associated with any necessary capital investments. In addition, our production facilities require operating permits that are subject to renewal and, in some circumstances, revocation. The necessary permits may not be issued or continue in effect, and any issued permits may contain significant new requirements. The nature of the chemical industry exposes us to risks of liability due to the use, production, management, storage, transportation and sale of materials that are heavily regulated or hazardous and can cause contamination or personal injury or damage if released into the environment.
We operate coal-burning boilers at our facility in the United States that could be subject to legislation and regulation affecting the emissions of greenhouse gases. We may be required to incur capital investments to upgrade our coal-burning boiler operations to comply with reasonably likely future greenhouse gas emissions controls. While the impact of any such legislation or regulation is currently speculative, any such legislation or regulation, if enacted, may have an adverse effect on our operations or financial condition.
We have health and safety management programs in place to help assure compliance with applicable regulatory requirements and with internal policies and procedures, as appropriate. Each facility has developed and implemented specific critical occupational health, safety, environmental and loss control programs.
Compliance with environmental laws generally increases the costs of transportation and storage of raw materials and finished products, as well as the costs of storage and disposal of wastes. We may incur substantial costs, including fines, damages, criminal or civil sanctions and remediation costs, or experience interruptions in our operations for violations arising under these laws or permit requirements.
Management at our facility at Belpre, Ohio has identified several occupied buildings that are closer to the manufacturing process than would be consistent with industry guidelines. A $7.6 million project is underway to relocate the buildings with the highest risk, and is expected to be completed by October 31, 2010. A second project to relocate the remaining buildings is expected to be complete in 2012. The cost for these relocations is included in our projected future capital expenditures. However, such costs may vary with changes in regulations or risk management strategy.
We may be subject to losses due to lawsuits arising out of environmental damage or personal injuries associated with chemical manufacturing.
We face the risk that individuals could, in the future, seek damages for personal injury due to exposure to chemicals at our facilities or to chemicals otherwise owned or controlled by us. We may be subject to future claims with respect to workplace exposure, workers’ compensation and other matters that are filed after the date of our acquisition of Shell Chemicals’ elastomers business. While Shell Chemicals has agreed to indemnify us for certain claims brought with respect to matters occurring before our separation from Shell Chemicals in February 2001, those indemnity obligations are subject to limitations, and we cannot be certain that those indemnities will be sufficient to satisfy claims against us. In addition, we face the risk that future claims would fall outside of the scope of the indemnity due either to the limitations on the indemnity or to their arising from events and circumstances occurring after February 2001.
Some environmental laws could impose on us the entire cost of clean-up of contamination present at a facility even though we did not cause the contamination. These laws often identify the site owner as one of the parties that can be jointly and severally liable for on-site remediation, regardless of fault or whether the original activity was legal at the time it occurred. For example, our Belpre, Ohio, facility is the subject of a required remediation program to clean up past contamination at the site and at an adjacent creek and we are a party to that site clean-up order. While Shell Chemicals has posted financial assurance of $5.2 million for this program and has taken the lead in implementing the program, we may incur costs and be required to take action under this program. Similarly, the Shell Chemicals indemnity for remediation at the Belpre facility may not cover all claims that might be brought against us.
Our Paulinia, Brazil, facility also has on-site contamination resulting from past operations of Shell Chemicals. The indemnity from Shell Chemicals covers claims related to certain specified areas within the plant,
26
Table of Contents
and we may be required to undertake and pay for remediation of these and other areas. The indemnity coverage from Shell Chemicals is limited in time and amount and we cannot rely upon it to cover possible future claims for on-site contamination separate from the areas specified in the indemnity. The Paulinia facility is also adjacent to a former Shell Chemicals site where we believe past manufacturing of hydrocarbons resulted in significant contamination of soil and groundwater and required relocation of nearby residents. It is our understanding that the Shell Chemicals portion of the site has changed ownership several times, which may impact financial responsibility for contamination on the site. While we are not aware of any significant contamination at our Paulinia facility, we could potentially be the subject of claims related to pesticide contamination and effects at some point in the future.
In general, there is always the possibility that a third-party plaintiff or claimant, or governmental or regulatory authority, could seek to include us in an action or claim for damages, clean-up, or remediation pertaining to events or circumstances occurring or existing at one or more of our sites prior to the time of our ownership or occupation of the applicable site. In the event that any of these actions or claims were asserted against us, our results of operations could be adversely affected.
Regulatory and statutory changes applicable to us or our customers could adversely affect our financial condition and results of operations.
We and many of the applications for the products in the end use markets in which we sell our products are regulated by various national and local rules, laws and regulations. Changes in any of these areas could result in additional compliance costs, seizures, confiscations, recall or monetary fines, any of which could prevent or inhibit the development, distribution and sale of our products. For example, changes in environmental regulations restricting the use of disposable diapers could cause a decline in sales to producers of that product. In addition, we benefit from certain trade protections, including anti-dumping protection. If we were to lose these protections, our results of operations could be adversely affected.
We are subject to customs, international trade, export control, antitrust, zoning and occupancy and labor and employment laws that could require us to modify our current business practices and incur increased costs.
We are subject to numerous regulations, including customs and international trade laws, export control, antitrust laws and zoning and occupancy laws that regulate manufacturers generally and/or govern the importation, promotion and sale of our products, the operation of factories and warehouse facilities and our relationship with our customers, suppliers and competitors. If these regulations were to change or were violated by our management, employees, suppliers, buying agents or trading companies, the costs of certain goods could increase, or we could experience delays in shipments of our goods, be subject to fines or penalties, or suffer reputational harm, which could reduce demand for our products and hurt our business and negatively impact results of operations. In addition, changes in federal and state minimum wage laws and other laws relating to employee benefits could cause us to incur additional wage and benefits costs, which could negatively impact our profitability.
Legal requirements are frequently changed and subject to interpretation, and we are unable to predict the ultimate cost of compliance with these requirements or their effects on our operations. We may be required to make significant expenditures or modify our business practices to comply with existing or future laws and regulations, which may increase our costs and materially limit our ability to operate our business.
Our relationship with our employees could deteriorate, which could adversely affect our operations.
As a manufacturing company, we rely on our employees and good relations with our employees to produce our products and maintain our production processes and productivity. As of June 30, 2010, we employed approximately 830 full-time employees. A significant number of our non-U.S. employees are subject to arrangements similar to collective bargaining arrangements. With respect to these employees, we may not be able to negotiate labor agreements on satisfactory terms, and actions by our employees may disrupt our business. Although we have
27
Table of Contents
historically maintained a good relationship with our employees, if these workers were to engage in a strike, work stoppage or other slowdown, our operations could be disrupted or we could experience higher labor costs. In addition, if our other employees were to become unionized, in particular our employees at our Belpre, Ohio facility, we could experience significant operating disruptions and higher ongoing labor costs, which could adversely affect our business and financial condition and results of operations. Because many of the personnel who operate our European facilities are employees of LyondellBasell, relations between LyondellBasell and its employees may also adversely affect our business and financial condition and results of operations.
Loss of key personnel or our inability to attract and retain new qualified personnel could hurt our business and inhibit our ability to operate and grow successfully.
Our success in the highly competitive markets in which we operate will continue to depend to a significant extent on our key employees. We are dependent on the expertise of our executive officers. Loss of the services of any of our executive officers could have an adverse effect on our prospects. We may not be able to retain our key employees or to recruit qualified individuals to join our company. The loss of key employees could result in high transition costs and could disrupt our operations.
Fluctuations in currency exchange rates may significantly impact our results of operations and may significantly affect the comparability of our results between financial periods.
Our operations are conducted by subsidiaries in many countries. The results of the operations and the financial position of these subsidiaries are reported in the relevant foreign currencies and then translated into U.S. dollars at the applicable exchange rates for inclusion in our consolidated financial statements. The main currencies to which we are exposed, besides the U.S. dollar, are the Euro, Japanese Yen and Brazilian Real. The exchange rates between these currencies and the U.S. dollar in recent years have fluctuated significantly and may continue to do so in the future. A depreciation of these currencies against the U.S. dollar will decrease the U.S. dollar equivalent of the amounts derived from these operations reported in our consolidated financial statements and an appreciation of these currencies will result in a corresponding increase in such amounts. Because many of our raw material costs are determined with respect to the U.S. dollar rather than these currencies, depreciation of these currencies may have an adverse effect on our profit margins or our reported results of operations. Conversely, to the extent that we are required to pay for goods or services in foreign currencies, the appreciation of such currencies against the U.S. dollar will tend to negatively impact our results of operations. In addition, currency fluctuations may affect the comparability of our results of operations between financial periods.
We incur currency transaction risk whenever we enter into either a purchase or sale transaction using a currency other than the local currency of the transacting entity. Beginning in 2008, we began implementing hedging strategies to minimize our exposure to certain foreign currency fluctuations. Given the volatility of exchange rates, there can be no assurance that we will be able to effectively manage our currency transaction risks or that any volatility in currency exchange rates will not have a material adverse effect on our financial condition or results of operations.
We generally do not have long-term contracts with our customers, and the loss of customers could adversely affect our sales and profitability.
With some exceptions, our business is based primarily upon individual sales orders with our customers. As such, our customers could cease buying our products from us at any time, for any reason, with little or no recourse. If multiple customers elected not to purchase products from us, our business prospects, financial condition and results of operations could be adversely affected.
A decrease in the fair value of pension assets could materially increase future funding requirements of the pension plan.
We sponsor a defined benefit pension plan. The total projected benefit obligation of our defined benefit pension plan exceeded the fair value of the plan assets by approximately $30.7 million at June 30, 2010. We
28
Table of Contents
contributed $4.2 million to the pension plan in 2009 and, based on the actuarial assumptions used in our consolidated financial statements, are forecasting contributions of approximately $3.2 million in calendar years 2010 and 2011, respectively. Among the key assumptions inherent in the actuarially calculated pension plan obligation and pension plan expense are the discount rate and the expected rate of return on plan assets. If interest rates and actual rates of return on invested plan assets were to decrease significantly, the pension plan obligation could increase materially. The size of future required pension contributions could result in us dedicating a substantial portion of our cash flow from operations to making the contributions, which could materially adversely affect our business, financial condition and results of operations.
Risk Factors Relating to the Offering
Concentration of ownership among our principal stockholders may prevent new investors from influencing significant corporate decisions.
Following the completion of this offering, TPG and JPMP will still own a significant percentage of our common stock. Pursuant to a registration rights and shareholders’ agreement entered into by TPG, JPMP and the company, TPG and JPMP each has the right to participate in certain dispositions by the other party. TPG and JPMP are also restricted from transferring common stock without the consent of the other party. Furthermore, each of TPG and JPMP has the right to elect two directors to the board of directors of the company so long as it owns 10% or more of the outstanding common stock and one director so long as it owns 2% or more of the common stock. See “Certain Relationships and Related Party Transactions—Registration Rights and Shareholders’ Agreement.” As our largest stockholders, TPG and JPMP together are able to exercise significant influence over all matters requiring stockholder approval, including the election of directors, amendment of our certificate of incorporation and approval of significant corporate transactions and have significant control over our management and policies. The interests of these stockholders may not be consistent with the interests of other stockholders. The existence of significant stockholders may also have the effect of deterring hostile takeovers, delaying or preventing changes in control or changes in management, or limiting the ability of our other stockholders to approve transactions that they may deem to be in the best interests of our company. In addition, our certificate of incorporation provides that the provisions of Section 203 of the Delaware General Corporation Law (“DGCL”), which relate to business combinations with interested stockholders, do not apply to us.
The market price of our common stock may fluctuate significantly, and it may trade at prices below the price at which you purchased it.
The market price of our common stock following this offering may fluctuate significantly from time to time as a result of many factors, including:
| • | investors’ perceptions of our prospects; |
| • | differences between our actual financial and operating results and those expected by investors and analysts; |
| • | changes in analysts’ recommendations or projections; |
| • | fluctuations in quarterly operating results; |
| • | announcements by us or our competitors of significant acquisitions, strategic partnerships or divestitures; |
| • | changes or trends in our industry; |
| • | adverse resolution of any new or pending litigation against us; |
| • | additions or departures of key personnel; |
| • | changes in general economic conditions; and |
| • | broad market fluctuations. |
29
Table of Contents
Broad market and industry factors may adversely affect the market price of our common stock, regardless of our actual operating performance. As a result, our common stock may trade at prices significantly below the price at which you purchased it.
Future sales of our shares could adversely affect the market price of our common stock.
Future sales of substantial amounts of our common stock in the public market following this offering, whether by us or our existing stockholders, or the perception that such sales could occur, may adversely affect the market price of our common stock, which could decline significantly. Sales by our existing stockholders might also make it more difficult for us to raise equity capital by selling new common stock at a time and price that we deem appropriate.
Upon completion of this offering we will have 31,197,149 shares of common stock outstanding. Of these outstanding shares, we expect all of the shares sold in this offering will be freely tradable in the public market, unless the shares are held by any of our affiliates, as that term is defined in the Securities and Exchange Commission’s (“SEC”) Rule 144. We expect 11,284,283 shares will be restricted securities as defined in Rule 144 and may be sold by the holders into the public market from time to time in accordance with and subject to limitation on sales by affiliates under Rule 144. All of these restricted shares will be eligible for sale under Rule 144 following expiration of the lock-up agreements described below subject to limitation on sales by affiliates.
We, each of our officers, directors and our selling stockholders, have agreed to a 90-day lockup, meaning that, for a period of 90 days following the date of this prospectus, we and they will not sell shares of our common stock. However, this lockup is subject to several exceptions, and our lead underwriters in their sole discretion may release any of the securities subject to the lockup, at any time without notice.
Delaware law and some provisions of our organizational documents make a takeover of our company more difficult.
Provisions of our charter and bylaws may have the effect of delaying, deferring or preventing a change in control of our company. A change of control could be proposed in the form of a tender offer or takeover proposal that might result in a premium over the market price for our common stock. In addition, these provisions could make it more difficult to bring about a change in the composition of our board of directors, which could result in entrenchment of current management. For example, our charter and bylaws:
| • | establish a classified board of directors so that not all members of our board of directors are elected at one time; |
| • | require that the number of directors be determined, and any vacancy or new board seat be filled, only by the board; |
| • | not permit stockholders to act by written consent; |
| • | not permit stockholders to call a special meeting; |
| • | permit the bylaws to be amended by a majority of the board without shareholder approval, and require that a bylaw amendment proposed by stockholders be approved by 66 2/3% of all outstanding shares; |
| • | establish advance notice requirements for nominations for elections to our board of directors or for proposing matters that can be acted upon by stockholders at stockholder meetings; and |
| • | authorize the issuance of undesignated preferred stock, or “blank check” preferred stock, by our board of directors without shareholder approval. |
Many of our employment agreements, plans and equity arrangements with our executive officers also contain change in control provisions. Under the terms of these arrangements, the executive officers are entitled to
30
Table of Contents
receive significant cash payments, immediate vesting of options, restricted shares and notional shares, and continued medical benefits in the event their employment is terminated under certain circumstances within one year following a change in control, and with respect to certain equity awards, within two years following a change in control. Any Supplemental Pension Benefits a participant may have accrued under the Kraton Polymers U.S. LLC Pension Benefit Restoration Plan also vests immediately on a change of control and any amounts accrued under the Kraton Polymers LLC Executive Deferred Compensation Plan are immediately payable upon a change of control. We note that a change in control should not be triggered under these arrangements solely by this offering. See “Executive Compensation,” for disclosure regarding potential payments to named executive officers following a change in control.
These and other provisions of our organizational documents and Delaware law may have the effect of delaying, deferring or preventing changes of control or changes in management of our company, even if such transactions or changes would have significant benefits for our stockholders. As a result, these provisions could limit the price some investors might be willing to pay in the future for shares of our common stock.
We do not expect to pay any dividends for the foreseeable future.
We do not anticipate paying any dividends to our stockholders for the foreseeable future. The senior secured credit facility precludes us from paying cash dividends, and we may be subject to other restrictions on our ability to pay dividends from time to time. In addition, because we are a holding company, our ability to pay dividends depends on our receipt of cash dividends and distributions from our subsidiaries. The terms of certain of the senior subordinated notes substantially restrict our ability and the ability of our subsidiaries to pay dividends. Accordingly, investors must be prepared to rely on sales of their common stock after price appreciation to earn an investment return, which may never occur. Investors seeking cash dividends should not purchase our common stock. Any determination to pay dividends in the future will be made at the discretion of our board of directors and will depend upon our results of operations, financial conditions, contractual restrictions, restrictions imposed by applicable law or the SEC and other factors our board deems relevant.
We are a holding company with nominal net worth and will depend on dividends and distributions from our subsidiaries to pay any dividends.
Kraton Performance Polymers is a holding company with nominal net worth. We do not have any assets or conduct any business operations other than our investments in our subsidiaries, including Kraton Polymers LLC. As a result, our ability to pay dividends, if any, will be dependent upon cash dividends and distributions or other transfers from our subsidiaries. Payments to us by our subsidiaries will be contingent upon their respective earnings and subject to any limitations on the ability of such entities to make payments or other distributions to us. In addition, our subsidiaries are separate and distinct legal entities and have no obligation to make any funds available to us.
If securities or industry analysts do not publish research or publish inaccurate or unfavorable research about our business, our stock price and trading volume could decline.
The trading market for our common stock will depend in part on the research and reports that securities or industry analysts publish about us or our business. If no securities or industry analysts cover our company, the trading price for our common stock would be negatively impacted. If one or more of the analysts who covers us downgrades our common stock or publishes inaccurate or unfavorable research about our business, our stock price would likely decline. If one or more of these analysts ceases coverage of us or fails to publish reports on us regularly, demand for our common stock could decrease, which could cause our stock price and trading volume to decline.
31
Table of Contents
CAUTIONARY NOTE REGARDING FORWARD-LOOKING STATEMENTS
Some of the statements made under the headings “Summary,” “Business,” “Management’s Discussion and Analysis of Financial Condition and Results of Operations, ” “Financial Statements” and elsewhere in this prospectus contain forward-looking statements within the meaning of the Private Securities Litigation Reform Act of 1995. Statements that are not historical facts, including statements about our beliefs and expectations, are forward-looking statements. Forward-looking statements are often characterized by the use of words such as “believes,” “estimates,” “expects,” “projects,” “may,” “intends,” “plans” or “anticipates,” or by discussions of strategy, plans or intentions. Such forward-looking statements involve known and unknown risks, uncertainties, assumptions and other important factors that could cause the actual results, performance or our achievements, or industry results, to differ materially from historical results, any future results or performance or achievements expressed or implied by such forward-looking statements. There are a number of risks and uncertainties that could cause our actual results to differ materially from the forward-looking statements contained in this prospectus. Further description of these risks and uncertainties and other important factors are set forth in “Risk Factors” and “Management’s Discussion and Analysis of Financial Condition and Results of Operations” herein, and include, but not limited to, such risks related to:
| • | conditions in the global economy and capital markets; |
| • | our reliance on LyondellBasell for the provision of significant operating and other services; |
| • | the failure of our raw materials suppliers to perform their obligations under long-term supply agreements, or our inability to replace or renew these agreements when they expire; |
| • | limitations in the availability of raw materials we need to produce our products in the amounts or at the prices necessary for us to effectively and profitably operate our business; |
| • | competition in our end use markets, by other producers of SBCs and by producers of products that can be substituted for our products; |
| • | our ability to produce and commercialize technological innovations; |
| • | our ability to protect our intellectual property, on which our business is substantially dependent; infringement of our products on the intellectual property rights of others; |
| • | seasonality in our Paving and Roofing business; |
| • | financial and operating constraints related to our substantial level of indebtedness; |
| • | product liability claims and other lawsuits arising from environmental damage or personal injuries associated with chemical manufacturing; |
| • | political and economic risks in the various countries in which we operate; |
| • | the inherently hazardous nature of chemical manufacturing; health, safety and environmental laws, including laws that govern our employees’ exposure to chemicals deemed harmful to humans; |
| • | regulation of our customers, which could affect the demand for our products or result in increased compliance costs; |
| • | international trade, export control, antitrust, zoning and occupancy and labor and employment laws that could require us to modify our current business practices and incur increased costs; |
| • | our relationship with our employees; |
| • | loss of key personnel or our inability to attract and retain new qualified personnel; |
| • | fluctuations in currency exchange rates; |
| • | the fact that we do not enter into long-term contracts with our customers; |
| • | a decrease in the fair value of our pension assets, which could require us to materially increase future funding of the pension plan; |
32
Table of Contents
| • | concentration of ownership among our principal stockholders, which may prevent new investors from influencing significant corporate decisions; and |
| • | other risks and uncertainties described in this prospectus. |
There may be other factors of which we are currently unaware or that we deem immaterial that may cause our actual results to differ materially from the expectations we express in our forward-looking statements. Although we believe the assumptions underlying our forward-looking statements are reasonable, any of these assumptions, and, therefore, also the forward-looking statements based on these assumptions could themselves prove to be inaccurate.
Forward-looking statements are based on current plans, estimates, assumptions and projections, and therefore you should not place undue reliance on them. Forward-looking statements speak only as of the date they are made, and we undertake no obligation to update them publicly in light of new information or future events.
You should carefully consider the “Risk Factors” and subsequent public statements, or reports filed with or furnished to the SEC, before making any investment decision with respect to our securities. If any of these trends, risks, assumptions or uncertainties actually occurs or continues, our business, financial condition or operating results could be materially adversely affected, the trading prices of our securities could decline and you could lose all or part of your investment. All forward-looking statements attributable to us or persons acting on our behalf are expressly qualified in their entirety by this cautionary statement.
33
Table of Contents
The selling stockholders will receive all of the proceeds from this offering. We will not receive any proceeds from the sale of shares of our common stock in this offering. We will pay the expenses, other than underwriting discounts and commissions, associated with the sale of shares by the selling stockholders. TPG and JPMP are our principal stockholders and are selling stockholders in this offering. See “Principal and Selling Stockholders.”
34
Table of Contents
Our common stock has been listed on the New York Stock Exchange under the symbol “KRA” since December 17, 2009. Prior to then, our equity securities were not listed on any exchange or traded on any public trading market. The following table sets forth the high and low sales prices of our common stock per share, as reported by the New York Stock Exchange.
| Share Prices (a) | ||||||
| High | Low | |||||
| 2010 |
||||||
| Third Quarter (through September 17, 2010) |
$ | 29.77 | $ | 18.28 | ||
| Second Quarter |
21.56 | 17.57 | ||||
| First Quarter |
18.49 | 12.91 | ||||
| 2009 |
||||||
| Fourth Quarter (beginning December 17) |
$ | 13.84 | $ | 13.21 | ||
| (a) | Stock prices represent the intra-day high and low stock price. |
We have not previously declared or paid any dividends or distributions on our common stock. See “Dividend Policy.”
On September 17, 2010, the closing price of our common stock as reported on the New York Stock Exchange was $29.72. As of September 17, 2010, we had approximately 34 holders of record of our common stock.
35
Table of Contents
We have not previously declared or paid any dividends or distributions on our common stock. We currently intend to retain all available funds and any future earnings to fund the development and growth of our business, and we do not anticipate paying any cash dividends in the foreseeable future. We are currently prohibited from paying cash dividends on our common stock by the covenants in the senior secured credit facility and may be further restricted by the terms of any of our future debt or preferred securities. In addition, because we are a holding company, our ability to pay dividends depends on our receipt of cash dividends and distributions from our subsidiaries. The terms of certain of the senior subordinated notes substantially restrict our ability and the ability of our subsidiaries to pay dividends. For more information about these restrictions, see “Description of Certain Indebtedness.” Any future determination to pay dividends will be at the discretion of our board of directors and will depend on our financial condition, results of operations, capital expenditure requirements, restrictions contained in current and future financing instruments and other factors that our board of directors deems relevant.
36
Table of Contents
The following table sets forth our cash and cash equivalents and our capitalization as of June 30, 2010:
Because we are not receiving any of the net proceeds from this offering, our capitalization will not be affected by this offering. You should read this information together with our financial statements and the notes to those statements and the information included under the headings “Management’s Discussion and Analysis of Financial Condition and Results of Operations” and “Selected Consolidated Financial Data” included elsewhere in this prospectus.
| As of June 30,
2010 (in thousands, except par value) | |||
| (unaudited) | |||
| Cash and cash equivalents |
$ | 39,405 | |
| Long-term debt, including current portion: |
|||
| Senior secured credit facility (1) |
220,577 | ||
| Senior subordinated notes (less $7.0 million held as Treasury Bonds) |
163,000 | ||
| Polymer Holdings LLC 12.00% discount notes |
250 | ||
| Total long-term debt |
383,827 | ||
| Equity: |
|||
| Preferred stock, $0.01 par value per share; 100,000 shares authorized; none issued |
— | ||
| Common stock, $0.01 par value per share; 500,000 shares authorized; 30,851 shares issued and outstanding |
309 | ||
| Additional paid in capital |
325,145 | ||
| Retained earnings |
58,376 | ||
| Accumulated other comprehensive income |
3,979 | ||
| Total equity |
387,809 | ||
| Total capitalization |
$ | 771,636 | |
| (1) | As of June 30, 2010, we had $80.0 million available under the revolving portion of our senior secured credit facility. |
37
Table of Contents
SELECTED CONSOLIDATED FINANCIAL INFORMATION
The table below sets forth our selected consolidated historical financial data for the periods indicated.
The selected consolidated historical financial data presented below for the years ended December 31, 2006 and 2005 and as of December 31, 2007, 2006 and 2005 have been derived from our audited consolidated financial statements that are not included elsewhere in this prospectus. The selected consolidated historical financial data presented below for the years ended December 31, 2009, 2008 and 2007 and as of December 31, 2009 and 2008 have been derived from our audited consolidated financial statements, which are included elsewhere in this prospectus. The selected consolidated historical financial data for the six months ended June 30, 2010 and 2009 and as of June 30, 2010 and 2009 have been derived from our unaudited condensed consolidated financial statements, which are included elsewhere in this prospectus. Results of operations for the interim periods are not necessarily indicative of the results that might be expected for any other interim period or for an entire year. Our historical results are not indicative of our future performance.
The selected consolidated financial information and other data presented below should be read in conjunction with the information contained in “Management’s Discussion and Analysis of Financial Condition and Results of Operations,” audited consolidated financial statements and the notes thereto and unaudited condensed consolidated financial statements and the notes thereto, which are included elsewhere in this prospectus.
| Year ended December 31, | Six months ended June 30, |
|||||||||||||||||||||||||
| 2009 | 2008 | 2007 | 2006 | 2005 | 2010 | 2009 | ||||||||||||||||||||
| (In thousands) | (unaudited) | |||||||||||||||||||||||||
| Consolidated Statements of Operations Data: |
||||||||||||||||||||||||||
| Operating Revenues |
||||||||||||||||||||||||||
| Sales |
$ | 920,362 | $ | 1,171,253 | $ | 1,066,044 | $ | 1,015,766 | $ | 952,921 | $ | 604,818 | $ | 411,607 | ||||||||||||
| Other (1) |
47,642 | 54,780 | 23,543 | 32,355 | 22,670 | — | 17,172 | |||||||||||||||||||
| Total operating revenues |
968,004 | 1,226,033 | 1,089,587 | 1,048,121 | 975,591 | 604,818 | 428,779 | |||||||||||||||||||
| Cost of Goods Sold (2) |
792,472 | 971,283 | 938,556 | 843,726 | 766,012 | 446,578 | 384,085 | |||||||||||||||||||
| Gross Profit |
175,532 | 254,750 | 151,031 | 204,395 | 209,579 | 158,240 | 44,694 | |||||||||||||||||||
| Operating Expenses |
||||||||||||||||||||||||||
| Research and development expenses |
21,212 | 27,049 | 24,865 | 24,598 | 26,152 | 11,556 | 10,040 | |||||||||||||||||||
| Selling, general and administrative |
79,504 | 101,431 | 69,020 | 73,776 | 72,731 | 43,834 | 36,303 | |||||||||||||||||||
| Depreciation and amortization of identifiable intangibles |
66,751 | 53,162 | 51,917 | 43,574 | 44,090 | 23,015 | 25,106 | |||||||||||||||||||
| Total operating expenses |
167,467 | 181,642 | 145,802 | 141,948 | 142,973 | 78,405 | 71,449 | |||||||||||||||||||
| Gain on Extinguishment of Debt |
23,831 | — | — | — | — | — | 23,831 | |||||||||||||||||||
| Earnings of Unconsolidated Joint Venture (3) |
403 | 437 | 626 | 168 | 1,516 | 236 | 176 | |||||||||||||||||||
| Interest Expense, Net |
33,956 | 36,695 | 43,484 | 66,637 | 45,733 | 12,336 | 16,738 | |||||||||||||||||||
| Income (Loss) Before Income Taxes |
(1,657 | ) | 36,850 | (37,629 | ) | (4,022 | ) | 22,389 | 67,735 | (19,486 | ) | |||||||||||||||
| Income Tax Expense (Benefit) |
(1,367 | ) | 8,431 | 6,120 | 29,814 | (7,999 | ) | 9,345 | 1,160 | |||||||||||||||||
| Net Income (Loss) |
$ | (290 | ) | $ | 28,419 | $ | (43,749 | ) | $ | (33,836 | ) | $ | 14,390 | $ | 58,390 | $ | (20,646 | ) | ||||||||
| (1) | Other revenues include the sale of by-products generated in the production of IR and SIS. |
38
Table of Contents
| (2) | In the year ended December 31, 2005 this amount includes $1,684 (in thousands) of additional costs relating to the sale of inventory, the carrying value of which had been increased to reflect the manufacturing profit in inventory as part of TPG and JPMP’s acquisition of our company. |
| (3) | Represents our 50% joint venture interest in Kraton JSR Elastomers K.K., which is accounted for using the equity method of accounting. |
| Year ended December 31, | Six months ended June 30, | ||||||||||||||
| 2009 | 2008 | 2007 | 2010 | 2009 | |||||||||||
| (In thousands, except per share data) | (unaudited) | ||||||||||||||
| Earnings (Loss) per common share (1) |
|||||||||||||||
| Basic |
$ | (0.01) | $ | 1.46 | $ | (2.26) | $ | 1.90 | $ | (1.06) | |||||
| Diluted |
$ | (0.01) | $ | 1.46 | $ | (2.26) | $ | 1.88 | $ | (1.06) | |||||
| Weighted average common shares outstanding (1) |
|||||||||||||||
| Basic |
19,844 | 19,406 | 19,375 | 30,751 | 19,409 | ||||||||||
| Diluted |
19,844 | 19,483 | 19,375 | 31,023 | 19,409 | ||||||||||
| (1) | Not applicable for the years ended December 31, 2006 and 2005. See Note 12 to our audited consolidated financial statements and Note 7 to our unaudited condensed consolidated financial statements, which are included elsewhere in this prospectus. |
| As of December 31, | As of June 30, | ||||||||||||||||||||
| 2009 | 2008 | 2007 | 2006 | 2005 | 2010 | 2009 | |||||||||||||||
| (In thousands) | (unaudited) | ||||||||||||||||||||
| Balance Sheet Data |
|||||||||||||||||||||
| Cash and cash equivalents |
$ | 69,291 | $ | 101,396 | $ | 48,277 | $ | 43,601 | $ | 100,934 | $ | 39,405 | $ | 17,710 | |||||||
| Total assets |
$ | 974,499 | $ | 1,031,874 | $ | 984,894 | $ | 989,153 | $ | 966,501 | $ | 997,179 | $ | 894,984 | |||||||
| Total debt |
$ | 384,979 | $ | 575,316 | $ | 538,686 | $ | 582,310 | $ | 567,988 | $ | 383,827 | $ | 486,650 | |||||||
39
Table of Contents
MANAGEMENT’S DISCUSSION AND ANALYSIS OF
FINANCIAL CONDITION AND RESULTS OF OPERATIONS
You should read the following discussion and analysis of our financial condition and results of operations together with our financial statements and related notes included elsewhere in this prospectus. Some of the information contained in this discussion and analysis or set forth elsewhere in this prospectus, including information with respect to plans and strategy for our business and related financing, includes forward-looking statements that involve risks and uncertainties. You should review the section entitled “Risk Factors” of this prospectus for a discussion of important factors that could cause actual results to differ materially from the results described in or implied by the forward-looking statements contained in the following discussion and analysis.
Overview
We are a leading global producer of styrenic block copolymers, or SBCs, a family of performance polymer products the chemistry of which we pioneered almost 50 years ago. SBCs are highly-engineered synthetic elastomers that enhance the performance of numerous products by delivering a variety of performance-enhancing characteristics, including greater flexibility, resilience, strength, durability and processability, and are a fast growing subset of the elastomers industry. Our polymers are typically formulated or compounded with other products to achieve improved, customer-specific performance characteristics in a variety of applications.
We offer our customers a broad portfolio of products that includes approximately 200 core commercial grades of SBCs. We manufacture our products along five primary product lines based upon polymer chemistry and process technologies:
| • | unhydrogenated SBCs, or USBCs; |
| • | hydrogenated SBCs, or HSBCs; |
| • | isoprene rubber, or IR; |
| • | isoprene rubber latex, or IRL; and |
| • | Compounds. |
We include IR and IRL in our USBC product line. USBCs and HSBCs represented approximately 66.4% and 33.6% of sales revenue for the year ended December 31, 2009, respectively, and 66.2% and 33.8% of sales revenue for the six months ended June 30, 2010, respectively. The majority of worldwide SBC capacity is dedicated to the production of USBCs, which are primarily used in the Paving and Roofing, Adhesives, Sealants and Coatings, and Footwear end use applications. HSBCs, which are significantly more complex and capital-intensive to manufacture than USBCs, are primarily used in higher value-added end uses, including soft touch and flexible materials, personal hygiene products, medical products, automotive components and certain adhesives and sealant applications.
We serve four core end use markets:
| • | Advanced Materials, which represented 31.0% and 31.5% of sales revenue for the year ended December 31, 2009 and six months ended June 30, 2010, respectively; |
| • | Adhesives, Sealants and Coatings, which represented 32.0% and 32.5% of sales revenue for the year ended December 31, 2009 and six months ended June 30, 2010, respectively; |
| • | Paving and Roofing, which represented 26.0% and 28.0% of sales revenue for the year ended December 31, 2009 and six months ended June 30, 2010, respectively; and |
| • | Emerging Businesses, which includes our IR and IRL activity, and represented 7.0% and 5.4% of sales revenue for the year ended December 31, 2009 and six months ended June 30, 2010. |
40
Table of Contents
We believe that the diversity and depth of our product portfolio is unmatched in the industry, serving the widest set of applications within each end use.
2010 Second Quarter Financial Highlights
| • | Operating revenues increased by 36.2% from the second quarter of 2009 due to increased sales prices and a 20.8% increase in sales volume. Our sales volume in the second quarter of 2010 exceeded the sales volume in the first quarter of 2010 by 18.3%. Historically the second and third quarters are our higher volume quarters given the seasonal nature of the Paving and Roofing end use market. |
| • | Gross profit amounted to 26.8% of operating revenue in second quarter 2010 compared to 14.7% in the second quarter 2009, and 25.3% in the first quarter 2010. |
| • | Net income improved by $42.8 million or $1.46 per diluted share to $38.6 million or $1.24 per diluted share compared to the second quarter 2009. |
| • | Adjusted EBITDA improved by $50.1 million to $63.0 million compared to the second quarter 2009, reflecting a margin of 19.0% of revenues. |
| • | Cash and cash equivalents increased from $12.1 million at March 31, 2010 to $39.4 million at June 30, 2010. |
2009 Financial Highlights
| • | Operating revenues declined by 21.0% from 2008, primarily due to a 16.9% decline in sales volume. Although the effects of the global economic downturn negatively impacted our volume and operating revenues throughout 2009, our sales volume in the fourth quarter of 2009 exceeded the sales volume in the fourth quarter of 2008 by 16.0%. |
| • | Gross profit amounted to 18.1% of operating revenue in 2009 compared to 20.8% in 2008. |
| • | Cash provided by operating activities amounted to $72.8 million in 2009 compared to $40.2 million in 2008. Capital expenditures were $53.4 million in 2009 compared to $24.1 million in 2008. In 2009, we completed our global Enterprise Resource Planning (“ERP”) project, which significantly enhanced our global information technology capabilities. Included in the 2009 capital expenditures is $15.3 million associated with this project. |
| • | We completed our initial public offering in December 2009, raising net proceeds of approximately $137.4 million. |
| • | We retired $37.0 million of face amount of our senior subordinated notes for $13.7 million. Coupled with the $100.0 million of the proceeds from our initial public offering used to reduce our outstanding term loans, and the full repayment of our revolving loans which stood at $50.0 million at December 31, 2008, we reduced total indebtedness by $190.3 million from December 31, 2008 to December 31, 2009. |
| • | We amended and extended our revolving facility which increased the maximum borrowings from $75.5 million to $80.0 million and extended the maturity on $79.8 million of the revolving loans from May 2011 to May 2013. |
RESULTS OF OPERATIONS
Factors Affecting Our Results of Operations
Raw Materials. Our results of operations are directly affected by the cost of raw materials. We use three monomers as our primary raw materials in the manufacture of our products: styrene, butadiene and isoprene. These monomers together represented approximately 43%, 49% and 51% of our total goods sold for years ended December 31, 2009, 2008 and 2007, respectively, and 54% and 45% for the six months ended June 30, 2010 and
41
Table of Contents
2009, respectively. Other raw materials used in our production process include catalysts, solvents, stabilizers and various process control chemicals. The cost of these monomers generally has been correlated with changes in crude oil prices and affected by global supply and demand and by global economic conditions. The market prices for styrene and butadiene monomers peaked during 2008 before collapsing during the financial crisis in early 2009. Butadiene pricing then increased from its lows of the first two quarters of 2009 and leveled off in late 2009. Butadiene pricing resumed its escalation in the first quarter of 2010, and the increase has slowed and begun to level off in the second quarter of 2010. Styrene pricing increased from its lows in the first quarter of 2009 before leveling off in 2010. Spot isoprene prices peaked in late 2008 then declined in the first quarter of 2009. Isoprene pricing increased during the second quarter of 2009, stabilized, then increased again in the fourth quarter of 2009. Isoprene pricing continued to increase through the first quarter of 2010 then leveled off in the second quarter of 2010. Overall, monomer pricing is up significantly in the first half of 2010 as compared to the first half of 2009.
We believe our contractual and other arrangements with suppliers of styrene, butadiene and isoprene provide an adequate supply of raw materials at competitive, market-based prices. We can provide no assurances that contract suppliers will not terminate these contracts at the expiration of their contract terms, that we will be able to obtain substitute arrangements on comparable terms, or that we generally will be able to source raw materials on an economic basis in the future.
Styrene, butadiene and isoprene used by our U.S. and European facilities are predominantly supplied by a portfolio of suppliers under long-term supply contracts with various expiration dates. For our U.S. facilities, we also procure a substantial amount of isoprene from a variety of suppliers from Russia, China and Japan. These purchases include both spot and contract arrangements.
In January 2009, the U.S. operations of LyondellBasell, along with one of its European-holding companies, Basell Germany Holdings GmbH, filed for voluntary reorganization under Chapter 11 of the U.S. Bankruptcy Code. Its Chapter 11 reorganization plan was confirmed by the bankruptcy court in April 2010, and LyondellBasell has emerged from bankruptcy. LyondellBasell is one of our major suppliers of raw materials in Europe and also operates our facilities at Berre, France, and Wesseling, Germany. We cannot accurately predict the effect, if any, that LyondellBasell’s emergence from bankruptcy will have upon our business, or our relationships with LyondellBasell. To date, these proceedings have resulted in no significant changes in our commercial relationship with LyondellBasell.
In Japan, butadiene and isoprene supplies for our joint venture facility are supplied under our joint venture agreement, where our partner supplies our necessary requirements. Styrene in Japan is sourced from local third-party suppliers. Our facility in Paulinia, Brazil, generally purchases all of its raw materials from local third-party suppliers.
International Operations and Currency Fluctuations. We operate a geographically diverse business, serving customers in approximately 60 countries from five manufacturing facilities on four continents. For the twelve months ended December 31, 2009, 42% of total operating revenues were generated from customers located in the Americas, 37% in Europe and 21% in the Asia Pacific region, and for the six months ended June 30, 2010, 45%, 35% and 20%, respectively. Although we sell and manufacture our products in many countries, our sales and production costs are mainly denominated in U.S. dollars, Euros, Japanese Yen and Brazilian Real. From time to time, we use hedging strategies to reduce our exposure to currency fluctuations.
In May 2010, we entered into multiple non-deliverable forward contracts to reduce our exposure to fluctuations in the Brazilian Real to the U.S. dollar associated with the funding of the debottleneck and expansion of our IRL capacity at our Paulina, Brazil, facility.
Our financial results are subject to gains and losses on currency translations, which occur when the financial statements of foreign operations are translated into U.S. dollars. The financial statements of operations outside the United States where the local currency is considered to be the functional currency are translated into U.S.
42
Table of Contents
dollars using the exchange rate at each balance sheet date for assets and liabilities and the daily spot exchange rate for revenues, expenses, gains and losses and cash flows. The effect of translating the balance sheet into U.S. dollars is included as a component of accumulated other comprehensive income in stockholders’ equity on the condensed consolidated balance sheets. Any appreciation of the functional currencies against the U.S. dollar will increase the U.S. dollar equivalent of amounts of revenues, expenses, gains and losses and cash flows, and any depreciation of the functional currencies will decrease the U.S. dollar amounts reported.
For the years ended December 31, 2009, 2008 and 2007, the estimated pre-tax income / loss from currency fluctuations, including the cost of hedging strategies, amounted to $3.3 million loss, $4.5 million income and $3.2 million income, respectively. For the six months ended June 30, 2010 and 2009, the estimated pre-tax loss from currency fluctuations, including the cost of hedging strategies, amounted to $1.2 million and $3.6 million, respectively.
Seasonality. Seasonal changes and weather conditions typically affect the Paving and Roofing end use market. In particular, sales volumes for paving products generally rise in the warmer months and generally decline during the colder months of fall and winter. Roofing product sales volumes tend to be more consistent throughout the year. Abnormally cold or wet seasons may cause reduced purchases from our Paving and Roofing customers. However, because seasonal weather patterns are difficult to predict, we cannot accurately estimate fluctuations in our quarterly Paving and Roofing sales in any given year. Our other end use markets tend to show relatively little seasonality.
Recent Developments
Project Assessment Underway for Additional HSBC Capacity in Asia. As a result of growth in Kraton’s differentiated grades of HSBCs globally, we see the need for additional manufacturing capacity. We are continuing to expand and strengthen our presence in Asia, and thus we believe Kraton’s regional, and global, business would benefit from such increased capacity. By committing the necessary resources, technology and capital, this would represent the next logical step to grow our position in the Asia Pacific region, in support of application and technology developments for Kraton’s leading, proprietary, SBC formulations. The anticipated 30 kiloton HSBC manufacturing facility would employ Kraton’s latest state-of-the-art technology for producing HSBCs and, we believe will set a new global standard for manufacturing cost and product quality, demonstrating further our commitment to our business and the region. Our site-selection team is expected to make its recommendation to management by December 2010 by which time we will be in a better position to render a final project decision. While it is too early to estimate the expected cost of the new facility, we anticipate that construction could commence in the first half of 2012 with start-up occurring as early as the second half of 2013.
Shanghai Office. We have relocated our Shanghai office to a facility that is double the size of the previous location, to better accommodate our ongoing increase in staff and in-house capabilities. Our Shanghai staff has nearly doubled since 2006. The new facility also offers a multi-functional customer service center and also includes a dedicated training facility.
New Innovation. In August 2010, we announced that our roof coating formulation containing Kraton G1643 exceeds requirements in the ASTM International D6083 standard specification recognized in the elastomeric roof coating market. ASTM D6083 is an industry standard that establishes minimum performance levels in the following areas: viscosity, weight and volume solids; mechanical properties; adhesion; low temperature flexibility after accelerated weathering; tear resistance; permeation and water swelling; and fungi resistance. This gives innovators an opportunity to more effectively compare polymer-to-polymer for roof coating formulations. This SBC-based polymer has a proven track record of improving the performance of roof coatings because it adds superior water resistance, improved adhesion, and increased elongation to formulations. It can be used to help lower volatile organic compounds (VOCs) in a solvented formulation, which have significant vapor pressures that can affect the environment and human health. In addition, our tested formulation can be used under the EPA’s regulation for thermoplastic rubber coatings and mastic. A roof coating formulation containing Kraton G1643 can reduce total cost of installation and provide fast cure coatings that will work better in cold, humid or
43
Table of Contents
wet conditions. Elastomeric roof coatings made with Kraton polymers will stand up better to ponding water, and provide excellent adhesion to all types of roofing substrates. Roof coatings made with Kraton G1643 are an excellent choice for low slope roofs, or high traffic areas, and will provide excellent reflectance to reduce energy costs, and extend the life of the roof.
In July 2010, we announced the addition of Kraton D1183 BT, a new SIS grade, to our line of polymers for use in applications where softness, ease-in-processing and high temperature resistance are essential. Kraton D1183 BT is suitable for use in many adhesive applications including thermal printing labels, high temperature resistant labels, elastic labels and diaper tabs. It is an excellent choice for adhesives in hygiene applications and its shear strength is particularly good at 37 degrees Celsius. Moreover, it offers economically attractive adhesive formulations, and gives formulators the ability to dilute it further to obtain equivalent performance levels of competing products, which can result in cost-savings. It can also achieve significantly higher cohesive strength and higher temperature resistance without the use of expensive endblock resins. Therefore, Kraton D1183 BT is not only economically attractive, but also substantially stronger and offers a wider formulating space. Prior to the commercialization of Kraton D1183 BT, innovators used low-coupled SIS block copolymers to impart softness to end-products. Although they offered improved adhesion on open and porous substrates and good label die-cutting performance, they often lacked cohesion, which hampered their use in applications where higher shear and temperature resistance was required. In comparison, Kraton D1183 BT is a 40% diblock SIS, which shows superior performance to low-coupled SIS block copolymers and is therefore the polymer of choice for these applications.
In May 2010, we announced the addition of DX405 to our product line of polymers for Adhesives, Sealants, and Coatings. This technology will allow our customers to more efficiently and expediently manufacture products that are stronger and softer. DX405 has a low styrene content, which promotes ease of processing, low viscosity, and the attainment of lower application temperatures. This adds efficiency and simplification to the manufacturing process, which shortens batch times, increases extrusion rates and improves productivity. DX405 has a wide formulation window and its versatility makes it suitable for solvent-based compositions, hot melt adhesives, and sealant applications. It can be formulated with other polymers, resins, fillers, pigments, oils, thickeners, waxes and stabilizers to obtain a desired balance of properties.
Polyisoprene Rubber Manufacturing at Belpre, Ohio. We plan to invest approximately $27.0 million in our Belpre, Ohio facility to enable production of IR. Plant modifications and upgrades commenced in the third quarter of 2010 with the new IR production capabilities expected by mid-2011.
Isoprene Rubber Latex Capacity Expansion at Paulinia, Brazil. We plan to invest approximately $10.0 million to debottleneck and expand IRL capacity at our Paulinia, Brazil, facility. We commenced spending on this initiative in the third quarter of 2010 with the project expected to be completed by mid-2011. When combined with the capacity contractually available to us at a third party site in Japan, this debottlenecking project will represent an estimated 33% increase in our total IRL capacity.
European Office Consolidation. We are consolidating our transactional functions as well as much of our European management to a new European central office in Amsterdam, the Netherlands. We believe that with this initiative we will achieve greater operating efficiency as well as service improvements by consolidating core competencies and further exploiting the advantages of our new global ERP system rolled out in 2009. We anticipate minimal impact on existing relationships and specifically no interruption in customer service during the gradual implementation of this transition plan. We expect to incur approximately $5.0 million to $6.0 million of restructuring costs, largely in the remainder of 2010. We expect operating cost reductions of more than $2.0 million on an annual basis starting in 2012 resulting from this consolidation.
Outlook
The rate of increase in raw material prices slowed in the second quarter of 2010 and has recently started to level off. We expect prices for our manufacturing inputs to remain relatively stable for the balance of the year.
44
Table of Contents
Based upon the volume growth we experienced in the second quarter of 2010, we remain positive on the near-term outlook for our business. At this time we expect third quarter sales volumes to be generally in line with the second quarter. We will continue to monitor the pace and strength of the economic recovery for any material change that could potentially impact demand in our end use markets.
Results of Operations
The following table summarizes certain information relating to our operating results that has been derived from our consolidated financial statements.
| Year ended December 31, | Six months ended June 30, | |||||||||||||||||
| 2009 | 2008 | 2007 | 2010 | 2009 | ||||||||||||||
| (In thousands) | (unaudited) | |||||||||||||||||
| Consolidated Statements of Operations Data: |
||||||||||||||||||
| Operating Revenues |
||||||||||||||||||
| Sales |
$ | 920,362 | $ | 1,171,253 | $ | 1,066,044 | $ | 604,818 | $ | 411,607 | ||||||||
| Other (1) |
47,642 | 54,780 | 23,543 | — | 17,172 | |||||||||||||
| Total operating revenues |
968,004 | 1,226,033 | 1,089,587 | 604,818 | 428,779 | |||||||||||||
| Cost of Goods Sold |
792,472 | 971,283 | 938,556 | 446,578 | 384,085 | |||||||||||||
| Gross Profit |
175,532 | 254,750 | 151,031 | 158,240 | 44,694 | |||||||||||||
| Operating Expenses |
||||||||||||||||||
| Research and development expenses |
21,212 | 27,049 | 24,865 | 11,556 | 10,040 | |||||||||||||
| Selling, general and administrative |
79,504 | 101,431 | 69,020 | 43,834 | 36,303 | |||||||||||||
| Depreciation and amortization of identifiable intangibles |
66,751 | 53,162 | 51,917 | 23,015 | 25,106 | |||||||||||||
| Total operating expenses |
167,467 | 181,642 | 145,802 | 78,405 | 71,449 | |||||||||||||
| Gain on Extinguishment of Debt |
23,831 | — | — | — | 23,831 | |||||||||||||
| Earnings of Unconsolidated Joint Venture (2) |
403 | 437 | 626 | 236 | 176 | |||||||||||||
| Interest Expense, net |
33,956 | 36,695 | 43,484 | 12,336 | 16,738 | |||||||||||||
| Income (Loss) Before Income Taxes |
(1,657 | ) | 36,850 | (37,629 | ) | 67,735 | (19,486 | ) | ||||||||||
| Income Tax Expense (Benefit) |
(1,367 | ) | 8,431 | 6,120 | 9,345 | 1,160 | ||||||||||||
| Net Income (Loss) |
$ | (290 | ) | $ | 28,419 | $ | (43,749 | ) | $ | 58,390 | $ | (20,646 | ) | |||||
| (1) | Other revenues include the sale of by-products generated in the production of IR and SIS. |
| (2) | Represents our 50% joint venture interest in Kraton JSR Elastomers K.K., which is accounted for using the equity method of accounting. |
45
Table of Contents
The following table summarizes certain information relating to our operating results as a percentage of total revenues and has been derived from the financial information presented above. We believe this presentation is useful to investors in comparing historical results. Certain amounts in the table may not sum due to the rounding of individual components.
| Year ended December 31, | Six months ended June 30, | ||||||||||||||
| 2009 | 2008 | 2007 | 2010 | 2009 | |||||||||||
| (unaudited) | |||||||||||||||
| Consolidated Statements of Operations Data: |
|||||||||||||||
| Operating Revenues |
|||||||||||||||
| Sales |
95.1 | % | 95.5 | % | 97.8 | % | 100.0 | % | 96.0 | % | |||||
|
Other (1) |
4.9 | 4.5 | 2.2 | — | 4.0 | ||||||||||
| Total operating revenues |
100.0 | 100.0 | 100.0 | 100.0 | 100.0 | ||||||||||
| Cost of Goods Sold |
81.9 | 79.2 | 86.1 | 73.8 | 89.6 | ||||||||||
| Gross Profit |
18.1 | 20.8 | 13.9 | 26.2 | 10.4 | ||||||||||
| Operating Expenses |
|||||||||||||||
| Research and development expenses |
2.2 | 2.2 | 2.3 | 1.9 | 2.3 | ||||||||||
| Selling, general and administrative |
8.2 | 8.3 | 6.3 | 7.2 | 8.5 | ||||||||||
| Depreciation and amortization of identifiable intangibles |
6.9 | 4.3 | 4.8 | 3.8 | 5.9 | ||||||||||
| Total operating expenses |
17.3 | 14.8 | 13.4 | 13.0 | 16.7 | ||||||||||
| Gain on Extinguishment of Debt |
2.5 | — | — | — | 5.6 | ||||||||||
| Earnings of Unconsolidated Joint Venture (2) |
— | — | 0.1 | — | — | ||||||||||
| Interest Expense, net |
3.5 | 3.0 | 4.0 | 2.0 | 3.9 | ||||||||||
| Income (Loss) Before Income Taxes |
(0.2 | ) | 3.0 | (3.5 | ) | 11.2 | (4.5 | ) | |||||||
| Income Tax Expense (Benefit) |
(0.1 | ) | 0.7 | 0.6 | 1.5 | 0.3 | |||||||||
| Net Income (Loss) |
— | % | 2.3 | % | (4.0 | )% | 9.7 | % | (4.8 | )% | |||||
Numbers in this table may not sum, due to rounding.
| (1) | Other revenues include the sale of by-products generated in the production of IR and SIS. |
| (2) | Represents our 50% joint venture interest in Kraton JSR Elastomers K.K., which is accounted for using the equity method of accounting. |
Six Months Ended June 30, 2010 Compared to Six Months Ended June 30, 2009
Operating Revenues
Operating revenues includes revenue from the sale of our core products and prior to the exit of our Pernis facility on December 31, 2009, the sale of small quantities of by-products resulting from the manufacturing process of IR. For the six months ended June 30, 2010, total operating revenues increased $176.0 million or 41.1% compared to the same period in 2009.
Sales increased $193.2 million or 46.9% over the same period in 2009. The increase in sales was the result of:
| • | a $139.7 million increase in sales volume from 118.5 kilotons in the first half of 2009 to 159.1 kilotons in the first half of 2010. The 40.6 kilotons or 34.2% increase in sales volume was broad-based across each end use market reflecting a continuation of the positive trend that began in the fourth quarter of 2009; |
| • | a $52.6 million increase in global product sales prices in response to higher raw material costs, increased demand for our products, and other considerations; and |
| • | a $0.9 million increase from changes in foreign currency exchange rates, principally from a weaker Euro versus U.S. dollar in the first half of 2010 compared to the first half of 2009. |
46
Table of Contents
The following are the primary factors influencing our sales revenue in each of our end use markets:
| • | In our Advanced Materials end use market, sales amounted to $190.4 million for the six months ended June 30, 2010, an increase of $66.2 million or 53.2% compared to 2009 sales of $124.3 million. The increase was broad-based across all regions, reflecting growth in automotive, consumer electronics, personal care and medical applications. For the six months ended June 30, 2010, growth in innovation-led revenue was driven by personal care applications and by PVC alternatives in wire and cable and medical applications. |
| • | In our Adhesives, Sealants and Coatings end use market, sales amounted to $196.8 million for the six months ended June 30, 2010, an increase of $64.6 million or 48.9% compared to 2009 sales of $132.1 million. The increase was broad-based across all regions, reflecting higher sales into personal care, labels, packaging tape, automotive sealants and sealants for do-it-yourself home improvement. |
| • | In our Paving and Roofing end use market, sales amounted to $169.1 million for the six months ended June 30, 2010, an increase of $65.8 million or 63.7% compared to 2009 sales of $103.3 million. The growth largely reflects sales into roofing applications, and to a lesser extent, higher paving sales in the first quarter of 2010 compared to the first quarter of 2009. |
| • | In our Emerging Businesses end use market, sales amounted to $32.6 million for the six months ended June 30, 2010, an increase of $8.8 million or 37.2% from the same period 2009 sales of $23.8 million. The increase reflects the continued volume growth of our IRL products in applications such as surgical gloves and condoms. |
As a result of our exit from our Pernis facility, other revenue decreased $17.2 million or 100.0% compared to the same period in 2009.
Cost of Goods Sold
Cost of goods sold for six months ended June 30, 2010 increased $62.5 million or 16.3% compared to the same period in 2009. The increase was driven primarily by:
| • | a $76.5 million increase in cost of goods sold related to the increase in sales volume; |
| • | a $14.8 million increase in monomer and other production costs; and |
| • | a $1.8 million increase from changes in foreign currency exchange rates; partially offset by |
| • | a $17.2 million decrease due to lower by-product costs; |
| • | a $8.2 million decrease in plant turnaround costs; and |
| • | a $5.2 million decrease in costs associated with the Pernis exit. |
The spread between first-in first-out, or FIFO, basis and current replacement cost basis resulted in a decrease in cost of goods sold in the six months ended June 30, 2010 of approximately $21.9 million compared to a increase in cost of goods sold of approximately $43.6 million for the same period in 2009. As a percentage of operating revenues, cost of goods sold decreased to 73.8% in 2010 from 89.6% in 2009.
Gross Profit
Gross profit for the six months ended June 30, 2010 increased $113.5 million or more than 100% compared to the same period in 2009. The increase was driven primarily by an increase in sales volume and the improved spread between FIFO basis and current replacement cost basis. As a percentage of operating revenues, gross profit increased to 26.2% in the first half of 2010 from 10.4% in the first half of 2009.
47
Table of Contents
Operating Expenses
Operating expenses for the six months ended June 30, 2010 increased $7.0 million or 9.7% compared to the same period in 2009. The increase was driven primarily by:
| • | a $1.5 million or 15.1% increase in research and development expense largely due to higher employment related costs of $0.8 million and higher operating costs of $0.7 million. As a percentage of operating revenues, research and development expenses decreased to 1.9% from 2.3% in the first half of 2009; and |
| • | a $7.5 million or 20.7% increase in selling, general and administrative expenses primarily due to an increase in employment related costs of $9.2 million, including an increase in incentive compensation costs of $5.7 million, partially offset by $2.1 million of savings from the implementation of our global ERP system. As a percentage of operating revenues, selling, general and administrative expenses decreased to 7.2% from 8.5% in the first half of 2009; partially offset by |
| • | a $2.1 million or 8.3% decrease in depreciation and amortization expenses largely due to the exit from our Pernis facility in December 2009. As a percentage of operating revenues, depreciation and amortization expenses decreased to 3.8% from 5.9% in the first half of 2009. |
Interest Expense, Net
Interest expense, net for the six months ended June 30, 2010 decreased $4.4 million or 26.3% to $12.3 million compared to $16.7 million during the same period in 2009 due to the decline in outstanding indebtedness. The average debt balances outstanding were $393.1 million and $549.6 million for the six months ended June 30, 2010 and 2009, respectively. The effective interest rates on our debt during the same period were 6.4% and 6.3%, respectively.
Income Tax Expense
Income tax expense was $9.3 million for the six months ended June 30, 2010 compared to an expense of $1.2 million for the same period in 2009. The effective tax rate was 13.8% for the six months ended June 30, 2010 compared to (6.0)% for the same period in 2009. Our effective tax rate for the six months ended June 30, 2010 was lower than the statutory rate of 35% primarily due to the mix of pre-tax income earned in foreign jurisdictions and the recognition of the tax benefit for certain net operating loss carryforwards.
Net Income (Loss)
Net income was $58.4 million or $1.88 per diluted share for the six months ended June 30, 2010, an increase of $79.0 million or $2.94 per diluted share compared to a net loss of $20.6 million or $1.06 per diluted share in the same period in 2009. In the first half of 2009, we realized a gain on the extinguishment of debt, which amounted to $1.23 per diluted share.
Year Ended December 31, 2009 Compared to Year Ended December 31, 2008
Operating Revenues
Operating revenues includes revenue from the sale of our core products and the sale of small quantities of by-products resulting from the manufacturing process of IR. For the year ended December 31, 2009 total operating revenues decreased $258.0 million or 21.0% compared to the same period in 2008.
Sales decreased $250.9 million or 21.4%. The decline in sales was the result of:
| • | a $168.5 million decrease in sales volume from 313.1 kilotons in 2008 to 260.3 kilotons in 2009. The 52.8 kilotons or 16.9% decline in sales volume was largely the result of weak first half demand where year-over-year volume was 52.5 kilotons below the first half of 2008. Demand was negatively impacted by the global economic slowdown; |
48
Table of Contents
| • | a $59.1 million decrease in global product sales prices, including the effect on sales prices from changes in the cost of monomers, and product mix; and |
| • | a $23.3 million decrease from changes in foreign currency exchange rates, principally from a weaker Euro versus U.S. dollar in 2009 compared to 2008. |
The following are the primary factors influencing our sales revenue in each of our end use markets:
| • | In our Adhesives, Sealants and Coatings end use market, sales amounted to $297.5 million in 2009, a decline of $75.7 million or 20.3% from 2008 sales of $373.2 million. Sales were down due to the general weak demand in the first half of 2009 due to the global economic crisis. We experienced a decline in overall demand that began in the fourth quarter of 2008 and continued into 2009. However, we did experience positive trends during the year, including increased demand for non-woven adhesives applications such as for diapers and hygiene products along with continued growth in commercial and specialty tapes and labels. |
| • | In our Advanced Materials end use market, sales amounted to $281.8 million in 2009, a decline of $73.1 million or 20.6% from 2008 sales of $354.9 million. Our sales volume into key markets such as automotive, consumer electronics/appliances and personal care applications declined commensurate with global economic conditions; however, as market conditions improved late in the third quarter and continued through the fourth quarter of 2009, volume began to recover. HSBC sales were up 20% in the fourth quarter of 2009 compared to the fourth quarter of 2008, as demand for consumer electronics and personal care items returned. There was also an improvement in innovation programs that were delayed in the first-half of 2009 but subsequently began to move forward by year end. |
| • | In our Paving and Roofing end use market, sales amounted to $242.9 million in 2009, a decline of $122.4 million or 33.5% from 2008 sales of $365.3 million. Roofing applications were lower due to the overall decline in construction activity, particularly in the commercial sector. We also experienced a decline in our paving business, largely due to delays associated with the uncertainty around the impact of the U.S. government economic stimulus spending and budgetary constraints on state and local government spending. |
| • | In our Emerging Businesses end use market, sales amounted to $60.8 million in 2009, an increase of $26.0 million or 74.7% from 2008 sales of $34.8 million. The increase reflects the continued penetration of our IR and IRL products in applications such as surgical gloves and condoms. |
Other revenue decreased $7.1 million or 13.0%. Other revenue primarily consists of the sales of small quantities of by-products resulting from the manufacturing process of IR, which is offset by a corresponding cost included in cost of goods sold.
Cost of Goods Sold
Cost of goods sold for the year ended December 31, 2009 decreased $178.8 million or 18.4% compared to the same period in 2008. The decrease was driven primarily by:
| • | a $127.3 million decrease related to the decline in sales volume; |
| • | a $37.1 million decrease in monomer and other production costs; |
| • | a $18.8 million decrease from changes in foreign currency exchange rates; and |
| • | a $7.1 million decrease due to lower by-product costs; offset by |
| • | a $11.5 million increase in plant turnaround costs. The increase in turnaround costs reflects major maintenance at our Wesseling, Germany, and Berre, France, facilities, which are required by regulatory authorities every six years. |
49
Table of Contents
The spread between FIFO basis and current replacement cost basis resulted in an increase in cost of goods sold in 2009 of approximately $17.6 million and a decrease in cost of goods sold of approximately $37.1 million in 2008. As a percentage of operating revenues, cost of goods sold increased to 81.9% from 79.2%.
Gross Profit
Gross profit for the year ended December 31, 2009 decreased $79.2 million or 31.1% compared to the same period in 2008. The decrease was driven primarily by a decrease in sales volume. As a percentage of operating revenues, gross profit decreased to 18.1% from 20.8%. On an estimated replacement cost basis, gross profit margins would have been 19.9% and 17.7% in 2009 and 2008, respectively.
Operating Expenses
Operating expenses for the year ended December 31, 2009 decreased $14.2 million or 7.8% compared to the same period in 2008. The decrease was driven primarily by:
| • | a $5.8 million or 21.6% decrease in research and development expenses. The decrease was largely due to a $2.1 million one-time cost of severance incurred in 2008, and approximately $2.7 million in staffing related savings in 2009 associated with the realignment of our Research and Technology Service organization. As a percentage of operating revenues, research and development was unchanged at 2.2%; and |
| • | a $21.9 million or 21.6% decrease in selling, general and administrative expenses. The decrease was primarily due to a reduction of our incentive compensation costs of $13.4 million and lower restructuring and related costs of $7.9 million. As a percentage of operating revenues, selling, general and administrative expenses decreased to 8.2% from 8.3%; partially offset by |
| • | a $13.6 million or 25.6% increase in depreciation and amortization expenses. The increase was largely due to the one-time accelerated depreciation associated with the shutdown and exit of the Pernis facility as of December 31, 2009. As a percentage of operating revenues, depreciation and amortization expenses increased to 6.9% from 4.3%. |
Interest Expense, Net
Interest expense, net for the year ended December 31, 2009 decreased $2.7 million or 7.5% to $34.0 million compared to $36.7 million during the same period in 2008. The decrease was primarily due to lower interest rates, amortized gains from our interest rate swap that was settled in June 2008 and lower debt balances; partially offset by the write off of approximately $1.5 million of deferred financing costs and the ineffective portion of our 2010 interest rate swap associated with the prepayment of $100 million on the term portion of Kraton’s senior secured credit facility. The average debt balances outstanding were $531.0 million for the year ended December 31, 2009 and $562.4 million for the year ended December 31, 2008. The effective interest rates on our debt were 6.4% for the year ended December 31, 2009 and 6.5% for the year ended December 31, 2008.
Income Tax Expense
Income tax expense for the year ended December 31, 2009 was a tax benefit of $1.4 million compared to an income tax expense of $8.4 million for the year ended December 31, 2008. The effective tax rate for the year ended December 31, 2009 was 82.5% compared to 22.9% for the year ended December 31, 2008.
50
Table of Contents
The provision for income taxes differs from the amount computed by applying the U.S. statutory income tax rate to income from continuing operations before income taxes for the reasons set forth below:
| December 31, | ||||||||||||
| 2009 | 2008 | 2007 | ||||||||||
| (in thousands) | ||||||||||||
| Income Taxes at the Statutory Rate |
$ | (580 | ) | $ | 12,897 | $ | (13,171 | ) | ||||
| Foreign Tax Rate Differential |
(97 | ) | (3,294 | ) | 3,331 | |||||||
| State Taxes |
(225 | ) | (86 | ) | (3,012 | ) | ||||||
| Permanent Differences—Netherlands Participation Exemption |
(784 | ) | (903 | ) | — | |||||||
| Permanent Differences—Other |
(48 | ) | 682 | (144 | ) | |||||||
| Differences in Foreign Earnings Remitted |
4,165 | 6,354 | 4,043 | |||||||||
| Tax Credits |
(122 | ) | — | — | ||||||||
| Other |
(189 | ) | — | — | ||||||||
| Tax Benefit Related to Foreign Losses |
(2,597 | ) | — | — | ||||||||
| Change in Valuation Allowance and Uncertain Tax Positions |
(890 | ) | (7,219 | ) | 15,073 | |||||||
| Income Tax Expense (Benefit) |
$ | (1,367 | ) | $ | 8,431 | $ | 6,120 | |||||
| December 31, | |||||||||
| 2009 | 2008 | 2007 | |||||||
| Income Taxes at the Statutory Rate |
35.0 | % | 35.0 | % | 35.0 | % | |||
| Foreign Tax Rate Differential |
5.9 | % | (8.9 | )% | (8.9 | )% | |||
| State Taxes |
13.6 | % | (0.2 | )% | 8.0 | % | |||
| Permanent Differences—Netherlands Participation Exemption |
47.3 | % | (2.5 | )% | 0.0 | % | |||
| Permanent Differences—Other |
2.9 | % | 1.9 | % | 0.4 | % | |||
| Differences in Foreign Earnings Remitted |
(251.4 | )% | 17.2 | % | (10.7 | )% | |||
| Tax Credits |
7.4 | % | 0.0 | % | 0.0 | % | |||
| Other |
11.4 | % | 0.0 | % | 0.0 | % | |||
| Tax Benefit Related to Foreign Losses |
156.7 | % | 0.0 | % | 0.0 | % | |||
| Change in Valuation Allowance and Uncertain Tax Positions |
53.7 | % | (19.6 | )% | (40.1 | )% | |||
| Effective Tax Rate |
82.5 | % | 22.9 | % | (16.3 | )% | |||
Net Income (Loss)
Net loss was $0.3 million for the year ended December 31, 2009, a decrease of $28.7 million compared to a net income of $28.4 million in the same period in 2008. Earnings and loss per share amounted to $(0.01) and $1.46 in 2009 and 2008, respectively.
Year Ended December 31, 2008 Compared to Year Ended December 31, 2007
Operating Revenues
Operating revenues includes revenue from the sale of our core products and the sale of small quantities of by-products resulting from the manufacturing process of IR. For the year ended December 31, 2008 operating revenue increased $136.4 million or 12.5% compared to the same period in 2007:
Sales increased $105.2 million or 9.9%. The increase in sales was the result of:
| • | an increase in global product sales prices and changes in product mix of $173.3 million; and |
| • | an increase from the impact of changes in foreign currency exchange rates of $50.1 million; partially offset by, |
| • | a $118.2 million decrease related to a 44.5 kiloton, or 12.4% decline in sales volume. |
51
Table of Contents
The increase in sales revenue of $105.2 million or 9.9% was primarily comprised of the following:
| • | an increase of $42.0 million in the Adhesives, Sealants and Coatings end use market; |
| • | an increase of $11.2 million in the Advanced Materials end use market; |
| • | an increase of $45.0 million in the Paving and Roofing end use market; and |
| • | an increase of $11.8 million in the Emerging Businesses end use market; partially offset by |
| • | a decrease of $4.8 million in the Other Markets end use markets. |
Sales volume amounted to 313.1 kilotons in 2008 compared to 357.6 kilotons in 2007. The following are the primary factors influencing sales volumes:
| • | Overall, volume was constrained due to butadiene availability in 2008. |
| • | In our Adhesives, Sealants and Coatings end use market, raw material availability was a primary driver, affecting North American tape and formulator customers. |
| • | In our Advanced Materials end use market, general weakness resulting from global economic conditions, partially offset by a modest growth in emerging markets due to increased demand for high quality isoprene latex rubber, used in medical applications. |
We implemented a series of global price increases beginning in August 2008, which were generally broad-based across our end use markets and in response to the increase in raw material and energy costs. As a result, even though sales volumes declined year-over-year, we experienced revenue growth in each of our end use markets.
Other revenue increased $31.2 million or 132.7%. Other revenue primarily consists of the sales of small quantities of residual products that are a by-product of the manufacturing process of IR; however the increase is offset by a corresponding increase in cost of goods sold.
Cost of Goods Sold
Cost of goods sold for the year ended December 31, 2008 increased $32.7 million or 3.5% compared to the same period in 2007. The increase was driven primarily by:
| • | a $39.2 million increase from changes in foreign currency exchange rates; |
| • | a $37.1 million increase in monomer and other production costs; |
| • | a $31.2 million increase in by-product cost; and |
| • | a $8.1 million increase due to a lower-of-cost-or-market adjustment of our finished goods inventory; partially offset by |
| • | a $82.9 million decrease in cost of goods sold directly related to the decline in sales volume. |
As a percentage of operating revenues, cost of goods sold decreased to 79.2% from 86.1%.
Gross Profit
Gross profit for the year ended December 31, 2008 increased $103.7 million or 68.7% compared to the same period in 2007. As a percentage of operating revenues, gross profit increased to 20.8% from 13.9%.
52
Table of Contents
Operating Expenses
Operating expenses for the year ended December 31, 2008 increased $35.8 million or 24.6% compared to the same period in 2007. The increase was driven primarily by:
| • | Research and development increased $2.2 million or 8.8%. The increase was largely due to the costs associated with the realignment of our Research and Technology Service organization. As a percentage of operating revenues, research and development decreased to 2.2% from 2.3%. |
| • | Selling, general and administrative increased $32.4 million or 47.0%. The increase was primarily due to $13.4 million associated with our incentive compensation plan, $4.1 million from changes in foreign currency exchange rates, $5.5 million associated with senior executive and other management changes, $3.9 million in severance related charges, $1.2 million related to analysis of refinancing options and $0.8 million related to the initial implementation cost associated with our ERP implementation. As a percentage of operating revenues, selling, general and administrative increased to 8.3% from 6.3%. |
| • | Depreciation and amortization of identifiable intangibles increased $1.2 million or 2.4%. The increase in depreciation and amortization expense reflects assets that were under construction in prior periods that were completed and placed in service, including our IRL plant at our Paulinia, Brazil, facility, accelerated depreciation on the SIS plant assets at our Pernis facility beginning in September 2007, and changes in foreign currency exchange rates. |
Equity in Earnings of Unconsolidated Joint Venture
The Kashima, Japan facility is operated by a manufacturing joint venture with JSR under the name Kraton JSR Elastomers K.K. We use the equity method of accounting for our joint venture at the Kashima site. Earnings in the joint venture decreased $0.2 million or 30.2% for the year ended December 31, 2008 compared to the same period in 2007.
Interest Expense, Net
Interest expense, net for the year ended December 31, 2008 decreased $6.8 million or 15.6% to $36.7 million compared to $43.5 million during the same period in 2007. The decrease was primarily due to lower interest rates, amortized gains from our interest rate swap and lower debt balances. The average debt balances outstanding were $562.7 million and $565.6 million, respectively. The effective interest rates on our debt during the same periods were 6.5% and 7.5%, respectively.
Income Tax Expense
Income tax expense was $8.4 million for the year ended December 31, 2008, as compared to $6.1 million for the year ended December 31, 2007. Income tax expense increased by $2.3 million primarily due to an increase of taxable income. The effective tax rate was 22.9% for the year ended December 31, 2008, as compared to (16.3%) for the year ended December 31, 2007. Our effective tax rate for the current period was less than our statutory rate primarily due to our not recording a tax benefit for certain net operating loss carryforwards generated during that period and our recognition of deferred tax assets on U.S. operations that were previously offset by valuation allowances, as well as a different income mix between foreign and domestic tax jurisdictions. Our effective tax rate for the prior period was less than our statutory rate primarily due to our not recording a tax benefit for certain net operating loss carryforwards generated during that period and a different income mix between foreign and domestic tax jurisdictions.
Net Income (Loss)
Net income was $28.4 million for the year ended December 31, 2008, an improvement of $72.2 million compared to a net loss of $43.7 million in 2007. Earnings and loss per share amounted to $1.46 and $(2.26) in 2008 and 2007, respectively.
53
Table of Contents
Critical Accounting Policies
The application of accounting policies and estimates is an important process that continues to evolve as our operations change and accounting guidance is issued. We have identified a number of critical accounting policies and estimates that require the use of significant estimates and judgments.
Management bases its estimates and judgments on historical experience and on other various assumptions that it believes are reasonable at the time of application. The estimates and judgments may change as time passes and more information becomes available. If estimates and judgments are different from the actual amounts recorded, adjustments are made in subsequent periods to take into consideration the new information.
Inventories. Our inventory is principally comprised of finished goods inventory. Inventories are stated at the lower of cost or market as determined on a FIFO basis. On a quarterly basis, we evaluate the carrying cost of our inventory to ensure that it is stated at the lower of cost or market. Our products are typically not subject to spoiling or obsolescence and consequently our reserves for slow moving and obsolete inventory have historically not been significant. Cash flows from the sale of inventory are reported in cash flows from operations in the consolidated statement of cash flows.
Property, Plant and Equipment. Property, plant and equipment is recorded at cost. Major renewals and improvements that extend the useful lives of equipment are capitalized. Repair and maintenance expenses are charged to operations as incurred. Disposals are removed at carrying cost less accumulated depreciation with any resulting gain or loss reflected in operations. When applicable, we capitalize interest costs that are incurred as part of the cost of constructing major facilities and equipment. We did not record any capitalized interest in any periods presented. Depreciation is provided using the straight-line method over the following estimated useful lives:
| Machinery and equipment |
20 years | |
| Buildings and land improvements |
20 years | |
| Process control equipment |
10 years | |
| Office equipment |
5 years | |
| Research equipment and facilities |
5 years | |
| Vehicles |
5 years | |
| Computer hardware/information systems |
3 years |
Long-Lived Assets. In accordance with Impairment or Disposal of Long-Lived Assets Subsections of FASB ASC Subtopic 360-10, Property, Plant, and Equipment—Overall, FASB Statement No. 144, Accounting for the Impairment or Disposal of Long-Lived Assets, long-lived assets, such as property, plant, and equipment, and purchased intangible assets subject to amortization, are reviewed for impairment whenever events or changes in circumstances indicate that the carrying amount of an asset may not be recoverable. If circumstances require a long-lived asset or asset group be tested for possible impairment, we first compare undiscounted cash flows expected to be generated by that asset or asset group to its carrying value. If the carrying value of the long-lived asset or asset group is not recoverable on an undiscounted cash flow basis, an impairment is recognized to the extent that the carrying value exceeds its fair value. Fair value is determined through various valuation techniques including discounted cash flow models, quoted market values and third-party independent appraisals, as considered necessary.
Income Taxes. We conduct operations in separate legal entities. Income tax amounts are reflected in these consolidated financial statements for each of the jurisdictions in which our legal entities operate.
Net operating losses and credit carryforwards are recorded in the event such benefits are expected to be realized. Deferred taxes result from differences between the financial and tax bases of our assets and liabilities and are adjusted for changes in tax rates and tax laws when changes are enacted. Valuation allowances are recorded to reduce deferred tax assets when it is more likely than not that a tax benefit will not be realized. In
54
Table of Contents
determining whether a valuation allowance is required, the company evaluates primarily (a) the impact of cumulative losses in past years and (b) current and/or recent losses. A recent trend in earnings despite cumulative losses is a pre-requisite to considering not recording a valuation allowance.
In assessing the realizability of deferred tax assets, we consider whether it is more likely than not that some portion or all of the deferred tax assets will not be realized. The ultimate realization of deferred tax assets is dependent upon the generation of future taxable income during the periods in which those temporary differences become deductible. We consider the scheduled reversal of deferred tax liabilities, projected future taxable income and tax planning strategies in making this assessment. Based upon the level of historical taxable income and projections for future taxable income over the periods in which the deferred tax assets are deductible, we believe it is more likely than not that we will realize the benefits of these deductible differences, net of the existing valuation allowances.
Benefit Plans. We sponsor a noncontributory defined benefit pension plan, a non-qualified defined benefit pension plan, and other postretirement benefit plans. The actuarial determination of the projected benefit obligations and related benefit expense requires that certain assumptions be made regarding such variables as expected return on plan assets, discount rates, rates of future compensation increases, estimated future employee turnover rates and retirement dates, distribution election rates, mortality rates, retiree utilization rates for health care services and health care cost trend rates. The selection of assumptions requires considerable judgment concerning future events and has a significant impact on the amount of the obligations recorded in the consolidated balance sheets and on the amount of expense included in the consolidated statements of operations.
Capital market declines experienced during the last half of 2008 have adversely impacted the market value of investment assets used to fund our defined benefit pension plans. Future changes in plan asset returns, assumed discount rates and various other factors related to our pension and post-retirement plans will impact future pension expense and liabilities.
Revenue Recognition. We recognize revenue from the time title transfers. We classify amounts billed to customers for shipping and handling as revenues, with the related shipping and handling costs included in cost of goods sold.
We have entered into agreements with some of our customers, whereby they earn rebates from us when the volume of their purchases of our products reaches certain agreed upon levels. We recognize the rebate obligation under these agreements as a reduction of revenue based on an allocation of the cost of honoring the rebates that are earned to each of the underlying revenue transactions that result in progress by the customer toward earning the rebate.
55
Table of Contents
LIQUIDITY AND CAPITAL RESOURCES
Known Trends and Uncertainties
We are a holding company without any operations or assets other than the investments in our subsidiaries.
Based upon current and anticipated levels of operations, we believe that cash flow from operations of our subsidiaries and borrowings available to us will be adequate for the foreseeable future for us to fund our working capital and capital expenditure requirements and to make required payments of principal and interest on our senior subordinated notes and senior secured credit facility. However, these cash flows are subject to a number of factors, including, but not limited to, earnings, sensitivities to the cost of raw materials, seasonality, currency transactions and currency translation. Since raw material feedstock costs represent approximately 50% of our cost of goods sold, in periods of rising feedstock costs, we consume cash in operating activities due to increases in accounts receivable and inventory, partially offset by increased value of accounts payable. Conversely, in periods where feedstock costs are declining, we generate cash flow from decreases in working capital.
Going forward there can be no assurance that our business will generate sufficient cash flow from operations or that future borrowings will be available under the senior secured credit facility to fund liquidity needs in an amount sufficient to enable us to service our indebtedness. At June 30, 2010, we had $39.4 million of cash and cash equivalents. Our available cash and cash equivalents are held in accounts managed by third-party financial institutions and consist of cash invested in interest bearing funds and cash in our operating accounts. To date, we have experienced no loss or lack of access to our invested cash or cash equivalents; however, we can provide no assurances that access to our invested cash and cash equivalents will not be impacted by adverse conditions in the financial markets. As of June 30, 2010, we had available to us, upon compliance with customary conditions, $80.0 million under the revolving portion of the senior secured credit facility. As of the date hereof, we have no drawings on the revolving portion. While we have met the conditions required to provide us full access to the revolving portion of the senior secured credit facility, we cannot guarantee that all of the counterparties contractually committed to fund a revolving credit draw request will actually fund future requests, although, based upon our present analysis, we currently believe that each of the counterparties would meet their funding requirements. Under the terms of the senior secured credit facility, as amended May 12, 2006, we are subject to certain financial covenants, including maintenance of a minimum interest rate coverage ratio and a maximum leverage ratio. We are required to maintain a fiscal quarter end interest coverage ratio of 3.00:1.00 and we are required to maintain a fiscal quarter end leverage ratio not to exceed 4.00:1.00.
Our failure to comply with any of these financial covenants would give rise to a default under the senior secured credit facility. As of June 30, 2010, we were in compliance with the applicable financial ratios in the senior secured credit facility and the other covenants contained in the senior secured credit facility and the indentures governing the senior subordinated notes and the Senior 12% Discount Notes, or the senior discount notes. The maintenance of these financial ratios is based on our level of profitability. If factors arise that negatively impact our profitability, we may not be able to satisfy our covenants. If we are unable to satisfy such covenants or other provisions at any future time, we would need to seek an amendment or waiver of such financial covenants or other provisions. The respective lenders under the senior secured credit facility may not consent to any amendment or waiver requests that we may make in the future, and, if they do consent, they may not do so on terms that are favorable to us. In the event that we were unable to obtain any such waiver or amendment and we were not able to refinance or repay our debt instruments, our inability to meet the financial covenants or other provisions of the senior secured credit facility would constitute an event of default under our debt instruments, including the senior secured credit facility, which would permit the bank lenders to accelerate the senior secured credit facility.
From time to time, on an ongoing basis, we continue to evaluate options with respect to our overall debt structure, including, without limitation, the possibility of cash purchases, in the open market, privately negotiated transactions or otherwise, of our indebtedness up to amounts permitted under the senior secured credit facility. Such repurchases, if any, will depend on prevailing market conditions, our liquidity requirements, contractual
56
Table of Contents
restrictions and other factors. In 2009, we repurchased a total of $37.0 million in face value of our senior subordinated notes.
Based on December 31, 2009 valuations, we expect to make contributions of $3.9 million to our employee benefit plans in 2010 versus $6.2 million in 2009. If the market value of these assets does not improve during 2010, higher levels of contributions could be required in 2011 and beyond.
Turbulence in the U.S. and international markets and economies may adversely affect our liquidity and financial condition, and the liquidity and financial condition of our customers, to timely replace maturing liabilities, and access the capital markets to meet liquidity needs, resulting in adverse effects on our financial condition and results of operations. However, we have been able to access borrowings available to us in amounts sufficient to fund liquidity needs.
Our ability to pay principal and interest on our indebtedness, fund working capital and make anticipated capital expenditures depends on our future performance, which is subject to general economic conditions and other factors, some of which are beyond our control. See “Risk Factors—Our substantial level of indebtedness could adversely affect our financial condition and prevent us from fulfilling our obligations under the senior secured credit facility and the senior subordinated notes.”
Operating Cash Flows
Net cash used in operating activities totaled $51.0 million for the six months ended June 30, 2010 compared to $4.7 million net cash provided by operating activities during the same period in 2009. This $55.7 million change was driven primarily by:
| • | a $30.8 million increase in accounts receivable due to the increase in sales volume for the first six months of 2010 versus the first six months of 2009; and |
| • | a $129.7 million increase in inventories of products, materials and supplies, largely due to increases in the cost of raw materials and sales volume; partially offset by |
| • | a $79.0 million increase in earnings; |
| • | a $12.1 million increase in accounts payable primarily due to the increase of inventories of products, materials and supplies, reflecting increases in the cost of raw materials and sales volume; and |
| • | a $11.7 million increase due to/from affiliate, primarily due to the timing of payments for purchases made from our unconsolidated joint venture. |
Cash and cash equivalents decreased from $69.3 million at December 31, 2009 to $39.4 million at June 30, 2010. Including amounts undrawn on our revolving loans, which amounted to $80.0 million at June 30, 2010 and December 31, 2009, liquidity, defined as cash and cash equivalents plus the undrawn amount of our revolving loans, amounted to $119.4 million at June 30, 2010 and $149.3 million at December 31, 2009.
Net cash provided by operating activities increased $32.6 million to $72.8 million in 2009 compared to $40.2 million provided by operating activities during the same period in 2008. This change was driven primarily by:
| • | a $130.8 million decrease in inventories of products, materials and supplies, largely due to decreases in the cost of raw material feedstocks and sales volume; |
| • | a $1.1 million decrease in other assets largely due to the timing of certain payments; and |
| • | a $3.8 million increase in accounts payable primarily due to the timing of payments; partially offset by |
| • | a $59.5 million increase in accounts receivable due to the increase in sales volume in the fourth quarter of 2009 versus the fourth quarter of 2008; |
57
Table of Contents
| • | a $23.8 million gain on the extinguishment of debt; and |
| • | a $28.7 million in lower earnings. |
Cash and cash equivalents decreased from $101.4 million at December 31, 2008 to $69.3 million at December 31, 2009. Including amounts undrawn on our revolving loans, which amounted to $80.0 million at December 31, 2009 and $25.5 million at December 31, 2008, liquidity, defined as cash and cash equivalents plus the undrawn amount of our revolving loans, amounted to $149.3 million at December 31, 2009 and $126.9 million at December 31, 2008.
Net cash provided by operating activities decreased $41.5 million to $40.2 million in 2008 compared to $81.7 million in 2007. This change was driven primarily by:
| • | a $104.5 million increase in inventories of products, materials and supplies, largely due to an increase in the cost of raw material feedstocks; |
| • | a $24.1 million decrease in accounts payable, indicative of the decline in sales volume; and |
| • | a $20.7 million increase in due to/from affiliate, primarily due to the timing of payments for purchases made from our unconsolidated joint venture; partially offset by |
| • | a $34.1 million decrease in accounts receivable due to an improvement in days sales outstanding and the decline in sales volume; and |
| • | a $72.2 million increase in net income. |
Cash and cash equivalents increased from $48.3 million at December 31, 2007 to $101.4 million at December 31, 2008. Including amounts undrawn on our revolving loans, which amounted to $25.5 million at December 31, 2008 and $75.5 million at December 31, 2007, liquidity, defined as cash and cash equivalents plus the undrawn amount of our revolving loans, amounted to $126.9 million at December 31, 2008 and $123.8 million at December 31, 2007.
Investing Cash Flows
Net cash used in investing activities totaled $19.4 million for the six months ended June 30, 2010 compared to net cash used in investing activities of $22.8 million during the same period in 2009.
Net cash used in investing activities totaled $49.6 million in 2009 compared to net cash used in investing activities of $24.1 million during the same period in 2008. This $25.5 million increase was primarily driven by timing of capital expenditures. We are upgrading certain systems and operating controls at our Belpre facility. This project is designed to significantly improve the effectiveness, competitiveness and operating efficiency of the Belpre facility. The project began in the second-half of 2008 and will be completed in distinct phases extending into 2012, with 2009 spending of $9.1 million. We also incurred approximately $15.3 million for an ERP software system upgrade, which we began implementing in January 2009. We upgraded our ERP software systems utilizing a single global system and implementing best practices for our industry. For Europe and the United States, we completed this upgrade in August 2009 and for Brazil and Asia, we completed this upgrade in October 2009.
Net cash used in investing activities totaled $24.1 million in 2008 compared to net cash used in investing activities of $28.7 million in 2007. This $4.6 million decrease was primarily driven by timing of capital expenditures.
Expected Capital Expenditures
We expect 2010 capital expenditures will be approximately $50.0 million to $55.0 million. Our minimum annual capital expenditure levels to maintain and achieve required improvements in our facilities in each of the
58
Table of Contents
next three to five years are expected to be approximately $12.0 million to $16.0 million. Included in our 2010 capital expenditure estimate is approximately $9.0 million for the second phase of the Belpre facility systems and control upgrades, approximately $11.0 million to replace IR production from our Pernis facility, approximately $6.0 million for the IRL expansion and approximately $5.0 million for building upgrades at our Belpre facility.
Financing Cash Flows and Liquidity
Our consolidated capital structure as of June 30, 2010 was approximately 50.0% equity and 50.0% debt compared to approximately 27.0% equity and 73.0% debt as of June 30, 2009, approximately 47.5% stockholders’ / member’s equity and 52.5% debt as of December 31, 2009, and approximately 24.7% member’s equity and 75.3% debt as of December 31, 2008.
Net cash provided by financing activities totaled $13.2 million for the six months ended June 30, 2010 compared to $59.3 million net cash used in financing activities during the same period in 2009. This increase was driven primarily by:
| • | $10.7 million in net proceeds from the exercise of the underwriters’ over-allotment option in January 2010; |
| • | $11.2 million to purchase and extinguish $30.7 million face value of our senior subordinated notes in 2009; and |
| • | $50.0 million repayment on the revolving portion of the senior secured credit facility in June 2009. |
Net cash used in financing activities totaled $40.6 million in 2009 compared to $46.1 million net cash provided by financing activities in 2008. This change was driven primarily by:
| • | a pre-payment of $100 million on the term loan portion of the senior secured credit facility in December 2009; |
| • | a $50.0 million repayment on the revolving portion of the senior secured credit facility in 2009; |
| • | $11.2 million to purchase and extinguish $30.7 million face value of our senior subordinated notes in 2009; |
| • | $3.2 million of fees in connection with the amendment to our Term Loan and Revolving loan in 2009; and |
| • | a $50 million draw on the revolving portion of the senior secured credit facility in September 2008; partially offset by |
| • | $126.7 million in proceeds from the issuance of common stock in December 2009. |
Net cash provided by financing activities totaled $46.1 million in 2008 compared to $43.9 million net cash used in financing activities in 2007. This change was driven primarily by:
| • | a voluntary pre-payment of $40 million on the term loan portion of the senior secured credit facility in September 2007; and |
| • | a $50 million draw on the revolving portion of the senior secured credit facility in September 2008. |
Other Contingencies
As a chemicals manufacturer, our operations in the United States and abroad are subject to a wide range of environmental laws and regulations at both the national and local levels. These laws and regulations govern, among other things, air emissions, wastewater discharges, solid and hazardous waste management, site remediation programs and chemical use and management.
59
Table of Contents
Pursuant to these laws and regulations, our facilities are required to obtain and comply with a wide variety of environmental permits for different aspects of their operations. Generally, many of these environmental laws and regulations are becoming increasingly stringent, and the cost of compliance with these various requirements can be expected to increase over time.
Management believes that we are in material compliance with all current environmental laws and regulations. We estimate that any expenses incurred in maintaining compliance with these requirements will not materially affect our results of operations or cause us to exceed our level of anticipated capital expenditures. However, we cannot give assurances that regulatory requirements or permit conditions will not change, and we cannot predict the aggregate costs of additional measures that may be required to maintain compliance as a result of such changes or expenses.
In the context of the separation in February 2001, Shell Chemicals agreed to indemnify us for specific categories of environmental claims brought with respect to matters occurring before the separation. However, the indemnity from Shell Chemicals is subject to dollar and time limitations. Coverage under the indemnity also varies depending upon the nature of the environmental claim, the location giving rise to the claim and the manner in which the claim is triggered. Therefore, if claims arise in the future related to past operations, we cannot give assurances that those claims will be covered by the Shell Chemicals’ indemnity and also cannot be certain that any amounts recoverable will be sufficient to satisfy claims against us.
In addition, we may in the future be subject to claims that arise solely from events or circumstances occurring after February 2001, which would not, in any event, be covered by the Shell Chemicals’ indemnity. While we recognize that we may in the future be held liable with respect for remediation activities beyond those identified to date, at present we are not aware of any circumstances that are reasonably expected to give rise to remediation claims that would have a material adverse effect on our results of operations or cause us to exceed our projected level of anticipated capital expenditures.
We had no material operating expenditures for environmental fines, penalties, government imposed remedial or corrective actions during the years ended December 31, 2009, 2008 or 2007.
Off-Balance Sheet Transactions
We are not involved in any off-balance sheet transactions as of June 30, 2010.
Contractual Obligations
Our principal outstanding contractual obligations relate to the long-term debt under the senior secured credit facility and the senior subordinated notes, the operating leases of some of our facilities and the feedstock contracts with Shell Chemicals and its affiliates, Lyondell-Basell and other suppliers to provide us with styrene, butadiene and isoprene. The following table summarizes our contractual cash obligations for the periods indicated.
Contractual Obligations as of December 31, 2009:
| Payments Due by Period | |||||||||||||||||||||
| Dollars in Millions |
Total | 2010 | 2011 | 2012 | 2013 | 2014 | 2015 and after | ||||||||||||||
| Long-term debt obligations |
$ | 385.0 | $ | 2.3 | $ | 2.3 | $ | 109.1 | $ | 108.0 | $ | 163.3 | $ | 0.0 | |||||||
| Estimated interest payments on debt |
89.2 | 21.0 | 23.1 | 22.3 | 16.2 | 6.6 | 0.0 | ||||||||||||||
| Operating lease obligations |
33.2 | 5.4 | 5.0 | 4.9 | 2.5 | 2.3 | 13.1 | ||||||||||||||
| Purchase obligations (1)(2) |
2,681.4 | 202.1 | 192.8 | 170.7 | 135.1 | 126.3 | 1,854.4 | ||||||||||||||
| Total contractual cash obligations |
$ | 3,188.8 | $ | 230.8 | $ | 223.2 | $ | 307.0 | $ | 261.8 | $ | 298.5 | $ | 1,867.5 | |||||||
| (1) | Pursuant to two feedstock supply contracts with Shell Chemicals or its affiliates, we are obligated to purchase minimum quantities of isoprene each year. If we do not meet these minimums, we are obligated to |
60
Table of Contents
| pay a penalty of approximately $300 per ton up to a maximum aggregate penalty of approximately $2.2 million. Pursuant to the styrene and butadiene feedstock supply contracts with Shell Chemicals and its affiliates, we are obligated to purchase minimum quantities. The contracts do not contain a stated penalty for failure to purchase the minimum quantities. However, if we do not purchase the minimum requirements, it is required under the terms of the contracts to meet with Shell Chemicals in an effort to determine a resolution equitable to both parties. |
| (2) | Pursuant to production agreements with LyondellBasell, we are obligated to pay a minimum indirect service fee each year of approximately $21.6 million. Not included in this table are future obligations arising under our Operating Agreements and Site Services, Utilities, Materials and Facilities Agreements that do not specify fixed or minimum quantities of goods or services to be purchased and do not contain fixed, minimum or variable price provisions. Under such agreements, our obligations to third parties are based on costs incurred by them in connection with the operation and maintenance of, and other services provided to, our European facilities. The terms of these agreements range between 20 years and 40 years and each agreement includes bilateral renewal rights. During the years ended December 31, 2009, 2008 and 2007, we incurred costs aggregating $92 million, $70 million and $70 million, respectively, under these agreements. |
Impact of Inflation
Our results of operations and financial condition are presented based on historical cost. While it is difficult to accurately measure the impact of inflation due to the imprecise nature of the estimates required, we believe the effects of inflation, if any, on our results of operations and financial condition have been immaterial.
OTHER ISSUES
New Accounting Pronouncements
The following new accounting pronouncement has been issued, but has not yet been adopted as of June 30, 2010:
In October 2009, FASB issued Accounting Standards Update (“ASU”), Number 2009-13 “Revenue Recognition (Topic 605): Multiple-Deliverable Revenue Arrangements—a consensus of the FASB Emerging Issues Task Force.” This update amends the revenue recognition guidance for arrangements with multiple deliverables. The amendments allow vendors to account for products and services separately rather than as a combined unit. A selling price hierarchy for determining the selling price of each deliverable is established in this ASU, along with eliminating the residual method. The amendments are effective for revenue arrangements that begin or are changed in fiscal years that start June 15, 2010 or later. We are in the process of assessing the provisions of this new guidance and currently do not expect that the adoption will have a material impact on our consolidated financial statements.
Quantitative and Qualitative Disclosures About Market Risk
We are exposed to market risk from changes in interest rates, foreign currency exchange rates, credit risk and commodity prices.
Interest Rate Risk. We have $220.6 million of variable rate debt outstanding under the term facility as of June 30, 2010. The loans made under the term facility bear interest at a rate equal to the adjusted Eurodollar rate plus 2.00% per annum or, at Kraton’s option, the base rate plus 1.00% per annum. The loans made under the portion of the revolving facility extended pursuant to the November 2009 amendment of Kraton’s senior secured credit agreement, or November 2009 Amendment, bear interest at a rate equal to the adjusted Eurodollar rate plus a margin of between 3.00% and 3.50% per annum (depending on Kraton’s consolidated leverage ratio) or at Kraton’s option, the base rate plus a margin of between 2.00% and 2.50% per annum (also depending on Kraton’s consolidated leverage ratio). The terms of the $0.2 million portion of the revolving facility that was not extended pursuant to November 2009 Amendment were not changed. Loans made under this portion of the
61
Table of Contents
revolving facility bear interest at a rate equal to the adjusted Eurodollar rate plus a margin of between 2.00% and 2.50% per annum (depending on Kraton’s leverage ratio), or at Kraton’s option, the base rate plus a margin of between 1.00% and 1.50% per annum (also depending on Kraton’s leverage ratio). The variable rate debt under the term facility is fully hedged with interest rate swap contracts in place through January 3, 2012. See “Description of Certain Indebtedness.”
In May 2009, we entered into a $310.0 million notional amount interest rate swap agreement to hedge or otherwise protect against Eurodollar interest rate fluctuations on a portion of our variable rate debt. This agreement was effective on January 4, 2010 and expires on January 3, 2011 and has a fixed rate of 1.53%, which results in a fixed rate of 3.53%. In December 2009, we made a $100.0 million payment of outstanding indebtedness under the term facility, reducing the principal amount outstanding from approximately $323.0 million to approximately $223.0 million. As a result, we were required to discontinue hedge accounting prospectively as the hedging relationship failed to meet all of the criteria set forth in ASC 815, “Derivatives and Hedging,” specifically the notional amount of the swap and the principal amount of the debt were no longer equal and the forecasted transaction was no longer probable of occurring based on the original hedge documentation. We have elected to redesignate the cash flow hedge relationship for approximately $218.0 million notional amount out of the total $310.0 million notional amount interest rate swap agreement. We recorded a gain of $0.3 million and $0.0 million in interest expense related to the ineffective portion and a gain of $0.5 million and a loss of $0.5 million in accumulated other comprehensive income related to the effective portion of the hedge for the six months ended June 30, 2010 and June 30, 2009, respectively. In December 2009, we recorded $0.8 million in interest expense related to the ineffective portion and $1.9 million in accumulated other comprehensive income related to the effective portion of the hedge.
In June 2010, we entered into a $215.0 million notional amount interest rate swap agreement to hedge or otherwise protect against Eurodollar interest rate fluctuations on a portion of our variable rate debt. This agreement will be effective on January 3, 2011 and expires on January 3, 2012 and has a fixed rate of 0.87%, which will result in a fixed rate of 2.87%. We recorded an unrealized loss of $0.2 million in accumulated other comprehensive income related to the effective portion of this hedge for the quarter ended June 30, 2010.
Foreign Currency Risk. We conduct operations in many countries around the world. Our results of operations are subject to both currency transaction risk and currency translation risk. We incur currency transaction risk whenever we enter into either a purchase or sale transaction using a currency other than the local currency of the transacting entity. With respect to currency translation risk, our financial condition and results of operations are measured and recorded in the relevant domestic currency and then translated into U.S. dollars for inclusion in our historical consolidated financial statements. In recent years, exchange rates between these currencies and U.S. dollars have fluctuated significantly and may do so in the future. For the six months ended June 30, 2010, 45% of total operating revenues were generated from customers located in the Americas, 35% in Europe and 20% in the Asia Pacific region. Although we sell and manufacture our products in many countries, our sales and production costs are mainly denominated in U.S. dollars, Euros, Japanese Yen and Brazilian Real.
We take steps to minimize risks from foreign currency exchange rate fluctuations through normal operating and financing activities and, when deemed appropriate, through the use of derivative instruments. We do not enter into any speculative positions with regard to derivative instruments. From time to time, we use hedging strategies to reduce our exposure to currency fluctuations.
In May 2010, we entered into multiple non-deliverable forward contracts to reduce our exposure to fluctuations in the Brazilian Real to U.S dollar associated with the funding of the debottleneck and expansion of our IRL capacity at our Paulina, Brazil, facility, for the notional amounts of R$2.7 million, R$7.1 million, and R$7.8 million with expiration dates of June 30, September 30, and December 31, 2010, respectively. The non-deliverable forward contracts qualify for hedge accounting and were designated as net investment hedges in accordance with ASC 815-35 “Net Investment Hedges.” We recorded a $0.1 million gain in accumulated other comprehensive income related to the effective portion of the hedge for the six months ended June 30, 2010. At
62
Table of Contents
June 30, 2010, the favorable / (unfavorable) fair value of the non-deliverable forward contracts was $0.1 million. The following table summarizes the approximate impact that a change in exchange rates would have on the fair values of our non-deliverable forward contracts.
| Change | Approximate Impact of Foreign Exchange Forward Contracts |
||||||
| (in thousands) | |||||||
| Real/USD exchange rate |
+10 | % | $ | (783 | ) | ||
| Real/USD exchange rate |
-10 | % | $ | 1,132 | |||
The impact from foreign currency exchange rate fluctuations historically has not had a material impact on our financial position or results of operations. For the six months ended June 30, 2010 and 2009, the estimated pre-tax loss from currency fluctuations, including the cost of hedging strategies, amounted to $1.2 million and $3.6 million, respectively.
Credit Risk. Our customers are diversified by industry and geography with approximately 700 customers in approximately 60 countries worldwide. We do not have concentrations of receivables from these industry sectors throughout these countries. The global economic downturn may affect our overall credit risk. Where exposed to credit risk, we analyze the counterparties’ financial condition prior to entering into an agreement, establish credit limits and monitor the appropriateness of those limits on an ongoing basis. We also obtain cash, letters of credit or other acceptable forms of security from customers to provide credit support, where appropriate, based on our financial analysis of the customer and the contractual terms and conditions applicable to each transaction.
Commodity Price Risk. We are subject to commodity price risk under agreements for the supply of our raw materials and energy.
63
Table of Contents
Industry Overview
Elastomers are a diverse family of polymers that include natural and synthetic rubbers. Elastomers, as their name suggests, exhibit elastic or rubber-like characteristics. Thermoplastic elastomers, or TPEs, are a category of elastomers that are particularly desirable because, unlike other elastomers, they can be melted and reformed when heated, which reduces processing cost, time, energy use and waste. Styrenic block copolymers, or SBCs, are a high performance subset of TPEs. SBCs are used globally in a wide variety of industrial and consumer applications.
The global demand for SBCs in 2009 exceeded 1,400 kilotons, resulting in sales of approximately $3.3 billion. According to management estimates, SBC demand for non-footwear applications grew at a compound annual growth rate of approximately 6.5% between 2001 and 2009. In 2008 and 2009, the SBC market demand was negatively impacted by the global economy. Prior to the economic downturn, SBC demand for non-footwear applications grew at a compound annual growth rate of approximately 9.0% between 2001 and 2007, or approximately 2.7 times global real GDP. Our estimates indicate that global SBC demand is currently concentrated in developed industrial regions, with approximately 21% of industry volumes in North and South America, approximately 26% of industry volumes in Europe, the Middle East and Africa and approximately 53% of industry volumes in Asia Pacific.
SBCs are primarily sold into four end uses: (1) Advanced Materials (compounding, personal care and polymer systems); (2) Adhesives, Sealants and Coatings; (3) Paving and Roofing; and (4) Footwear. Due to the higher selling prices in the Advanced Materials, Adhesives, Sealants and Coatings and Paving and Roofing end uses relative to the Footwear end use, the relative market share by end use on a revenue basis is meaningfully different than on a volume basis.
SBC demand is satisfied by several competitors worldwide. We believe the top four producers supply 60% of the SBC products consumed globally by revenue. We believe we have approximately 30% (excluding Footwear and Other) market share while the next largest competitor in the SBC industry has approximately 16% market share in terms of 2009 sales revenue. Our most significant competitors in the SBC industry are: Asahi Chemical, Chi Mei, Dexco Polymers, Dynasol Elastomers, Kuraray, Korea Kumho P.C., Lee Chang Yung, LG Chemical, Polimeri Europa, Sinopec, Taiwan Synthetic Rubber Corporation and Zeon Corporation. We also compete in each of our end use markets against non-SBC products that perform in a similar manner to our products.
64
Table of Contents
SBC Products
As illustrated in the table below, there are two major types of SBCs: hydrogenated styrenic block copolymers, or HSBCs, and unhydrogenated styrenic block copolymers, or USBCs.
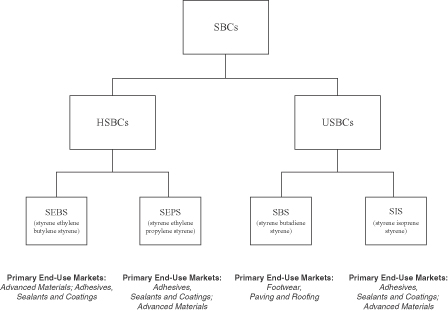
HSBCs
HSBCs are produced in two primary configurations: SEBS (styrene-ethylene-butylene-styrene) and SEPS (styrene-ethylene-propylene-styrene), each in multiple grades. Generally, SEBS grades are used in Advanced Materials applications for general molded or extruded goods, including a broad range of consumer and industrial products requiring soft-touch characteristics. SEPS grades are more commonly used in the manufacture of adhesives and oil gels.
HSBC products are significantly more complex to produce than USBC products and, consequently, generate higher margins and generally command selling prices between two and three times those for USBCs. We believe our 45% end use market share of 2009 HSBC sales revenue leads the industry and is more than twice the size of our closest competitor. The HSBC class of products, which is typically more durable than USBC products, is primarily used in higher value-added Advanced Materials and Adhesives, Sealants and Coatings applications. We estimate that HSBCs accounted for approximately 21% of worldwide SBC industry sales revenue in 2009.
HSBCs are primarily used in our Advanced Materials and our Adhesives, Sealants and Coatings end use markets, to impart improved performance characteristics such as:
| • | stretch properties in disposable diapers and adult incontinence products; |
| • | soft feel in numerous consumer products such as the handles for razor blades, power tools and automobile interiors; |
| • | impact resistance for demanding engineering plastic applications; |
| • | flexibility for wire and cable plastic outer layers; and |
| • | improved flow characteristics for many industrial and consumer sealants and lubricating fluids. |
USBCs
USBCs are produced in two primary configurations: SBS (styrene-butadiene-styrene) and SIS (styrene-isoprene-styrene). In 2009, we estimate that USBCs represented approximately 79% of worldwide SBC industry sales revenue and were used primarily in Footwear, Paving and Roofing, and Adhesives, Sealants and Coatings end uses.
65
Table of Contents
SBS. In 2009, we estimate that SBS products accounted for approximately 88% of worldwide USBC sales volumes. SBS is sold in both unmodified and “oil-extended” forms (blended with various amounts of oil to achieve the desired characteristics). The oil-extended grades of SBS are widely used in the Footwear end use market. Unmodified grades of SBS are used in all four end use markets, particularly Paving and Roofing and Footwear. We expect growth in SBS sales to be driven by the global expansion of adhesive and compounding applications and increasing penetration of modified asphalts in roofing and roadway construction.
SIS. In 2009, we estimate that SIS products accounted for approximately 12% of worldwide USBC sales volumes. SIS use is concentrated in the Adhesives, Sealants and Coatings end use market because it provides superior specific adhesion and thermal behavior. SIS products have historically generated higher margins than SBS products due to their enhanced performance characteristics and their ability to add value to products used in adhesive applications. In addition, SIS is more difficult to produce than SBS due to the need for more demanding process controls and finishing technology. We expect growth in SIS sales to come primarily from increasing demand for hot-melt adhesive solutions used in the production of personal hygiene products and adhesives for tapes and labels and construction applications.
We believe that our 25% market share of 2009 USBC sales revenue, excluding the Footwear end use market, leads the industry, and is approximately 1.3 times that of our closest competitor in terms of 2009 sales revenue.
USBCs are used in all our end use markets in a range of products to impart desirable characteristics, such as:
| • | resistance to temperature and weather extremes in roads and roofing; |
| • | resistance to cracking, reduced sound transmission and better drainage in porous road surfaces; |
| • | impact resistance for consumer plastics; and |
| • | increased processing flexibility in materials used in disposable diapers and adhesive applications, such as packaging tapes and labels. |
End Uses for SBCs
SBCs are primarily sold into four end uses: (i) Advanced Materials, or compounding, personal care and polymer systems; (ii) Adhesives, Sealants and Coatings; (iii) Paving and Roofing; and (iv) Footwear. We estimate that approximately 19% of the total 2009 industry SBC volume was consumed in Advanced Materials, approximately 35% was consumed in Paving and Roofing, approximately 21% was consumed in Adhesives, Sealants and Coatings and approximately 25% was consumed in Footwear and Other. Due to the higher selling prices in the Advanced Materials, Adhesives, Sealants and Coatings and Paving and Roofing end uses relative to the Footwear and Other end use, the relative share by end use on a revenue basis is meaningfully different than on a volume basis. Based on our management estimates, on a revenue basis, approximately 24% of total industry SBC revenue in 2009 was related to Advanced Materials applications, approximately 31% was related to Paving and Roofing, approximately 26% was related to Adhesives, Sealants and Coatings applications and approximately 19% was related to Footwear and Other.
Advanced Materials. We estimate that Advanced Materials as an end use represented approximately 19% of 2009 SBC industry sales volumes and approximately 24% of 2009 SBC industry revenue. According to management estimates, these applications grew at a compound annual growth rate of 7.4% from 2001 through 2009. In general, SBCs are compounded with other polymers (for example, polypropylene) in relatively small amounts (typically less than 30%) to yield desired performance characteristics while constituting a small portion of the cost of the final product. Examples of Advanced Materials products include soft touch for consumer products (tooth brushes and razor blades) and power tools, impact resistant engineering plastics, automotive interior components, elastic films for disposable diapers and adult incontinence branded products, skin care products and lotions, disposable food packaging, and medical packaging films and tubing, often as an alternative to PVC. HSBC applications are projected to grow faster than USBC applications.
66
Table of Contents
In Advanced Materials industry applications, SBCs compete with other polymers (including PVCs, EPDM, thermoplastic vulcanizates and natural rubber) based on performance, ease of use, desired aesthetics and total end-product cost.
Adhesives, Sealants and Coatings. We estimate that Adhesives, Sealants and Coatings as an end use represented approximately 21% of 2009 SBC industry sales volumes and approximately 26% of 2009 SBC industry revenue. According to management estimates, demand for SBCs in Adhesives, Sealants and Coatings grew at a compound annual growth rate of 5.9% from 2001 through 2009. We expect industry growth to be supported by the continuing substitution of adhesives for mechanical fastening systems and the growing demand within developing countries for disposable hygiene products that contain adhesives and sealants. Examples of Adhesives, Sealants and Coatings products include tapes and labels, non-woven and industrial and industrial and consumer weather sealants.
In various adhesives and sealant applications, SBCs compete with acrylics, solvent-based rubber systems and silicones based on bond strength, specific adhesion, consistent performance to specification, processing speed, water resistance, hot-melt application and total end-product cost.
Paving and Roofing. We estimate that Paving and Roofing as an end use represented approximately 35% of 2009 SBC industry sales volumes and approximately 31% of 2009 SBC industry revenue. According to management estimates, the demand for SBCs in Paving and Roofing grew at a compound annual growth rate of 6.5% from 2001 through 2009 due to the increased demand for improved durability of SBC-modified asphalt products, as well as growing penetration rates in many developing economies. Examples of Paving and Roofing products include asphalt modification for performance roadways and asphalt modification for roofing felts and shingles.
Asphalt modification applications involve the addition of small amounts of SBS, typically about 2% to 6% by weight to asphalt used in road paving and approximately 11% by weight in roofing felts and shingles, to enhance the properties of the end product. Many end users have determined that the increased cost of installing SBS-enhanced asphalt is offset by future maintenance savings and the benefit of less disruption due to the increased durability.
In asphalt modification, SBCs compete with atactic polypropylene, EPDM, ethylene vinyl acetate resins and unmodified asphalts based on total end-product performance and cost and ease-of-use.
Footwear. We estimate that Footwear as an end use represented approximately 24% of 2009 SBC industry sales volumes and approximately 16% of 2009 SBC industry revenue. According to management estimates, the demand for SBC in Footwear declined by a compound annual growth rate of 1.7% from 2001 through 2009 due to changes in fashion and substitution by lighter materials in shoe soling. This application is the most commoditized demand for SBCs with high competitive intensity and management estimates that SBC demand in Footwear applications will continue to decline in the future.
SBCs are used in Footwear applications to impart flexibility, durability, strong elastomeric properties at low temperatures, thermal insulation and ease of coloration to shoe soles. There are also niche applications in high-performance outdoor footwear that demand the superior traction and durability provided by SBCs. In Footwear applications, SBCs compete with leather, PVC, various synthetic and natural rubbers and polyurethane materials, based on appearance and feel, durability, grip and ease of processing.
Manufacturing Processes
Both USBCs and HSBCs are produced by anionic polymerization. This process involves joining polymer chains consisting of blocks of styrene and either butadiene or isoprene, in the presence of a solvent. The solvent is a processing aid and must be removed to recover the final product. In the case of USBCs, the solvent removal
67
Table of Contents
occurs immediately after polymerization. Steam is typically applied to the polymer/solvent mixture to evaporate the solvent. The remaining polymer is then compressed to remove the water produced by the steam and air-dried, leaving behind dry pellets of USBC products, which are then packaged and shipped.
The manufacture of HSBCs follows a similar process to that of USBCs, except that the polymer goes through a hydrogenation process prior to removal of the solvent. After polymerization, a chemical catalyst and hydrogen are added to the mix to hydrogenate the base USBC. The resulting polymer mixture then undergoes a solvent removal process. Similar to USBC production, steam is applied to remove the solvent. The remaining product mix is air-dried and then packaged and shipped. HSBCs are significantly more difficult to produce than USBCs because of the hydrogenation process. This critical step introduces sufficient complexity into the production process such that only a handful of manufacturers have been able to produce HSBCs of consistent quality in commercial quantities.
68
Table of Contents
General
Our Company
We believe we are the world’s leading producer of styrenic block copolymers (SBCs) as measured by 2009 sales revenue. We market our products under the widely recognized Kraton® brand. SBCs are highly-engineered synthetic elastomers that we invented and commercialized over almost 50 years ago, which enhance the performance of numerous end use products, imparting greater flexibility, resilience, strength, durability and processability. We focus on the end use markets we believe offer the highest growth potential and greatest opportunity to differentiate our products from competing products. Within these end use markets, we believe that we provide our customers with a broad portfolio of highly-engineered and value-enhancing polymers that are critical to the performance of our customers’ products. We seek to maximize the value of our product portfolio by introducing innovations that command premium pricing and by consistently upgrading from lower margin products. As the industry leader, we believe we maintain significant competitive advantages, including an almost 50-year proven track record of innovation; world-class technical expertise; customer, geographical and end use market diversity; and industry-leading customer service capabilities. These advantages are supported by a global infrastructure and a long history of successful capital investments and operational excellence.
Our SBC products are found in many everyday applications, including disposable baby diapers, the rubberized grips of toothbrushes, razor blades, power tools and in asphalt formulations used to pave roads. We believe that there are many untapped uses for our products, and we will continue to develop new applications for SBCs. We also develop, manufacture and market niche, non-SBC products that we believe have high growth potential, such as isoprene rubber latex, or IRL. IRL is a highly-engineered, reliable synthetic substitute for natural rubber latex. We believe the versatility of IRL offers significant opportunities for new, high-margin applications. Our IRL products, which are used in applications such as surgical gloves and condoms, have not been found to contain the proteins present in natural latex and are, therefore, not known to cause allergies. We believe we produce the highest purity IRL globally and that we are the only significant third-party supplier of the product. Our IRL business has grown at a compound annual growth rate of 28.8%, based on revenues, from 2007 to 2009.
We currently offer approximately 800 products to more than 700 customers in over 60 countries worldwide, and we manufacture our polymers at five manufacturing facilities on four continents, including our flagship plant in Belpre, Ohio, the most diversified SBC plant in the world. The plant in Japan is operated by an unconsolidated manufacturing joint venture. Our products are typically developed using our proprietary, and in many cases patent-protected, technology and require significant engineering, testing and certification. In 2009, we were awarded 94 patents for new products or applications and at December 31, 2009, we had approximately 1,000 granted patents and approximately 381 pending patent applications. We are widely regarded as the industry’s leading innovator and cost-efficient manufacturer in our end use markets. We work closely with our customers to design products that meet application-specific performance and quality requirements. We expect these innovations to drive our organic growth, sustain our leadership position, expand our market share, improve our margins and produce a high return on invested capital. For example, in 2008, we developed a family of environmentally-friendly products as an alternative to materials like polyvinyl chloride, or PVC, for medical packaging applications and wire and cable applications in electronics and automobiles.
Over the past several years, we have implemented a range of strategic initiatives designed to enhance our profitability and end use market position. These include fixed asset investments to expand our capacity in high value products, to enhance productivity at our existing facilities and to significantly reduce our fixed cost structure through head count reductions, production line closures at our Pernis facility and system upgrades. During this period, we have shifted our portfolio to higher-margin products, substantially exited low-margin businesses such as footwear and implemented smart pricing strategies that have improved our overall margins and return on invested capital. We believe these initiatives provide us with a strong platform to drive growth, create significant operating leverage and position us to benefit from volume recovery in our end use markets.
69
Table of Contents
We believe that starting in late 2008 the global economic downturn, and associated reduction in customer and end-user inventory levels, caused an unprecedented slowdown across the industry. We experienced a decline in sales volume across all of our end use markets, including the traditionally more stable consumer and medical applications. We believe that a significant factor in this decline was inventory de-stocking. Our first and second quarter 2009 sales volumes were 39% and 24%, respectively, less than our sales volumes in the comparable 2008 quarters. The trend began to reverse itself in June 2009, as demand patterns began to shift towards recovery such that our third quarter 2009 sales volume was 10% less than the sales volume in the third quarter of 2008 and our fourth quarter 2009 sales volume was 16% above the sales volume in the fourth quarter of 2008. More recently, we have seen demand returning to more normal levels, with first-half 2010 sales volume up 34% compared to the first-half of 2009.
Corporate History
Prior to February 28, 2001, we operated as a number of business units as a part of Shell Chemicals and did not exist as a stand-alone entity. On February 28, 2001, Ripplewood Chemical Holding LLC, or Ripplewood Chemical, acquired us from Shell Chemicals through a master sale agreement. On December 23, 2003, Polymer Holdings acquired all of Kraton’s outstanding equity interests from Ripplewood Chemical. Prior to our initial public offering and related reorganization transactions described below, we were an indirect wholly-owned subsidiary of TJ Chemical Holdings LLC, or TJ Chemical, and were indirectly owned by TPG and JPMP, and certain members of our management.
Initial Public Offering
We conduct our business through Kraton and its consolidated subsidiaries. Prior to our initial public offering, Kraton’s parent company was Polymer Holdings LLC, a Delaware limited liability company. On December 16, 2009, Polymer Holdings was converted from a Delaware limited liability company to a Delaware corporation and renamed Kraton Performance Polymers, Inc., which remains Kraton’s parent company. In addition, prior to the closing of the initial public offering, TJ Chemical was merged into (and did not survive the merger with) Kraton. Trading in our common stock on the New York Stock Exchange commenced on December 17, 2009 under the symbol “KRA.” On December 22, 2009, we completed our initial public offering. Including 887,082 shares issued on January 7, 2010 following the exercise of the underwriters’ over-allotment option, the aggregate shares issued in connection with the initial public offering amounted to 11,181,200 shares, at a price of $13.50 per share, and the net proceeds after the underwriting discounts and commissions and fees and expenses amounted to approximately $137.4 million. We used $100.0 million of the net proceeds to prepay outstanding indebtedness, approximately $7.7 million for strategic capital projects, such as alternative production capabilities for IR, the development of additional capacity in our IRL business, continuation of our upgrade of certain systems and operating controls at our Belpre, Ohio facility, and approximately $29.7 million for general corporate purposes. Except with respect to proceeds used to repay debt, the foregoing amounts reflect reasonable estimates of our use of the net proceeds of the offering.
Our Competitive Strengths
We believe the following competitive strengths help us to sustain our market leadership position and contribute to our ability to generate superior margins and strong cash flow. We expect these strengths to support our growth in the future:
The Market Leader in SBCs
We believe we hold the number one global market position, based on 2009 sales revenue, in each of our four core end use markets, with sales of approximately $920.4 million and sales volumes of approximately 260.3 kilotons, excluding by-products, for the year ended December 31, 2009. We generated approximately 96% of our 2009 product sales revenue in our core end use markets. Our Belpre, Ohio facility is the most diversified SBC plant in the world, and we believe our Wesseling, Germany, facility is world scale and cost efficient. As the
70
Table of Contents
pioneer of SBCs over almost 50 years ago, we believe our Kraton® brand is widely recognized for our industry leadership, and we are particularly well regarded for our process technology expertise and long track record of market-driven innovation.
Growth Through Innovation and Technological Know-how
SBC production and product development require complex and specific expertise, which we believe many of our competitors are unable to replicate. As the industry pioneer, Kraton maintains a constant focus on enhancing the value-added attributes of our products and on developing new applications for SBCs. At December 31, 2009, we had approximately 1,000 granted patents and approximately 381 pending patent applications. Our “Vision 20/20” program targets generating 20% of sales revenues from new products or applications introduced in the prior five years. In 2009, we generated 12.4% of our sales from innovation driven revenue. We believe that our new product innovation will allow us to drive increases in our volume, expand unit contribution margins and increase our customers’ reliance on Kraton’s products and technical expertise. For example, for the twelve months ended December 31, 2009, our Emerging Businesses end use market, which includes IR and IRL, represented 7.0% of sales revenues. Furthermore, our IRL business has grown at a compound annual growth rate of 28.8%, based on sales revenues, from 2007 to 2009 and is earning a unit contribution margin in excess of the company as a whole.
Diverse Global Manufacturing Capabilities and End Use Market Exposures
We operate manufacturing facilities on four continents producing what we believe to be the highest quality grades available of USBCs HSBCs, and high purity IRL. We believe we are the only SBC producer with this breadth of technical capabilities and global footprint, selling approximately 800 products in over 60 countries. Since 2003, we have successfully completed plant expansions totaling 60 kilotons of capacity at a total cost of less than $50 million, giving us a total capacity of approximately 420 kilotons. Our manufacturing and product footprint allow revenue diversity, both geographically and by end use market. We believe our scale and footprint make us an attractive customer for our monomer suppliers, which in turn, allows us to offer a high degree of supply security to customers.

|

|
| Source: | Management Estimates |
Long-Standing, Strong Customer Relationships Supported by Leading Service-Offering
We sell our products to over 700 customers, many of which we have had relationships with for 15 years or more. Our customers are broad-based, with no single customer accounting for more than 5% of our sales revenue in 2009 (our top 10 customers represented 26% of sales revenue in 2009). Our customers’ manufacturing processes are typically calibrated to the performance specifications of our products. Given the technical expertise and investment required to develop these formulations and the lead times required to replace them, we believe
71
Table of Contents
our customers face high switching costs. We believe our customers view our products as being high value-added, even though our products generally represent a small proportion of the overall cost of the finished product. Leveraging our global infrastructure, we believe we offer our customers a best-in-class service level that aligns us to their respective business models, through “on demand” order delivery and product development specifically designed for each customer’s needs.
Experienced Management Team with a Track Record of Growth and Productivity Improvements
Our senior management team has an average industry experience of approximately 25 years, most of which has been with some of the world’s leading companies, including General Electric, Koch Industries, and Chevron Phillips Chemical. Since early 2008, when the current executive team was put in place, we have instituted a number of strategic initiatives designed to enhance productivity, reduce costs and capital intensity, expand margins and drive innovation-led growth.
Our Business Strategy
Building on these competitive strengths, we are focused on achieving profitable top-line growth and improving margins through the introduction of highly-engineered, high value-added products to drive strong and sustainable cash flow.
Drive Growth and Margin Expansion Through Innovation
We have an almost 50-year track record of innovation dating back to our development of the first SBCs. Our research and development effort is focused on end use markets and new product developments that we believe offer high growth as well as opportunities to develop highly-differentiated products for our customers, thus yielding higher margin potential. We work very closely with our longstanding customer base to produce products that address their specific technical requirements. For example, to address an industry trend to provide an alternative to PVC in applications such as medical packaging and wire and cable, we have developed and commercialized a series of custom-designed polymers and compounds. In addition to this innovation-led growth, we believe that there are a number of end use market dynamics that will also drive growth in our business such as the general demand by customers for higher value-added product performance characteristics.
Pursue “Smart Pricing”
In late 2007, we undertook a comprehensive review of our entire product portfolio, including both product-specific and customer-specific profitability analyses. As a result, we took a variety of actions including reducing or eliminating our exposure to lower margin business and increasing our prices to reflect the significant value-added benefits of our products to our customers’ products. For example, since the end of 2007, we have increased our unit contribution margins by approximately 50%. We will continue to pursue pricing strategies that reflect the contribution to the end product of our high value and complex product offerings for which limited substitutes exist.
Invest in Key Growth Initiatives
We expect 2010 capital expenditures will be approximately $50.0 million to $55.0 million. Included in our 2010 capital expenditure estimate is approximately $9.0 million for the second phase of the Belpre systems and control upgrades, approximately $11.0 million to replace IR production from our Pernis facility, approximately $6.0 million for the IRL expansion and approximately $5.0 million for building upgrades at our Belpre facility. Through the six months ended June 30, 2010, capital expenditures were $19.4 million.
72
Table of Contents
Continue to Pursue Operational Efficiencies
We have a history of implementing continuous process and cost improvement plans that have resulted in a significant reduction in our cost position and an improvement in the way we run our business. Since the beginning of 2007, we have implemented cost saving initiatives that have reduced costs by over $55 million, on an annual basis. For example, these initiatives include (i) programs to streamline our operations and lower staffing levels reducing our costs by approximately $25 million, (ii) the shutdown of SIS production in our Pernis facility in 2008 resulting in annual cost savings of $10 million, (iii) ERP related cost reductions resulting in annual savings of $5 million. In addition, as of December 31, 2009 we shut down IR production in our Pernis facility, which we expect will result in annual cost savings of approximately $12.0 million beginning in January 2010.
In connection with the exit from Pernis, we incurred approximately $11.0 million in asset retirement obligations, restructuring costs and write-downs during 2009. Prior to the exit, we manufactured IR at the Pernis facility. We are transferring IR production to our Belpre, Ohio, facility at an estimated capital cost of $27.0 million. We currently expect this project will be completed by mid-2011. We plan to satisfy customer demand for IR with inventory currently on hand and we believe the cash flow from the sale of IR inventory will likely mitigate a significant portion of the cash requirements for the alternative capacity.
Through these actions, we have created substantial operating leverage in our business model. We believe this demonstrates our management team’s ability to successfully manage the business in a downturn and position us for significant growth and margin expansion in a global economic recovery.
New Innovations
In 2010, we announced the following product innovations.
Consistent with our strategy, we believe that we continue to lead SBC innovation as evidenced by numerous developments announced across several of our core end use markets throughout the six months ended June 30, 2010. Below are our most recently announced product innovations.
| • | In August 2010, we announced that our roof coating formulation containing Kraton G1643 exceeds requirements in the ASTM International D6083 standard specification recognized in the elastomeric roof coating market. ASTM D6083 is an industry standard that establishes minimum performance levels in the following areas: viscosity, weight and volume solids; mechanical properties; adhesion; low temperature flexibility after accelerated weathering; tear resistance; permeation and water swelling; and fungi resistance. This gives innovators an opportunity to more effectively compare polymer-to-polymer for roof coating formulations. This SBC-based polymer has a proven track record of improving the performance of roof coatings because it adds superior water resistance, improved adhesion, and increased elongation to formulations. It can be used to help lower volatile organic compounds (VOCs) in a solvented formulation, which have significant vapor pressures that can affect the environment and human health. In addition, our tested formulation can be used under the EPA’s regulation for thermoplastic rubber coatings and mastic. A roof coating formulation containing Kraton G1643 can reduce total cost of installation and provide fast cure coatings that will work better in cold, humid, or wet conditions. Elastomeric roof coatings made with Kraton polymers will stand up better to ponding water, and provide excellent adhesion to all types of roofing substrates. Roof coatings made with Kraton G1643 are an excellent choice for low slope roofs, or high traffic areas, and will provide excellent reflectance to reduce energy costs, and extend the life of the roof. |
| • | In July 2010, we announced the addition of Kraton D1183 BT, a new SIS grade, to our line of polymers for use in applications where softness, ease-in-processing, and high temperature resistance are essential. Kraton D1183 BT is suitable for use in many adhesive applications including thermal printing labels, high temperature resistant labels, elastic labels and diaper tabs. It is an excellent choice |
73
Table of Contents
| for adhesives in hygiene applications and its shear strength is particularly good at 37 degrees Celsius. Moreover, it offers economically attractive adhesive formulations, and gives formulators the ability to dilute it further to obtain equivalent performance levels of competing products, which can result in cost-savings. It can also achieve significantly higher cohesive strength and higher temperature resistance without the use of expensive endblock resins. Therefore, Kraton D1183 BT is not only economically attractive, but also substantially stronger and offers a wider formulating space. Prior to the commercialization of Kraton D1183 BT, innovators used low-coupled SIS block copolymers to impart softness to end-products. Although they offered improved adhesion on open and porous substrates and good label die-cutting performance, they often lacked cohesion, which hampered their use in applications where higher shear and temperature resistance was required. In comparison, Kraton D1183 BT is a 40% diblock SIS, which shows superior performance to low-coupled SIS block copolymers and is therefore the polymer of choice for these applications. |
| • | In May 2010, we announced the addition of DX405 to our product line of polymers for Adhesives, Sealants, and Coatings. This technology will allow our customers to more efficiently and expediently manufacture products that are stronger and softer. DX405 has a low styrene content, which promotes ease of processing, low viscosity, and the attainment of lower application temperatures. This adds efficiency and simplification to the manufacturing process, which shortens batch times, increases extrusion rates and improves productivity. DX405 has a wide formulation window and its versatility makes it suitable for solvent-based compositions, hot melt adhesives, and sealant applications. It can be formulated with other polymers, resins, fillers, pigments, oils, thickeners, waxes and stabilizers to obtain a desired balance of properties. |
Products
Our Kraton polymer products are high performance elastomers, which are engineered for a wide range of end use applications. Our products possess a combination of high strength and low viscosity, which facilitates ease of processing at elevated temperatures and high processing speeds. Our products can be processed in a variety of manufacturing applications, including injection molding, blow molding, compression molding, extrusion, hot melt and solution applied coatings.
We offer our customers a broad portfolio of products that includes approximately 200 core commercial grades of SBCs. We believe that the diversity and depth of our product portfolio is unmatched in the industry, serving the widest set of applications within each end use.
While we organize our commercial activities around our four core end uses, we manufacture our products along five primary product lines based upon polymer chemistry and process technologies: (1) USBCs; (2) HSBCs; (3) IR; (4) IRL; and (5) Compounds. The majority of worldwide SBC capacity is dedicated to the production of USBCs, which are primarily used in the Paving and Roofing, Adhesives, Sealants and Coatings and Footwear end use applications. HSBCs, which are significantly more complex and capital-intensive to manufacture than USBCs, are primarily used in higher value-added end uses, including soft touch and flexible materials, personal hygiene products, medical products, automotive components and certain adhesives and sealant applications. The following product summaries highlight our portfolio of product grades, their key performance characteristics and selected applications:
HSBCs. We developed the first HSBC polymers in the late 1960s for use in production of soft, strong compounds for handles and grips and elastic components in diapers. As of July 31, 2010, our HSBC product portfolio includes approximately 91 commercial grades of products. Our technical expertise in HSBC manufacturing and our history of HSBC innovation have led to what we believe is a number one market share of HSBC sales in terms of industry sales revenue. HSBC products are significantly more complex to produce than USBC products and, as a result, generally command selling prices that are significantly higher than those for USBCs and generate higher margins. Sales of HSBC products comprised 34%, 31% and 32% of our total sales revenue (which excludes by-product sales) in 2009, 2008 and 2007, respectively, and 30.4% and 33.8% for the three and six months ended June 30, 2010, respectively.
74
Table of Contents
HSBC products impart higher performance characteristics than USBC products including: color range and stability; resistance to ultraviolet light; processing stability and viscosity; and elevated temperature resistance. HSBCs are primarily used in our Advanced Materials and our Adhesives, Sealants and Coatings end use markets to impart improved performance characteristics such as: (1) stretch properties in disposable diapers and adult incontinence products; (2) soft feel in numerous consumer products such as razor blades, power tools and automobile internals; (3) impact resistance for demanding engineering plastic applications; (4) flexibility for wire and cable plastic outer layers; and (5) improved flow characteristics for many industrial and consumer sealants lubricating fluids.
USBCs. We developed the first USBC polymers in 1964. Our flagship Belpre, Ohio site, the first dedicated block copolymer plant, was built in 1971. As of July 31, 2010, our USBC product portfolio includes approximately 116 commercial grades of products. We believe we hold the number one market share of USBC sales, excluding footwear, in terms of industry sales revenue. USBC comprised 66%, 69% and 68% of our total sales revenue (which excludes by-product sales) in 2009, 2008 and 2007, respectively, and 69.6% and 66.2% for the three and six months ended June 30, 2010, respectively.
USBCs are used in all our end use markets in a range of products to impart desirable characteristics, such as: (1) resistance to temperature and weather extremes in roads and roofing; (2) resistance to cracking, reduced sound transmission and better drainage in porous road surfaces; (3) impact resistance for consumer plastics; and (4) increased processing flexibility in adhesive applications, such as packaging tapes and labels, and materials used in disposable diapers. As with SBCs in general, USBCs are most often blended with substrates to impart the aforementioned performance enhancements. We made the strategic decision to largely exit the less attractive footwear market and focus our resources on the greater value proposition offered by the remaining end uses for our USBC products.
IR. Isoprene Rubber (formed from polymerizing isoprene) is a line of high purity isoprene rubber products and is a non-SBC product. These products combine the key qualities of natural rubber, such as good mechanical properties and hysteresis, with superior features such as high purity, excellent clarity, good flow, low gel content, no nitrosamines and no natural rubber proteins. Our IR polymers are available as bales of rubber or as latex. IR polymers are useful in the production of medical products, adhesives, tackifiers, paints, coatings and photo-resistors. We include IR in our USBC product line.
IRL. Isoprene Rubber Latex (emulsion of IR in water) is a substitute for natural rubber latex, particularly in applications with high purity requirements, such as medical, healthcare, personal care and food contact operations. Our IRL is unique polyisoprene latex with controlled structure and low chemical impurity levels manufactured through an anionic polymerization process followed by a proprietary latex processing step, both of which were developed by us. IRL is durable, tear resistant, soft, transparent and odorless. In addition, the synthetic material has unparalleled consistency, and it is non-allergenic, providing a distinct property advantage over natural rubber latex. We include IRL in our USBC product line.
Compounds. Our Compounds are a mixture of Kraton polymers and other polymers, resins, oils or fillers to enhance the final properties for processing. Compounds cover a wide range of polymers tailored to meet specific customer needs in consumer and industrial applications. Compounds can be formulated so that they can be extruded, injection molded, foamed, etc. to meet the final application requirements. These products are primarily used in soft-touch grips, sporting equipment, automotive components and personal care products. Compounds comprised 3.0%, 3.0% and 3.0% of our total sales revenue in 2009, 2008 and 2007, respectively, and 2.7%, and 2.5% for the three and six months ended June 30, 2010, respectively. Compounds are included in our USBC and HSBC product lines, as appropriate.
Our End Use Markets
We have aligned our commercial activities to serve four core end use markets that we believe have the highest growth and profitability potential: (1) Advanced Materials; (2) Adhesives, Sealants and Coatings;
75
Table of Contents
(3) Paving and Roofing; and (4) Emerging Businesses. The following table describes our four core end use markets and other end use markets, and their approximate relative sizes:
| End Use Markets |
Revenue Mix (1) |
Our End Use Market Position (2) |
Our End Use Market Share (2) |
Our Relative End Use Market Share (3) |
Industry Compound Annual Growth Rate (4) |
Selected Applications/Products | |||||||||
| Advanced Materials |
31 | % | #1 | 36 | % | 2.0X | 7.4 | % | Soft touch for consumer products (tooth brushes and razor blades) and power tools Impact resistant engineering plastics Automotive components Elastic films for disposable diapers and adult incontinence branded products Skin care products and lotions Disposable food packaging Medical packaging films and tubing, often as an alternative to PVC | ||||||
| Adhesives, Sealants and Coatings |
32 | % | #1 | 34 | % | 1.9X | 5.9 | % | Tapes and labels Non-woven and industrial adhesives Industrial and consumer weather sealants | ||||||
| Paving and Roofing |
26 | % | #1 | 24 | % | 1.6X | 6.5 | % | Asphalt modification for performance roadways Asphalt modification for roofing felts and shingles | ||||||
| Emerging Businesses (5) |
7 | % | N/A | N/A | N/A | 26.8 | % | Surgical gloves Condoms | |||||||
| Other Markets (6) |
4 | % | N/A | N/A | N/A | N/A | Lubricants and fuel additives High styrenics packaging Footwear | ||||||||
| (1) | Based on 2009 sales of $920.4 million (excludes by-product sales which are reported as other revenues). |
| (2) | Management estimates, based on 2009 sales. |
| (3) | Management estimates, versus next largest competitor based on 2009 sales. |
| (4) | Management estimates of volume growth, 2001 to 2009, except for Emerging Businesses, which is 2005 to 2009. |
| (5) | The Emerging Businesses end use market includes our IR and IRL business. We believe that we are the only major third-party supplier of IR and IRL, and therefore end use market position, end use market share and relative end use market share metrics are not meaningful. |
| (6) | Our Other Markets end use market is not directly comparable to our four core end use markets because it includes a mix of products ranging from lubricants and fuel additives to high styrenics packaging to footwear products. Therefore, we cannot estimate end use market position, end use market share, relative end use market share or industry compound annual growth rate. |
76
Table of Contents
Advanced Materials. Through sales of HSBC, USBC and IR products, as well as certain compounded products, we maintain a leading position in the global Advanced Materials end use market.
In the Advanced Materials end use market, our products compete against a wide variety of chemical and non-chemical alternatives, including thermoplastic vulcanizates, ethylene propylene diene monomer rubber, known as EPDM, thermoplastic polyolefin elastomers and thermoplastic polyurethanes, known as TPUs. The choice between these materials is influenced by performance characteristics, ease of use, desired aesthetics and total end-product cost. In addition, competing materials include spandex, natural rubber, polyvinyl chloride polymers and compounds, polyolefins, polyethylene terephthalate, known as PET, nylon and polycarbonate, based on performance, ease of use, desired aesthetics and total end-product cost.
Advanced Materials polymers and compounds from Kraton are used in a range of diverse applications, many of which require customized formulations, product testing with long lead time approvals, and production evaluations for specific end use customers and applications. As such, customer loyalty tends to be strongest in this end use market, helped in part by the fact that many of the applications are patent protected. The degree of complexity in the manufacturing of these products and the attractive value proposition for our customers drives higher sustainable margins for this end use market.
We believe our Advanced Materials’ growth is driven by customers’ desire for improved product flexibility and resilience, impact resistance, moisture resistance and aesthetics (clarity and feel) in consumer products, medical products, packaging and automotive components. In addition, due to health and recycling (or “green”) concerns, one trend that is particularly a focus for our company is in providing alternative solutions to PVC in a number of demanding medical (blood and intravenous bags, tubes and stoppers) and electronic (wire and cable outer layer) applications.
A differentiating driver for our expected Advanced Materials’ growth is our unique ability to design and manufacture certain custom compound formulations. One specific example is Kraton compounds that provide critical stretch performance for the infant care (diaper) and adult incontinence markets.
Revenue from Advanced Materials represented 31%, 30% and 32% of total sales revenue (which excludes by-product sales) in 2009, 2008 and 2007, respectively, and 29.5% and 31.5% for the three and six months ended June 30, 2010, respectively.
Adhesives, Sealants and Coatings. Through sales of HSBC, USBC and certain IR products, we continue to hold a leading position in the global Adhesives, Sealants and Coatings end use market.
In the Adhesives, Sealants and Coatings end use market, SBC products primarily compete with acrylics, silicones, solvent-based rubber systems and thermoplastic polyolefin elastomers. The choice between these materials is influenced by bond strength, specific adhesion, consistent performance to specification, processing speed, hot-melt application, resistance to water and total end-product cost.
Our Adhesives, Sealants and Coatings polymers are used in a number of demanding applications such as: adhesives for diapers and hygiene products; sealants for construction and automotive applications; and adhesives for tapes and labels. Our coatings polymers have expanded into the high growth market of elastomeric white roof coatings. The coating provides not only weather resistance but improved energy efficiency reducing solar absorption on bitumen based industrial roofs. We expect our growth to be supported by the continuing substitution of adhesives for mechanical fastening systems and the growing demand within developing countries for disposable hygiene products that contain adhesives and sealants.
Another significant growth application for our SBCs is for tapes and labels. In both solvent-based and hot-melt forms, Kraton SBCs impart water resistance, color stability, strong bonding characteristics, high cohesive strength, good ultraviolet light resistance, heat stability and long shelf life. Specifically, the pressure sensitive label market continues to expand using SBC technology at the expense of paper labels, driven by cost reduction and higher consumer market appeal. In addition, our SBCs’ compatibility with many other formulating
77
Table of Contents
ingredients and their suitability for hot-melt systems are major factors in demand growth. Furthermore, we believe our blend of new styrene-isoprene-butadiene-styrene (SIBS) and styrene-butadiene-styrene (SBS) polymers with rosin ester tackifying resins can produce a tape with properties similar to a traditional styrene-isoprene-styrene (SIS) hydrocarbon resin formulation, but with cost savings of 10% to 20%. We have expanded our offering of formulated compounds for adhesive films that protect LCD panels and consumer appliances providing improved adhesive performance with no residue or haze after removal. Both applications are growing rapidly in Asia and South America as SBC based technology penetrates preferentially versus acrylic based films. In 2008, we largely exited the increasingly commoditized portions of the tape and label business, choosing to refocus our development and manufacturing capacity on higher value-added and more proprietary products. Our history of innovation in the Adhesives, Sealants and Coatings end use market has allowed us to capitalize on our unique product offerings, significantly enhancing the value of this end use market to the business.
Revenue from Adhesives, Sealants and Coatings represented 32%, 32% and 31% of total sales revenue (which excludes by-product sales) in 2009, 2008 and 2007, respectively, and 31.5% and 32.5% for the three and six months ended June 30, 2010, respectively.
Paving and Roofing. Through sales of primarily USBC products, we maintained a leading market position in 2009 of the global asphalt modification SBC industry.
We believe that our sales into the Paving and Roofing end use market will see meaningful growth driven by an overall volume recovery to a level more in line with historical norms, improvement in roofing demand including re-stocking of depleted roofing supply chains, continued penetration of polymer modified road surfaces, and the impact of government programs associated with infrastructure spending in the United States and Europe. In the United States specifically, the American Recovery and Reinvestment Act of 2009 provides $6.9 billion in 2010 for incremental Federal Highway Administration funding (25% of the $27.5 billion in total committed to highway construction). We believe that the American Recovery and Reinvestment Act of 2009 could yield additional demand for our products.
The addition of our SBS in asphalt greatly improves the strength and elasticity of asphalt-based paving compositions over an extended temperature range, thus increasing resistance to wear, rutting and cracking. In roofing applications, SBS-modified asphalt produces stronger and more durable felts and shingles, thus reducing the possibility of damage from weather, ice and water build-up and again extending service life.
We believe our growth in the Paving and Roofing end use market will benefit from new products we have recently introduced, and those that are currently under development, to respond to industry trends for elevated polymer content roads and surfaces, over-lay compatibility with concrete systems, and general environmental awareness (for example, road construction emissions).
Revenue from Paving and Roofing represented 26%, 31% and 30% of total sales revenue (which excludes by-product sales) in 2009, 2008 and 2007, respectively, and 32.4% and 28.0% for the three and six months ended June 30, 2010, respectively.
Emerging Businesses. We use this end use to commercialize and manage innovations that are outside of our current end use organizational structure. For example, IR is a line of high purity isoprene rubber products that combines the key qualities of natural rubber, such as good mechanical properties and hysteresis, with superior features such as high purity, excellent clarity, good flow, low gel content, no nitrosamines and no natural rubber proteins. IR polymers in general are used in high volume, lower value-added applications such as tire rubber. However, we focus our unique IR polymers, produced using state-of-the-art nanotechnology, in more demanding applications such as medical products, adhesives and tackifiers, paints, coatings and photo-resistors. Approximately half of our current IR production is converted into IRL (emulsion of IR in water), a substitute for natural rubber latex, particularly in applications with high purity requirements, such as medical, healthcare, personal care and food contact applications. IRL is durable, tear resistant, soft, transparent and odorless. Most importantly, IRL is non-allergenic for both doctor and patient, providing a distinct property advantage over natural rubber latex.
78
Table of Contents
IRL is predominately used in the synthetic surgical gloves and condoms markets. Our IRL business has grown at a compound annual growth rate of 28.8%, based on revenues, from 2007 to 2009. The combination of increasing demand, favorable market dynamics and competitive differentiation make this a key product offering for us. We currently anticipate growth to continue for the foreseeable future, and will likely need to add capacity to our global supply system.
In addition to IRL, we believe we have a robust portfolio of innovations at various stages of development and commercialization that we believe will fuel our future growth. One such example is our Nexar™ family of membrane polymers for water filtration and breathable fabrics.
Revenue from Emerging Businesses represented 7%, 3% and 2% of total sales revenue (which excludes by-product sales) in 2009, 2008 and 2007, respectively, and 5.7% and 5.4% for the three and six months ended June 30, 2010, respectively.
Research, Development and Technology
Our research and development program is designed to develop new products and applications, provide technical service to customers, develop and optimize process technology and assist in marketing new products. We spent $20.4 million, $26.4 million and $24.0 million for research and development for the years ended December 31, 2009, 2008 and 2007, respectively. From time to time, we also engage in customer-sponsored research projects, with spending of approximately $1.0 million a year for the three-year period ended December 31, 2009. As of December 31, 2009, approximately 94 personnel are dedicated to this critical business activity.
Our research and development activities are primarily conducted in laboratories in Houston, Texas and Amsterdam, the Netherlands. We also own a laboratory in Paulinia, Brazil, that provides technical services to our South American customers. Our application and technical service laboratories in Shanghai, China and Tsukuba, Japan provide support to our Asian customers. In addition, we have technical service staff located in Mont St. Guibert, Belgium.
Our experienced, knowledgeable professionals perform product research using extensive scientific application equipment located at our Houston and Amsterdam research and development facilities. Our Houston laboratory also includes a comprehensive pilot plant for a number of uses. In early 2009, we moved into a new Houston research and technology service facility. The new facility is expected to yield cost savings when compared with our previous facilities leased at Shell Chemicals’ Westhollow location in Houston. The new facility is designed specifically to enhance the effectiveness of our research and technology service team. At both of our major research and development facilities, we produce new Kraton product samples for our customers and provide guidance to our manufacturing organization. In addition, we also use our pilot plant to test new raw materials and new process technologies in order to improve the manufacturing performance of our products. Application equipment is used in all of our research and technical service labs to evaluate polymers and compounds to determine optimal formulations.
Since the introduction of SBCs in the mid-1960s, we have experienced strong demand for the development of new products that utilize the enhancing properties offered by our polymers. We believe we have a strong new product pipeline to take advantage of many new opportunities. As a proven product innovator, we will continue to employ our product knowledge and technical expertise to provide application-based solutions for our customers’ highly specialized needs. This can include modifications to current products as well as significant new innovations aimed at displacing more expensive, less efficient product solutions in the marketplace.
Sales and Marketing
Our business is predominantly based on a short sales cycle. We sell our products through a number of channels including a direct sales force, marketing representatives and distributors. The majority of our products
79
Table of Contents
are sold through our direct sales force. In countries where we generate substantial revenues, our sales force is organized by end use market in order to meet the specific needs of our customers. In geographic areas where it is not efficient for us to organize our sales force by end use market, we may use one sales team to service all end use markets.
In smaller markets, we often use marketing representatives who act as independent contractors to sell our products. In addition, we use distributors to service our smaller customers in all regions. Distributors sell a wide variety of products, which allows smaller customers to obtain multiple products from one source. In addition to our long- term relationships with distributors in North America and Europe, we have established relationships with a wide network of distributors in Latin America and the Asia Pacific region. We have transferred some existing small customers to distributors, and are working to transfer others, to free up our sales force to focus on more substantial opportunities.
Our sales force, distributors and agents interact with our customers to provide both product advice and technical assistance. In general, they arrange and coordinate contact between our customers and our research and development personnel to provide quality control and new product solutions. Our close interaction with our customers has allowed us to develop and maintain strong customer relationships. In addition, we focus our sales efforts on those customers who value the quality of our products, service and technical support.
Total operating revenues from our operations outside the United States were approximately 67%, 66% and 66% of our total operating revenues in the years ended December 31, 2009, 2008 and 2007, respectively. Direct sales we make outside of the United States are generally priced in local currencies and can be subject to currency exchange fluctuations when reported in our consolidated financial statements, which are maintained in U.S. dollars in accordance with GAAP. For geographic reporting, revenues are attributed to the geographic location in which the customers’ facilities are located. We generated 42% of our 2009 sales from customers located in the Americas, 37% in Europe, the Middle East and Africa and 21% in the Asia Pacific region. See Note 13 to our consolidated financial statements for geographic reporting for total operating revenues and long-lived assets as of and for the years ended December 31, 2009, 2008 and 2007.
Sources and Availability of Raw Materials
We use three monomers as our primary raw materials in the manufacture of our products: styrene, butadiene and isoprene. These monomers together represented approximately 43%, 49% and 51% of our total cost of goods sold for the twelve months ended December 31, 2009, 2008 and 2007, respectively. Other raw materials used in our production process include catalysts, solvents, stabilizers and various process control chemicals. The cost of these monomers has generally been correlated with changes in crude oil prices and affected by global supply and demand and global economic conditions. The market prices for styrene and butadiene monomers declined significantly late in 2008 and into the first half of 2009. Butadiene prices bottomed in the second quarter of 2009 and styrene prices bottomed in January 2009. Pricing for these two monomers generally increased and stabilized during the remainder of 2009. Butadiene pricing resumed its escalation in the first quarter of 2010, and the increase slowed and leveled off in the second quarter of 2010. Styrene pricing increased from its lows in the first quarter of 2009 before leveling off in 2010. Alternately, spot isoprene prices peaked in late 2008 then declined in the first quarter of 2009. Isoprene pricing increased during the second quarter of 2009, stabilized, then increased again in the fourth quarter of 2009. Isoprene pricing continued to increase through the first quarter of 2010 then leveled off in the second quarter of 2010. Overall, monomer pricing is up significantly in the first half of 2010 as compared to the first half of 2009.
We believe our contractual and other arrangements with suppliers of styrene, butadiene and isoprene provide an adequate supply of raw materials at competitive, market-based prices. We can provide no assurances that contract suppliers will not terminate these contracts at the expiration of their contract terms, that we will be able to obtain substitute arrangements on comparable terms, or that we generally will be able to source raw materials on an economic basis in the future.
80
Table of Contents
Styrene, butadiene and isoprene used by our U.S. and European facilities are predominantly supplied by a portfolio of suppliers under long-term supply contracts with various expiration dates. For our U.S. facilities, we also procure a substantial amount of isoprene from a variety of suppliers from Russia, China and Japan. These purchases include both spot and contract arrangements. We generally contract with them on a short-term basis, although the number of such contracts has been increasing since 2008.
In January 2009, the U.S. operations of LyondellBasell, along with one of its European-holding companies, Basell Germany Holdings GmbH, filed for voluntary reorganization under Chapter 11 of the U.S. Bankruptcy Code. Its Chapter 11 reorganization plan was confirmed by the bankruptcy court in April 2010, and LyondellBasell has emerged from bankruptcy. LyondellBasell is one of our major suppliers of raw materials in Europe and also operates our facilities at Berre, France, and Wesseling, Germany. We cannot accurately predict the effect, if any, that LyondellBasell’s emergence from bankruptcy will have upon our business, or our relationships with LyondellBasell. To date, these proceedings have resulted in no significant changes in our commercial relationship with LyondellBasell.
In Japan, butadiene and isoprene supplies for our joint venture facility are supplied under our joint venture agreement, where our partner supplies our necessary requirements. Styrene in Japan is sourced from local third-party suppliers. Our facility in Paulinia, Brazil, generally purchases all of its raw materials from local third-party suppliers.
Styrene. Styrene is available on the global petrochemical market with approximately 11 producers located in the Americas, 12 producers located in Europe and 41 producers located in Asia. The top five producers worldwide are: Shell Chemicals, LyondellBasell, Dow Chemical Company, BASF and Total, which collectively account for approximately one-third of global capacity. Styrene prices are primarily driven by worldwide supply and demand and the cost of ethylene and benzene and are influenced by prevailing crude oil and natural gas prices. Following the collapse of energy, benzene, and styrene prices in late 2008, styrene pricing reached its lowest levels in January 2009 before recovering throughout the remainder of 2009 and leveling off in early 2010.
We satisfy our styrene requirements in the United States pursuant to several purchase agreements with maturities up to the end of 2011, subject to renewal conditions. As contracts expire, we cannot give assurances that we will obtain new long-term supply agreements or that the terms of any such agreements will be on terms favorable to us, and as a consequence, our future acquisition costs for styrene may therefore increase.
For our agreements covering our manufacturing facility in the United States, the price we pay for styrene varies with the published prices of styrene and/or the raw materials used to produce styrene. The price we pay for styrene under our agreement covering France and Germany varies to reflect the published price for styrene even though our purchase price is subject to certain minimums and maximums that vary with other factors.
Butadiene. Butadiene is available on the global petrochemical market with approximately eight producers in the Americas, 19 producers in Western Europe and 38 producers located in Asia. Prices for butadiene reflect worldwide supply and demand and prevailing crude oil and ethylene prices.
We believe our contractual and other arrangements with our suppliers will generally provide adequate supplies of butadiene at competitive prices to support our current sales levels. Growth in the production of our products that require butadiene could be limited by our ability to source additional butadiene at competitive prices.
We currently source butadiene in the United States pursuant to several contractual arrangements with maturities up to the end of 2012, subject to renewal conditions. Our U.S. butadiene purchases vary with the published prices for butadiene on world markets. We have supplemented our requirements by spot supply as needed. No assurances can be given that any other agreement(s) will be entered into or as to the volumes or terms of any such agreement(s).
81
Table of Contents
We currently source our butadiene in Europe pursuant to contracts with LyondellBasell. The contract covering Germany will expire on December 31, 2040, and will be renewed automatically at the conclusion of the current term unless terminated with prior written notice by either party. The contract covering France expired effective December 31, 2008. We are presently acquiring butadiene in France from LyondellBasell under a term sheet reflecting an agreement in principle that has been reached between the parties. However, we can provide no assurance to the nature of the final agreement or as to the volumes or terms of such an agreement. The price we pay for butadiene under our agreements covering France and Germany vary based upon the published price for butadiene, the amount of butadiene purchased during the preceding calendar year and/or the cost of butadiene manufactured. In Brazil, butadiene is obtained from a local third-party source. In Kashima, Japan, a majority of our butadiene needs are sourced from JSR on a commercial supply basis. As contracts expire, we cannot give assurances that we will obtain new long-term supply agreements, or that the terms of any such agreements will be on terms favorable to us, and as a consequence, our future acquisition costs for butadiene may therefore increase.
Isoprene. Isoprene is primarily produced and consumed captively by manufacturers for the production of IR, which is primarily used in the manufacture of rubber tires. As a result, there is limited non-captive isoprene available in the market place. Prices for isoprene are determined by the supply and prices of natural and synthetic rubber, crude oil and natural gas prices, and existing supply and demand in the market. Isoprene prices increased for most of 2008. Following the collapse of energy prices in late 2008, isoprene pricing declined in the first quarter of 2009, increased during the second quarter of 2009, stabilized, then increased again in the fourth quarter of 2009. The increase was largely driven by the reduced availability of raw materials for isoprene extraction. The economic advantage of lighter feeds for ethylene plants reduced the manufacture of by-products, including crude isoprene. Isoprene pricing continued to increase through the first quarter of 2010 then leveled off in the second quarter of 2010.
We source our global isoprene requirements through several contractual arrangements. We also purchase additional supplies of isoprene from various suppliers at prevailing market price. In Kashima, Japan, the majority of our isoprene needs are sourced from JSR on a commercial supply basis and from alternative suppliers as needed. As contracts expire, we may not be able to obtain new long-term supply agreements and the terms of any such agreement may not be on terms favorable to us.
We have historically had adequate supplies of isoprene. However, we have periodically experienced periods of limited supply due to operational problems at key producers, or as was the case during 2008, due to limited availability of crude raw materials for the isoprene extraction units. During these periods, we are normally able to meet most of our needs by acquiring relatively expensive isoprene from other suppliers. After an initial improvement in supply availability in 2008, isoprene availability was reduced for most of 2008. In response, we were forced to allocate SIS supplies. Similarly, supply constraints in 2009 limited isoprene purchases under some of our existing contracts. We satisfied our requirements by supplementing purchases from a variety of other suppliers. Going forward, we believe our contractual arrangements with several suppliers as well as spot arrangements and longstanding relationships with other third-party suppliers of isoprene, will generally provide adequate future supplies of isoprene at competitive prices to support our current sales levels. Growth in the production of our products that require isoprene could be limited by our ability to source additional isoprene at competitive prices, and we can give no guarantees or assurances in this regard.
Competition
We compete with other SBC product and non-SBC product producers primarily on the basis of price, breadth of product availability, product quality and speed of service from order to delivery. We believe our customers also base their supply decisions on the ability to design and produce custom products and the availability of technical support.
SBC Industry. Our most significant competitors in the SBC industry are: Asahi Chemical, Chi Mei, Dexco Polymers, Dynasol Elastomers, Kuraray, Korea Kumho P.C., Lee Chang Yung, LG Chemical, Polimeri Europa,
82
Table of Contents
Sinopec, Taiwan Synthetic Rubber Corporation and Zeon Corporation. Generally, however, individual competitors do not compete in each of our end use markets. Rather, there are different competitors in each of our end use markets indicative of the depth and breadth of our product offering.
Product Substitution. We also compete against a broad range of alternative, non-SBC products within each end use market.
In the Advanced Materials end use market, our products compete against a wide variety of chemical and non-chemical alternatives, including thermoplastic vulcanizates, ethylene propylene diene monomer rubber, known as EPDM, thermoplastic polyolefin elastomers and thermoplastic polyurethanes, known as TPUs. The choice between these materials is influenced by performance characteristics, ease of use, desired aesthetics and total end-product cost. In addition, competing materials include spandex, natural rubber, polyvinyl chloride polymers and compounds, polyolefins, polyethylene terephthalate, known as PET, nylon and polycarbonate, based on performance, ease of use, desired aesthetics and total end-product cost.
In the Adhesives, Sealants and Coatings end use market, the primary product alternatives include acrylic polymers, silicones, solvent-based natural rubber systems and metallocene polyolefins.
In the Paving and Roofing end use market, the primary product substitute for roofing is atactic polypropylene, whereas for road surfaces it is styrene butadiene rubber, or SBR. Customers also have a choice to use unmodified asphalts.
Operating and Other Agreements
Operating Agreements. Shell Nederland Refinery operated our manufacturing facility located in Pernis, the Netherlands.
On January 18, 2010, consistent with our announcement in the third quarter of 2009 of our intent to exit our Pernis facility, our indirect, wholly-owned subsidiary Kraton Polymers Nederland BV, or Kraton Netherlands, agreed to terminate the following material definitive agreements relating to the operation of the Pernis facility and transfer the site back to its owner:
| • | First Amended and Restated Site Services, Utilities, Materials and Facilities Agreement between Kraton Netherlands and Shell Nederland Raffinaderij BV (“SNR”) dated 28 February 2001; and |
| • | First Amended and Restated Site Services, Utilities, Materials and Facilities Agreement between Kraton Netherlands and Shell Nederland Chemie BV (“SNC,” and together with SNR, the “Shell Entities”) dated 28 February 2001. |
Production at the Pernis facility ceased December 31, 2009 and actual termination of these agreements became effective on March 31, 2010.
LyondellBasell operates our manufacturing facility located in Berre, France. This facility is situated on a major LyondellBasell refinery and petrochemical site at which other third party tenants also own facilities. LyondellBasell charges us fees based on certain costs incurred in connection with operating and maintaining this facility, including the direct and indirect costs of employees and subcontractors, reasonable insurance costs, certain taxes imposed on LyondellBasell (other than income taxes) and depreciation and capital charges on certain assets. Pursuant to the agreement, LyondellBasell employs and provides all staff, other than certain plant managers, assistant plant managers and technical personnel whom we may appoint. The agreement has an initial term of 20 years, beginning in February 2001, and thereafter will automatically renew indefinitely for consecutive five-year periods. Either party may terminate the agreement (totally or partially) under various circumstances, including if such party ceases its operations at the facility and provides 18 months prior written notice; or if any of the services, utilities, materials and facilities agreements have been terminated, and the terminating party provides notice as required by such agreement.
83
Table of Contents
Pursuant to an agreement dated March 31, 2000, LyondellBasell operates and provides certain services, materials and utilities required to operate our manufacturing facility in Wesseling, Germany. We pay LyondellBasell a monthly fee, as well as costs incurred by LyondellBasell in providing the various services, even if the facility fails to produce any output (whether or not due to events within LyondellBasell’s control), and even if we reject some or all output. This agreement has an initial term of 40 years and will automatically renew subject to five years prior written notice of non-renewal. This agreement will terminate at any earlier date as of which the facility can no longer operate in a safe and efficient manner.
Site Services, Utilities, Materials and Facilities Agreements. LyondellBasell, through local operating affiliates, provides various site services, utilities, materials and facilities for the Berre, France, and Wesseling, Germany, manufacturing sites. Generally these services, utilities, materials and facilities are provided by LyondellBasell on either a long-term basis, short-term basis or a sole-supplier basis. Items provided on a sole-supplier basis may not be terminated except upon termination of the applicable agreement in its entirety. Items provided on a long-term or short-term basis may be terminated individually under certain circumstances.
Information Systems
We utilize ERP software systems to support each of our facilities worldwide. In 2009, we upgraded our ERP software systems utilizing a single global system and implementing best practices for our industry. For Europe and the United States we completed this upgrade in August 2009, and for Brazil and Asia we completed this upgrade in October 2009. In addition to providing increased reliability, we estimate ongoing cost savings of $5.0 million to $10.0 million per annum will be achieved as a result of the new ERP system. These systems are being supported by internal resources. We also have in place a laboratory quality assurance system, including bar code based material management systems and manufacturing systems. An annual disaster recovery exercise is performed on critical systems utilizing third-party data centers.
Patents, Trademarks, Copyrights and Other Intellectual Property Rights
We rely on a variety of intellectual property rights to conduct our business, including patents, trademarks and trade secrets. As of December 31, 2009, approximately one-quarter of our patent portfolio (381 of 1,381) consisted of patent applications (the majority of which were filed after 2003). In light of the fact that patents are generally in effect for a period of 20 years as of the filing date, this means that a significant portion of the portfolio would remain in effect for a long period (assuming most of these applications will be granted). The granted patents and the applications cover both the United States and foreign countries. We do not expect that the expiration of any single patent or specific group of patents would have a material impact on our business. Our material trademarks will remain in effect unless we decide to abandon any of them, subject to possible third-party claims challenging our rights. Similarly, our trade secrets will preserve their status as such for as long as they are the subject of reasonable efforts, on our part, to maintain their secrecy. Since January 2003, we have filed 104 new patent applications with filings in the United States and many foreign countries. A significant number of patents in our patent portfolio were acquired from Shell Chemicals. Shell Chemicals retained for itself fully-transferable and exclusive licenses for their use outside of the elastomers field, as well as fully-transferable, non-exclusive licenses within the field of elastomers for certain limited uses in non-competing activities. Shell Chemicals is permitted to sublicense these rights. Shell Chemicals also retains the right to enforce these patents outside the elastomers field and recover any damages resulting from these actions. Shell Chemicals may engage in or be the owner of a business that manufactures and/or sells elastomers in the elastomers field, so long as they do not use patent rights or technical knowledge exclusively licensed to us.
As a general matter, our trade names are protected by trademark laws. Our SBC products are marketed under the trademark “Kraton,” which is registered in the United States and in many other countries.
In our almost 50 years in the SBC business, we have accumulated a substantial amount of technical and business expertise. Our expertise includes: product development, design and formulation, information relating to the applications in which our products are used, process and manufacturing technology, including the process and
84
Table of Contents
design information used in the operation, maintenance and debottlenecking of our manufacturing facilities, and the technical service that we provide to our customers. Extensive discussions are held with customers and potential customers to define their market needs and product application opportunities. Where necessary, we have implemented trade secret protection for our technical knowledge through non-analysis, secrecy and related agreements.
Employees
We had approximately 830 full-time employees at June 30, 2010. In addition, approximately 175 LyondellBasell manufacturing employees operate our manufacturing facilities and provide maintenance services in Europe under various operating and services arrangements. See “—Operating and Other Agreements.” None of our employees in the United States are subject to collective bargaining agreements. In Europe, Brazil and Japan, a significant number of our employees are in arrangements similar to collective bargaining arrangements. We believe our relationships with our employees continue to be good.
Environmental Regulation
Our operations in the United States and abroad are subject to a wide range of environmental laws and regulations at both the national and local levels. These laws and regulations govern, among other things, air emissions, wastewater discharges, solid and hazardous waste management, site remediation programs and chemical use and management.
Pursuant to these laws and regulations, our facilities are required to obtain and comply with a wide variety of environmental permits for different aspects of their operations. Generally, many of these environmental laws and regulations are becoming increasingly stringent and the cost of compliance with these various requirements can be expected to increase over time.
Management believes that we are in material compliance with all current environmental laws and regulations. We currently estimate that any expenses incurred in maintaining compliance with these requirements will not materially affect our results of operations or cause us to exceed our level of anticipated capital expenditures. However, we cannot give assurances that regulatory requirements or permit conditions will not change, and we cannot predict the aggregate costs of additional measures that may be required to maintain compliance as a result of such changes or expenses.
Environmental laws and regulations in various jurisdictions also establish programs and, in some instances, obligations to clean up contamination from current or historic operations. Under some circumstances, the current owner or operator of a site can be held responsible for remediation of past contamination regardless of fault and regardless of whether the activity was legal at the time that it occurred. Evaluating and estimating the potential liability related to site remediation projects is a difficult undertaking, and several of our facilities have been affected by contamination from historic operations.
Our Belpre, Ohio, facility is the subject of a site investigation and remediation program administered by the Environmental Protection Agency pursuant to the Resource Conservation and Recovery Act. In March 1997, Shell Chemicals entered into a consent order to investigate and remediate areas of contamination on and adjacent to the site. In March 2003, we joined Shell Chemicals in signing a new consent order that required additional remediation and assessment of various areas of contamination and continues to require groundwater-monitoring and reporting. Shell Chemicals continues to take the lead in this program, has posted financial assurance of $5.2 million for the work required under the consent order and has also indemnified us for the work required under this program, subject to the condition that we provide notice on or prior to February 28, 2021. In turn, we have agreed with Shell Chemicals that we will, for a fee, provide certain services related to the remediation program. We have agreed with Shell Chemicals that we will pay up to $100,000 per year for the groundwater monitoring associated with the 2003 consent order.
85
Table of Contents
Our Brazilian facility has also been affected by prior Shell Chemicals operations. A Shell Chemicals pesticide manufacturing operation previously was located on a tract of land adjacent to our Brazilian facility. In addition, areas of our facility were used by Shell Chemicals as part of its crop protection business. Shell Chemicals has retained responsibility for remediating a former manufacturing facility located on our site and has also indemnified us for a number of the identified waste management areas used in prior operations. The indemnity from Shell Chemicals expired in 2004 for the following categories of claims to the extent notice was not previously provided by us: (1) remediation activity required by applicable environmental laws or third-party claims, (2) third-party claims for exposure to hazardous substances and (3) violations of environmental law. The indemnity for remediation relating directly to the plant for the previous pesticide manufacturing operations and for disposal activity related to that plant and for third-party claims regarding hazardous substance disposal requires us to give notice on or prior to February 28, 2021. Shell Chemicals has installed a hydraulic barrier to prevent migration of ground water contamination and has completed other cleanup actions on the site.
Shell Chemicals agreed to indemnify us for specific categories of environmental claims brought with respect to matters occurring before our separation from Shell Chemicals in February 2001. Coverage under the indemnity also varies depending upon the nature of the environmental claim, the location giving rise to the claim and the manner in which the claim is triggered. The indemnity from Shell Chemicals expired in 2004 for the following categories of claims to the extent notice was not previously provided by us: (1) site clean-up other than those specifically agreed with Shell Chemicals, (2) third-party claims for exposure to hazardous substances and (3) violations of environmental law. The indemnity for site clean-up specifically agreed with Shell Chemicals and for third-party claims regarding hazardous substance disposal requires us to give notice on or prior to February 28, 2021. Hence, if claims arise in the future related to past operations, we cannot give assurances that those claims will be covered by the Shell Chemicals’ indemnity and also cannot be certain that any amounts recoverable will be sufficient to satisfy claims against us.
In addition, we may in the future be subject to claims that arise solely from events or circumstances occurring after February 2001 that would not, in any event, be covered by the Shell Chemicals’ indemnity. While we recognize that we may, in the future, be held liable with respect for remediation activities beyond those identified to date, at present we are not aware of any circumstances that are reasonably expected to give rise to remediation claims that would have a material adverse effect on our results of operations or cause us to exceed our projected level of anticipated capital expenditures.
Insurance
We have customary levels of insurance for a company of our size in our industry. Our insurance policies are subject to customary deductibles and limits.
Seasonality
Seasonal changes and weather conditions typically affect our polymer product sales into our Paving and Roofing end use market. Within this market, typically, volume rises, as temperatures rise, from January to June, peaking during the summer. After summer, volume declines during the colder months in fall and winter. However, paving and roofing have different demand curves. Paving is seasonal with a warm weather peak and cool weather decline due to temperature requirements, whereas roofing tends to be more consistent throughout the year. Our other end use markets, Advanced Materials and Adhesives, Sealants and Coatings, and Emerging Businesses tend to show relatively little seasonality.
Available Information
We electronically file reports with the SEC, including annual reports on Form 10-K, quarterly reports on Form 10-Q, current reports on Form 8-K and amendments to such reports. The public may read and copy any materials that we file with the SEC at the SEC’s Public Reference Room at 100 F Street, N.E., Washington, D.C.
86
Table of Contents
20549. The public may obtain information on the operation of the Public Reference Room by calling the SEC at 1-800-SEC-0330. The SEC also maintains an internet site that contains reports and information statements, and other information regarding issuers that file electronically with the SEC at http://www.sec.gov. Additionally, information about us, including our reports filed with the SEC, is available through our web site at http://www.kraton.com. Such reports are accessible at no charge through our web site and are made available as soon as reasonably practicable after such material is filed with or furnished to the SEC. Our website and the information contained on that site, or connected to that site, are not incorporated by reference into this prospectus.
Properties
Our principal executive offices are located at 15710 John F. Kennedy Boulevard, Suite 300, Houston, Texas 77032.
We believe that our properties and equipment are generally in good operating condition and are adequate for our present needs. Production capacity at our sites can vary depending upon feedstock, product mix and operating conditions.
The following table sets forth our principal facilities:
| Location |
Acres | Approximated Square Footage |
Use |
Owned/ Leased | ||||
| Belpre, Ohio, United States |
350 | 3,600,000 | Manufacturing | Owned (1) | ||||
| Wesseling, Germany |
8.1 | 354,000 | Manufacturing | Leased (2) | ||||
| Berre, France |
9.0 | 392,000 | Manufacturing | Owned (3) | ||||
| Paulinia, Brazil |
179 | 2,220,000 | Manufacturing | Owned | ||||
| Kashima, Japan |
11.6 | 395,000 | Manufacturing | Owned (4) | ||||
| Houston, Texas, United States |
N/A | 105,500 | R&D | Leased (5) | ||||
| Amsterdam, The Netherlands |
N/A | 32,015 | R&D | Leased (5) | ||||
| Tsukuba, Japan |
4.5 | 23,327 | R&D | Owned | ||||
| Shanghai, China |
N/A | 20,000 | Distribution | Leased (5) |
| (1) | A portion of the HSBC capacity at the Belpre facility is owned by Infineum USA, a joint venture between Shell Chemicals and ExxonMobil. |
| (2) | We lease the land and the manufacturing facility, but own the production equipment. |
| (3) | We lease the land, but own the manufacturing facility and production equipment. |
| (4) | The Kashima, Japan, facility is owned by our 50%-50% joint venture with JSR. |
| (5) | We lease the facility, but own the equipment. |
Belpre, Ohio, United States. Our Belpre, Ohio site is our largest manufacturing facility with connections to barge, rail and truck shipping and receiving facilities. The Belpre site has approximately 189 kilotons of production capacity to which we are entitled. It has the largest dedicated SBC production capacity of any SBC facility in the world. The Belpre facility currently produces USBC and HSBC products.
A portion of the HSBC capacity at Belpre is owned by Infineum USA. Infineum is a joint venture between Shell Chemicals and ExxonMobil that makes products for the lubricating oil additives business. Under a facility sharing agreement that terminates in 2030, we operate Infineum’s share of the HSBC assets to manufacture a line of products for Infineum, and Infineum is entitled to a portion of the HSBC capacity at Belpre. Other than those assets owned by Infineum, we own the Belpre facility and the land on which it is located.
Wesseling, Germany. Our Wesseling, Germany, manufacturing site is located on the premises of LyondellBasell. The site has direct access to major highways and extensive railway connections. Production capacity is approximately 95 kilotons. LyondellBasell owns the land and buildings on the premises and leases them to us. All leased property is required to be used in connection with our elastomers business. The lease is for
87
Table of Contents
a term of 30 years, beginning from March 31, 2000 and is extended automatically for a successive period of 10 years unless terminated upon one-year’s written notice by either party. We own the SBC production equipment in the manufacturing facility. The Wesseling facility currently produces USBC products. LyondellBasell provides us operating and site services, utilities, materials and facilities under a long-term production agreement. LyondellBasell has the right to approve any expansion of our facility at Wesseling provided its consent may only be withheld if an expansion would be detrimental to the site.
Berre, France. Our Berre, France, site is located in southeastern France. The facility has direct access to sea, rail and road transport and has a production capacity of approximately 87 kilotons. The Berre site was leased to us by Shell Petrochimie Mediterranee through April 1, 2008, at which time the site was sold to LyondellBasell, which now operates the site and with which our lease now exists under a long-term lease due to expire in 2030. We own the SBC manufacturing facility and production equipment at Berre. We currently produce USBC and HSBC products there. We have an operating agreement with LyondellBasell for various site services, utilities and facilities under a long-term agreement.
Paulinia, Brazil. Our Paulinia, Brazil, site is located with access to major highways. The facility currently has a production capacity of approximately 28 kilotons of USBC. The facility was built to meet demand for IRL products for hypoallergenic and medical applications, including surgical gloves and condoms. We own the facility at Paulinia as well as the land on which our facility sits. BASF owns the adjacent site and shares title to facilities that are common to the two companies such as the administration building, cafeteria and maintenance facilities. An expansion of the existing capacity was completed in 2009.
Kashima, Japan. Our Kashima, Japan, site is operated by a manufacturing joint venture named Kraton JSR Elastomers K.K., or KJE, between us and JSR. The Kashima site is located northeast of Tokyo on the main island of Honshu at a JSR site that includes several synthetic rubber plants and butadiene and isoprene extraction units. This site is serviced by rail, barge and truck connections. Production capacity is approximately 40 kilotons of USBC products, and we are generally entitled to 50% of the production pursuant to our joint venture agreement. The SBC manufacturing facility is leased to KJE.
JSR markets its portion of the production under its own trademarks, and we market our portion of the production under the Kraton® brand name although this amount may vary from time to time based on the economic interest of the joint venture. We and JSR each have a right of first refusal on the transfer of the joint venture interests of the other.
Legal Proceedings
We and certain of our subsidiaries are parties to several legal proceedings that have arisen in the ordinary course of business. While the outcome of these proceedings cannot be predicted with certainty, management does not expect these matters, individually or in the aggregate, to have a material adverse effect upon our financial position, results of operations or cash flows. Furthermore, Shell Chemicals has agreed, subject to certain limitations, to indemnify us for certain claims brought with respect to matters occurring before February 28, 2001. As of June 30, 2010, we have not been named as parties in any of these claims. Our right to indemnification from Shell Chemicals is subject to certain time limitations disclosed under “—Environmental Regulation.”
88
Table of Contents
MANAGEMENT AND BOARD OF DIRECTORS
Directors and Executive Officers
The following table sets forth the name, age and position of individuals who currently serve as directors and executive officers of our company. Each of the individuals listed below, other than Ms. Twitchell, served as a director or officer of Kraton and has been named to the same position at Kraton Performance Polymers in connection with our initial public offering. Ms. Twitchell was appointed as a director of Kraton Performance Polymers and Kraton, effective December 3, 2009.
| Name |
Age | Position | ||
| Dan F. Smith |
64 | Director and Chairman of the Board of Directors | ||
| Barry J. Goldstein |
67 | Director and Audit Committee Chairman | ||
| Kelvin L. Davis |
46 | Director | ||
| Michael G. MacDougall |
39 | Director | ||
| Nathan H. Wright |
44 | Director | ||
| Timothy J. Walsh |
46 | Director | ||
| Kevin G. O’Brien |
44 | Director | ||
| Steven J. Demetriou |
51 | Director | ||
| Richard C. Brown |
50 | Director | ||
| Karen A. Twitchell |
54 | Director | ||
| Kevin M. Fogarty |
44 | Director, Chief Executive Officer and President | ||
| Stephen E. Tremblay |
51 | Vice President and Chief Financial Officer | ||
| David A. Bradley |
39 | Chief Operating Officer | ||
| Richard A. Ott |
56 | Vice President, Human Resources and Corporate Communications | ||
| Stephen W. Duffy |
57 | Vice President, General Counsel and Secretary | ||
| Lothar Freund |
50 | Vice President, Technology | ||
| Larry R. Frazier |
64 | Chief Information Officer |
Dan F. Smith. Mr. Smith was named a director and Chairman of Kraton Polymers LLC on February 4, 2008 and as a director of Kraton Performance Polymers on September 29, 2009. He began his career with ARCO (Atlantic Richfield Company) in 1968 as an engineer. He was elected President of Lyondell Chemical Company in August 1994, Chief Executive Officer in December 1996, and Chairman of the Board of Directors in May 2007. Mr. Smith retired in December 2007 as Chairman, President and Chief Executive Officer of Lyondell Chemical Company following the acquisition of Lyondell by Basell. Mr. Smith also served as Chief Executive Officer of Equistar Chemicals, LP from December 1997 through December 2007 and as Chief Executive Officer of Millennium Chemicals Inc. from November 2004 until December 2007. Equistar and Millennium are wholly-owned subsidiaries of Lyondell. Mr. Smith is a director of Cooper Industries, Inc. and is Chairman of the Board of the general partner of Valerus Compression Services, L.P. He also serves as a member of the College of Engineering Advisory Council at Lamar University and as a member of the Board of Trustees of the Lamar University Foundation. Mr. Smith is a graduate of Lamar University with a B.S. degree in Chemical Engineering.
Our Corporate Governance and Nominating Committee has considered the following in evaluating whether Mr. Smith should serve on our board: Mr. Smith has a long and distinguished career in the chemical industry and is widely recognized as an expert in the field. He has extensive executive experience at the highest levels, including several years of experience as the Chief Executive Officer of a major chemical company. Mr. Smith has international business experience, together with chemical engineering expertise that is of value to the board.
Barry J. Goldstein. Mr. Goldstein was named a director of Kraton Polymers LLC on May 1, 2008 and as a director of Kraton Performance Polymers on September 29, 2009. Mr. Goldstein retired as Executive Vice President and Chief Financial Officer of Office Depot, Inc. in October 2000, which he first joined as Chief Financial Officer in May 1987. Mr. Goldstein was previously with Grant Thornton from 1969 through May 1987,
89
Table of Contents
where he was named a Partner in 1976. Mr. Goldstein is a director of Interline Brands, Inc., Noble Environmental Power, LLC and Generac Holdings, Inc. During the past five years, Mr. Goldstein served on the boards of directors of PQ Corp. and Brand Energy & Infrastructure Services, Inc. He received a B.S. degree in Economics from the Wharton School at the University of Pennsylvania.
Our Corporate Governance and Nominating Committee has considered the following in evaluating whether Mr. Goldstein should serve on our board: Mr. Goldstein has public company financial reporting experience at the highest levels, having served as the Chief Financial Officer for Office Depot for over a decade, having been a partner in a major public accounting firm, and having served on numerous corporate audit committees. Mr. Goldstein also has strong corporate finance experience, demonstrated business leadership experience, and board experience in early stage public companies.
Kelvin L. Davis. Mr. Davis was named a director of Kraton Polymers LLC and Kraton Performance Polymers on December 23, 2003. Mr. Davis is a senior partner of TPG and Head of the North American Buyouts Group, incorporating investments in all non-technology industry sectors. Prior to joining TPG in 2000, Mr. Davis was President and Chief Operating Officer of Colony Capital, Inc., a private international real estate-related investment firm in Los Angeles. Prior to the formation of Colony, Mr. Davis was a principal of RMB Realty, Inc., the real estate investment vehicle of Robert M. Bass. Prior to his affiliation with RMB Realty, Inc., he worked at Goldman, Sachs & Co. in New York City and with Trammell Crow Company in Dallas and Los Angeles. Mr. Davis earned a B.A. degree in Economics from Stanford University and an M.B.A. from Harvard University, where he was a Baker Scholar, a John L. Loeb Fellow and a Wolfe Award recipient. Mr. Davis is a director of Metro-Goldwyn-Mayer, Inc., Harrah’s Entertainment, Inc., Univision Communications, Inc. and ST Residential, LLC. During the past five years, Mr. Davis served on the board of directors of Aleris International, Inc. He is also a director of Los Angeles Team Mentoring, Inc., a charitable mentoring organization, a director of the Los Angeles Philharmonic Association, and is on the Board of Overseers and Art Collectors Council of The Huntington Library, Art Collections and Botanical Gardens.
Our Corporate Governance and Nominating Committee has considered the following in evaluating whether Mr. Davis should serve on our board: Mr. Davis has significant skill and experience in corporate finance, having over a decade of experience in investment banking and private equity finance. He has considerable breadth of experience in public and private company management. Mr. Davis also has executive leadership experience, having served as President and COO of Colony Capital. In addition, he brings unique experience to our board in the area of real estate. Mr. Davis also has a longstanding tenure on our board, which provides a breadth of experience with our company that is beneficial to the board as a whole.
Michael G. MacDougall. Mr. MacDougall was named a director of Kraton Polymers LLC and Kraton Performance Polymers on December 23, 2003. Mr. MacDougall is a partner of TPG Capital. Prior to joining TPG Capital in 2002, Mr. MacDougall was a vice president in the Principal Investment Area of the Merchant Banking Division of Goldman, Sachs & Co., where he focused on private equity and mezzanine investments. He is a director of Graphic Packaging Holding Company and Energy Future Holdings Corp. (formally TXU Corp.) and a director of the general partner of Valerus Compression Services, L.P. He also serves as the Chairman of the Board of The Opportunity Network and is a member of the board of directors of the Dwight School Foundation and Iselsboro Affordable Property. Mr. MacDougall is a graduate of The University of Texas at Austin and received his M.B.A. with distinction from Harvard Business School.
Our Corporate Governance and Nominating Committee has considered the following in evaluating whether Mr. MacDougall should serve on our board: Mr. MacDougall has strong skills and experience in corporate finance, having over a decade of experience in investment banking and private equity finance. He has board experience in early stage public companies and significant board experience managing private companies. Mr. MacDougall also has a longstanding tenure on our board, which provides a breadth of experience with our company that is beneficial to the board as a whole.
90
Table of Contents
Nathan H. Wright. Mr. Wright was named a director of Kraton Polymers LLC and as a director of Kraton Performance Polymers on July 26, 2005. Mr. Wright has been a partner of TPG’s Operations Group for ten years, during which time he has supported transformation efforts within TPG portfolio companies. Prior to joining TPG, Mr. Wright spent six years as a consultant with Bain & Company in the firm’s Dallas, Texas, Sydney, Australia, and Johannesburg, South Africa, offices. He received his M.B.A. from the Tuck School at Dartmouth College. Prior to earning his M.B.A., Mr. Wright worked in the information systems consulting and outsourcing industry for four years and founded an Atlanta-based systems strategy firm. He holds a B.S. degree in Mechanical Engineering from the Rose-Hulman Institute of Technology.
Our Corporate Governance and Nominating Committee has considered the following in evaluating whether Mr. Wright should serve on our board: Mr. Wright’s engineering experience and business background in supporting transformational efforts within a broad range of companies and industries provides invaluable insight to our board. Mr. Wright has significant board experience.
Timothy J. Walsh. Mr. Walsh was named a director of Kraton Polymers LLC and Kraton Performance Polymers on December 23, 2003. Mr. Walsh is a Managing Director of CCMP Capital Advisors, LLC, a private equity firm formed in August 2006 by the former buyout/growth equity investment team of J.P. Morgan Partners, LLC, a private equity division of JPMorgan Chase & Co. Prior to his role with CCMP, Mr. Walsh was a partner with J.P. Morgan Partners, LLC. Prior to joining J.P. Morgan Partners, LLC in 1993, he was a vice president of J.P. Morgan Chase & Co. (formerly The Chase Manhattan Corporation). Mr. Walsh is a director of Octagon Credit Investors, LLC, Metokote Corporation and Generac Holdings, Inc. During the past five years, Mr. Walsh also served on the boards of directors of Pliant Corp and PQ Corp. Mr. Walsh received his B.S. in Economics from Trinity College, Hartford and his M.B.A. from the University of Chicago.
Our Corporate Governance and Nominating Committee has considered the following in evaluating whether Mr. Walsh should serve on our board: Mr. Walsh has excellent skills and experience in corporate finance, having over two decades of experience in banking, investment banking and private equity finance. He has board experience in early stage public companies and significant board experience managing private companies. Mr. Walsh also has a longstanding tenure on our board, which provides a breadth of experience with our company that is beneficial to the board as a whole.
Kevin G. O’Brien. Mr. O’Brien was named a director of Kraton Polymers LLC on January 31, 2008 and as a director of Kraton Performance Polymers on September 29, 2009. Mr. O’Brien is a managing director of CCMP Capital Advisors, LLC, a private equity firm formed in August 2006 by the former buyout/growth equity investment team of J.P. Morgan Partners, LLC, a private equity division of JPMorgan Chase & Co. Prior to his role with CCMP, Mr. O’Brien was a partner with J.P. Morgan Partners, LLC. Prior to joining JPMP in 2000, Mr. O’Brien worked in the High Yield Capital Markets and High Yield Corporate Finance Groups at Chase Securities and Chemical Securities. Previously, he was a member of the Leveraged Finance Group at Bankers Trust and prior to that, Mr. O’Brien was a Commissioned Officer in the U.S. Navy. Mr. O’Brien is a director of CareMore Medical Enterprises, FSC Acquisition, LLC (Hanley Wood, LLC), Infogroup, Inc., LHP Hospital Group, Inc. and National Surgical Care, Inc. During the past five years, Mr. O’Brien also served on the boards of directors of LPA Holding Corp. and Pinnacle Foods Group, Inc. Mr. O’Brien holds a B.A. in Economics and English from the University of Notre Dame and an M.B.A. from the Wharton School of the University of Pennsylvania.
Our Corporate Governance and Nominating Committee has considered the following in evaluating whether Mr. O’Brien should serve on our board: Mr. O’Brien has significant skill and experience in corporate finance, having over a decade of experience in investment banking and private equity finance. Mr. O’Brien has financial reporting experience and is financially literate. He has significant board experience with private companies. Mr. O’Brien’s demonstrated leadership ability from his military service is a benefit to our board.
Steven J. Demetriou. Mr. Demetriou was named a director of Kraton Polymers LLC and as a director of Kraton Performance Polymers on December 1, 2004. Mr. Demetriou is currently the Chairman and Chief
91
Table of Contents
Executive Officer of Aleris International, Inc. Previously, Mr. Demetriou was appointed President and Chief Executive Officer of Commonwealth Industries, Inc. (a predecessor by merger to Aleris) in June 2004, after serving as a member of that company’s board of directors since 2002. Before joining Commonwealth in 2004, Mr. Demetriou was President and Chief Executive Officer of privately held Noveon, Inc. Prior to that, from 1999 to 2001, he was Executive Vice President of IMC Global Inc. From 1997 to 1999, Mr. Demetriou held various leadership positions with Cytec Industries Inc. From 1981 to 1997, he served in management positions with ExxonMobil Corporation. Mr. Demetriou is a director of Foster Wheeler and OM Group, Inc. He has a B.S. degree in Chemical Engineering from Tufts University.
Our Corporate Governance and Nominating Committee has considered the following in evaluating whether Mr. Demetriou should serve on our board: Mr. Demetriou has business leadership experience at the highest levels, is currently serving as the CEO of Aleris International, and has prior CEO experience. He has extensive experience in the specialty chemicals industry, together with significant board experience within public companies. Mr. Demetriou also has a longstanding tenure on our board, which provides a breadth of experience with our company that is beneficial to the board as a whole. Mr. Demetriou has chemical engineering expertise that is also of benefit to our board.
Richard C. Brown. Mr. Brown was named a director of Kraton Polymers LLC on May 1, 2008 and as a director of Kraton Performance Polymers on September 29, 2009. Mr. Brown is Chief Executive Officer of Performance Fibers, Inc., a global leader in high-performance industrial fibers and related materials. Prior to joining Performance Fibers, Mr. Brown was a vice president of W.R. Grace & Co. and President of the Grace Performance Chemicals business, which business included Grace Construction Products, Grace Residential Building Products and Darex Packaging Technologies. Previously, he spent 19 years with General Electric Co. in a series of positions with increasing responsibilities, including President of GE Silicones, Core Products Business and President of GE Sealants & Adhesives. Mr. Brown is a director of Ferro Corporation. Mr. Brown has a B.S. degree from Plymouth State University (University of New Hampshire system).
Our Corporate Governance and Nominating Committee has considered the following in evaluating whether Mr. Brown should serve on our board: Mr. Brown has extensive experience in the chemical industry, including experience in the specialty chemicals business. He has business leadership experience at the highest levels, currently serving as the CEO of Performance Fibers and having served in senior executive positions with major companies. Mr. Brown also has significant international experience.
Karen A. Twitchell. Ms. Twitchell was named as a director of Kraton Polymers LLC and Kraton Performance Polymers effective as of December 3, 2009. From 2001 to 2009, Ms. Twitchell was a Vice President and Treasurer of LyondellBasell Industries and Lyondell Chemical Company (a predecessor by merger to LyondellBasell). She previously served as a Vice President and Treasurer of Kaiser Aluminum Corporation where she was employed from 1996 to 2000. Prior to that, she served as a Vice President and Treasurer of Southdown, Inc. Before joining Southdown in 1988, Ms. Twitchell was an investment banker with Credit Suisse First Boston in its corporate finance department for seven years. Ms. Twitchell is a director of KMG Chemicals, Inc. Ms. Twitchell holds a B.A. in Economics from Wellesley College and an M.B.A. from Harvard University.
Our Corporate Governance and Nominating Committee has considered the following in evaluating whether Ms. Twitchell should serve on our board at this time: Ms. Twitchell has broad experience in financial management and corporate finance, including investment banking and the treasury function. She is financially literate and eligible to serve on our Audit Committee. Ms. Twitchell also has chemical industry experience and approximately 30 years’ experience in senior corporate positions.
Kevin M. Fogarty. Mr. Fogarty was named a director of Kraton Polymers LLC effective as of January 31, 2008 and as a director of Kraton Performance Polymers on September 29, 2009. Mr. Fogarty was appointed our President and Chief Executive Officer on January 14, 2008. Prior to being appointed President and Chief
92
Table of Contents
Executive Officer, Mr. Fogarty served as our Executive Vice President of Global Sales and Marketing from June 15, 2005. Mr. Fogarty joined us from Invista, where he had served as President for Polymer and Resins since May 2004. For the 13 years prior to his most recent position with Invista, Mr. Fogarty held a variety of roles within the Koch Industries, Inc. family of companies, including KoSa. Mr. Fogarty earned a B.S. degree in Engineering from the Technical University of Nova Scotia.
Our Corporate Governance and Nominating Committee has considered the following in evaluating whether Mr. Fogarty should serve on our board: The Corporate Governance and Nominating Committee believes the Chief Executive Officer should serve on our board. As the Chief Executive Officer of our company and the only management representative on the board, Mr. Fogarty provides valuable insight to the board into the day to day business issues facing our company. Mr. Fogarty has extensive sales, marketing and leadership experience in the chemical industry, including experience in the specialty chemicals business, and has broad international business experience. His strong chemical company expertise in marketing is of particular value to our board. In addition, Mr. Fogarty has high-level leadership experience in several prior positions.
Stephen E. Tremblay. Mr. Tremblay was appointed Vice President and Chief Financial Officer on January 21, 2008. From 1997 to 2007, Mr. Tremblay held various financial positions, including Chief Financial Officer at Vertis, Inc., a provider of print advertising and media technology. From 1990 to 1997, Mr. Tremblay held senior finance positions at Wellman, Inc., a provider of polyester fiber and resins, and from 1983 to 1990 was a member of the accounting and auditing practice at Ernst & Young. Mr. Tremblay earned a B.S. degree in Business Administration from Bryant University and is a Certified Public Accountant.
David A. Bradley. Mr. Bradley was appointed Chief Operating Officer on January 14, 2008 and was previously our Vice President of Global Operations since December 2, 2004. On April 1, 2004, we hired Mr. Bradley as Vice President of Business Transformation. Prior to joining us, he served as the Lexan Manufacturing Manager at GE Plastics’ Mount Vernon, Indiana, site. From 1994 to 2004, Mr. Bradley served in a variety of leadership positions for GE Plastics, which included roles in business process development and Six Sigma. He holds a B.S. degree in Chemical Engineering from the University of Louisville.
Richard A. Ott. Mr. Ott has been our Vice President of Human Resources and Corporate Communications since December 2, 2004. Mr. Ott was the Vice President of Operations and Human Resources from June 2000 to December 2004. From 1998 to 2002, he also served as the Site Manager for the Belpre facility. Mr. Ott started with Shell Chemicals in 1976, where he held various positions in operations and business strategy. He holds a B.S. degree in Industrial Engineering from West Virginia University.
Stephen W. Duffy. Mr. Duffy was appointed Vice President, General Counsel and Secretary on February 4, 2008. Prior to his appointment, Mr. Duffy served as Counsel to Curtis, Mallet-Prevost, Colt & Mosle, LLP where he was responsible for domestic and international energy sector transactions. Mr. Duffy previously served as Senior Vice President, Legal and Government Affairs for Paramount Petroleum Corporation from July 2004 to July 2005, and as Vice President, Global General Counsel and Secretary for KoSa B.V. from December 2000 to April 2004. Mr. Duffy earned an A.B. degree from Duke University and his J.D. degree from Southern Methodist University.
Lothar Freund. Mr. Freund has served as our Vice President of Technology since 2005. He is responsible for Kraton Performance Polymers’ global R&D programs and technical service as well as the implementation of the company-wide innovation process. Dr. Freund joined us from Koch Industries, where he served from 1989 in a variety of operating and technical positions in the polyester businesses acquired from Hoechst in 1998, most recently as the manufacturing and technology director of the PET & Nylon Polymer business of Invista, a Koch subsidiary. Dr. Freund holds a Masters Degree and a Ph.D. in Polymer Chemistry from the University of Marburg in Germany.
Larry R. Frazier. Mr. Frazier joined Kraton Performance Polymers as Chief Information Officer on November 10, 2008. Prior to joining us, Mr. Frazier was Chief Information Officer for Chevron Phillips
93
Table of Contents
Chemical Company, a position he had held since July 2000. Previous to this, Mr. Frazier was employed in various management positions with Phillips Petroleum Company (now ConocoPhillips). Earlier in his career, he worked for the U.S. federal government as a Statistician/Mathematician. Mr. Frazier earned a B.S. degree in Mathematics from Northeastern Oklahoma State University, a Masters Degree in Electrical Engineering from University of New Mexico and a Masters in Public Administration from Harvard University.
Our Board of Directors
Controlled Company
Following the completion of this offering, we will no longer qualify for the controlled company exemption under the corporate governance rules of the New York Stock Exchange. As a result, in addition to a majority of independent directors on our board of directors meeting the independence requirements of the New York Stock Exchange, our Compensation Committee and Corporate Governance and Nominating Committee must be composed entirely of independent directors as defined under the rules of the New York Stock Exchange within one year of the date we cease to be a controlled company. We have determined that we currently satisfy this independence requirement for our Compensation Committee and Corporate Governance and Nominating Committee. The controlled company exemption does not modify the independence requirements for the Audit Committee, and we currently comply with the requirements of the Sarbanes-Oxley Act of 2002 and the New York Stock Exchange, which require that our audit committee be composed of at least three members, one of whom will be independent upon the listing of our common stock on the New York Stock Exchange, a majority of whom will be independent within 90 days of the date of this prospectus, and each of whom will be independent within one year of the date of this prospectus.
Board Composition
Our board of directors is currently comprised of eleven members. The exact number of members of our board of directors will be determined from time to time by resolution of a majority of our full board of directors.
Our board of directors is divided into three classes, with each director serving a three-year term and one class being elected at each year’s annual meeting of stockholders.
Messrs. Goldstein, MacDougall, Smith and Walsh serve as Class I directors (with a term expiring in 2013). Messrs. Brown, Davis, O’Brien and Wright serve as Class II directors (with a term expiring in 2011). Messrs. Demetriou and Fogarty and Ms. Twitchell serve as Class III directors (with a term expiring in 2012).
Independence
Our board has determined that each of Ms. Twitchell and Messrs. Brown, Davis, Demetriou, Goldstein, MacDougall, O’Brien, Smith, Walsh and Wright is independent under the New York Stock Exchange listed company rules and applicable law. Such directors are collectively referenced in this prospectus as the “Independent Directors.”
In making its independence determinations, the board considers and broadly evaluates all information provided by each director in response to detailed questionnaires concerning his or her independence and any direct or indirect business, family, employment, transaction, or other relationship or affiliation of such director with our company.
As part of its analysis to determine director independence, the board reviewed the affiliations of Messrs. Davis, MacDougall and Wright with TPG Capital, which is affiliated with TPG Advisors III, Inc. and TPG Group Holdings (SBS) Advisors, Inc., two of our stockholders. In addition, the board reviewed the affiliations of Messrs. O’Brien and Walsh with J.P. Morgan Partners, which is affiliated with JPMP Capital Corp, one of our stockholders. Messrs. O’Brien and Walsh are Managing Directors of CCMP Capital Advisors, LLC, which acts as an investment advisor to J.P. Morgan Partners and are serving on the board at the request of J.P. Morgan Partners.
94
Table of Contents
Under the Dodd-Frank Wall Street Reform and Consumer Protection Act, which was signed into law on July 21, 2010, the SEC must direct national securities exchanges and national securities associations, no later than July 16, 2011, to adopt a separate definition of independence for the compensation committee members. We intend to fully comply with this requirement once the SEC issues the applicable rule.
Committees of the Board of Directors
We currently have four standing committees: the Audit Committee, the Corporate Governance and Nominating Committee, the Compensation Committee and the Executive Committee. The charters for each of these committees can be found in the “Investor Relations” section of our web site located at www.kraton.com.
Audit Committee
Our Audit Committee consists of Messrs. Goldstein (Chair) and O’Brien and Ms. Twitchell. The Audit Committee will be responsible for, among other things:
| • | selecting and hiring our independent registered public accounting firm, and pre-approving the audit and non-audit services to be performed by our independent registered public accounting firm; |
| • | reviewing the performance of the internal audit services function; |
| • | discussing the scope and results of the audit with the independent registered public accounting firm and reviewing with management and the independent registered public accounting firm our interim and year-end operating results; |
| • | reviewing the adequacy and effectiveness of our internal control policies and procedures; |
| • | preparing the Audit Committee report required by the SEC to be included in our annual proxy statement; |
| • | monitoring the integrity of our financial statements and our compliance with legal and regulatory requirements as they relate to financial statements or accounting matters; |
| • | setting policies regarding the hiring of current and former employees of the independent registered public accounting firm; |
| • | discussing types of information to be disclosed in earnings press releases and provided to analysts and rating agencies; |
| • | establishing procedures for receipt, retention and treatment of complaints received by the company regarding accounting or internal controls and the submission of anonymous employee concerns regarding accounting; |
| • | discussing with our general counsel legal matters having an impact on financial statements; |
| • | reviewing the policy with respect to related party transactions and approving or rejecting proposed related party transactions; and |
| • | undertaking such other tasks delegated to the committee by the Board of Directors, including matters relating to risk oversight. |
Our board of directors has affirmatively determined that Mr. Goldstein and Ms. Twitchell meet the definition of “independent director” for purposes of serving on an audit committee under applicable SEC and New York Stock Exchange rules. In addition, our Board of Directors has determined that Mr. Goldstein qualifies as our “audit committee financial expert.” We have determined that Mr. O’Brien does not meet the criteria for independence set forth in Rule 10A-3 of the Securities Exchange Act of 1934, as amended (the “Exchange Act”), because he is deemed an affiliated person of the company based upon his relationship with J.P. Morgan Partners as a result of his employment with CCMP Capital Advisors, LLC, which acts as an investment adviser to J.P. Morgan Partners. However, Mr. O’Brien is deemed to be independent under the general corporate governance rules of the New York Stock Exchange. We expect that we will be in compliance with all applicable “independent director” requirements as and when required by SEC and New York Stock Exchange rules.
95
Table of Contents
We currently comply with the requirements of the Sarbanes-Oxley Act of 2002 and the New York Stock Exchange, which require that our Audit Committee be composed of at least three members, all of whom must be independent by December 16, 2010 (one year following the effective date of our initial public offering). We do not believe that our reliance on this “phase-in” exemption that allows our Audit Committee to consist of only a majority of independent directors until December 16, 2010 materially adversely affects the ability of the Audit Committee to act independently and to satisfy the other requirements of the SEC and New York Stock Exchange rules with respect to audit committees of public companies.
Compensation Committee
Our Compensation Committee consists of Messrs. Brown, Smith, Walsh (Chair) and Wright. We have determined that all the committee members are independent for purposes of the New York Stock Exchange and meet the definition of “outside director” for purposes of Section 162(m) of the Internal Revenue Code of 1986, as amended (the “Internal Revenue Code”). We have determined that Mr. Brown meets the definition of “non-employee director” for purposes of Section 16 of the Exchange Act. The Compensation Committee will be responsible for, among other things:
| • | reviewing and approving corporate goals and objectives relevant to compensation of our executive officers and other members of management; |
| • | determining the compensation of our officers and directors; |
| • | recommending, when appropriate, changes to our compensation philosophy and principles; |
| • | evaluation of overall compensation and benefits programs; |
| • | recommending to our board any changes in our incentive compensation and equity-based plans that are subject to board approval; |
| • | reviewing and discussing with management, prior to the filing of the proxy statement, the disclosure prepared regarding executive compensation, including the Compensation Discussion and Analysis and the compensation tables (in addition to preparing a report on executive compensation for the proxy statement); and |
| • | undertaking such other tasks delegated to the committee by the Board of Directors, including matters relating to risk oversight. |
Under its charter, our Compensation Committee may delegate any of its responsibilities to one or more subcommittees comprised of one or more members of the Compensation Committee. Without limiting the foregoing, the Compensation Committee may establish a committee comprised of our officers, directors or employees to administer defined benefit and other pension plans as may be provided in plan documentation or otherwise. See “Executive Compensation—Compensation Discussion and Analysis” for information on our process and procedures for determining 2009 executive officer compensation.
Corporate Governance and Nominating Committee
Our Corporate Governance and Nominating Committee consists of Messrs. Demetriou, MacDougall (Chair) and O’Brien. We have determined that all the committee members are independent for purposes of the New York Stock Exchange. The Corporate Governance and Nominating Committee is responsible for, among other things:
| • | assisting our Board of Directors in identifying prospective director nominees, and recommending nominees for each annual meeting of stockholders to the Board of Directors; |
| • | reviewing developments in corporate governance practices and developing and recommending governance principles applicable to our Board of Directors; |
| • | overseeing the evaluation of our Board of Directors and management; and |
| • | recommending members for each board committee of our Board of Directors. |
96
Table of Contents
Executive Committee
Our Executive Committee consists of Messrs. Fogarty, MacDougall, Smith (Chair) and Walsh. The purpose of the committee is to act, between meetings of the board, with the authority of the board on matters set forth in the committee’s charter. Subject to the limitations specified in the committee’s charter, by Delaware law and in our Certificate of Incorporation and Bylaws, the responsibility of the committee is to act, between meetings of the board with respect to matters arising with respect to the company in the ordinary course of business and specified from time to time by the board and with respect to such other matters as may be delegated to the committee by the board.
Compensation Committee Interlocks and Insider Participation
None of our Compensation Committee members was formerly or during 2009 an officer of or employed by us. No executive officer serves as a member of the board of directors or compensation committee of any entity that has one or more executive officers serving as a member of our board of directors or our Compensation Committee. No member of our Compensation Committee had any relationship requiring disclosure under Item 404 of Regulation S-K under the Exchange Act.
Code of Ethics and Business Conduct
We have adopted a Code of Ethics and Business Conduct that is applicable to all of our directors, officers and other employees. The Code is posted under the “Investor Relations” section on our web site at www.kraton.com and is available to any stockholder upon request. If there are any changes to or waivers of the Code of Ethics and Business Conduct that apply to our Chief Executive Officer and/or Senior Financial Officers, we will disclose them on our web site in the same location.
Corporate Governance Guidelines
We are committed to having sound corporate governance practices that maximize stockholder value in a manner consistent with legal requirements and the highest standard of integrity. In that regard, our board has adopted guidelines that provide a framework for the governance of Kraton Performance Polymers. In addition, we frequently review these guidelines and regularly monitor developments in the area of corporate governance. Our Corporate Governance Guidelines are posted under the “Investor Relations” section on our web site at www.kraton.com and is available to any stockholder upon request.
Involvement in Certain Legal Proceedings
Steven J. Demetriou, one of our directors, is the Chief Executive Officer of Aleris International, Inc. On February 12, 2009, Aleris International and its wholly-owned U.S. subsidiaries filed petitions for voluntary reorganization under Chapter 11 of the U.S. Bankruptcy Code, in the U.S. Bankruptcy Court in the State of Delaware.
Election of Officers
Our Board of Directors elects our officers, and our officers serve until their successors are duly elected and qualified.
Director Compensation
Directors who are our employees are not entitled to receive any compensation for their services. See “Executive Compensation.”
97
Table of Contents
Compensation Discussion and Analysis
We do not directly employ any executive officers. The executives who run our company are employed by Kraton, and, therefore, the disclosure in this section relates to those executives. References to “our” compensation policies in this section refer to the joint policies and practices of us and Kraton, and references to “our” Compensation Committee refers to both the Compensation Committees of us and Kraton. Our compensation program for executive officers named in the Summary Compensation Table below, referred to in this section as the “named executive officers,” is structured to attract, motivate, retain and reward high quality executives. This section includes information and analysis related to such compensation arrangements of our named executive officers.
Compensation Philosophy and Objectives
Our Compensation Committee looks to the aggregate compensation package for each named executive officer to determine the individual elements of each such named executive officer’s pay. Our executive compensation policy, as established by our Compensation Committee, is designed to provide a base salary and incentive compensation that is competitive in the marketplace with other privately and publicly owned chemical companies whose revenue is similar to ours.
Our Compensation Committee and our board of directors approve an annual variable cash compensation plan, or the Incentive Compensation Plan, targeted to pay competitive bonuses provided that pre-established individual and company performance goals are achieved. Although we consider compensation to executives of our peer companies (described below), we do not formally benchmark our executives’ compensation.
Our Compensation Committee may also approve the grant of options, or other equity or equity-based awards from time to time. Each of our named executive officers has one or more of the types of awards described under the section entitled “Components of Direct Compensation—Equity” below. These awards are intended to motivate our named executive officers and align their long-term interests with those of our company and our stockholders by linking a portion of the executive’s compensation with the performance of our company, while also promoting retention by utilizing multi-year vesting periods. Generally, we grant equity awards to executives in connection with their commencement of employment with us. Our Compensation Committee determines the value of such grants by reviewing compensation practices of peer companies, reviewing our past practice, and through individual negotiations with the executive. In addition, our Compensation Committee has the discretion to grant additional equity awards to executives, including our named executive officers, based on the individual’s contributions to our company. Our Compensation Committee has the discretion to grant such awards throughout the year.
Role of the Compensation Committee
Our Compensation Committee discharges the responsibility of the board of directors relating to the compensation of our executive officers, including our named executive officers. The Compensation Committee’s charter contains detailed information on the Compensation Committee’s duties and function and is available under the “Investor Relations” section on our web site at www.kraton.com.
Our Compensation Committee no less frequently than annually reviews our goals and objectives related to the compensation of our named executive officers. During that review, the Compensation Committee considers the balance between short-term compensation and long-term incentive compensation, evaluates the performance of our named executive officers in light of pre-established goals and objectives and sets the compensation levels of our named executive officers based on that evaluation. In determining appropriate compensation levels, our
98
Table of Contents
Compensation Committee considers our performance and relative stockholder return, the compensation levels of persons holding comparable positions at our peer companies (described below) and the compensation given to our named executive officers in previous years. Our Compensation Committee has the ultimate authority and responsibility to engage and terminate any outside consultant to assist in determining appropriate compensation levels for our named executive officers. Our Compensation Committee uses information provided by such advisors and consultants to determine the appropriate compensation of our named executive officers. Our Chief Executive Officer is typically consulted regarding the compensation of the named executive officers other than himself. Our Vice President of Human Resources and Corporate Communications regularly attends the meetings of the Compensation Committee and provides input on compensation matters as requested by the Compensation Committee. Our Compensation Committee then reviews and recommends any changes for subsequent approval by our board of directors.
Compensation Consultants. No compensation consultants were retained with respect to the establishment of 2009 compensation. In November 2009, our Compensation Committee directly engaged Hewitt Associates LLC as an independent compensation consultant. Hewitt Associates was instructed to perform an overall assessment of our compensation practices as well as to provide recommendations regarding best practices around governance issues. Hewitt Associates selected a “peer group” of companies in the chemical industries of similar size and complexity to the company for the purposes of providing a reference point as one of many factors to consider, when reviewing and advising on the compensatory scheme of the company. The peer group included Arch Chemicals Inc., Fuller (H.B.) Co., Koppers Holdings Inc., Kronos Worldwide Inc., Minerals Technologies Inc., OM Group Inc., OMNOVA Solutions Inc., Schulman (A) Inc., Spartech Corp. and Stepan Co. We do not benchmark any element of executive compensation to members of the peer group or otherwise. Based in part on the information, feedback and advice our Compensation Committee received from Hewitt Associates as well as the Compensation Committee’s overall review of the current compensation arrangements of our named executive officers, the Compensation Committee determined that certain increases in base salaries and severance benefits were appropriate as well as additional grants of restricted stock and options in connection with the closing of our initial public offering in December 2009, each as described in more detail below. Hewitt Associates did not provide any further services to the company during 2009.
Components of Direct Compensation
Base Salary. Employment contracts for our named executive officers are established as a result of negotiation between the individual and the company at the time of hire, within a reasonable range of compensation determined by competitive data, including that described above, and by experience. Our Compensation Committee reviews the base salaries of our named executive officers on an annual basis and determines if an increase is warranted based on its review of individual performance, compensation comparisons (with executives in comparable positions and comparisons among our other executives), consultation with our Chief Executive Officer and consideration of each named executive officer’s experience and skills. Although we take into consideration the base salaries of similarly situated executives at other companies to obtain a general understanding of current compensation practices when setting base salaries for our named executive officers, we do not establish base salaries with reference to a specific percentile of base salaries earned by others inside or outside our company or otherwise benchmark salaries to those earned by others inside or outside our company. Internal compensation information and external compensation information are relevant factors in setting the compensation levels for our executives; however, our Compensation Committee does not specifically establish a target benchmarking percentage for any executive when making such comparisons or setting compensation.
On February 13, 2009, the Compensation Committee approved a mandatory 10% reduction in base salary for certain senior managers of our company, including our named executive officers, effective April 1, 2009 through December 31, 2009. In connection with the salary reduction explained above, each of our named executive officers entered into a Waiver and Agreement pursuant to which each executive consented to such reduction and waived, on a one-time basis, his right to claim “good reason” existed for purposes of his employment agreement, incentive compensation, equity awards or pursuant to any other agreement the individual
99
Table of Contents
had with our company, as a result of such reduction. The Waiver and Agreement also provided that in the event our EBITDA for fiscal year 2009 equaled or exceeded certain pre-established targets, each affected executive would have been entitled to receive a cash payment equal to up to two times the difference between the amount of base salary he actually received during 2009 and the amount of base salary he would have received during 2009 absent the reduction described above. Ultimately, based on our 2009 EBITDA, no such payments were made.
Effective as of the closing of our initial public offering, our Compensation Committee approved increases in the base salaries of Messrs. Fogarty, Bradley, Tremblay and Freund to $575,000, $425,000, $375,000 and $300,000, respectively. These increases were determined to be appropriate in light of the increase in their responsibilities and duties in connection with assuming an executive role at a public company and were based in part on recommendations by Hewitt Associates in establishing competitive pay for our executives. As of January 1, 2010, in accordance with the Waiver and Agreement, Mr. Frazier’s annual base salary was adjusted to make it equal to his base salary prior to the reduction described above. His base compensation is subject to future increases for cost of living or otherwise in the sole discretion of the Compensation Committee.
Annual Bonus: Incentive Compensation Plan. Pursuant to their employment agreements, our named executive officers are eligible to receive target annual bonuses equal to 100% of base salary for Mr. Fogarty, 75% of base salary for Mr. Bradley and 50% of base salary for Messrs. Tremblay, Frazier and Freund, with maximum bonuses of 200% of base salary for Mr. Fogarty, 150% of base salary for Mr. Bradley, and 100% of base salary for Messrs. Tremblay, Frazier and Freund. Mr. Bradley’s employment agreement was amended effective as of the closing of our initial public offering to increase his target bonus from 60% to 75% of base salary. This new target will be applied to his bonus for the fiscal year ending December 31, 2010 and thereafter. The Compensation Committee made this adjustment to recognize his increased responsibilities as the Chief Operating Officer of a public company. Under the targets our Compensation Committee has adopted for 2010, no named executive officer may earn more than two times his contractual target bonus for his service during the 2010 bonus year. For more information on awards for fiscal year 2010 please see the section entitled “Plans Adopted in Connection with our Initial Public Offering—Polymer Holdings LLC Cash Incentive Plan,” below.
For 2009, annual bonuses were determined pursuant to the 2009 Incentive Compensation Plan, subject to the terms of the plan and the discretion of the Compensation Committee to make such adjustments as it deemed appropriate, including in certain instances, its discretion to exceed the maximum amount otherwise payable under the plan. For 2010 and going forward, annual bonuses for our executive officers, including our named executive officers, will be paid under the Polymer Holdings LLC Cash Incentive Plan.
A participant’s actual bonus under our bonus plan for 2009 was based on a formula as set forth in the plan and was calculated as a multiple of:
| • | the participant’s base salary, |
| • | his target bonus expressed as a percentage of base salary, |
| • | a company factor based on our performance during the bonus year, and |
| • | the participant’s individual performance factor, |
which were then weighed against the performance of all other participants and the contractual limits (as described above) to determine the percentage of the common bonus pool he would receive.
Our Compensation Committee determined the company’s performance factor through use of a sliding scale based on the Adjusted EBITDA we generated. For example, if we successfully achieved Adjusted EBITDA that was exactly equal to the Adjusted EBITDA target of $120.0 million as set in our annual business plan, then the performance factor would be 1.0. The annual business plan also established a “stretch” Adjusted EBITDA target of $138.8 million, which if achieved or exceeded, would result in a performance factor of 2.0. The company performance factor could never exceed 2.0. Sixty-five percent of the Adjusted EBITDA target, or $101.3 million,
100
Table of Contents
was the minimum threshold below which the company performance factor, and thus the common bonus pool, would be zero. If actual Adjusted EBITDA fell between 65% of the Adjusted EBITDA target and the stretch Adjusted EBITDA target, then the company performance factor would be adjusted based on a sliding scale.
Based on additional performance criteria, an additional amount of up to $1.0 million could be added or subtracted from the common bonus pool amount. Any additional amount was to be allocated among all or a select portion of the participants in the Compensation Committee’s sole discretion. Those eligible for payout from the 2009 common bonus pool included all employees, with the exception of the non-exempt hourly plant workers at the Belpre facility, on the payroll as of December 31, 2009, including our named executive officers. The 2009 Incentive Compensation Plan was intended to encourage strong performance on factors that were considered key to our growth and success. Final bonus amounts were to be adjusted downwards as necessary so as not to exceed the common bonus pool amount or maximum payouts as established by employment contracts (as described above). The Compensation Committee was then to determine the individual performance factor, typically ranging from zero to 2.0 based on the individual’s contributions to our company and adherence to our company values.
The annual bonus, if any, under the 2009 Incentive Compensation Plan for our named executive officers would have been calculated in accordance with the following formula:
| Annual Base Salary |
x | Target Bonus Percentage |
x | Company Performance Factor |
x | Personal Performance Factor |
= | Total Incentive Bonus |
On February 13, 2009, the Compensation Committee approved and adopted the 2009 Incentive Compensation Plan, including the performance-based criteria by which potential bonus payouts to participants were to be determined. For the bonus year that ended December 31, 2009, a common bonus pool based upon EBITDA performance calculations, in accordance with provisions of the 2009 Incentive Compensation Plan, was to be established within the potential range from $0 to $15 million, depending on our performance and the individual performance factors. Based on additional performance criteria relating to safety and compliance, innovation, top line growth, margin preservation and productivity, the Compensation Committee could have added up to $1.0 million to the 2009 bonus pool.
However, for the bonus year ended December 31, 2009, our Compensation Committee determined that the threshold level of Adjusted EBITDA of $101.3 million was not met, and determined there would be no payout under the 2009 Incentive Compensation Plan.
For more information on awards for fiscal year 2010, please see the section entitled “Plans Adopted in Connection with our Initial Public Offering—Polymer Holdings LLC Cash Incentive Plan,” below.
Discretionary Bonuses. In January 2010, our Compensation Committee awarded Mr. Tremblay and Mr. Frazier discretionary bonuses in the amount of $100,000 each in recognition of their extraordinary efforts on special projects in 2009. It is not anticipated that discretionary bonus awards will be a regular component of our compensation program for our named executive officers.
Equity. In order to align the interests of our named executive officers with those of the company and its stockholders, the Compensation Committee has determined that a material portion of each named executive officer’s compensation should be in the form of equity or equity-based awards. To encourage retention of key executives, these awards vest over time. At the time of the closing of the 2003 Acquisition of the company by TPG and JPMP, individuals received some or all of the following: stock options (which are taxable upon exercise), restricted units (which are taxable upon vesting) and notional units (which permitted the deferral of taxable income until settlement). Since the acquisition by TPG and JPMP, the Compensation Committee has determined that a simplified equity scheme is easier to administer, more advantageous for internal comparison purposes and generally more beneficial to the company. Therefore, the Compensation Committee’s current
101
Table of Contents
approach to equity compensation is to grant options or restricted shares, or a combination thereof, to the company’s executives. While options specifically reward only an increase in the value of the company following their grant, restricted shares also serve as a useful retention tool because the executive benefits from their value immediately upon vesting. On the other hand, options permit the deferral of income recognition to a time of the executive’s choosing (within the term of the option), while restricted shares are taxable upon vesting.
Plans in Existence Prior to our Initial Public Offering. Following is a discussion of our equity plans that were in effect prior to the completion of our initial public offering in December 2009. In the discussion of each plan set forth below, we have included disclosure explaining the treatment of any equity interests granted or purchased under such plan prior to the completion of our initial public offering.
Membership Units of Kraton Management LLC. Kraton Management LLC, or Kraton Management, was an entity set up to hold management’s interests in TJ Chemical, which was the entity through which TPG and JPMP owned 100% of our company before our initial public offering. The named executive officers were each given the opportunity to purchase membership units of Kraton Management, which entity owned a corresponding number of membership units in TJ Chemical. These membership units were converted into shares of our common stock in connection with our initial public offering at a conversion ratio of one common share to 13.5120 membership units.
Options. On September 9, 2004, TJ Chemical adopted the TJ Chemical Holdings LLC 2004 Option Plan, which allowed for the grant to key employees, consultants, members and service providers of TJ Chemical, and its affiliates, of non-qualified options to purchase membership units in TJ Chemical. The purpose of the plan was to retain talent and improve the growth and profitability of TJ Chemical and its affiliates.
Effective upon the closing of our initial public offering, Kraton Performance Polymers assumed liability for all benefits under the TJ Chemical plan, and the plan was amended to provide that: (i) no new grants may be awarded under the plan; (ii) the Compensation Committee of our board of directors shall administer the plan; and (iii) any options to purchase TJ Chemical membership units outstanding under the plan were cancelled and converted into options to purchase our common shares. Options were converted, in a manner intended to comply with Section 409A of the Internal Revenue Code, into options to purchase a number of Kraton Performance Polymers’ common shares equal to the number of membership units underlying the option prior to the closing date of the offering divided by 13.5120, rounded down to the nearest whole share, with the options having an exercise price of $13.512.
Our Compensation Committee administers the TJ Chemical Holdings LLC 2004 Option Plan (and prior to the closing of our initial public offering, the Compensation Committee of Kraton administered the plan) on behalf of TJ Chemical. The committee has the right to terminate all, but not less than all, of the outstanding options at any time and pay the participants an amount equal to the excess, if any, of the fair market value of a common share as of such date over the exercise price with respect to each option. Generally, in the event of a merger where Kraton Performance Polymers is the surviving corporation, any outstanding options under the plan will pertain to and apply to the securities that the option holder would have received in the merger. Generally, in the event of a dissolution, liquidation, sale of assets or merger where Kraton Performance Polymers is not the surviving corporation, the committee has the discretion to: (i) provide for an “exchange” of the options for new options on all or some of the property for which the shares are exchanged (as may be adjusted by the committee); (ii) cancel and cash out the options (whether or not then vested) at the value of the spread; or (iii) provide for a combination of both. Generally, the Compensation Committee may make appropriate adjustments with respect to the number of shares covered by outstanding options and the exercise price in the event of any increase or decrease in the number of shares or any other corporate transaction not described in the preceding sentence.
In general, on a termination of a named executive officer’s employment, unvested options automatically expire and vested options expire on the earlier of (i) the commencement of business on the date the employment is terminated for cause; (ii) 90 days after the date employment is terminated for any reason other than cause, death or disability; or (iii) one-year after the date employment is terminated by
102
Table of Contents
reason of death or disability. In the event the named executive officer’s employment is terminated by us without cause or by the executive officer for good reason within the two years immediately following a change in control (as defined in the plan), all outstanding options become vested as of such termination and shall expire 90 calendar days after the date the named executive officer’s employment was terminated.
No options were granted under the TJ Chemical plan during 2009. Please see the table below titled “2009 Outstanding Equity Awards at Fiscal Year End” for more information on our named executive officers’ current outstanding options.
Profits Units of Kraton Management LLC. In the period pre-dating our initial public offering, the Compensation Committee granted profits units of Kraton Management to our named executive officers. These profits units were economically equivalent to options, except that they might provide the recipient with an opportunity to recognize capital gains in the appreciation of TJ Chemical and its affiliates and TJ Chemical and its affiliates were not entitled to take any deduction at the time of grant or disposition of the profits unit by the employee. Generally, 50% of the profits units granted were to vest when the fair value of TJ Chemical’s assets equaled or exceeded two times the “Threshold Amount,” which was generally defined as the value of TJ Chemical’s assets on the date of grant, and 50% of the profits units granted were to vest when the fair value of TJ Chemical’s assets equaled or exceeded three times the Threshold Amount, provided the participant was employed by Kraton or its subsidiaries on such vesting date. No profits units were granted during 2009.
Upon the closing of our initial public offering, each award of profits units was converted into a number of shares of restricted stock of Kraton Performance Polymers equal to the quotient of (i) the product of the number of profits units multiplied by the amount by which the value of the profits unit exceeded $1.00, divided by (ii) the value of a common share of our company immediately following the closing date of the offering. The restricted stock to be granted was to vest upon the achievement of certain performance measures by our company.
Messrs. Fogarty and Bradley held profits units prior to the closing of our initial public offering. However, the value of the profits units did not exceed $1.00 as of the closing of our initial public offering, and, therefore, the conversion calculation set forth above did not result in the issuance of any shares of restricted stock in exchange for profits units outstanding immediately prior to our initial public offering. No restricted stock was issued upon the conversion and cancellation of the profits units.
Notional Units and Restricted Units of Kraton Management LLC. In the period pre-dating our initial public offering, the Compensation Committee granted time-vested restricted membership units and time-vested notional membership units in Kraton Management to named executive officers. Holders of notional units did not have any beneficial ownership in the underlying membership units, and the grant represented an unsecured promise to deliver membership units or, in certain cases, cash on a future date. Actual membership units or cash were not to be distributed in settlement of notional units until the earlier of (i) a change in control or (ii) the termination of the grantee’s employment, to the extent vested as of such date. Effective as of the closing of our initial public offering, the outstanding notional units and restricted units of Kraton Management held by our named executive officers were cancelled and converted into notional shares or restricted shares of Kraton Performance Polymers, respectively, at a conversion ratio of one share of our stock per 13.5120 units.
Each notional unit was the equivalent of one notional membership unit of TJ Chemical. Other than pursuant to our Deferred Compensation Plan (see “Components of Post-Employment Compensation—Executive Deferred Compensation Plan” for information on notional units granted in connection therewith), Mr. Fogarty was the only named executive officer who held notional units as of the date of our initial public offering. Mr. Fogarty did not have any beneficial ownership in the membership units underlying the notional units, which represented an unsecured promise to deliver membership units of TJ Chemical (either directly or through membership units of Kraton Management) on a future date.
The restricted units were a grant of membership units in Kraton Management, subject to time-vesting conditions. Mr. Bradley and Mr. Fogarty have received grants of restricted units that vest over a three-year
103
Table of Contents
period, provided they remained employed through each such vesting date. For more information on restricted units, please see the “2009 Grants of Plan-Based Awards” and “2009 Outstanding Equity Awards at Fiscal Year End” tables below. None of the other named executive officers held restricted units.
Plans Adopted in Connection with our Initial Public Offering. Shortly before our initial public offering, we adopted the Polymer Holdings LLC 2009 Equity Incentive Plan and Polymer Holdings LLC Cash Incentive Plan. A discussion of the provisions of those plans follows.
Polymer Holdings LLC 2009 Equity Incentive Plan. Our board of directors and our stockholders approved the Polymer Holdings LLC 2009 Equity Incentive Plan, or 2009 Equity Plan, on November 30, 2009. Following our initial public offering, we granted 74,008 shares of restricted stock to our named executive officers as follows: Mr. Fogarty, 37,004; Mr. Bradley, 22,202; and Mr. Tremblay, 14,802. These restricted shares are subject to a three-year cliff vesting. In January 2010, we granted options to purchase 471,789 shares of our common stock, of which 344,136 were granted to our named executive officers as follows: Mr. Fogarty, 177,619; Mr. Bradley, 88,809; Mr. Tremblay, 37,004; Mr. Frazier, 18,502; and Mr. Freund, 22,202. These options have a ten-year term and vest in equal installments over five years. In addition, in January 2010, we granted 22,202 shares of restricted stock to Mr. Smith. These restricted shares are subject to a three-year cliff vesting. As discussed above, all unvested grants of restricted units and notional units made prior to the initial public offering were canceled and replaced with new grants of restricted stock and notional shares under this plan. These replacement grants have substantially similar terms as the original grants.
The purpose of the 2009 Equity Plan is to promote the interests of the company and its stockholders by providing the employees and independent contractors of the company, and eligible non-employee directors of Kraton Performance Polymers, who are largely responsible for the management, growth, and protection of the business of the company, with incentives and rewards to encourage them to continue in the service of the company. The 2009 Equity Plan is administered by our Compensation Committee. The maximum number of shares of common stock that may be delivered pursuant to awards granted under the 2009 Equity Plan is 4,350,000. At the end of fiscal year 2009, there were 4,275,992 shares of common stock reserved for issuance under the 2009 Equity Plan. Subject to the terms of the 2009 Equity Plan, 1,000,000 of the reserved shares may be issued pursuant to incentive stock options. Subject to adjustment, no participant may receive Awards under the 2009 Equity Plan in any calendar year that relate to more than 300,000 shares of common stock.
The 2009 Equity Plan provides for the issuance of incentive stock options, non-qualified stock options, stock appreciation rights, restricted stock awards and restricted stock unit awards, in addition to other equity or equity-based awards as the board determines necessary from time to time.
Polymer Holdings LLC Cash Incentive Plan. On November 30, 2009, our board of directors approved and adopted the Polymer Holdings LLC Cash Incentive Plan, or Cash Incentive Plan, for eligible employees of Kraton Performance Polymers and our subsidiaries, the effectiveness of which was contingent upon the closing of our initial public offering. The purposes of the Cash Incentive Plan are to promote the interests of our company and its stockholders by providing compensation opportunities that are competitive with other companies, and to provide performance-based cash bonus awards to those individuals who contribute to the long-term performance and growth of our company. Generally, our Compensation Committee will establish target bonuses for employees based on position and level of responsibility and grant awards based on the achievement of pre-established company and/or individual goals. Participants shall receive distributions, if any, in cash following written certification by our Compensation Committee of the extent to which the applicable performance targets have been achieved, and in no event more than two and one half months following the end of the performance period to which such certification relates. This plan was adopted to take advantage of the performance-based compensation exception to Section 162(m) of the Internal Revenue Code. We expect the incentive compensation plan to function in substantially the same way going forward as it has in the past but the plan will now contain additional limitations and requirements for awards to Covered Employees (as defined in Section 162(m) of the Internal Revenue Code), including our named executive officers.
104
Table of Contents
On March 8, 2010, our Compensation Committee approved the Performance Targets under the Cash Incentive Plan for the Kraton Leadership Team, which includes our named executive officers.
For the bonus year that ends December 31, 2010, our Compensation Committee has established the following Target Bonus amounts for our named executive officers:
| Named Executive Officer |
Target Bonus | |
| Kevin Fogarty |
1.0 x Base Salary | |
| David A. Bradley |
.75 x Base Salary | |
| Stephen E. Tremblay |
.50 x Base Salary | |
| Larry R. Frazier |
.50 x Base Salary | |
| Lothar Freund |
.50 x Base Salary |
As described more fully below, if the Business Performance Targets and the Personal Performance Targets are achieved at the maximum, or “stretch,” levels, each named executive officer’s actual bonus can be up to two times his Target Bonus.
The Compensation Committee has established Business Performance Targets for the company and Personal Performance Targets for each named executive officer and has assigned a percentage weighting to the achievement of each. The actual bonus earned shall be the sum of:
| • | the amount earned for achievement of Business Performance Targets times the seventy-five percent (75%) weighting assigned to the achievement of Business Performance Targets, and |
| • | the amount earned for achievement of the Personal Performance Targets times the twenty-five percent (25%) weighting assigned to the achievement of Personal Performance Targets, |
provided that if no bonus compensation is payable for the achievement of Business Performance Targets, then no annual bonus compensation shall be payable to the participants.
The Business Performance Targets are comprised of three performance measures, each of which is assigned an individual weighting by our Compensation Committee: achievement of Adjusted EBITDA (60%); achievement of operating cash flow (20%); and percentage of innovation sales (percentage of income generated from sales of products commercialized within the past five years) (20%). The Compensation Committee has established threshold, target and stretch targets for each of these factors, which if achieved, will provide a bonus multiplier of 0.5, 1.0 or 2.0, respectively.
The Personal Performance Criteria are comprised of three or more performance measures, each of which is assigned an individual weighting, within the executive’s area of management or control. Examples of Personal Performance Criteria include: the achievement of specific goals (such as the successful commercialization of a specific product, execution of a particular capital spending project or the implementation of a new system or process) and the successful management of matters under the executive’s control (such as safety performance, compliance, and process management and control). The Compensation Committee has established threshold, target and stretch targets for each of these factors, which if achieved, will provide a bonus multiplier of 0.5, 1.0 or 2.0, respectively.
An example of the total bonus calculation follows using assumed performance levels for demonstration purposes only for an executive with an assumed Target Bonus of .50 x Base Salary:
Business Performance Targets—75% weighting
| Weighting | Threshold 0.5x |
Target 1.0x |
Stretch 2.0x |
||||||||||||
| Adjusted EBITDA |
60 | % | X | 0.60 | |||||||||||
| Operating Cash Flow |
20 | % | X | 0.40 | |||||||||||
| Innovation % |
20 | % | X | 0.40 | |||||||||||
| 1.40 | x 0.75 = | 1.05 |
105
Table of Contents
Personal Performance Targets—25% weighting
| Assumed Weighting |
Threshold 0.5x |
Target 1.0x |
Stretch 2.0x |
||||||||||||
| Factor 1 |
50 | % | X | 1.00 | |||||||||||
| Factor 2 |
25 | % | X | .25 | |||||||||||
| Factor 3 |
25 | % | X | .50 | |||||||||||
| 1.75 | x 0.25 = | 0.438 |
Total Bonus: (1.05 + 0.438) x 0.50 x Base Salary = 0.744 x Base Salary
Any such bonuses will be paid in cash, and we expect that such payments, if any, will be made in first quarter 2011.
Fringe Benefits/Perquisites. We reimburse Mr. Freund (i) for travel expenses to his home country of Germany for himself and his direct family members once per year and (ii) for expenses related to tax preparation, in both cases consistent with his employment agreement. No other material fringe benefits or perquisites are provided to our named executive officers.
U.S. 401K Plan. Our named executive officers are eligible to participate in the Kraton Savings Plan, a broad-based tax-qualified savings plan providing for employer and employee contributions for employees employed within the United States.
U.S. Defined Benefit Pension Plan. Our named executive officers who were hired prior to October 15, 2005 were afforded an opportunity to participate in our broad-based tax-qualified noncontributory defined benefit pension plan (the “Pension Plan”). Employees hired on or after October 15, 2005 are not eligible to participate in the pension plan. The Pension Plan was amended in 2005 to provide participants with a choice, which was effective as of January 1, 2006, between (i) continuing to accrue benefits under the final average pay formula provided for under the Pension Plan or (ii) “freezing” benefits under the Pension Plan in exchange for an enhanced benefit under the Kraton Savings Plan. For participants who chose to receive the enhanced benefit under the Kraton Savings Plan, the Final Average Earnings, Service and Social Security Benefit components of the pension formula were frozen as of December 31, 2005. However, such participants will still be credited with service accumulated after December 31, 2005 for purposes of vesting of benefits under the Pension Plan.
Non-Qualified Restoration Plans. Our named executive officers who participate in the Kraton Savings Plan and/or the Pension Plan are eligible to participate in a non-qualified defined benefit restoration plan and non-qualified defined contribution restoration plan, respectively, that are intended to restore certain benefits under the pension plan and the savings plan, respectively, that would otherwise be lost due to certain limitations imposed by law on tax-qualified plans.
Executive Deferred Compensation Plan. Prior to our initial public offering, we operated an Executive Deferred Compensation Plan, which provided our named executive officers with the option of deferring up to 50% of their annual bonus, if any, which was converted to notional units. Such notional units were to remain outstanding until either (i) a change in control or (ii) termination of employment. Effective as of the closing date of our initial public offering, the Executive Deferred Compensation Plan was amended to provide that (i) the plan is frozen and no new deferrals shall be made under the plan, (ii) the Compensation Committee of Kraton Performance Polymers shall administer the plan and (iii) the notional units currently outstanding under the plan shall be exchanged for notional shares of Kraton Performance Polymers common stock.
Retiree Medical Benefits. Health and welfare benefits are provided to eligible employees in the United States, including our named executive officers, who retire from Kraton Performance Polymers. Retirees under the age of 65 are eligible for the same medical, dental, and vision plans as active employees, but with a cap that varies based on years of service and ranges from $7,000 to $10,000 per employee for premiums on an annual basis.
106
Table of Contents
Components of Post-Employment Compensation
Employment Agreements and Severance Benefits. The employment agreements for each of our named executive officers provide for severance payments upon certain terminations of employment. In the event employment is terminated by us without “cause” or by the named executive officer for “good reason” (as each such term is defined in the employment agreements), the executive would be entitled to up to 18 months of salary and medical benefit continuation for Mr. Fogarty and up to 12 months of base salary and medical benefit continuation for all other named executive officers. In the event such termination occurs within the one year immediately following a change in control (as defined in the employment agreements) of Kraton Performance Polymers, the executive would be entitled to 24 months of salary and medical benefit continuation for Mr. Fogarty and to 18 months of base salary and medical benefit continuation for all other named executive officers, and, in addition to such salary and benefit continuation, our named executive officers would be entitled to receive an additional amount equal to the sum of (i) in the case of Mr. Fogarty, 1.5 times, or in the case each of Messrs. Bradley, Tremblay, Frazier and Freund, 1.0 times, his Target Bonus, and (ii) a pro rata portion of the annual bonus he would have earned in the year of termination had his employment not terminated, based upon his date of termination. For more information on these employment agreements, see the section entitled “Employment Agreements” below.
Other Compensation Policies
Financial Restatement. The 2009 Equity Plan and the Cash Incentive Plan each provide that performance-based compensation granted under such plan is subject to a right of recapture. In the event the determination that a performance goal was achieved was based on incorrect data and, in fact, such goal was not achieved, any compensation under the respective plan that was paid on the basis of the achievement of such goal must be returned.
Stock Ownership Requirements. The Compensation Committee does not maintain a policy relating to stock ownership guidelines or requirements for our named executive officers. The Compensation Committee is reviewing whether such a policy is appropriate.
Trading in Our Stock Derivatives. Our Stock Trading Policy prohibits our employees, including our named executive officers, from speculative trading in our common stock.
107
Table of Contents
Summary of Cash and Certain Other Compensation
The following table provides information concerning compensation we paid or accrued on behalf of our Principal Executive Officer, Principal Financial Officer and the other three most highly compensated executive officers serving at December 31, 2009, who are sometimes referred to herein as our “named executive officers.”
2009 Summary Compensation Table
| Name and Principal |
Year | Salary ($) | Bonus ($) (1) |
Stock Awards ($) (2)(3) |
Option Awards ($) (2)(4) |
Non-equity Incentive Plan Compensation ($) (5) |
Change in Pension Value and Non-qualified Deferred Compensation Earnings ($) (6) |
All Other Compensation ($) (7) |
Total ($) | |||||||||
| (a) | (b) | (c) | (d) | (e) | (f) | (g) | (h) | (i) | (j) | |||||||||
| Kevin M. Fogarty |
2009 | 470,645 | — | 500,000 | — | — | — | 80,538 | 1,051,183 | |||||||||
| President and Chief Executive Officer |
2008 | 494,394 | 400,000 | 600,000 | 1,023,259 | 1,500,000 | 1,643 | 29,664 | 4,048,960 | |||||||||
| 2007 | 330,000 | — | — | — | 150,000 | 1,445 | 20,869 | 502,314 | ||||||||||
| David A. Bradley |
2009 | 328,723 | — | 300,000 | — | — | — | 58,296 | 687,019 | |||||||||
| Chief Operating Officer |
2008 | 347,622 | 400,000 | 300,000 | 347,908 | 630,000 | 3,877 | 20,857 | 2,050,264 | |||||||||
| 2007 | 275,000 | — | — | — | 150,000 | 1,658 | 21,000 | 447,658 | ||||||||||
| Stephen E. Tremblay |
2009 | 326,250 | 100,000 | 200,000 | — | — | — | 37,406 | 663,656 | |||||||||
| Vice President and Chief Financial Officer |
2008 | 332,948 | — | — | 744,000 | 450,000 | — | 99,406 | 1,626,354 | |||||||||
| Larry F. Frazier |
2009 | 231,250 | 100,000 | — | — | — | — | 8,194 | 339,444 | |||||||||
| Chief Information Officer |
2008 | 36,058 | — | — | 165,000 | — | — | 51,082 | 252,140 | |||||||||
| Lothar Freund |
2009 | 234,375 | — | — | — | — | — | 34,285 | 268,660 | |||||||||
| Vice President, Technology |
2008 | 250,000 | 200,000 | — | 217,000 | 250,000 | — | 15,000 | 932,000 | |||||||||
| (1) | Amounts in this column for 2009 consist of a discretionary bonus for Messrs. Tremblay and Frazier in the amount of $100,000 each. |
| (2) | Amounts set forth in the Stock Awards and Option Awards columns represent the aggregate grant date fair value computed by Kraton Performance Polymers with respect to restricted stock awards and notional stock awards, profits unit awards and option awards, in accordance with the Financial Accounting Standards Board ASC Topic 718 (disregarding the estimate of forfeitures related to service-based vesting conditions). For a discussion of the assumptions used in calculating the fair value of our stock-based compensation, refer to Note 2, Share-Based Compensation, to our consolidated financial statements, which are included elsewhere in this prospectus. |
| (3) | This column consists of awards of Restricted Shares and Notional Shares granted pursuant to the TJ Chemical 2004 Option Plan and the Polymer Holdings LLC 2009 Equity Incentive Plan. |
| (4) | This column consists of awards of Options to purchase shares of our common stock granted pursuant to the TJ Chemical 2004 Option Plan. |
| (5) | Amounts listed in this column for 2009 consist of bonuses paid pursuant to the 2009 Incentive Compensation Plan. Please see the discussion of the specific components of the Incentive Compensation Plan under “—Annual Bonus: Incentive Compensation Plan” above. |
| (6) | In accordance with Instruction number 1 to Item 402(a)(3) of Regulation S-K, amounts shown in this column for 2009 are not included in the total for purposes of determining the identity of our named executive officers. All amounts in this column reflect the aggregate change in the present value of the Pension Plan in accordance with Item 402(c)(2)(viii)(A) of Regulation S-K. For 2009, the aggregate present value of the Pension Plan of each of Messrs. Fogarty and Bradley decreased by $598 and $1,615, respectively. Participants in the Deferred Compensation Plan do not receive preferential earnings on amounts deferred thereunder. |
| (7) | Amounts in this column consists of (a) contributions to the Savings Plan by Kraton Performance Polymers on behalf of Messrs. Fogarty, Bradley, Tremblay, Frazier and Freund in the amounts of $80,538, $58,296, $37,406, $8,194 and $23,006, respectively; (b) for Mr. Freund, reimbursement in the amount of $11,004 for travel expenses to his home country of Germany for himself and his direct family members once per year, and (c) for Mr. Freund, $275 for expenses related to tax preparation, in both cases consistent with his employment agreement. |
108
Table of Contents
Equity Compensation Plan Information
The following table sets forth information as of December 31, 2009 with respect to compensation plans under which our equity securities are authorized for issuance.
| Plan Category |
Number of Securities to be issued upon exercise of outstanding options, warrants and rights |
Weighted-average exercise price of outstanding options, warrants and rights ($) |
Number of securities remaining available for future issuance under equity compensation plans (excluding securities reflected in column (a)) | |||
| (a) | (b) | (c) | ||||
| Equity compensation plans approved by stockholders |
1,584,970 | 13.51 | 4,275,992 | |||
| Equity Compensation Plans not approved by stockholders |
— | — | — | |||
| Total: |
1,584,970 | 13.51 | 4,275,992 |
2009 Grants of Plan-Based Awards
The following table provides details regarding plan based awards granted to our named executive officers during the fiscal year ended December 31, 2009.
| Name |
Grant Date | Estimated Future Payouts Under Non- Equity Incentive Plan Awards (1) |
Estimated Future Payouts Under Equity Incentive Plan Awards |
All Other Stock Awards: Number of Shares of Stocks or Units (#)(2) |
All Other Option Awards: Number of Securities Underlying Options (#) |
Exercise or Base Price of Option Awards ($/Sh) | ||||||||||||||
| Threshold ($) |
Target ($) |
Maximum ($) |
Threshold ($) |
Target ($) |
Maximum ($) |
|||||||||||||||
| (a) | (b) | (c) | (d) | (e) | (f) | (g) | (h) | (i) | (j) | (k) | ||||||||||
| Kevin M. Fogarty |
12/22/2009 | 37,004 | 13.51 | |||||||||||||||||
| 2/13/2009 | 200,000 | 500,000 | 1,000,000 | |||||||||||||||||
| David A. Bradley |
12/22/2009 | 22,202 | 13.51 | |||||||||||||||||
| 2/13/2009 | 84,000 | 210,000 | 420,000 | |||||||||||||||||
| Stephen E. Tremblay |
12/22/2009 | 14,802 | 13.51 | |||||||||||||||||
| 2/13/2009 | 70,000 | 175,000 | 350,000 | |||||||||||||||||
| Larry R. Frazier |
2/13/2009 | 50,000 | 125,000 | 250,000 | ||||||||||||||||
| Lothar Freund |
2/13/2009 | 50,000 | 125,000 | 250,000 | ||||||||||||||||
| (1) | These columns provide information on potential payouts under the 2009 Incentive Compensation Plan. For information on amounts actually earned, see the “2009 Summary Compensation Table.” |
| (2) | Messrs. Fogarty, Bradley and Tremblay were granted 37,004, 22,202 and 14,802 Restricted Stock Awards, respectively, on December 22, 2009 in connection with our initial public offering. These awards were granted under the Polymer Holdings LLC 2009 Equity Incentive Plan. |
109
Table of Contents
2009 Outstanding Equity Awards at the Fiscal Year End
The following table sets forth information regarding outstanding equity awards held by our named executive officers as of December 31, 2009.
| Option Awards (1) | Stock Awards | ||||||||||||||||||
| Name |
Number of Securities Underlying Unexercised Options (#) Exercisable |
Number of Securities Underlying Unexercised Options (#) Unexercisable |
Equity Incentive Plan Awards: Number of Securities Underlying Unexercised Unearned Options (#) |
Option Exercise Price ($) |
Option Expiration Date |
Number of Shares of Stock or Units of Stock That Have Not Vested (#) |
Market Value of Shares or Units of Stock That Have Not Vested (#) (2) |
Equity Incentive Plan Awards: Number of Unearned Shares, Units or Other Rights That Have Not Vested (#) |
Equity Incentive Plan Awards: Market or Payout Value of Unearned Shares, Units or Other Rights That Have Not Vested (#) | ||||||||||
| (a) | (b) | (c) | (d) | (e) | (f) | (g) | (h) | (i) | (j) | ||||||||||
| Kevin M. Fogarty |
74,008 | 18,502 | — | 13.51 | 6/15/2015 | — | — | — | — | ||||||||||
| 81,430 | 162,859 | — | 13.51 | 6/19/2018 | — | — | — | — | |||||||||||
| — | — | — | — | — | 4,441 | (3) | 60,220 | — | — | ||||||||||
| — | — | — | — | — | 29,603 | (4) | 401,417 | — | — | ||||||||||
| — | — | — | — | — | 37,004 | (5) | 501,774 | ||||||||||||
| David A. Bradley |
46,255 | 0 | — | 13.51 | 3/8/2014 | — | — | — | — | ||||||||||
| 22,202 | 5,551 | — | 13.51 | 2/1/2015 | — | — | — | — | |||||||||||
| 27,686 | 55,372 | — | 13.51 | 6/19/2018 | — | — | — | — | |||||||||||
| — | — | — | — | — | 1,481 | (4) | 20,082 | ||||||||||||
| — | — | — | — | — | 14,801 | (4) | 200,702 | ||||||||||||
| — | — | — | — | — | 22,202 | (5) | 301,059 | ||||||||||||
| Stephen E. Tremblay |
59,207 | 118,412 | — | 13.51 | 6/19/2018 | — | — | — | — | ||||||||||
| — | — | — | — | — | 14,802 | (5) | 200,715 | — | — | ||||||||||
| Larry R. Frazier |
12,335 | 24,669 | — | 13.51 | 12/18/2008 | ||||||||||||||
| Lothar Freund |
29,603 | 7,401 | — | 13.51 | 9/6/2015 | — | — | — | — | ||||||||||
| 17,269 | 34,536 | — | 13.51 | 6/19/2018 | — | — | — | — | |||||||||||
| (1) | All options were granted pursuant to the TJ Chemical Holdings LLC 2004 Option Plan and relate to the right to purchase membership units in TJ Chemical Holdings. All Options granted prior to 2008 vest in equal installments over five years from the date of grant. Those granted in 2008 vest in equal installments over three years from the date of the grant. The vesting of the option grants set forth above is as follows: |
| • | Mr. Fogarty received a grant of 92,510 options on June 15, 2005. 18,502 of these options vested on each of June 15, 2006, 2007, 2008, 2009 and 2010. Mr. Fogarty also received a grant of 244,289 options on June 19, 2008. 81,430 of these options vested on June 19, 2009, 81,429 of these options vested on June 19, 2010 and 81,430 of these options will vest on June 19, 2011, subject in each case to Mr. Fogarty’s being employed by us on the vesting date. |
| • | Mr. Bradley received a grant of 46,255 options on March 8, 2004. 9,251 of these options vested on each of March 8, 2005, 2006, 2007, 2008 and 2009. Mr. Bradley also received a grant of 27,753 options on February 1, 2005. 5,550 of these options vested on each of February 1, 2006 and 2007, and 5,551 of these options vested on each of February 1, 2008, 2009 and 2010. Mr. Bradley also received a grant of 83,058 options on June 19, 2008, of which 27,686 options vested on each of June 19, 2009 and 2010, and the remaining options shall vest on June 19, 2011, subject to Mr. Bradley’s being employed by us on the vesting date. |
| • | Mr. Tremblay received a grant of 177,619 options on June 19, 2008. 59,207 of these options vested on June 19, 2009 and 59,206 of these options vested on June 19, 2010. The remaining 59,206 options shall vest on June 19, 2011, subject to Mr. Tremblay’s being employed by us on the vesting date. |
| • | Mr. Frazier received a grant of 37,004 options on December 16, 2008. 12,335 options vested on December 18, 2009. The remaining options will vest in tranches of 12,334 on December 18, 2010 and 12,335 on December 18, 2011, subject in each case to Mr. Frazier’s being employed by us on the vesting date. |
| • | Mr. Freund received a grant of 37,004 options on September 6, 2005, of which 7,400 vested on September 6, 2006 and 7,401 options vested on each of September 6, 2007, 2008 and 2009. The remaining 7,401 options shall vest on September 6, 2010, subject to Mr. Freund’s being employed by us on the vesting date. Mr. Freund also received a grant of 51,805 options on June 19, 2008, 17,269 of which vested on June 19, 2009 and 17,268 of which vested on June 19, 2010. The remaining 17,268 options will vest on June 19, 2011, subject to Mr. Freund’s being employed by us on the vesting date. |
| (2) | The market value of shares that have not yet vested are calculated based on our closing price on December 31, 2009, the last trading day of the year, which was $13.56. |
110
Table of Contents
| (3) | This relates to an award of 22,202 notional units that was granted on June 15, 2005. 4,440 units vested on each of June 15, 2006, 2007 and 2008, and 4,441 units vested on June 15, 2009 and 2010. See “—Compensation Discussion and Analysis—Components of Direct Compensation—Equity—Plans in Existence Prior to Our Initial Public Offering—Notional Units and Restricted Units of Kraton Management LLC” above for more information. |
| (4) | These are awards of restricted units, which were converted to shares of restricted stock in connection with our initial public offering. (See “Equity—Plans in Existence Prior to our Initial Public Offering—Notional Units and Restricted Units of Kraton Management LLC” above for more information.) The vesting of the Restricted stock grants set forth above is as follows: |
| • | Mr. Fogarty received a grant of 44,405 restricted shares on June 19, 2008. 14,802 of these restricted shares vested June 19, 2009 and 14,801 restricted shares vested June 19, 2010. The remaining 14,802 restricted shares will vest on June 19, 2011, subject to Mr. Fogarty’s being employed by us on the vesting date. |
| • | Mr. Bradley received a grant of 14,802 restricted shares on September 10, 2004. 2,960 of the restricted shares vested on each of April 1, 2005, 2006 and 2007, and 2,961 vested on each of April 1, 2008 and 2009. Mr. Bradley also received a grant of 7,401 restricted shares on March 17, 2005. 1,480 of the restricted shares vested on each of February 1, 2006, 2007, 2008, 2009 and 2010. Mr. Bradley also received a grant of 22,202 restricted shares on June 19, 2008, 7,401 of which vested on June 19, 2009 and 7,400 of which vested on June 19, 2010. The remaining 7,401 restricted shares vest on June 19, 2011, subject to Mr. Bradley’s being employed with Kraton on the vesting date. |
| (5) | These are awards of restricted stock. Messrs. Fogarty, Bradley and Tremblay received a grant of 37,004, 22,202 and 14,802 respectively on December 22, 2009. All shares will vest on December 22, 2012. |
2009 Option Exercises and Stock Vested Table
The following table sets forth information regarding equity awards held by our named executive officers exercised or vested during fiscal year 2009.
| Option Awards | Stock Awards | |||||||
| Name |
Number of Shares Acquired on Exercise (#) |
Value Realized on Exercise ($) |
Number of Shares Acquired on Vesting (#) |
Value Realized on Vesting (#) (1) | ||||
| Kevin M. Fogarty |
— | — | 19,242 | 226,198 | ||||
| David A. Bradley |
— | — | 11,842 | 139,208 | ||||
| Stephen E. Tremblay |
— | — | — | — | ||||
| Larry R. Frazier |
— | — | — | — | ||||
| Lothar Freund |
— | — | — | — | ||||
| (1) | The value realized is calculated by multiplying the number of shares of stock by an estimated valuation of the underlying shares on the vesting date. |
Prior to our initial public offering in December 2009, there was no established public market for our shares. We engaged an independent valuation and financial consultant, Corporate Valuation Advisors, Inc., to perform a valuation of the total equity of TJ Chemical (formerly, the ultimate holding company of Kraton Performance Polymers and Kraton) in January 2007 and again in January 2008. In valuing the equity of TJ Chemical, the consultant relied upon our historical financial statements. In valuing the total equity of TJ Chemical, the consultant utilized the market approach. The market approach is a valuation technique in which estimated market value is based on market prices in actual transactions. The market approach compared our company with similar companies that were publicly traded. The technique consisted of collecting selling prices for comparable assets. After studying the selling prices, value adjustments were made for comparability differences. This process was essentially one of comparison and correlation. In applying the market approach, market and financial data on publicly-traded guideline companies was analyzed and relevant valuation multiples were formulated. The consultant considered the outlook of the economy and the current market for publicly-traded guideline companies engaged in the same industry or an industry similar to the one in which we compete. The fair value of a membership unit of TJ Chemical was estimated at $0.87 as of December 31, 2008. After adjustment at the conversion ratio of 13.5120 membership units per common share used in our initial public offering, this renders a valuation of $11.76 per common share, which is the valuation used in this table.
111
Table of Contents
2009 Pension Benefits
The following table sets forth information regarding participation of our named executive officers in our pension plans.
| Name |
Plan Name |
Number of Years Credited Services (#) |
Present Value of Accumulated Benefit ($) |
Payments During Last Fiscal Year ($) | ||||
| (a) | (b) | (c) | (d) | (e) | ||||
| Kevin M. Fogarty |
Pension Plan | 0.60 | 4,854 | — | ||||
| Pension Benefit Restoration Plan | 0.60 | — | 2,937 | |||||
| David A. Bradley |
Pension Plan | 1.76 | 10,039 | — | ||||
| Pension Benefit Restoration Plan | 1.76 | — | 389 | |||||
| Stephen E. Tremblay |
Pension Plan | — | — | — | ||||
| Pension Benefit Restoration Plan | — | — | — | |||||
| Larry R. Frazier |
Pension Plan | — | — | — | ||||
| Pension Benefit Restoration Plan | — | — | — | |||||
| Lothar Freund |
Pension Plan | — | — | — | ||||
| Pension Benefit Restoration Plan | — | — | — |
Pension Plan
We maintain a noncontributory defined benefit pension plan that covers our U.S. eligible employees hired prior to October 15, 2005, our former employees and our retirees. See Note 7, Employee Benefits, to our consolidated financial statements, which are included elsewhere in this prospectus. We make contributions to the plan on behalf of our eligible employees. Employees do not make contributions to the plan. The pension plan is intended to qualify under Section 401 of the Internal Revenue Code.
The normal retirement benefit formula for participants is approximately 1.6% of the participant’s average final compensation multiplied by his years of accredited service, minus a percentage of benefits received under social security. The company does not have a policy of granting extra years of service. The primary elements of compensation that are included in applying the payment and benefit formulae are (i) base salary, including salary deferrals, and (ii) non-deferred payments under incentive compensation plans prior to a participant’s separation from service, provided that no more than three consecutive payments of incentive compensation are taken into account.
Participants become eligible to begin receiving payments when they reach the “normal retirement age” of 65. Under certain circumstances participants are eligible to receive payments at early retirement; however, under no circumstances can a participant be qualified for early retirement before the age of 45. None of our named executive officers is currently eligible for early retirement under the terms of the pension plan and the pension benefit restoration plan described below. Benefits under the pension plan for Messrs. Bradley and Fogarty were frozen as of December 31, 2005; however, they continue to accumulate years of credited service for purposes of vesting under the plan. The other named executive officers do not participate in the Pension Plan.
Pension Benefit Restoration Plan
Certain participants in the Pension Plan, including the participating named executive officers, are eligible to participate in a non-qualified defined benefit plan (the “Pension Benefit Restoration Plan”) which is intended to restore certain benefits under the Pension Plan that would otherwise be lost due to certain limitations imposed by law on tax-qualified plans. The terms set forth above with regard to the Pension Plan also apply to the Pension Benefit Restoration Plan, which is generally designed to mirror the Pension Plan.
112
Table of Contents
2009 Nonqualified Deferred Compensation
The following table sets forth information regarding participation of our named executive officers in our non-qualified deferred compensation plans. Amounts set forth in the table are under our Deferred Compensation and Restoration Plan.
| Name |
Executive Contributions in Last FY ($) |
Company Contributions in Last FY ($) (1) |
Aggregate Earnings in Last FY ($) (2) |
Aggregate Withdrawals/ Distributions ($) |
Aggregate Balance at Last FYE ($) | |||||
| (a) | (b) | (c) | (d) | (e) | (f) | |||||
| Kevin M. Fogarty |
28,187 | 65,838 | 12,924 | — | 178,245 | |||||
| David A. Bradley |
19,788 | 43,596 | 31,943 | — | 142,723 | |||||
| Stephen E. Tremblay |
19,038 | 22,706 | 4,167 | — | 48,987 | |||||
| Larry R. Frazier |
— | — | — | — | — | |||||
| Lothar Freund |
9,750 | 12,056 | 2,637 | — | 32,196 |
| (1) | Amounts set forth in this column were reported in “All Other Compensation” in our “2009 Summary Compensation Table.” |
| (2) | In 2009, our named executive officers invested in the following funds with the following annual rates of return: Fidelity Diversified International (31.78%); Fidelity Freedom Income Fund (16.12%); Fidelity Freedom 2030 (30.57%); Fidelity Freedom 2035 (31.26%); Fidelity Emerging Markets (76.00%); Fidelity International Real Estate (35.82%); DWS Global Opps S (47.41%); Mutual Discovery A (20.89%); Fidelity Leveraged Co. Stock (59.56%); PIMCO High Yield ADM (43.70%); Fidelity Contrafund (29.23%); and MSIF Emerging Markets (69.18%). |
Deferred Compensation and Restoration Plan
Our Deferred Compensation and Restoration Plan is intended to restore certain benefits under our Savings Plan that would otherwise be lost due to restrictions imposed by the Internal Revenue Code. Prior to the commencement of each plan year, participants make elections to defer any portion of their base compensation (including all amounts paid by the company for services rendered, but excluding any amounts paid for overtime, commissions, severance payments, bonus compensation or the value of any stock option granted) under both the Savings Plan and the Deferred Compensation and Restoration Plan. Deferrals are notionally invested in accordance with the participant’s investment elections in the company’s 401(k) plan. Contributions by both Kraton Performance Polymers and the participant are made to the Savings Plan until the maximum amount permitted by law has been contributed to such plan, after which contributions are made to the Deferred Compensation and Restoration Plan. Distributions made pursuant to the Deferred Compensation and Restoration Plan are only made in connection with the participant’s separation from service or death, provided that in certain circumstances, the company may grant a hardship distribution in accordance with the requirements of the Internal Revenue Code.
Executive Deferred Compensation Plan
Under the Executive Deferred Compensation Plan adopted on May 30, 2006, certain employees were permitted to elect to defer a portion (generally up to 50%) of their annual incentive bonus with respect to each bonus period. Participating employees were credited with a notional number of membership units based on the fair value of TJ Chemical membership units as of the date of the deferral, although the distribution of membership units in such accounts could have been made indirectly through Kraton Management. Such membership units were to be distributed upon termination of the participant’s employment, subject to a call right, or upon a change in control, as defined in the plan. Upon the closing of our initial public offering in December 2009, notional membership units in TJ Chemical (or Kraton Management) were converted into notional shares of our common stock.
113
Table of Contents
There were no elections to the Executive Deferred Compensation Plan in 2007, 2008, or 2009. Effective upon the closing of our initial public offering, no new deferrals are allowed under this plan. Messrs. Fogarty and Bradley each hold 5,607 notional shares of our common stock based on prior deferrals under the plan when it was still active.
Termination and Change in Control Payments
The following tables set forth the estimated value of payments and benefits that our named executive officers would be entitled to receive assuming certain terminations of employment and/or assuming a change in control of Kraton Performance Polymers, in each case occurring on December 31, 2009, in addition to the amounts they would be entitled to receive pursuant to the Pension Plan, the Pension Benefit Restoration Plan, the Deferred Compensation and Restoration Plan, and the Executive Deferred Compensation Plan, each as described above. Complete descriptions of employment agreements immediately follow these tables.
Effective as of the closing of our initial public offering, our Compensation Committee approved amendments to the Employment Agreements of Messrs. Fogarty, Bradley, Tremblay and Freund to provide for an increase in severance benefits for certain terminations within one year following a change in control as follows: each such executive was previously entitled to 12 months of continued health coverage and base salary following such a termination (except Mr. Fogarty who was entitled to 18 months). However, this potential benefit has been increased to 18 months for Messrs. Bradley, Tremblay and Freund and to 24 months for Mr. Fogarty. The Compensation Committee determined such amendments were appropriate based in part on recommendations by Hewitt Associates, LLC on severance benefits afforded to similarly situated executives at other public companies and on the Compensation Committee’s assessment of the appropriate value required for retentive purposes.
Kevin M. Fogarty
| Triggering Event |
Severance Payment ($) |
Accelerated Vesting of Equity Awards (4) |
Continuation of Medical Benefits | |||
| Termination of Employment: |
||||||
| By us for cause or resignation by executive without good reason |
— | — | — | |||
| By us without cause, or pursuant to our election not to extend the employment term, or by executive for good reason (1) |
862,500 | — | 30,760 | |||
| By us without cause or by executive for good reason within one year of a change in control (2) |
2,875,000 | 972,116 | 30,760 | |||
| Upon Disability (3) |
— | — | 15,380 | |||
| Upon Death (3) |
— | — | 15,380 | |||
| Upon a Change in Control |
— | — | — |
| (1) | Upon termination of Mr. Fogarty’s employment by us without “cause,” due to our election not to extend the employment term, or by Mr. Fogarty for “good reason,” Mr. Fogarty is entitled to (i) continuation of base salary for a period of up to 18 months and (ii) continuation of medical benefits for up to 18 months (such benefits cease upon commencement of benefits from a new employer, if any; however, for the purposes of this table, we have assumed such benefits shall continue for 18 months). |
| (2) | Upon termination of Mr. Fogarty’s employment by us without “cause” or by Mr. Fogarty for “good reason” within one year of a change in control, Mr. Fogarty is entitled to (i) continuation of base salary for a period of 24 months and (ii) a lump sum cash payment equal to two times Mr. Fogarty’s annual bonus calculated at target level, (iii) a pro-rata portion of his target annual bonus through the termination date, and (iv) continuation of medical benefits for up to 24 months (such benefits cease upon commencement of benefits from a new employer, if any; however, for the purposes of this table, we have assumed such benefits shall continue for 24 months). |
114
Table of Contents
| (3) | Upon termination of Mr. Fogarty’s employment due to Disability or death, he, or his estate, is entitled to continuation of medical benefits for up to 12 months (such benefits cease upon commencement of benefits from a new employer, if any; however, for the purposes of this table, we have assumed such benefits shall continue for 12 months). |
| (4) | Equity awards vest in accordance with the terms of the individual grant agreements with respect to each such award. Options and notional shares vest immediately in the event of termination of Mr. Fogarty’s employment by us without “cause” or by Mr. Fogarty for “good reason” within two years following a change in control, while restricted shares vest immediately in the event of termination of Mr. Fogarty’s employment by us without “cause” or by Mr. Fogarty for “good reason” within one year following a change in control. This value represents an amount equal to the number of shares underlying all of Mr. Fogarty’s unvested restricted stock, notional units and stock options as of December 31, 2009 multiplied (i) in the case of restricted stock and notional units, by the closing market price of our common stock on December 31, 2009 ($13.56), which was the last business day of fiscal 2009, and (ii) in the case of stock options, by the spread between the closing market price of our common stock on December 31, 2009 ($13.5600) and the applicable exercise price of each stock option ($13.5120). |
David A. Bradley
| Triggering Event |
Severance Payment ($) |
Accelerated Vesting of Equity Awards ($) (4) |
Continuation of Medical Benefits ($) | |||
| Termination of Employment: |
||||||
| By us for cause or resignation by executive without good reason |
— | — | — | |||
| By us without cause, or pursuant to our election not to extend the employment term, or by executive for good reason (1) |
425,000 | — | 15,380 | |||
| By us without cause or by executive for good reason within one year of a change in control (2) |
1,275,000 | 524,767 | 23,070 | |||
| Upon Disability (3) |
255,000 | — | — | |||
| Upon Death (3) |
255,000 | — | — | |||
| Upon a Change in Control |
— | — | — |
| (1) | Upon termination of Mr. Bradley’s employment by us without “cause,” due to our election not to extend the employment term, or by Mr. Bradley for “good reason,” Mr. Bradley is entitled to (i) continuation of base salary for a period of 12 months and (ii) continuation of medical benefits for up to 12 months (such benefits cease upon commencement of benefits from a new employer, if any; however, for the purposes of this table, we have assumed such benefits shall continue for 12 months). |
| (2) | Upon termination of Mr. Bradley’s employment by us without “cause” or by Mr. Bradley for “good reason” within one year of a change in control, Mr. Bradley is entitled to (i) continuation of base salary for a period of 18 months and (ii) a lump sum cash payment equal to 1.5 times Mr. Bradley’s annual bonus calculated at target level, (iii) a pro-rata portion of his target annual bonus through the termination date, and (iv) continuation of medical benefits for up to 18 months (such benefits cease upon commencement of benefits from a new employer, if any; however, for the purposes of this table, we have assumed such benefits shall continue for 18 months). |
| (3) | Upon termination of Mr. Bradley’s employment due to Disability or death, he, or his estate, as the case may be, is entitled to a pro rata portion of the bonus for the year during which the termination occurs. Given that for the purposes of this disclosure, termination is deemed to have occurred on December 31, 2009, Mr. Bradley would have received 100% of his target bonus. |
115
Table of Contents
| (4) | Equity awards vest in accordance with the terms of the individual grant agreements with respect to each such award. Options and notional shares vest immediately in the event of termination of Mr. Bradley’s employment by us without “cause” or by Mr. Bradley for “good reason” within two years following a change in control, while restricted shares vest immediately in the event of termination of Mr. Bradley’s employment by us without “cause” or by Mr. Bradley for “good reason” within one year following a change in control. This value represents an amount equal to the number of shares underlying all of Mr. Bradley’s unvested restricted stock and stock options as of December 31, 2009 multiplied (i) in the case of restricted stock, by the closing market price of our common stock on December 31, 2009 ($13.56), which was the last business day of fiscal 2009, and (ii) in the case of stock options, by the spread between the closing market price of our common stock on December 31, 2009 ($13.5600) and the applicable exercise price of each stock option ($13.5120). |
Stephen E. Tremblay
| Triggering Event |
Severance Payment ($) |
Accelerated Vesting of Equity Awards ($) (4) |
Continuation of Medical Benefits ($) | |||
| Termination of Employment: |
||||||
| By us for cause or resignation by executive without good reason |
— | — | — | |||
| By us without cause, or pursuant to our election not to extend the employment term, or by executive for good reason (1) |
375,000 | — | 15,380 | |||
| By us without cause or by executive for good reason within one year of a change in control (2) |
1,031,250 | 206,399 | 23,070 | |||
| Upon Disability (3) |
187,500 | — | — | |||
| Upon Death (3) |
187,500 | — | — | |||
| Upon a Change in Control |
— | — | — |
| (1) | Upon termination of Mr. Tremblay’s employment by us without “cause,” due to our election not to extend the employment term, or by Mr. Tremblay for “good reason,” Mr. Tremblay is entitled to (i) continuation of base salary for a period of 12 months and (ii) continuation of medical benefits for up to 12 months (such benefits cease upon commencement of benefits from a new employer, if any; however, for the purposes of this table, we have assumed such benefits shall continue for 12 months). |
| (2) | Upon termination of Mr. Tremblay’s employment by us without “cause” or by Mr. Tremblay for “good reason” within one year of a change in control, Mr. Tremblay is entitled to (i) continuation of base salary for a period of 18 months and (ii) a lump sum cash payment equal to 1.5 times Mr. Tremblay’s annual bonus calculated at target level, (iii) a pro-rata portion of his target annual bonus through the termination date, and (iv) continuation of medical benefits for up to 18 months (such benefits cease upon commencement of benefits from a new employer, if any; however, for the purposes of this table, we have assumed such benefits shall continue for 18 months). |
| (3) | Upon termination of Mr. Tremblay’s employment due to Disability or death, he, or his estate, as the case may be, is entitled to a pro rata portion of the bonus for the year during which the termination occurs. Given that for the purposes of this disclosure, termination is deemed to have occurred on December 31, 2009, Mr. Tremblay would have received 100% of his target bonus. |
| (4) | Equity awards vest in accordance with the terms of the individual grant agreements with respect to each such award. Options and notional shares vest immediately in the event of termination of Mr. Tremblay’s employment by us without “cause” or by Mr. Tremblay for “good reason” within two years following a change in control, while restricted shares vest immediately in the event of termination of Mr. Tremblay’s employment by us without “cause” or by Mr. Tremblay for “good reason” within one year following a change in control. This value represents an amount equal to the number of shares underlying all of |
116
Table of Contents
| Mr. Tremblay’s unvested restricted stock and stock options as of December 31, 2009 multiplied (i) in the case of restricted stock, by the closing market price of our common stock on December 31, 2009 ($13.56), which was the last business day of fiscal 2009, and (ii) in the case of stock options, by the spread between the closing market price of our common stock on December 31, 2009 ($13.5600) and the applicable exercise price of each stock option ($13.5120). |
Larry R. Frazier
| Triggering Event |
Severance Payment ($) |
Accelerated Vesting of Equity Awards ($) (4) |
Continuation of Medical Benefits ($) (5) | |||
| Termination of Employment: |
||||||
| By us for cause or resignation by executive without good reason |
— | — | — | |||
| By us without cause, or pursuant to our election not to extend the employment term, or by executive for good reason (1) |
250,000 | — | — | |||
| By us without cause or by executive for good reason within one year of a change in control (2) |
500,000 | 1,184 | — | |||
| Upon Disability (3) |
125,000 | — | — | |||
| Upon Death (3) |
125,000 | — | — | |||
| Upon a Change in Control |
— | — | — |
| (1) | Upon termination of Mr. Frazier’s employment by us without “cause,” due to our election not to extend the employment term, or by Mr. Frazier for “good reason,” Mr. Frazier is entitled to (i) continuation of base salary for a period of 12 months and (ii) continuation of medical benefits for up to 12 months (such benefits cease upon commencement of benefits from a new employer, if any; however, for the purposes of this table, we have assumed such benefits shall continue for 12 months). |
| (2) | Upon termination of Mr. Frazier’s employment by us without “cause” or by Mr. Frazier for “good reason” within one year of a change in control, Mr. Frazier is entitled to (i) continuation of base salary for a period of 12 months and (ii) a lump sum cash payment equal to one times Mr. Frazier’s annual bonus calculated at target level, (iii) a pro-rata portion of his target annual bonus through the termination date, and (iv) continuation of medical benefits for up to 12 months (such benefits cease upon commencement of benefits from a new employer, if any; however, for the purposes of this table, we have assumed such benefits shall continue for 12 months). |
| (3) | Upon termination of Mr. Frazier’s employment due to Disability or death, he, or his estate, as the case may be, is entitled to a pro rata portion of the bonus for the year during which the termination occurs. Given that for the purposes of this disclosure, termination is deemed to have occurred on December 31, 2009, Mr. Frazier would have received 100% of his target bonus. |
| (4) | Equity awards vest in accordance with the terms of the individual grant agreements with respect to each such award. Options and notional shares vest immediately in the event of termination of Mr. Frazier’s employment by us without “cause” or by Mr. Frazier for “good reason” within two years following a change in control, while restricted shares vest immediately in the event of termination of Mr. Frazier’s employment by us without “cause” or by Mr. Frazier for “good reason” within one year following a change in control. This value represents an amount equal to the number of shares underlying all of Mr. Frazier’s unvested restricted stock and stock options as of December 31, 2009 multiplied (i) in the case of restricted stock, by the closing market price of our common stock on December 31, 2009 ($13.56), which was the last business day of fiscal 2009, and (ii) in the case of stock options, by the spread between the closing market price of our common stock on December 31, 2009 ($13.5600) and the applicable exercise price of each stock option ($13.5120). |
| (5) | Mr. Frazier does not currently participate in our medical plan. Therefore, he would not be entitled to any continuation of medical benefits under his employment agreement. |
117
Table of Contents
Lothar Freund
| Triggering Event |
Severance Payment ($) |
Accelerated Vesting of Equity Awards ($) (4) |
Continuation of Medical Benefits | |||
| Termination of Employment: |
||||||
| By us for cause or resignation by executive without good reason |
— | — | — | |||
| By us without cause, or pursuant to our election not to extend the employment term, or by executive for good reason (1) |
300,000 | — | 15,380 | |||
| By us without cause or by executive for good reason within one year of a change in control (2) |
825,000 | 2,013 | 23,070 | |||
| Upon Disability (3) |
150,000 | — | — | |||
| Upon Death (3) |
150,000 | — | — | |||
| Upon a Change in Control |
— | — | — |
| (1) | Upon termination of Mr. Freund’s employment by us without “cause,” due to our election not to extend the employment term, or by Mr. Freund for “good reason,” Mr. Freund is entitled to (i) continuation of base salary for a period of 12 months and (ii) continuation of medical benefits for up to 12 months (such benefits cease upon commencement of benefits from a new employer, if any; however, for the purposes of this table, we have assumed such benefits shall continue for 12 months). |
| (2) | Upon termination of Mr. Freund’s employment by us without “cause” or by Mr. Freund for “good reason” within one year of a change in control, Mr. Freund is entitled to (i) continuation of base salary for a period of 18 months and (ii) a lump sum cash payment equal to 1.5 times Mr. Freund’s annual bonus calculated at target level, (iii) a pro-rata portion of his target annual bonus through the termination date, and (iv) continuation of medical benefits for up to 18 months (such benefits cease upon commencement of benefits from a new employer, if any; however, for the purposes of this table, we have assumed such benefits shall continue for 18 months). |
| (3) | Upon termination of Mr. Freund’s employment due to Disability or death, he, or his estate, as the case may be, is entitled to a pro rata portion of the bonus for the year during which the termination occurs. Given that for the purposes of this disclosure, termination is deemed to have occurred on December 31, 2009, Mr. Freund would have received 100% of his target bonus. |
| (4) | Equity awards vest in accordance with the terms of the individual grant agreements with respect to each such award. Options and notional shares vest immediately in the event of termination of Mr. Freund’s employment by us without “cause” or by Mr. Freund for “good reason” within two years following a change in control, while restricted shares vest immediately in the event of termination of Mr. Freund’s employment by us without “cause” or by Mr. Freund for “good reason” within one year following a change in control. This value represents an amount equal to the number of shares underlying all of Mr. Freund’s unvested restricted stock and stock options as of December 31, 2009 multiplied (i) in the case of restricted stock, by the closing market price of our common stock on December 31, 2009 ($13.56), which was the last business day of fiscal 2009, and (ii) in the case of stock options, by the spread between the closing market price of our common stock on December 31, 2009 ($13.5600) and the applicable exercise price of each stock option ($13.5120). |
Employment Agreements
The employment agreements for Messrs. Fogarty, Bradley, Tremblay, Frazier and Freund provide for an annual base salary of $575,000, $425,000, $375,000, $250,000 and $300,000, respectively. The Employment Agreements provide for target and maximum bonus opportunities of 100% and 200% of base salary for Mr. Fogarty, 75% and 150% of base salary for Mr. Bradley, 50% and 100% of base salary for each of Messrs. Tremblay, Frazier and Freund. Please see the section entitled “Base Salary” above for information regarding decreases in salary for fiscal year 2009 and increases in connection with the closing of our initial public offering.
118
Table of Contents
Severance Arrangements as Set Forth in Employment Agreements
The employment agreements generally set forth the severance, if any, a named executive officer is entitled to under varying circumstances. The provisions of the named executive officer’s agreements that are related to payments on termination of employment or a change in control of Kraton Performance Polymers are set forth in the tabular disclosure directly under the heading “Termination and Change in Control Payments.”
Generally, the employment agreements define “Cause” to mean (A) the executive’s continued failure substantially to perform the executive’s duties, provided that we cannot terminate the executive’s employment for Cause because of dissatisfaction with the quality of services provided by or disagreement with the actions taken by him or her in the good faith performance of his or her duties to our company; (B) failure to maintain his principal residence in the same metropolitan area as our principal headquarters, or elsewhere as mutually agreed; (C) theft or embezzlement of our company’s property; (D) executive’s conviction of or plea of guilty or no contest to (x) a felony or (y) a crime involving moral turpitude; (E) the executive’s willful malfeasance or willful misconduct in connection with his or her duties under the employment agreement or any act or omission which is materially injurious to the financial condition or business reputation of our company or any of its subsidiaries or affiliates; or (F) the executive’s breach of the restrictive covenants in the employment agreement.
Generally, the employment agreements define “Good Reason” to mean (A) our failure to pay the executive’s Base Salary or Annual Bonus (if any) when due; (B) a reduction in the executive’s Base Salary, the Target Annual Bonus opportunity, or Employee Benefits other than an across-the-board reduction; (C) a relocation of the executive’s primary work location more than 50 miles from Houston, TX, without written consent; or (D) a material reduction in the executive’s duties and responsibilities, provided that none of these events shall constitute Good Reason unless we fail to cure such event within 30 days after receipt from the executive of written notice and provided further that Good Reason shall cease to exist for an event on the 60th day following the later of its occurrence or the executive’s knowledge thereof, unless the executive has given us written notice thereof prior to such date.
Each of our named executive officers’ employment agreements contain confidentiality provisions and provide for customary restrictive covenants, including non-competition and non-solicitation provisions for a period of 12 months following termination of employment.
Director Compensation
The table below summarizes the compensation paid by us to our non-employee directors. We also reimburse our directors for travel, lodging and related expenses incurred in attending board or committee meetings and for directors’ education programs and seminars.
2009 Compensation of Directors
| Name |
Fees Earned or Paid in Cash ($) |
Option Award ($) (1) |
Total ($) | |||
| Richard C. Brown (2) |
58,000 | — | 58,000 | |||
| Kelvin L. Davis |
2,038 | — | 2,038 | |||
| Steven J. Demetriou (3) |
25,000 | 9,722 | 34,722 | |||
| Barry J. Goldstein (4) |
73,000 | — | 73,000 | |||
| Michael G. MacDougall |
2,038 | — | 2,038 | |||
| Kevin G. O’Brien |
2,038 | — | 2,038 | |||
| Dan F. Smith (5) |
200,000 | — | 200,000 | |||
| Karen A. Twitchell |
3,940 | — | 3,940 | |||
| Timothy J. Walsh |
2,446 | — | 2,466 | |||
| Nathan H. Wright |
2,038 | — | 2,038 |
119
Table of Contents
| (1) | Stock options that were granted to our non-employee directors in prior years vest over periods of one to three years. The amounts set forth in this column represent the aggregate grant date fair value computed by Kraton with respect to option awards, in accordance with the Financial Accounting Standards Board ASC Topic 718 (disregarding the estimate of forfeitures related to service-based vesting conditions). For a discussion of the assumptions used in calculating the fair value of our stock-based compensation, refer to Note 2, Share-Based Compensation, to our consolidated financial statements, which are included elsewhere in this prospectus. |
| (2) | At December 31, 2009, Mr. Brown had 16,651 options outstanding, of which 5,551 were exercisable. |
| (3) | At December 31, 2009, Mr. Demetriou had 9,250 options outstanding, of which 8,325 were exercisable. |
| (4) | At December 31, 2009, Mr. Goldstein had 16,651 options outstanding, of which 5,551 were exercisable. |
| (5) | At December 31, 2009, Mr. Smith had 14,801 options outstanding, of which 14,801 were exercisable. |
Prior to our initial public offering, directors who were employees or representatives of TPG Capital or J. P. Morgan Partners did not receive any compensation for their services on our board or its committees. Annual fees paid to our other directors were the result of individually negotiated arrangements. Mr. Brown was entitled to an annual director fee of $50,000. In addition, Mr. Brown received $2,000 per meeting for his participation in person in board meetings. In 2009, Mr. Demetriou received an annual director fee of $25,000, paid quarterly. Mr. Demetriou also received a grant of 1,850 options on January 28, 2010 in respect of his board service in 2009. Mr. Goldstein received an annual director fee of $50,000 and was entitled to a supplemental fee for serving as Audit Committee chairman of $15,000. In addition, Mr. Goldstein received $2,000 per meeting for his participation in person in board meetings. Mr. Smith, who served as our Chairman of the Board, was entitled to an annual director fee of $200,000. The company determined that Mr. Smith’s compensation level is appropriate considering his active role as chairman, extensive background in the petrochemical industry and his personal knowledge and contacts as a result of that experience.
2010 Director Compensation
In connection with our initial public offering, our board adopted the following compensation program for our non-management directors under which these directors will be compensated by a combination of retainers and grants of common stock.
Retainers
Our non-employee directors will receive retainers for serving on our Board of Directors as follows:
| Position |
Retainer ($) | |
| Chairman of the Board |
200,000 | |
| Board Member |
50,000 | |
| Audit Committee Chair |
15,000 | |
| Compensation Committee Chair |
10,000 |
Equity Awards
Mr. Smith is to receive an annual equity grant to be determined by the board. In January 2010, he received a restricted stock grant of 22,202 shares with a three-year cliff vest provided he remains on our board. All other Directors are to receive a grant of $50,000 of our common stock each year commencing in January 2010.
Indemnification of Officers and Directors and Limitation of Liability
Our certificate of incorporation and bylaws provide that we will indemnify our directors and officers to the fullest extent permitted by Delaware law, as it now exists or may in the future be amended, against all expenses and liabilities reasonably incurred in connection with their service for or on behalf of us. In addition, our certificate of incorporation provides that our directors will not be personally liable for monetary damages to us
120
Table of Contents
for breaches of their fiduciary duty as directors, unless they violated their duty of loyalty to us or our stockholders, acted in bad faith, knowingly or intentionally violated the law, authorized illegal dividends or redemptions, or derived an improper personal benefit from their action as directors. We maintain liability insurance that insures our directors and officers against certain losses and that insures us against our obligations to indemnify our directors and officers.
In addition, on May 27, 2010 we entered into indemnification agreements with each of our directors and officers. These agreements, among other things, require us to indemnify each director and officer to the fullest extent permitted by Delaware law, including indemnification of expenses such as attorneys’ fees, judgments, fines, and settlement amounts incurred by the director or officer in any action or proceeding, including any action or proceeding by or in right of us, arising out of the person’s services as a director or officer. At present, we are not aware of any pending or threatened litigation or proceeding involving any of our directors, officers, employees or agents in which indemnification would be required or permitted. We believe provisions in our certificate of incorporation and indemnification agreements are necessary to attract and retain qualified persons as directors and officers.
121
Table of Contents
PRINCIPAL AND SELLING STOCKHOLDERS
Beneficial ownership is determined in accordance with the rules and regulations of the SEC. These rules generally provide that a person is the beneficial owner of securities if such person has or shares the power to vote or direct the voting thereof, or to dispose or direct the disposition thereof or has the right to acquire such powers within 60 days. Percentage of beneficial ownership is based on 31,197,149 shares of common stock outstanding as of September 15, 2010, plus, with respect to any person, the number of shares that may be acquired pursuant to stock options that are or will become exercisable by such person within 60 days. Except as disclosed in the footnotes to this table and subject to applicable community property laws, we believe that each stockholder identified in the table possesses sole voting and investment power over all shares of common stock shown as beneficially owned by the stockholder.
For further information regarding material transactions between us and certain of our stockholders, see “Certain Relationships and Related Party Transactions.”
The following table sets forth information regarding the beneficial ownership of our common stock as of September 15, 2010 of:
| • | each person or group who is known by us to own beneficially more than 5% of our outstanding shares of common stock; |
| • | each of our named executive officers; |
| • | each of our directors and each director nominee; |
| • | all of the executive officers, directors and director nominees as a group; and |
| • | each selling stockholder. |
| Name and Address of Beneficial Owner (1) |
Shares Beneficially Owned Prior to This Offering (2) |
Number of Shares Offered |
Shares Beneficially Owned After This Offering | |||||||||
| Number | Percent | Number | Percent | |||||||||
| 5% Stockholders: |
||||||||||||
| TPG Advisors III, Inc. (3) |
5,825,464 | (4) | 18.67 | % | 2,428,786 | 3,396,678 | 10.89% | |||||
| 301 Commerce Street, Suite 3300 Fort Worth, Texas 76102 |
||||||||||||
| TPG Group Holdings (SBS) Advisors, Inc.(5) |
5,687,379 | (4) | 18.23 | % | 2,371,214 | 3,316,165 | 10.63% | |||||
| 301 Commerce Street, Suite 3300 Fort Worth, Texas 76102 |
||||||||||||
| JPMP Capital Corp. and Related Entities (6) |
7,675,229 | (7) | 24.60 | % | 3,200,000 | 4,475,229 | 14.34% | |||||
| c/o J.P. Morgan Partners, LLC 270 Park Avenue, 4th Floor New York, New York 10017 |
||||||||||||
| GMT Capital Corporation (8) |
1,599,755 | 5.13 | % | — | 1,599,755 | 5.13% | ||||||
| 2100 Riveredge Parkway, Suite 840 Atlanta, GA 30328 |
||||||||||||
122
Table of Contents
| Name and Address of Beneficial Owner (1) |
Shares Beneficially Owned Prior to This Offering (2) |
Number of Shares Offered |
Shares Beneficially Owned After This Offering |
|||||||||||
| Number | Percent | Number | Percent | |||||||||||
| Directors and Named Executive Officers: |
||||||||||||||
| David A. Bradley |
205,294 | * | — | 205,294 | * | |||||||||
| Richard C. Brown |
14,714 | * | — | 14,714 | * | |||||||||
| Kelvin L. Davis |
3,613 | (9) | * | — | 3,613 | (9) | * | |||||||
| Steven J. Demetriou |
23,039 | * | — | 23,039 | * | |||||||||
| Kevin M. Fogarty |
364,587 | * | — | 364,587 | * | |||||||||
| Larry Frazier |
12,335 | * | — | 12,335 | * | |||||||||
| Lothar Freund |
31,541 | * | — | 31,541 | * | |||||||||
| Barry J. Goldstein |
14,714 | * | — | 14,714 | * | |||||||||
| Michael G. MacDougall |
3,613 | (9) | * | — | 3,613 | (9) | * | |||||||
| Kevin G. O’Brien |
3,613 | (10) | * | — | 3,613 | (10) | * | |||||||
| Dan F. Smith |
51,805 | * | — | 51,805 | * | |||||||||
| Stephen E. Tremblay |
108,215 | * | — | 108,215 | * | |||||||||
| Karen A. Twitchell |
3,613 | * | — | 3,613 | * | |||||||||
| Timothy J. Walsh |
3,613 | (10) | * | — | 3,613 | (10) | * | |||||||
| Nathan H. Wright |
3,613 | (9) | * | — | 3,613 | (9) | * | |||||||
| All Directors and Named Executive Officers as a Group |
847,922 | 2.67 | % | — | 847,922 | 2.67 | % | |||||||
| * | Represents beneficial ownership of less than 1% |
| (1) | Unless otherwise provided in the table, the address for the beneficial owners is 15710 John F. Kennedy Boulevard, Suite 300 Houston, Texas 77032. |
| (2) | Shares shown in the table above include shares held in the beneficial owner’s name or jointly with others, or in the name of a bank, nominee or trustee for the beneficial owner’s account. |
The totals in this column include the following shares, beneficial ownership of which the officer or director has the right to acquire within sixty days of September 15, 2010: Mr. Bradley—129,380; Mr. Brown—11,101; Mr. Demetriou—8,325; Mr. Fogarty—255,369; Mr. Frazier—12,335; Mr. Freund—31,541; Mr. Goldstein—11,101; Mr. Smith—14,801; and Mr. Tremblay—93,413.
| (3) | TPG Advisors III, Inc. (“TPG Advisors III”) is the general partner of TPG GenPar III, L.P., which in turn is the sole general partner of each of TPG Partners III, L.P. (“Partners III”), TPG Parallel III, L.P. (“Parallel III”), TPG Investors III, L.P. (“Investors III”), FOF Partners III, L.P. (“FOF”) and FOF Partners III-B, L.P. (“FOF B”) and the sole member of TPG GenPar Dutch, L.L.C., which is the general partner of TPG Dutch Parallel III, C.V. (“Dutch Parallel III”). Partners III, Parallel III, Investors III, FOF, FOF B and Dutch Parallel III are the members of TPG III Polymer Holdings LLC (“TPG III Polymer Holdings”). TPG Advisors III may be deemed, pursuant to Rule 13d-3 under the Securities Exchange Act of 1934, as amended, to beneficially own all of the securities held by TPG III Polymer Holdings. David Bonderman and James G. Coulter are directors, officers and sole stockholders of TPG Advisors III, and therefore, Messrs. Bonderman and Coulter may be deemed to be the beneficial owners of, with indirect voting and dispositive authority over, the equity securities held by TPG III Polymer Holdings. The selling stockholder is an affiliate of a broker-dealer and purchased the shares being registered for resale in the ordinary course of business and, at the time of purchase, with no agreements or understandings, directly or indirectly, with any person to distribute such shares. |
| (4) | This share information was obtained from a Schedule 13G filed with the SEC on February 12, 2010. |
| (5) | TPG Group Holdings (SBS) Advisors, Inc. (“TPG Group Advisors”) is the general partner of TPG Group Holdings (SBS), L.P., which is the sole member of TPG Holdings I-A, LLC, which is the general partner of TPG Holdings I, L.P., which is the sole member of TPG GenPar IV Advisors, LLC, which is the general partner of TPG GenPar IV, L.P., which is the general partner of TPG Partners IV, L.P., which is the sole member of TPG IV Polymer Holdings LLC (“TPG IV Polymer Holdings). TPG Group Advisors may be |
123
Table of Contents
| deemed, pursuant to Rule 13d-3 under the Securities Exchange Act of 1934, as amended, to beneficially own all of the securities held by TPG IV Polymer Holdings. David Bonderman and James G. Coulter are directors, officers and sole stockholders of TPG Group Advisors and therefore, Messrs. Bonderman and Coulter may be deemed to be beneficial owners of, with indirect voting and dispositive authority over, the equity securities held by TPG IV Polymer Holdings. The selling stockholder is an affiliate of a broker-dealer and purchased the shares being registered for resale in the ordinary course of business and, at the time of purchase, with no agreements or understandings, directly or indirectly, with any person to distribute such shares. |
| (6) | JPMP Capital Corp., a wholly-owned subsidiary of JPMorgan Chase & Co., a publicly traded company, is the general partner of JPMP Master Fund Manager, L.P. JPMP Master Fund Manager L.P. is the general partner of J.P. Morgan Partners (BHCA), L.P. (“BHCA”) JPMP Capital Corp. is also the general partner of JPMP Global Investors, L.P. JPMP Global Investors, L.P. is the general partner of each of J.P. Morgan Partners Global Investors, L.P., JPMP Global Fund/Kraton A, L.P., J.P. Morgan Partners Global Investors (Cayman), L.P., J.P. Morgan Partners Global Investors (Cayman) II, L.P., JPMP Global Fund/Kraton, L.P., J.P. Morgan Partners Global Investors (Selldown), L.P., JPMP Global Fund/Kraton/Selldown, L.P., J.P. Morgan Partners Global Investors (Selldown) II, L.P., and JPMP Global Fund/Kraton/Selldown II, L.P. (collectively, the “Global Fund Entities”). BHCA and the Global Fund Entities are selling stockholders. JPMP Capital Corp. may be deemed, pursuant to Rule 13d-3 under the Securities Exchange Act of 1934, as amended, to beneficially own all of the securities held by BHCA and the Global Fund Entities. Ina Drew, John Wilmot and Ana Capella Gomez-Acebo are officers of JPMP Capital Corp. who have voting and dispositive authority over securities beneficially owned by JPMP Capital Corp., and may be deemed to be the beneficial owners of the equity securities held by BHCA and the Global Fund Entities. The address for each of the entities described above is 270 Park Avenue, New York, New York 10017, except that the address of each Cayman entity described above is c/o Walkers SPV Limited, PO Box 908 GT, Walker House, George Town, Grand Cayman, Cayman Islands. The selling stockholders are affiliates of a broker-dealer and purchased the shares being registered for resale in the ordinary course of business and, at the time of purchase, with no agreements or understandings, directly or indirectly, with any person to distribute such shares. |
| (7) | This share information was obtained from a Schedule 13G filed with the SEC on February 12, 2010. |
| (8) | In a schedule 13G filed with the SEC on August 18, 2010, Bay II Resource Partners Offshore Master Fund L.P., GMT Capital Corp, and Thomas E. Claugus (together the “GMT Capital Parties”) reported beneficial ownership of 1,599,755 shares. The GMT Capital Parties together reported shared voting power and shared dispositive power over 1,520,255 of these shares, and Mr. Claugus reported sole voting and dispositive power over 49,300 of these shares. |
| (9) | Messrs. Davis, MacDougall and Wright are each one of our directors and are also partners at TPG Capital, L.P., which is an affiliate of both TPG III Polymer Holdings and TPG IV Polymer Holdings. Each of Messrs. Davis, MacDougall and Wright have no voting or investment power over, and each disclaim beneficial ownership in, the equity securities held by TPG III Polymer Holdings and TPG IV Polymer Holdings. The address of Messrs. Davis, MacDougall and Wright is c/o TPG Capital, L.P., 301 Commerce Street, Suite 3300, Fort Worth, TX 76102. |
| (10) | Messrs. Walsh and O’Brien are each one of our directors and are also Managing Directors of CCMP Capital Advisors, LLC, a private equity firm comprised of the former buyout/growth equity professionals of J.P. Morgan Partners who separated from JPMorgan Chase to form an independent private equity platform. Messrs. Walsh and O’Brien are serving as directors at the request of J.P. Morgan Partners, and JPMP Capital Corp. beneficially owns these shares. Messrs. Walsh and O’Brien disclaim any beneficial ownership of any shares beneficially owned by JPMP Capital Corp. and Related Entities. The address of each of Messrs. Walsh and O’Brien is c/o CCMP Capital Advisors, LLC, 245 Park Avenue, New York, New York 10167. |
124
Table of Contents
CERTAIN RELATIONSHIPS AND RELATED PARTY TRANSACTIONS
Conversion of Corporate Form
Prior to the closing of our initial public offering, we converted from a Delaware limited liability company, Polymer Holdings LLC, to a Delaware corporation under the name Kraton Performance Polymers, Inc.
Reorganization Transactions
In connection with our initial public offering, we completed a reorganization in order to merge TJ Chemical Holdings LLC, which was the entity through which TPG and JPMP owned 100% of our company prior to our initial public offering in December 2009, into our wholly-owned operating subsidiary Kraton Polymers LLC, as a result of which entities related to TPG and JPMP became stockholders of Kraton Performance Polymers. The principal steps involved in these reorganization transactions are summarized below:
TJ Chemical Holdings Merger. TJ Chemical merged with and into Kraton with Kraton surviving. In connection with the merger, TPG and JPMP, which held membership units in TJ Chemical, received shares of common stock of Kraton Performance Polymers in exchange (pro rata) for their respective membership interests in TJ Chemical.
Registration Rights and Shareholders’ Agreement. TPG and JPMP entered into a registration rights and shareholders’ agreement with us. The existing registration rights agreement between TJ Chemical, TPG and JPMP was amended to provide that TPG and JPMP can cause the company to register their shares of common stock in Kraton Performance Polymers under the Securities Act of 1933, as amended (the “Securities Act”), and to maintain a shelf registration statement effective with respect to such shares. Additionally, the agreement places restrictions on each party’s right to transfer the common stock without the consent of the other party and grants rights to the other party to participate on the same terms in mutually consensual transfers. These provisions will be in effect for a limited time and will terminate earlier if the ownership interest of TPG and JPMP falls below certain levels. Furthermore, each of TPG and JPMP have the right to nominate two directors to our board of directors so long as it owns 10% or more of our outstanding common stock and one director so long as it owns 2% or more of our common stock.
Termination of TJ Chemical Holdings, LLC Limited Liability Company Operating Agreement
In connection with the acquisition of Kraton by TPG and JPMP on December 23, 2003, TPG III Polymer Holdings LLC, or TPG III Holdings, TPG IV Polymer Holdings LLC, or TPG IV Holdings, and JPMP established TJ Chemical. We refer to TPG III Holdings and TPG IV Holdings together as the TPG Parties. Pursuant to the limited liability company operating agreement of TJ Chemical, each of the TPG Parties received approximately a 30% membership interest in TJ Chemical, and JPMP received approximately a 40% membership interest. In addition, members of our management received equity or profit interests in TJ Chemical. This acquisition is hereinafter referred to in this prospectus as the “2003 Acquisition.”
Under the limited liability company operating agreement of TJ Chemical, initially, each of the TPG Parties was entitled to designate or nominate two directors of TJ Chemical and JPMP was entitled to elect four directors of TJ Chemical. Prior to the reorganization transactions, the board of TJ Chemical consisted of three directors elected by the TPG Parties and two directors elected by JPMP. The number of directors that the TPG Parties or JPMP were entitled to designate or nominate decreased in the event that their respective ownership percentages decreased below specified percentages. The limited liability company agreement of TJ Chemical required the approval of both the TPG Parties and JPMP for certain fundamental matters with respect to Kraton and placed certain restrictions on the transfer of their interests in TJ Chemical. Each party also had the right to participate in certain dispositions by the other parties and could be required to participate on the same terms in any sale by the other parties that sell in excess of a specified percentage of their original interests. In connection with the reorganization transactions described above, the limited liability company agreement of TJ Chemical was terminated.
125
Table of Contents
Termination of TJ Chemical’s Purchase Option
In connection with the consummation of the 2003 Acquisition, TJ Chemical acquired from us, in consideration for an option premium payment to us of approximately $27.2 million, an option to purchase all of its outstanding equity interests in Kraton free and clear of all liens, claims and encumbrances other than those created in connection with the senior secured credit facility. The option was exercisable at any time until the seventh anniversary of the 2003 Acquisition (December 23, 2010), for a purchase price in cash, referred to as the Call Option Price, equal to $400 million on or prior to the first anniversary of the acquisition, $405 million thereafter but on or prior to the second anniversary of the acquisition, $281 million thereafter but on or prior to the third anniversary of the acquisition, $286 million thereafter but on or prior to the fourth anniversary of the acquisition, $771 million thereafter but on or prior to the fifth anniversary of the acquisition, $1.071 billion thereafter but on or prior to the sixth anniversary of the acquisition and $1.371 billion thereafter until the option expires. The Call Option Price was subject to adjustment under certain circumstances, to take into account contributions made by us to Kraton or any material distributions made by Kraton to us. Prior to the closing of our initial public offering, the option was terminated without the payment of any consideration by TJ Chemical or us.
Termination of Management Services Agreement
Upon the consummation of the 2003 Acquisition, Kraton paid a transaction fee to the general partner of TPG Partners III, L.P. in the amount of approximately $4.0 million, to the general partner of TPG Partners IV, L.P. in the amount of approximately $4.0 million and to JPMP in the amount of $2.5 million. In addition, in connection with the 2003 Acquisition, Kraton entered into a management services agreement with these parties. Under this agreement, in exchange for consulting and management advisory services provided to Kraton, a management fee of $0.5 million per quarter was paid that was divided among these parties in accordance with the provisions set forth in the agreement. We terminated the management services agreement in connection with our initial public offering and paid a fee of $2.0 million in connection with the termination.
Related Transactions
We own a 50% equity investment in a manufacturing joint venture with JSR under the name of Kraton JSR Elastomers K.K. located in Kashima, Japan. KJE produces thermoplastic rubber for sale to third-party customers only through Kraton and JSR. We and JSR separately, but with equal rights, participate as distributors in the sale of the thermoplastic rubber produced by KJE.
During the years ended December 31, 2009, 2008 and 2007, we made sales of thermoplastic rubber on behalf of KJE of approximately $27.8 million, $37.9 million and $39.7 million, respectively. From time to time, KJE will purchase thermoplastic rubber products from us. For the years ended December 31, 2009, 2008 and 2007, we had sales of our products to KJE of approximately $0, $0.6 million and $1.2 million, respectively.
In October 2009, we entered into a contract with Amyris Biotechnologies, Inc. to explore the development of an alternative source of certain raw materials, and subject to Amyris’s meeting developmental and manufacturing milestones, to purchase raw materials from Amyris. We have not made any purchases to date. TPG Biotechnology II, L.P., a private investment fund that may be deemed to be an affiliate of TPG III and TPG IV, owns approximately 10% of Amyris Biotechnologies.
Policy Concerning Related Party Transactions
Our board has adopted a written policy relating to the approval of related party transactions. Under our policy, our employees, officers and directors are discouraged from entering into any transaction that may cause a conflict of interest for us. In addition, they must report any potential conflict of interest, including related party transactions, to their supervisors or our law department. Pursuant to its charter, our Audit Committee is required to evaluate each related person transaction for the purpose of recommending to the disinterested members of our board of directors that the transactions are fair, reasonable and within our policy, and should be ratified and approved by the board.
126
Table of Contents
In evaluating such proposed transactions, the Audit Committee is required to consider the relevant facts and circumstances available and deemed relevant to the Audit Committee, including:
| • | the benefits of the transaction to our company; |
| • | the terms of the transaction and whether they are arm’s-length and in the ordinary course of our company’s business; |
| • | the direct or indirect nature of the related person’s interest in the transaction; |
| • | the size and expected term of the transaction; and |
| • | other facts and circumstances that bear on the materiality of the related person transaction under applicable law and listing standards. |
Our Audit Committee will recommend approval of only those transactions that, in light of known circumstances, are in, or are not inconsistent with, our best interests, as our Audit Committee determines in the good faith exercise of its discretion.
127
Table of Contents
Our authorized capital stock consists of 500,000,000 shares of common stock, $0.01 par value and 100,000,000 shares of preferred stock, par value $0.01. The following description summarizes important terms of our capital stock. Because it is only a summary, it does not contain all the information that may be important to you. For a complete description, you should refer to our certificate of incorporation and our bylaws, which are filed as Exhibits 3.1 and 3.2.
Common Stock
General. Our certificate of incorporation authorizes the issuance of up to 500,000,000 shares of common stock, up to 10,000,000 of which may be issued and designated as non-voting shares. As of September 15, 2010, there were 31,197,149 shares of our common stock outstanding. None of our outstanding common stock has been designated as non-voting.
Holders of common stock (other than common stock designated as non-voting) are entitled to one vote for each share held on all matters submitted to a vote of stockholders and do not have cumulative voting rights. Accordingly, holders of a majority of the shares of common stock entitled to vote in any election of directors may elect all of the directors standing for election. Holders of common stock are entitled to receive proportionately any dividends as may be declared by our board of directors, subject to any preferential dividend rights of outstanding preferred stock. Upon our liquidation, dissolution or winding up, the holders of common stock are entitled to receive proportionately our net assets available after the payment of all debts and other liabilities and subject to the prior rights of any outstanding preferred stock. Holders of common stock have no preemptive, subscription, redemption or conversion rights. Our outstanding shares of common stock, including the shares offered by the selling stockholders in this offering, are validly issued, fully paid and nonassessable. The rights, preferences and privileges of holders of common stock are subject to, and may be impacted by, the rights of the holders of shares of any series of preferred stock that we may designate and issue in the future.
Dividends. Subject to preferences that may be applicable to any then outstanding preferred stock, holders of our common stock are entitled to receive ratably those dividends, if any, as may be declared by the board of directors out of legally available funds.
Liquidation, Dissolution, and Winding Up. Upon our liquidation, dissolution or winding up, the holders of our common stock will be entitled to share ratably in the net assets legally available for distribution to stockholders after the payment of all of our debts and other liabilities, subject to the prior rights of any preferred stock then outstanding.
Preemptive Rights. Holders of our common stock have no preemptive or conversion rights or other subscription rights, and there are no redemption or sinking funds provisions applicable to our common stock.
Assessment. All outstanding shares of our common stock, including the shares offered by the selling stockholders in this offering, are fully paid and nonassessable.
Preferred Stock.
Our certificate of incorporation authorizes the issuance of up to 100,000,000 shares of preferred stock. As of September 15, 2010, there were no shares of preferred stock outstanding.
Our board of directors may issue preferred stock, without stockholder approval, in such series and with such designations, preferences, conversion or other rights, voting powers and qualifications, limitations or restrictions thereof, as the board of directors deems appropriate. While the board of directors has no current intention of
128
Table of Contents
doing so, it could, without stockholder approval, issue preferred stock with voting, conversion and other rights that could adversely affect the voting power and impact other rights of the holders of the common stock. Our board of directors may issue preferred stock as an anti-takeover measure without any further action by the holders of common stock. This may have the effect of delaying, deferring or preventing a change of control of our company by increasing the number of shares necessary to gain control of the company. As of September 17, 2010, our board of directors has not authorized the issuance of any shares of preferred stock, and we have no agreements or current plans for the issuance of any shares of preferred stock.
Options
As of September 17, 2010, there are 3,604,484 shares of common stock reserved for future issuance under the Polymer Holdings LLC 2009 Equity Incentive Plan.
Provisions in Our Charter and Bylaws
Bylaws. Our bylaws provide that:
| • | any action to be taken by our stockholders must be effected at a duly called annual or special meeting and not by a consent in writing; |
| • | annual or special meetings of the stockholders can only be called pursuant to a resolution adopted by a majority of our board of directors or by the chairman of the board; |
| • | our board of directors is divided into three classes, with each class serving for a term of three years; |
| • | vacancies on the board, including newly created directorships, can be filled for the remainder of the relevant term by a majority of the directors then in office; and |
| • | our directors may be removed only for cause. |
Our bylaws provide that stockholders seeking to bring business before an annual or special meeting of stockholders or to nominate candidates for election as directors at an annual or special meeting of stockholders must comply with advance notice requirements in writing. To be timely, a stockholder’s notice must be received at our principal executive offices not less than 90 days nor more than 120 days prior to the anniversary date of the immediately preceding annual meeting of stockholders. In the event that the annual meeting is called for a date that is not within 30 days before or 60 days after the anniversary date, in order to be timely, notice from the stockholder must be received:
| • | not earlier than 120 days prior to the annual meeting of stockholders; and |
| • | not later than 90 days prior to the annual meeting of stockholders or, if the first public announcement of the date of such annual meeting is less than 100 days prior to the date of such annual meeting, the tenth day following the date on which notice of the annual meeting was made public. |
In the case of a special meeting of stockholders called for the purpose of electing directors, notice by the stockholder, in order to be timely, must be received:
| • | not earlier than 120 days prior to the special meeting; and |
| • | not later than 90 days prior to the special meeting or the close of business on the tenth day following the day on which public disclosure of the date of the special meeting was made. |
Our bylaws also specify requirements as to the form and content of a stockholder’s notice. These provisions may preclude stockholders from bringing matters before an annual or special meeting of stockholders or from making nominations for directors at an annual or special meeting of stockholders or from making nominations for directors at an annual or special meeting of stockholders. In addition, our certificate of incorporation permits our board of directors to amend or repeal our amended and restated bylaws by majority vote, but requires a two-thirds supermajority vote of stockholders to amend or repeal our amended and restated bylaws.
129
Table of Contents
The provisions in our certificate of incorporation and our bylaws are intended to enhance the likelihood of continuity and stability in the composition of the board of directors and in the policies formulated by the board of directors and to discourage certain types of transactions that may involve an actual or threatened change of control of our company. These provisions also are designed to reduce our vulnerability to an unsolicited takeover proposal that does not contemplate the acquisition of all of the outstanding shares of our common stock or an unsolicited proposal for the restructuring or sale of all or part of us. These provisions, however, could discourage potential acquisition proposals and could delay or prevent a change in control of our company. They may also have the effect of preventing changes in our management.
Delaware Anti-Takeover Statute
In addition, our certificate of incorporation will provide that the provisions of Section 203 of the DGCL, which relate to business combinations with interested stockholders, do not apply to us. Section 203 of the DGCL prohibits a publicly held Delaware corporation from engaging in a business combination transaction with an interested stockholder (a stockholder who purchases more than 15% of our common stock) for a period of three years after the interested stockholder became such unless the transaction fits within an applicable exemption, such as board approval of the business combination or the transaction that resulted in such stockholder becoming an interested stockholder. These provisions would apply even if the business combination could be considered beneficial by some stockholders. By opting out of Section 203 of the DGCL, a stockholder that becomes an interested stockholder will be able to engage in a business combination transaction with us without prior board approval.
Corporate Opportunities
Our certificate of incorporation provides that TPG and JPMP have no obligation to offer us an opportunity to participate in business opportunities presented to TPG or JPMP or their respective affiliates even if the opportunity is one that we might reasonably have pursued (and therefore may be free to compete with us in the same business or similar businesses), and that neither TPG and JPMP nor their respective affiliates will be liable to us or our stockholders for breach of any duty by reason of any such activities unless, in the case of any person who is a director or officer of our company, such business opportunity is expressly offered to such director or officer in writing solely in his or her capacity as an officer or director of our company. Stockholders will be deemed to have notice of and consented to this provision of our certificate of incorporation.
Limitation of Liability and Indemnification of Officers and Directors
Our certificate of incorporation provides that no director shall be liable to us or our stockholders for monetary damages for breach of fiduciary duty as a director, except as required by the DGCL as in effect from time to time. Our bylaws provide that, to the full extent permitted by law, we will indemnify any person made or threatened to be made a party to any action by reason of the fact that the person is or was our director or officer, or serves or served as a director or officer of any other enterprise at our request.
Transfer Agent and Registrar
The transfer agent and registrar for our common stock is Computershare Inc.
Registration Rights
For a description of registration rights with respect to our common stock, see the information under the heading “Certain Relationships and Related Party Transactions—Registration Rights and Shareholders’ Agreement.”
Exchange
Our common stock is listed on the New York Stock Exchange under the symbol “KRA.”
130
Table of Contents
DESCRIPTION OF CERTAIN INDEBTEDNESS
Senior Secured Credit Facility
Kraton entered into a senior secured credit agreement, or Credit Agreement, dated as of December 23, 2003, which was subsequently amended as of March 4, 2004, October 21, 2004, February 16, 2006, May 12, 2006, December 15, 2006, October 20, 2009 and November 30, 2009. In this prospectus, we refer to the loans made under the revolving portion of the senior secured credit facility as the revolving loans and the loans made under the term portion of the senior secured credit facility as the term loans.
The amendment as of May 12, 2006, or the 2006 Amendment, provided for, among other things, a term facility of $385 million, representing a $25 million increase over the original term facility and extended the maturity of the term facility from December 23, 2010 to May 12, 2013. In addition, the 2006 Amendment extended the maturity of the revolving facility from December 23, 2008 to May 12, 2011 and provided for the possibility of increasing the existing revolving facility from $60 million to $80 million, subject to new revolving lenders becoming parties to the Credit Agreement. On June 7, 2006, Kraton entered into a joinder agreement with a new revolving lender that increased the revolving facility to $75.5 million from $60.0 million. The 2006 Amendment also reduced the interest rate margin on the term facility, eliminated or amended certain affirmative and negative covenants, including a covenant that limited Kraton’s ability to make capital expenditures and modified the financial ratios Kraton is required to maintain. On the effective date of the 2006 Amendment, Kraton borrowed the full $385 million available under the new term facility and used the proceeds to prepay in full existing borrowings under the original term facility, to make a distribution to us to provide a portion of the funds necessary to consummate a tender offer for the senior discount notes issued by us and Polymer Holdings Capital Corporation on November 2, 2004 and pay fees and expenses related to the foregoing.
The amendment as of October 20, 2009, or the October 2009 Amendment, permits Kraton to convert all or a portion of existing term loans into separate classes of extended term loans that extend the scheduled amortization and maturity of the existing term loans. The extended term loans are required to be substantially identical to the terms of the existing term facility, with the exception of scheduled installment payments and maturity, fees, interest rates and prepayment rights. There is no limit on the number of classes of term loans outstanding at any one time. The October 2009 Amendment also permits Kraton to establish separate classes (but in no event more than three at any time) of loans to replace all or a portion of the existing revolving loans. The terms of replacement revolving loans are required to be substantially identical to the terms of the existing revolving loans, with the exception of maturity, fees and interest rates. Finally, the October 2009 Amendment also allows the Borrower to incur indebtedness secured pari passu with the collateral securing the existing lenders under the existing Credit Agreement to refinance existing term loans. This refinancing indebtedness may not amortize or mature prior to the maturity of the existing term loans.
A further amendment on November 30, 2009, or the November 2009 Amendment, increased the maximum available borrowings under the revolving facility from $75.5 million to $80.0 million and extended the maturity on $79.8 million of the revolving loans from May 2011 to May 2013.
Kraton is the borrower under the amended Credit Agreement and its wholly-owned domestic subsidiaries along with us, as successor to Polymer Holdings, have guaranteed the amended Credit Agreement. We refer to these guarantors, together with Kraton, as the Loan Parties. The Credit Agreement is secured by a perfected first priority security interest in substantially all of each Loan Party’s tangible and intangible assets, including intellectual property, real property, all of Kraton’s capital stock and the capital stock of Kraton’s domestic subsidiaries and 65% of the capital stock of the direct foreign subsidiaries of each Loan Party.
For the years ended December 31, 2009, 2008 and 2007, Kraton made prepayments on the term loans in the amounts of $100.0 million, $10.0 million and $40.0 million, which resulted in the write off of approximately $1.5 million, $0.2 million and $0.6 million of deferred financing cost, respectively.
131
Table of Contents
As of June 30, 2010, Kraton had no outstanding revolving loans.
The following is a summary of the material terms of the amended Credit Agreement. This description does not purport to be complete and is qualified in its entirety by reference to the provisions of the Credit Agreement.
Maturity. The revolving loans extended pursuant to the November 2009 Amendment are payable in a single maturity on May 12, 2013. The $200,000 portion of the revolving loans that were not extended pursuant to November 2009 Amendment are payable on May 12, 2011. The term loans are payable in eight remaining consecutive equal quarterly installments, in an aggregate annual amount equal to 1.0% of the original principal amount of such loans. The remaining balance is payable in four equal quarterly installments commencing on September 30, 2012 and ending on May 12, 2013.
Interest. The term loans bear interest at a rate equal to the adjusted Eurodollar rate plus 2.00% per annum or, at Kraton’s option, the base rate plus 1.00% per annum. The average effective interest rates on the term loans for the six months ended June 30, 2010 and 2009 were 3.4% and 4.3%, respectively, and 4.5% and 5.0% for the years ended December 31, 2009 and 2008, respectively. The revolving loans extended pursuant to the November 2009 Amendment bear interest at a rate equal to the adjusted Eurodollar rate plus a margin of between 3.00% and 3.50% per annum (depending on the Kraton’s consolidated leverage ratio) or at Kraton’s option, the base rate plus a margin of between 2.00% and 2.50% per annum (also depending on Kraton’s consolidated leverage ratio). In addition, with respect to the extended portion of the revolving loans, an annual commitment fee equal to 0.75% payable quarterly on the daily average undrawn portion of the revolving loans extended pursuant to the November 2009 Amendment accrues and is payable quarterly in arrears.
The terms of the $0.2 million portion of the revolving loans that were not extended pursuant to November 2009 Amendment were not changed. These revolving loans bear interest at a rate equal to the adjusted Eurodollar rate plus a margin of between 2.00% and 2.50% per annum (depending on Kraton’s leverage ratio), or at Kraton’s option, the base rate plus a margin of between 1.00% and 1.50% per annum (depending on Kraton’s leverage ratio). The unused commitment fee for the unextended revolving loans is 0.5%.
Mandatory Prepayments. The existing term facility is subject to mandatory prepayment with, in general: (1) 100% of the net cash proceeds of certain asset sales, subject to certain reinvestment rights; (2) 100% of the net cash proceeds of certain insurance and condemnation payments, subject to certain reinvestment rights; 3) 50% of the net cash proceeds of certain equity offerings (declining to 25%, if a leverage ratio is met); (4) 100% of the net cash proceeds of debt incurrences (other than debt incurrences permitted under the Credit Agreement); and (5) 50% of Kraton’s excess cash flow, as defined in the Credit Agreement (declining to 25%, if a leverage ratio is met and to 0% if a further leverage ratio is met). Any such prepayment is applied first to the term facility and thereafter to the revolving facility.
Covenants. The Credit Agreement contains certain affirmative covenants including, among others, covenants to furnish the lenders with financial statements and other financial information and to provide the lenders notice of material events and information regarding collateral.
The Credit Agreement contains certain negative covenants that, among other things, restrict Kraton’s ability, subject to certain exceptions, to incur additional indebtedness, grant liens on its assets, undergo fundamental changes, make investments, sell assets, make acquisitions, engage in sale and leaseback transactions, make restricted payments, engage in transactions with its affiliates, amend or modify certain agreements and charter documents and change its fiscal year. The covenants also restrict our activities. Kraton is required to maintain a fiscal quarter end interest coverage ratio of at least 3.00:1.00 a fiscal quarter end leverage ratio not to exceed 4.00. In addition, under the senior credit facility, an event of default would result upon the occurrence of a “change of control.” A “change of control” is defined to include, once TPG and JPMP and their affiliates collectively own capital stock representing less than 35% of the voting power represented by our issued and outstanding capital stock, the acquisition by any person or group of an equal or greater percentage of our voting power.
132
Table of Contents
On January 14, 2008, Kraton received an equity investment of $10.0 million, of which $9.6 million was included in the financial covenant calculation for the twelve-month period ending December 31, 2007 and was included in the fiscal quarter covenant calculations through the fiscal quarter ending September 30, 2008 pursuant to the equity cure provisions included in the Credit Agreement.
As of June 30, 2010, we were in compliance with all covenants under the Credit Agreement.
Senior 12% Discount Notes Due July 15, 2014
As part of a refinancing of indebtedness on November 2, 2004, Polymer Holdings issued $150.0 million of Senior 12% Discount Notes. On May 12, 2006 all but $0.25 million of the senior discount notes were repaid.
8.125% Senior Subordinated Notes due 2014
On December 23, 2003, Kraton and Kraton Polymers Capital Corporation issued 8.125% Senior Subordinated Notes due 2014 in an aggregate principal amount of $200.0 million. The senior subordinated notes are subject to the provisions for mandatory and optional prepayment and acceleration and are payable in full on January 15, 2014. Each of Kraton Polymers U.S. LLC and Elastomers Holdings LLC has guaranteed the senior subordinated notes. The following is a summary of the material terms of the senior subordinated notes. This description does not purport to be complete and is qualified, in its entirety, by reference to the provisions of the indenture governing the senior subordinated notes.
Maturity. The senior subordinated notes mature on January 15, 2014.
Interest. The senior subordinated notes bear interest at a fixed rate of 8.125% per annum. Interest is payable semi-annually on January 15 and July 15.
Guarantees. The senior subordinated notes are guaranteed on a senior subordinated basis by all of Kraton’s existing and future subsidiaries that guarantee the indebtedness under the senior secured credit facility described above.
Security and Ranking. The senior subordinated notes and the guarantees are general unsecured obligations and are subordinated to Kraton’s and its guarantor subsidiaries’ existing and future senior indebtedness, including indebtedness under the senior secured credit facility, and rank equally with Kraton’s and its guarantor subsidiaries’ future senior subordinated indebtedness. The senior subordinated notes and the guarantees effectively rank junior to Kraton’s secured indebtedness and to the secured indebtedness of all of Kraton’s guarantor subsidiaries to the extent of the value of the assets securing the indebtedness and are structurally subordinated to all liabilities of Kraton’s subsidiaries that are not guarantors of the senior subordinated notes.
Optional Redemption. We may redeem all or a part of the senior subordinated notes at the redemption prices (expressed as percentages of principal amount) set forth below plus accrued and unpaid interest, if any, on the senior subordinated notes redeemed to the applicable redemption date.
| Year |
Percentage | ||
| 2010 |
102.708 | % | |
| 2011 |
101.354 | % | |
| 2012 |
100.000 | % | |
| 2013 and thereafter |
100.000 | % |
Purchase of a Portion of the Senior Subordinated Notes. On March 16, 2009, Kraton purchased and retired $30 million face value of the senior subordinated notes for cash consideration of $10.9 million, which included accrued interest of $0.4 million. We recorded a gain of approximately $19.5 million in the quarter ending March 31, 2009 related to the purchase and retirement of these senior subordinated notes.
133
Table of Contents
In April 2009, TJ Chemical purchased approximately $6.3 million face value of the senior subordinated notes for cash consideration of $2.5 million, which included accrued interest of $0.1 million. Immediately upon purchasing the senior subordinated notes, TJ Chemical contributed the purchased notes to us, and we in turn contributed the notes to Kraton. No equity interest or other consideration was issued in exchange for the contribution of the senior subordinated notes, although equity of each of Kraton Performance Polymers and Kraton was increased by an amount equal to the cash consideration paid by TJ Chemical. Kraton holds the senior subordinated notes as treasury notes. Also in April 2009, Kraton purchased approximately $0.7 million face value of the senior subordinated notes for cash consideration of $0.3 million, which Kraton is holding as treasury notes. We recorded a gain of approximately $4.3 million on the extinguishment of debt in the quarter ended June 30, 2009.
Covenants. The senior subordinated notes contain certain affirmative covenants including, among others, covenants to furnish the holders of the senior subordinated notes with financial statements and other financial information and to provide the holders of the senior subordinated notes notice of material events.
The senior subordinated notes contain certain negative covenants including limitations on indebtedness, limitations on restricted payments, limitations on restrictions on distributions from certain subsidiaries, limitations on lines of businesses and mergers and consolidations.
As of June 30, 2010, we were in compliance with all covenants under the senior subordinated notes.
134
Table of Contents
SHARES ELIGIBLE FOR FUTURE SALE
Future sales of substantial amounts of common stock, including shares issued upon exercise of options and warrants, in the public market after this offering, or the anticipation of those sales, could adversely affect market prices of our common stock prevailing from time to time and could impair our ability to raise capital through sales of our equity securities.
Sales of Restricted Shares
Upon completion of this offering, we will have outstanding an aggregate of 31,197,149 shares of common stock. Of these outstanding shares, we expect all of the shares of common stock to be sold in this offering will be freely tradable in the public market without restriction or further registration under the Securities Act, unless the shares are held by any of our affiliates, as that term is defined in Rule 144 of the Securities Act, which shares will be subject to the volume limitations and other restrictions of Rule 144 described below. We expect 11,284,283 shares will be restricted securities as defined in Rule 144 and may be sold by the holders in the public market only after registration under the Securities Act or pursuant to an exemption from such registration, including, among others, Rule 144 or Rule 701, each of which is discussed below.
We, each of our officers and directors and the selling stockholders are subject to lock-up agreements under which they have agreed not to transfer or dispose of, directly or indirectly, any shares of common stock or any securities convertible into or exercisable or exchangeable for shares of common stock, for a period of 90 days after the date of this prospectus, which is subject to extension in some circumstances, as discussed below. Shares of common stock held by these holders subject to the lock-up agreements will be eligible for sale in the public market after the expiration of the lock-up period, pursuant to Rule 144 or Rule 701. However, this lockup is subject to several exceptions.
Rule 144
In general, under Rule 144, a person who is not our affiliate, has not been our affiliate for the previous three months, and who has beneficially owned shares of our common stock for at least six months may sell all such shares. An affiliate or a person who has been our affiliate within the previous three months, and who has beneficially owned shares of our common stock for at least six months, may sell within any three-month period a number of shares that does not exceed the greater of:
| • | One percent of the number of shares of common stock then outstanding, which will equal approximately 311,971 shares immediately after this offering; and |
| • | the average weekly trading volume of the common stock on the New York Stock Exchange during the four calendar weeks preceding the filing of a notice on Form 144 with respect to the sale. |
All sales under Rule 144 are subject to the availability of current public information about us. Sales under Rule 144 by affiliates or persons who have been affiliates within the previous three months, are also subject to manner of sale provisions and notice requirements.
Rule 701
In general, under Rule 701 of the Securities Act, any of our employees, consultants or advisors who purchase shares from us in connection with a qualified compensatory stock plan or other written agreement is eligible to resell those shares 90 days after the effective date of our initial public offering in reliance on Rule 144, but without compliance with the holding period contained in Rule 144, and, in the case of non-affiliates, without the availability of current public information.
Lock-up Agreements
We, each of our officers and directors and the selling stockholders have agreed, subject to certain exceptions, with the underwriters not to dispose of or hedge any of the shares of common stock or securities
135
Table of Contents
convertible into or exchangeable for shares of common stock during the period from the date of this prospectus continuing through the date 90 days after the date of this prospectus, except in our case for the issuance of common stock upon the exercise of options issued pursuant to compensation plans for directors and executive officers approved by our board of directors prior to this offering or pursuant to a dividend investment plan. Credit Suisse Securities (USA) LLC, Merrill Lynch, Pierce, Fenner & Smith Incorporated and Morgan Stanley & Co. Incorporated may, in their sole discretion, release any of these shares from these restrictions at any time without notice. See “Underwriting.”
136
Table of Contents
CERTAIN UNITED STATES FEDERAL INCOME AND ESTATE TAX CONSIDERATIONS FOR NON-U.S. HOLDERS
The following is a summary of material United States federal income and estate tax consequences of the purchase, ownership and disposition of our common stock as of the date of this prospectus. Except where noted, this summary deals only with common stock that is held as a capital asset by a non-U.S. holder. A “non-U.S. holder” means a person (other than a partnership) that is not for United States federal income tax purposes any of the following:
| • | an individual citizen or resident of the United States including an alien individual who is a lawful permanent resident of the United States or meets the “substantial presence” test under Section 7701(b) of the Code; |
| • | a corporation (or any other entity treated as a corporation for United States federal income tax purposes) created or organized in or under the laws of the United States, any state thereof or the District of Columbia; |
| • | an estate the income of which is subject to United States federal income taxation regardless of its source; or |
| • | a trust if it (1) is subject to the primary supervision of a court within the United States and one or more United States persons have the authority to control all substantial decisions of the trust or (2) has a valid election in effect under applicable United States Treasury regulations to be treated as a United States person. |
This summary is based upon provisions of the Internal Revenue Code of 1986, as amended (the “Code”), and regulations, rulings and judicial decisions as of the date hereof. Those authorities may be changed, perhaps retroactively, so as to result in United States federal income and estate tax consequences different from those summarized below. This summary does not address all aspects of United States federal income and estate taxes and does not deal with foreign, state, local or other tax considerations that may be relevant to non-U.S. holders in light of their particular circumstances. In addition, it does not represent a detailed description of the United States federal income and estate tax consequences applicable to you if you are subject to special treatment under the United States federal income tax laws (including if you are a United States expatriate, “controlled foreign corporation,” “passive foreign investment company,” or corporation that accumulates earnings to avoid United States federal income tax). A change in law may alter significantly the tax considerations that we describe in this summary, possibly with retroactive effect.
If a partnership holds our common stock, the tax treatment of a partner will generally depend upon the status of the partner and the activities of the partnership. If you are a partner of a partnership holding our common stock, you should consult your tax advisors.
If you are considering the purchase of our common stock, we recommend that you consult your own tax advisors concerning the particular United States federal income and estate tax consequences to you of the ownership and disposition of the common stock, as well as the consequences to you arising under the laws of any other taxing jurisdiction.
Dividends
In the event that we pay dividends, dividends paid to a non-U.S. holder of our common stock generally will be subject to withholding of United States federal income tax at a 30% rate or such lower rate as may be specified by an applicable income tax treaty. However, dividends that are effectively connected with the conduct of a trade or business by the non-U.S. holder within the United States (and, where a tax treaty applies, are attributable to a United States permanent establishment of the non-U.S. holder) are not subject to the withholding tax, provided certain certification and disclosure requirements are satisfied. Instead, such dividends are subject to United States federal income tax on a net income basis in the same manner as if the non-U.S. holder were a
137
Table of Contents
United States person as defined under the Code. A foreign corporation receiving any such effectively connected dividends may be subject to an additional “branch profits tax” imposed at a 30% rate or such lower rate as may be specified by an applicable income tax treaty.
A non-U.S. holder of our common stock that wishes to claim the benefit of an applicable treaty rate and avoid backup withholding, as discussed below, for dividends will be required to (a) complete Internal Revenue Service Form W-8BEN (or other applicable form) and certify under penalty of perjury that such holder is not a United States person as defined under the Code or (b) if our common stock is held through certain foreign intermediaries, satisfy the relevant certification requirements of applicable United States Treasury regulations. Special certification and other requirements apply to certain non-U.S. holders that are entities rather than individuals.
A non-U.S. holder of our common stock eligible for a reduced rate of United States withholding tax pursuant to an income tax treaty may obtain a refund of any excess amounts withheld by filing an appropriate claim for refund with the Internal Revenue Service.
Gain on Sale or Other Disposition of Common Stock
Any gain realized on the disposition of our common stock generally will not be subject to United States federal income tax unless:
| • | the gain is effectively connected with a trade or business of the non-U.S. holder in the United States, and, if required by an applicable income tax treaty, is attributable to a United States permanent establishment of the non-U.S. holder; |
| • | the non-U.S. holder is an individual who is present in the United States for 183 days or more in the taxable year of disposition and certain other conditions are met; or |
| • | we are or have been a “United States real property holding corporation” for United States federal income tax purposes. |
An individual non-U.S. holder described in the first bullet point immediately above will be subject to tax on the net gain derived from the sale under regular graduated United States federal income tax rates. An individual non-U.S. holder described in the second bullet point immediately above will be subject to a flat 30% tax on the gain derived from the sale, which may be offset by United States source capital losses, even though the individual is not considered a resident of the United States, but may not be offset by any capital loss carryovers. If a non-U.S. holder that is a foreign corporation falls under the first bullet point immediately above, it generally will be subject to tax on its net gain in the same manner as if it were a United States person as defined under the Code and, in addition, may be subject to the branch profits tax imposed at a rate of 30% or at such lower rate as may be specified by an applicable income tax treaty. We do not believe that we are or have been, and do not expect to become, a United States real property holding corporation for United States federal income tax purposes.
Federal Estate Tax
Common stock held by an individual non-U.S. holder at the time of death and common stock held by entities the property of which is potentially includible in such an individual’s gross estate for U.S. federal estate tax purposes will be included in such holder’s gross estate for United States federal estate tax purposes, unless an applicable estate tax treaty provides otherwise.
Backup Withholding, Information Reporting and Other Reporting Requirements
We must report annually to the Internal Revenue Service and to each non-U.S. holder the amount of dividends paid to such holder and the tax withheld with respect to such dividends, regardless of whether
138
Table of Contents
withholding was required. Copies of the information returns reporting such dividends and withholding may also be made available to the tax authorities in the country in which the non-U.S. holder resides under the provisions of an applicable income tax treaty.
A non-U.S. holder will be subject to backup withholding for dividends paid to such holder unless such holder certifies under penalty of perjury that it is a non-U.S. holder, and the payor does not have actual knowledge or reason to know that such holder is a United States person as defined under the Code, or such holder otherwise establishes an exemption.
Information reporting and, depending on the circumstances, backup withholding will apply to the proceeds of a sale of our common stock within the United States or conducted through certain United States-related financial intermediaries, unless the beneficial owner certifies under penalty of perjury that it is a non-U.S. holder (and the payor does not have actual knowledge or reason to know that the beneficial owner is a United States person as defined under the Code) or such owner otherwise establishes an exemption.
Any amounts withheld under the backup withholding rules may be allowed as a refund or a credit against a non-U.S. holder’s United States federal income tax liability provided the required information is timely furnished to the Internal Revenue Service.
Recently Enacted Legislation Affecting Taxation of Our Common Stock Held By or Through Foreign Entities
Recently enacted legislation generally will impose a United States federal withholding tax of 30% on dividends and the gross proceeds of a disposition of our common stock paid after December 31, 2012 to a “foreign financial institution” (as specially defined under these rules), unless such institution enters into an agreement with the United States government to withhold on certain payments and to collect and provide to the United States tax authorities substantial information regarding United States account holders of such institution (which includes certain equity and debt holders of such institution, as well as certain account holders that are foreign entities with United States owners). The legislation also will generally impose a United States federal withholding tax of 30% on dividends and the gross proceeds of a disposition of our common stock paid after December 31, 2012 to a non-financial foreign entity unless such entity provides the withholding agent with a certification identifying the direct and indirect United States owners of the entity. The scope of these requirements remains unclear and potentially subject to material changes resulting from any future guidance. Under certain circumstances, a non-United States holder might be eligible for refunds or credits of such taxes. Prospective investors are encouraged to consult with their own tax advisors regarding the possible implications of this legislation on their investment in our common stock. Non-U.S. holders are urged to consult their own advisors about the new requirements and the effect that such new requirements may have on them.
139
Table of Contents
Under the terms and subject to the conditions contained in an underwriting agreement dated , 2010, the selling stockholders have agreed to sell to the underwriters named below, for whom Credit Suisse Securities (USA) LLC, Merrill Lynch, Pierce, Fenner & Smith Incorporated, Morgan Stanley & Co. Incorporated and Oppenheimer & Co. Inc. are acting as representatives (the “Representatives”), the following respective numbers of shares of common stock:
| Underwriter | Number of Shares | |||
| Credit Suisse Securities (USA) LLC |
||||
| Merrill Lynch, Pierce, Fenner & Smith |
||||
|
Incorporated |
||||
| Morgan Stanley & Co. Incorporated |
||||
| Oppenheimer & Co. Inc. |
||||
| KeyBanc Capital Markets Inc. |
||||
| UBS Securities LLC |
||||
|
Total |
||||
The underwriting agreement provides that the underwriters are obligated to purchase all the shares of common stock in the offering if any are purchased, other than those shares covered by the over-allotment option described below.
The selling stockholders have granted the underwriters the right to purchase shares of common stock on the same terms and conditions as set forth above if the underwriters sell more than shares of common stock in this offering. The underwriters can exercise this right at any time and from time to time, in whole or in part, within 30 days after the offering.
The underwriters propose to offer the shares of common stock initially at the public offering price on the cover page of this prospectus and to selling group members at that price less a selling concession of $ per share. After the initial offering of the shares of common stock the underwriters may change the public offering price and concession and discount to broker/dealers.
The following table summarizes the compensation and estimated expenses we will pay:
| Per Share | Total | |||||||
| Without Over- allotment |
With Over- allotment |
Without Over- allotment |
With Over- allotment | |||||
| Underwriting Discounts and Commissions paid by the selling stockholders |
||||||||
| Expenses payable by the selling stockholders |
||||||||
The underwriters have informed us that they do not expect sales to accounts over which the underwriters have discretionary authority to exceed 5% of the shares of common stock being offered.
The selling stockholders will receive all of the proceeds from this offering and we will not receive any proceeds from the sale of shares in this offering.
We and the selling stockholders have agreed that we will not offer, sell, contract to sell, pledge or otherwise dispose of, directly or indirectly, or file with the Securities and Exchange Commission a registration statement under the Securities Act of 1933 (the “Securities Act”) relating to, any shares of our common stock or securities convertible into or exchangeable or exercisable for any shares of our common stock, or publicly disclose the intention to make any offer, sale, pledge, disposition or filing, without the prior written consent of Credit Suisse
140
Table of Contents
Securities (USA) LLC, Merrill Lynch, Pierce, Fenner & Smith Incorporated and Morgan Stanley & Co. Incorporated for a period of 90 days after the date of this prospectus, except issuances pursuant to the exercise of options issued pursuant to compensation plans for directors and executive officers approved by our board of directors prior to this offering or pursuant to a dividend reinvestment plan. However, in the event that either (1) during the last 17 days of the “lock-up” period, we release earnings results or material news or a material event relating to us occurs or (2) prior to the expiration of the “lock-up” period, we announce that we will release earnings results during the 16-day period beginning on the last day of the ‘lock-up’ period, then in either case the expiration of the “lock-up” will be extended until the expiration of the 18-day period beginning on the date of the release of the earnings results or the occurrence of the material news or event, as applicable, unless Credit Suisse Securities (USA) LLC, Merrill Lynch, Pierce, Fenner & Smith Incorporated and Morgan Stanley & Co. Incorporated waive, in writing, such an extension.
We and the selling stockholders have agreed to indemnify the several underwriters against liabilities under the Securities Act, or contribute to payments that the underwriters may be required to make in that respect. We and the selling stockholders have agreed to contribute to payments made by the underwriters for liabilities under the Securities Act if our indemnification of such liabilities is unavailable or insufficient to hold harmless the underwriters.
Our common stock is listed on the New York Stock Exchange under the Symbol. Our common stock is listed on the New York Stock Exchange under the symbol “KRA.” On September 17, 2010 the closing price of our common stock as reported on the New York Stock Exchange was $29.72.
In connection with the offering the underwriters may engage in stabilizing transactions, over-allotment transactions, syndicate covering transactions and penalty bids in accordance with Regulation M under the Securities Exchange Act of 1934 (the “Exchange Act”).
| • | Stabilizing transactions permit bids to purchase the underlying security so long as the stabilizing bids do not exceed a specified maximum. |
| • | Over-allotment involves sales by the underwriters of shares in excess of the number of shares the underwriters are obligated to purchase, which creates a syndicate short position. The short position may be either a covered short position or a naked short position. In a covered short position, the number of shares over-allotted by the underwriters is not greater than the number of shares that they may purchase in the over-allotment option. In a naked short position, the number of shares involved is greater than the number of shares in the over-allotment option. The underwriters may close out any covered short position by either exercising their over-allotment option and/or purchasing shares in the open market. |
| • | Syndicate covering transactions involve purchases of the common stock in the open market after the distribution has been completed in order to cover syndicate short positions. In determining the source of shares to close out the short position, the underwriters will consider, among other things, the price of shares available for purchase in the open market as compared to the price at which they may purchase shares through the over-allotment option. If the underwriters sell more shares than could be covered by the over-allotment option, a naked short position, the position can only be closed out by buying shares in the open market. A naked short position is more likely to be created if the underwriters are concerned that there could be downward pressure on the price of the shares in the open market after pricing that could adversely affect investors who purchase in the offering. |
| • | Penalty bids permit the underwriting syndicate to reclaim a selling concession from a syndicate member when the common stock originally sold by the syndicate member is purchased in a stabilizing or syndicate covering transaction to cover syndicate short positions. |
| • | In passive market making, market makers in the common stock who are underwriters or prospective underwriters may, subject to limitations, make bids for or purchases of our common stock until the time, if any, at which a stabilizing bid is made. |
141
Table of Contents
These stabilizing transactions, syndicate covering transactions and penalty bids may have the effect of raising or maintaining the market price of our common stock or preventing or retarding a decline in the market price of the common stock. As a result the price of our common stock may be higher than the price that might otherwise exist in the open market. These transactions may be effected on the New York Stock Exchange and if commenced, may be discontinued at any time.
A prospectus in electronic format may be made available on the web sites maintained by one or more of the underwriters, or selling group members, if any, participating in this offering and one or more of the underwriters participating in this offering may distribute prospectuses electronically. The Representatives may agree to allocate a number of shares to underwriters and selling group members for sale to their online brokerage account holders. Internet distributions will be allocated by the underwriters and selling group members that will make internet distributions on the same basis as other allocations.
The underwriters and their respective affiliates are full service financial institutions engaged in various activities, which may include securities trading, commercial and investment banking, financial advisory, investment management, principal investment, hedging, financing and brokerage activities. Certain of the underwriters and their respective affiliates have, from time to time, performed, and may in the future perform, various financial advisory and investment banking services for the issuer, for which they received or will receive customary fees and expenses.
In the ordinary course of their various business activities, the underwriters and their respective affiliates may make or hold a broad array of investments and actively trade debt and equity securities (or related derivative securities) and financial instruments (including bank loans) for their own account and for the accounts of their customers and may at any time hold long and short positions in such securities and instruments. Such investment and securities activities may involve securities and instruments of the issuer. UBS Securities LLC holds a 0.22% proprietary interest in TPG Partners III, LP, a principal and selling stockholder.
European Selling Restrictions
European Economic Area
In relation to each member state of the European Economic Area that has implemented the Prospectus Directive (each, a relevant member state), with effect from and including the date on which the Prospectus Directive is implemented in that relevant member state (the relevant implementation date), an offer of common stock described in this prospectus may not be made to the public in that relevant member state prior to the publication of a prospectus in relation to our common stock that has been approved by the competent authority in that relevant member state or, where appropriate, approved in another relevant member state and notified to the competent authority in that relevant member state, all in accordance with the Prospectus Directive, except that, with effect from and including the relevant implementation date, an offer of securities may be offered to the public in that relevant member state at any time:
| • | to any legal entity that is authorized or regulated to operate in the financial markets or, if not so authorized or regulated, whose corporate purpose is solely to invest in securities; or |
| • | to any legal entity that has two or more of (1) an average of at least 250 employees during the last financial year, (2) a total balance sheet of more than €43,000,000 and (3) an annual net turnover of more than €50,000,000, as shown in its last annual or consolidated accounts; or |
| • | to fewer than 100 natural or legal persons (other than qualified investors as defined in the Prospectus Directive) subject to obtaining the prior consent of Credit Suisse Securities (USA) LLC, Merrill Lynch, Pierce, Fenner & Smith Incorporated and Morgan Stanley & Co. Incorporated for any such offer; or |
| • | in any other circumstances that do not require the publication of a prospectus pursuant to Article 3 of the Prospectus Directive. |
142
Table of Contents
Each purchaser of common stock described in this prospectus located within a relevant member state will be deemed to have represented, acknowledged and agreed that it is a “qualified investor” within the meaning of Article 2(1)(e) of the Prospectus Directive.
For purposes of this provision, the expression an “offer to the public” in any relevant member state means the communication in any form and by any means of sufficient information on the terms of the offer and the securities to be offered so as to enable an investor to decide to purchase or subscribe the securities, as the expression may be varied in that member state by any measure implementing the Prospectus Directive in that member state, and the expression “Prospectus Directive” means Directive 2003/71/EC and includes any relevant implementing measure in each relevant member state.
The sellers of our common stock have not authorized and do not authorize the making of any offer of common stock through any financial intermediary on their behalf, other than offers made by the underwriters with a view to the final placement of our common stock as contemplated in this prospectus. Accordingly, no purchaser of our common stock, other than underwriters, is authorized to make any further offer of our common stock on behalf of the sellers or the underwriters.
United Kingdom
This prospectus is only being distributed to, and is only directed at, persons in the United Kingdom that are qualified investors within the meaning of Article 2(1)(e) of the Prospectus Directive (Qualified Investors) that are also (i) investment professionals falling within Article 19(5) of the Financial Services and Markets Act 2000 (Financial Promotion) Order 2005 (the Order) or (ii) high net worth entities, and other persons to whom it may lawfully be communicated, falling within Article 49(2)(a) to (d) of the Order (all such persons together being referred to as relevant persons). This prospectus and its contents are confidential and should not be distributed, published or reproduced (in whole or in part) or disclosed by recipients to any other persons in the United Kingdom. Any person in the United Kingdom that is not a relevant persons should not act or rely on this document or any of its contents.
Switzerland
We have not and will not register with the Swiss Financial Market Supervisory Authority (FINMA) as a foreign collective investment scheme pursuant to Article 119 of the Federal Act on Collective Investment Scheme of 23 June 2006, as amended (CISA), and accordingly the shares being offered pursuant to this prospectus have not and will not be approved, and may not be licenseable, with FINMA. Therefore, the shares have not been authorized for distribution by FINMA as a foreign collective investment scheme pursuant to Article 119 CISA and the shares offered hereby may not be offered to the public (as this term is defined in Article 3 CISA) in or from Switzerland. The shares may solely be offered to “qualified investors,” as this term is defined in Article 10 CISA, and in the circumstances set out in Article 3 of the Ordinance on Collective Investment Scheme of 22 November 2006, as amended (CISO), such that there is no public offer. Investors, however, do not benefit from protection under CISA or CISO or supervision by FINMA. This prospectus and any other materials relating to the shares are strictly personal and confidential to each offeree and do not constitute an offer to any other person. This prospectus may only be used by those qualified investors to whom it has been handed out in connection with the offer described herein and may neither directly or indirectly be distributed or made available to any person or entity other than its recipients. It may not be used in connection with any other offer and shall in particular not be copied and/or distributed to the public in Switzerland or from Switzerland. This prospectus does not constitute an issue prospectus as that term is understood pursuant to Article 652a and/or 1156 of the Swiss Federal Code of Obligations. We have not applied for a listing of the shares on the SIX Swiss Exchange or any other regulated securities market in Switzerland, and consequently, the information presented in this prospectus does not necessarily comply with the information standards set out in the listing rules of the SIX Swiss Exchange and corresponding prospectus schemes annexed to the listing rules of the SIX Swiss Exchange.
143
Table of Contents
Hong Kong, Singapore and Japan Selling Restrictions
Hong Kong
The notes may not be offered or sold by means of any document other than (i) in circumstances which do not constitute an offer to the public within the meaning of the Companies Ordinance (Cap.32, Laws of Hong Kong), or (ii) to “professional investors” within the meaning of the Securities and Futures Ordinance (Cap.571, Laws of Hong Kong) and any rules made thereunder, or (iii) in other circumstances which do not result in the document being a “prospectus” within the meaning of the Companies Ordinance (Cap.32, Laws of Hong Kong), and no advertisement, invitation or document relating to the notes may be issued or may be in the possession of any person for the purpose of issue (in each case whether in Hong Kong or elsewhere), which is directed at, or the contents of which are likely to be accessed or read by, the public in Hong Kong (except if permitted to do so under the laws of Hong Kong) other than with respect to notes which are or are intended to be disposed of only to persons outside Hong Kong or only to “professional investors” within the meaning of the Securities and Futures Ordinance (Cap. 571, Laws of Hong Kong) and any rules made thereunder.
Singapore
This offering circular has not been registered as a prospectus with the Monetary Authority of Singapore. Accordingly, this offering circular and any other document or material in connection with the offer or sale, or invitation for subscription or purchase, of the notes may not be circulated or distributed, nor may the notes be offered or sold, or be made the subject of an invitation for subscription or purchase, whether directly or indirectly, to persons in Singapore other than (i) to an institutional investor under Section 274 of the Securities and Futures Act, Chapter 289 of Singapore (the “SFA”), (ii) to a relevant person, or any person pursuant to Section 275(1A), and in accordance with the conditions, specified in Section 275 of the SFA or (iii) otherwise pursuant to, and in accordance with the conditions of, any other applicable provision of the SFA.
Where the notes are subscribed or purchased under Section 275 by a relevant person which is: (a) a corporation (which is not an accredited investor) the sole business of which is to hold investments and the entire share capital of which is owned by one or more individuals, each of whom is an accredited investor; or (b) a trust (where the trustee is not an accredited investor) whose sole purpose is to hold investments and each beneficiary is an accredited investor, shares, debentures and units of shares and debentures of that corporation or the beneficiaries’ rights and interest in that trust shall not be transferable for 6 months after that corporation or that trust has acquired the notes under Section 275 except: (1) to an institutional investor under Section 274 of the SFA or to a relevant person, or any person pursuant to Section 275(1A), and in accordance with the conditions, specified in Section 275 of the SFA; (2) where no consideration is given for the transfer; or (3) by operation of law.
Japan
The securities have not been and will not be registered under the Financial Instruments and Exchange Law of Japan (the Financial Instruments and Exchange Law) and each Initial Purchaser has agreed that it will not offer or sell any securities, directly or indirectly, in Japan or to, or for the benefit of, any resident of Japan (which term as used herein means any person resident in Japan, including any corporation or other entity organized under the laws of Japan), or to others for re-offering or resale, directly or indirectly, in Japan or to a resident of Japan, except pursuant to an exemption from the registration requirements of, and otherwise in compliance with, the Financial Instruments and Exchange Law and any other applicable laws, regulations and ministerial guidelines of Japan.
144
Table of Contents
Israel
In the State of Israel, the securities offered hereby may not be offered to any person or entity other than the following:
(a) a fund for joint investments in trust (i.e., mutual fund), as such term is defined in the Law for Joint Investments in Trust, 5754-1994, or a management company of such a fund;
(b) a provident fund as defined in Section 47(a)(2) of the Income Tax Ordinance of the State of Israel, or a management company of such a fund;
(c) an insurer, as defined in the Law for Oversight of Insurance Transactions, 5741-1981, (d) a banking entity or satellite entity, as such terms are defined in the Banking Law (Licensing), 5741-1981, other than a joint services company, acting for their own account or fro the account of investors of the type listed in Section 15A(b) of the Securities Law 1968;
(d) a company that is licensed as a portfolio manager, as such term is defined in Section 8(b) of the Law for the Regulation of Investment Advisors and Portfolio Managers, 5755-1995, acting on its own account or for the account of investors of the type listed in Section 15A(b) of the Securities Law 1968;
(e) a company that is licensed as an investment advisor, as such term is defined in Section 7(c) of the Law for the Regulation of Investment Advisors and Portfolio Managers, 5755-1995, acting on its own account;
(f) a company that is a member of the Tel Aviv Stock Exchange, acting on its own account or for the account of investors of the type listed in Section 15A(b) of the Securities Law 1968;
(g) an underwriter fulfilling the conditions of Section 56(c) of the Securities Law, 5728-1968;
(h) a venture capital fund (defined as an entity primarily involved in investments in companies which, at the time of investment, (i) are primarily engaged in research and development or manufacture of new technological products or processes and (ii) involve above-average risk);
(i) an entity primarily engaged in capital markets activities in which all of the equity owners meet one or more of the above criteria; and
(j) an entity, other than an entity formed for the purpose of purchasing securities in this offering, in which the shareholders equity (including pursuant to foreign accounting rules, international accounting regulations and U.S. generally accepted accounting rules, as defined in the Securities Law Regulations (Preparation of Annual Financial Statements), 1993) is in excess of NIS 250 million.
Any offeree of the securities offered hereby in the State of Israel shall be required to submit written confirmation that it falls within the scope of one of the above criteria. This prospectus will not be distributed or directed to investors in the State of Israel who do not fall within one of the above criteria.
NOTICE TO CANADIAN RESIDENTS
Resale Restrictions
The distribution of the shares in Canada is being made only on a private placement basis exempt from the requirement that we and the selling stockholders prepare and file a prospectus with the securities regulatory authorities in each province where trades of shares are made. Any resale of the shares in Canada must be made under applicable securities laws which may vary depending on the relevant jurisdiction, and which may require resales to be made under available statutory exemptions or under a discretionary exemption granted by the applicable Canadian securities regulatory authority. Purchasers are advised to seek legal advice prior to any resale of the shares.
145
Table of Contents
Representations of Purchasers
By purchasing shares in Canada and accepting delivery of a purchase confirmation, a purchaser is representing to us, the selling stockholders and the dealer from whom the purchase confirmation is received that:
| • | the purchaser is entitled under applicable provincial securities laws to purchase the shares without the benefit of a prospectus qualified under those securities laws as it is an “accredited investor” as defined under National Instrument 45-106—Prospectus and Registration Exemptions, |
| • | the purchaser is a “permitted client” as defined in National Instrument 31-103—Registration Requirements and Exemptions, |
| • | where required by law, the purchaser is purchasing as principal and not as agent, |
| • | the purchaser has reviewed the text above under “Resale Restrictions”, and |
| • | the purchaser acknowledges and consents to the provision of specified information concerning the purchase of the shares to the regulatory authority that by law is entitled to collect the information, including certain personal information. For purchasers in Ontario, questions about such indirect collection of personal information should be directed to Administrative Support Clerk, Suite 1903, Box 55, 20 Queen Street West, Toronto, Ontario M5H 3S8 or to (416) 593-3684. |
Rights of Action—Ontario Purchasers
Under Ontario securities legislation, certain purchasers who purchase a security offered by this document during the period of distribution will have a statutory right of action for damages, or while still the owner of the shares, for rescission against us and the selling stockholders in the event that this document contains a misrepresentation without regard to whether the purchaser relied on the misrepresentation. The right of action for damages is exercisable not later than the earlier of 180 days from the date the purchaser first had knowledge of the facts giving rise to the cause of action and three years from the date on which payment is made for the shares. The right of action for rescission is exercisable not later than 180 days from the date on which payment is made for the shares. If a purchaser elects to exercise the right of action for rescission, the purchaser will have no right of action for damages against us and the selling stockholders. In no case will the amount recoverable in any action exceed the price at which the shares were offered to the purchaser and if the purchaser is shown to have purchased the securities with knowledge of the misrepresentation, we and the selling stockholders will have no liability. In the case of an action for damages, we and the selling stockholders will not be liable for all or any portion of the damages that are proven to not represent the depreciation in value of the shares as a result of the misrepresentation relied upon. These rights are in addition to, and without derogation from, any other rights or remedies available at law to an Ontario purchaser. The foregoing is a summary of the rights available to an Ontario purchaser. Ontario purchasers should refer to the complete text of the relevant statutory provisions.
Enforcement of Legal Rights
All of our directors and officers as well as the experts named herein and the selling stockholders may be located outside of Canada and, as a result, it may not be possible for Canadian purchasers to effect service of process within Canada upon us or those persons. All or a substantial portion of our assets and the assets of those persons may be located outside of Canada and, as a result, it may not be possible to satisfy a judgment against us or those persons in Canada or to enforce a judgment obtained in Canadian courts against us or those persons outside of Canada.
Taxation and Eligibility for Investment
Canadian purchasers of shares should consult their own legal and tax advisors with respect to the tax consequences of an investment in the shares in their particular circumstances and about the eligibility of the investment by the purchaser under relevant Canadian legislation.
146
Table of Contents
Notice to Prospective Investors in the Dubai International Financial Centre
This document relates to an exempt offer in accordance with the Offered Securities Rules of the Dubai Financial Services Authority. This document is intended for distribution only to persons of a type specified in those rules. It must not be delivered to, or relied on by, any other person. The Dubai Financial Services Authority has no responsibility for reviewing or verifying any documents in connection with exempt offers. The Dubai Financial Services Authority has not approved this document nor taken steps to verify the information set out in it, and has no responsibility for it. The shares which are the subject of the offering contemplated by this prospectus may be illiquid and/or subject to restrictions on their resale. Prospective purchasers of the shares offered should conduct their own due diligence on the shares. If you do not understand the contents of this document you should consult an authorized financial adviser.
147
Table of Contents
Cleary Gottlieb Steen & Hamilton LLP will pass upon the legality of the shares of common stock sold in this offering. Certain partners of Cleary Gottlieb Steen & Hamilton LLP are members of a limited liability company that is an investor in one or more investment funds advised by TPG Capital, L.P., including investment funds that own a beneficial equity interest in the company. Cleary Gottlieb Steen & Hamilton LLP represents entities affiliated with TPG Capital, L.P. and its affiliates in connection with legal matters. Certain legal matters in connection with this offering will be passed upon for the underwriters by Latham & Watkins LLP, New York, New York.
The consolidated financial statements and schedule of Kraton Performance Polymers, Inc. as of December 31, 2009 and 2008, and for each of the years in the three-year period ended December 31, 2009, have been included herein in reliance upon the reports of KPMG LLP, independent registered public accounting firm, appearing elsewhere herein, and upon the authority of said firm as experts in accounting and auditing.
WHERE YOU CAN FIND MORE INFORMATION
We have filed with the SEC a registration statement on Form S-1 under the Securities Act, with respect to our common stock offered by this prospectus. This prospectus, which forms part of the registration statement, does not contain all of the information set forth in the registration statement and the exhibits to the registration statement. Some items are omitted in accordance with the rules and regulations of the SEC. For further information about us and our common stock, we refer you to the registration statement and the exhibits to the registration statement filed as part of the registration statement. You may read and copy the registration statement, including the exhibits to the registration statement, at the SEC’s Public Reference Room at 100 F Street, N.E., Washington, D.C. 20549. You can obtain information on the operation of the Public Reference Room by calling the SEC at 1-800-SEC-0330. In addition, the SEC maintains an internet site at www.sec.gov, from which you can electronically access the registration statement, including the exhibits to the registration statement.
We are subject to the full informational requirements of the Exchange Act, and as a result, file periodic reports, proxy statements and other information with the SEC. We also furnish our stockholders with annual reports containing financial statements that have been examined and reported on, with an opinion expressed by an independent registered public accounting firm. We maintain a web site at www.kraton.com. Information about us, including our reports filed with the SEC, is available through that site. Such reports are accessible at no charge through our web site and are made available as soon as reasonably practicable after such material is filed with or furnished to the SEC. Our web site and the information contained on that site, or connected to that site, are not incorporated by reference into this prospectus.
148
Table of Contents
INCORPORATION OF CERTAIN INFORMATION BY REFERENCE
We are allowed to “incorporate by reference” the information contained in documents that we have filed with the SEC, which means that we can disclose important information to you by referring you to those documents. The information incorporated by reference is considered to be part of this prospectus. We hereby incorporate by reference the documents listed below:
| • | our annual report on Form 10-K for the fiscal year ended December 31, 2009 as filed on March 15, 2010, as subsequently amended by our Form 10-K/A filed on March 31, 2010; |
| • | our quarterly reports on Form 10-Q for the quarterly period ended March 31, 2010 as filed on May 5, 2010 and for the quarterly period ended June 30, 2010 as filed on August 4, 2010; |
| • | our current reports on Form 8-K as filed on February 9, 2010 and June 2, 2010; and |
| • | our proxy statement on Schedule 14A as filed on April 13, 2010. |
Any information incorporated or deemed to be incorporated by reference shall be deemed to be modified or superseded for purposes of this prospectus to the extent that the information contained in this prospectus modifies or supersedes that information.
You may request a copy of these filings, at no cost, by contacting us at the following:
Secretary
Kraton Performance Polymers, Inc.
15710 John F. Kennedy Blvd.
Suite 300
Houston, Texas 77032
Telephone: (281) 504-4700
We make these filings available through our web site at http://www.kraton.com. Our web site and the information contained on that site, or connected to that site, are not incorporated by reference into this prospectus.
149
Table of Contents
KRATON PERFORMANCE POLYMERS, INC.
INDEX TO CONSOLIDATED FINANCIAL STATEMENTS
| Page | ||
| Audited Consolidated Financial Statements |
||
| F-2 | ||
| Consolidated Balance Sheets as of December 31, 2009 and 2008 |
F-3 | |
| Consolidated Statements of Operations for Years Ended December 31, 2009, 2008 and 2007 |
F-4 | |
| F-5 | ||
| Consolidated Statements of Cash Flows for Years Ended December 31, 2009, 2008 and 2007 |
F-6 | |
| F-7 | ||
| Unaudited Condensed Consolidated Financial Statements |
||
| F-57 | ||
| Condensed Consolidated Balance Sheets as of June 30, 2010 and December 31, 2009 |
F-59 | |
| Condensed Consolidated Statements of Operations for the three months ended June 30, 2010 and 2009 |
F-60 | |
| Condensed Consolidated Statements of Cash Flows for the three months ended June 30, 2010 and 2009 |
F-61 | |
| F-62 | ||
F-1
Table of Contents
REPORT OF INDEPENDENT REGISTERED PUBLIC ACCOUNTING FIRM
The Board of Directors and Stockholders
Kraton Performance Polymers, Inc.:
We have audited the accompanying consolidated balance sheets of Kraton Performance Polymers, Inc. (formerly Polymer Holdings LLC) and subsidiaries as of December 31, 2009 and 2008, and the related consolidated statements of operations, changes in stockholders’ and member’s equity and comprehensive income (loss), and cash flows for each of the years in the three-year period ended December 31, 2009. These consolidated financial statements are the responsibility of Kraton Performance Polymers, Inc.’s management. Our responsibility is to express an opinion on these consolidated financial statements based on our audits.
We conducted our audits in accordance with the standards of the Public Company Accounting Oversight Board (United States). Those standards require that we plan and perform the audit to obtain reasonable assurance about whether the financial statements are free of material misstatement. An audit includes examining, on a test basis, evidence supporting the amounts and disclosures in the financial statements. An audit also includes assessing the accounting principles used and significant estimates made by management, as well as evaluating the overall financial statement presentation. We believe that our audits provide a reasonable basis for our opinion.
In our opinion, the consolidated financial statements referred to above present fairly, in all material respects, the financial position of Kraton Performance Polymers, Inc. and subsidiaries as of December 31, 2009 and 2008, and the results of their operations and their cash flows for each of the years in the three-year period ended December 31, 2009, in conformity with U.S. generally accepted accounting principles.
/s/ KPMG LLP
Houston, Texas
March 15, 2010
F-2
Table of Contents
KRATON PERFORMANCE POLYMERS, INC.
CONSOLIDATED BALANCE SHEETS
(In thousands, except par value)
| December 31, 2009 |
December
31, 2008 | ||||||
| ASSETS |
|||||||
| Current Assets |
|||||||
| Cash and cash equivalents |
$ | 69,291 | $ | 101,396 | |||
| Receivables, net of allowances of $1,335 and $2,512 |
115,329 | 95,443 | |||||
| Inventories of products, net |
284,258 | 324,193 | |||||
| Inventories of materials and supplies, net |
10,862 | 11,055 | |||||
| Deferred income taxes |
3,107 | 14,778 | |||||
| Other current assets |
16,770 | 6,769 | |||||
| Total current assets |
499,617 | 553,634 | |||||
| Property, plant and equipment, less accumulated depreciation of $236,558 and $182,252 |
354,860 | 372,008 | |||||
| Identifiable intangible assets, less accumulated amortization of $42,741 and $36,169 |
75,801 | 67,051 | |||||
| Investment in unconsolidated joint venture |
12,078 | 12,371 | |||||
| Deferred financing costs |
7,318 | 8,184 | |||||
| Other long-term assets |
24,825 | 18,626 | |||||
| Total Assets |
$ | 974,499 | $ | 1,031,874 | |||
| LIABILITIES AND STOCKHOLDERS’ AND MEMBER’S EQUITY |
|||||||
| Current Liabilities |
|||||||
| Current portion of long-term debt |
$ | 2,304 | $ | 3,343 | |||
| Accounts payable-trade |
93,494 | 75,177 | |||||
| Other payables and accruals |
68,271 | 69,349 | |||||
| Due to related party |
19,006 | 25,585 | |||||
| Total current liabilities |
183,075 | 173,454 | |||||
| Long-term debt, net of current portion |
382,675 | 571,973 | |||||
| Deferred income taxes |
13,488 | 34,954 | |||||
| Long-term liabilities |
46,477 | 63,117 | |||||
| Total Liabilities |
625,715 | 843,498 | |||||
| Commitments and contingencies (note 8) |
|||||||
| Stockholders’ and Member’s equity |
|||||||
| Preferred stock, $0.01 par value; 100,000 shares authorized; none issued |
|||||||
| Common stock, $0.01 par value; 500,000 shares authorized; 29,709 shares issued and outstanding |
297 | — | |||||
| Additional paid in capital |
311,665 | — | |||||
| Member’s equity |
— | 182,553 | |||||
| Retained earnings |
(14 | ) | — | ||||
| Accumulated other comprehensive income |
36,836 | 5,823 | |||||
| Total stockholders’ and member’s equity |
348,784 | 188,376 | |||||
| Total Liabilities and Stockholders’ and Member’s Equity |
$ | 974,499 | $ | 1,031,874 | |||
See Notes to Consolidated Financial Statements
F-3
Table of Contents
KRATON PERFORMANCE POLYMERS, INC.
CONSOLIDATED STATEMENTS OF OPERATIONS
(In thousands, except per share data)
| Years ended December 31, | |||||||||||
| 2009 | 2008 | 2007 | |||||||||
| Operating Revenues |
|||||||||||
| Sales |
$ | 920,362 | $ | 1,171,253 | $ | 1,066,044 | |||||
| Other |
47,642 | 54,780 | 23,543 | ||||||||
| Total operating revenues |
968,004 | 1,226,033 | 1,089,587 | ||||||||
| Cost of Goods Sold |
792,472 | 971,283 | 938,556 | ||||||||
| Gross Profit |
175,532 | 254,750 | 151,031 | ||||||||
| Operating Expenses |
|||||||||||
| Research and development |
21,212 | 27,049 | 24,865 | ||||||||
| Selling, general and administrative |
79,504 | 101,431 | 69,020 | ||||||||
| Depreciation and amortization of identifiable intangibles |
66,751 | 53,162 | 51,917 | ||||||||
| Total operating expenses |
167,467 | 181,642 | 145,802 | ||||||||
| Gain on Extinguishment of Debt |
23,831 | — | — | ||||||||
| Equity in Earnings of Unconsolidated Joint Venture |
403 | 437 | 626 | ||||||||
| Interest Expense, net |
33,956 | 36,695 | 43,484 | ||||||||
| Income (Loss) Before Income Taxes |
(1,657 | ) | 36,850 | (37,629 | ) | ||||||
| Income Tax Expense (Benefit) |
(1,367 | ) | 8,431 | 6,120 | |||||||
| Net Income (Loss) |
$ | (290 | ) | $ | 28,419 | $ | (43,749 | ) | |||
| Earnings (Loss) per common share |
|||||||||||
| Basic |
$ | (0.01 | ) | $ | 1.46 | $ | (2.26 | ) | |||
| Diluted |
$ | (0.01 | ) | $ | 1.46 | $ | (2.26 | ) | |||
| Weighted average common shares outstanding |
|||||||||||
| Basic |
19,844 | 19,406 | 19,375 | ||||||||
| Diluted |
19,844 | 19,483 | 19,375 | ||||||||
See Notes to Consolidated Financial Statements
F-4
Table of Contents
KRATON PERFORMANCE POLYMERS, INC.
CONSOLIDATED STATEMENTS OF CHANGES IN STOCKHOLDERS’ AND MEMBER’S EQUITY AND COMPREHENSIVE INCOME (LOSS)
(In thousands)
| Common Stock |
Additional Paid in Capital |
Retained Earnings (post 12/17/2009) |
Common Equity (pre 12/17/2009) |
Accumulated Other Comprehensive Income (Loss) |
Total | |||||||||||||||||
| December 31, 2006 |
$ | — | $ | — | $ | — | $ | 183,918 | $ | 15,630 | $ | 199,548 | ||||||||||
| Net loss |
— | — | — | (43,749 | ) | — | (43,749 | ) | ||||||||||||||
| Other comprehensive loss |
||||||||||||||||||||||
| Foreign currency translation adjustments, net of tax |
— | — | — | — | 21,457 | 21,457 | ||||||||||||||||
| Realized loss on interest rate swaps, net of tax |
— | — | — | — | (1,863 | ) | (1,863 | ) | ||||||||||||||
| Decrease in pension liability, net of deferred tax liability of $1,800 |
— | — | — | — | 4,337 | 4,337 | ||||||||||||||||
| Total comprehensive loss |
(19,818 | ) | ||||||||||||||||||||
| Non-cash compensation related to equity awards |
— | — | — | 2,781 | — | 2,781 | ||||||||||||||||
| December 31, 2007 |
— | — | — | 142,950 | 39,561 | 182,511 | ||||||||||||||||
| Net income |
— | — | — | 28,419 | — | 28,419 | ||||||||||||||||
| Other comprehensive loss |
||||||||||||||||||||||
| Foreign currency translation adjustments, net of tax |
— | — | — | — | 5,396 | 5,396 | ||||||||||||||||
| Net unrealized loss on interest rate swaps |
— | — | — | — | (858 | ) | (858 | ) | ||||||||||||||
| Reclassification of interest rate swaps into earnings |
— | — | — | — | (1,326 | ) | (1,326 | ) | ||||||||||||||
| Increase in pension liability, net of tax |
— | — | — | — | (36,950 | ) | (36,950 | ) | ||||||||||||||
| Total comprehensive loss |
(5,319 | ) | ||||||||||||||||||||
| Cash contribution from member |
— | — | — | 10,000 | — | 10,000 | ||||||||||||||||
| Non-cash compensation related to equity awards |
— | — | — | 1,184 | — | 1,184 | ||||||||||||||||
| December 31, 2008 |
— | — | — | 182,553 | 5,823 | 188,376 | ||||||||||||||||
| Net loss |
— | — | (14 | ) | (276 | ) | — | (290 | ) | |||||||||||||
| Other comprehensive income |
||||||||||||||||||||||
| Foreign currency translation adjustments, net of tax |
— | — | — | — | 14,023 | 14,023 | ||||||||||||||||
| Net unrealized loss on interest rate swaps |
— | — | — | — | 3,158 | 3,158 | ||||||||||||||||
| Reclassification of interest rate swaps into earnings |
— | — | — | — | (2,827 | ) | (2,827 | ) | ||||||||||||||
| Increase in pension liability, net of tax |
— | — | — | — | 16,659 | 16,659 | ||||||||||||||||
| Total comprehensive income |
30,723 | |||||||||||||||||||||
| Non-cash compensation related to equity awards |
— | — | — | 2,160 | — | 2,160 | ||||||||||||||||
| Liquidation of Kraton Polymers Management LLC |
— | — | — | (1,760 | ) | — | (1,760 | ) | ||||||||||||||
| Non-cash contribution from member |
— | — | — | 2,560 | — | 2,560 | ||||||||||||||||
| Equity conversion—December 16, 2009 |
194 | 185,043 | — | (185,237 | ) | — | — | |||||||||||||||
| Public stock offering, December 17, 2009 |
103 | 126,622 | — | — | — | 126,725 | ||||||||||||||||
| December 31, 2009 |
$ | 297 | $ | 311,665 | $ | (14 | ) | — | $ | 36,836 | $ | 348,784 | ||||||||||
See Notes to Consolidated Financial Statements
F-5
Table of Contents
KRATON PERFORMANCE POLYMERS, INC.
CONSOLIDATED STATEMENTS OF CASH FLOWS
(In thousands)
| Years ended December 31, | ||||||||||||
| 2009 | 2008 | 2007 | ||||||||||
| CASH FLOWS FROM OPERATING ACTIVITIES |
||||||||||||
| Net income (loss) |
$ | (290 | ) | $ | 28,419 | $ | (43,749 | ) | ||||
| Adjustments to reconcile net income (loss) to net cash provided by operating activities: |
||||||||||||
| Depreciation and amortization of identifiable intangibles |
66,751 | 53,162 | 51,917 | |||||||||
| Accretion of debt discount |
5 | 24 | 24 | |||||||||
| Inventory impairment |
1,769 | 8,100 | — | |||||||||
| Amortization of deferred financing costs |
4,090 | 2,139 | 2,715 | |||||||||
| Loss on disposal of fixed assets |
348 | 184 | 274 | |||||||||
| Gain on extinguishment of debt |
(23,831 | ) | — | — | ||||||||
| Change in fair value of interest rate swaps |
(2,827 | ) | (1,378 | ) | (1,553 | ) | ||||||
| Distributed (undistributed) earnings in unconsolidated joint venture |
30 | 604 | (520 | ) | ||||||||
| Deferred income tax expense (benefit) |
(4,623 | ) | (5,445 | ) | 1,519 | |||||||
| Non-cash compensation related to equity awards |
2,160 | 1,184 | 2,781 | |||||||||
| Decrease (increase) in |
||||||||||||
| Accounts receivable |
(16,680 | ) | 42,815 | 8,710 | ||||||||
| Due to/from related party |
(6,180 | ) | (6,007 | ) | 14,704 | |||||||
| Inventories of products, materials and supplies |
44,060 | (86,738 | ) | 17,793 | ||||||||
| Other assets |
(305 | ) | (1,377 | ) | (1,525 | ) | ||||||
| Increase in |
||||||||||||
| Accounts payable-trade, other payables and accruals, and long-term |
8,328 | 4,541 | 28,647 | |||||||||
| Net cash provided by operating activities |
72,805 | 40,227 | 81,737 | |||||||||
| CASH FLOWS FROM INVESTING ACTIVITIES |
||||||||||||
| Purchase of property, plant and equipment |
(38,101 | ) | (24,093 | ) | (28,713 | ) | ||||||
| Purchase of software |
(15,322 | ) | — | — | ||||||||
| Proceeds from sale of property, plant and equipment |
3,870 | 26 | 43 | |||||||||
| Net cash used in investing activities |
(49,553 | ) | (24,067 | ) | (28,670 | ) | ||||||
| CASH FLOWS FROM FINANCING ACTIVITIES |
||||||||||||
| Proceeds from debt |
144,000 | 316,250 | 48,500 | |||||||||
| Repayment of debt |
(308,131 | ) | (279,644 | ) | (92,148 | ) | ||||||
| Cash contribution from member |
— | 10,000 | — | |||||||||
| Proceeds from issuance of common stock |
126,725 | — | — | |||||||||
| Repayment of insurance note payable |
— | (494 | ) | (245 | ) | |||||||
| Deferred financing costs |
(3,216 | ) | — | — | ||||||||
| Net cash provided by (used in) financing activities |
(40,622 | ) | 46,112 | (43,893 | ) | |||||||
| Effect of exchange rate differences on cash |
(14,735 | ) | (9,153 | ) | (4,498 | ) | ||||||
| Net increase (decrease) in cash and cash equivalents |
(32,105 | ) | 53,119 | 4,676 | ||||||||
| Cash and cash equivalents at beginning of period |
101,396 | 48,277 | 43,601 | |||||||||
| Cash and cash equivalents at end of period |
$ | 69,291 | $ | 101,396 | $ | 48,277 | ||||||
| Supplemental Disclosures |
||||||||||||
| Cash paid during the period for income taxes |
$ | 9,164 | $ | 11,251 | $ | 8,912 | ||||||
| Cash paid during the period for interest |
$ | 34,707 | $ | 39,533 | $ | 37,052 | ||||||
See Notes to Consolidated Financial Statements
F-6
Table of Contents
KRATON PERFORMANCE POLYMERS, INC.
Notes to Consolidated Financial Statements
INDEX
| PAGE | ||
| 1. Summary of Operations and Significant Accounting Policies |
F-7 | |
| F-14 | ||
| F-17 | ||
| F-18 | ||
| F-23 | ||
| F-23 | ||
| F-27 | ||
| F-37 | ||
| F-38 | ||
| F-38 | ||
| F-40 | ||
| F-41 | ||
| F-42 | ||
| F-43 | ||
| 15. Financial Instruments, Hedging Activities and Credit Risk |
F-52 | |
| F-53 | ||
| F-54 |
1. Summary of Operations and Significant Accounting Policies
Organization and Description of Business. Kraton Performance Polymers, Inc., or Kraton Performance Polymers, and its direct and indirect subsidiaries, are, unless the context requires otherwise, collectively referred to herein as “we,” “our,” “us,” “our company” and/or “the Company.” Kraton Performance Polymers is the sole Member and 100% equity owner of Kraton Polymers LLC. As used herein, the term “Kraton” refers to Kraton Polymers LLC, and, unless the context herein requires otherwise, said term shall include the direct and indirect subsidiaries of Kraton Polymers LLC. Kraton Polymers LLC directly or indirectly owns 100% of the equity interests in (1) Elastomers Holdings LLC (holding company of Kraton’s United States (U.S.) operations), (2) K.P. Global Holdings C.V. (holding company of the remainder of our global operations) and (3) Kraton Polymers Capital Corporation (a company with no obligations). We believe we are the world’s leading producer in terms of sales revenues and sales volumes of styrenic block copolymers, or SBCs, a family of performance polymer products whose chemistry we pioneered over 40 years ago. SBCs are highly-engineered synthetic elastomers which enhance the performance of numerous products by delivering a variety of performance-enhancing characteristics, including greater flexibility, resilience, strength, durability and processability, and are a fast growing subset of the elastomers industry. Our polymers are typically formulated or compounded with other products to achieve improved, customer specific performance characteristics in a variety of applications. We manufacture products at five plants globally, including our flagship plant in Belpre, Ohio, the largest and most diversified SBC plant in the world, as well as plants in Germany, France, Brazil, and Japan. The plant in Japan is operated by a unconsolidated manufacturing joint venture.
Corporate History
Prior to February 28, 2001, we operated as a number of business units as a part of Shell Chemicals and did not exist as a stand-alone entity. On February 28, 2001, Ripplewood Chemical Holding LLC, or Ripplewood Chemical, acquired us from Shell Chemicals through a master sale agreement. On December 23, 2003, Polymer Holdings LLC acquired all of Kraton’s outstanding equity interests from Ripplewood Chemical. Prior to our
F-7
Table of Contents
KRATON PERFORMANCE POLYMERS, INC.
Notes to Consolidated Financial Statements—(Continued)
initial public offering and related reorganization transactions, described below, we were a wholly-owned subsidiary of TJ Chemical Holdings LLC and were indirectly owned by certain affiliates of TPG Capital, L.P., which we refer to collectively as “TPG,” and certain affiliates of J.P. Morgan Partners, LLC, which we refer to collectively as “JPMP,” and certain members of our management.
Initial Public Offering
On December 16, 2009, Polymer Holdings, and its consolidated subsidiaries were converted from a Delaware limited liability company to a Delaware corporation and renamed Kraton Performance Polymers, Inc. In addition, prior to the closing of the IPO, TJ Chemical, was merged into (and did not survive the merger with) Kraton. Trading in shares of our common stock on the NYSE commenced on December 17, 2009 under the symbol “KRA”. On December 22, 2009, Kraton Performance Polymers, Inc., the parent and owner of 100% of the membership interests in Kraton closed its IPO. Including 887,082 shares issued on January 7, 2010 following the exercise of the underwriters’ over-allotment option, the aggregate shares issued in connection with the IPO amounted to 11,181,200 shares, at a price of $13.50 per share, and the net proceeds after the underwriting discounts and commissions and fees and expenses amounted to approximately $138.0 million. We used $100.0 million of the net proceeds to prepay outstanding indebtedness, with the balance to be used for general corporate purposes, including to fund strategic capital projects such as alternative production capabilities for Isoprene Rubber or IR, the development of additional capacity in our Isoprene Latex business, and/or the continuation of our upgrade of certain systems and operating controls at our Belpre, Ohio facility. Following the IPO, related reorganization transactions, and the exercise of the underwriters’ over-allotment option TPG, owned approximately 37.6% of our common stock and JPMP, owned approximately 25.1% of our common stock.
Basis of Presentation. The accompanying Consolidated Financial Statements presented herein are for us and our consolidated subsidiaries, each of which is a wholly-owned subsidiary. Polymer Holdings LLC, or Polymer Holdings, and its consolidated subsidiaries are treated as our predecessor entity for financial statement reporting purposes. The Consolidated Financial Statements present our historical financial statements and the historical financial statements of our predecessor. Accordingly the information for periods prior to December 22, 2009, is that of Polymer Holdings. The historical Consolidated Financial Statements presented for the years ended December 31, 2009, 2008 and 2007 and as of December 31, 2009 and 2008 have been derived from our audited consolidated financial statements.
These financial statements reflect all normal recurring adjustments that are, in the opinion of management, necessary to fairly present our results of operations and financial position.
Use of Estimates. The preparation of consolidated financial statements in conformity with accounting principles generally accepted in the United States of America requires management to make estimates and assumptions that affect the reported amounts of assets and liabilities and disclosure of contingent assets and liabilities at the date of the consolidated financial statements and the reported amounts of revenues and expenses during the reporting period. Actual results could differ from those estimates. Significant items subject to such estimates and assumptions include the useful lives of fixed assets; allowances for doubtful accounts and sales returns; the valuation of derivatives, deferred tax assets, property, plant and equipment, inventory, investments and share-based compensation; and liabilities for employee benefit obligations, asset retirement obligations, income tax uncertainties and other contingencies.
Reclassifications. Certain amounts reported in the Consolidated Financial Statements and Notes to Consolidated Financial Statements for the prior periods have been reclassified to conform to the current reporting presentation.
F-8
Table of Contents
KRATON PERFORMANCE POLYMERS, INC.
Notes to Consolidated Financial Statements—(Continued)
Cash and Cash Equivalents. It is our policy to invest our excess cash in investment instruments whose value is not subject to market fluctuations, such as bank deposits or certificates of deposit. Other permitted investments include commercial paper of major U.S. corporations with ratings of A1 by Standard & Poor’s Ratings Group or P1 by Moody’s Investor Services, Inc., loan participations of major U.S. corporations with a short term credit rating of A1/P1 and direct obligations of the U.S. government or its agencies. We consider all investments having a remaining maturity of 3 months or less to be cash equivalents.
Receivables. Receivables are recorded at the invoiced amount and do not bear interest. The allowance for doubtful accounts is our best estimate of the amount of probable credit losses in our existing receivables. We determine the allowance based on historical write-off experience and global economic data. We review the allowance for doubtful accounts quarterly. Past due balances over 90 days and above a specified amount are reviewed individually for collectibility. Account balances are charged off against the allowance after all means of collection have been exhausted and the potential for recovery is considered remote. We do not have any off-balance sheet credit exposure related to our customers.
Inventories. Our inventory is principally comprised of finished goods inventory. Inventories are stated at the lower of cost or market as determined on a first-in, first-out basis. On a quarterly basis, we evaluate the carrying cost of our inventory to ensure that it is stated at the lower of cost or market. Our products are typically not subject to spoiling or obsolescence and consequently our reserves for slow moving and obsolete inventory have historically not been significant. Cash flows from the sale of inventory are reported in cash flows from operations in the consolidated statement of cash flows.
Derivative Instruments and Hedging Activities. We account for derivatives and hedging activities in accordance with FASB ASC Topic 815, Derivatives and Hedging (Statement No. 133, Accounting for Derivative Instruments and Certain Hedging Activities, as amended), which requires entities to recognize all derivative instruments as either assets or liabilities in the balance sheet at their respective fair values. For derivatives designated in cash flow hedging relationships, changes in the fair value are either offset through earnings against the change in fair value of the hedged item attributable to the risk being hedged or recognized in accumulated other comprehensive income, to the extent the derivative is effective at offsetting the changes in cash flows being hedged until the hedged item affects earnings.
For all hedging relationships, we formally document the hedging relationship and our risk-management objective and strategy for undertaking the hedge, the hedging instrument, the hedged transaction, the nature of the risk being hedged, how the hedging instrument’s effectiveness in offsetting the hedged risk will be assessed prospectively and retrospectively, and a description of the method used to measure ineffectiveness. We also formally assesses, both at the inception of the hedging relationship and on an ongoing basis, whether the derivatives that are used in hedging relationships are highly effective in offsetting changes in cash flows of hedged transactions. For derivative instruments that are designated and qualify as part of a cash flow hedging relationship, the effective portion of the gain or loss on the derivative is reported as a component of other comprehensive income and reclassified into earnings in the same period or periods during which the hedged transaction affects earnings. Gains and losses on the derivative representing either hedge ineffectiveness or hedge components excluded from the assessment of effectiveness are recognized in current earnings.
We discontinue hedge accounting prospectively when we determine that the derivative is no longer effective in offsetting cash flows attributable to the hedged risk, the derivative expires or is sold, terminated, or exercised, the cash flow hedge is dedesignated because a forecasted transaction is not probable of occurring, or management determines to remove the designation of the cash flow hedge.
In all situations in which hedge accounting is discontinued and the derivative remains outstanding, we continue to carry the derivative at its fair value on the balance sheet and recognize any subsequent changes in its
F-9
Table of Contents
KRATON PERFORMANCE POLYMERS, INC.
Notes to Consolidated Financial Statements—(Continued)
fair value in earnings. When it is probable that a forecasted transaction will not occur, we discontinue hedge accounting and recognize immediately in earnings gains and losses that were accumulated in other comprehensive income related to the hedging relationship.
Property, Plant and Equipment. Property, plant and equipment are recorded at cost. Major renewals and improvements which extend the useful lives of equipment are capitalized. Repair and maintenance expenses are charged to operations as incurred. Disposals are removed at carrying cost less accumulated depreciation with any resulting gain or loss reflected in operations. We capitalize interest costs which are incurred as part of the cost of constructing major facilities and equipment. We did not record any capitalized interest in any periods presented. Depreciation is provided using the straight-line method over the following average estimated useful lives:
| Machinery and equipment |
20 years | |
| Building and land improvements |
20 years | |
| Computer hardware/information systems |
3 years | |
| Office equipment |
5 years | |
| Research equipment and facilities |
5 years | |
| Vehicles |
5 years |
Major Maintenance Activities. We incur maintenance costs on our major equipment. Repair and maintenance costs are expensed as incurred.
Asset Retirement Obligations. We account for asset retirement obligations pursuant to the provisions of ASC 410-20, “Asset Retirement Obligations.” ASC 410-20 requires us to record the fair value of an asset retirement obligation as a liability in the period in which we incur a legal obligation associated with the retirement of tangible long-lived assets that result from the acquisition, construction, development, and/or normal use of the assets. ASC 410-20 also requires us to record a corresponding asset that is depreciated over the life of the asset. Subsequent to the initial measurement of the asset retirement obligation, the obligation is to be adjusted at the end of each period to reflect the passage of time and changes in the estimated future cash flows underlying the obligation.
We have no assets that are legally restricted for purposes of settling asset retirement obligations. We have determined that we have contractual or regulatory requirements to decommission and perform other remediation for many of our manufacturing facilities and other assets upon retirement. These manufacturing facilities have historically been profitable, and we plan to continue to upgrade these assets and expand the manufacturing capacity in conjunction with the growing market for our products. We plan to operate our manufacturing facilities for the foreseeable future and there are no current plans to close or convert these assets for use in the manufacture of fundamentally different products. Unlike our manufacturing assets in the United States and Brazil, our manufacturing assets in Europe are all located on leased land. For these assets, we used the lease termination dates as the estimate for when our asset retirement obligations related to those assets will be settled.
Long-Lived Assets. In accordance with Impairment or Disposal of Long-Lived Assets Subsections of FASB ASC Subtopic 360-10, Property, Plant, and Equipment—Overall, (FASB Statement No. 144, Accounting for the Impairment or Disposal of Long-Lived Assets, long-lived assets, such as property, plant, and equipment, and purchased intangible assets subject to amortization, are reviewed for impairment whenever events or changes in circumstances indicate that the carrying amount of an asset may not be recoverable. If circumstances require a long-lived asset or asset group be tested for possible impairment, we first compare undiscounted cash flows expected to be generated by that asset or asset group to its carrying value. If the carrying value of the long-lived asset or asset group is not recoverable on an undiscounted cash flow basis, an impairment is recognized to the
F-10
Table of Contents
KRATON PERFORMANCE POLYMERS, INC.
Notes to Consolidated Financial Statements—(Continued)
extent that the carrying value exceeds its fair value. Fair value is determined through various valuation techniques including discounted cash flow models, quoted market values and third-party independent appraisals, as considered necessary.
Identifiable Intangible Assets. We have identifiable intangible assets related to technology, tradenames/trademarks, customer relationships and software as detailed in Note 3 below. Identifiable intangible assets are amortized on the straight-line method over the estimated useful lives of the assets. The estimated useful life of technology, tradenames/trademarks and customer relationships is 15 years, while the estimated useful life of software is 10 years.
Pension and Other Postretirement Plans. We have a noncontributory defined benefit pension plan covering substantially all of our employees upon their retirement. The benefits are based on age, years of service and the level of compensation during the five years before retirement. We also sponsor a defined benefit health care plan for substantially all retirees and full-time employees.
We record annual amounts relating to our pension and postretirement plans based on calculations that incorporate various actuarial and other assumptions, including discount rates, mortality, assumed rates of return, compensation increases, turnover rates and healthcare cost trend rates. We review our assumptions on an annual basis and make modifications to the assumptions based on current rates and trends when it is appropriate to do so. The effect of modifications to those assumptions is recorded in accumulated other comprehensive income and amortized to net periodic cost over future periods using the corridor method. We believe that the assumptions utilized in recording our obligations under our plans are reasonable based on our experience and market conditions.
The net periodic costs are recognized as employees render the services necessary to earn the postretirement benefits.
Investment in Unconsolidated Joint Venture. Our 50% equity investment in a manufacturing joint venture at our Kashima site is accounted for under the equity method with our share of the operating results of the joint venture classified within equity in earnings of unconsolidated joint venture in the Consolidated Statements of Operations.
We evaluate our equity method investment for impairment when events or changes in circumstances indicate, in management’s judgment, that the carrying value of such investment may have experienced an other-than-temporary decline in value. When evidence of loss in value has occurred, management compares the estimated fair value of the investment to the carrying value of the investment to determine whether an impairment has occurred. Management assesses the fair value of its equity method investment using commonly accepted techniques, and may use more than one method, including, but not limited to, recent third party comparable sales, internally developed discounted cash flow analysis and analysis from outside advisors. If the estimated fair value is less than the carrying value and management considers the decline in value to be other than temporary, the excess of the carrying value over the estimated fair value is recognized in the financial statements as an impairment.
Deferred Financing Costs. We capitalize financing fees and other related costs and amortize them to interest expense over the term of the related debt instrument using the effective interest method.
Environmental Costs. Environmental costs are expensed as incurred unless the expenditures extend the economic useful life of the relevant assets. Costs that extend the economic life of assets are capitalized and
F-11
Table of Contents
KRATON PERFORMANCE POLYMERS, INC.
Notes to Consolidated Financial Statements—(Continued)
depreciated over the remaining life of those assets. Liabilities are recorded when environmental assessments, or remedial efforts are probable, and the cost can be reasonably estimated.
Disclosures about Fair Value of Financial Instruments. The carrying amount approximates fair value for cash and cash equivalents, receivables, accounts payable and certain accrued expenses due to the short maturities of these instruments. The fair values of long-term debt instruments and the interest rate swap agreements are estimated based upon market values (if applicable) or on the current interest rates available to us for debt with similar terms and remaining maturities. Considerable judgment is required in developing these estimates.
Revenue Recognition. Sales are recognized in accordance with the U.S. Securities and Exchange Commission’s Staff Accounting Bulletin (“SAB”) No. 104, “Revenue Recognition in Financial Statements” when the revenue is realized or realizable, and has been earned. Revenue for product sales is recognized as risk and title to the product transfer to the customer, which usually occurs at the time shipment is made. The Company’s products are generally sold FOB (free on board) shipping point or, with respect to countries other than the United States, an equivalent basis. As such, title to the product passes when the product is delivered to the freight carrier. The Company’s standard terms of delivery are included in its contracts of sale, order confirmation documents and invoices.
Shipping and other transportation costs charged to customers are recorded in both sales and cost of sales. Sales revenues are reduced by the expense of rebates to customers as agreed upon volume targets are met.
We have entered into agreements with some of our customers, whereby they earn rebates from us when the volume of their purchases of our product reach certain agreed upon levels. We recognize the rebate obligation under these agreements as a reduction of revenue based on an allocation of the cost of honoring the rebates that are earned to each of the underlying revenue transactions that result in progress by the customer toward earning the rebate.
Research and Development Expenses. Research and development expenses are expensed as incurred.
Leases. All leases entered into as of December 31, 2009 are classified as operating leases. For those leases which contain escalating rent payment clauses, we use the straight-line method to record lease expense.
Income Taxes. We conduct operations in separate legal entities; as a result, income tax amounts are reflected in these consolidated financial statements for each of those jurisdictions.
Deferred taxes result from differences between the financial and tax bases of our assets and liabilities and are adjusted for changes in tax rates and tax laws when changes are enacted. Valuation allowances are recorded to reduce deferred tax assets when it is more likely than not that a tax benefit will not be realized.
In assessing the realizability of deferred tax assets, we consider whether it is more likely than not that some portion or all of the deferred tax assets will not be realized. The ultimate realization of deferred tax assets is dependent upon the generation of future taxable income during the periods in which those temporary differences become deductible. We consider the scheduled reversal of deferred tax liabilities, projected future taxable income and tax planning strategies in making this assessment. Based upon the level of historical taxable income and projections for future taxable income over the periods in which the deferred tax assets are deductible, we believe it is more likely than not that we will realize the benefits of these deductible differences, net of the existing valuation allowances.
Foreign Currency Translation and Foreign Currency Exchange Rates. Financial statements of our operations outside the United States where the local currency is considered to be the functional currency are
F-12
Table of Contents
KRATON PERFORMANCE POLYMERS, INC.
Notes to Consolidated Financial Statements—(Continued)
translated into U.S. dollars using the exchange rate at each balance sheet date for assets and liabilities and the average exchange rate for each period for revenues, expenses, gains, and losses and cash flows. The effects of translating such operations into U.S. dollars are included as a component of other comprehensive income (loss) in stockholders’ / member’s equity.
New Accounting Pronouncements—2009. The following new accounting pronouncements were adopted during 2009 and the effect of such adoption, if applicable, has been presented in the accompanying Consolidated Financial Statements:
Adopted Accounting Standards
In January 2009, the Financial Accounting Standards Board (“FASB”), issued FASB Staff Position (“FSP”) No. FAS No. 132(R)-1 “Employers Disclosures about Pensions and Other Postretirement Benefit Plan Assets” (“FSP FAS No. 132(R)-1”), included in the Codification as ASC 715-20-65-2. This topic provides guidance on an employer’s disclosures about plan assets of a defined benefit pension or other postretirement plan. This topic is effective for fiscal years ending after December 15, 2009. Our adoption of the new guidance did not have a material effect on our consolidated financial statements.
In May 2009, the FASB issued new guidance for subsequent events. The new guidance, which is part of ASC 855, Subsequent Events, is intended to establish general standards of accounting for and disclosure of events that occur after the balance sheet date but before financial statements are issued or are available to be issued. Specifically, this guidance sets forth the period after the balance sheet date during which management of a reporting entity should evaluate events or transactions that may occur for potential recognition or disclosure in the financial statements, the circumstances under which an entity should recognize events or transactions occurring after the balance sheet date in its financial statements, and the disclosures that an entity should make about events or transactions that occurred after the balance sheet date. The new guidance is effective for fiscal years and interim periods ended after June 15, 2009 and will be applied prospectively. Our adoption of the new guidance did not have a material effect on our consolidated financial statements.
In April 2008, the FASB issued FSP No. 142-3, “Determination of the Useful Life of Intangible Assets” (“FSP No. 142-3”), included in the Codification as ASC 350-30-50-4. This topic amends the factors that should be considered in developing renewal or extension assumptions used to determine the useful life of a recognized intangible asset. This topic is effective for financial statements issued for fiscal years beginning after December 15, 2008 and interim periods within those fiscal years. On January 1, 2009, we adopted this topic, which did not have any impact on our consolidated financial statements.
In March 2008, the FASB issued SFAS No. 161, “Disclosures about Derivative Instruments and Hedging Activities-an amendment of FASB Statement No. 133” (“SFAS No. 161”), included in the Codification as ASC 815-10-65-1. This topic requires enhanced disclosure related to derivatives and hedging activities. This topic must be applied prospectively to all derivative instruments and non-derivative instruments that are designated and qualify as hedging instruments and related hedged items for all financial statements issued for fiscal years and interim periods beginning after November 15, 2008. We adopted this topic on January 1, 2009.
In December 2007, the FASB issued SFAS No. 141 (revised 2007), “Business Combinations” (“SFAS 141(R)”), which is a revision of SFAS 141, “Business Combinations,” included in the Codification as ASC 805-10-05-2. The primary requirements of this topic are as follows: (i) Upon initially obtaining control, the acquiring entity in a business combination must recognize 100% of the fair values of the acquired assets, including goodwill, and assumed liabilities, with only limited exceptions even if the acquirer has not acquired 100% of its target. As a consequence, the current step acquisition model will be eliminated. (ii) Contingent
F-13
Table of Contents
KRATON PERFORMANCE POLYMERS, INC.
Notes to Consolidated Financial Statements—(Continued)
consideration arrangements will be fair valued at the acquisition date and included on that basis in the purchase price consideration. The concept of recognizing contingent consideration at a later date when the amount of that consideration is determinable beyond a reasonable doubt, will no longer be applicable. (iii) All transaction costs will be expensed as incurred. This topic is effective as of the beginning of an entity’s first fiscal year beginning after December 15, 2008. Our adoption of this topic on January 1, 2009 has had no impact to our financial position, results of operations or cash flows. A significant impact may, however, be realized on any future acquisitions by us. The amount of such impact will depend on the nature and terms of such future acquisition, if any.
New Accounting Pronouncements. The following new accounting pronouncement has been issued, but have not yet been adopted as of December 31, 2009:
Future Adoption of Accounting Standards
In October 2009, FASB issued Accounting Standards Update (ASU), Number 2009-13 “Revenue Recognition (Topic 605): Multiple-Deliverable Arrangements—consensus of the FASB Emerging Issues Task Force.” This update amends the revenue recognition guidance for arrangements with multiple deliverables. The amendments allow vendors to account for products and services separately rather than as a combined unit. A selling price hierarchy for determining the selling price of each deliverable is established in this ASU, along with eliminating the residual method. The amendments are effective for revenue arrangements that begin or are changed in fiscal years that start June 15, 2010 or later. We are in the process of assessing the provisions of this new guidance and currently do not expect that the adoption will have a material impact on our consolidated financial statements.
We account for share-based awards under the provisions of ASC 718, “Share-Based Payment,” which established the accounting for share-based awards exchanged for employee services. Accordingly, share-based compensation cost is measured at the grant date based on the fair value of the award and is recognized as expense over the requisite service period. We record non-cash compensation expense for the restricted membership units, notional membership units and option awards over the vesting period using the straight-line method. See Note 12 for further discussion.
See Note 7(f) for a description of the TJ Chemical Holdings LLC 2004 Option Plan. There were 0, 11,463,118 and 50,000 options granted under this plan to our employees and directors during the years ended December 31, 2009, 2008 and 2007, respectively. We awarded 74,008 shares of restricted stock on December 22, 2009. There were no options exercised during the years ended December 31, 2009, 2008 and 2007, respectively.
We record non-cash compensation expense for the restricted membership units, notional membership units and option awards over the vesting period using the straight-line method. We recorded share-based employee compensation expense of approximately $1.4 million, $0.8 million and $1.5 million for the years ended December 31, 2009, 2008 and 2007, respectively, net of tax effects of $0.8 million, $0.4 million and $0.9 million, respectively. At December 31, 2009, there was approximately $1.4 million of unrecognized compensation cost related to non-vested option awards, and $1.5 million of unrecognized compensation expense related to non-vested restricted membership unit and notional membership unit awards expected to be recognized over a weighted-average period of 6.8 years.
F-14
Table of Contents
KRATON PERFORMANCE POLYMERS, INC.
Notes to Consolidated Financial Statements—(Continued)
Stock Option Activity
Information pertaining to option activity for the year ended December 31, 2009 is as follows:
| Options | Weighted Average Exercise Price |
Weighted Average Remaining Life |
Aggregate Intrinsic Value (1) | ||||||
| (in thousands) | (in years) | (in millions) | |||||||
| Outstanding at December 31, 2008 |
22,101 | $ | 1.00 | 6.8 | — | ||||
| Granted |
— | — | — | — | |||||
| Exercised |
— | — | — | — | |||||
| Forfeited or expired |
685 | 1.00 | — | — | |||||
| Outstanding at December 16, 2009 |
21,416 | 1.00 | — | — | |||||
| Conversion rate is 7.4008 new to 100 old (2) |
|||||||||
| Outstanding at December 17, 2009 |
1,585 | 13.51 | — | — | |||||
| Granted |
— | — | — | — | |||||
| Exercised |
— | — | — | — | |||||
| Forfeited or expired |
— | — | — | — | |||||
| Outstanding at December 31, 2009 |
1,585 | 13.51 | 6.8 | 0.1 | |||||
| Exercisable at December 31, 2009 |
955 | 13.51 | 6.0 | — | |||||
| (1) | The intrinsic value of a stock option is the amount by which the market value of the underlying stock exceeds the exercise price of the option. |
| (2) | 100 ÷ 7.4008 = 13.51. |
Prior to December 17, 2009, we engaged an independent valuation and financial consultant to estimate the fair value of the options issued using the Black-Scholes Merton option-pricing model.
The number, weighted average exercise price and weighted average remaining contractual life of options outstanding as of December 31, 2009, and the number and weighted average exercise price of options exercisable as of December 31, 2009 follow:
| Range of Exercise Prices |
Options | Weighted Average Exercise Price |
Weighted Average Remaining Life | |||||||
| (in thousands) | (in years) | |||||||||
| Outstanding options |
$ | 13.51 | 1,585 | $ | 13.51 | 6.8 | ||||
| Exercisable options |
13.51 | 955 | 13.51 | 6.0 | ||||||
See Note 7(e) for a description of the TJ Chemical Holdings LLC Membership Units Plan. TJ Chemical Holdings LLC may grant time-vested restricted membership units and time-vested notional membership units to certain employees. Holders of notional membership units do not have any beneficial ownership in the underlying membership units and the grant represents an unsecured promise to deliver membership units on a future date. Actual membership units underlying the restricted membership units and the notional membership units will not be distributed until the earlier of a change in control or the termination of the grantee’s employment.
F-15
Table of Contents
KRATON PERFORMANCE POLYMERS, INC.
Notes to Consolidated Financial Statements—(Continued)
The following table represents the restricted membership units, notional membership units and restricted stock granted, vested and forfeited during 2009.
| Unit | Grant Date Fair Value per Unit | ||||
| (in thousands) | |||||
| Restricted and Notional Units and Restricted Stock |
|||||
| Non-vested shares at January 1, 2009 |
2,454 | $ | 1.00 | ||
| Granted |
— | — | |||
| Vested |
— | — | |||
| Forfeited |
729 | 1.00 | |||
| Non-vested shares at December 16, 2009 |
1,725 | $ | 1.00 | ||
| Conversion rate is 7.4008 new to 100 old |
|||||
| Non-vested shares at December 17, 2009 |
128 | $ | 13.51 | ||
| Granted |
74 | 13.51 | |||
| Vested |
— | — | |||
| Forfeited |
— | — | |||
| Non-vested shares at December 31, 2009 |
202 | $ | 13.51 | ||
Weighted-Average Assumptions for Option Pricing
| 2009 | 2008 | 2007 | ||||||
| Risk-free interest rate |
n/a | 3.59 | % | 3.40 | % | |||
| Expected dividend yield |
n/a | 0.00 | % | 0.00 | % | |||
| Expected volatility |
n/a | 0.38 | 0.40 | |||||
| Expected term |
n/a | 5 years | 5 years |
Since our membership units were privately held prior to the IPO, the estimated volatility is based on the historical volatility of similar companies’ stock that is publicly traded. The expected term of options represents the period of time that options granted are expected to be outstanding. The risk free interest rate for the periods within the contractual life of the option is based on the U.S. Treasury yield curve in effect at the time of grant.
The weighted average fair value per option at the date of grant for options granted in 2008 and 2007 was $0.31 in both years, as valued using the Black-Scholes Merton option-pricing model. No options were granted in 2009. Option grants subsequent to 2009 will be valued at the fair market value of our common stock on the date of grant.
F-16
Table of Contents
KRATON PERFORMANCE POLYMERS, INC.
Notes to Consolidated Financial Statements—(Continued)
3. Detail of Certain Balance Sheet Accounts
| December 31, | ||||||
| 2009 | 2008 | |||||
| (in thousands) | ||||||
| Inventories of products, net: |
||||||
| Finished products |
$ | 223,500 | $ | 271,449 | ||
| Work in progress |
3,254 | 1,781 | ||||
| Raw materials |
57,504 | 50,963 | ||||
| $ | 284,258 | $ | 324,193 | |||
| Property, plant and equipment: |
||||||
| Land |
$ | 8,782 | $ | 15,240 | ||
| Buildings |
32,467 | 37,601 | ||||
| Plant and equipment |
508,057 | 482,880 | ||||
| Construction in progress |
42,112 | 18,539 | ||||
| 591,418 | 554,260 | |||||
| Less accumulated depreciation |
236,558 | 182,252 | ||||
| $ | 354,860 | $ | 372,008 | |||
| Identifiable intangible assets: |
||||||
| Technology |
$ | 44,813 | $ | 44,813 | ||
| Customer relations |
35,213 | 35,213 | ||||
| Trademarks |
23,194 | 23,194 | ||||
| Software |
15,322 | — | ||||
| 118,542 | 103,220 | |||||
| Less accumulated amortization |
42,741 | 36,169 | ||||
| $ | 75,801 | $ | 67,051 | |||
| Other payables and accruals: |
||||||
| Employee related |
$ | 5,783 | $ | 25,418 | ||
| Interest |
7,366 | 10,316 | ||||
| Property and other taxes |
4,255 | — | ||||
| Customer rebates |
2,960 | 4,402 | ||||
| Income taxes payable |
4,000 | 8,538 | ||||
| Derivative liabilities |
2,926 | 5,483 | ||||
| Pernis restructuring |
9,874 | — | ||||
| Other |
31,107 | 15,192 | ||||
| $ | 68,271 | $ | 69,349 | |||
We recorded lower-of-cost-or-market adjustments for inventories in cost of goods sold of $0.7 million and $8.1 million in 2009 and 2008, respectively.
The identifiable intangible assets are amortized on the straight-line method over the estimated useful lives of the assets. The estimated useful life of technology, tradenames/trademarks and customer relationships is 15 years, while the estimated useful life of software is 10 years. Aggregate amortization expense for amortizing intangible assets was approximately $6.6 million, $7.0 million and $7.2 million for the years ended December 31, 2009, 2008 and 2007, respectively. Estimated amortization expense for each of the next five years
F-17
Table of Contents
KRATON PERFORMANCE POLYMERS, INC.
Notes to Consolidated Financial Statements—(Continued)
is approximately $6.6 million. Identifiable intangibles were adjusted in 2007 for the realization of certain excess tax basis that had not previously been recognized in the consolidated financial statements.
Accumulated other comprehensive income consists of the following:
| December 31, 2009 |
December 31, 2008 |
|||||||
| (in thousands) | ||||||||
| Foreign currency adjustments |
$ | 55,765 | $ | 41,742 | ||||
| Unrealized gain on interest rate swaps, net of tax |
(1,780 | ) | (2,111 | ) | ||||
| Pension adjustment, net of tax |
(17,149 | ) | (33,808 | ) | ||||
| Total accumulated other comprehensive income |
$ | 36,836 | $ | 5,823 | ||||
Long-term debt consists of the following:
| December 31, | |||||||
| 2009 | 2008 | ||||||
| (in thousands) | |||||||
| Senior Secured Credit Facilities: |
|||||||
| Revolving loans |
$ | — | $ | 50,000 | |||
| Term loans |
221,729 | 325,071 | |||||
| 12.00% discount notes |
250 | 245 | |||||
| 8.125% discount notes |
170,000 | 200,000 | |||||
| 8.125% discount notes held in Treasury |
(7,000 | ) | — | ||||
| Total debt |
384,979 | 575,316 | |||||
| Less current portion of long-term debt |
2,304 | 3,343 | |||||
| Total long-term debt |
$ | 382,675 | $ | 571,973 | |||
(a) Term Loans and Revolving Loans. On May 12, 2006 we entered into an amendment (the “Amendment”) to our senior secured credit agreement, or the Credit Agreement, dated as of December 23, 2003, as amended as of March 4, 2004, as further amended as of October 21, 2004 and as further amended as of February 16, 2006 in order to provide a portion of the funds required in connection with the cash tender offer and consent solicitation commenced on April 24, 2006 by us and Polymer Holdings Capital Corporation with respect to any and all of our outstanding 12.0% discount notes. On May 12, 2006 all but $250,000 of the $150,000,000 12.0% discount notes validly tendered and not withdrawn in the tender offer (representing approximately 99.8% of the aggregate amount of outstanding 12.0% discount notes) were accepted for payment and purchased for aggregate total consideration equal to $128,785,000.
The Amendment provided for, among other things, a new term facility (the “Term Facility”) of $385 million, representing a $25 million increase over the original Term Facility, and extending the maturity of the Term Facility from December 23, 2010 to May 12, 2013. The Amendment extended the maturity of the revolving facility (the “Revolving Facility”), from December 23, 2008 to May 12, 2011 and provided for the possibility of increasing the existing Revolving Facility from $60 million to $80 million, subject to new revolving lenders becoming parties to the Credit Agreement. On June 7, 2006, we entered into a Joinder Agreement with a new revolving lender that increased the Revolving Facility to $75.5 million from $60.0 million. In addition to the foregoing, the Amendment reduced the interest rate margin on the Term Facility, eliminated certain affirmative
F-18
Table of Contents
KRATON PERFORMANCE POLYMERS, INC.
Notes to Consolidated Financial Statements—(Continued)
and negative covenants, including a covenant that limited our ability to make capital expenditures, and modified the financial ratios we are required to maintain. On the effective date of the Amendment, we borrowed the full $385 million available under the new Term Facility and used the proceeds to prepay in full existing borrowings under the original Term Facility, provided a portion of the funds necessary to consummate the tender offer for the 12.0% discount notes and pay fees and expenses related to the foregoing.
The amendment as of October 20, 2009, or the October 2009 Amendment, permits Kraton to convert all or a portion of existing term loans into separate classes of extended term loans that extend the scheduled amortization and maturity of the existing term loans. The extended term loans are required to be substantially identical to the terms of the existing term facility, with the exception of scheduled installment payments and maturity, fees, interest rates and prepayment rights. There is no limit on the number of classes of term loans outstanding at any one time. The October 2009 Amendment also permits Kraton to establish separate classes (but in no event more than three at any time) of commitments to replace all or a portion of the existing revolving commitments. The terms of Replacement Revolving Commitments are required to be substantially identical to the terms of the existing revolving commitments, with the exception of maturity, fees and interest rates. Finally, the October 2009 Amendment also allows the Borrower to incur indebtedness secured pari passu with the collateral securing the existing lenders under the existing Credit Agreement to refinance existing term loans. This refinancing indebtedness may not amortize or mature prior to the maturity of the existing term loans.
A further amendment on November 30, 2009, or the November 2009 Amendment, increased the maximum available borrowings under the revolving commitments from $75.5 million to $80.0 million and extended the maturity on $79.8 million of the revolving commitments from May 2011 to May 2013.
Kraton is the borrower under the amended Credit Agreement and its wholly-owned domestic subsidiaries along with us have guaranteed the amended Credit Agreement. We refer to these guarantors, together with Kraton, as the Loan Parties. The Credit Agreement is secured by a perfected first priority security interest in substantially all of each Loan Party’s tangible and intangible assets, including intellectual property, real property, all of Kraton’s capital stock and the capital stock of Kraton’s domestic subsidiaries and 65% of the capital stock of the direct foreign subsidiaries of each Loan Party.
For the years ended December 31, 2009, 2008 and 2007, Kraton made prepayments on the term portion of its senior secured credit facility in the amounts of $100.0 million, $10.0 million and $40.0 million, which resulted in the write off of approximately $1.5 million, $0.2 million and $0.6 million of deferred financing cost, respectively.
As of December 31, 2009, Kraton had no outstanding borrowings under the revolving facility.
The following is a summary of the material terms of the amended Credit Agreement. This description does not purport to be complete and is qualified in its entirety by reference to the provisions of the Credit Agreement.
In these notes to the consolidated financial statements, the loans made under the Revolving Facility are referred to as the Revolving Loans, and the loans made under the Term Facility are referred to as the Term Loans.
Maturity. The loans made under the portion of the revolving commitments extended pursuant to the November 2009 Amendment are payable in a single maturity on May 12, 2013. The $200,000 portion of the revolving commitments that were not extended pursuant to November 2009 Amendment are payable on May 12, 2011. The loans made under the existing term facility are payable in 10 remaining consecutive equal quarterly
F-19
Table of Contents
KRATON PERFORMANCE POLYMERS, INC.
Notes to Consolidated Financial Statements—(Continued)
installments, in an aggregate annual amount equal to 1.0% of the original principal amount of such loans. The remaining balance is payable in four equal quarterly installments commencing on September 30, 2012 and ending on May 12, 2013.
Interest. The loans made under the existing term facility bear interest at a rate equal to the adjusted Eurodollar rate plus 2.00% per annum or, at Kraton’s option, the base rate plus 1.00% per annum. Interest is payable on the last day of each interest period selected by Kraton under the Credit Agreement, and in any event at least quarterly. The average effective interest rates on the loans made under the existing term facility for the years ended December 31, 2009 and 2008 were 4.5% and 5.0%, respectively. The loans made under the portion of the revolving commitments extended pursuant to the November 2009 Amendment bear interest at a rate equal to the adjusted Eurodollar rate plus a margin of between 3.00% and 3.50% per annum (depending on Kraton’s consolidated leverage ratio) or at Kraton’s option, the base rate plus a margin of between 2.00% and 2.50% per annum (also depending on Kraton’s consolidated leverage ratio). In addition, with respect to the extended portion of the revolving commitments, an annual commitment fee equal to 0.75% payable quarterly on the daily average undrawn portion of revolving commitments extended pursuant to the November 2009 Amendment accrues and is payable quarterly in arrears.
The terms of the $200,000 portion of the revolving commitments that were not extended pursuant to November 2009 Amendment were not changed. Loans made under this portion of the revolving commitments bear interest at a rate equal to the adjusted Eurodollar rate plus a margin of between 2.00% and 2.50% per annum, depending on Kraton’s leverage ratio, or at Kraton’s option, the base rate plus a margin of between 1.00% and 1.50% per annum, depending on Kraton’s leverage ratio. The unused commitment fee for the unextended revolving commitments is 0.5%.
Mandatory Prepayments. The existing term facility is subject to mandatory prepayment with, in general: (1) 100% of the net cash proceeds of certain asset sales, subject to certain reinvestment rights; (2) 100% of the net cash proceeds of certain insurance and condemnation payments, subject to certain reinvestment rights; (3) 50% of the net cash proceeds of certain equity offerings of TJ Chemical Holdings LLC or us (declining to 25%, if a leverage ratio is met); (4) 100% of the net cash proceeds of debt incurrences (other than debt incurrences permitted under the Credit Agreement); and (5) 50% of Kraton’s excess cash flow, as defined in the Credit Agreement (declining to 25%, if a leverage ratio is met and to 0% if a further leverage ratio is met). Any such prepayment is applied first to the term facility and thereafter to the revolving facility.
Covenants. The Credit Agreement contains certain affirmative covenants including, among others, covenants to furnish the Lenders with financial statements and other financial information and to provide the Lenders notice of material events and information regarding collateral.
The Credit Agreement contains certain negative covenants that, among other things, restrict Kraton’s ability, subject to certain exceptions, to incur additional indebtedness, grant liens on its assets, undergo fundamental changes, make investments, sell assets, make acquisitions, engage in sale and leaseback transactions, make restricted payments, engage in transactions with its affiliates, amend or modify certain agreements and charter documents and change its fiscal year. The covenants also restrict our activities. Kraton is required to maintain a fiscal quarter end interest coverage ratio of at least 2.75:1.00 through December 31, 2009; and of at least 3.00:1.00 beginning March 31, 2010 and continuing thereafter. In addition, Kraton is required to maintain a fiscal quarter end leverage ratio not to exceed 4.00 beginning December 31, 2009 and continuing thereafter.
As of December 31, 2009, we were in compliance with the applicable financial ratios in the senior secured credit facility and the other covenants contained in the senior secured credit facility and the indentures governing the senior subordinated notes.
F-20
Table of Contents
KRATON PERFORMANCE POLYMERS, INC.
Notes to Consolidated Financial Statements—(Continued)
On January 14, 2008, we received an equity investment of $10.0 million, of which $9.6 million was included in the financial covenant calculation for the twelve-month period ending December 31, 2007 and was included in the fiscal quarter covenant calculations through the fiscal quarter ending September 30, 2008 pursuant to the equity cure provisions included in the Credit Agreement.
(b) Senior Discount Notes Due July 15, 2014. As part of a refinancing of indebtedness on November 2, 2004, Polymer Holdings issued the 12% discount notes. The following is a summary of the material terms of the 12% discount notes. This description does not purport to be complete and is qualified, in its entirety, by reference to the provisions of the indenture governing the 12% discount notes.
Interest. No cash interest accrued on the 12% discount notes prior to January 15, 2009. Thereafter, cash interest on the 12% discount notes will accrue and be payable semi-annually in arrears on January 15 and July 15 of each year, commencing on July 15, 2009, at a rate of 12.000% per annum.
Accretion. The 12% discount notes were issued at a substantial discount to their principal amount at maturity and generated gross proceeds of approximately $91.9 million. The accreted value of each 12% discount note increased on a daily basis from the date of issuance until January 15, 2009, at a rate of 12% per annum, reflecting the accrual of non-cash interest, such that the accreted value on January 15, 2009, equals the principal amount at maturity.
Guarantees. None of Polymer Holdings’ subsidiaries guarantee the 12% discount notes.
Holding Company Structure and Ranking. Kraton Performance Polymers is a holding company and does not have any material assets or operations other than ownership of Kraton’s capital stock. All of its operations are conducted through Kraton and Kraton’s subsidiaries and, therefore, Kraton Performance Polymers will be dependent upon Kraton’s cash flow and the cash flow of our subsidiaries to meet its obligations under the 12% discount notes. As a result of the holding company structure, any right of Kraton Performance Polymers and its creditors, including the holders of the 12% discount notes, to participate in the assets of any of its subsidiaries upon such subsidiary’s liquidation or reorganization will be structurally subordinated to the claims of that subsidiary’s creditors and holders of preferred stock of such subsidiary, if any. In addition, in the event of the bankruptcy, liquidation, reorganization or other winding up of Kraton Performance Polymers, or upon a default in payment with respect to, or the acceleration of, any indebtedness under the senior secured credit facility or other secured indebtedness of Kraton Performance Polymers, the assets of Kraton Performance Polymers will be available to pay obligations on the 12% discount notes only after all secured indebtedness has been repaid from such assets.
Optional Redemption. Polymer Holdings may elect to redeem the 12% discount notes at certain predetermined redemption prices, plus accrued and unpaid interest.
Covenants. The 12% discount notes contain certain affirmative covenants including, among others, to furnish the holders of 12% discount notes with financial statements and other financial information and to provide the holders of 12% discount notes notice of material events.
The 12% discount notes contain certain negative covenants including limitations on indebtedness, limitations on restricted payments, limitations on restrictions on distributions from certain subsidiaries, limitations on lines of business and merger and consolidations.
As of December 31, 2009, Polymer Holdings was in compliance with all covenants under the 12% discount notes.
F-21
Table of Contents
KRATON PERFORMANCE POLYMERS, INC.
Notes to Consolidated Financial Statements—(Continued)
Exchange Offer. On October 20, 2005, Polymer Holdings completed an offer to exchange all of its outstanding 12% discount notes issued under an exemption from the registration requirement of the Securities Act, for notes registered under the Securities Act. In this offer, 100% of the outstanding notes issued under the exemptions from registration were tendered and exchanged for registered notes. The registered notes are identical to the unregistered notes, except that the registered notes do not carry transfer restrictions.
(c) Senior Subordinated Notes Due January 15, 2014. On December 23, 2003, Kraton and Kraton Polymers Capital Corporation issued the 8.125% Notes in an aggregate principal amount of $200.0 million. The 8.125% Notes are subject to the provisions for mandatory and optional prepayment and acceleration and are payable in full on January 15, 2014. Polymer Holdings and each of Kraton Polymers U.S. LLC and Elastomers Holdings LLC, which we refer to collectively as the Subsidiary Guarantors, have guaranteed the 8.125% Notes. The amount of 8.125% Notes outstanding at December 31, 2009 and 2008, was $163 million and $200.0 million.
Interest. The 8.125% Notes bear interest at a fixed rate of 8.125% per annum. Interest is payable semi-annually on January 15 and July 15.
Optional Redemption. Kraton may redeem all or a part of the senior subordinated notes at the redemption prices (expressed as percentages of principal amount) set forth below plus accrued and unpaid interest, if any, on the Notes redeemed to the applicable redemption date.
| Year |
Percentage | ||
| 2010 |
102.708 | % | |
| 2011 |
101.354 | % | |
| 2012 |
100.000 | % | |
| 2013 and thereafter |
100.000 | % |
Purchase of a Portion of the Senior Subordinated Notes. In April 2009, TJ Chemical purchased approximately $6.3 million face value of the senior subordinated notes for cash consideration of $2.5 million, which included accrued interest of $0.1 million. Immediately upon purchasing the senior subordinated notes, TJ Chemical contributed the purchased notes to us, and we in turn contributed the notes to Kraton. No equity interest or other consideration was issued in exchange for the contribution of the senior subordinated notes, although equity of each of Kraton Performance and Kraton was increased by an amount equal to the cash consideration paid by TJ Chemical. Kraton holds the senior subordinated notes as treasury bonds. Also in April 2009, Kraton purchased approximately $0.7 million face value of the senior subordinated notes for cash consideration of $0.3 million which Kraton is holding as treasury bonds. We recorded a gain of approximately $4.3 million on the extinguishment of debt in the quarter ended June 30, 2009.
On March 16, 2009, Kraton purchased and retired $30 million face value of the senior subordinated notes for cash consideration of $10.9 million, which included accrued interest of $0.4 million. We recorded a gain of approximately $19.5 million in the quarter ending March 31, 2009 related to the purchase and retirement of these senior subordinated notes.
Covenants. The 8.125% Notes contain certain affirmative covenants including, among others, covenants to furnish the holders of the 8.125% Notes with financial statements and other financial information and to provide the holders of the 8.125% Notes notice of material events.
The 8.125% Notes contain certain negative covenants including limitations on indebtedness, limitations on restricted payments, limitations on restrictions on distributions from certain subsidiaries, limitations on lines of businesses and mergers and consolidations. As of December 31, 2009, we were in compliance with all covenants under the 8.125% Notes.
F-22
Table of Contents
KRATON PERFORMANCE POLYMERS, INC.
Notes to Consolidated Financial Statements—(Continued)
(d) Debt Maturities. The estimated remaining principal payments on our outstanding total debt as of December 31, 2009, are as follows:
| Principal Payments | |||
| (in thousands) | |||
| December 31: |
|||
| 2010 |
$ | 2,304 | |
| 2011 |
$ | 2,304 | |
| 2012 |
$ | 109,137 | |
| 2013 |
$ | 107,984 | |
| 2014 and thereafter |
$ | 163,250 | |
| Total debt |
$ | 384,979 | |
We capitalize financing fees and other related costs and amortize them to interest expense over the term of the related debt instrument using the effective interest method. We amortized $4.1 million, $2.1 million and $2.7 million in deferred financing costs in the years ended 2009, 2008 and 2007, respectively. In December 2009, we made a $100.0 million pre-payment of outstanding indebtedness under the Term Loans, which resulted in the write off of approximately $1.5 million of deferred financing cost. In June 2008 we made a $10.0 million voluntary prepayment of outstanding indebtedness under the Term Loans, which resulted in the write off of approximately $0.2 million of deferred financing cost. In addition, during the year ended December 31, 2007, we made voluntary prepayments under the Term Loans in the amount of $40.0 million, which resulted in the write off of approximately $0.6 million of deferred financing cost.
We incurred approximately $3.2 million of fees in connection with the amendment to our Term Loan and Revolving loan in 2009, and these fees were recorded as deferred financing costs during the year ended December 31, 2009. In 2008, we incurred fees of approximately $1.2 million associated with preliminary analysis of refinancing options associated with our Credit Agreement and recorded a charge of $1.2 million to selling, general, and administrative expense in the consolidated statements of Operations as we determined our refinancing efforts were not probable due to current market condition.
Income taxes are recorded utilizing an asset and liability approach. This method gives consideration to the future tax consequences associated with the differences between the financial accounting basis and tax basis of the assets and liabilities, and the ultimate realization of any deferred tax asset resulting from such differences.
F-23
Table of Contents
KRATON PERFORMANCE POLYMERS, INC.
Notes to Consolidated Financial Statements—(Continued)
The provision (benefit) for income taxes on income from continuing operations is comprised of the following:
| December 31, | ||||||||||||
| 2009 | 2008 | 2007 | ||||||||||
| (in thousands) | ||||||||||||
| Current tax provision: |
||||||||||||
| U.S. |
$ | 422 | $ | 262 | $ | 12 | ||||||
| Foreign |
8,239 | 13,614 | 4,589 | |||||||||
| Total |
8,661 | 13,876 | 4,601 | |||||||||
| Deferred tax provision: |
||||||||||||
| U.S. |
(285 | ) | (51 | ) | 2,491 | |||||||
| Foreign |
(9,743 | ) | (5,394 | ) | (972 | ) | ||||||
| Total |
(10,028 | ) | (5,445 | ) | 1,519 | |||||||
| Income tax expense (benefit) |
$ | (1,367 | ) | $ | 8,431 | $ | 6,120 | |||||
Deferred income taxes reflect the net tax effects of temporary differences between the carrying amounts of assets and liabilities for financial reporting purposes and the amounts used for income tax purposes, as well as operating loss and tax credit carryforwards. In connection with the acquisition, the book basis of foreign assets and liabilities was stepped-up to their estimated fair market value.
Income (loss) before income taxes is comprised of the following:
| December 31, | |||||||||||
| 2009 | 2008 | 2007 | |||||||||
| (in thousands) | |||||||||||
| Income (loss) before income taxes: |
|||||||||||
| U.S. |
$ | 9,656 | $ | 7,098 | $ | (29,205 | ) | ||||
| Foreign |
(11,313 | ) | 29,752 | (8,424 | ) | ||||||
| Total |
$ | (1,657 | ) | $ | 36,850 | $ | (37,629 | ) | |||
The tax effects of temporary differences that gave rise to significant components of deferred tax liabilities and assets are as follows:
| December 31, | ||||||||
| 2009 | 2008 | |||||||
| (in thousands) | ||||||||
| Deferred tax liabilities: |
||||||||
| Property, plant and equipment |
$ | 96,424 | $ | 100,104 | ||||
| Identifiable intangibles |
2,986 | 4,921 | ||||||
| Total deferred tax liabilities |
99,410 | 105,025 | ||||||
| Deferred tax assets: |
||||||||
| Net operating loss carryforward |
(116,438 | ) | (113,519 | ) | ||||
| Inventory |
(3,270 | ) | (3,563 | ) | ||||
| Exchange rate differences |
(236 | ) | (1,210 | ) | ||||
| Interest rate swaps |
(1,097 | ) | (2,022 | ) | ||||
| Pension accrual |
(15,971 | ) | (18,716 | ) | ||||
| Other Accruals and Reserves |
(8,976 | ) | (9,465 | ) | ||||
| Interest |
— | (31 | ) | |||||
| Total deferred tax assets |
(145,988 | ) | (148,526 | ) | ||||
| Valuation allowance for deferred tax assets |
56,956 | 63,677 | ||||||
| Net deferred tax liabilities |
$ | 10,378 | $ | 20,176 | ||||
F-24
Table of Contents
KRATON PERFORMANCE POLYMERS, INC.
Notes to Consolidated Financial Statements—(Continued)
| December 31 | ||||||||
| 2009 | 2008 | |||||||
| (in thousands) | ||||||||
| Net deferred tax liabilities of: |
||||||||
| Current deferred tax assets |
$ | (14,730 | ) | $ | (24,196 | ) | ||
| Non-current deferred tax assets |
(168,979 | ) | (166,930 | ) | ||||
| Current deferred tax liabilities |
11,624 | 9,418 | ||||||
| Non-current deferred tax liabilities |
182,463 | 201,884 | ||||||
| Net deferred tax liabilities |
$ | 10,378 | $ | 20,176 | ||||
The provision for income taxes differs from the amount computed by applying the U.S. statutory income tax rate to income from continuing operations before income taxes for the reasons set forth below:
| December 31, | ||||||||||||
| 2009 | 2008 | 2007 | ||||||||||
| (in thousands) | ||||||||||||
| Income Taxes at the Statutory Rate |
$ | (580 | ) | $ | 12,897 | $ | (13,171 | ) | ||||
| Foreign Tax Rate Differential |
(97 | ) | (3,294 | ) | 3,331 | |||||||
| State Taxes |
(225 | ) | (86 | ) | (3,012 | ) | ||||||
| Permanent Differences—Netherlands Participation Exemption |
(784 | ) | (903 | ) | — | |||||||
| Permanent Differences—Other |
(48 | ) | 682 | (144 | ) | |||||||
| Differences in Foreign Earnings Remitted |
4,165 | 6,354 | 4,043 | |||||||||
| Tax Credits |
(122 | ) | — | — | ||||||||
| Other |
(189 | ) | — | — | ||||||||
| Tax Benefit Related to Foreign Losses |
(2,597 | ) | — | — | ||||||||
| Change in Valuation Allowance and Uncertain Tax Positions |
(890 | ) | (7,219 | ) | 15,073 | |||||||
| Income Tax Expense (Benefit) |
$ | (1,367 | ) | $ | 8,431 | $ | 6,120 | |||||
| December 31, | |||||||||
| 2009 | 2008 | 2007 | |||||||
| Income Taxes at the Statutory Rate |
35.0 | % | 35.0 | % | 35.0 | % | |||
| Foreign Tax Rate Differential |
5.9 | % | (8.9 | )% | (8.9 | )% | |||
| State Taxes |
13.6 | % | (0.2 | )% | 8.0 | % | |||
| Permanent Differences—Netherlands Participation Exemption |
47.3 | % | (2.5 | )% | 0.0 | % | |||
| Permanent Differences—Other |
2.9 | % | 1.9 | % | 0.4 | % | |||
| Differences in Foreign Earnings Remitted |
(251.4 | )% | 17.2 | % | (10.7 | )% | |||
| Tax Credits |
7.4 | % | 0.0 | % | 0.0 | % | |||
| Other |
11.4 | % | 0.0 | % | 0.0 | % | |||
| Tax Benefit Related to Foreign Losses |
156.7 | % | 0.0 | % | 0.0 | % | |||
| Change in Valuation Allowance and Uncertain Tax Positions |
53.7 | % | (19.6 | )% | (40.1 | )% | |||
| Effective Tax Rate |
82.5 | % | 22.9 | % | (16.3 | )% | |||
As of December 31, 2009, we had $331.3 million of operating loss carryforwards for income tax purposes, of which $233.8 million relates to the United States and the remaining $97.5 million relates to foreign tax jurisdictions. The United States operating loss carryforwards will expire in 2024, 2025, 2026 and 2027, if not utilized in prior years. We anticipate taxable income in future years that will allow us to utilize the carryforwards that have not had a valuation allowance placed against them.
F-25
Table of Contents
KRATON PERFORMANCE POLYMERS, INC.
Notes to Consolidated Financial Statements—(Continued)
As of December 31, 2009 and 2008, a valuation allowance of $57.0 million and $63.7 million, respectively, had been recorded related to certain deferred tax assets. We record a valuation allowance when it is more likely than not that some portion or all of the deferred tax assets will not be realized. The ultimate realization of the deferred tax assets depends on the ability to generate sufficient taxable income of the appropriate character in the future and in the appropriate taxing jurisdictions. We have provided a valuation allowance for operating loss carryforwards and deferred tax assets in certain jurisdictions.
In assessing realizability of deferred tax assets, management considers whether it is more likely than not that some portion or all of the deferred tax assets will not be realized. The ultimate realization of deferred tax assets is dependent upon the generation of future taxable income during the periods in which those temporary differences become deductible. Based upon management’s expectations at December 31, 2009, management believes it is more likely than not, that we will realize the benefit of the deferred tax assets, net of the existing valuation allowances.
We provide for taxes in certain situations where assessments have not been received. In those situations, we consider it probable that the taxes ultimately payable will exceed the amounts reflected in filed tax returns; accordingly, taxes are provided in those situations under the guidance in ASC 740-10-05, Accounting for Uncertainty in Income Taxes, and are included in both income taxes in current liabilities and in deferred income taxes and other liabilities in the consolidated balance sheets.
Effective January 1, 2007, we adopted the principles of ASC 740-10-05, Accounting for Uncertainty in Income Taxes, which prescribes the minimum recognition threshold a tax position taken or expected to be taken in a tax return is required to meet before being recognized in the financial statements. It also provides guidance for derecognition, classification, interest and penalties, accounting in interim periods, disclosure, and transition. As a result of the implementation of ASC 740-10-05, we recognized no change in the liability for unrecognized tax benefits or accrued interest and penalties. We file income tax returns in the U.S. federal jurisdiction, and various state and foreign jurisdictions. As of December 31, 2009, our 2005 through 2008 U.S. federal income tax returns remain open to examination. In addition, open tax years to state and foreign jurisdictions remain subject to examination.
As of January 1, 2009, we had total unrecognized tax benefits of approximately $1.1 million. During the year ended December 31, 2009, we had a change in certain tax positions mainly related to prior tax periods. The increase of $0.1 million in these tax positions was primarily due to recognizing additional reserve needs in connection with an ongoing tax audit in Asia. As of December 31, 2009, we estimated $ 1.2 million in unrecognized tax benefits, that if recognized, would impact the effective tax rate. We recognize interest and penalties related to unrecognized tax benefits within the provision for income taxes in our consolidated statement of operations. During the year ended December 31, 2009, we recognized additional interest and penalties charges related to unrecognized tax benefits. As of January 1, 2009, we believe that no current tax positions that have resulted in unrecognized tax benefits will significantly increase or decrease within one year. As of the year ended December 31, 2009, no material changes, other than the tax audit related charges mentioned above, have occurred in our estimates or expected events related to anticipated changes in our unrecognized tax benefits.
The following presents a rollforward of our unrecognized tax benefits and associated interest and penalties.
| Unrecognized Tax Benefits |
Interest
and Penalties | |||||
| (in thousands) | ||||||
| Balance at January 1, 2009 |
$ | 1,144 | $ | 83 | ||
| Increase in prior year tax positions |
11 | 38 | ||||
| Balance at December 31, 2009 |
$ | 1,155 | $ | 121 | ||
F-26
Table of Contents
KRATON PERFORMANCE POLYMERS, INC.
Notes to Consolidated Financial Statements—(Continued)
(a) U.S. Retirement Benefit Plans. We have a U.S noncontributory defined benefit pension plan in the United States, which covers all salaried and hourly wage employees in the United States, who were employed by us on or before December 31, 2005. Employees who begin their employment with us after December 31, 2005 are not covered by our U.S. noncontributory defined benefit pension plan. The benefits under this plan are based primarily on years of service and employees’ pay near retirement. For our employees who were employed as of March 1, 2001 and who: (1) were previously employed by Shell Chemicals; and (2) elected to transfer their pension assets to us, we consider the total combined Shell Chemicals and Kraton service when calculating the employee’s pension benefit. For those employees who: (1) elected to retire from Shell Chemicals; or (2) elected not to transfer their pension benefit, only Kraton service (since March 1, 2001) is considered when calculating benefits.
The 2009 measurement date of the plans’ assets and obligations was December 31, 2009. Based on the funded status of our defined benefit pension plan as of December 31, 2009, we reported an increase in our accumulated other comprehensive income of approximately $12.3 million and a related decrease in accrued pension obligations. Accrued pension obligations are included in long-term liabilities on our consolidated balance sheet. Information concerning the pension obligation, plan assets, amounts recognized in our financial statements and underlying actuarial assumptions are as follows:
| December 31, | ||||||||
| 2009 | 2008 | |||||||
| (in thousands) | ||||||||
| Change in benefit obligation |
||||||||
| Benefit obligation at beginning of year |
$ | 82,163 | $ | 62,061 | ||||
| Service cost |
2,813 | 2,281 | ||||||
| Interest cost |
4,690 | 4,275 | ||||||
| Benefits paid |
(2,086 | ) | (1,880 | ) | ||||
| Actuarial (gain) loss |
(10,691 | ) | 15,268 | |||||
| Plan amendments |
— | 158 | ||||||
| Benefit obligation at end of year |
$ | 76,889 | $ | 82,163 | ||||
| Change in plan assets |
||||||||
| Fair value at beginning of year |
$ | 39, 111 | $ | 46,329 | ||||
| Actual return on plan assets |
9,106 | (14,313 | ) | |||||
| Employer contributions |
4,190 | 8,974 | ||||||
| Benefits paid |
(2,086 | ) | (1,880 | ) | ||||
| Fair value at end of year |
$ | 50,321 | $ | 39,110 | ||||
| December 31, | ||||||||
| 2009 | 2008 | |||||||
| Development of net amount recognized |
||||||||
| Funded status |
$ | (26,568 | ) | $ | (43,052 | ) | ||
| Unrecognized net prior service cost |
— | — | ||||||
| Unrecognized actuarial loss |
— | — | ||||||
| Net amount recognized in long-term liabilities |
$ | (26,568 | ) | $ | (43,052 | ) | ||
F-27
Table of Contents
KRATON PERFORMANCE POLYMERS, INC.
Notes to Consolidated Financial Statements—(Continued)
The projected benefit obligation, fair value of plan assets and accumulated benefit obligation for the Plan with accumulated benefit obligations in excess of plan assets were $76.9 million, $50.3 million and $67.7 million, respectively, as of December 31, 2009 and $82.2 million, $39.1 million and $70.0 million, respectively, as of December 31, 2008.
Net periodic pension costs consist of the following components:
| December 31, | ||||||||||||
| 2009 | 2008 | 2007 | ||||||||||
| (in thousands) | ||||||||||||
| Service cost benefits earned during the period |
$ | 2,813 | $ | 2,281 | $ | 2,561 | ||||||
| Interest on prior year’s projected benefit obligation |
4,690 | 4,275 | 3,842 | |||||||||
| Expected return on plan assets |
(4,680 | ) | (4,084 | ) | (3,646 | ) | ||||||
| Amortization of net actuarial |
514 | — | — | |||||||||
| Recognized curtailment loss |
— | — | — | |||||||||
| Recognized loss due to special term benefits |
— | 158 | — | |||||||||
| Net periodic pension costs |
$ | 3,337 | $ | 2,630 | $ | 2,757 | ||||||
Discount rates are determined annually and are based on rates of return of high-quality long-term fixed income securities currently available and expected to be available during the maturity of the pension benefits.
| December 31, | ||||||
| 2009 | 2008 | |||||
| Weighted average assumptions used to determine benefit obligations |
||||||
| Measure date |
12/31/2009 | 12/31/2008 | ||||
| Discount rate |
6.38 | % | 5.73 | % | ||
| Rates of increase in salary compensation level |
3.00 | % | 3.70 | % | ||
| Weighted average assumptions used to determine periodic benefit cost |
||||||
| Discount rate |
5.73 | % | 6.64 | % | ||
| Rates of increase in salary compensation level |
3.70 | % | 3.50 | % | ||
| Expected long-term rate of return on plan assets |
8.50 | % | 8.50 | % | ||
The expected long-term rate of return on assets assumption is derived from a study conducted by our actuaries. The study includes a review of anticipated future long-term performance of individual asset classes and consideration of the appropriate asset allocation strategy given the anticipated requirements of the plan to determine the average rate of earnings expected on the funds invested to provide for the pension plan benefits. While the study gives appropriate consideration to recent fund performance and historical returns, the assumption is primarily a long-term, prospective rate. Based on our most recent study, the expected long-term return assumption for our U.S. plan effective for the current year will remain at 8.5%.
Plan Assets. We maintain target allocation percentages among various asset classes based on an investment policy established for the pension plan. The target allocation is designed to achieve long term objectives of return, while mitigating against downside risk and considering expected cash flows. The current weighted-average target asset allocation is as follows: equity securities 64.0%, debt securities 35.5%, real estate 0.0%, and other 0.5%. Our investment policy is reviewed from time to time to ensure consistency with our long term objective.
F-28
Table of Contents
KRATON PERFORMANCE POLYMERS, INC.
Notes to Consolidated Financial Statements—(Continued)
Our pension plan asset allocations at December 31, 2009, and 2008, by asset category are as follows:
| Percentage of Plan Assets at December 31 |
||||||
| Asset Category |
2009 | 2008 | ||||
| Equity securities |
64.6 | % | 62.5 | % | ||
| Debt securities |
34.9 | % | 37.0 | % | ||
| Real estate |
0.0 | % | 0.0 | % | ||
| Other |
0.5 | % | 0.5 | % | ||
| Total |
100.0 | % | 100.0 | % | ||
Equity securities include our common stock in the amounts of $0 (0 percent of total assets) and $0 (0 percent of total assets) at December 31, 2009, and 2008, respectively.
The fair value of the Company’s pension plan assets at December 31, 2009, by asset category are as follows:
| Pension Plan Assets Fair Value Measurements at December 31, 2009 | ||||||||||||
| Total | Quoted Prices In Active Markets Identical Assets (Level 1) |
Significant Observable Inputs (Level 2) |
Significant Unobservable Inputs (Level 3) | |||||||||
| (In thousands) | ||||||||||||
| Money Market Mutual Fund |
$ | 244 | $ | 244 | $ | — | $ | — | ||||
| Commingled Pool Equity |
||||||||||||
| FMTC US Equity Index Pool (d) |
6,224 | 6,224 | ||||||||||
| Pyramis Intl Growth Com Pool (e) |
3,015 | 3,015 | ||||||||||
| Pyramis Quant LG Cap Cor Com Pool (f) |
2,547 | 2,547 | ||||||||||
| Pyramis Select Intl Equity (g) |
5,486 | 5,486 | ||||||||||
| Pyramis Small Company Com Pool (h) |
5,008 | 5,008 | ||||||||||
| Pyramis US Total Market Equity (i) |
10,230 | 10,230 | ||||||||||
| Total |
32,510 | 32,510 | ||||||||||
| Commingled Pool Debt |
||||||||||||
| Pyramis EMG MKT Debt Com Pool (a) |
1,022 | 1,022 | ||||||||||
| Pyramis High Yield Bond Com Pool (b) |
2,095 | 2,095 | ||||||||||
| Pyramis Long Duration (c) |
14,451 | 14,451 | ||||||||||
| Total |
17,568 | 17,568 | ||||||||||
| Total |
$ | 50,322 | $ | 244 | $ | 50,078 | $ | — | ||||
| (a) | Portfolio with the primary objective to achieve superior total returns primarily through investments in debt securities of emerging countries. |
| (b) | Portfolio with the primary objective to achieve superior total returns through investments in a universe of lower-rated and non-rated debt securities providing high current income. |
| (c) | Portfolio with the primary objective to generate returns that exceed the Barclays Capital® US Long Government/Credit Bond Index through investments in investment-grade fixed-income securities and commingled vehicles. |
| (d) | Portfolio with the primary objective to provide investment results that correspond to the total return performance of common stocks publicly traded in the United States. |
F-29
Table of Contents
KRATON PERFORMANCE POLYMERS, INC.
Notes to Consolidated Financial Statements—(Continued)
| (e) | Portfolio with the primary objective to seek long-term growth of capital primarily through investments in foreign equity securities. |
| (f) | Portfolio with the primary objective to consistently provide excess return over the S&P 500® Index through active stock selection while maintaining portfolio risk characteristics similar to the benchmark. |
| (g) | Portfolio with the primary objective to seek long-term growth of capital primarily through investments in foreign securities. |
| (h) | Portfolio with the primary objective to achieve long-term growth of capital, principally by investing in the equity securities of smaller, growing companies. |
| (i) | Portfolio with the primary objective to provide excess return over a market cycle relative to the Dow Jones U.S. Total Stock Market Index® (Index), an unmanaged index of all U.S. headquartered companies maintained by Whilshire Associates, while maintaining similar style characteristics and sector weights. |
Contributions. We expect to contribute $3.2 million to our pension plan in 2010.
Estimated Future Benefit Payments.
The following benefit payments, which reflect expected future service, as appropriate, are expected to be paid:
| (in thousands) | |||
| 2010 |
2,202 | ||
| 2011 |
2,382 | ||
| 2012 |
2,572 | ||
| 2013 |
2,845 | ||
| 2014 |
3,230 | ||
| Years 2015-2019 |
23,120 | ||
| $ | 36,351 | ||
(b) Other Retirement Benefit Plans. Certain employees are eligible to participate in a non-qualified defined benefit restoration plan and/or a non-qualified defined contribution restoration plan (“benefit restoration plans”) which are intended to restore certain benefits under the noncontributory defined benefit pension plan in the United States and the Kraton Savings Plan in the United States, respectively, which would otherwise be lost due to certain limitations imposed by law on tax-qualified plans. We made $0.9 million in contributions to the benefit restoration plans for the years ended December 31, 2009 and no contribution for the year ended December 31, 2008 and 2007. As of December 31, 2009 and 2008, amounts recognized in the statement of financial position as a component of long-term liabilities for the benefit restoration plans were $0.4 million and $1.0 million, respectively.
We have established a defined benefit plan in Japan designed to be equivalent to the plan previously provided by Shell Chemicals.and covers substantially all Japan employees. Our contributions to the plan for the years ended December 31, 2009, 2008 and 2007 were $0.19 million, $0 million, and $0.02 million, respectively. As of December 31, 2009, 2008, and 2007 amounts recognized in the statement of financial position as a component of long-term liabilities for the defined benefit plan were $1.3 million, $1.3 million and $0.9 million, respectively.
(c) Postretirement Benefits Other Than Pensions. Health and welfare benefits are provided to benefit eligible employees in the United States who retire from Kraton and were employed by us prior to January 1, 2006. Retirees under the age of 65 are eligible for the same medical, dental, and vision plans as active employees, but with an annual cap on premiums that varies based on years of service and ranges from $7,000 to
F-30
Table of Contents
KRATON PERFORMANCE POLYMERS, INC.
Notes to Consolidated Financial Statements—(Continued)
$10,000 per employee. Our subsidy schedule for medical plans is based on accredited service at retirement. Retirees are responsible for the full cost of premiums for postretirement dental and vision coverage. In general, the plans stipulate that health and welfare benefits are paid as covered expenses are incurred. We accrue the cost of these benefits during the period in which the employee renders the necessary service.
Employees who were retirement eligible as of February 28, 2001, have at their option the right to participate in either Shell Chemicals or Kraton postretirement health and welfare plans.
ASC 715, “Compensation-Retirement Benefits,” requires that we measure the plans’ assets and obligations that determine our funded status as of the end of the fiscal year. The 2009 measurement date of the plans’ assets and obligations was December 31, 2009. We are also required to recognize as a component of accumulated other comprehensive income the changes in funded status that occurred during the year that are not recognized as part of new periodic benefit cost.
Based on the funded status of our postretirement benefit plan as of December 31, 2009, we reported a decrease of approximately $0.8 million in accrued postretirement obligations.
It has been determined that the plan’s retiree prescription plan is actuarially equivalent for the Medicare Part D subsidy. The accumulated postretirement benefit obligation for the year ended December 31, 2009 decreased approximately $3.2 million due to the inclusion of the Medicare Part D subsidy.
Information concerning the plan obligation, the funded status and amounts recognized in our financial statements and underlying actuarial assumptions are as follows:
| December 31, | ||||||||
| 2009 | 2008 | |||||||
| (in thousands) | ||||||||
| Change in benefit obligation: |
||||||||
| Benefit obligation at beginning of period |
$ | 16,138 | $ | 13,341 | ||||
| Service cost |
392 | 332 | ||||||
| Interest cost |
1,058 | 871 | ||||||
| Benefits paid |
(614 | ) | (772 | ) | ||||
| Actuarial loss |
1,499 | 2,102 | ||||||
| Plan amendments |
— | 264 | ||||||
| Benefit obligation at end of period |
$ | 18,473 | $ | 16,138 | ||||
| Reconciliation of plan assets (1): |
||||||||
| Employer contributions |
$ | 614 | $ | 772 | ||||
| Benefits paid |
(614 | ) | (772 | ) | ||||
| $ | — | $ | — | |||||
| (1) | As part of the Ripplewood Transaction, Shell Chemicals has committed to a future cash payment related to retiree medical expenses based on a specified dollar amount per employee, if certain contractual commitments are met. We have recorded an asset of approximately $6.6 million and $6.5 million as our estimate of the present value of this commitment as of December 31, 2009 and 2008, respectively. |
| December 31, | ||||||||
| 2009 | 2008 | |||||||
| (in thousands) | ||||||||
| Development of net amount recognized: |
||||||||
| Funded status |
$ | (18,474 | ) | $ | (16,138 | ) | ||
| Unrecognized cost: Actuarial gain |
— | — | ||||||
| Amount recognized in long-term liabilities |
$ | (18,474 | ) | $ | (16,138 | ) | ||
F-31
Table of Contents
KRATON PERFORMANCE POLYMERS, INC.
Notes to Consolidated Financial Statements—(Continued)
Net periodic benefit costs consist of the following components:
| December 31, | |||||||||
| 2009 | 2008 | 2007 | |||||||
| (in thousands) | |||||||||
| Service cost |
$ | 392 | $ | 332 | $ | 357 | |||
| Interest cost |
1,058 | 871 | 776 | ||||||
| Amortization of net actuarial loss |
231 | — | — | ||||||
| Restructuring costs |
— | 264 | — | ||||||
| Net periodic benefit costs |
$ | 1,681 | $ | 1,467 | $ | 1,133 | |||
| December 31, | ||||||
| 2009 | 2008 | |||||
| Weighted average assumptions used to determine benefit obligations |
||||||
| Measurement date |
12/31/2009 | 12/31/2008 | ||||
| Discount rate |
6.17 | % | 5.76 | % | ||
| Rates of increase in salary compensation level |
N/A | N/A | ||||
| Weighted average assumptions used to net periodic benefit cost |
||||||
| Discount rate |
5.76 | % | 6.49 | % | ||
| Rates of increase in salary compensation level |
N/A | N/A | ||||
| Expected long-term rate of return on plan assets |
N/A | N/A | ||||
| December 31, | ||||||
| 2009 | 2008 | |||||
| Assumed health care cost trend rates |
||||||
| Health care cost trend rate assumed for next year |
8.00 | % | 8.75 | % | ||
| Rate to which the cost trend rate is assumed to decline (the ultimate trend rate) |
4.00 | % | 5.00 | % | ||
| Year that the rate reaches the ultimate trend rate |
2014 | 2014 | ||||
The discount rate for 2009 was based in part on the average Moody’s Aa Corporate Bond Yield and the average Citigroup Pension Liability Index, which were 5.49% and 5.96%, respectively. The Fidelity Investments bond modeler was used to compare the expected future cash outflows to the bonds included in the indices noted above.
Assumed health care cost trend rates have a significant effect on the amounts reported for the health care plans. A 1%-point change in assumed health care cost trend rates would have the following effect (in thousands):
| 1% Increase | 1% Decrease | ||||||
| Effect on total of service and interest cost components |
$ | 52 | $ | (76 | ) | ||
| Effect on postretirement benefit obligation |
622 | (931 | ) | ||||
(d) Kraton Savings Plan. The Kraton Savings Plan, as adopted on March 1, 2001, covers substantially all U.S. employees, including executive officers. We amended and restated the Savings Plan in April 2002, to comply with changes in legislation in 2002, and subsequently submitted and received an IRS determination letter.
Through automatic payroll deduction, participants have the option to defer up to 60% of eligible earnings in any combination of pretax and/or post-tax contributions. Contributions are subject to annual dollar limitations set forth in the Internal Revenue Code. Effective January 1, 2006 we modified the Kraton Savings Plan to have three
F-32
Table of Contents
KRATON PERFORMANCE POLYMERS, INC.
Notes to Consolidated Financial Statements—(Continued)
types of employer contributions. After completing one year of service, we will make a matching contribution of 50% of the first 6% contributed by the employee and after completing five years of service we will make a matching contribution of 100% of the first 6% contributed by the employee. For employees who have completed nine or more years of service and elected to remain a participant in the pension plan, we made a transition contribution of 4% during 2006 and reduced transition contribution of 2% in 2007. For employees who elected to lock in their Kraton pension benefits as of December 31, 2005, we make enhanced employer contributions of 3% for employees who have less than five years of service and a 4% contribution for employees who have five or more years of service. For our employees who were employed as of February 28, 2001, and who were previously employed by Shell Chemicals, we recognize their Shell Chemicals years of service for purposes of determining employer contributions under our Plan. Overall, a participant may direct up to a maximum of 100% of eligible earnings to this Plan, but cannot exceed the IRS maximum limit for the combined total of employee and employer contributions. Our contributions to the plan for the year ended December 31, 2009, 2008 and 2007, were $2.7 million, $2.2 million, and $2.7 million, respectively.
(e) Membership Units. Prior to the IPO, we provided certain key employees who held interests in us prior to the acquisition the opportunity to roll over their interests into membership units of Management LLC, which owned a corresponding number of membership units in TJ Chemical. Additional employees were also given the opportunity to purchase membership units in TJ Chemical through Management LLC at the original buy-in price. The membership units were subject to customary tag-along and drag-along rights, as well as a company call right in the event of termination of employment. In addition, pursuant to Messrs. Gregory and Fogarty employment agreements, on September 10, 2004 and June 15, 2005, TJ Chemical granted a notional restricted unit award with a fair value at the grant date of $875,000 and $300,000, to Messrs. Gregory and Fogarty, respectively. Each of these awards vested 20% on each of the first five anniversaries of their employment commencement dates, so long as Messrs. Gregory and Fogarty remain employed by us through the applicable vesting date. The actual membership units would not be distributed until the earlier of: (1) a change in control; or (2) the termination of either Messrs. Gregory and Fogarty’s employment. TJ Chemical granted two restricted membership unit awards having a fair value at the grant date of $200,000 and $100,000 each to David Bradley. The award for $200,000 vested 20% on each of the first five anniversaries of his employment commencement date (April 1, 2004), so long as Mr. Bradley remained employed by us through the applicable vesting date. The award for $100,000 vests 20% on each of the first five anniversaries and commenced vesting, on February 1, 2006, so long as Mr. Bradley remains employed by us through the applicable vesting date. TJ Chemical granted a restricted membership unit award to Nicholas G. Dekker on October 6, 2006 having a fair value at the grant date of $150,000. This award vested 20% on each of the first five anniversaries of his employment as our Chief Financial Officer and Vice President (October 6, 2006), for so long as Mr. Dekker remained employed by us through the applicable vesting date. In connection with their promotions, Messrs. Fogarty and Bradley were awarded additional restricted membership units in the amount of 600,000 and 300,000, respectively, on June 19, 2008. These restricted Membership Units vest 1/3 on each of the first three anniversaries of the grant date, so long as they remain employed through the applicable vesting date. The amount to Messrs. Gregory, Bradley, Fogarty and Dekker will be recognized in earnings over the vesting period on a straight-line basis.
In connection with his termination of employment, Mr. Gregory retained 151,000 membership units, and was paid out at a price of $1.00 per unit for 149,000 units as part of his Separation Agreement. In connection with his termination of employment, Mr. Dekker was paid out at a price of $1.00 per unit for his total units of $50,000. As of December 31, 2008, there were 1,886,000 membership units of Management LLC issued and outstanding.
Effective as of the IPO, Management LLC transferred all outstanding grants of membership units to Polymer Holdings (now Kraton Performance Polymers, Inc). The outstanding equity and equity awards of
F-33
Table of Contents
KRATON PERFORMANCE POLYMERS, INC.
Notes to Consolidated Financial Statements—(Continued)
Management LLC held by the employees were cancelled and converted into equity or equity awards of equal value of common shares of Kraton Performance Polymers, Inc. The remaining terms of all outstanding awards remained substantially the same, including with respect to vesting and forfeiture provisions.
(f) TJ Chemical Holdings LLC 2004 Option Plan. On September 9, 2004, TJ Chemical adopted an option plan, or the Option Plan, which allows for the grant to key employees, consultants, members and service providers of TJ Chemical and its affiliates, including us, of non-qualified options to purchase TJ Chemical membership units. The aggregate number of membership units with respect to which options may be granted under the Option Plan shall not exceed an amount representing 8% of the outstanding membership units and profits units of TJ Chemical on March 31, 2004, on a fully diluted basis. As of December 31, 2008 and 2007 there were 22,101,118 and 14,670,000 options granted and outstanding, respectively. All options granted in fiscal 2008, fiscal 2007 and fiscal 2006 had an exercise price of $1 per membership unit, which is equal to or in excess of the fair value of the membership unit on the date of grant. The options generally vest in 20% annual increments from the date of grant. However, the Compensation Committee determined that a shorter vesting period was appropriate for grants made during the 2008 fiscal year and therefore options granted in 2008 were set to vest in increments of 1/3 over 3 years. With respect to directors, previous to 2008 options were exercisable in 50% increments annually on each of the first two anniversaries of the grant date, so long as the holder of the option is still a director on the vesting date. In 2008, options granted to directors were granted in increments of 1/3 over 3 years, except the Chairman who has a one year vesting period. The exercise price per membership unit shall equal the fair market value of a membership unit on the date of exercised. Upon a change in control, the options will become 100% vested if the participant’s employment is terminated without cause or by the participant for good reason (as each term is defined in the Option Plan) within the 2-year period immediately following such change in control.
The Compensation Committee of Kraton Performance Polymers administers the Option Plan on behalf of TJ Chemical, including, without limitation, the determination of the individuals to whom grants will be made, the number of membership units subject to each grant and the various terms of such grants. The Committee will have the right to terminate all of the outstanding options at any time and pay the participants an amount equal to the excess, if any, of the fair market value of a membership unit as of such date over the exercise price with respect to such option, or the spread. Generally, in the event of a merger (except a merger where membership unit holders receive securities of another corporation), the options will pertain to and apply to the securities that the option holder would have received in the merger; and in the event of a dissolution, liquidation, sale of assets or any other merger, the Committee has the discretion to: (1) provide for an “exchange” of the options for new options on all or some of the property for which the membership units are exchanged (as may be adjusted by the Committee); (2) cancel and cash out the options (whether or not then vested) at the spread; or (3) provide for a combination of both. Generally, the Committee may make appropriate adjustments with respect to the number of membership units covered by outstanding options and the exercise price in the event of any increase or decrease in the number of membership units or any other corporate transaction not described in the preceding sentence.
On a termination of a participant’s employment (other than without cause or by the participant for good reason within the 2-year period immediately following a change in control), unvested options automatically expire and vested options expire on the earlier of: (1) the commencement of business on the date the employment is terminated for cause; (2) 90 days after the date employment is terminated for any reason other than cause, death or disability; (3) 1-year after the date employment is terminated by reason of death or disability; or (4) the 10th anniversary of the grant date for such option.
Generally, pursuant to TJ Chemical’s operating agreement, membership units acquired pursuant to the Option Plan are subject to customary tag-along and drag-along rights for the 180-day period following the later
F-34
Table of Contents
KRATON PERFORMANCE POLYMERS, INC.
Notes to Consolidated Financial Statements—(Continued)
of a termination of employment and 6 months and 1-day following the date that units were acquired pursuant to the exercise of the option, TJ Chemical has the right to repurchase each membership unit then owned by the participant at fair value, as determined in good faith by the Board of Directors of TJ Chemical.
As of the effective date of the IPO, TJ Chemical transferred all benefits under the Option Plan and all outstanding grants of awards to Kraton Performance Polymers, Inc. In addition, any future awards payable in membership units of TJ Chemical will be adjusted to provide for a distribution of Kraton Performance Polymers, Inc. shares of equal value. The remaining terms of all outstanding awards remain substantially the same, including with respect to vesting and forfeiture provisions.
Furthermore, effective as of the date of the IPO, the outstanding equity and equity awards of TJ Chemical held by the Named Executive Officers were cancelled and converted into equity or equity awards, as applicable, of Kraton Performance Polymers, Inc. Each membership unit was exchanged for a number of common shares of Kraton Performance Polymers, Inc. of equal value and each option was converted, in compliance with Section 409A of the Code, into an option to purchase a number of common shares equal in value to the number of membership units underlying the option at the date of the IPO, rounded down to the nearest whole share.
(g) Polymer Holdings 2009 Equity Incentive Plan. On November 30, 2009, the Kraton Performance Polymers, Inc. board of directors and our stockholders approved the Polymer Holdings LLC Equity Incentive Plan (the “Equity Plan”) The Equity Plan allows for the grant to key employees, independent contractors, and eligible non-employee directors of incentive stock options (“ISOs”, non-qualified stock options (“NSOs” and together with the ISOs, “Options”), stock appreciation rights (“SARs”), restricted stock awards and restricted stock unit awards, in addition to other equity or equity-based awards as the board determines is necessary from time to time. As of the IPO, there were 4,350,000 shares of common stock reserved for issuance under the Equity Plan. Shares of common stock issued under the Equity Plan may be either authorized and unissued shares or treasury shares, or both, at the sole discretion of the Committee. Subject to the terms of the Equity Plan, we reserved shares, which may be issued pursuant to incentive stock options (“ISOs”). Any shares covered by an award that are not purchased or are forfeited or otherwise terminated shall be available for future grants under the Equity Plan. Furthermore, no participant may receive awards under the Equity Plan in any calendar year that relate to more than 300,000 shares of common stock.
The Committee will determine which employees and independent contractors are eligible to receive awards under the Equity Plan. In addition, the Committee will interpret the Equity Plan and may adopt any administrative rules, regulations, procedures and guidelines governing the Equity Plan or any awards granted under the Equity Plan as it deems to be appropriate. The Board may grant awards to directors. On or after the date of grant of an award, the Committee may (i) in the event of the Participant’s death, disability or retirement, or in the event of a change in control, accelerate the date on which any such award becomes vested or exercisable, as the case may be, (ii) accelerate the date on which any such award becomes transferable, (iii) extend the term of any such award, (iv) waive any conditions to the vesting, exercisability or transferability, as the case may be of such award or (v) provide for the payment of dividends or dividend equivalents with respect to any such award; provided such action would not cause tax to become due under Section 409A of the Code. The Equity Plan may be further amended or terminated by our board of directors at any time, but no amendment may be made without stockholder approval if it would require approval by stockholders in order to comply with any applicable law, regulation or the rules of the New York Stock Exchange.
The Committee may grant other stock-based awards to employees and independent contractors and our board of directors may grant such awards to directors subject to such terms and conditions as the Committee or our board of directors, as appropriate, may determine. Each such award may (i) involve the transfer of actual shares of our common stock to participants, either at the time of grant or thereafter, or payment in cash or otherwise of amounts
F-35
Table of Contents
KRATON PERFORMANCE POLYMERS, INC.
Notes to Consolidated Financial Statements—(Continued)
based on the value of shares of our common stock, (ii) be subject to performance-based and/or service-based conditions, (iii) be in the form of phantom stock, restricted stock, restricted stock units, performance shares, deferred share units or share-denominated performance units, (iv) be designed to comply with applicable laws of jurisdictions other than the United States and (v) be designed to qualify as performance-based compensation.
The amount payable with respect to an award that is intended to qualify as performance-based compensation under the Equity Plan shall be determined in any manner permitted by Section 162(m) of the Code. The Committee shall establish performance measures, the level of actual achievement of performance goals and the amount payable with respect to an award intended to qualify under Section 162(m) of the Code. The grant, exercise and/or settlement of such performance or annual incentive award shall be contingent upon achievement of pre-established performance goals which shall consist of one or more business criteria and a targeted level or levels of performance with respect to each of such criteria. Performance goals shall be objective and shall otherwise meet the requirements of Section 162(m) of the Code.
We awarded 74,008 shares of restricted stock to our executives on December 22, 2009, the date the IPO closed, as follows: Mr. Fogarty, 37,004; Mr. Bradley, 22,202; and Mr. Tremblay, 14,802.
(h) Other Equity Awards. We provided certain key employees with a grant of profits units of Kraton Management LLC (subject to the 8% pool limitation described above). Profits units are economically equivalent to an option, except that they provide the recipient/employee with an opportunity to recognize capital gains in the appreciation of TJ Chemical and its affiliates and TJ Chemical and its affiliates does not receive any deduction at the time of grant or disposition of the profits unit by the employee. Generally, pursuant to the applicable grant agreements, 50% of such profits units will vest when the fair value of TJ Chemical’s assets equals or exceeds two times the Threshold Amount, i.e., the first tranche, and the remaining 50% will vest when the fair value of TJ Chemical’s assets equals or exceeds three times the threshold amount, i.e., the second tranche, in each case, as determined by the Board of TJ Chemical, provided that the executive remains employed through the applicable vesting date. Additionally, 100% of the profits units shall vest upon the effective date of a disposition by the initial investors of 51% or more of their aggregate interests in Kraton. If at the time TJ Chemical makes a determination as to whether an individual is entitled to any appreciation with respect to the profits units, the value of the assets is more than two times, but less than three times the Threshold Amount, a pro rata portion of the second tranche will vest based on the appreciation above the two times Threshold Amount. Compensation expense will be recorded in our consolidated financial statements for this difference at the time it becomes probable the profits units will become vested. If an employees’ employment terminates prior to any applicable vesting date, such employee shall automatically forfeit all rights to any unvested profits units. As of December 31, 2009 and 2008, there were 0 shares and 900,000 profits units granted and not yet vested, respectively.
In connection with the IPO, each award of profits units was converted into a number of shares of restricted shares equal to the quotient of (i) the product of the number of profits units multiplied by the Profits Unit Value (as defined below) divided by (ii) the value of a common share of our company immediately following the closing date of the offering. For these purposes, “Profits Unit Value” means, with respect to an award of profits units, the difference between the fair value of a membership unit immediately prior to the closing of the offering and $1.00 (which represents the value of a membership unit on the date the profits unit award was granted).
(i) 2009 Incentive Compensation Plan. On February 13, 2009, the Compensation Committee of the Board of Directors of Kraton Performance Polymers, Inc. approved and adopted the 2009 Incentive Compensation Plan, including the performance-based criteria by which potential bonus payouts to participants will be determined.
The bonus pool was based largely on EBITDA performance and as a result of our actual performance against targeted levels of EBITDA there were no incentive compensation awards under this plan in 2009.
F-36
Table of Contents
KRATON PERFORMANCE POLYMERS, INC.
Notes to Consolidated Financial Statements—(Continued)
8. Commitments and Contingencies
(a) Lease Commitments
We have entered into various long-term non-cancelable operating leases. Future minimum lease commitments at December 31, 2009, are as follows: 2010—$5.4 million; 2011—$5.0 million; 2012—$4.9 million; 2013—$2.5 million; 2014—$2.3 million and thereafter—$13.1 million. We recorded $4.1 million, $8.4 million and $8.5 million in rent expense for the years ended December 31, 2009, 2008 and 2007, respectively.
(b) Environmental and Safety Matters
Our finished products are not classified as hazardous. However, our operations involve the handling, transportation, treatment, and disposal of potentially hazardous materials that are extensively regulated by environmental, health and safety laws, regulations and permit requirements. Environmental permits required for our operations are subject to periodic renewal and can be revoked or modified for cause or when new or revised environmental requirements are implemented. Changing and increasingly strict environmental requirements can affect the manufacturing, handling, processing, distribution and use of our chemical products and the raw materials used to produce such products and, if so affected, our business and operations may be materially and adversely affected. In addition, changes in environmental requirements can cause us to incur substantial costs in upgrading or redesigning our facilities and processes, including waste treatment, disposal, and other waste handling practices and equipment.
We conduct environmental management programs designed to maintain compliance with applicable environmental requirements at all of our facilities. We routinely conduct inspection and surveillance programs designed to detect and respond to leaks or spills of regulated hazardous substances and to correct identified regulatory deficiencies. We believe that our procedures for waste handling are consistent with industry standards and applicable requirements. In addition, we believe that our operations are consistent with good industry practice. However, a business risk inherent with chemical operations is the potential for personal injury and property damage claims from employees, contractors and their employees, and nearby landowners and occupants. While we believe our business operations and facilities generally are operated in compliance, in all material respects, with all applicable environmental and health and safety requirements, we cannot be sure that past practices or future operations will not result in material claims or regulatory action, require material environmental expenditures, or result in exposure or injury claims by employees, contractors and their employees, and the public. Some risk of environmental costs and liabilities are inherent in our operations and products, as it is with other companies engaged in similar businesses.
The Paulinia, Brazil, and Belpre, Ohio facilities are subject to a number of actual and/or potential environmental liabilities primarily relating to contamination caused by former operations at those facilities. Some environmental laws could impose on us the entire costs of cleanup regardless of fault, legality of the original disposal, or ownership of the disposal site. In some cases, the governmental entity with jurisdiction could seek an assessment for damage to the natural resources caused by contamination from those sites. Shell Chemicals has agreed, subject to certain limitations, in time and amounts, to indemnify us against most environmental liabilities related to the acquired facilities that arise from conditions existing prior to the closing.
We had no material operating expenditures for environmental fines, penalties, government imposed remedial or corrective actions in each of the years ended December 31, 2009, 2008 and 2007.
(c) Legal Proceedings
We and certain of our subsidiaries are parties to several legal proceedings that have arisen in the ordinary course of business. While the outcome of these proceedings cannot be predicted with certainty, management does
F-37
Table of Contents
KRATON PERFORMANCE POLYMERS, INC.
Notes to Consolidated Financial Statements—(Continued)
not expect these matters, individually or in the aggregate, to have a material adverse effect upon our financial position, results of operations or cash flows. Furthermore, Shell Chemicals has agreed, subject to certain limitations, to indemnify us for certain claims brought with respect to matters occurring before February 28, 2001.
Effective January 1, 2008, we adopted ASC 820, “Fair Value Measurements and Disclosures.” ASC 820 defines fair value, establishes a consistent framework for measuring fair value and expands disclosure requirements about fair value measurements. ASC 820 requires entities to, among other things, maximize the use of observable inputs and minimize the use of unobservable inputs when measuring fair value.
ASC 820 defines fair value as the exchange price that would be received for an asset or paid to transfer a liability (an exit price) in the principal or most advantageous market for the asset or liability in an orderly transaction between market participants on the measurement date.
ASC 820 specifies a hierarchy of valuation techniques based on whether the inputs to those valuation techniques are observable or unobservable. Observable inputs reflect market data obtained from independent sources, while unobservable inputs reflect our market assumptions. In accordance with ASC 820, these two types of inputs have created the following fair value hierarchy:
| • | Level 1—Quoted unadjusted prices for identical instruments in active markets. |
| • | Level 2—Quoted prices for similar instruments in active markets; quoted prices for identical or similar instruments in markets that are not active; and model-derived valuations in which all significant inputs and significant value drivers are observable in active markets. |
| • | Level 3—Model-derived valuations in which one or more significant inputs or significant value drivers are unobservable. |
From time to time, we enter into derivative financial instruments that are measured at fair value. See Note 15 for further discussion.
We are party to significant contracts with subsidiaries and affiliates of Shell Chemicals and LyondellBasell. These contracts are for: (1) leases of land and facilities at some of our foreign locations; (2) operating agreements where LyondellBasell operates some of our foreign manufacturing facilities; (3) site services, utilities, material and facilities agreements at some of our foreign manufacturing facilities; (4) raw material supply agreements; and (5) transitional and interim service agreements.
(a) Leases with Shell Chemicals and LyondellBasell. The land on which our manufacturing facility in Berre, France, is located was leased to us by Shell Petrochimie Mediterranee (SPM) through April 1, 2008, at which time the site was sold to LyondellBasell, who now operates the site and with whom our tenancy now exists under a long-term lease due to expire in 2030. Our Wesseling, Germany, manufacturing facility is located on an industrial site belonging to LyondellBasell. LyondellBasell owns the land and buildings at our Wesseling facility and leases same to us. The lease is for a term of 30 years, beginning from March 31, 2000 and is extended automatically for a successive period of 10 years unless terminated upon one-year prior written notice by either party. These lease agreements, including the financial terms thereof, have all been negotiated at arm’s length.
F-38
Table of Contents
KRATON PERFORMANCE POLYMERS, INC.
Notes to Consolidated Financial Statements—(Continued)
(b) Operating Agreements. LyondellBasell operates our manufacturing facility located in Berre, France. This facility is situated on a major LyondellBasell refinery and petrochemical site at which other third party tenants also own facilities and lease space. LyondellBasell charges us fees based on certain costs incurred in connection with operating and maintaining this facility, including the direct and indirect costs of employees and subcontractors, reasonable insurance costs, certain taxes imposed on LyondellBasell (other than income taxes) and depreciation and capital charges on certain assets. Pursuant to the applicable operating agreement, LyondellBasell employs and provides all staff, other than certain plant managers, assistant plant managers and technical personnel whom we may appoint. The agreement has an initial term of 20 years, and thereafter will automatically renew indefinitely for consecutive 5-year periods. Either party may terminate the agreement (totally or partially) under various circumstances, including if the terminating party ceases its operations at the facility and provides 18 (eighteen) months prior written notice; or if any of the services, utilities, materials and facilities agreements have been terminated, and the terminating party provides notice as required by such agreement.
Pursuant to an agreement dated March 31, 2000, LyondellBasell operates and provides certain services, materials and utilities required to operate our manufacturing facility in Wesseling, Germany. We pay LyondellBasell a monthly fee, as well as costs incurred by LyondellBasell in providing the various services, even if the facility fails to produce any output (whether or not due to events within LyondellBasell’s control), and even if we reject some or all output. This agreement has an initial term of 40 years and will automatically renew, subject to 5 (five) years prior written notice of non-renewal. This agreement will terminate at any earlier date as of which the facility can no longer be operated in a safe and efficient manner. These operating agreements, including the financial terms thereof, have all been negotiated at arm’s length.
(c) Site Services, Utilities, Materials and Facilities Agreements. LyondellBasell, through local operating affiliates, provides various site services, utilities, materials and facilities for the Berre, France, manufacturing site. Generally these services, utilities, materials and facilities are provided by LyondellBasell on either a long-term basis, short-term basis or a sole-supplier basis. Items provided on a sole-supplier basis may not be terminated except upon termination of the applicable agreement in its entirety. Items provided on a long-term or short-term basis may be terminated individually under certain circumstances.
(d) Raw Materials Agreements. Styrene, butadiene and isoprene used by our U.S. facilities are primarily supplied by a portfolio of suppliers under long-term supply contracts with various expiration dates. The monomers used by our European facilities are primarily supplied by one or more LyondellBasell entities or affiliates, and other suppliers under long-term supply contracts with various expiration dates. For our U.S. facilities, we also procure a substantial amount of isoprene from a variety of suppliers from Russia, China and Japan. These purchases include both spot and contract arrangements. We generally contract with them on a short-term basis, although the number of such contracts has been increasing since 2008.
We believe our contractual arrangements with our suppliers of styrene, butadiene and isoprene provide an adequate supply of raw materials at competitive, market-based prices.
Under each of the agreements summarized below, reasonably unforeseen circumstances, including, without limitations, plant breakdowns, will excuse performance by either party. In addition, inability to acquire any supplies or components necessary for manufacturing the applicable raw material from usual sources and on terms the supplier deems reasonable will excuse supplier’s nonperformance.
Styrene. We satisfy our styrene requirements in the United States pursuant to purchase agreements that run through 2011 subject to renewal conditions.
F-39
Table of Contents
KRATON PERFORMANCE POLYMERS, INC.
Notes to Consolidated Financial Statements—(Continued)
Our contracts that satisfied our styrene requirements in Europe expired on February 28, 2010 and we have finalized negotiations with two vendors and expect to execute new supply agreements that we anticipate will provide for European Styrene supply through to February 2013. As contracts expire, we cannot give assurances that we will obtain new long-term supply agreements, or that the terms of any such agreements will be on terms favorable to us, and as a consequence, our future acquisition costs for styrene may therefore increase.
For our agreements covering our manufacturing facility in the United States, the price we pay for styrene varies with the published prices of styrene and/or the raw materials used to produce styrene. The price we pay for styrene under our agreements covering France and Germany varies to reflect the published price for styrene, even though our purchase price is subject to certain minimums and maximums that vary with other factors.
Butadiene. We currently source butadiene in the United States pursuant to contract arrangements with several suppliers, supplemented by spot supply as needed. The price we pay for butadiene is scheduled and varies based on the published prices for butadiene in world markets.
We currently source our butadiene in Europe pursuant to contracts with certain LyondellBasell entities. The contract covering Germany will expire on December 31, 2040, and will be renewed automatically at the conclusion of the current term unless terminated with prior written notice by either party. The contract covering France expired pursuant to its terms on December 31, 2007; provided, however, that on December 12, 2006, we were notified by LyondellBasell of its intention to allow the contract to automatically renew for one year, and to terminate effective December 31, 2008. We are presently acquiring butadiene from an LyondellBasell entity in France under a commercial term sheet, reflecting an agreement in principle that has been reached between the parties. The price we pay for butadiene under our arrangements or agreements covering France and Germany vary based upon the published price for butadiene, the amount of butadiene purchased during the preceding calendar year, and/or the cost of butadiene manufactured. In Brazil, butadiene is obtained from a local third-party source. In Kashima, Japan, a majority of our butadiene needs are sourced from JSR Corporation (“JSR”), on a commercial supply basis.
Isoprene. We source our global isoprene requirements through several contract arrangements. We also purchase some additional supplies of isoprene from various suppliers at prevailing market prices. In Brazil, isoprene is obtained from a local third party supplier. In Kashima, Japan, the majority of our isoprene needs are sourced from JSR on a commercial supply basis and from alternative suppliers as needed.
(e) Infineum
We have entered into several commercial agreements with Infineum, a joint venture between Shell Chemicals and ExxonMobil, related to: (1) the sharing by Infineum of certain production capacity at our Belpre, Ohio manufacturing facility; and (2) our production of certain additives for Infineum at our Belpre, Ohio and our Berre, France, manufacturing facilities. The Belpre, Ohio agreements have a 30-year term, and the Berre, France, agreement has a term ending in December 2010.
11. Related Party Transactions
We own a 50% equity investment in a manufacturing joint venture with JSR Corporation (“JSR”) under the name of Kraton JSR Elastomers K.K. (“KJE”) located in Kashima, Japan. KJE manufactures thermoplastic rubber (“TR”), which is a wholly or predominantly composed of a block co-polymer comprising styrene blocks with butadiene and/or isoprene polymer blocks. KJE produces TR for sale to third party customers only through Kraton and JSR. We and JSR separately, but with equal rights, participate as distributors in the sales of the TR produced by KJE.
F-40
Table of Contents
KRATON PERFORMANCE POLYMERS, INC.
Notes to Consolidated Financial Statements—(Continued)
The aggregate amounts of related-party transactions were as follows:
| December 31, | |||||||||
| 2009 | 2008 | 2007 | |||||||
| Sales to related party |
$ | — | $ | 626 | $ | 1,210 | |||
| Purchases from related party |
$ | 27,763 | $ | 37,894 | $ | 39,741 | |||
A private investment fund managed by TPG Capital L.P., which advises TPG Partners III and TPG Partners IV, has an ownership share of British Vita PLC, one of our customers. From 2007 to 2009 we have derived revenues averaging $9.2 million annually from sales to British Vita. We do not have any contractual requirements for sales to British Vita.
In October 2009, we entered into a contract with Amyris Biotechnologies, Inc. to explore the development of an alternative source of certain raw materials and, subject to Amyris meeting developmental and manufacturing milestones, to purchase raw materials from Amyris. We have not made any purchases to date. TPG Biotechnology II, L.P., a private investment fund that may be deemed to be an affiliate of TPG III and TPG IV, has an ownership share of Amyris Biotechnologies.
Common stock—Kraton Performance Polymers, Inc. has authorized 500.0 million shares of common stock with a par value of $0.01 per share and 100.0 million shares of preferred stock with a par value of $0.01 per share. No preferred stock has been issued.
As of December 31, 2009, there were 29,709,114 common shares issued and outstanding. We held no treasury shares.
Earnings per share—Basic earnings per common share (“EPS”) is computed by dividing net income by the weighted-average number of common shares outstanding during the period. The weighted average number of common shares used in the diluted earnings per share calculation is determined using the treasury stock method. Diluted EPS is computed by dividing net income by the diluted weighted-average number of common shares outstanding during the period. Diluted EPS reflects the potential dilution that could occur if securities or other agreements to issue common stock, such as stock options, stock-based performance awards and preferred stock, were exercised, settled or converted into common stock.
The following table summarizes the effect of the share-based compensation awards on the weighted- average number of shares outstanding used in calculating diluted earnings per share:
| December 31, | |||||||||||
| 2009 | 2008 | 2007 | |||||||||
| (In thousands, except per share data) | |||||||||||
| Net income (loss) as reported |
$ | (290 | ) | $ | 28,419 | $ | (43,749 | ) | |||
| Weighted-average number of common shares for basic earnings per share |
19,844 | 19,406 | 19,375 | ||||||||
| Incremental effect of dilutive common stock equivalents: |
|||||||||||
| Restricted and notional units |
— | 77 | — | ||||||||
| Weighted-average number of shares for diluted earnings per share |
19,844 | 19,483 | 19,375 | ||||||||
| Earnings (loss) per common share—basic |
$ | (0.01 | ) | $ | 1.46 | $ | (2.26 | ) | |||
| Earnings (loss) per common share—dilutive |
$ | (0.01 | ) | $ | 1.46 | $ | (2.26 | ) | |||
F-41
Table of Contents
KRATON PERFORMANCE POLYMERS, INC.
Notes to Consolidated Financial Statements—(Continued)
Restricted and Notional units of 78 and 118 thousand units at December 31, 2009 and 2007, respectively, were not included in the computation of diluted earnings per share because we incurred net losses in those years. Stock option awards of 1,585, 1,636 and 1,086 thousand shares, respectively, were outstanding at December 31, 2009, 2008 and 2007, respectively, and were not included in the computation of diluted earnings per common share because these options were antidilutive.
13. Industry Segment and Foreign Operations
We operate in one segment for the manufacture and marketing of styrenic block copolymers. In accordance with the provisions of ASC 280, “Segment Reporting,” our chief operating decision-maker has been identified as the President and Chief Executive Officer, who reviews operating results to make decisions about allocating resources and assessing performance for the entire company. Since we operate in one segment and in one group of similar products, all financial segment and product line information required by ASC 280 can be found in the consolidated financial statements.
For geographic reporting, revenues are attributed to the geographic location in which the customers’ facilities are located. Long-lived assets consist primarily of property, plant, and equipment, which are attributed to the geographic location in which they are located. Total operating revenues and long-lived assets by geographic region were as follows:
| December 31, | |||||||||
| 2009 | 2008 | 2007 | |||||||
| (in thousands) | |||||||||
| Total Operating Revenues: |
|||||||||
| United States |
$ | 304,265 | $ | 395,568 | $ | 366,048 | |||
| Germany |
121,959 | 149,011 | 145,649 | ||||||
| Japan |
73,055 | 70,169 | 53,479 | ||||||
| The Netherlands |
66,027 | 80,980 | 49,334 | ||||||
| Brazil |
40,438 | 40,868 | 36,732 | ||||||
| China |
37,123 | 31,421 | 33,956 | ||||||
| Italy |
35,934 | 48,328 | 51,569 | ||||||
| Thailand |
28,779 | 22,877 | 14,916 | ||||||
| United Kingdom |
27,425 | 40,401 | 38,364 | ||||||
| France |
27,342 | 39,757 | 30,358 | ||||||
| Belgium |
16,273 | 30,079 | 30,751 | ||||||
| Canada |
16,168 | 25,361 | 22,300 | ||||||
| Taiwan |
15,711 | 18,527 | 20,196 | ||||||
| Poland |
15,537 | 26,934 | 22,604 | ||||||
| Turkey |
12,990 | 15,979 | 14,432 | ||||||
| Sweden |
11,292 | 13,002 | 12,418 | ||||||
| Mexico |
11,029 | 14,028 | 9,460 | ||||||
| Argentina |
10,854 | 17,174 | 14,109 | ||||||
| Republic of Korea |
9,928 | 11,013 | 8,877 | ||||||
| Australia |
9,124 | 15,939 | 8,856 | ||||||
| Denmark |
8,283 | 9,147 | 8,795 | ||||||
| Austria |
8,170 | 13,062 | 9,973 | ||||||
| Malaysia |
6,769 | 4,396 | 3,631 | ||||||
| Switzerland |
4,994 | 5,348 | 4,914 | ||||||
| India |
4,148 | 4,312 | 2,001 | ||||||
| Czech Republic |
4,024 | 4,273 | 4,021 | ||||||
| Hong Kong |
4,000 | 7,430 | 8,369 | ||||||
| All other countries |
36,363 | 70,649 | 63,475 | ||||||
| $ | 968,004 | $ | 1,226,033 | $ | 1,089,587 | ||||
F-42
Table of Contents
KRATON PERFORMANCE POLYMERS, INC.
Notes to Consolidated Financial Statements—(Continued)
During the years ended December 31, 2009, 2008 and 2007, no single customer accounted for 10% or more of our total operating revenues.
| December 31, | |||||||||
| 2009 | 2008 | 2007 | |||||||
| (in thousands) | |||||||||
| Long-lived Assets: |
|||||||||
| United States |
$ | 317,719 | $ | 303,278 | $ | 298,979 | |||
| Germany |
42,724 | 39,361 | 40,406 | ||||||
| Japan |
482 | 6,699 | 3,743 | ||||||
| France |
125,839 | 108,665 | 111,441 | ||||||
| The Netherlands |
36,971 | 34,018 | 34,454 | ||||||
| Brazil |
64,385 | 48,237 | 56,721 | ||||||
| China |
2,334 | 2,317 | 2,119 | ||||||
| All other countries |
964 | 11,685 | 12,050 | ||||||
| $ | 591,418 | $ | 554,260 | $ | 559,913 | ||||
14. Supplemental Guarantor Information
Kraton and Kraton Polymers Capital Corporation, a financing subsidiary, collectively, the Issuers, are co-issuers of the 8.125% Notes. The Guarantor Subsidiaries include Elastomers Holdings LLC, a U.S. holding company, and Kraton Polymers U.S. LLC, a U.S. operating subsidiary, collectively, the Guarantor Subsidiaries, fully and unconditionally guarantee on a joint and several basis, the Issuers’ obligations under the 8.125% Notes. Our remaining subsidiaries are not guarantors of the 8.125% Notes. We do not believe that separate financial statements and other disclosures concerning the Guarantor Subsidiaries would provide any additional information that would be material to investors in making an investment decision.
Correction of immaterial errors. During 2009, we identified errors associated with the classification of certain cash inflows and outflows as disclosed within the condensed consolidating financial information of the issuer, guarantor and non-guarantor subsidiaries for the years ended December 31, 2008 and 2007. The errors were primarily due to the fact that cash outflows associated with disbursements for certain intercompany loans and receipts from collections on these loans were classified within cash flows from financing activities rather than investing activities. Consequently, we have corrected immaterial errors in the accompanying condensed consolidated Statements of Cash Flows for the year ended December 31, 2008 by increasing issuer cash flows used in investing activities by $38.1 million and increasing issuer cash flows provided by financing activities by the same amount, and for the year ended December 31, 2007 by (i) increasing issuer cash flows provided by investing activities by $69 million and increasing issuer cash flows used in financing activities by the same amount, (ii) reducing guarantor subsidiaries’ cash flows from operating activities by $7.2 million and reducing guarantor subsidiaries’ cash flows used in financing activities by the same amount, and (iii) increasing non-guarantor subsidiaries cash flows from operating activities by $7.2 million and increasing non-guarantor subsidiaries’ cash flows used in financing activities by the same amount. The correction of these errors does not impact the net change in cash and cash equivalents, has no impact on net income and is not material to our previously reported Consolidating Statements of Cash Flows.
F-43
Table of Contents
KRATON PERFORMANCE POLYMERS, INC.
Notes to Consolidated Financial Statements—(Continued)
KRATON PERFORMANCE POLYMERS, INC.
CONSOLIDATING BALANCE SHEET
December 31, 2009
(In thousands, except par value)
| Kraton Performance Polymers (1) |
Kraton (2) | Guarantor Subsidiaries |
Non-Guarantor Subsidiaries |
Eliminations | Consolidated | ||||||||||||||||||
| ASSETS |
|||||||||||||||||||||||
| Current Assets |
|||||||||||||||||||||||
| Cash and cash equivalents |
$ | — | $ | — | $ | 36,567 | $ | 32,724 | $ | — | $ | 69,291 | |||||||||||
| Receivables, net of allowance |
— | — | 41,194 | 74,135 | — | 115,329 | |||||||||||||||||
| Inventories of products, net |
— | — | 124,003 | 160,255 | — | 284,258 | |||||||||||||||||
| Inventories of materials and supplies, net |
— | — | 6,830 | 4,032 | — | 10,862 | |||||||||||||||||
| Deferred income taxes |
— | — | — | 3,107 | — | 3,107 | |||||||||||||||||
| Other current assets |
— | 1,086 | 1,421 | 14,263 | — | 16,770 | |||||||||||||||||
| Total current assets |
— | 1,086 | 210,015 | 288,516 | — | 499,617 | |||||||||||||||||
| Property, plant and equipment, less accumulated depreciation |
— | 85,284 | 171,024 | 98,552 | — | 354,860 | |||||||||||||||||
| Identifiable intangible assets, less accumulated amortization |
— | 13,541 | 15,322 | 46,938 | — | 75,801 | |||||||||||||||||
| Investment in consolidated subsidiaries |
312,164 | 971,995 | — | — | (1,284,159 | ) | — | ||||||||||||||||
| Investment in unconsolidated joint venture |
— | 813 | — | 11,265 | — | 12,078 | |||||||||||||||||
| Deferred financing costs |
— | 7,309 | — | 9 | — | 7,318 | |||||||||||||||||
| Deferred income taxes |
34 | — | — | — | (34 | ) | — | ||||||||||||||||
| Other long-term assets |
— | 1,142 | 468,794 | 95,054 | (540,165 | ) | 24,825 | ||||||||||||||||
| Total Assets |
$ | 312,198 | $ | 1,081,170 | $ | 865,155 | $ | 540,334 | $ | (1,824,358 | ) | $ | 974,499 | ||||||||||
| LIABILITIES AND STOCKHOLDERS’ AND MEMBER’S EQUITY |
|||||||||||||||||||||||
| Current Liabilities |
|||||||||||||||||||||||
| Current portion of long-term debt |
$ | — | $ | 2,304 | $ | — | $ | — | $ | — | $ | 2,304 | |||||||||||
| Accounts payable-trade |
— | 2,699 | 37,732 | 53,063 | — | 93,494 | |||||||||||||||||
| Other payables and accruals |
— | 18,251 | 15,010 | 35,118 | (108 | ) | 68,271 | ||||||||||||||||
| Due to related party |
— | — | — | 19,006 | — | 19,006 | |||||||||||||||||
| Total current liabilities |
— | 23,254 | 52,742 | 107,187 | (108 | ) | 183,075 | ||||||||||||||||
| Long-term debt, net of current portion |
250 | 382,425 | — | — | — | 382,675 | |||||||||||||||||
| Deferred income taxes |
— | 12,858 | — | 630 | — | 13,488 | |||||||||||||||||
| Long-term liabilities |
— | 351,353 | 47,494 | 187,721 | (540,091 | ) | 46,477 | ||||||||||||||||
| Total liabilities |
250 | 769,890 | 100,236 | 295,538 | (540,199 | ) | 625,715 | ||||||||||||||||
| Commitments and contingencies (note 8) |
|||||||||||||||||||||||
| Stockholders’ and Member’s equity |
|||||||||||||||||||||||
| Preferred stock, $0.01 par value; 100,000 shares authorized; none issued |
|||||||||||||||||||||||
| Common stock, $0.01 par value; 500,000 shares authorized; 29,709 shares issued and outstanding |
297 | — | — | — | — | 297 | |||||||||||||||||
| Additional paid in capital |
311,665 | — | — | — | — | 311,665 | |||||||||||||||||
| Member’s equity |
— | 312,164 | 775,493 | 196,502 | (1,284,159 | ) | — | ||||||||||||||||
| Retained Earnings |
(14 | ) | — | — | — | — | (14 | ) | |||||||||||||||
| Accumulated other comprehensive income |
— | (884 | ) | (10,574 | ) | 48,294 | — | 36,836 | |||||||||||||||
| Total stockholders’ and member’s equity |
311,948 | 311,280 | 764,919 | 244,796 | (1,284,159 | ) | 348,784 | ||||||||||||||||
| Total Liabilities and Stockholders’ and Member’s Equity. |
$ | 312,198 | $ | 1,081,170 | $ | 865,155 | $ | 540,334 | $ | (1,824,358 | ) | $ | 974,499 | ||||||||||
| (1) | Kraton Performance Polymers and Polymer Holdings Capital Corporation are the issuers of the 12% Discount Notes. Polymer Holdings Capital Corporation has minimal assets and income. We do not believe that separate financial information concerning the issuers would provide information that would be useful. |
| (2) | Kraton and Kraton Polymers Capital Corporation are the issuers of the 8.125% Notes. Kraton Polymers Capital Corporation has minimal assets and income. We do not believe that separate financial information concerning the Issuers would provide additional information that would be useful. |
F-44
Table of Contents
KRATON PERFORMANCE POLYMERS, INC.
Notes to Consolidated Financial Statements—(Continued)
KRATON PERFORMANCE POLYMERS, INC.
CONSOLIDATING BALANCE SHEET
December 31, 2008
(In thousands)
| Kraton Performance Polymers (1) |
Kraton (2) | Guarantor Subsidiaries |
Non-Guarantor Subsidiaries |
Eliminations | Consolidated | ||||||||||||||||
| ASSETS |
|||||||||||||||||||||
| Current Assets |
|||||||||||||||||||||
| Cash and cash equivalents |
$ | — | $ | — | $ | 65,460 | $ | 35,936 | $ | — | $ | 101,396 | |||||||||
| Receivables, net of allowance |
— | 944 | 45,322 | 68,148 | (18,971 | ) | 95,443 | ||||||||||||||
| Inventories of products, net |
— | — | 145,654 | 187,396 | (8,857 | ) | 324,193 | ||||||||||||||
| Inventories of materials and supplies, net |
— | — | 6,816 | 4,239 | — | 11,055 | |||||||||||||||
| Deferred income taxes |
— | — | 14,778 | — | — | 14,778 | |||||||||||||||
| Other current assets |
— | 2,905 | 720 | 3,144 | — | 6,769 | |||||||||||||||
| Total current assets |
— | 3,849 | 278,750 | 298,863 | (27,828 | ) | 553,634 | ||||||||||||||
| Property, plant and equipment, less accumulated depreciation |
— | 93,782 | 164,396 | 113,830 | — | 372,008 | |||||||||||||||
| Identifiable intangible assets, less accumulated amortization |
— | 20,113 | — | 46,938 | — | 67,051 | |||||||||||||||
| Investment in consolidated subsidiaries |
182,767 | 898,565 | — | — | (1,081,332 | ) | — | ||||||||||||||
| Investment in unconsolidated joint venture |
— | 813 | — | 11,558 | — | 12,371 | |||||||||||||||
| Deferred financing costs |
— | 8,184 | — | — | — | 8,184 | |||||||||||||||
| Deferred income taxes |
31 | 20,131 | — | — | (20,162 | ) | — | ||||||||||||||
| Other long-term assets |
— | 137,954 | 411,841 | 11,739 | (542,908 | ) | 18,626 | ||||||||||||||
| Total Assets |
$ | 182,798 | $ | 1,183,391 | $ | 854,987 | $ | 482,928 | $ | (1,672,230 | ) | $ | 1,031,874 | ||||||||
| LIABILITIES AND MEMBER’S EQUITY |
|||||||||||||||||||||
| Current Liabilities |
|||||||||||||||||||||
| Current portion of long-term debt |
$ | — | $ | 3,343 | $ | — | $ | — | $ | — | $ | 3,343 | |||||||||
| Accounts payable-trade |
— | 2,700 | 36,806 | 35,671 | — | 75,177 | |||||||||||||||
| Other payables and accruals |
— | 15,815 | 26,184 | 27,350 | — | 69,349 | |||||||||||||||
| Due to related party |
— | — | 9,546 | 35,010 | (18,971 | ) | 25,585 | ||||||||||||||
| Total current liabilities |
— | 21,858 | 72,536 | 98,031 | (18,971 | ) | 173,454 | ||||||||||||||
| Long-term debt, net of current portion |
245 | 571,728 | — | — | — | 571,973 | |||||||||||||||
| Deferred income taxes |
— | — | 53,435 | 1,681 | (20,162 | ) | 34,954 | ||||||||||||||
| Long-term liabilities |
— | 408,416 | 53,626 | 143,983 | (542,908 | ) | 63,117 | ||||||||||||||
| Total liabilities |
245 | 1,002,002 | 179,597 | 243,695 | (582,041 | ) | 843,498 | ||||||||||||||
| Commitments and contingencies (note 8) Member’s equity |
|||||||||||||||||||||
| Member’s equity |
182,553 | 182,767 | 694,170 | 213,252 | (1,090,189 | ) | 182,553 | ||||||||||||||
| Accumulated other comprehensive income |
— | (1,378 | ) | (18,780 | ) | 25,981 | — | 5,823 | |||||||||||||
| Total member’s equity |
182,553 | 181,389 | 675,390 | 239,233 | (1,090,189 | ) | 188,376 | ||||||||||||||
| Total Liabilities and Member’s Equity. |
$ | 182,798 | $ | 1,183,391 | $ | 854,987 | $ | 482,928 | $ | (1,672,230 | ) | $ | 1,031,874 | ||||||||
| (1) | Kraton Performance Polymers and Polymer Holdings Capital Corporation are the issuers of the 12% Discount Notes. Polymer Holdings Capital Corporation has minimal assets and income. We do not believe that separate financial information concerning the issuers would provide information that would be useful. |
| (2) | Kraton and Kraton Polymers Capital Corporation are the issuers of the 8.125% Notes. Kraton Polymers Capital Corporation has minimal assets and income. We do not believe that separate financial information concerning the Issuers would provide additional information that would be useful. |
F-45
Table of Contents
KRATON PERFORMANCE POLYMERS, INC.
Notes to Consolidated Financial Statements—(Continued)
KRATON PERFORMANCE POLYMERS, INC.
CONSOLIDATING STATEMENT OF OPERATIONS
Year Ended December 31, 2009
(In thousands)
| Kraton Performance Polymers (1) |
Kraton (2) | Guarantor Subsidiaries |
Non-Guarantor Subsidiaries |
Eliminations | Consolidated | |||||||||||||||||||
| Operating Revenues |
||||||||||||||||||||||||
| Sales |
$ | — | $ | — | $ | 480,438 | $ | 591,309 | $ | (151,385 | ) | $ | 920,362 | |||||||||||
| Other |
— | — | 74 | 47,568 | — | 47,642 | ||||||||||||||||||
| Total operating revenues |
— | — | 480,512 | 638,877 | (151,385 | ) | 968,004 | |||||||||||||||||
| Cost of Goods Sold |
— | (15,654 | ) | 376,543 | 582,968 | (151,385 | ) | 792,472 | ||||||||||||||||
| Gross Profit |
— | 15,654 | 103,969 | 55,909 | — | 175,532 | ||||||||||||||||||
| Operating Expenses |
||||||||||||||||||||||||
| Research and development expenses |
— | — | 13,150 | 8,062 | — | 21,212 | ||||||||||||||||||
| Selling, general and administrative expenses |
— | (1,430 | ) | 45,497 | 35,437 | — | 79,504 | |||||||||||||||||
| Depreciation |
— | 22,039 | 21,598 | 23,114 | — | 66,751 | ||||||||||||||||||
| Total operating expenses |
— | 20,609 | 80,245 | 66,613 | — | 167,467 | ||||||||||||||||||
| Gain on Extinguishment of Debt |
— | 23,831 | — | — | — | 23,831 | ||||||||||||||||||
| Earnings in consolidated subsidiaries |
(288 | ) | 29,893 | — | — | (29,605 | ) | — | ||||||||||||||||
| Equity in Earnings of Unconsolidated Joint Venture |
— | — | — | 403 | — | 403 | ||||||||||||||||||
| Interest Expense (Income), net |
5 | 40,818 | (11,156 | ) | 4,289 | — | 33,956 | |||||||||||||||||
| Income (Loss) Before Income Taxes |
(293 | ) | 7,951 | 34,880 | (14,590 | ) | (29,605 | ) | (1,657 | ) | ||||||||||||||
| Income Tax Expense (Benefit) |
(3 | ) | 8,239 | (876 | ) | (8,727 | ) | — | (1,367 | ) | ||||||||||||||
| Net Income (Loss) |
$ | (290 | ) | $ | (288 | ) | $ | 35,756 | $ | (5,863 | ) | $ | (29,605 | ) | $ | (290 | ) | |||||||
| (1) | Kraton Performance Polymers and Polymer Holdings Capital Corporation are the issuers of the 12% Discount Notes. Polymer Holdings Capital Corporation has minimal assets and income. We do not believe that separate financial information concerning the issuers would provide information that would be useful. |
| (2) | Kraton and Kraton Polymers Capital Corporation are the issuers of the 8.125% Notes. Kraton Polymers Capital Corporation has minimal assets and income. We do not believe that separate financial information concerning the Issuers would provide additional information that would be useful. |
F-46
Table of Contents
KRATON PERFORMANCE POLYMERS, INC.
Notes to Consolidated Financial Statements—(Continued)
KRATON PERFORMANCE POLYMERS, INC.
CONSOLIDATING STATEMENT OF OPERATIONS
Year Ended December 31, 2008
(In thousands)
| Kraton Performance Polymers (1) |
Kraton (2) | Guarantor Subsidiaries |
Non-Guarantor Subsidiaries |
Eliminations | Consolidated | |||||||||||||||||
| Operating Revenues |
||||||||||||||||||||||
| Sales |
$ | — | $ | — | $ | 607,428 | $ | 750,165 | $ | (186,340 | ) | $ | 1,171,253 | |||||||||
| Other |
— | — | — | 54,780 | — | 54,780 | ||||||||||||||||
| Total operating revenues |
— | — | 607,428 | 804,945 | (186,340 | ) | 1,226,033 | |||||||||||||||
| Cost of Goods Sold |
— | 2,356 | 467,079 | 688,188 | (186,340 | ) | 971,283 | |||||||||||||||
| Gross Profit |
— | (2,356 | ) | 140,349 | 116,757 | — | 254,750 | |||||||||||||||
| Operating Expenses |
||||||||||||||||||||||
| Research and development expenses |
— | — | 15,829 | 11,220 | — | 27,049 | ||||||||||||||||
| Selling, general and administrative expenses |
— | 902 | 52,729 | 47,800 | — | 101,431 | ||||||||||||||||
| Depreciation |
— | 18,127 | 21,676 | 13,359 | — | 53,162 | ||||||||||||||||
| Total operating expenses |
— | 19,029 | 90,234 | 72,379 | — | 181,642 | ||||||||||||||||
| Earnings in consolidated subsidiaries |
28,434 | 85,848 | — | — | (114,282 | ) | — | |||||||||||||||
| Equity in Earnings of Unconsolidated Joint Venture |
— | — | — | 437 | — | 437 | ||||||||||||||||
| Interest Expense (Income), net |
24 | 39,394 | (10,576 | ) | 7,853 | — | 36,695 | |||||||||||||||
| Income (Loss) Before Income Taxes |
28,410 | 25,069 | 60,691 | 36,962 | (114,282 | ) | 36,850 | |||||||||||||||
| Income Tax Expense (Benefit) |
(9 | ) | (3,365 | ) | 220 | 11,585 | — | 8,431 | ||||||||||||||
| Net Income (Loss) |
$ | 28,419 | $ | 28,434 | $ | 60,471 | $ | 25,377 | $ | (114,282 | ) | $ | 28,419 | |||||||||
| (1) | Kraton Performance Polymers and Polymer Holdings Capital Corporation are the issuers of the 12% Discount Notes. Polymer Holdings Capital Corporation has minimal assets and income. We do not believe that separate financial information concerning the issuers would provide information that would be useful. |
| (2) | Kraton and Kraton Polymers Capital Corporation are the issuers of the 8.125% Notes. Kraton Polymers Capital Corporation has minimal assets and income. We do not believe that separate financial information concerning the Issuers would provide additional information that would be useful. |
F-47
Table of Contents
KRATON PERFORMANCE POLYMERS, INC.
Notes to Consolidated Financial Statements—(Continued)
KRATON PERFORMANCE POLYMERS, INC.
CONSOLIDATING STATEMENT OF OPERATIONS
Year Ended December 31, 2007
(In thousands)
| Kraton Performance Polymers (1) |
Kraton (2) | Guarantor Subsidiaries |
Non-Guarantor Subsidiaries |
Eliminations | Consolidated | |||||||||||||||||||
| Operating Revenues |
||||||||||||||||||||||||
| Sales |
$ | — | $ | — | $ | 545,203 | $ | 669,809 | $ | (148,968 | ) | $ | 1,066,044 | |||||||||||
| Other |
— | — | — | 23,543 | — | 23,543 | ||||||||||||||||||
| Total operating revenues |
— | — | 545,203 | 693,352 | (148,968 | ) | 1,089,587 | |||||||||||||||||
| Cost of Goods Sold |
— | 2,728 | 458,148 | 626,648 | (148,968 | ) | 938,556 | |||||||||||||||||
| Gross Profit |
— | (2,728 | ) | 87,055 | 66,704 | — | 151,031 | |||||||||||||||||
| Operating Expenses |
||||||||||||||||||||||||
| Research and development expenses |
— | — | 7,851 | 17,014 | — | 24,865 | ||||||||||||||||||
| Selling, general and administrative expenses |
— | (193 | ) | 39,612 | 29,601 | — | 69,020 | |||||||||||||||||
| Depreciation |
— | 19,687 | 20,299 | 11,931 | — | 51,917 | ||||||||||||||||||
| Total operating expenses |
— | 19,494 | 67,762 | 58,546 | — | 145,802 | ||||||||||||||||||
| Earnings in consolidated subsidiaries |
(43,743 | ) | 22,273 | — | — | 21,470 | — | |||||||||||||||||
| Equity in Earnings of Unconsolidated Joint Venture |
— | — | — | 626 | — | 626 | ||||||||||||||||||
| Interest Expense (Income), net |
24 | 45,954 | (9,480 | ) | 6,986 | — | 43,484 | |||||||||||||||||
| Income (Loss) Before Income Taxes |
(43,767 | ) | (45,903 | ) | 28,773 | 1,798 | 21,470 | (37,629 | ) | |||||||||||||||
| Income Tax Expense (Benefit) |
(18 | ) | (2,160 | ) | 4,681 | 3,617 | — | 6,120 | ||||||||||||||||
| Net Income (Loss) |
$ | (43,749 | ) | $ | (43,743 | ) | $ | 24,092 | $ | (1,819 | ) | $ | 21,470 | $ | (43,749 | ) | ||||||||
| (1) | Kraton Performance Polymers and Polymer Holdings Capital Corporation are the issuers of the 12% Discount Notes. Polymer Holdings Capital Corporation has minimal assets and income. We do not believe that separate financial information concerning the issuers would provide information that would be useful. |
| (2) | Kraton and Kraton Polymers Capital Corporation are the issuers of the 8.125% Notes. Kraton Polymers Capital Corporation has minimal assets and income. We do not believe that separate financial information concerning the Issuers would provide additional information that would be useful. |
F-48
Table of Contents
KRATON PERFORMANCE POLYMERS, INC.
Notes to Consolidated Financial Statements—(Continued)
KRATON PERFORMANCE POLYMERS, INC.
CONSOLIDATED STATEMENT OF CASH FLOWS
Year Ended December 31, 2009
(In thousands)
| Kraton Performance Polymers (1) |
Kraton (2) | Guarantor Subsidiaries |
Non-Guarantor Subsidiaries |
Eliminations | Consolidated | |||||||||||||||||||
| Cash flows provided by (used in) operating activities |
$ | — | $ | (39,221 | ) | $ | 53,247 | $ | 58,779 | $ | — | $ | 72,805 | |||||||||||
| Cash flows provided by (used in) investing activities |
||||||||||||||||||||||||
| Proceeds from (payments on) intercompany loans |
— | 79,843 | — | — | (79,843 | ) | — | |||||||||||||||||
| Purchase of plant and equipment, net of proceeds from sales of equipment |
— | — | (28,226 | ) | (6,005 | ) | — | (34,231 | ) | |||||||||||||||
| Purchase of software |
— | — | (15,322 | ) | — | — | (15,322 | ) | ||||||||||||||||
| Net cash provided by (used in) investing activities |
— | 79,843 | (43,548 | ) | (6,005 | ) | (79,843 | ) | (49,553 | ) | ||||||||||||||
| Cash flows provided by (used in) financing activities |
||||||||||||||||||||||||
| Proceeds from debt |
— | 144,000 | — | — | — | 144,000 | ||||||||||||||||||
| Repayment of debt |
— | (308,131 | ) | — | — | — | (308,131 | ) | ||||||||||||||||
| Cash contribution from member |
— | 126,725 | — | — | (126,725 | ) | — | |||||||||||||||||
| Cash distribution to member |
(126,725 | ) | — | — | — | 126,725 | — | |||||||||||||||||
| Public stock offering |
126,725 | — | — | — | — | 126,725 | ||||||||||||||||||
| Deferred financing costs |
— | (3,216 | ) | — | — | — | (3,216 | ) | ||||||||||||||||
| Proceeds from (payments on) intercompany loans |
— | — | (38,592 | ) | (41,251 | ) | 79,843 | — | ||||||||||||||||
| Net cash provided by (used in) financing activities |
— | (40,622 | ) | (38,592 | ) | (41,251 | ) | 79,843 | (40,622 | ) | ||||||||||||||
| Effect of exchange rate difference on cash |
— | — | — | (14,735 | ) | — | (14,735 | ) | ||||||||||||||||
| Net increase (decrease) in cash and cash equivalents |
— | — | (28,893 | ) | (3,212 | ) | — | (32,105 | ) | |||||||||||||||
| Cash and cash equivalents at beginning of period |
— | — | 65,460 | 35,936 | — | 101,396 | ||||||||||||||||||
| Cash and cash equivalents at end of period |
$ | — | $ | — | $ | 36,567 | $ | 32,724 | $ | — | $ | 69,291 | ||||||||||||
| (1) | Kraton Performance Polymers and Polymer Holdings Capital Corporation are the issuers of the 12% Discount Notes. Polymer Holdings Capital Corporation has minimal assets and income. We do not believe that separate financial information concerning the issuers would provide information that would be useful. |
| (2) | Kraton and Kraton Polymers Capital Corporation are the issuers of the 8.125% Notes. Kraton Polymers Capital Corporation has minimal assets and income. We do not believe that separate financial information concerning the Issuers would provide additional information that would be useful. |
F-49
Table of Contents
KRATON PERFORMANCE POLYMERS, INC.
Notes to Consolidated Financial Statements—(Continued)
KRATON PERFORMANCE POLYMERS, INC.
CONSOLIDATED STATEMENT OF CASH FLOWS
Year Ended December 31, 2008
(In thousands)
| Kraton Performance Polymers (1) |
Kraton (2) | Guarantor Subsidiaries |
Non-Guarantor Subsidiaries |
Eliminations | Consolidated | ||||||||||||||||||
| Cash flows provided by (used in) operating activities |
$ | — | $ | (7,968 | ) | $ | 83,530 | $ | (35,335 | ) | $ | — | $ | 40,227 | |||||||||
| Cash flows provided by (used in) investing activities |
|||||||||||||||||||||||
| Purchase of plant and equipment, net of proceeds from sales of equipment |
— | — | (19,123 | ) | (4,944 | ) | — | (24,067 | ) | ||||||||||||||
| Proceeds from (payments on) intercompany loans |
— | (38,144 | ) | — | — | 38,144 | — | ||||||||||||||||
| Net cash provided by (used in) investing activities |
— | (38,144 | ) | (19,123 | ) | (4,944 | ) | 38,144 | (24,067 | ) | |||||||||||||
| Cash flows provided by (used in) financing activities |
|||||||||||||||||||||||
| Proceeds from debt |
— | 316,250 | — | — | — | 316,250 | |||||||||||||||||
| Repayment of debt |
— | (279,644 | ) | — | — | — | (279,644 | ) | |||||||||||||||
| Cash contribution from member |
— | 10,000 | — | — | — | 10,000 | |||||||||||||||||
| Proceeds from insurance note payable |
— | (494 | ) | — | — | — | (494 | ) | |||||||||||||||
| Proceeds from (payments on) intercompany loans |
— | — | (10,099 | ) | 48,243 | (38,144 | ) | — | |||||||||||||||
| Net cash provided by (used in) financing activities |
— | 46,112 | (10,099 | ) | 48,243 | (38,144 | ) | 46,112 | |||||||||||||||
| Effect of exchange rate difference on cash |
— | — | — | (9,153 | ) | — | (9,153 | ) | |||||||||||||||
| Net increase (decrease) in cash and cash equivalents |
— | — | 54,308 | (1,189 | ) | — | 53,119 | ||||||||||||||||
| Cash and cash equivalents at beginning of period |
— | — | 11,152 | 37,125 | — | 48,277 | |||||||||||||||||
| Cash and cash equivalents at end of period |
$ | — | $ | — | $ | 65,460 | $ | 35,936 | $ | — | $ | 101,396 | |||||||||||
| (1) | Kraton Performance Polymers and Polymer Holdings Capital Corporation are the issuers of the 12% Discount Notes. Polymer Holdings Capital Corporation has minimal assets and income. We do not believe that separate financial information concerning the issuers would provide information that would be useful. |
| (2) | Kraton and Kraton Polymers Capital Corporation are the issuers of the 8.125% Notes. Kraton Polymers Capital Corporation has minimal assets and income. We do not believe that separate financial information concerning the Issuers would provide additional information that would be useful. |
F-50
Table of Contents
KRATON PERFORMANCE POLYMERS, INC.
Notes to Consolidated Financial Statements—(Continued)
KRATON PERFORMANCE POLYMERS, INC.
CONSOLIDATED STATEMENT OF CASH FLOWS
Year Ended December 31, 2007
(In thousands)
| Kraton Performance Polymers (1) |
Kraton (2) | Guarantor Subsidiaries |
Non-Guarantor Subsidiaries |
Eliminations | Consolidated | ||||||||||||||||||
| Cash flows provided by (used in) operating activities |
$ | — | $ | (25,177 | ) | $ | 77,721 | $ | 29,193 | $ | — | $ | 81,737 | ||||||||||
| Cash flows provided by (used in) investing activities |
|||||||||||||||||||||||
| Proceeds from (payments on) intercompany loans |
— | 69,070 | — | — | (69,070 | ) | — | ||||||||||||||||
| Purchase of plant and equipment, net of proceeds from sales of equipment |
— | — | (18,584 | ) | (10,086 | ) | — | (28,670 | ) | ||||||||||||||
| Net cash provided by (used in) investing activities |
— | 69,070 | (18,584 | ) | (10,086 | ) | (69,070 | ) | (28,670 | ) | |||||||||||||
| Cash flows provided by (used in) financing activities |
|||||||||||||||||||||||
| Proceeds from debt |
— | 48,500 | — | — | — | 48,500 | |||||||||||||||||
| Repayment of debt |
— | (92,148 | ) | — | — | — | (92,148 | ) | |||||||||||||||
| Proceeds from insurance note payable |
— | (245 | ) | — | — | — | (245 | ) | |||||||||||||||
| Proceeds from (payments on) intercompany loans |
— | — | (61,835 | ) | (7,235 | ) | 69,070 | — | |||||||||||||||
| Net cash provided by (used in) financing activities |
— | (43,893 | ) | (61,835 | ) | (7,235 | ) | 69,070 | (43,893 | ) | |||||||||||||
| Effect of exchange rate difference on cash |
— | — | — | (4,498 | ) | — | (4,498 | ) | |||||||||||||||
| Net increase (decrease) in cash and cash equivalents |
— | — | (2,698 | ) | 7,374 | — | 4,676 | ||||||||||||||||
| Cash and cash equivalents at beginning of period |
— | — | 13,850 | 29,751 | — | 43,601 | |||||||||||||||||
| Cash and cash equivalents at end of period |
$ | — | $ | — | $ | 11,152 | $ | 37,125 | $ | — | $ | 48,277 | |||||||||||
| (1) | Kraton Performance Polymers and Polymer Holdings Capital Corporation are the issuers of the 12% Discount Notes. Polymer Holdings Capital Corporation has minimal assets and income. We do not believe that separate financial information concerning the issuers would provide information that would be useful. |
| (2) | Kraton and Kraton Polymers Capital Corporation are the issuers of the 8.125% Notes. Kraton Polymers Capital Corporation has minimal assets and income. We do not believe that separate financial information concerning the Issuers would provide additional information that would be useful. |
F-51
Table of Contents
KRATON PERFORMANCE POLYMERS, INC.
Notes to Consolidated Financial Statements—(Continued)
15. Financial Instruments, Hedging Activities and Credit Risk
Financial Instruments
(a) Interest Rate Swap Agreements. In February 2008, we entered into a $325 million notional amount interest rate swap agreement to hedge or otherwise protect against Eurodollar interest rate fluctuations on a portion of our variable rate debt. The agreement had a fixed rate of 2.77%, with a margin of 2.0%, which resulted in a total cost of 4.77%, and a term through April 1, 2010. This agreement was designated as a cash flow hedge on the exposure of the variability of future cash flows subject to the variable quarterly interest rates on $325 million of the term loan portion of the Term Facility. We settled the swap early in June 2008 and realized cash proceeds of $4.6 million, resulting in a gain on the settlement of $4.6 million. The gain is deferred in accumulated other comprehensive income at December 31, 2009 and is being reclassified as a reduction in interest expense through March 31, 2010 using the effective interest method, unless we determine that the forecasted interest payments under the Term Facility are probable not to occur, in which case the gain would then be reclassified immediately to interest expense. In 2009, we reclassified $2.9 million into earnings.
In October 2008, we entered into a $320 million notional amount interest rate swap agreement to hedge or otherwise protect against Eurodollar interest rate fluctuations on a portion of our variable rate debt. The agreement had a fixed rate of 2.99%, with a margin of 2.0%, which resulted in a total cost of 4.99%, and a term through December 31, 2009. This agreement was designated as a cash flow hedge on the exposure of the variability of future cash flows subject to the variable quarterly interest rates on $320 million of the term loan portion of the Term Facility. We settled the swap on December 31, 2009 and recorded a loss of $2.2 million.
In May 2009, we entered into a $310 million notional amount interest rate swap agreement to hedge or otherwise protect against Eurodollar interest rate fluctuations on a portion of our variable rate debt. This agreement is effective on January 4, 2010 and expires on January 3, 2011 and has a fixed rate of 1.53%, with a margin of 2.0%, which resulted in a total cost of 3.53%. The agreement hedges monthly interest payments from January through December 2010 and expires on January 3, 2011. It has a fixed rate of 1.53% and a margin of 2.0%, which results in a total cost of 3.53%. In December 2009, we made a $100.0 million payment of outstanding indebtedness under the Term Loans reducing the principal amount outstanding from approximately $322.6 million to $222.0 million. As a result, we are required to discontinue hedge accounting prospectively as the hedging relationship fails to meet all of the criteria set forth in ASC 815, specifically the notional amount of the swap and the principal amount of the debt are no longer equal and the forecasted transaction is no longer probable of occurring as documented in the original hedge documentation. We recorded $0.8 million in interest expense related to the ineffective portion and $1.9 million in accumulated other comprehensive income related to the effective portion of the hedge. We have elected to dedesignate the initial hedging relationship.
As of January 1, 2008, we adopted the provisions of FASB ASC 820-10, which establishes a three-tier value hierarchy, categorizing the inputs used to measure fair value. The hierarchy can be described as follows: (Level 1) observable inputs such as quoted prices in active markets; (Level 2) inputs other than the quoted prices in active markets that are observable either directly or indirectly; and (Level 3) unobservable inputs in which there is little or no market data, which require the reporting entity to develop its own assumptions.
The financial assets and liabilities measured at fair value on a recurring basis are included below:
| December 31, 2009 |
Fair Value Measurements at Reporting Date Using | |||||||||||
| Quoted Prices in Active Markets for Identical Assets (Level 1) |
Significant Other Observable Inputs (Level 2) |
Significant Unobservable Inputs (Level 3) | ||||||||||
| (in thousands) | ||||||||||||
| Derivative liabilities |
$ | 2,926 | $ | — | $ | 2,926 | $ | — | ||||
F-52
Table of Contents
KRATON PERFORMANCE POLYMERS, INC.
Notes to Consolidated Financial Statements—(Continued)
As of December 31, 2009, the fair market value of the interest rate swap agreement in effect was a liability of approximately $2.9 million.
(b) Fair Value of Financial Instruments.
| December 31, 2009 | December 31, 2008 | |||||||||||
| Carrying Value |
Fair Value |
Carrying Value |
Fair Value | |||||||||
| (in thousands) | ||||||||||||
| Revolving loans |
$ | — | $ | — | $ | 50,000 | $ | 50,000 | ||||
| Term loans |
221,729 | 221,729 | 325,071 | 325,071 | ||||||||
| 12.00% Discount notes |
250 | 250 | 245 | 245 | ||||||||
| Bonds Payable 8.125% Notes |
163,000 | 146,089 | 200,000 | 79,250 | ||||||||
| 8.125% Notes Held as Treasury Bonds |
7,000 | 6,274 | — | — | ||||||||
The following table presents the carrying values and approximate fair values of our long-term debt at December 31, 2009 and December 31, 2008:
The Term Loans and Revolving Loans are variable interest rate securities, and as such, the fair value approximates their carrying value.
Foreign Currency Hedge. On April 3 and July 1, 2008 we entered into two foreign currency option contracts to reduce our exposure to fluctuations in the Euro to U.S. dollar exchange rate for notional amounts of €10 million and €20 million with expiration dates of June 26, and December 29, 2008, respectively. The option contracts do not qualify for hedge accounting. The April, 2008 option contract expired on June 26, 2008 and the July, 2008 option contract expired on December 29, 2008. The impact on our consolidated results of operations, financial position and cash flows was immaterial.
On February 18, 2009 we entered into a foreign currency option contract to reduce our exposure to fluctuations in the Euro to U.S. dollar exchange rate for a notional amount of €47.3 million which expires on December 29, 2009. The option contract does not qualify for hedge accounting. We settled the hedge on December 31, 2009, with a gain of $1.9 million which represented the mark-to-market impact of the purchased option contract. The gains were recorded in selling, general, and administrative expense on the Consolidated Statements of Operations.
Credit Risk. Our customers are diversified by industry and geography with more than 700 customers in over 60 countries. We do not have concentrations of receivables from these industry sectors throughout these countries. The recent global economic downturn may affect our overall credit risk. Where exposed to credit risk, we analyze the counterparties’ financial condition prior to entering into an agreement, establishes credit limits and monitors the appropriateness of those limits on an ongoing basis. We also obtain cash, letters of credit or other acceptable forms of security from customers to provide credit support, where appropriate, based on our financial analysis of the customer and the contractual terms and conditions applicable to each transaction.
16. Restructuring and Restructuring-related Costs
As part of our ongoing efforts to improve efficiencies and increase productivity, we have implemented a number of restructuring initiatives in recent years.
We ceased production at the Pernis facility on December 31, 2009, where, prior to the exit we manufactured IR. In connection with the exit, we incurred $3.9 million in asset retirement obligations, $6.0 million in
F-53
Table of Contents
KRATON PERFORMANCE POLYMERS, INC.
Notes to Consolidated Financial Statements—(Continued)
restructuring costs and a $1.1 million non-cash charge to write-down our inventory of spare parts. The estimated asset retirement obligations and restructuring costs of $5.1 million and $6.0 million were recorded in the third quarter of 2009, respectively. The asset retirement obligations were adjusted pursuant to the settlement agreement in December 2009. The $14.9 million of property and equipment related to Pernis was fully depreciated as of December 31, 2009. The settlement agreement calls for total payments of approximately $10.0 million and will be paid in full on or about May 2010. In January 2010 we made two payments totaling $7.5 million.
In 2008, we restructured our research and technical service organizations to better align our research and product development capabilities with our customers’ needs and market requirements and to focus on our core capabilities, and incurred $2.2 million of severance and other staffing-related costs which were recorded in research and development expenses in the consolidated statements of operations. Substantially all of the cash expenditures related to these restructurings were paid as of December 31, 2008.
Prior to the 2009 exit from Pernis, on September 20, 2007, we exited the SIS plant at the Pernis facility, and relocated our SIS production to our other production facilities as part of our cost reduction efforts. This resulted in a contractor workforce reduction. The exit plan was completed in the first half of 2008. As a result of exiting the SIS plant, we recorded a liability associated with the plan of approximately $2.1 million, consisting of $1.8 million in contractor workforce reduction and $0.3 million in other associated costs. The entire amount of the charge consisted of cash expenditures in the first and second quarters of 2008.
We have received a communication from a law firm asserting that approximately $13.5 million in alleged payments to us from SemGroup, L.P. and/or one or more of its affiliates (collectively “SemGroup”), during the 90-day period preceding SemGroup’s Chapter 11 bankruptcy filing on July 22, 2008, appear to constitute preferential payments avoidable and recoverable under sections 547 and 550 of the United States Bankruptcy Code. In this regard, no formal claim has been asserted against us in the bankruptcy court as of this date. However, we intend to vigorously defend any such claim if it is made against us, and although the ultimate outcome of any such matter cannot be determined with certainty, we believe we would have a number of defenses to any such claim, including, without limitation, defenses concerning the ordinary course of business and the timing of certain product deliveries made by Kraton to SemGroup prior to the date of its bankruptcy filing. At this time, we have recorded no provision for losses in connection with this matter. Further we do not believe that any claim, if one is asserted, will have a material adverse impact on our business, financial condition, or results of operations.
On January 18, 2010, consistent with our announcement in the third quarter of 2009 of our intent to exit our Pernis, the Netherlands facility, our indirect, wholly-owned subsidiary Kraton Polymers Nederland BV (“Kraton Netherlands”) agreed to terminate the following material definitive agreements:
| • | First Amended and Restated Site Services, Utilities, Materials and Facilities Agreement between Kraton Netherlands and Shell Nederland Raffinaderij BV (“SNR”) dated 28 February 2001; and |
| • | First Amended and Restated Site Services, Utilities, Materials and Facilities Agreement between Kraton Netherlands and Shell Nederland Chemie BV (“SNC,” and together with SNR, the “Shell Entities”) dated 28 February 2001. |
Production at the Pernis facility ceased December 31, 2009. However, the actual termination of these agreements remains subject to the satisfaction of various conditions and is anticipated to become effective on or about May 31, 2010. We expect to maintain a presence at the facility through May 2010, as the site is cleared for
F-54
Table of Contents
KRATON PERFORMANCE POLYMERS, INC.
Notes to Consolidated Financial Statements—(Continued)
demolition beginning thereafter. We currently anticipate transferring IR production to our Belpre, Ohio facility. We are in the process of completing project scoping, including associated capital expenditure requirements, for producing the alternative capacity, and until such alternative production capacity is brought on line, we plan to satisfy customer demand for IR with inventory currently on hand.
On January 7, 2010, the underwriters in our IPO exercised their option to purchase 887,082 additional shares of common stock from our company at the initial public offering price less the underwriting discount to cover over-allotments. Net proceeds from the exercise of the over-allotment option amounted to approximately $11.2 million. After giving effect to the sale of the shares sold pursuant to the over-allotment option, a total of 11,181,200 shares of our company’s common stock were sold in the IPO by us at a price to the public of $13.50.
We have evaluated significant events and transactions that have occurred and have determined that there were no other events or transactions other than those disclosed in this report that would require recognition or disclosure in our Consolidated Financial Statements for the period ended December 31, 2009.
F-55
Table of Contents
Selected Quarterly Financial Data (Unaudited)
The following table sets forth a summary of Kraton Performance Polymers, Inc.’s quarterly financial information for each of the four quarters ended December 31, 2009 and December 31, 2008:
| First Quarter (1) |
Second Quarter (2) |
Third Quarter (3) |
Fourth Quarter (4)(5) |
Total | |||||||||||||||
| (In thousands, except per share data) | |||||||||||||||||||
| 2009 |
|||||||||||||||||||
| Operating revenues |
$ | 184,957 | $ | 243,821 | $ | 288,518 | $ | 250,708 | $ | 968,004 | |||||||||
| Gross profit |
8,934 | 35,761 | 69,969 | 60,868 | 175,532 | ||||||||||||||
| Operating income |
(26,849 | ) | 96 | 28,135 | 6,683 | 8,065 | |||||||||||||
| Net income (loss) |
(16,461 | ) | (4,178 | ) | 21,865 | (1,516 | ) | (290 | ) | ||||||||||
| Earnings (loss) per common share |
|||||||||||||||||||
| Basic |
(0.85 | ) | (0.22 | ) | 1.13 | (0.07 | ) | (0.01 | ) | ||||||||||
| Diluted |
(0.85 | ) | (0.22 | ) | 1.12 | (0.07 | ) | (0.01 | ) | ||||||||||
| Weighted average common shares outstanding |
|||||||||||||||||||
| Basic |
19,407 | 19,410 | 19,433 | 21,111 | 19,844 | ||||||||||||||
| Diluted |
19,407 | 19,410 | 19,496 | 21,111 | 19,844 | ||||||||||||||
| 2008 |
|||||||||||||||||||
| Operating revenues |
$ | 266,861 | $ | 345,369 | $ | 382,167 | $ | 231,636 | $ | 1,226,033 | |||||||||
| Gross profit |
48,785 | 62,546 | 94,448 | 48,971 | 254,750 | ||||||||||||||
| Operating income (loss) |
760 | 22,124 | 47,308 | 2,916 | 73,108 | ||||||||||||||
| Net income (loss) |
(9,413 | ) | 10,213 | 34,614 | (6,995 | ) | 28,419 | ||||||||||||
| Earnings (loss) per common share |
|||||||||||||||||||
| Basic |
(0.49 | ) | 0.53 | 1.78 | (0.36 | ) | 1.46 | ||||||||||||
| Diluted |
(0.49 | ) | 0.53 | 1.77 | (0.36 | ) | 1.46 | ||||||||||||
| Weighted average common shares outstanding |
|||||||||||||||||||
| Basic |
19,390 | 19,406 | 19,415 | 19,413 | 19,406 | ||||||||||||||
| Diluted |
19,390 | 19,448 | 19,511 | 19,413 | 19,483 | ||||||||||||||
| (1) | During the first quarter of 2009, we recorded a gain of $19.5 million associated with the purchase and retirement of a portion of the 8.125% senior subordinated notes, which is included in Gain on Extinguishment of Debt. |
| (2) | During the second quarter of 2009, we recorded a gain of $4.3 million associated with the purchase and retirement of a portion of the 8.125% senior subordinated notes, which is included in Gain on Extinguishment of Debt. |
| (3) | During the third quarter of 2009, we recorded restructuring costs of $6.0 million and a $1.1 million non-cash charge to write-down our inventory of spare-parts associated with the shutdown and exit from the Pernis, the Netherlands facilities, which are included in Cost of Goods Sold. |
| (4) | During the fourth quarter of 2009, we recorded one-time accelerated depreciation of $14.3 million associated with the shutdown and exit from the Pernis, the Netherlands facilities, which is included in Depreciation and amortization of identifiable intangibles. |
| (5) | During the fourth quarter of 2008, we recorded a lower-of-cost-or-market adjustment for inventory of $8.1 million, which is included in Cost of Goods Sold. |
Basic and diluted earnings per share are computed independently for each of the quarters presented. Therefore, the sum of quarterly basic and diluted per share information may not equal annual basic and diluted earnings per share.
F-56
Table of Contents
Report of Independent Registered Public Accounting Firm
The Board of Directors and Stockholders
Kraton Performance Polymers, Inc.:
Under date of March 15, 2010, we reported on the consolidated balance sheets of Kraton Performance Polymers, Inc. (formerly Polymer Holdings LLC) and subsidiaries as of December 31, 2009 and 2008, and the related consolidated statements of operations, changes in stockholders’ and member’s equity and comprehensive income (loss), and cash flows for each of the years in the three-year period ended December 31, 2009, which are included in Kraton Performance Polymers, Inc.’s Annual Report on Form 10-K. In connection with our audits of the aforementioned consolidated financial statements, we also audited the related financial statement schedule in Kraton Performance Polymers, Inc.’s Annual Report on Form 10-K. This financial statement schedule is the responsibility of Kraton Performance Polymers, Inc.’s management. Our responsibility is to express an opinion on this financial statement schedule based on our audits.
In our opinion, the financial statement schedule, when considered in relation to the basic consolidated financial statements taken as a whole, presents fairly, in all material respects, the information set forth therein.
/S/ KPMG LLP
Houston, Texas
March 15, 2010
F-57
Table of Contents
KRATON PERFORMANCE POLYMERS, INC.
SCHEDULE II—VALUATION AND QUALIFYING ACCOUNTS AND RESERVES
For the Years Ended December 31, 2009, 2008 and 2007
(In thousands)
| Balance at Beginning of Period |
Charged to Costs and Expenses |
Deductions | Balance at End of Period | |||||||||||
| Allowance for Doubtful Accounts |
||||||||||||||
| Year ended December 31, 2009 |
$ | 2,512 | $ | (857 | ) | $ | (320 | ) | $ | 1,335 | ||||
| Year ended December 31, 2008 |
1,542 | 2,075 | (1,105 | ) | 2,512 | |||||||||
| Year ended December 31, 2007 |
2,157 | 81 | (696 | ) | 1,542 | |||||||||
| Balance at Beginning of Period |
Charged to Costs and Expenses |
Deductions | Balance at End of Period | ||||||||||
| Inventory Reserves |
|||||||||||||
| Year ended December 31, 2009 |
$ | 5,063 | $ | 1,526 | $ | (454 | ) | $ | 6,135 | ||||
| Year ended December 31, 2008 |
4,755 | 768 | (460 | ) | 5,063 | ||||||||
| Year ended December 31, 2007 |
4,215 | 2,994 | (2,454 | ) | 4,755 | ||||||||
F-58
Table of Contents
KRATON PERFORMANCE POLYMERS, INC.
CONDENSED CONSOLIDATED BALANCE SHEETS
(Unaudited)
(In thousands, except par value)
| June 30, 2010 |
December 31, 2009 |
||||||
| ASSETS |
|||||||
| Current Assets |
|||||||
| Cash and cash equivalents |
$ | 39,405 | $ | 69,291 | |||
| Receivables, net of allowances of $1,232 and $1,335 |
166,020 | 115,329 | |||||
| Inventories of products, net |
304,364 | 284,258 | |||||
| Inventories of materials and supplies, net |
10,521 | 10,862 | |||||
| Deferred income taxes |
3,107 | 3,107 | |||||
| Other current assets |
19,478 | 16,770 | |||||
| Total current assets |
542,895 | 499,617 | |||||
| Property, plant and equipment, less accumulated depreciation of $212,794 and $236,558 |
342,143 | 354,860 | |||||
| Identifiable intangible assets, less accumulated amortization of $46,836 and $42,741 |
73,564 | 75,801 | |||||
| Investment in unconsolidated joint venture |
12,104 | 12,078 | |||||
| Deferred financing costs |
6,272 | 7,318 | |||||
| Other long-term assets |
20,201 | 24,825 | |||||
| Total Assets |
$ | 997,179 | $ | 974,499 | |||
| LIABILITIES AND STOCKHOLDERS’ EQUITY |
|||||||
| Current Liabilities |
|||||||
| Current portion of long-term debt |
$ | 2,304 | $ | 2,304 | |||
| Accounts payable-trade |
85,013 | 93,494 | |||||
| Other payables and accruals |
56,790 | 68,271 | |||||
| Due to related party |
16,833 | 19,006 | |||||
| Insurance note payable |
2,566 | — | |||||
| Total current liabilities |
163,506 | 183,075 | |||||
| Long-term debt, net of current portion |
381,523 | 382,675 | |||||
| Deferred income taxes |
15,841 | 13,488 | |||||
| Other long-term liabilities |
48,500 | 46,477 | |||||
| Total Liabilities |
609,370 | 625,715 | |||||
| Commitments and contingencies (note 11) |
|||||||
| Stockholders’ equity |
|||||||
| Preferred stock, $0.01 par value; 100,000 shares authorized; none issued |
|||||||
| Common stock, $0.01 par value; 500,000 shares authorized; 30,851 shares issued and outstanding |
309 | 297 | |||||
| Additional paid in capital |
325,145 | 311,665 | |||||
| Retained earnings |
58,376 | (14 | ) | ||||
| Accumulated other comprehensive income |
3,979 | 36,836 | |||||
| Total stockholders’ equity |
387,809 | 348,784 | |||||
| Total Liabilities and Stockholders’ Equity |
$ | 997,179 | $ | 974,499 | |||
See Notes to Condensed Consolidated Financial Statements
F-59
Table of Contents
KRATON PERFORMANCE POLYMERS, INC.
CONDENSED CONSOLIDATED STATEMENTS OF OPERATIONS
(Unaudited)
(In thousands, except per share data)
| Three months ended June 30, |
Six months ended June 30, |
|||||||||||||
| 2010 | 2009 | 2010 | 2009 | |||||||||||
| Operating Revenues |
||||||||||||||
| Sales |
$ | 332,086 | $ | 233,741 | $ | 604,818 | $ | 411,607 | ||||||
| Other |
— | 10,080 | — | 17,172 | ||||||||||
| Total operating revenues |
332,086 | 243,821 | 604,818 | 428,779 | ||||||||||
| Cost of Goods Sold |
242,973 | 208,060 | 446,578 | 384,085 | ||||||||||
| Gross Profit |
89,113 | 35,761 | 158,240 | 44,694 | ||||||||||
| Operating Expenses |
||||||||||||||
| Research and development |
5,572 | 5,071 | 11,556 | 10,040 | ||||||||||
| Selling, general and administrative |
21,772 | 18,052 | 43,834 | 36,303 | ||||||||||
| Depreciation and amortization of identifiable intangibles |
11,969 | 12,542 | 23,015 | 25,106 | ||||||||||
| Total operating expenses |
39,313 | 35,665 | 78,405 | 71,449 | ||||||||||
| Gain on Extinguishment of Debt |
— | 4,340 | — | 23,831 | ||||||||||
| Earnings of Unconsolidated Joint Venture |
162 | 102 | 236 | 176 | ||||||||||
| Interest Expense, net |
6,272 | 7,832 | 12,336 | 16,738 | ||||||||||
| Income (Loss) Before Income Taxes |
43,690 | (3,294 | ) | 67,735 | (19,486 | ) | ||||||||
| Income Tax Expense |
5,095 | 891 | 9,345 | 1,160 | ||||||||||
| Net Income (Loss) |
$ | 38,595 | $ | (4,185 | ) | $ | 58,390 | $ | (20,646 | ) | ||||
| Earnings (Loss) per common share (note 7) |
||||||||||||||
| Basic |
$ | 1.25 | $ | (0.22 | ) | $ | 1.90 | $ | (1.06 | ) | ||||
| Diluted |
$ | 1.24 | $ | (0.22 | ) | $ | 1.88 | $ | (1.06 | ) | ||||
| Weighted average common shares outstanding |
||||||||||||||
| Basic |
30,806 | 19,410 | 30,751 | 19,409 | ||||||||||
| Diluted |
31,244 | 19,410 | 31,023 | 19,409 | ||||||||||
See Notes to Condensed Consolidated Financial Statements
F-60
Table of Contents
KRATON PERFORMANCE POLYMERS, INC.
CONDENSED CONSOLIDATED STATEMENTS OF CASH FLOWS
(Unaudited)
(In thousands)
| Six months ended June 30, |
||||||||
| 2010 | 2009 | |||||||
| CASH FLOWS FROM OPERATING ACTIVITIES |
||||||||
| Net income (loss) |
$ | 58,390 | $ | (20,646 | ) | |||
| Adjustments to reconcile net income (loss) to net cash provided by (used in) operating activities: |
||||||||
| Depreciation and amortization of identifiable intangibles |
23,015 | 25,106 | ||||||
| Accretion of debt discount |
— | 5 | ||||||
| Inventory impairment |
— | 669 | ||||||
| Amortization of deferred financing costs |
1,036 | 1,582 | ||||||
| Loss on disposal of fixed assets |
3 | 431 | ||||||
| Gain on extinguishment of debt |
— | (23,831 | ) | |||||
| Change in fair value of interest rate swaps |
(450 | ) | (842 | ) | ||||
| Distributed earnings in unconsolidated joint venture |
167 | 257 | ||||||
| Deferred income tax expense |
3,853 | (910 | ) | |||||
| Non-cash compensation related to equity awards |
1,771 | 1,237 | ||||||
| Decrease (increase) in |
||||||||
| Accounts receivable |
(60,335 | ) | (29,542 | ) | ||||
| Inventories of products, materials and supplies |
(39,002 | ) | 90,670 | |||||
| Other assets |
(30,167 | ) | (6,365 | ) | ||||
| (Decrease) in |
||||||||
| Accounts payable-trade, other payables and accruals, and other long-term liabilities |
(6,444 | ) | (18,564 | ) | ||||
| Due to related party |
(2,874 | ) | (14,550 | ) | ||||
| Net cash provided by (used in) operating activities |
(51,037 | ) | 4,707 | |||||
| CASH FLOWS FROM INVESTING ACTIVITIES |
||||||||
| Purchase of property, plant and equipment |
(17,545 | ) | (19,972 | ) | ||||
| Purchase of software |
(1,857 | ) | (6,685 | ) | ||||
| Proceeds from sale of property, plant and equipment |
— | 3,833 | ||||||
| Net cash used in investing activities |
(19,402 | ) | (22,824 | ) | ||||
| CASH FLOWS FROM FINANCING ACTIVITIES |
||||||||
| Proceeds from debt |
69,000 | 53,000 | ||||||
| Repayment of debt |
(70,152 | ) | (115,341 | ) | ||||
| Proceeds from issuance of common stock |
11,197 | — | ||||||
| Costs associated with the issuance of common stock |
(534 | ) | — | |||||
| Proceeds from stock based compensation |
1,087 | — | ||||||
| Proceeds from insurance note payable |
3,518 | 4,506 | ||||||
| Repayment of insurance note payable |
(952 | ) | (1,487 | ) | ||||
| Net cash provided by (used in) financing activities |
13,164 | (59,322 | ) | |||||
| Effect of exchange rate differences on cash |
27,389 | (6,247 | ) | |||||
| Net decrease in cash and cash equivalents |
(29,886 | ) | (83,686 | ) | ||||
| Cash and cash equivalents, beginning of period |
69,291 | 101,396 | ||||||
| Cash and cash equivalents, end of period |
$ | 39,405 | $ | 17,710 | ||||
| Supplemental Disclosures |
||||||||
| Cash paid during the period for income taxes, net of refunds received |
$ | 2,026 | $ | 7,455 | ||||
| Cash paid during the period for interest |
$ | 12,192 | $ | 16,489 | ||||
See Notes to Condensed Consolidated Financial Statements
F-61
Table of Contents
KRATON PERFORMANCE POLYMERS, INC.
NOTES TO CONDENSED CONSOLIDATED FINANCIAL STATEMENTS
(Unaudited)
1. General
Organization and Description of Business. Kraton Performance Polymers, Inc., or Kraton Performance Polymers, and its direct and indirect subsidiaries, are, unless the context requires otherwise, collectively referred to herein as “we,” “our,” “ours,” “us,” “our company” and/or “the Company.” Kraton Performance Polymers is the sole Member and 100% equity owner of Kraton Polymers LLC. As used herein, the term “Kraton” refers to Kraton Polymers LLC, and, unless the context herein requires otherwise, said term shall include the direct and indirect subsidiaries of Kraton Polymers LLC. Kraton Polymers LLC directly or indirectly owns 100% of the equity interests in (1) Elastomers Holdings LLC (holding company of Kraton’s U.S. operations), (2) K.P. Global Holdings C.V. (holding company of the remainder of our global operations) and (3) Kraton Polymers Capital Corporation (finance subsidiary with no operations). We believe we are the world’s leading producer in terms of sales revenues of styrenic block copolymers, or SBCs, a family of performance polymer products whose chemistry we pioneered almost 50 years ago. SBCs are highly-engineered synthetic elastomers that enhance the performance of numerous products by delivering a variety of performance-enhancing characteristics, including greater flexibility, resilience, strength, durability and processability. SBCs are a fast growing subset of the elastomers industry. Our polymers are typically formulated or compounded with other products to achieve improved customer specific performance characteristics in a variety of applications. We manufacture products at five plants globally, including our flagship plant in Belpre, Ohio, the most diversified SBC plant in the world, as well as plants in Germany, France, Brazil and Japan. The plant in Japan is operated by an unconsolidated manufacturing joint venture.
Basis of Presentation. The accompanying Condensed Consolidated Financial Statements presented herein are for Kraton Performance Polymers, Inc. (formerly Polymer Holdings LLC) and its consolidated subsidiaries, each of which is a wholly-owned subsidiary. These interim financial statements should be read in conjunction with the consolidated financial statements included in our Annual Report on Form 10-K for the year ended December 31, 2009, as amended, and reflect all normal recurring adjustments that are, in the opinion of management, necessary to fairly present our results of operations and financial position. Amounts reported in the Condensed Consolidated Statements of Operations are not necessarily indicative of amounts expected for the respective annual periods, in particular due to the effect of seasonal changes and weather conditions that typically affect our polymer product sales into our Paving and Roofing end use market.
Our significant accounting policies have been disclosed in Note 1 Summary of Operations and Significant Accounting Policies in our most recent Annual Report on Form 10-K, as amended. There have been no changes to the policies disclosed therein. The accompanying Condensed Consolidated Financial Statements presented herein have been prepared in accordance with those policies.
Use of Estimates. The preparation of Condensed Consolidated Financial Statements in conformity with accounting principles generally accepted in the United States of America requires management to make estimates and assumptions that affect the reported amounts of assets and liabilities and disclosure of contingent assets and liabilities at the date of the Condensed Consolidated Financial Statements and the reported amounts of revenues and expenses during the reporting period. Actual results could differ from those estimates. Significant items subject to such estimates and assumptions include the useful lives of fixed assets; allowances for doubtful accounts and sales returns; the valuation of derivatives, deferred tax assets, property, plant and equipment, inventory, investments and share-based compensation; and liabilities for employee benefit obligations, asset retirement obligations, income tax uncertainties and other contingencies.
Income Tax in Interim Periods. Our business operations are global in nature, and we are subject to taxes in numerous jurisdictions. Tax laws and tax rates vary substantially in these jurisdictions and are subject to change given the political and economic climate in those countries. We file our tax returns in accordance with our
F-62
Table of Contents
KRATON PERFORMANCE POLYMERS, INC.
NOTES TO CONDENSED CONSOLIDATED FINANCIAL STATEMENTS—(Continued)
(Unaudited)
interpretations of each jurisdiction’s tax laws. We record our tax provision or benefit on an interim basis using the estimated annual effective tax rate. This rate is applied to the current period ordinary income or loss to determine the income tax provision or benefit allocated to the interim period. Losses from jurisdictions for which no benefit can be realized and the income tax effects of unusual and infrequent items are excluded from the estimated annual effective tax rate. Valuation allowances are provided against the future tax benefits that arise from the losses in jurisdictions for which no benefit can be realized. In addition, the effects of unusual and infrequent items are recognized in the impacted interim period as discrete items. The estimated annual effective tax rate may be significantly impacted by nondeductible expenses and our projected earnings mix by tax jurisdiction. Adjustments to the estimated annual effective income tax rate are recognized in the period when such estimates are revised. Additionally, we have established valuation allowances against a variety of deferred tax assets, including net operating loss carry-forwards, foreign tax credits and other income tax credits. Valuation allowances take into consideration our ability to use these deferred tax assets and reduce the value of such items to the amount that is deemed more likely than not to be recoverable. Our ability to utilize these deferred tax assets is dependent on achieving our forecast of future taxable operating income over an extended period of time. We review our forecast in relation to actual results and expected trends on a quarterly basis. Failure to achieve our operating income targets may change our assessment regarding the recoverability of our net deferred tax assets and such change could result in a valuation allowance being recorded against some or all of our net deferred tax assets. An increase in a valuation allowance would result in additional income tax expense and lower stockholders’ equity and could have a significant impact on our earnings in future periods. The release of valuation allowances in periods when these tax attributes become realizable would reduce our effective tax rate.
Correction of immaterial errors. We have corrected immaterial errors in the accompanying Condensed Consolidated Statements of Operations related to cost of goods sold for the three months ended March 31, 2010. The correction increased cost of goods sold and decreased inventory by $3.0 million. The correction is not material to our Condensed Consolidated Statements of Operations for the three and six months ended June 30, 2010.
2. New Accounting Pronouncements
Adoption of Accounting Standards
We have implemented all new accounting pronouncements that are in effect and that may impact our financial statements and do not believe that there are any other new accounting pronouncements that have been issued that might have a material impact on our financial position or results of operations.
Future Adoption of Accounting Standards
The following new accounting pronouncement has been issued, but has not yet been adopted as of June 30, 2010:
In October 2009, the Financial Accounting Standards Board (FASB), issued Accounting Standards Update (“ASU”), Number 2009-13 “Revenue Recognition (Topic 605): Multiple-Deliverable Revenue Arrangements—a consensus of the FASB Emerging Issues Task Force.” This update amends the revenue recognition guidance for arrangements with multiple deliverables. The amendments allow vendors to account for products and services separately rather than as a combined unit. A selling price hierarchy for determining the selling price of each deliverable is established in this ASU, along with eliminating the residual method. The amendments are effective for revenue arrangements that begin or are changed in fiscal years that start June 15, 2010 or later. We are in the process of assessing the provisions of this new guidance and currently do not expect that the adoption will have a material impact on our consolidated financial statements.
F-63
Table of Contents
KRATON PERFORMANCE POLYMERS, INC.
NOTES TO CONDENSED CONSOLIDATED FINANCIAL STATEMENTS—(Continued)
(Unaudited)
3. Share-Based Compensation
We account for share-based awards under the provisions of ASC 718, “Stock Compensation,” which established the accounting for share-based awards exchanged for employee services. Accordingly, share-based compensation cost is measured at the grant date based on the fair value of the award and is recognized as expense over the requisite service period. We record non-cash compensation expense for the restricted stock awards, notional units and stock options over the vesting period using the straight-line method. We awarded 22,202 shares of restricted stock during the six months ended June 30, 2010. See Note 7 Common Stock and Earnings per Common Share for further discussion.
Information pertaining to option activity for the six months ended June 30, 2010 is as follows:
| Options | Weighted- Average Exercise Price | |||||
| (in thousands) | ||||||
| Outstanding at December 31, 2009 |
1,585 | $ | 13.51 | |||
| Granted |
612 | 15.39 | ||||
| Exercised |
(81 | ) | 13.51 | |||
| Cancelled |
(3 | ) | 13.51 | |||
| Outstanding at June 30, 2010 |
2,113 | $ | 14.05 | |||
| Exercisable at June 30, 2010 |
1,165 | $ | 13.51 | |||
We value stock options issued using the Black-Scholes Merton option-pricing model and there have been no changes to our methodology disclosed in our most recently filed Annual Report on Form 10-K, as amended.
4. Restructuring and Restructuring-Related Costs
As part of our ongoing efforts to improve efficiencies and increase productivity, we have implemented a number of restructuring initiatives in recent years.
We ceased production at our Pernis, the Netherlands, facility on December 31, 2009, where, prior to the exit, we manufactured isoprene rubber. In connection with the exit, we incurred $3.9 million in asset retirement obligations (“ARO”), $6.0 million in restructuring costs and a $1.1 million non-cash charge to write-down our inventory of spare parts.
For the six months ended June 30, 2010, the original estimated ARO of $3.9 million was reduced to $2.6 million as a result of our completing the exit of the facility two months earlier than originally anticipated. As a result, included in depreciation and amortization of intangible assets in the six months ended June 30, 2010 is a reduction in the accrued restructuring cost, which lowered depreciation expense by approximately $1.3 million. The following is a summary of the 2010 activity associated with the exit of the Pernis facility:
| Pernis Restructuring |
||||
| (in thousands) | ||||
| Accrued Pernis restructuring at December 31, 2009 |
$ | 9,989 | ||
| Payments |
(8,698 | ) | ||
| Change in estimate for demolition cost |
(1,291 | ) | ||
| Accrued Pernis restructuring at June 30, 2010 |
$ | — | ||
F-64
Table of Contents
KRATON PERFORMANCE POLYMERS, INC.
NOTES TO CONDENSED CONSOLIDATED FINANCIAL STATEMENTS—(Continued)
(Unaudited)
5. Detail of Certain Balance Sheet Accounts
The components of inventories of products and other payables and accruals are as follows:
| June 30, 2010 |
December 31, 2009 | |||||
| (in thousands) | ||||||
| Inventories of products, net: |
||||||
| Finished products |
$ | 230,112 | $ | 223,500 | ||
| Work in progress |
4,807 | 3,254 | ||||
| Raw materials |
69,445 | 57,504 | ||||
| $ | 304,364 | $ | 284,258 | |||
| Other payables and accruals: |
||||||
| Employee related |
$ | 12,665 | $ | 5,783 | ||
| Interest |
6,796 | 7,366 | ||||
| Property and other taxes |
669 | 4,255 | ||||
| Customer rebates |
2,309 | 2,960 | ||||
| Income taxes payable |
7,506 | 4,000 | ||||
| Derivative liabilities |
2,172 | 2,926 | ||||
| Pernis restructuring |
— | 9,874 | ||||
| Other |
24,673 | 31,107 | ||||
| $ | 56,790 | $ | 68,271 | |||
6. Comprehensive Income
Comprehensive income includes net income (loss) and all other non-owner changes in equity. Components of comprehensive income are as follows:
| Three months ended June 30, |
Six months ended June 30, |
|||||||||||||||
| 2010 | 2009 | 2010 | 2009 | |||||||||||||
| (in thousands) | (in thousands) | |||||||||||||||
| Net income (loss) |
$ | 38,595 | $ | (4,185 | ) | $ | 58,390 | $ | (20,646 | ) | ||||||
| Other comprehensive income (loss) |
||||||||||||||||
| Foreign currency translation adjustments, net of tax |
(30,438 | ) | 22,464 | (33,000 | ) | 5,398 | ||||||||||
| Reclassification of interest rate swaps into earnings |
— | (421 | ) | (450 | ) | (842 | ) | |||||||||
| Net unrealized gain (loss) on interest rate swaps |
660 | (211 | ) | 519 | (358 | ) | ||||||||||
| Net unrealized gain on net investment hedge |
74 | — | 74 | — | ||||||||||||
| Total comprehensive income (loss) |
$ | 8,891 | $ | 17,647 | $ | 25,533 | $ | (16,448 | ) | |||||||
Accumulated other comprehensive income consists of the following:
| June 30, 2010 |
December 31, 2009 |
|||||||
| (in thousands) | ||||||||
| Foreign currency translation adjustments, net of tax |
$ | 22,765 | $ | 55,765 | ||||
| Net unrealized loss on interest rate swaps |
(1,711 | ) | (1,780 | ) | ||||
| Net unrealized gain on net investment hedge |
74 | — | ||||||
| Increase in pension liability, net of tax |
(17,149 | ) | (17,149 | ) | ||||
| Total accumulated other comprehensive income |
$ | 3,979 | $ | 36,836 | ||||
F-65
Table of Contents
KRATON PERFORMANCE POLYMERS, INC.
NOTES TO CONDENSED CONSOLIDATED FINANCIAL STATEMENTS—(Continued)
(Unaudited)
7. Common Stock and Earnings per Common Share
Common stock—Kraton Performance Polymers, Inc. has authorized 500.0 million shares of common stock with a par value of $0.01 per share and 100.0 million shares of preferred stock with a par value of $0.01 per share. No preferred stock has been issued.
As of June 30, 2010, there were 30,851,281 common shares issued and outstanding.
Earnings per share (“EPS”)—Basic EPS is computed by dividing net income by the weighted-average number of common shares outstanding during the period. Diluted EPS is computed by dividing net income by the diluted weighted-average number of common shares outstanding during the period. The diluted weighted-average number of common shares used in the diluted EPS calculation is determined using the treasury stock method. Diluted EPS reflects the potential dilution that could occur if securities or other agreements to issue common stock, such as stock options, stock-based performance awards and preferred stock, were exercised, settled or converted into common stock and were dilutive.
Unvested awards of share-based payments with rights to receive dividends or dividend equivalents, such as our restricted stock awards are considered to be participating securities and the two-class method is used for purposes of calculating EPS. Under the two-class method, a portion of net income is allocated to these participating securities and therefore is excluded from the calculation of EPS allocated to common stock.
The following table summarizes the effect of the share-based compensation awards on the diluted weighted- average number of shares outstanding used in calculating diluted EPS:
| Three months ended June 30, |
Six months ended June 30, |
|||||||||||||||
| 2010 | 2009 | 2010 | 2009 | |||||||||||||
| (in thousands, except per share data) |
(in thousands, except per share data) |
|||||||||||||||
| Net income (loss) as reported |
$ | 38,595 | $ | (4,185 | ) | $ | 58,390 | $ | (20,646 | ) | ||||||
| Less (income) loss allocated to restricted shares |
(173 | ) | 6 | (258 | ) | 27 | ||||||||||
| Income (loss) allocated to common shares for basic and diluted EPS |
$ | 38,422 | $ | (4,179 | ) | $ | 58,132 | $ | (20,619 | ) | ||||||
| Total weighted-average number of shares for basic EPS |
30,668 | 19,383 | 30,615 | 19,386 | ||||||||||||
| Incremental effect of dilutive common share equivalents: |
||||||||||||||||
| Notional units |
35 | — | 35 | — | ||||||||||||
| Stock options |
403 | — | 237 | — | ||||||||||||
| Total weighted-average number of shares for diluted EPS |
31,106 | 19,383 | 30,887 | 19,386 | ||||||||||||
| Total Basic Earnings per Common Share |
$ | 1.25 | $ | (0.22 | ) | $ | 1.90 | $ | (1.06 | ) | ||||||
| Total Dilutive Earnings per Share |
$ | 1.24 | $ | (0.22 | ) | $ | 1.88 | $ | (1.06 | ) | ||||||
Restricted common shares outstanding totaled 118,413 and 46,699 at June 30, 2010 and 2009, respectively, and are subject to time vesting and restrictions on transfer until vested and have identical voting, income and distribution rights to the unrestricted common shares outstanding.
Notional units of 63,221 and stock options of 1,584,970 were outstanding at June 30, 2009 and were not included in the computation of diluted EPS because such units and options were anti-dilutive.
F-66
Table of Contents
KRATON PERFORMANCE POLYMERS, INC.
NOTES TO CONDENSED CONSOLIDATED FINANCIAL STATEMENTS—(Continued)
(Unaudited)
8. Long-Term Debt
Long-term debt consists of the following:
| June 30, 2010 |
December 31, 2009 |
|||||||
| (in thousands) | ||||||||
| Term loans (a) |
$ | 220,577 | $ | 221,729 | ||||
| 12% discount notes (b) |
250 | 250 | ||||||
| 8.125% discount notes (c) |
170,000 | 170,000 | ||||||
| 8.125% discount notes held in treasury (c) |
(7,000 | ) | (7,000 | ) | ||||
| Total debt |
383,827 | 384,979 | ||||||
| Less current portion of long-term debt (a) |
2,304 | 2,304 | ||||||
| Total long-term debt |
$ | 381,523 | $ | 382,675 | ||||
(a) Term Loans and Revolving Loans. Kraton is the borrower under our senior secured credit agreement dated as of December 23, 2003, as amended, (the “Credit Agreement”), and Kraton’s wholly-owned domestic subsidiaries along with us, as successor to Polymer Holdings, are guarantors under the Credit Agreement. We refer to these guarantors, together with Kraton, as the Loan Parties. The Credit Agreement is secured by a perfected first priority security interest in substantially all of each Loan Party’s tangible and intangible assets, including intellectual property, real property, all of Kraton’s capital stock, the capital stock of Kraton’s domestic subsidiaries and 65% of the capital stock of the direct foreign subsidiaries of each Loan Party. There have been no material changes to our Credit Agreement since the disclosure made in our most recently filed Annual Report on Form 10-K, as amended. In these notes to the Condensed Consolidated Financial Statements, the loans made under the revolving facility are referred to as the Revolving Loans, and the loans made under the term facility are referred to as the Term Loans.
Pursuant to Amendment No. 7 to the Credit Agreement, dated November 30, 2009 (the “November 2009 Amendment”), the maximum available borrowings under the Revolving Loans increased from $75.5 million to $80.0 million and the maturity on $79.8 million of the Revolving Loans was extended from May 2011 to May 2013.
In December 2009, Kraton applied a portion of the proceeds from our initial public offering as a prepayment on the term portion of its senior secured credit facility in the amount of $100.0 million, which resulted in the write off of approximately $1.5 million of deferred financing cost. As of June 30, 2010, Kraton had no outstanding borrowings under the Revolving Loans.
The following is a summary of the material terms of the Credit Agreement. This description does not purport to be complete and is qualified in its entirety by reference to the provisions of the Credit Agreement.
Maturity. The Revolving Loans extended pursuant to the November 2009 Amendment are payable in a single maturity on May 12, 2013. The $0.2 million portion of the Revolving Loans that were not extended pursuant to November 2009 Amendment are payable on May 12, 2011. The Term Loans are payable in 8 remaining consecutive equal quarterly installments, in an aggregate annual amount equal to 1.0% of the original principal amount of such loans. The remaining balance is payable in four equal quarterly installments commencing on September 30, 2012 and ending on May 12, 2013.
Interest. The Term Loans bear interest at a rate equal to the adjusted Eurodollar rate plus 2.00% per annum or, at Kraton’s option, the base rate plus 1.00% per annum. The average effective interest rates on the Term
F-67
Table of Contents
KRATON PERFORMANCE POLYMERS, INC.
NOTES TO CONDENSED CONSOLIDATED FINANCIAL STATEMENTS—(Continued)
(Unaudited)
Loans for the six months ended June 30, 2010 and 2009 were 3.4% and 4.3%, respectively. The Revolving Loans extended pursuant to the November 2009 Amendment bear interest at a rate equal to the adjusted Eurodollar rate plus a margin of between 3.00% and 3.50% per annum (depending on Kraton’s consolidated leverage ratio) or at Kraton’s option, the base rate plus a margin of between 2.00% and 2.50% per annum (also depending on Kraton’s consolidated leverage ratio). In addition, with respect to the extended portion of the Revolving Loans, an annual commitment fee equal to 0.75% payable quarterly on the daily average undrawn portion of the Revolving Loans extended pursuant to the November 2009 Amendment accrues and is payable quarterly in arrears.
The terms of the $0.2 million portion of the Revolving Loans that were not extended pursuant to November 2009 Amendment were not changed. These Revolving Loans bear interest at a rate equal to the adjusted Eurodollar rate plus a margin of between 2.00% and 2.50% per annum (depending on Kraton’s leverage ratio), or at Kraton’s option, the base rate plus a margin of between 1.00% and 1.50% per annum (also depending on Kraton’s leverage ratio). The unused commitment fee for the unextended Revolving Loan is 0.5%.
Mandatory Prepayments. The existing term facility is subject to mandatory prepayments as discussed in our most recently filed Annual Report on Form 10-K, as amended.
Covenants. The Credit Agreement contains certain affirmative and negative covenants, as discussed in our most recently filed Annual Report on Form 10-K, as amended. As of June 30, 2010, we were in compliance with all covenants contained in the Credit Agreement.
(b) Senior 12% Discount Notes Due July 15, 2014. As part of a refinancing of indebtedness on November 2, 2004, Polymer Holdings issued $150.0 million of 12% discount notes. On May 12, 2006 all but $0.25 million of the 12% discount notes were repaid.
(c) Senior Subordinated 8.125% Notes Due January 15, 2014. On December 23, 2003, Kraton and Kraton Polymers Capital Corporation issued the 8.125% Notes in an aggregate principal amount of $200.0 million. The 8.125% Notes are subject to the provisions for mandatory and optional prepayment and acceleration and are payable in full on January 15, 2014. Each of Kraton Polymers U.S. LLC and Elastomers Holdings LLC has guaranteed the 8.125% Notes.
Interest. The 8.125% Notes bear interest at a fixed rate of 8.125% per annum. Interest is payable semi-annually on January 15 and July 15.
Optional Redemption. We may redeem all or a part of the 8.125% Notes at the redemption prices (expressed as percentages of principal amount) plus accrued and unpaid interest, if any.
Purchase of a Portion of the Senior Subordinated 8.125% Notes. On March 16, 2009, Kraton purchased and retired $30 million face value of the 8.125% Notes for cash consideration of $10.9 million, which included accrued interest of $0.4 million. We recorded a gain of approximately $19.5 million in the quarter ended March 31, 2009 related to the purchase and retirement of these 8.125% Notes.
In April 2009, TJ Chemical purchased approximately $6.3 million face value of the 8.125% Notes for cash consideration of $2.5 million, which included accrued interest of $0.1 million. Immediately upon purchasing the 8.125% Notes, TJ Chemical contributed the purchased notes to us, and we in turn contributed the notes to Kraton. No equity interest or other consideration was issued in exchange for the contribution of the 8.125% Notes, although equity of each of Kraton Performance Polymers and Kraton was increased by an amount equal to
F-68
Table of Contents
KRATON PERFORMANCE POLYMERS, INC.
NOTES TO CONDENSED CONSOLIDATED FINANCIAL STATEMENTS—(Continued)
(Unaudited)
the cash consideration paid by TJ Chemical. Kraton holds the 8.125% Notes as treasury notes. Also in April 2009, Kraton purchased approximately $0.7 million face value of the 8.125% Notes for cash consideration of $0.3 million, which Kraton is holding as treasury notes. We recorded a gain of approximately $4.3 million on the extinguishment of debt in the quarter ended June 30, 2009.
Covenants. The 8.125% Notes contain certain affirmative and negative covenants, as discussed in our most recently filed Annual Report on Form 10-K, as amended. As of June 30, 2010, we were in compliance with all covenants under the 8.125% Notes.
See Note 9 Financial Instruments, Hedging Activities and Credit Risk for fair value information related to our long-term debt.
9. Financial Instruments and Credit Risk
Financial Instruments
(a) Interest Rate Swap Agreements. In February 2008, we entered into a $325 million notional amount interest rate swap agreement to hedge or otherwise protect against Eurodollar interest rate fluctuations on a portion of our variable rate debt. The agreement had a fixed rate of 2.77%, which resulted in a fixed rate of 4.77%, and a term through April 1, 2010. This agreement was designated as a cash flow hedge on the exposure of the variability of future cash flows subject to the variable quarterly interest rates on $325 million of the term loan portion of the Term Facility. We settled the swap early in June 2008 and realized cash proceeds of $4.6 million, resulting in a gain on the sale of $4.6 million. The gain was deferred in accumulated other comprehensive income and was being reclassified as a reduction in interest expense through March 31, 2010 using the effective interest method. We reclassified $0.5 million and $0.8 million into earnings for the six months ended June 30, 2010 and 2009, respectively.
In May 2009, we entered into a $310 million notional amount interest rate swap agreement to hedge or otherwise protect against Eurodollar interest rate fluctuations on a portion of our variable rate debt. This agreement was effective on January 4, 2010 and expires on January 3, 2011 and has a fixed rate of 1.53%, which results in a fixed rate of 3.53%. In December 2009, we made a $100.0 million payment of outstanding indebtedness under the Term Facility, reducing the principal amount outstanding from approximately $323.0 million to approximately $223.0 million. As a result, we were required to discontinue hedge accounting prospectively as the hedging relationship failed to meet all of the criteria set forth in ASC 815, “Derivatives and Hedging,” specifically the notional amount of the swap and the principal amount of the debt were no longer equal and the forecasted transaction was no longer probable of occurring based on the original hedge documentation. We have elected to redesignate the cash flow hedge relationship for approximately $218.0 million notional amount out of the total $310.0 million notional amount interest rate swap agreement. We recorded a gain of $0.3 million and $0.0 million in interest expense related to the ineffective portion and a gain of $0.5 million and a loss of $0.5 million in accumulated other comprehensive income related to the effective portion of the hedge for the six months ended June 30, 2010 and June 30, 2009, respectively.
In June 2010, we entered into a $215.0 million notional amount interest rate swap agreement to hedge or otherwise protect against Eurodollar interest rate fluctuations on a portion of our variable rate debt. This agreement will be effective on January 3, 2011 and expires on January 3, 2012 and has a fixed rate of 0.87%, which will result in a fixed rate of 2.87%. We recorded an unrealized loss of $0.2 million in accumulated other comprehensive income related to the effective portion of this hedge for the quarter ended June 30, 2010.
F-69
Table of Contents
KRATON PERFORMANCE POLYMERS, INC.
NOTES TO CONDENSED CONSOLIDATED FINANCIAL STATEMENTS—(Continued)
(Unaudited)
(b) Foreign Currency Hedges. In February 2009, we entered into a foreign currency option contract to reduce our exposure to fluctuations in the Euro to U.S. dollar exchange rate for a notional amount of €47.3 million, which expired on December 29, 2009. The option contract did not qualify for hedge accounting. During the six months ended June 30, 2009, we recorded a gain of $0.8 million, which represented the mark-to-market impact of the purchased option contract. The gain was recorded in selling, general and administrative expense on the Condensed Consolidated Statements of Operations. We settled the hedge on December 31, 2009, with a gain of $1.9 million, which represented the mark-to-market impact of the purchased option contract.
(c) Net Investment Hedges. In May 2010, we entered into multiple non-deliverable forward contracts to reduce our exposure to fluctuations in the Brazilian Real to the U.S. dollar associated with the funding of the debottleneck and expansion of our isoprene rubber latex capacity at our Paulina, Brazil, plant, for the notional amounts of R$2.7 million, R$7.0 million, and R$7.8 million with expiration dates of June 30, September 30, and December 31, 2010, respectively. The non-deliverable forward contracts qualify for hedge accounting and were designated as net investment hedges in accordance with ASC 815-35 “Net Investment Hedges.” We recorded a $0.1 million gain in accumulated other comprehensive income related to the effective portion of the hedge for the quarter ended June 30, 2010.
(d) Fair Value of Financial Instruments. Effective January 1, 2008, we adopted ASC 820, “Fair Value Measurements and Disclosures.” ASC 820 defines fair value, establishes a consistent framework for measuring fair value and expands disclosure requirements about fair value measurements. ASC 820 requires entities to, among other things, maximize the use of observable inputs and minimize the use of unobservable inputs when measuring fair value.
ASC 820 defines fair value as the exchange price that would be received for an asset or paid to transfer a liability (an exit price) in the principal or most advantageous market for the asset or liability in an orderly transaction between market participants on the measurement date. ASC 820 specifies a hierarchy of valuation techniques based on whether the inputs to those valuation techniques are observable or unobservable. Observable inputs reflect market data obtained from independent sources, while unobservable inputs reflect our market assumptions. In accordance with ASC 820, these two types of inputs have created the following fair value hierarchy:
| • | Level 1—Quoted unadjusted prices for identical instruments in active markets. |
| • | Level 2—Quoted prices for similar instruments in active markets; quoted prices for identical or similar instruments in markets that are not active; and model-derived valuations in which all significant inputs and significant value drivers are observable in active markets. |
| • | Level 3—Model-derived valuations in which one or more significant inputs or significant value drivers are unobservable. |
The following table presents the carrying values and approximate fair values of our long-term debt at June 30, 2010 and December 31, 2009:
| June 30, 2010 | December 31, 2009 | |||||||||||
| Carrying Value |
Fair Value | Carrying Value |
Fair Value | |||||||||
| (in thousands) | (in thousands) | |||||||||||
| Senior Secured Credit Facilities: |
||||||||||||
| Term loans |
$ | 220,577 | $ | 220,577 | $ | 221,729 | $ | 221,729 | ||||
| 12% discount notes |
250 | 250 | 250 | 250 | ||||||||
| 8.125% discount notes |
163,000 | 163,408 | 163,000 | 146,089 | ||||||||
| 8.125% discount notes held in treasury |
7,000 | 7,018 | 7,000 | 6,274 | ||||||||
F-70
Table of Contents
KRATON PERFORMANCE POLYMERS, INC.
NOTES TO CONDENSED CONSOLIDATED FINANCIAL STATEMENTS—(Continued)
(Unaudited)
The Term Loans and Revolving Loans are variable interest rate securities, and as such, the fair value approximates their carrying value.
The financial assets and liabilities measured at fair value on a recurring basis are included below:
| Balance Sheet Location | June 30, 2010 |
Fair Value Measurements at Reporting Date Using | ||||||||||||
| Quoted Prices in Active Markets for Identical Assets (Level 1) |
Significant Other Observable Inputs (Level 2) |
Significant Unobservable Inputs (Level 3) | ||||||||||||
| (in thousands) | ||||||||||||||
| Derivative liabilities—2009 Interest rate swap |
Other payables and accruals | $ | 2,016 | $ | — | $ | 2,016 | $ | — | |||||
| Derivative liabilities—2010 Interest rate swap |
Other payables and accruals | $ | 156 | $ | — | $ | 156 | $ | — | |||||
| Derivative liabilities—2010 |
Other current assets | $ | 74 | $ | — | $ | 74 | $ | — | |||||
| Balance Sheet Location | December 31, 2009 |
Fair Value Measurements at Reporting Date Using | ||||||||||||
| Quoted Prices in Active Markets for Identical Assets (Level 1) |
Significant Other Observable Inputs (Level 2) |
Significant Unobservable Inputs (Level 3) | ||||||||||||
| (in thousands) | ||||||||||||||
| Derivative liabilities—2009 Interest rate swap |
Other payables and accruals | $ | 2,926 | $ | — | $ | 2,926 | $ | — | |||||
The use of derivatives creates exposure to credit risk relating to potential losses that could be recognized in the event that the counterparties to these instruments fail to perform their obligations under the contracts. We minimize this risk by limiting our counterparties to major financial institutions with acceptable credit ratings and monitoring positions with individual counterparties. In the event of a default by one of our counterparties, we may not receive payments provided for under the terms of our derivatives. We do not anticipate any defaults by our derivative instrument contract counterparties.
Credit Risk. Our customers are diversified by industry and geography with approximately 700 customers in approximately 60 countries worldwide. We do not have concentrations of receivables from these industry sectors throughout these countries. Where exposed to credit risk, we analyze the counterparties’ financial condition prior to entering into an agreement, establish credit limits and monitor the appropriateness of those limits on an ongoing basis. We also obtain cash, letters of credit or other acceptable forms of security from customers to provide credit support, where appropriate, based on our financial analysis of the customer and the contractual terms and conditions applicable to each transaction.
10. Income Taxes
Income tax expense for the six months ended June 30, 2010 was $9.3 million compared to $1.2 million for the six months ended June 30, 2009. The effective tax rate for the six months ended June 30, 2010 was 13.8% compared to (6.0)% for the six months ended June 30, 2009. Our effective tax rate for the six months ended June 30, 2010 was lower than the statutory rate of 35% primarily due to the mix of pre-tax income earned in foreign jurisdictions and the recognition of the tax benefit for certain net operating loss carryforwards.
F-71
Table of Contents
KRATON PERFORMANCE POLYMERS, INC.
NOTES TO CONDENSED CONSOLIDATED FINANCIAL STATEMENTS—(Continued)
(Unaudited)
We are required to provide a valuation allowance for certain deferred tax assets in excess of deferred tax liabilities because we have concluded that it is more likely than not that such deferred tax assets ultimately will not be realized.
As of June 30, 2010, we had unrecognized tax benefits related to foreign tax positions, all of which, if recognized, would impact the effective tax rate. We had no substantial change in uncertain tax positions and have recorded $1.3 million of unrecognized tax benefits, including interest and penalties, as a long-term liability.
Our tax jurisdictions include the United States and various state and foreign jurisdictions. The U.S. federal income tax return has been examined by the tax authorities through December 31, 2004; all years subsequent to 2004 remain subject to examination. In addition, open tax years to state and foreign jurisdictions remain subject to examination.
11. Commitments and Contingencies
Legal Proceedings. We and certain of our subsidiaries are parties to several legal proceedings that have arisen in the ordinary course of business. While the outcome of these proceedings cannot be predicted with certainty, management does not expect these matters, individually or in the aggregate, to have a material adverse effect upon our financial position, results of operations or cash flows. Furthermore, Shell Chemicals L.P. (“Shell Chemicals”) has agreed, subject to certain limitations, to indemnify us for certain claims brought with respect to matters occurring before February 28, 2001. As of the date of this Quarterly Report on Form 10-Q, we have not been named as parties in any of these claims. Our right to indemnification from Shell Chemicals is subject to certain time limitations disclosed under “Business—Environmental Regulation” in our most recently filed Annual Report on Form 10-K, as amended. During the first quarter of 2010, we received a communication from a law firm asserting that approximately $13.5 million in alleged payments to us from SemGroup, L.P. and/or one or more of its affiliates (collectively “SemGroup”) during the 90-day period preceding SemGroup’s Chapter 11 bankruptcy filing on July 22, 2008 appear to constitute preferential payments avoidable and recoverable under sections 547 and 550 of the United States Bankruptcy Code. This matter was settled for a de minimis sum in July 2010 in a manner that provides Kraton with a release of claims in connection with the matter. This resolution is final and completed and will not have a material adverse impact on our business, financial condition or results of operations. Except as provided immediately above, there have been no material changes to our Commitments and Contingencies disclosed in our most recently filed Annual Report on Form 10-K, as amended.
12. Employee Benefits
Retirement Plans. The components of net periodic benefit cost related to pension benefits and other post-retirement benefits for the three and six months ended June 30, 2010 and June 30, 2009 are as follows:
| Three months ended June 30, |
Six months ended June 30, |
|||||||||||||||
| 2010 | 2009 | 2010 | 2009 | |||||||||||||
| (in thousands) | (in thousands) | |||||||||||||||
| Defined Benefit |
||||||||||||||||
| Components of net period benefit cost: |
||||||||||||||||
| Service cost |
$ | 580 | $ | 709 | $ | 1,203 | $ | 1,445 | ||||||||
| Interest cost |
1,230 | 1,186 | 2,446 | 2,364 | ||||||||||||
| Expected return on plan assets |
(1,213 | ) | (1,170 | ) | (2,426 | ) | (2,357 | ) | ||||||||
| Amortization of prior service cost |
17 | 135 | 21 | 262 | ||||||||||||
| Net periodic benefit cost |
$ | 614 | $ | 860 | $ | 1,244 | $ | 1,714 | ||||||||
F-72
Table of Contents
KRATON PERFORMANCE POLYMERS, INC.
NOTES TO CONDENSED CONSOLIDATED FINANCIAL STATEMENTS—(Continued)
(Unaudited)
| Three months ended June 30, |
Six months ended June 30, | |||||||||||
| 2010 | 2009 | 2010 | 2009 | |||||||||
| (in thousands) | (in thousands) | |||||||||||
| Other Post-retirement Benefits |
||||||||||||
| Components of net period benefit cost: |
||||||||||||
| Service cost |
$ | 98 | $ | 100 | $ | 196 | $ | 200 | ||||
| Interest cost |
280 | 230 | 560 | 460 | ||||||||
| Amortization of prior service cost |
39 | 18 | 78 | 36 | ||||||||
| Net periodic benefit cost |
$ | 417 | $ | 348 | $ | 834 | $ | 696 | ||||
Contributions. Based on December 31, 2009 valuations, we expect to make contributions of $3.9 million to our employee benefit plans in 2010 versus $6.2 million in 2009. We made contributions of $1.1 million to our pension plan for the six months ended June 30, 2010. See Note 7 Employee Benefits in our most recent Annual Report on Form 10-K, as amended, for further discussion.
13. Industry Segment and Foreign Operations
We operate in one segment for the manufacture and marketing of styrenic block copolymers. In accordance with the provisions of ASC 280, “Segment Reporting,” our chief operating decision-maker has been identified as the President and Chief Executive Officer, who regularly reviews financial information to make decisions about allocating resources and assessing performance for the entire company. Since we operate in one segment and in one group of similar products, all financial segment and product line information required by ASC 280 can be found in the Condensed Consolidated Financial Statements.
F-73
Table of Contents
KRATON PERFORMANCE POLYMERS, INC.
NOTES TO CONDENSED CONSOLIDATED FINANCIAL STATEMENTS—(Continued)
(Unaudited)
For geographic reporting, revenues are attributed to the geographic location in which the customers’ facilities are located. Long-lived assets consist primarily of property, plant and equipment, which are attributed to the geographic location in which they are located. Total operating revenues and long-lived assets by geographic region were as follows:
| Three months ended June 30, |
Six months ended June 30, | |||||||||||
| 2010 | 2009 | 2010 | 2009 | |||||||||
| (in thousands) | (in thousands) | |||||||||||
| Total Operating Revenues: |
||||||||||||
| United States |
$ | 115,602 | $ | 78,641 | $ | 225,407 | $ | 139,188 | ||||
| Germany |
41,910 | 29,072 | 72,516 | 50,642 | ||||||||
| Japan |
21,559 | 16,040 | 37,478 | 26,969 | ||||||||
| China |
15,172 | 8,826 | 27,351 | 12,443 | ||||||||
| Brazil |
12,934 | 7,937 | 24,197 | 14,335 | ||||||||
| Italy |
11,822 | 9,168 | 22,648 | 16,049 | ||||||||
| France |
10,419 | 6,569 | 17,913 | 14,304 | ||||||||
| United Kingdom |
9,531 | 7,672 | 15,741 | 13,987 | ||||||||
| Thailand |
8,946 | 6,704 | 16,391 | 12,513 | ||||||||
| Turkey |
7,691 | 3,568 | 11,865 | 5,680 | ||||||||
| The Netherlands |
6,980 | 16,057 | 14,703 | 24,702 | ||||||||
| Taiwan |
6,189 | 5,111 | 11,937 | 7,655 | ||||||||
| Canada |
5,942 | 4,100 | 10,896 | 7,828 | ||||||||
| Australia |
5,143 | 2,346 | 8,373 | 3,202 | ||||||||
| Austria |
4,457 | 2,227 | 6,728 | 2,938 | ||||||||
| Sweden |
4,384 | 3,730 | 7,472 | 6,181 | ||||||||
| South Korea |
3,836 | 2,706 | 7,269 | 4,600 | ||||||||
| Belgium |
3,785 | 1,677 | 5,792 | 14,659 | ||||||||
| Mexico |
3,637 | 3,584 | 5,893 | 5,806 | ||||||||
| Argentina |
3,208 | 2,657 | 5,812 | 5,303 | ||||||||
| Poland |
3,065 | 4,943 | 3,611 | 5,602 | ||||||||
| Malaysia |
2,630 | 1,337 | 4,672 | 2,400 | ||||||||
| Denmark |
2,553 | 3,276 | 4,256 | 6,079 | ||||||||
| Spain |
2,348 | 1,112 | 3,516 | 1,451 | ||||||||
| Czech Republic |
1,523 | 1,157 | 2,722 | 2,264 | ||||||||
| Norway |
1,457 | 1,875 | 1,709 | 1,969 | ||||||||
| Russian Federation |
1,416 | 682 | 1,562 | 713 | ||||||||
| India |
1,343 | 1,162 | 2,683 | 2,263 | ||||||||
| All other countries |
12,604 | 9,885 | 23,705 | 17,054 | ||||||||
| $ | 332,086 | $ | 243,821 | $ | 604,818 | $ | 428,779 | |||||
| June 30, 2010 |
December 31, 2009 | |||||
| (in thousands) | ||||||
| Long Lived Assets: |
||||||
| United States |
$ | 324,748 | $ | 317,719 | ||
| France |
114,920 | 125,839 | ||||
| Brazil |
65,455 | 64,385 | ||||
| Germany |
36,123 | 42,724 | ||||
| The Netherlands |
10,179 | 36,971 | ||||
| China |
2,670 | 2,334 | ||||
| All other countries |
842 | 1,446 | ||||
| $ | 554,937 | $ | 591,418 | |||
F-74
Table of Contents
KRATON PERFORMANCE POLYMERS, INC.
NOTES TO CONDENSED CONSOLIDATED FINANCIAL STATEMENTS—(Continued)
(Unaudited)
14. Related Party Transactions
We own a 50% equity investment in a manufacturing joint venture with JSR Corporation (“JSR”) under the name of Kraton JSR Elastomers K.K. (“KJE”) located in Kashima, Japan. KJE manufactures thermoplastic rubber, which is wholly or predominantly composed of a block copolymer comprising styrene blocks with butadiene and/or isoprene polymer blocks. KJE produces thermoplastic rubber for sale to third party customers only through Kraton and JSR. We and JSR separately, but with equal rights, participate as distributors in the sales of the thermoplastic rubber produced by KJE.
The aggregate amounts of related-party transactions were as follows:
| Three months ended June 30, |
Six months ended June 30, | |||||||||||
| 2010 | 2009 | 2010 | 2009 | |||||||||
| (in thousands) | (in thousands) | |||||||||||
| Purchases from related party |
$ | 6,503 | $ | 2,574 | $ | 16,157 | $ | 8,323 | ||||
In October 2009, we entered into a contract with Amyris Biotechnologies, Inc. to explore the development of an alternative source of certain raw materials and, subject to Amyris’s meeting developmental and manufacturing milestones, to purchase raw materials from Amyris. We have not made any purchases to date. TPG Biotechnology II, L.P., a private investment fund that may be deemed to be an affiliate of TPG Partners III and TPG Partners IV, has an ownership interest in Amyris.
15. Supplemental Guarantor Information
Kraton and Kraton Polymers Capital Corporation, a financing subsidiary, collectively, the Issuers, are co-issuers of the 8.125% Notes. Elastomers Holdings LLC, a U.S. holding company, and Kraton Polymers U.S. LLC, a U.S. operating subsidiary, collectively, the Guarantor Subsidiaries, fully and unconditionally guarantee on a joint and several basis the Issuers’ obligations under the 8.125% Notes. Our remaining subsidiaries are not guarantors of the 8.125% Notes. We do not believe that separate financial statements and other disclosures concerning the Guarantor Subsidiaries would provide any additional information that would be material to investors in making an investment decision.
F-75
Table of Contents
KRATON PERFORMANCE POLYMERS, INC.
NOTES TO CONDENSED CONSOLIDATED FINANCIAL STATEMENTS—(Continued)
(Unaudited)
KRATON PERFORMANCE POLYMERS, INC.
CONDENSED CONSOLIDATING BALANCE SHEET
June 30, 2010
(Unaudited)
(In thousands, except par value)
| Kraton Performance Polymers (1) |
Kraton (2) | Guarantor Subsidiaries |
Non-Guarantor Subsidiaries |
Eliminations | Consolidated | ||||||||||||||||
| ASSETS |
|||||||||||||||||||||
| Current Assets |
|||||||||||||||||||||
| Cash and cash equivalents |
$ | — | $ | — | $ | 14,849 | $ | 24,556 | $ | — | $ | 39,405 | |||||||||
| Receivables, net of allowance |
— | — | 73,102 | 92,918 | — | 166,020 | |||||||||||||||
| Inventories of products, net |
— | — | 153,866 | 150,498 | — | 304,364 | |||||||||||||||
| Inventories of materials and supplies, net |
— | — | 7,011 | 3,510 | — | 10,521 | |||||||||||||||
| Deferred income taxes |
— | — | — | 3,107 | — | 3,107 | |||||||||||||||
| Other current assets |
— | 3,357 | 5,223 | 10,898 | — | 19,478 | |||||||||||||||
| Total current assets |
— | 3,357 | 254,051 | 285,487 | — | 542,895 | |||||||||||||||
| Property, plant and equipment, less accumulated depreciation |
— | 80,751 | 174,270 | 87,122 | — | 342,143 | |||||||||||||||
| Identifiable intangible assets, less accumulated amortization |
— | 10,255 | 16,399 | 46,910 | — | 73,564 | |||||||||||||||
| Investment in consolidated subsidiaries |
384,080 | 1,053,498 | — | — | (1,437,578 | ) | — | ||||||||||||||
| Investment in unconsolidated joint venture |
— | 400 | — | 11,704 | — | 12,104 | |||||||||||||||
| Deferred financing costs |
— | 6,272 | — | — | — | 6,272 | |||||||||||||||
| Deferred income taxes |
— | — | — | 1,697 | (1,697 | ) | — | ||||||||||||||
| Other long-term assets |
— | 12,625 | 512,704 | 201,803 | (706,931 | ) | 20,201 | ||||||||||||||
| Total Assets |
$ | 384,080 | $ | 1,167,158 | $ | 957,424 | $ | 634,723 | $ | (2,146,206 | ) | $ | 997,179 | ||||||||
| LIABILITIES AND STOCKHOLDERS’ AND MEMBER’S EQUITY |
|||||||||||||||||||||
| Current Liabilities |
|||||||||||||||||||||
| Current portion of long-term debt |
$ | — | $ | 2,304 | $ | — | $ | — | $ | — | $ | 2,304 | |||||||||
| Accounts payable-trade |
— | 2,250 | 46,493 | 36,270 | — | 85,013 | |||||||||||||||
| Other payables and accruals |
— | 9,158 | 20,904 | 26,728 | — | 56,790 | |||||||||||||||
| Due to related party |
— | — | — | 16,833 | — | 16,833 | |||||||||||||||
| Insurance note payable |
— | 2,566 | — | — | — | 2,566 | |||||||||||||||
| Total current liabilities |
— | 16,278 | 67,397 | 79,831 | — | 163,506 | |||||||||||||||
| Long-term debt, net of current portion |
250 | 381,273 | — | — | — | 381,523 | |||||||||||||||
| Deferred income taxes |
— | 17,538 | — | — | (1,697 | ) | 15,841 | ||||||||||||||
| Other long-term liabilities |
— | 377,559 | 65,811 | 312,061 | (706,931 | ) | 48,500 | ||||||||||||||
| Total liabilities |
250 | 792,648 | 133,208 | 391,892 | (708,628 | ) | 609,370 | ||||||||||||||
| Commitments and contingencies (note 11) |
|||||||||||||||||||||
| Stockholders’ and Member’s equity |
|||||||||||||||||||||
| Preferred stock, $0.01 par value; 100,000 shares authorized; none issued |
|||||||||||||||||||||
| Common stock, $0.01 par value; 500,000 shares authorized; 30,851 shares issued and outstanding |
309 | — | — | — | — | 309 | |||||||||||||||
| Additional paid in capital |
325,145 | — | — | — | — | 325,145 | |||||||||||||||
| Member’s equity |
— | 384,080 | 834,790 | 218,708 | (1,437,578 | ) | — | ||||||||||||||
| Retained Earnings |
58,376 | — | — | — | — | 58,376 | |||||||||||||||
| Accumulated other comprehensive income |
— | (9,570 | ) | (10,574 | ) | 24,123 | — | 3,979 | |||||||||||||
| Total stockholders’ and member’s equity |
383,830 | 374,510 | 824,216 | 242,831 | (1,437,578 | ) | 387,809 | ||||||||||||||
| Total Liabilities and Stockholders’ and Member’s Equity |
$ | 384,080 | $ | 1,167,158 | $ | 957,424 | $ | 634,723 | $ | (2,146,206 | ) | $ | 997,179 | ||||||||
| (1) | Kraton Performance Polymers and Polymer Holdings Capital Corporation are the issuers of the 12% Discount Notes. Polymer Holdings Capital Corporation has minimal assets and income. We do not believe that separate financial information concerning the issuers would provide additional information that would be useful. |
| (2) | Kraton and Kraton Polymers Capital Corporation are the issuers of the 8.125% Notes. Kraton Polymers Capital Corporation has minimal assets and income. We do not believe that separate financial information concerning the Issuers would provide additional information that would be useful. |
F-76
Table of Contents
KRATON PERFORMANCE POLYMERS, INC.
NOTES TO CONDENSED CONSOLIDATED FINANCIAL STATEMENTS—(Continued)
(Unaudited)
KRATON PERFORMANCE POLYMERS, INC.
CONDENSED CONSOLIDATING BALANCE SHEET
December 31, 2009
(In thousands, except par value)
| Kraton Performance Polymers (1) |
Kraton (2) | Guarantor Subsidiaries |
Non-Guarantor Subsidiaries |
Eliminations | Consolidated | ||||||||||||||||||
| ASSETS |
|||||||||||||||||||||||
| Current Assets |
|||||||||||||||||||||||
| Cash and cash equivalents |
$ | — | $ | — | $ | 36,567 | $ | 32,724 | $ | — | $ | 69,291 | |||||||||||
| Receivables, net of allowance |
— | — | 41,194 | 74,135 | — | 115,329 | |||||||||||||||||
| Inventories of products, net |
— | — | 124,003 | 160,255 | — | 284,258 | |||||||||||||||||
| Inventories of materials and supplies, net |
— | — | 6,830 | 4,032 | — | 10,862 | |||||||||||||||||
| Deferred income taxes |
— | — | — | 3,107 | — | 3,107 | |||||||||||||||||
| Other current assets |
— | 1,086 | 1,421 | 14,263 | — | 16,770 | |||||||||||||||||
| Total current assets |
— | 1,086 | 210,015 | 288,516 | — | 499,617 | |||||||||||||||||
| Property, plant and equipment, less accumulated depreciation |
— | 85,284 | 171,024 | 98,552 | — | 354,860 | |||||||||||||||||
| Identifiable intangible assets, less accumulated amortization |
— | 13,541 | 15,322 | 46,938 | — | 75,801 | |||||||||||||||||
| Investment in consolidated subsidiaries |
312,164 | 971,995 | — | — | (1,284,159 | ) | — | ||||||||||||||||
| Investment in unconsolidated joint venture |
— | 813 | — | 11,265 | — | 12,078 | |||||||||||||||||
| Deferred financing costs |
— | 7,309 | — | 9 | — | 7,318 | |||||||||||||||||
| Deferred income taxes |
34 | — | — | — | (34 | ) | — | ||||||||||||||||
| Other long-term assets |
— | 1,142 | 468,794 | 95,054 | (540,165 | ) | 24,825 | ||||||||||||||||
| Total Assets |
$ | 312,198 | $ | 1,081,170 | $ | 865,155 | $ | 540,334 | $ | (1,824,358 | ) | $ | 974,499 | ||||||||||
| LIABILITIES AND STOCKHOLDERS’ AND MEMBER’S EQUITY |
|||||||||||||||||||||||
| Current Liabilities |
|||||||||||||||||||||||
| Current portion of long-term debt |
$ | — | $ | 2,304 | $ | — | $ | — | $ | — | $ | 2,304 | |||||||||||
| Accounts payable-trade |
— | 2,699 | 37,732 | 53,063 | — | 93,494 | |||||||||||||||||
| Other payables and accruals |
— | 18,251 | 15,010 | 35,118 | (108 | ) | 68,271 | ||||||||||||||||
| Due to related party |
— | — | — | 19,006 | — | 19,006 | |||||||||||||||||
| Total current liabilities |
— | 23,254 | 52,742 | 107,187 | (108 | ) | 183,075 | ||||||||||||||||
| Long-term debt, net of current portion |
250 | 382,425 | — | — | — | 382,675 | |||||||||||||||||
| Deferred income taxes |
— | 12,858 | — | 630 | — | 13,488 | |||||||||||||||||
| Other long-term liabilities |
— | 351,353 | 47,494 | 187,721 | (540,091 | ) | 46,477 | ||||||||||||||||
| Total liabilities |
250 | 769,890 | 100,236 | 295,538 | (540,199 | ) | 625,715 | ||||||||||||||||
| Commitments and contingencies (note 11) |
|||||||||||||||||||||||
| Stockholders’ and Member’s equity |
|||||||||||||||||||||||
| Preferred stock, $0.01 par value; 100,000 shares authorized; none issued |
|||||||||||||||||||||||
| Common stock, $0.01 par value; 500,000 shares authorized; 29,709 shares issued and outstanding |
297 | — | — | — | — | 297 | |||||||||||||||||
| Additional paid in capital |
311,665 | — | — | — | — | 311,665 | |||||||||||||||||
| Member’s equity |
— | 312,164 | 775,493 | 196,502 | (1,284,159 | ) | — | ||||||||||||||||
| Retained Earnings |
(14 | ) | — | — | — | — | (14 | ) | |||||||||||||||
| Accumulated other comprehensive income |
— | (884 | ) | (10,574 | ) | 48,294 | — | 36,836 | |||||||||||||||
| Total stockholders’ and member’s equity |
311,948 | 311,280 | 764,919 | 244,796 | (1,284,159 | ) | 348,784 | ||||||||||||||||
| Total Liabilities and Stockholders’ and Member’s Equity |
$ | 312,198 | $ | 1,081,170 | $ | 865,155 | $ | 540,334 | $ | (1,824,358 | ) | $ | 974,499 | ||||||||||
| (1) | Kraton Performance Polymers and Polymer Holdings Capital Corporation are the issuers of the 12% Discount Notes. Polymer Holdings Capital Corporation has minimal assets and income. We do not believe that separate financial information concerning the issuers would provide additional information that would be useful. |
| (2) | Kraton and Kraton Polymers Capital Corporation are the issuers of the 8.125% Notes. Kraton Polymers Capital Corporation has minimal assets and income. We do not believe that separate financial information concerning the Issuers would provide additional information that would be useful. |
F-77
Table of Contents
KRATON PERFORMANCE POLYMERS, INC.
NOTES TO CONDENSED CONSOLIDATED FINANCIAL STATEMENTS—(Continued)
(Unaudited)
KRATON PERFORMANCE POLYMERS, INC.
CONDENSED CONSOLIDATING STATEMENT OF OPERATIONS
Three months ended June 30, 2010
(Unaudited)
(In thousands)
| Kraton Performance Polymers (1) |
Kraton (2) | Guarantor Subsidiaries |
Non-Guarantor Subsidiaries |
Eliminations | Consolidated | ||||||||||||||||
| Operating Revenues |
|||||||||||||||||||||
| Sales |
$ | — | $ | — | $ | 179,710 | $ | 190,659 | $ | (38,283 | ) | $ | 332,086 | ||||||||
| Total operating revenues |
— | — | 179,710 | 190,659 | (38,283 | ) | 332,086 | ||||||||||||||
| Cost of Goods Sold |
— | — | 120,224 | 161,032 | (38,283 | ) | 242,973 | ||||||||||||||
| Gross Profit |
— | — | 59,486 | 29,627 | — | 89,113 | |||||||||||||||
| Operating Expenses |
|||||||||||||||||||||
| Research and development expenses |
— | — | 3,526 | 2,046 | — | 5,572 | |||||||||||||||
| Selling, general and administrative expenses |
— | 13 | 16,167 | 5,592 | — | 21,772 | |||||||||||||||
| Depreciation and amortization of identifiable intangibles |
— | 3,909 | 5,887 | 2,173 | — | 11,969 | |||||||||||||||
| Total operating expenses |
— | 3,922 | 25,580 | 9,811 | — | 39,313 | |||||||||||||||
| Earnings in Consolidated Subsidiaries |
38,629 | 47,939 | — | — | (86,568 | ) | — | ||||||||||||||
| Earnings of Unconsolidated Joint Venture |
— | — | — | 162 | — | 162 | |||||||||||||||
| Interest Expense (Income), net |
— | 8,274 | (2,871 | ) | 869 | — | 6,272 | ||||||||||||||
| Income Before Income Taxes |
38,629 | 35,743 | 36,777 | 19,109 | (86,568 | ) | 43,690 | ||||||||||||||
| Income Tax Expense (Benefit) |
34 | (2,886 | ) | 566 | 7,381 | — | 5,095 | ||||||||||||||
| Net Income |
$ | 38,595 | $ | 38,629 | $ | 36,211 | $ | 11,728 | $ | (86,568 | ) | $ | 38,595 | ||||||||
| (1) | Kraton Performance Polymers and Polymer Holdings Capital Corporation are the issuers of the 12% Discount Notes. Polymer Holdings Capital Corporation has minimal assets and income. We do not believe that separate financial information concerning the issuers would provide additional information that would be useful. |
| (2) | Kraton and Kraton Polymers Capital Corporation are the issuers of the 8.125% Notes. Kraton Polymers Capital Corporation has minimal assets and income. We do not believe that separate financial information concerning the Issuers would provide additional information that would be useful. |
F-78
Table of Contents
KRATON PERFORMANCE POLYMERS, INC.
NOTES TO CONDENSED CONSOLIDATED FINANCIAL STATEMENTS—(Continued)
(Unaudited)
KRATON PERFORMANCE POLYMERS, INC.
CONDENSED CONSOLIDATING STATEMENT OF OPERATIONS
Three months ended June 30, 2009
(Unaudited)
(In thousands)
| Kraton Performance Polymers (1) |
Kraton (2) | Guarantor Subsidiaries |
Non-Guarantor Subsidiaries |
Eliminations | Consolidated | |||||||||||||||||||
| Operating Revenues |
||||||||||||||||||||||||
| Sales |
$ | — | $ | — | $ | 122,112 | $ | 151,539 | $ | (39,910 | ) | $ | 233,741 | |||||||||||
| Other |
1 | — | — | 10,079 | — | 10,080 | ||||||||||||||||||
| Total operating revenues |
1 | — | 122,112 | 161,618 | (39,910 | ) | 243,821 | |||||||||||||||||
| Cost of Goods Sold |
2 | 5,449 | 95,779 | 146,740 | (39,910 | ) | 208,060 | |||||||||||||||||
| Gross Profit |
(1 | ) | (5,449 | ) | 26,333 | 14,878 | — | 35,761 | ||||||||||||||||
| Operating Expenses |
||||||||||||||||||||||||
| Research and development expenses |
— | — | 3,485 | 1,586 | — | 5,071 | ||||||||||||||||||
| Selling, general and administrative expenses |
1 | (272 | ) | 9,123 | 9,200 | — | 18,052 | |||||||||||||||||
| Depreciation and amortization of identifiable intangibles |
— | 3,973 | 5,522 | 3,047 | — | 12,542 | ||||||||||||||||||
| Total operating expenses |
1 | 3,701 | 18,130 | 13,833 | — | 35,665 | ||||||||||||||||||
| Gain on Extinguishment of Debt |
— | 4,340 | — | — | — | 4,340 | ||||||||||||||||||
| Earnings of Consolidated Subsidiaries |
(4,178 | ) | 12,781 | — | — | (8,603 | ) | — | ||||||||||||||||
| Earnings of Unconsolidated Joint Venture |
— | — | — | 102 | — | 102 | ||||||||||||||||||
| Interest Expense (Income), net |
5 | 9,725 | (2,746 | ) | 848 | — | 7,832 | |||||||||||||||||
| Income (Loss) Before Income Taxes |
(4,185 | ) | (1,754 | ) | 10,949 | 299 | (8,603 | ) | (3,294 | ) | ||||||||||||||
| Income Tax Expense (Benefit) |
— | 2,424 | 33 | (1,566 | ) | — | 891 | |||||||||||||||||
| Net Income (Loss) |
$ | (4,185 | ) | $ | (4,178 | ) | $ | 10,916 | $ | 1,865 | $ | (8,603 | ) | $ | (4,185 | ) | ||||||||
| (1) | Kraton Performance Polymers and Polymer Holdings Capital Corporation are the issuers of the 12% Discount Notes. Polymer Holdings Capital Corporation has minimal assets and income. We do not believe that separate financial information concerning the issuers would provide additional information that would be useful. |
| (2) | Kraton and Kraton Polymers Capital Corporation are the issuers of the 8.125% Notes. Kraton Polymers Capital Corporation has minimal assets and income. We do not believe that separate financial information concerning the Issuers would provide additional information that would be useful. |
F-79
Table of Contents
KRATON PERFORMANCE POLYMERS, INC.
NOTES TO CONDENSED CONSOLIDATED FINANCIAL STATEMENTS—(Continued)
(Unaudited)
KRATON PERFORMANCE POLYMERS, INC.
CONDENSED CONSOLIDATING STATEMENT OF OPERATIONS
Six months ended June 30, 2010
(Unaudited)
(In thousands)
| Kraton Performance Polymers (1) |
Kraton (2) | Guarantor Subsidiaries |
Non-Guarantor Subsidiaries |
Eliminations | Consolidated | ||||||||||||||||
| Operating Revenues |
|||||||||||||||||||||
| Sales |
$ | — | $ | — | $ | 344,208 | $ | 333,343 | $ | (72,733 | ) | $ | 604,818 | ||||||||
| Total operating revenues |
— | — | 344,208 | 333,343 | (72,733 | ) | 604,818 | ||||||||||||||
| Cost of Goods Sold |
— | — | 240,286 | 279,025 | (72,733 | ) | 446,578 | ||||||||||||||
| Gross Profit |
— | — | 103,922 | 54,318 | — | 158,240 | |||||||||||||||
| Operating Expenses |
|||||||||||||||||||||
| Research and development expenses |
— | — | 7,080 | 4,476 | — | 11,556 | |||||||||||||||
| Selling, general and administrative expenses |
— | (82 | ) | 32,694 | 11,222 | — | 43,834 | ||||||||||||||
| Depreciation and amortization of identifiable intangibles |
— | 7,818 | 11,712 | 3,485 | — | 23,015 | |||||||||||||||
| Total operating expenses |
— | 7,736 | 51,486 | 19,183 | — | 78,405 | |||||||||||||||
| Earnings in Consolidated Subsidiaries |
58,424 | 79,762 | — | — | (138,186 | ) | — | ||||||||||||||
| Earnings of Unconsolidated Joint Venture |
— | — | — | 236 | — | 236 | |||||||||||||||
| Interest Expense (Income), net |
— | 16,581 | (5,654 | ) | 1,409 | — | 12,336 | ||||||||||||||
| Income Before Income Taxes |
58,424 | 55,445 | 58,090 | 33,962 | (138,186 | ) | 67,735 | ||||||||||||||
| Income Tax Expense (Benefit) |
34 | (2,979 | ) | 566 | 11,724 | — | 9,345 | ||||||||||||||
| Net Income |
$ | 58,390 | $ | 58,424 | $ | 57,524 | $ | 22,238 | $ | (138,186 | ) | $ | 58,390 | ||||||||
| (1) | Kraton Performance Polymers and Polymer Holdings Capital Corporation are the issuers of the 12% Discount Notes. Polymer Holdings Capital Corporation has minimal assets and income. We do not believe that separate financial information concerning the issuers would provide additional information that would be useful. |
| (2) | Kraton and Kraton Polymers Capital Corporation are the issuers of the 8.125% Notes. Kraton Polymers Capital Corporation has minimal assets and income. We do not believe that separate financial information concerning the Issuers would provide additional information that would be useful. |
F-80
Table of Contents
KRATON PERFORMANCE POLYMERS, INC.
NOTES TO CONDENSED CONSOLIDATED FINANCIAL STATEMENTS—(Continued)
(Unaudited)
KRATON PERFORMANCE POLYMERS, INC.
CONDENSED CONSOLIDATING STATEMENT OF OPERATIONS
Six months ended June 30, 2009
(Unaudited)
(In thousands)
| Kraton Performance Polymers (1) |
Kraton (2) | Guarantor Subsidiaries |
Non-Guarantor Subsidiaries |
Eliminations | Consolidated | |||||||||||||||||||
| Operating Revenues |
||||||||||||||||||||||||
| Sales |
$ | — | $ | — | $ | 218,973 | $ | 273,425 | $ | (80,791 | ) | $ | 411,607 | |||||||||||
| Other |
— | — | — | 17,172 | — | 17,172 | ||||||||||||||||||
| Total operating revenues |
— | — | 218,973 | 290,597 | (80,791 | ) | 428,779 | |||||||||||||||||
| Cost of Goods Sold |
— | (3,706 | ) | 191,552 | 277,030 | (80,791 | ) | 384,085 | ||||||||||||||||
| Gross Profit |
— | 3,706 | 27,421 | 13,567 | — | 44,694 | ||||||||||||||||||
| Operating Expenses |
||||||||||||||||||||||||
| Research and development expenses |
— | — | 6,060 | 3,980 | — | 10,040 | ||||||||||||||||||
| Selling, general and administrative expenses |
— | (625 | ) | 19,354 | 17,574 | — | 36,303 | |||||||||||||||||
| Depreciation and amortization of identifiable intangibles |
— | 8,141 | 11,025 | 5,940 | — | 25,106 | ||||||||||||||||||
| Total operating expenses |
— | 7,516 | 36,439 | 27,494 | — | 71,449 | ||||||||||||||||||
| Gain on Extinguishment of Debt |
— | 23,831 | — | — | — | 23,831 | ||||||||||||||||||
| Earnings of Consolidated Subsidiaries |
(20,644 | ) | (18,948 | ) | — | — | 39,592 | — | ||||||||||||||||
| Earnings of Unconsolidated Joint Venture |
— | — | — | 176 | — | 176 | ||||||||||||||||||
| Interest Expense (Income), net |
5 | 19,858 | (5,471 | ) | 2,346 | — | 16,738 | |||||||||||||||||
| Income (Loss) Before Income Taxes |
(20,649 | ) | (18,785 | ) | (3,547 | ) | (16,097 | ) | 39,592 | (19,486 | ) | |||||||||||||
| Income Tax Expense (Benefit) |
(3 | ) | 1,859 | 67 | (763 | ) | — | 1,160 | ||||||||||||||||
| Net Loss |
$ | (20,646 | ) | $ | (20,644 | ) | $ | (3,614 | ) | $ | (15,334 | ) | $ | 39,592 | $ | (20,646 | ) | |||||||
| (1) | Kraton Performance Polymers and Polymer Holdings Capital Corporation are the issuers of the 12% Discount Notes. Polymer Holdings Capital Corporation has minimal assets and income. We do not believe that separate financial information concerning the issuers would provide additional information that would be useful. |
| (2) | Kraton and Kraton Polymers Capital Corporation are the issuers of the 8.125% Notes. Kraton Polymers Capital Corporation has minimal assets and income. We do not believe that separate financial information concerning the Issuers would provide additional information that would be useful. |
F-81
Table of Contents
KRATON PERFORMANCE POLYMERS, INC.
NOTES TO CONDENSED CONSOLIDATED FINANCIAL STATEMENTS—(Continued)
(Unaudited)
KRATON PERFORMANCE POLYMERS, INC.
CONDENSED CONSOLIDATING STATEMENT OF CASH FLOWS
Six months ended June 30, 2010
(Unaudited)
(In thousands)
| Kraton Performance Polymers (1) |
Kraton (2) | Guarantor Subsidiaries |
Non-Guarantor Subsidiaries |
Eliminations | Consolidated | |||||||||||||||||||
| Cash flows provided by (used in) operating activities |
$ | — | $ | (12,315 | ) | $ | 6,231 | $ | (44,953 | ) | $ | — | $ | (51,037 | ) | |||||||||
| Cash flows provided by (used in) investing activities |
||||||||||||||||||||||||
| Proceeds from (payments on) intercompany loans |
— | (849 | ) | — | — | 849 | — | |||||||||||||||||
| Purchase of plant and equipment, net of proceeds from sales of equipment |
— | — | (14,178 | ) | (3,367 | ) | — | (17,545 | ) | |||||||||||||||
| Purchase of software |
— | — | (1,857 | ) | — | — | (1,857 | ) | ||||||||||||||||
| Net cash provided by (used in) investing activities |
— | (849 | ) | (16,035 | ) | (3,367 | ) | 849 | (19,402 | ) | ||||||||||||||
| Cash flows provided by (used in) financing activities |
||||||||||||||||||||||||
| Proceeds from debt |
— | 69,000 | — | — | — | 69,000 | ||||||||||||||||||
| Repayment of debt |
— | (70,152 | ) | — | — | — | (70,152 | ) | ||||||||||||||||
| Cash contribution from member |
— | 11,750 | — | — | (11,750 | ) | — | |||||||||||||||||
| Cash distribution to member |
(11,750 | ) | — | — | — | 11,750 | — | |||||||||||||||||
| Proceeds from issuance of common stock |
11,197 | — | — | — | — | 11,197 | ||||||||||||||||||
| Proceeds from stock based compensation |
1,087 | — | — | — | — | 1,087 | ||||||||||||||||||
| Costs associated with the issuance of common stock |
(534 | ) | — | — | — | — | (534 | ) | ||||||||||||||||
| Proceeds from insurance note payable |
— | 3,518 | — | — | — | 3,518 | ||||||||||||||||||
| Repayment of insurance note payable |
— | (952 | ) | — | — | — | (952 | ) | ||||||||||||||||
| Proceeds from (payments on) intercompany loans |
— | — | (11,914 | ) | 12,763 | (849 | ) | — | ||||||||||||||||
| Net cash provided by (used in) financing activities |
— | 13,164 | (11,914 | ) | 12,763 | (849 | ) | 13,164 | ||||||||||||||||
| Effect of exchange rate differences on cash |
— | — | — | 27,389 | — | 27,389 | ||||||||||||||||||
| Net decrease in cash and cash equivalents |
— | — | (21,718 | ) | (8,168 | ) | — | (29,886 | ) | |||||||||||||||
| Cash and cash equivalents at beginning of period |
— | — | 36,567 | 32,724 | — | 69,291 | ||||||||||||||||||
| Cash and cash equivalents at end of period |
$ | — | $ | — | $ | 14,849 | $ | 24,556 | $ | — | $ | 39,405 | ||||||||||||
| (1) | Kraton Performance Polymers and Polymer Holdings Capital Corporation are the issuers of the 12% Discount Notes. Polymer Holdings Capital Corporation has minimal assets and income. We do not believe that separate financial information concerning the issuers would provide additional information that would be useful. |
| (2) | Kraton and Kraton Polymers Capital Corporation are the issuers of the 8.125% Notes. Kraton Polymers Capital Corporation has minimal assets and income. We do not believe that separate financial information concerning the Issuers would provide additional information that would be useful. |
F-82
Table of Contents
KRATON PERFORMANCE POLYMERS, INC.
NOTES TO CONDENSED CONSOLIDATED FINANCIAL STATEMENTS—(Continued)
(Unaudited)
KRATON PERFORMANCE POLYMERS, INC.
CONDENSED CONSOLIDATING STATEMENT OF CASH FLOWS
Six months ended June 30, 2009
(Unaudited)
(In thousands)
| Kraton Performance Polymers (1) |
Kraton (2) | Guarantor Subsidiaries |
Non-Guarantor Subsidiaries |
Eliminations | Consolidated | ||||||||||||||||||
| Cash flows provided by (used in) operating activities |
$ | — | $ | (22,334 | ) | $ | 19,861 | $ | 7,180 | $ | — | $ | 4,707 | ||||||||||
| Cash flows provided by (used in) investing activities |
|||||||||||||||||||||||
| Proceeds from (payments on) intercompany loans |
81,656 | (81,656 | ) | — | |||||||||||||||||||
| Purchase of property, plant and equipment, net of proceeds from sales of equipment |
— | — | (15,562 | ) | (577 | ) | — | (16,139 | ) | ||||||||||||||
| Purchase of Software |
(6,685 | ) | (6,685 | ) | |||||||||||||||||||
| Net cash provided by (used in) investing activities |
— | 81,656 | (22,247 | ) | (577 | ) | (81,656 | ) | (22,824 | ) | |||||||||||||
| Cash flows provided by (used in) financing activities |
|||||||||||||||||||||||
| Proceeds from debt |
— | 53,000 | — | — | — | 53,000 | |||||||||||||||||
| Repayment of debt |
— | (115,341 | ) | — | — | — | (115,341 | ) | |||||||||||||||
| Proceeds from (payments on) intercompany loans |
— | — | (60,588 | ) | (21,068 | ) | 81,656 | — | |||||||||||||||
| Proceeds from insurance note payable |
— | 4,506 | — | — | — | 4,506 | |||||||||||||||||
| Repayment of insurance note payable |
— | (1,487 | ) | — | — | — | (1,487 | ) | |||||||||||||||
| Net cash provided by (used in) financing activities |
— | (59,322 | ) | (60,588 | ) | (21,068 | ) | 81,656 | (59,322 | ) | |||||||||||||
| Effect of exchange rate differences on cash |
— | — | — | (6,247 | ) | — | (6,247 | ) | |||||||||||||||
| Net decrease in cash and cash equivalents |
— | — | (62,974 | ) | (20,712 | ) | — | (83,686 | ) | ||||||||||||||
| Cash and cash equivalents at beginning of period |
— | — | 65,460 | 35,936 | — | 101,396 | |||||||||||||||||
| Cash and cash equivalents at end of period |
$ | — | $ | — | $ | 2,486 | $ | 15,224 | $ | — | $ | 17,710 | |||||||||||
| (1) | Kraton Performance Polymers and Polymer Holdings Capital Corporation are the issuers of the 12% Discount Notes. Polymer Holdings Capital Corporation has minimal assets and income. We do not believe that separate financial information concerning the issuers would provide additional information that would be useful. |
| (2) | Kraton and Kraton Polymers Capital Corporation are the issuers of the 8.125% Notes. Kraton Polymers Capital Corporation has minimal assets and income. We do not believe that separate financial information concerning the Issuers would provide additional information that would be useful. |
F-83
Table of Contents
KRATON PERFORMANCE POLYMERS, INC.
NOTES TO CONDENSED CONSOLIDATED FINANCIAL STATEMENTS—(Continued)
(Unaudited)
16. Subsequent Events
During the first quarter of 2010, we received a communication from a law firm asserting that approximately $13.5 million in alleged payments to us from SemGroup, L.P. and/or one or more of its affiliates (collectively “SemGroup”) during the 90-day period preceding SemGroup’s Chapter 11 bankruptcy filing on July 22, 2008 appear to constitute preferential payments avoidable and recoverable under sections 547 and 550 of the United States Bankruptcy Code. This matter was settled for a de minimis sum in July 2010 in a manner which provides Kraton with a release of claims in connection with the matter. This resolution is final and completed and will not have a material adverse impact on our business, financial condition or results of operations.
We have evaluated significant events and transactions that have occurred and have determined that there were no other events or transactions other than those disclosed in this report that would require recognition or disclosure in our Condensed Consolidated Financial Statements for the quarterly period ended June 30, 2010.
F-84
Table of Contents
8,000,000 Shares
Common Stock
Credit Suisse
BofA Merrill Lynch
Morgan Stanley
Oppenheimer & Co.
KeyBanc Capital Markets
UBS Investment Bank
Prospectus
, 2010
Table of Contents
PART II
INFORMATION NOT REQUIRED IN PROSPECTUS
| Item 13. | Other Expenses of Issuance and Distribution. |
Estimated expenses payable in connection with the sale of the common stock in this offering are as follows:
| SEC registration fee |
$ | 18,032.34 | |
| FINRA filing fee |
25,791.00 | ||
| Printing and engraving expenses |
250,000.00 | ||
| Legal fees and expenses |
250,000.00 | ||
| Accounting fees and expenses |
150,000.00 | ||
| Blue Sky fees and expenses |
10,000.00 | ||
| Miscellaneous |
150,000.00 | ||
| Total |
$ | 853,823.34 | |
We will bear all of the expenses shown above.
| Item 14. | Indemnification of Directors and Officers. |
The Delaware General Corporation Law and our certificate of incorporation and bylaws provide for indemnification of our directors and officers for liabilities and expenses that they may incur in such capacities. In general, directors and officers are indemnified with respect to actions taken in good faith in a manner reasonably believed to be in, or not opposed to, our best interests, and with respect to any criminal action or proceeding, actions that the indemnitee had no reasonable cause to believe were unlawful. Please see our certificate of incorporation and our bylaws, which are filed as Exhibits 3.1 and 3.2, respectively.
We have entered into indemnification agreements with our directors, officers and certain key employees on May 27, 2010. The indemnification agreements provide our directors, officers and certain key employees with further indemnification to the maximum extent permitted by the Delaware General Corporation Law. The form of indemnification agreement is filed as an exhibit to our Form 8-K filed with the SEC on June 2, 2010. We expect to enter into an underwriting agreement that also provides that the underwriters are obligated, under certain circumstances, to indemnify our directors, officers and controlling persons against certain liabilities, including liabilities under the Securities Act.
We currently maintain a directors’ and officers’ liability insurance policy.
| Item 15. | Recent Sales of Unregistered Securities. |
On December 16, 2009, in connection with our initial public offering, Polymer Holdings and its consolidated subsidiaries were converted from a Delaware limited liability company to a Delaware corporation and renamed Kraton Performance Polymers, Inc. All of the outstanding membership interests of Polymer Holdings held by TJ Chemical were converted into 19,325,311 shares of common stock of Kraton Performance Polymers, Inc.
| Item 16. | Exhibits and Financial Statement Schedules. |
(a) Exhibits: The list of exhibits is set forth in beginning on page II-5 of this Registration Statement and is incorporated herein by reference.
II-1
Table of Contents
(b) Financial Statement Schedules: No financial statement schedules are provided because the information called for is not applicable or is shown in the financial statements or notes thereto.
| Item 17. | Undertakings. |
* (h) Insofar as indemnification for liabilities arising under the Securities Act of 1933 may be permitted to directors, officers, and controlling persons of the registrant pursuant to the foregoing provisions, or otherwise, the registrant has been advised that in the opinion of the Securities and Exchange Commission such indemnification is against public policy as expressed in the Act and is, therefore, unenforceable. In the event that a claim for indemnification against such liabilities (other than the payment by the registrant of expenses incurred or paid by a director, officer, or controlling person of the registrant in the successful defense of any action, suit or proceeding) is asserted by such director, officer, or controlling person in connection with the securities being registered, the registrant will, unless in the opinion of its counsel the matter has been settled by controlling precedent, submit to a court of appropriate jurisdiction the question whether such indemnification by it is against public policy as expressed in the Act and will be governed by the final adjudication of such issue.
* (i) The undersigned registrant hereby undertakes that:
| • | For purposes of determining any liability under the Securities Act of 1933, the information omitted from the form of prospectus filed as part of this registration statement in reliance upon Rule 430A and contained in a form of prospectus filed by us pursuant to Rule 424(b)(1) or (4) or 497(h) under the Securities Act shall be deemed to be part of this registration statement as of the time it was declared effective. |
| • | For the purpose of determining any liability under the Securities Act of 1933, each post-effective amendment that contains a form of prospectus shall be deemed to be a new registration statement relating to the securities offered therein, and the offering of such securities at that time shall be deemed to be the initial bona fide offering thereof. |
| * | Paragraph references correspond to those of Regulation S-K, Item 512. |
II-2
Table of Contents
SIGNATURES
Pursuant to the requirements of the Securities Act of 1933, the registrant has duly caused this registration statement to be signed on its behalf by the undersigned, thereunto duly authorized, in the city of Houston, State of Texas on September 20, 2010.
| KRATON PERFORMANCE POLYMERS, INC. | ||
| By: | /s/ KEVIN M. FOGARTY | |
| Its: | President and Chief Executive Officer | |
Pursuant to the requirements of the Securities Act of 1933, as amended, this registration statement has been signed below by the following persons in the capacities and on the dates indicated.
| Name |
Title |
Date | ||
| /S/ KEVIN M. FOGARTY Kevin M. Fogarty |
Chief Executive Officer, President and Director (principal executive officer) |
September 20, 2010 | ||
| /s/ STEPHEN E. TREMBLAY Stephen E. Tremblay |
Chief Financial Officer (principal financial and accounting officer) | September 20, 2010 | ||
| * Dan F. Smith |
Director | September 20, 2010 | ||
| * Barry J. Goldstein |
Director | September 20, 2010 | ||
| * Kelvin L. Davis |
Director | September 20, 2010 | ||
| * Michael G. MacDougall |
Director | September 20, 2010 | ||
| * Nathan H. Wright |
Director | September 20, 2010 | ||
II-3
Table of Contents
| Name |
Title |
Date | ||
| * Timothy J. Walsh |
Director |
September 20, 2010 | ||
| * Kevin G. O’Brien |
Director | September 20, 2010 | ||
| * Steven J. Demetriou |
Director | September 20, 2010 | ||
| * Richard C. Brown |
Director | September 20, 2010 | ||
| * Karen A. Twitchell |
Director | September 20, 2010 | ||
| *By: | /s/ KEVIN M. FOGARTY | |
| Kevin M. Fogarty, as Attorney-in-Fact | ||
II-4
Table of Contents
EXHIBIT INDEX
| Exhibit No |
Description of Exhibits | |
| 1.1 | Form of Underwriting Agreement | |
| 2.1 | Amended and Restated Agreement and Plan of Merger dated November 5, 2003, among Ripplewood Chemical Holding LLC, Kraton Polymers LLC, Polymer Holdings LLC and Polymer Acquisition LLC (portions of this exhibit have been omitted pursuant to a request for confidential treatment) (incorporated by reference to Exhibit 2.1 to Amendment No. 2 to Kraton Polymers LLC’s Registration Statement on Form S-4 filed with the SEC on July 15, 2005) | |
| 3.1 | Certificate of Incorporation of Kraton Performance Polymers, Inc. | |
| 3.2 | Bylaws of Kraton Performance Polymers, Inc. | |
| 4.1 | Specimen Stock Certificate of Kraton Performance Polymers, Inc.’s Common Stock, par value $0.01 per share (incorporated by reference to Exhibit 4.1 to Amendment No. 4 to Kraton Performance Polymers, Inc.’s Registration Statement on Form S-1 filed with the SEC on December 10, 2009) | |
| 4.2 | Reference is made to Exhibits 3.1 and 3.2 | |
| 4.3 | Indenture dated as of November 2, 2004, among Polymer Holdings LLC, Polymer Holdings Capital Corporation, and Wells Fargo Bank, N.A., as trustee, relating to the 12.000% Senior Discount Notes due 2014 (incorporated by reference to Exhibit 4.1 to Polymer Holdings LLC’s Registration Statement on Form S-4 filed with the SEC on April 1, 2005) | |
| 4.4 | First Supplemental Indenture dated May 9, 2006, among Polymer Holdings LLC, Polymer Holdings Capital Corporation and Wells Fargo Bank, N.A., as trustee, relating to the 12.000% Senior Discount Notes due 2014 (incorporated by reference to Exhibit 4.1 to Polymer Holdings LLC’s Quarterly Report on Form 10-Q filed with the SEC on May 15, 2006) | |
| 4.5 | Indenture dated as of December 23, 2003, among Kraton Polymers LLC, Kraton Polymers Capital Corporation, the Guarantors named therein and Wells Fargo Bank Minnesota, N.A., as trustee, relating to the 8.125% Senior Subordinated Notes due 2014 (incorporated by reference to Exhibit 4.1 to Kraton Polymer LLC’s Registration Statement on Form S-4 filed with the SEC on April 1, 2005) | |
| 4.6 | Form of 8.125% Senior Subordinated Notes due 2014 of Kraton Polymers LLC and Kraton Polymers Capital Corporation (incorporated by reference to Exhibit A1 to the Indenture filed as Exhibit 4.1 to Kraton Polymers LLC’s Registration Statement on Form S-4 filed with the SEC on April 1, 2005) | |
| 4.7 | Pledge and Security Agreement dated December 23, 2003, among Kraton Polymers LLC, Polymer Holdings LLC, Kraton Polymers Capital Corporation, Elastomers Holdings LLC, Kraton Polymers U.S. LLC, as Grantors and UBS AG, Stamford Branch, as Collateral Agent (incorporated by reference to Exhibit 4.4 to Kraton Polymers LLC’s Registration Statement on Form S-4 filed with the SEC on April 1, 2005) | |
| 4.8 | Credit and Guaranty Agreement dated December 23, 2003, among Kraton Polymers LLC, as Borrower, Polymer Holdings LLC, certain subsidiaries of Kraton Polymers LLC, as Guarantors, various lenders, Goldman Sachs Credit Partners L.P. and UBS Securities LLC, as Lead Arrangers, Goldman Sachs Credit Partners L.P., as Syndication Agent, UBS AG, Stamford Branch, as Administrative Agent and Collateral Agent and Morgan Stanley Senior Funding Inc., Credit Suisse First Boston, acting through its Cayman Islands Branch and General Electric Capital Corporation, as Documentation Agents (incorporated by reference to Exhibit 4.5(a) to Kraton Polymers LLC’s Registration Statement on Form S-4 filed with the SEC on April 1, 2005) | |
II-5
Table of Contents
| Exhibit No |
Description of Exhibits | |
| 4.9 | Amendment No. 1 to the Credit and Guaranty Agreement dated as of March 4, 2004 (incorporated by reference to Exhibit 4.5(b) to Kraton Polymers LLC’s Registration Statement on Form S-4 filed with the SEC on April 1, 2005) | |
| 4.10 | Amendment No. 2 to the Credit and Guaranty Agreement dated as of October 21, 2004 (incorporated by reference to Exhibit 4.5(c) to Kraton Polymers LLC’s Registration Statement on Form S-4 filed with the SEC on April 1, 2005) | |
| 4.11 | Amendment No. 3 to the Credit and Guaranty Agreement dated as of February 16, 2006 (incorporated by reference to Exhibit 10.1 to Kraton Polymers LLC’s Quarterly Report on Form 10-Q filed with the SEC on May 15, 2006) | |
| 4.12 | Amendment No. 4 to the Credit and Guaranty Agreement dated as of May 12, 2006 (incorporated by reference to Exhibit 10.3 to Kraton Polymers LLC’s Quarterly Report on Form 10-Q filed with the SEC on May 15, 2006) | |
| 4.13 | Amendment No. 5 to the Credit and Guaranty Agreement dated as of December 15, 2006 (incorporated by reference to Exhibit 10.1 to Kraton Polymers LLC’s Current Report on Form 8-K filed with the SEC on December 21, 2006) | |
| 4.14 | Amendment No. 6 to the Credit and Guaranty Agreement dated as of October 20, 2009 (incorporated by reference to Exhibit 99.1 to Kraton Polymers LLC’s Current Report on Form 8-K filed with the SEC on October 22, 2009) | |
| 4.15 | Amendment No. 7 to the Credit and Guaranty Agreement dated as of November 30, 2009 (incorporated by reference to Exhibit 99.1 to Kraton Polymers LLC’s Current Report on Form 8-K filed with the SEC on November 30, 2009) | |
| 4.16 | Joinder Agreement dated June 7, 2006, among Amegy Bank National Association as Lender, Kraton Polymers LLC as Borrower, the Guarantors and the UBS AG, Stamford Branch as Administrative Agent (incorporated by reference to Exhibit 10.1 to Kraton Polymers LLC’s Current Report on Form 8-K filed with the SEC on June 7, 2006) | |
| 4.17 | Form of Amended and Restated Registration Rights and Shareholders’ Agreement, (incorporated by reference to Exhibit 4.17 to Amendment No. 4 to Kraton Performance Polymers, Inc.’s Registration Statement on Form S-1 filed with the SEC on December 10, 2009) | |
| 5.1 | Opinion of Cleary Gottlieb Steen & Hamilton LLP | |
| 10.1 | Employment Agreement dated April 12, 2004, between Richard A. Ott and Kraton Polymers LLC (incorporated by reference to Exhibit 10.20 to Kraton Polymers LLC’s Registration Statement on Form S-4 filed with the SEC on April 1, 2005) | |
| 10.2 | Amendment No. 2 to the Employment Agreement dated April 9, 2007, between Richard A. Ott and Kraton Polymers LLC (incorporated by reference to Exhibit 10.5(a) to Kraton Polymers LLC’s Annual Report on Form 10-K filed with the SEC on April 12, 2007) | |
| 10.3 | Profits Unit Award Agreement dated September 10, 2004, between Richard A. Ott and Kraton Polymers LLC (incorporated by reference to Exhibit 10.22 to Kraton Polymers LLC’s Registration Statement on Form S-4 filed with the SEC on April 1, 2005) | |
| 10.4 | Employment Agreement dated March 8, 2004, between David A. Bradley and Kraton Polymers LLC (incorporated by reference to Exhibit 10.26 to Kraton Polymers LLC’s Registration Statement on Form S-4 filed with the SEC on April 1, 2005) | |
| 10.5 | Amendment No. 3 to the Employment Agreement dated April 9, 2007, between David A. Bradley and Kraton Polymers LLC (incorporated by reference to Exhibit 10.9(a) to Kraton Polymers LLC’s Annual Report on Form 10-K filed with the SEC on April 12, 2007) | |
II-6
Table of Contents
| Exhibit No |
Description of Exhibits | |
| 10.6 | Employment Agreement dated as of April 1, 2008, between David A. Bradley and Kraton Polymers LLC (incorporated by reference to Exhibit 10.2 to Kraton Polymers LLC’s Current Report on Form 8-K filed with the SEC on April 7, 2008) | |
| 10.7 | Profits Unit Award Agreement dated September 10, 2004, between David A. Bradley and Kraton Polymers LLC (incorporated by reference to Exhibit 10.28 to Kraton Polymers LLC’s Registration Statement on Form S-4 filed with the SEC on April 1, 2005) | |
| 10.8 | Restricted Unit Award Grant Agreement dated September 10, 2004, between David A. Bradley and Kraton Polymers LLC (incorporated by reference to Exhibit 10.29 to Kraton Polymers LLC’s Registration Statement on Form S-4 filed with the SEC on April 1, 2005) | |
| 10.9 | Restricted Unit Award Grant Agreement dated as of March 17, 2005, between Kraton Polymers LLC and David A. Bradley (incorporated by reference to Exhibit 10.29(a) to Amendment No. 1 to Kraton Polymers LLC’s Registration Statement on Form S-4 filed with the SEC on June 9, 2005) | |
| 10.10 | Restricted Unit Award Grant Agreement dated as of June 19, 2008, between Kraton Polymers LLC and David Bradley (incorporated by reference to Exhibit 10.18 to Amendment No. 2 to Kraton Performance Polymers, Inc.’s Registration Statement on Form S-1 filed with the SEC on November 20, 2009) | |
| 10.11 | Employment Agreement dated November 9, 2005, between Kraton and Kevin M. Fogarty (incorporated by reference to Exhibit 10.3 to Kraton Polymers LLC’s Quarterly Report on Form 10-Q filed with the SEC on November 14, 2005) | |
| 10.12 | Amendment No. 2 to the Employment Agreement dated April 9, 2007, between Kevin M. Fogarty and Kraton Polymers LLC (incorporated by reference to Exhibit 10.16(a) to Kraton Polymers LLC’s Annual Report on Form 10-K filed with the SEC on April 12, 2007) | |
| 10.13 | Employment Agreement dated April 1, 2008, between Kevin M. Fogarty and Kraton Polymers LLC (incorporated by reference to Exhibit 10.1 to Kraton Polymers LLC’s Current Report on Form 8-K filed with the SEC on April 7, 2008) | |
| 10.14 | Notional Unit Award Grant Agreement dated July 15, 2005, between Kevin M. Fogarty and Kraton Polymers LLC (incorporated by reference to Exhibit 10.56 to Amendment No. 3 to Kraton Polymers LLC’s Registration Statement on Form S-4 filed with the SEC on August 30, 2005) | |
| 10.15 | Amendment No. 1 dated December 18, 2008 to the Notional Unit Award Grant Agreement, between Kevin Fogarty and Kraton Polymers LLC (incorporated by reference to Exhibit 10.23 to Amendment No. 2 to Kraton Performance Polymers, Inc.’s Registration Statement on Form S-1 filed with the SEC on November 20, 2009) | |
| 10.16 | Profits Unit Award Agreement dated July 15, 2005, between Kevin M. Fogarty and Kraton Management LLC (incorporated by reference to Exhibit 10.58 to Amendment No. 3 to Kraton Polymers LLC’s Registration Statement on Form S-4 filed with the SEC on August 30, 2005) | |
| 10.17 | Restricted Unit Award Grant Agreement dated as of June 19, 2008, between Kraton Polymers LLC and Kevin M. Fogarty (incorporated by reference to Exhibit 10.25 to Amendment No. 2 to Kraton Performance Polymers, Inc.’s Registration Statement on Form S-1 filed with the SEC on November 20, 2009) | |
| 10.18 | Employment Agreement dated April 1, 2008, between Stephen E. Tremblay and Kraton Polymers LLC (incorporated by reference to Exhibit 10.3 to Kraton Polymers LLC’s Current Report on Form 8-K filed with the SEC on April 7, 2008) | |
| 10.19 | Employment Agreement dated December 31, 2008, between Lothar Fruend and Kraton Polymers LLC (incorporated by reference to Exhibit 10.27 to Amendment No. 2 to Kraton Performance Polymers, Inc.’s Registration Statement on Form S-1 filed with the SEC on November 20, 2009) | |
II-7
Table of Contents
| Exhibit No |
Description of Exhibits | |
| 10.20 | Savings Deferred Compensation and Restoration Plan dated December 31, 2008, restated (incorporated by reference to Exhibit 10.28 to Amendment No. 2 to Kraton Performance Polymers, Inc.’s Registration Statement on Form S-1 filed with the SEC on November 20, 2009) | |
| 10.21 | Pension Benefit Restoration Plan dated December 31, 2008, restated (incorporated by reference to Exhibit 10.29 to Amendment No. 3 to Kraton Performance Polymers, Inc.’s Registration Statement on Form S-1 filed with the SEC on December 2, 2009) | |
| 10.22 | Kraton Polymers LLC Executive Deferred Compensation Plan dated December 31, 2008 (incorporated by reference to Exhibit 10.30 to Amendment No. 3 to Kraton Performance Polymers, Inc.’s Registration Statement on Form S-1 filed with the SEC on December 2, 2009) | |
| 10.23 | Summary of the Terms of the 2009 Incentive Compensation Plan (incorporated by reference to Exhibit 10.32 to Amendment No. 2 to Kraton Performance Polymers, Inc.’s Registration Statement on Form S-1 filed with the SEC on November 20, 2009) | |
| 10.24 | TJ Chemical Holdings LLC 2004 Option Plan and Form of Option Grant Agreement (incorporated by reference to Exhibit 10.31 to Kraton Polymers LLC’s Registration Statement on Form S-4 filed with the SEC on April 1, 2005) | |
| 10.25 | Amendment to TJ Chemical Holdings LLC 2004 Option Plan dated August 18, 2008 (incorporated by reference to Exhibit 10.1 to Kraton Polymers LLC’s Quarterly Report on Form 10-Q filed with the SEC on November 12, 2008) | |
| 10.26 | Form of Amendment No. 2 to the Employment Agreement of Executive Officers (incorporated by reference to Exhibit 10.4 to Kraton Polymers LLC’s Current Report on Form 8-K filed with the SEC on December 22, 2006) | |
| 10.27 | Form of Amendment No. 3 to the Employment Agreement of Executive Officers effective December 31, 2008 (incorporated by reference to Exhibit 10.43 to Amendment No. 2 to Kraton Performance Polymers, Inc.’s Registration Statement on Form S-1 filed with the SEC on November 20, 2009) | |
| 10.28 | Form of Amendment No. 1 to the Profits Unit Award Agreement (incorporated by reference to Exhibit 10.5 to Kraton Polymers LLC’s Current Report on Form 8-K filed with the SEC on December 22, 2006) | |
| 10.29 | Form of Base Salary Reduction Agreement effective April 1, 2009 (incorporated by reference to Exhibit 10.46 to Amendment No. 2 to Kraton Performance Polymers, Inc.’s Registration Statement on Form S-1 filed with the SEC on November 20, 2009) | |
| 10.30 | Amendment No. 2 dated December 8, 2009 to the Notional Unit Award Grant Agreement, between Kevin M. Fogarty and Kraton Polymers LLC (incorporated by reference to Exhibit 10.47 to Amendment No. 4 to Kraton Performance Polymers, Inc.’s Registration Statement on Form S-1 filed with the SEC on December 10, 2009) | |
| 10.31 | Polymer Holdings Equity Incentive Plan dated November 30, 2009 (incorporated by reference to Exhibit 10.48 to Amendment No. 3 to Kraton Performance Polymers, Inc.’s Registration Statement on Form S-1 filed with the SEC on December 2, 2009) | |
| 10.32 | Polymer Holdings Cash Incentive Plan dated November 30, 2009 (incorporated by reference to Exhibit 10.49 to Amendment No. 2 to Kraton Performance Polymers, Inc.’s Registration Statement on Form S-1 filed with the SEC on November 20, 2009) | |
| 10.33 | Form of Polymer Holdings Restricted Stock Grant Agreement (incorporated by reference to Exhibit 10.50 to Amendment No. 3 to Kraton Performance Polymers, Inc.’s Registration Statement on Form S-1 filed with the SEC on December 2, 2009) | |
II-8
Table of Contents
| Exhibit No |
Description of Exhibits | |
| 10.34 | Form of Polymer Holdings Option Grant Agreement (incorporated by reference to Exhibit 10.51 to Amendment No. 3 to Kraton Performance Polymers, Inc.’s Registration Statement on Form S-1 filed with the SEC on December 2, 2009) | |
| 10.35 | Polymer Holdings Executive Deferred Compensation Plan dated November 30, 2009 (incorporated by reference to Exhibit 10.52 to Amendment No. 3 to Kraton Performance Polymers, Inc.’s Registration Statement on Form S-1 filed with the SEC on December 2, 2009) | |
| 10.36 | Amendment to TJ Chemical Option Plan dated November 30, 2009 (incorporated by reference to Exhibit 10.53 to Amendment No. 3 to Kraton Performance Polymers, Inc.’s Registration Statement on Form S-1 filed with the SEC on December 2, 2009) | |
| 10.37 | Amendment No.1 dated December 8, 2009 to the Restricted Unit Award Grant Agreement dated as of June 19, 2008, between Kraton Polymers LLC and Kevin M. Fogarty (incorporated by reference to Exhibit 10.54 to Amendment No. 4 to Kraton Performance Polymers, Inc.’s Registration Statement on Form S-1 filed with the SEC on December 10, 2009) | |
| 10.38 | Amendment No.1 dated December 8, 2009 to the Restricted Unit Award Grant Agreement dated as of March 17, 2005, between Kraton Polymers LLC and David A. Bradley (incorporated by reference to Exhibit 10.55 to Amendment No. 4 to Kraton Performance Polymers, Inc.’s Registration Statement on Form S-1 filed with the SEC on December 10, 2009) | |
| 10.39 | Amendment dated December 8, 2009 to the Restricted Unit Award Grant Agreement dated as of June 19, 2008, between Kraton Polymers LLC and David A. Bradley (incorporated by reference to Exhibit 10.56 to Amendment No. 4 to Kraton Performance Polymers, Inc.’s Registration Statement on Form S-1 filed with the SEC on December 10, 2009) | |
| 10.40 | Amendment dated December 8, 2009 to the Profits Unit Award Agreement dated July 15, 2005, between Kevin M. Fogarty and Kraton Management LLC (incorporated by reference to Exhibit 10.57 to Amendment No. 4 to Kraton Performance Polymers, Inc.’s Registration Statement on Form S-1 filed with the SEC on December 10, 2009) | |
| 10.41 | Amendment dated December 8, 2009 to the Profits Unit Award Agreement dated September 10, 2004, between David A. Bradley and Kraton Management LLC (incorporated by reference to Exhibit 10.58 to Amendment No. 4 to Kraton Performance Polymers, Inc.’s Registration Statement on Form S-1 filed with the SEC on December 10, 2009) | |
| 10.42 | Amendment dated December 8, 2009 to the Profits Unit Award Agreement dated September 10, 2004, between Richard A. Ott and Kraton Management LLC (incorporated by reference to Exhibit 10.59 to Amendment No. 4 to Kraton Performance Polymers, Inc.’s Registration Statement on Form S-1 filed with the SEC on December 10, 2009) | |
| 10.43 | Amended Employment Agreement dated December 8, 2009 between Kevin M. Fogarty and Kraton Polymers LLC (incorporated by reference to Exhibit 10.60 to Amendment No. 4 to Kraton Performance Polymers, Inc.’s Registration Statement on Form S-1 filed with the SEC on December 10, 2009) | |
| 10.44 | Amended Employment Agreement dated December 8, 2009, between David A. Bradley and Kraton Polymers LLC (incorporated by reference to Exhibit 10.61 to Amendment No. 4 to Kraton Performance Polymers, Inc.’s Registration Statement on Form S-1 filed with the SEC on December 10, 2009) | |
| 10.45 | Amended Employment Agreement dated December 8, 2009, between Richard Ott and Kraton Polymers LLC (incorporated by reference to Exhibit 10.62 to Amendment No. 4 to Kraton Performance Polymers, Inc.’s Registration Statement on Form S-1 filed with the SEC on December 10, 2009) | |
II-9
Table of Contents
| Exhibit No |
Description of Exhibits | |
| 10.46 | Amended Employment Agreement dated December 8, 2009, between Lothar Freund and Kraton Polymers LLC (incorporated by reference to Exhibit 10.63 to Amendment No. 4 to Kraton Performance Polymers, Inc.’s Registration Statement on Form S-1 filed with the SEC on December 10, 2009) | |
| 10.47 | Amended Employment Agreement dated December 8, 2009, between Stephen E. Tremblay and Kraton Polymers LLC (incorporated by reference to Exhibit 10.64 to Amendment No. 4 to Kraton Performance Polymers, Inc.’s Registration Statement on Form S-1 filed with the SEC on December 10, 2009) | |
| 10.48 | Amended and Restated Employment Agreement dated December 8, 2009, by and between Larry R. Frazier, Polymer Holdings, LLC and Kraton Polymers LLC (incorporated by reference to Exhibit 10.48 to Kraton Performance Polymers, Inc.’s Annual Report on Form 10-K filed with the SEC on March 15, 2010) | |
| 10.49 | Amended and Restated Employment Agreement dated December 8, 2009, by and between Stephen W. Duffy, Polymer Holdings, LLC and Kraton Polymers LLC (incorporated by reference to Exhibit 10.49 to Kraton Performance Polymers, Inc.’s Annual Report on Form 10-K filed with the SEC on March 15, 2010) | |
| 10.50 | First Amended and Restated Site Services, Utilities, Materials and Facilities Agreement dated February 28, 2001, between Shell Chimie S.A. and Kraton Polymers France S.A.S. (Berre) (portions of this exhibit have been omitted pursuant to a request for confidential treatment) (incorporated by reference to Exhibit 10.34 to Amendment No. 2 to Kraton Polymers LLC’s Registration Statement on Form S-4 filed with the SEC on July 15, 2005) | |
| 10.51 | Amended and Restated Belpre Facility Sharing and Operating Agreement dated July 1, 1999, among Infineum USA LP, Shell Oil Company and Shell Elastomers LLC (portions of this exhibit have been omitted pursuant to a request for confidential treatment) (incorporated by reference to Exhibit 10.38 to Amendment No. 2 to Kraton Polymers LLC’s Registration Statement on Form S-4 filed with the SEC on July 15, 2005) | |
| 10.52 | Amendment No. 1 dated January 23, 2007 to Amended and Restated Belpre Facility Sharing and Operating Agreement (incorporated by reference to Exhibit 10.69 to Amendment No. 2 to Kraton Performance Polymers, Inc.’s Registration Statement on Form S-1 filed with the SEC on November 20, 2009) | |
| 10.53 | Amendment No. 2 dated January 1, 2009 to Amended and Restated Belpre Facility Sharing and Operating Agreement (incorporated by reference to Exhibit 10.70 to Amendment No. 2 to Kraton Performance Polymers, Inc.’s Registration Statement on Form S-1 filed with the SEC on November 20, 2009) | |
| 10.54 | First Amended and Restated Operations and Maintenance Services Agreement dated February 28, 2001, between Kraton Polymers France S.A.S. and Shell Chimie S.A. (Berre) (portions of this exhibit have been omitted pursuant to a request for confidential treatment) (incorporated by reference to Exhibit 10.36 to Amendment No. 2 to Kraton Polymers LLC’s Registration Statement on Form S-4 filed with the SEC on July 15, 2005) | |
| 10.55 | Production Agreement dated March 31, 2000, between Elenac GmbH and Kraton Polymers GmbH (Wesseling) (portions of this exhibit have been omitted pursuant to a request for confidential treatment) (incorporated by reference to Exhibit 10.37 to Amendment No. 2 to Kraton Polymers LLC’s Registration Statement on Form S-4 filed with the SEC on July 15, 2005) | |
| 10.56 | 1,3-Butadiene Agreement dated December 1, 1999, between Deutsche Shell Chemie GmbH and MWW Achtundzwanzigste Vermoegensverwaltungs GmbH (portions of this exhibit have been omitted pursuant to a request for confidential treatment) (incorporated by reference to Exhibit 10.44 to Amendment No. 2 to Kraton Polymers LLC’s Registration Statement on Form S-4 filed with the SEC on July 15, 2005) | |
II-10
Table of Contents
| Exhibit No |
Description of Exhibits | |
| 10.57 | Agreement dated February 28, 2001, between Shell Nederland Chemie B.V. and Kraton Polymers Nederland B.V. for the supply of Isoprene Monomer (portions of this exhibit have been omitted pursuant to a request for confidential treatment) (incorporated by reference to Exhibit 10.46 to Amendment No. 2 to Kraton Polymers LLC’s Registration Statement on Form S-4 filed with the SEC on July 15, 2005) | |
| 10.58 | Letter Amendment No. 2 (and by reference Amendment No. 1) to the Agreement dated February 28, 2001, between Shell Nederland Chemie B.V. and Kraton Polymers Nederland B.V. for the supply of Isoprene Monomer, dated December 10, 2007, between Shell Chemicals Europe B.V. and Kraton Polymers Nederland P.V. (incorporated by reference to Exhibit 10.39(a) to Kraton Polymers LLC’s Annual Report on Form 10-K filed with the SEC on March 31, 2008) | |
| 10.59 | Manufacturing Facility Lease dated August 24, 2000, between Shell Chemie and Kravis (Berre-Kraton D) (incorporated by reference to Exhibit 10.47 to Kraton Polymers LLC’s Registration Statement on Form S-4 filed with the SEC on April 1, 2005) | |
| 10.60 | Manufacturing Facility Lease dated August 24, 2000, between Shell Chimie and Kraton Polymers France SAS (Berre-Kraton G) (incorporated by reference to Exhibit 10.48 to Kraton Polymers LLC’s Registration Statement on Form S-4 filed with the SEC on April 1, 2005) | |
| 10.61 | Business Lease dated March 31, 2000, between Elenac GmbH and Kraton Polymers GmbH (Wesseling) (portions of this exhibit have been omitted pursuant to a request for confidential treatment) (incorporated by reference to Exhibit 10.49 to Kraton Polymers LLC’s Registration Statement on Form S-4 filed with the SEC on April 1, 2005) | |
| 10.62 | Amendment to the Business Lease dated March 31, 2000, between Bassell Polyolefine GmbH (previously Elenac GmbH) and Kraton Polymers GmbH (incorporated by reference to Exhibit 10.49(a) to Kraton Polymers LLC’s Registration Statement on Form S-4 filed with the SEC on April 1, 2005) | |
| 10.63 | Contribution Agreement dated February 28, 2001, between Shell Oil Company and Shell Elastomers (portions of this exhibit have been omitted pursuant to a request for confidential treatment) (incorporated by reference to Exhibit 10.50 to Amendment No. 2 to Kraton Polymers LLC’s Registration Statement on Form S-4 filed with the SEC on July 15, 2005) | |
| 10.64 | Contribution Agreement dated February 28, 2001, between Shell Internationale Research Maatschappij B.V. and Kraton Polymers Research B.V. (portions of this exhibit have been omitted pursuant to a request for confidential treatment) (incorporated by reference to Exhibit 10.51 to Amendment No. 2 to Kraton Polymers LLC’s Registration Statement on Form S-4 filed with the SEC on July 15, 2005) | |
| 10.65 | Agreement for Adjustment and Termination of Services under Kraton/SNC SUMFs and OMS Agreements at Pernis dated as of June 28, 2007 by and among Shell Nederland Chemie B.V. and Kraton Polymers Nederland B.V. (incorporated by reference to Exhibit 10.1 to Kraton Polymers LLC’s Quarterly Report on Form 10-Q filed with the SEC on November 14, 2007) | |
| 10.66 | Amendment to Outstanding Option Grant Agreements (incorporated by reference to Exhibit 10.92 to Amendment No. 3 to Kraton Performance Polymers, Inc.’s Registration Statement on Form S-1 filed with the SEC on December 2, 2009) | |
| 10.67 | Form of Indemnification Agreement (incorporated by reference to Exhibit 10.1 to Kraton Performance Polymers Inc.’s Current Report on Form 8-K filed with SEC on June 2, 2010) | |
| 21.1 | List of Significant Subsidiaries (incorporated by reference to Exhibit 21.1 to Amendment No. 5 to Kraton Performance Polymers, Inc.’s Registration Statement on Form S-1 filed with the SEC on December 14, 2009) | |
II-11
Table of Contents
| Exhibit No |
Description of Exhibits | |
| 23.1 | Consent of Cleary Gottlieb Steen & Hamilton LLP (included in Exhibit 5.1) | |
| 23.2 | Consent of Independent Registered Public Accounting Firm | |
| 24.1 | Powers of Attorney (included on signature page) | |
II-12