Attached files
| file | filename |
|---|---|
| 8-K - 8-K - MARKWEST ENERGY PARTNERS L P | a10-17874_18k.htm |
Exhibit 99.1
|
|
Barclays Capital CEO Energy-Power Conference September 15, 2010 |
|
|
Forward-Looking Statements This presentation contains forward-looking statements and information. These forward-looking statements, which in many instances can be identified by words like “could,” “may,” “will,” “should,” “expects,” “plans,” “project,” “anticipates,” “believes,” “planned,” “proposed,” “potential,” and other comparable words, regarding future or contemplated results, performance, transactions, or events, are based on MarkWest Energy Partners, L.P. (“MarkWest” and “Partnership”) current information, expectations and beliefs, concerning future developments and their potential effects on MarkWest. Although we believe that the expectations reflected in the forward-looking statements are reasonable, we can give no assurance that such expectations will prove to be correct, and actual results, performance, distributions, events or transactions could vary significantly from those expressed or implied in such statements and are subject to a number of uncertainties and risks. Among the factors that could cause results, performance, distributions, events or transactions to differ materially from those expressed or implied, are those risks discussed in our Annual Report on Form 10-K for the year ended December 31, 2009 and our Quarterly Report on Form 10-Q for the quarter ended June 30, 2010, as filed with the SEC. You are urged to carefully review and consider the cautionary statements and other disclosures, including those under the heading “Risk Factors,” made in those documents. If any of the uncertainties or risks develop into actual events or occurrences, or if underlying assumptions prove incorrect, it could cause actual results to vary significantly from those expressed in the presentation, and our business, financial condition, or results of operations could be materially adversely affected. Key uncertainties and risks that may directly affect MarkWest’s performance, future growth, results of operations, and financial condition, include, but are not limited to: Fluctuations and volatility of natural gas, NGL products, and oil prices; A reduction in natural gas or refinery off-gas production which we gather, transport, process, and/or fractionate; A reduction in the demand for the products we produce and sell; Financial credit risks / failure of customers to satisfy payment or other obligations under our contracts; Effects of our debt and other financial obligations, access to capital, or our future financial or operational flexibility or liquidity; Construction, procurement, and regulatory risks in our development projects; Hurricanes, fires, and other natural and accidental events impacting our operations, and adequate insurance coverage; Terrorist attacks directed at our facilities or related facilities; Changes in and impacts of laws and regulations affecting our operations and risk management strategy; and Failure to integrate recent or future acquisitions. |
|
|
Non-GAAP Measures Distributable Cash Flow and Adjusted EBITDA are not measures of performance calculated in accordance with GAAP, and should not be considered separately from or as a substitute for net income, income from operations, or cash flow as reflected in our financial statements. The GAAP measure most directly comparable to Distributable Cash Flow and Adjusted EBITDA is net income (loss). In general, we define Distributable Cash Flow as net income (loss) adjusted for (i) depreciation, amortization, accretion, and other non-cash expense; (ii) amortization of deferred financing costs; (iii) non-cash (earnings) loss from unconsolidated affiliates; (iv) distributions from (contributions to) unconsolidated affiliates (net of affiliate growth capital expenditures); (v) non-cash compensation expense; (vi) non-cash derivative activity; (vii) losses (gains) on the disposal of property, plant, and equipment (PP&E) and unconsolidated affiliates; (viii) provision for deferred income taxes; (ix) cash adjustments for non-controlling interest in consolidated subsidiaries; (x) losses (gains) relating to other miscellaneous non-cash amounts affecting net income for the period; and (xi) maintenance capital expenditures. We define Adjusted EBITDA as net income (loss) adjusted for (i) depreciation, amortization, accretion, and other non-cash expense; (ii) interest expense; (iii) amortization of deferred financing costs; (iv) losses (gains) on the disposal of PP&E and unconsolidated affiliates; (v) non-cash derivative activity; (vi) non-cash compensation expense; (vii) provision for income taxes; (viii) adjustments for cash flow from unconsolidated affiliates; (ix) adjustment related to non-wholly owned subsidiaries; and (x) losses (gains) relating to other miscellaneous non-cash amounts affecting net income for the period. Distributable Cash Flow is a financial performance measure used by management as a key component in the determination of cash distributions paid to unitholders. We believe distributable cash flow is an important financial measure for unitholders as an indicator of cash return on investment and to evaluate whether the Partnership is generating sufficient cash flow to support quarterly distributions. In addition, distributable cash flow is commonly used by the investment community because the market value of publicly traded partnerships is based, in part, on distributable cash flow and cash distributions paid to unitholders. Adjusted EBITDA is a financial performance measure used by management, industry analysts, investors, lenders, and rating agencies to assess the financial performance and operating results of the Partnership’s ongoing business operations. Additionally, we believe Adjusted EBITDA provides useful information to investors for trending, analyzing, and benchmarking our operating results from period to period as compared to other companies that may have different financing and capital structures. Please see the Appendix for reconciliations of Distributable Cash Flow and Adjusted EBITDA to net income (loss), respectively. |
|
|
MarkWest Key Investment Considerations Committed to maintaining strong financial profile Debt to book capitalization of 41% Debt to Adjusted EBITDA of 3.6x Adjusted EBITDA to Interest Expense of 3.4x Established relationships with joint venture partners, which provides capital flexibility No incentive distribution rights, which drives a lower cost of capital Distributions have increased by 156% (12.5% CAGR) since IPO 11 acquisitions totaling ~$875 million since IPO Proven ability to expand organizational capabilities 2010 growth capital forecast of $300 million to $350 million Growth projects are well diversified across the asset base and increase percentage of fee-based net operating margin Long-term organic growth opportunities focused on resource plays High-Quality, Diversified Assets Proven Track Record of Growth Strong Financial Profile Leading presence in five core natural gas producing regions of the U.S. Key long-term contracts with high-quality producers to develop the Marcellus Shale, Woodford Shale, Haynesville Shale, and Granite Wash formation Substantial Growth Opportunities |
|
|
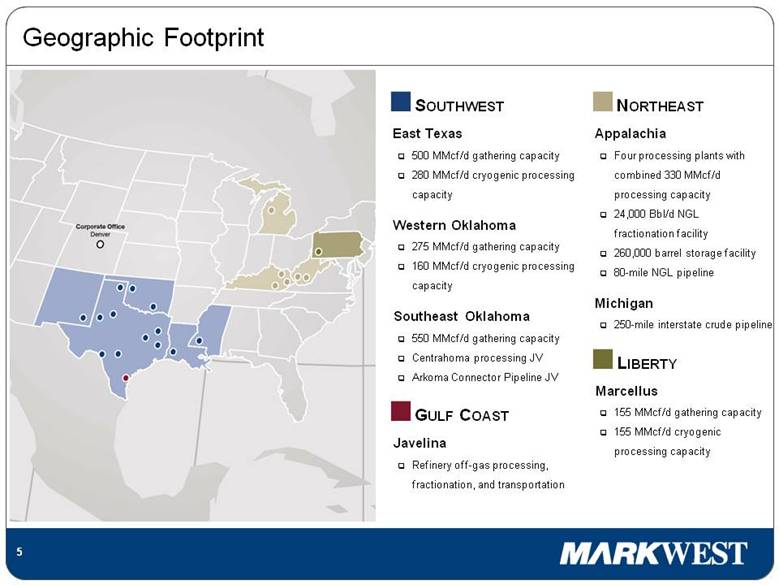
Geographic Footprint NORTHEAST Appalachia Four processing plants with combined 330 MMcf/d processing capacity 24,000 Bbl/d NGL fractionation facility 260,000 barrel storage facility 80-mile NGL pipeline Michigan 250-mile interstate crude pipeline LIBERTY Marcellus 155 MMcf/d gathering capacity 155 MMcf/d cryogenic processing capacity SOUTHWEST East Texas 500 MMcf/d gathering capacity 280 MMcf/d cryogenic processing capacity Western Oklahoma 275 MMcf/d gathering capacity 160 MMcf/d cryogenic processing capacity Southeast Oklahoma 550 MMcf/d gathering capacity Centrahoma processing JV Arkoma Connector Pipeline JV GULF COAST Javelina Refinery off-gas processing, fractionation, and transportation |
|
|
Growth Driven by Customer Satisfaction R A N G E RESOURCES Since 2006, MarkWest has Ranked # 1 or #2 in Natural Gas Midstream Services Customer Satisfaction EnergyPoint Research, Inc. Customer Satisfaction Survey |
|
|
MarkWest’s Commitment to Major Unconventional Resource Plays Map Source: RBC Capital Markets/RBC Richardson Barr U.S. Gas Resource Plays MarkWest’s Role in Emerging Resource Plays MarkWest is the largest gatherer in the Woodford with a system that covers more than 750 square miles of the core Woodford shale. MarkWest’s East Texas system covers more than 1,200 square miles of the Haynesville shale. MarkWest expanded its western Oklahoma system to gather significant new Granite Wash production in the Texas Panhandle. MarkWest Liberty is the largest gatherer and processor in the rich-gas area of the Marcellus Shale. Barnett Haynesville Fayetteville Woodford (Arkoma) Eagle Ford Granite Wash Marcellus/Huron Acquisitions Develop Emerging Resource Plays Build Base Production * Includes growth capital that has been funded or is expected to be funded through joint ventures and divestiture activities. 2004 2005 2006 2007 2008 2009 2010F Total Growth Capital Investment* 0 100 200 300 400 500 600 |
|
|
Diverse Volume Growth Major Resource Plays Tight Sand Production 1,600 1,400 1,200 1,000 800 600 400 200 0 2006 2007 2008 2009 2010F MMcf/d |
|
|
Long-term Appalachian History MarkWest is the largest gas processor and fractionator in the Appalachian Basin We created a franchise position with vertical integration of processing, fractionation, storage, and marketing Total gas processing capacity of approximately 330 MMcf/d in the Appalachian Basin NGLs from four Appalachian processing gas plants are shipped to Siloam for fractionation, storage, and marketing Existing propane and heavier fractionation capacity of 24,000 Bbl/d Existing storage capacity of approximately 260,000 barrels Long before the Marcellus was identified as an important new emerging shale play, we understood the importance of gas processing and NGL fractionation in the hydrocarbon-rich areas of Southwest PA |
|
|
Majorsville MarkWest Liberty Overview Joint Venture with The Energy & Minerals Group Partners one of the best midstream companies with a strong financial partner that shares a common view towards the value of the Marcellus Competitive advantages Significant first mover advantage in the prolific Marcellus Shale with key producer acreage dedications of up to 300,000 rich-gas acres Critical gathering, processing, transportation, fractionation, and storage infrastructure System and plants are new; highly fuel efficient with minimal losses Extensive NGL marketing experience in the Northeast Market Access Interconnected to Columbia Gas Transmission (CGT) and TEPPCO Products Pipeline Low-pressure Gas Gathering system 155 MMcf/d gathering capacity More than 80 miles of pipe and 25,000 hp of compression Gas processing capacity 155 MMcf/d cryogenic processing capacity 625 MMcf/d of cryogenic processing capacity by the end of 2011 NGL fractionation capacity 60,000 barrel per day fractionator will be online in mid 2011 Once complete, MarkWest Liberty will operate the largest NGL fractionation and logistics complex in the Northeastern United States TEPPCO PRODUCTS PIPELINE MARKWEST GAS GATHERING PIPELINE MARKWEST NGL PIPELINE MARKWEST PROCESSING PLANT |
|
|
DRY GAS DRY GAS RICH GAS RICH GAS Liberty Marcellus Project Schedule Ohio West Virginia Pennsylvania Ohio MarkWest Liberty is developing integrated and scalable gathering, processing, fractionation, and marketing infrastructure to support production in excess of 1 Bcf/d TEPPCO PRODUCTS PIPELINE |
|
|
Houston Plant Site – June 2008 |
|
|
Houston Plant Site – September 2008 |
|
|
Houston Plant Site – September 2009 |
|
|
Majorsville Plant Site – August 2010 |
|
|
Vertical Integration is Essential |
|
|
NGL Marketing in the Marcellus The Northeast provides premium markets for NGLs produced in the Marcellus; however, Must be able to produce purity products Must have marketing options including truck, rail, and pipeline options Storage is critical MarkWest Liberty can provide producers with all of these marketing services MarkWest has successfully marketed NGLs in Appalachia for more than 20 years |
|
|
Strong Market for Marcellus NGLs in the Northeast |
|
|
Marcellus Ethane MarkWest conducted a detailed analysis of the U.S. ethane markets in order to identify the best possible market for Marcellus Shale ethane A critical component of the analysis included in-depth discussions with key Marcellus ethane producers and large ethane consumers Louisiana was identified as the optimum market for significant new volumes of Marcellus Shale ethane Based on our discussions with Gulf Coast ethane consumers, the demand for ethane in Louisiana is between 60,000 Bbl/d and 120,000 Bbl/d MarkWest led the development of the Mariner Project, a joint effort with Sunoco Logistics (SXL), to deliver purity ethane to Louisiana markets The Mariner Project will support up to 2 BCF / day of rich-gas production by mid-2012 and can be expanded to support additional Marcellus production Key Marcellus producers, including Range Resources and Chesapeake, have agreed to support the Mariner Project as firm shippers We are negotiating with large ethane consumers in Louisiana regarding purchase price and contract structure for Marcellus ethane A purity-ethane project to the Gulf Coast will maximize producer economics |
|
|
The Mariner Project Sunoco 8” Pipeline New MarkWest Liberty Houston to Delmont Pipeline Sunoco Philadelphia Storage and Docks MarkWest Liberty will construct a 45-mile liquid ethane pipeline Sunoco Logistics will convert its existing 250-mile, 8-inch refined products pipeline to liquid ethane service The pipeline will have capacity of approximately 50,000 bbl/day Sunoco Logistics will construct refrigerated ethane store facilities and load it onto refrigerated LPG carriers LPG carriers will transport the ethane to Gulf Coast markets Indicative tariff estimated at 75%-80% of pipeline projects The Mariner Project will be operational in early 2012 and can be cost effectively scaled |
|
|
Capital Structure ($ in millions) As of December 31, 2009 As of June 30, 2010 Cash $ 97.8 $ 134.9 Credit Facility 59.3 51.5 6-7/8% Senior Notes due 2014 216.9 217.6 6-7/8% Senior Notes due 2014 120.7 121.6 8-1/2% Senior Notes due 2016 274.2 274.3 8-3/4% Senior Notes due 2018 498.9 499.0 Total Debt $ 1,170.0 $ 1,164.0 Total Equity $ 1,379.4 $ 1,649.2 Total Capitalization $ 2,549.4 $ 2,813.2 LTM Adjusted EBITDA (1) $ 279.2 $ 298.6 Total Debt / Capitalization 46% 41% Total Debt / LTM Adjusted EBITDA (2) 4.1x 3.6x Adjusted EBITDA / Interest Expense (2) 3.2x 3.4x Adjusted EBITDA is calculated in accordance with Credit Facility covenants; See Appendix for reconciliation of Adjusted EBITDA to net income (loss). Leverage ratio and interest coverage ratio are calculated in accordance with Credit Facility covenants. (1) (2) |
|
|
2010 Growth Capital Forecast 2010 growth capital forecast in a range of $300 million to $350 million Southwest Amine plant Haynesville gathering lines Compressor / pipeline additions New well connects Other expansion Liberty Rich gas gathering system Houston III processing plant Majorsville I processing plant Fractionation facility NGL Pipeline Railyard / truck loading facility |
|
|
Risk Management Program Six months ended June 30, 2010 Net Operating Margin by Contract Type Six months ended June 30, 2010 Net Operating Margin including Hedges 2010 – 2013 Combined Hedge Percentage NOTE: For the six months ended June 30, 2010. Net Operating Margin is calculated as revenue less purchased product costs. |
|
|
Capital Markets and Liquidity Update As of early August 2010, MarkWest had ~$670 million of available liquidity to fund growth capital In April 2010, MarkWest completed a common unit equity offering 4.9 million common units were issued for net proceeds of approximately $142 million In July 2010, the Partnership executed a $705 million senior secured revolving credit facility that matures in July 2015 The new credit facility provides additional financial flexibility, lowers the Partnership’s borrowing costs, and maintains key financial covenants substantially unchanged from the previous credit facility Moody’s and S&P upgraded MarkWest’s credit ratings to Ba3 and BB- and Fitch initiated coverage on MarkWest with a BB rating The primary drivers behind the ratings actions include MarkWest’s successful track record in executing its growth strategy, improved liquidity and strengthened balance sheet, increased fee-based operating margin, and commitment to issuing equity |
|
|
Keys to Success Maintain stronghold in key resource plays with high-quality assets Execute growth projects that are well diversified across the asset base Provide best-of-class midstream services for our producer customers Preserve strong financial profile Deliver sustainable distribution growth EXECUTE, EXECUTE, EXECUTE |
|
|
Appendix |
|
|
($ in millions) Year ended December 31, 2009 Three months ended June 30, 2010 Net (loss) income $ (113.4) $ 93.0 Depreciation, amortization, impairment, and other non-cash operating expenses 144.4 78.9 Non-cash earnings from unconsolidated affiliates (3.5) (1.5) Contributions to unconsolidated affiliates, net of growth capital (0.4) 1.2 Gain on sale of unconsolidated affiliate (6.8) — Non-cash derivative activity 223.6 (65.4) Non-cash compensation expense 3.9 5.0 Provision for income tax – deferred (50.1) 13.7 Cash adjustment for non-controlling interest of consolidated subsidiaries (8.1) (11.0) Other 10.3 6.7 Maintenance capital expenditures (7.5) (3.3) Distributable cash flow (DCF) $ 192.4 $ 117.3 Total distributions paid $ 159.8 $ 91.4 Distribution coverage ratio (DCF / Total distributions paid) 1.20x 1.28x DCF and Distribution Coverage |
|
|
($ in millions) Year ended December 31, 2009 LTM ended June 30, 2010 Net income (loss) $ (113.4) $ 78.5 Non-cash compensation expense 3.9 6.3 Non-cash derivative activity 222.8 3.3 Interest expense 1 94.6 100.6 Depreciation, amortization, accretion, impairments, and other non-cash operating expenses 144.4 151.6 Provision for income tax (42.0) 7.1 Gain on sale of unconsolidated affiliate (6.8) — Adjustment for cash flow from unconsolidated affiliates (1.7) (8.7) Adjustment related to non-wholly owned subsidiaries (22.6) (39.7) Other — (0.4) Adjusted EBITDA $ 279.2 $ 298.6 Reconciliation of Adjusted EBITDA (1) Includes derivative activity related to interest expense and reclassification of interest expense related to the SMR. |
|
|
1515 Arapahoe Street Tower 2, Suite 700 Denver, Colorado 80202 Phone: 303-925-9200 Investor Relations: 866-858-0482 Email: investorrelations@markwest.com Website: www.markwest.com |