Attached files
Table of Contents
UNITED STATES
SECURITIES AND EXCHANGE COMMISSION
Washington, D.C. 20549
FORM 10-K
| x | ANNUAL REPORT PURSUANT TO SECTION 13 OR 15(d) OF THE SECURITIES EXCHANGE ACT OF 1934 |
For the Fiscal Year Ended: June 30, 2010
OR
| ¨ | TRANSITION REPORT PURSUANT TO SECTION 13 OR 15(d) OF THE SECURITIES EXCHANGE ACT OF 1934 |
For the transition period from to .
Commission File Number: 001-34388
KENSEY NASH CORPORATION
(Exact name of registrant as specified in its charter)
| Delaware | 36-3316412 | |
| (State or other jurisdiction of incorporation or organization) |
(IRS Employer Identification No.) |
735 Pennsylvania Drive, Exton, Pennsylvania 19341
(Address of principal executive offices and zip code)
Registrant’s telephone number, including area code: (484) 713-2100
Securities registered pursuant to Section 12(b) of the Act:
| Title of each class |
Name of exchange on which registered | |
| Common Stock, par value $.001 per share | NASDAQ Global Select Market | |
| Series A Junior Participating Preferred Stock Purchase Right | NASDAQ Global Select Market |
Securities registered pursuant to Section 12(g) of the Act: None
Indicate by check mark if the registrant is a well-known seasoned issuer, as defined in Rule 405 of the Securities Act. Yes ¨ No x
Indicate by check mark if the registrant is not required to file reports pursuant to Section 13 or Section 15(d) of the Act. Yes ¨ No x
Indicate by check mark whether the registrant (1) has filed all reports required to be filed by Section 13 or 15(d) of the Securities Exchange Act of 1934 during the preceding 12 months (or for such shorter period that the registrant was required to file such reports), and (2) has been subject to such filing requirements for the past 90 days. Yes x No ¨
Indicate by check mark whether the registrant has submitted electronically and posted on its corporate website, if any, every Interactive Data File required to be submitted and posted pursuant to Rule 405 of Regulation S-T (§232.405 of this chapter) during the preceding 12 months (or for such shorter period that the registrant was required to submit and post such files). Yes ¨ No ¨
Indicate by check mark if disclosure of delinquent filers pursuant to Item 405 of Regulation S-K is not contained herein, and will not be contained, to the best of registrant’s knowledge, in definitive proxy or information statements incorporated by reference in Part III of this Form 10-K or any amendment to this Form 10-K. ¨
Indicate by check mark whether the registrant is a large accelerated filer, an accelerated filer, a non-accelerated filer, or a smaller reporting company. See definitions of “large accelerated filer,” “accelerated filer” and “smaller reporting company” in Rule 12b-2 of the Exchange Act. (Check one):
| Large accelerated filer | ¨ | Accelerated filer | x | |||
| Non-accelerated filer | ¨ | Smaller reporting company | ¨ | |||
Indicate by check mark whether the registrant is a shell company (as defined in Rule 12b-2 of the Exchange Act). Yes ¨ No x
The aggregate market value of the registrant’s Common Stock held by non-affiliates of the registrant as of December 31, 2009 (the last business day of the registrant’s most recently completed second fiscal quarter) was $187,167,374, based on the closing price per share of Common Stock of $25.50 as of such date reported by the NASDAQ Global Select Market. Shares of the registrant’s Common Stock held by each executive officer and director and by each person who owns 10% or more of the outstanding Common Stock have been excluded in that such persons may be deemed to be affiliates. This determination of affiliate status is not necessarily a conclusive determination for other purposes.
The number of shares outstanding of the registrant’s Common Stock, par value $.001 per share, as of August 31, 2010 was 8,899,448.
Table of Contents
DOCUMENTS INCORPORATED BY REFERENCE
Portions of registrant’s definitive Proxy Statement, to be filed pursuant to Regulation 14A under the Securities Exchange Act of 1934, in connection with the registrant’s 2010 Annual Meeting of Stockholders scheduled to be held on December 1, 2010, are incorporated by reference into Part III of this report.
| Page | ||||
| Item 1. | 2 | |||
| Item 1A. | 16 | |||
| Item 1B. | 26 | |||
| Item 2. | 26 | |||
| Item 3. | 26 | |||
| Item 5. | 27 | |||
| Item 6. | 30 | |||
| Item 7. | Management’s Discussion and Analysis of Financial Condition and Results of Operations |
31 | ||
| Item 7A. | 46 | |||
| Item 8. | 48 | |||
| Item 9. | Changes in and Disagreements with Accountants on Accounting and Financial Disclosure |
79 | ||
| Item 9A. | 79 | |||
| Item 9B. | 82 | |||
| Item 10. | 83 | |||
| Item 11. | 83 | |||
| Item 12. | 83 | |||
| Item 13. | Certain Relationships and Related Transactions and Director Independence |
83 | ||
| Item 14. | 83 | |||
| Item 15. | 84 | |||
| 87 |
Table of Contents
CAUTIONARY NOTE REGARDING FORWARD LOOKING STATEMENTS
This report contains forward looking statements within the meaning of Section 21E of the Securities Exchange Act of 1934. We have based these forward looking statements largely on our current expectations and projections about future events and trends affecting our business. In this report, the words “believe,” “may,” “will,” “estimate,” “continue,” “anticipate,” “intend,” “forecast,” “expect,” “plan,” “should,” “is likely” and similar expressions, as they relate to Kensey Nash, our business or our management, are intended to identify forward looking statements, but they are not exclusive means of identifying them.
The forward looking statements in this report are only predictions and actual events or results may differ materially. In evaluating such statements, a number of risks, uncertainties and other factors could cause our actual results, performance, financial condition, cash flows, prospects and opportunities to differ materially from those expressed in, or implied by, the forward-looking statements. These risks, uncertainties and other factors include, among other things:
| • | general economic and business conditions, both nationally and in our markets; |
| • | the impact of competition; |
| • | anticipated trends in our business; |
| • | existing and future regulations affecting our business; |
| • | strategic alliance and acquisition opportunities; and |
| • | other risk factors set forth under “Item 1A. Risk Factors” below. |
Except as expressly required by the federal securities laws, we undertake no obligation to publicly update or revise any forward looking statements, whether as a result of new information or future events or otherwise after the date of this report. Our results of operations in any past period should not be considered indicative of the results to be expected for future periods. Fluctuations in operating results may also result in fluctuations in the trading price of our Common Stock.
References in this Form 10-K to “we,” “us,” “our” and “our company” refer to Kensey Nash Corporation and our subsidiaries.
1
Table of Contents
| ITEM 1. | BUSINESS |
OVERVIEW
Kensey Nash Corporation, incorporated in Delaware in 1984, is a medical device company primarily focused in the field of regenerative medicine, which is the application of devices, materials and other therapies to help repair damaged or diseased tissues. We are recognized as a leader for innovative product development, as well as for our broad portfolio of resorbable biomaterials products. We have an extensive range of products, which are sold through strategic partners in multiple large medical markets, including cardiology, orthopaedic, sports medicine, spinal and general surgery. We also have an ongoing development and manufacturing program for products in the endovascular market.
During the past 25 years, we have established ourselves as a leader in designing, developing, manufacturing and processing proprietary medical devices, which include resorbable biomaterials products such as synthetic polymers and collagen. We have expanded our base of technology, which has enabled us to develop multiple resorbable product platforms that can be used in a wide variety of applications. We have developed extensive expertise in tissue regeneration and tissue repair, and the ability to commercialize and produce products with these capabilities. In our fiscal year ended June 30, 2010 (fiscal 2010), we manufactured and sold over 4.5 million resorbable product units representing approximately 230 commercialized products, to strategic partners and customers, many of which are leaders in their market segments. We continue to broaden our proprietary biomaterials technologies, and our development and manufacturing capabilities.
In fiscal 2010, sales to and royalties from our three largest customers, St. Jude Medical, Inc. (St. Jude Medical), Arthrex, Inc. (Arthrex) and Orthovita, Inc. (Orthovita) represented approximately 85% of our total revenues. Our other key customers include Johnson & Johnson, Inc. and its subsidiaries (Johnson & Johnson), Medtronic, Inc. (Medtronic), Stryker, Inc. (Stryker), Synthes, Inc. (Synthes) and Zimmer, Inc. (Zimmer).
We are known as a pioneer in the field of arterial puncture closure, as the inventor and original developer of the Angio-Seal™ Vascular Closure Device (Angio-Seal), which is exclusively licensed to St. Jude Medical. Today, the Angio-Seal device (which is manufactured, marketed and sold by St. Jude Medical) is the leading arterial puncture closure product in the world with over 15 million Angio-Seal units having been sold since its market introduction approximately 14 years ago. We have manufactured key resorbable components for the Angio-Seal device and receive an approximate 6% royalty on Angio-Seal end-user sales. The resorbable biomaterial component sales are pursuant to a supply agreement which expires on December 31, 2010. In June 2010, we entered into a new two-year supply agreement for the period from January 1, 2011 to December 31, 2012 (the new supply agreement). The new supply agreement substantially reduces the quantities which St. Jude Medical is required to purchase from us. As a result, if St. Jude Medical purchases only the minimum levels required under this new supply agreement, our corresponding product sales will be substantially lower than our historical annual sales to St. Jude Medical. Royalties under our license agreement with St. Jude Medical for the Angio-Seal device are not affected by this new supply agreement. See “St. Jude Medical Customer Relationship” for additional information.
We are building on our pipeline of new proprietary products in the soft tissue and cartilage repair markets. Our expansion into the soft tissue repair market has been largely facilitated by our proprietary Optrix™ process which allows us to manufacture extracellular matrix (ECM) products. Our first ECM product, Medeor™ Matrix, made from porcine dermis (pigs skin), received 510(k) clearance from the U.S. Food and Drug Administration (FDA) in October 2009 and CE Mark approval in April 2010. In May 2010, our second ECM product, the Meso BioMatrix™ product, which is made from porcine-mesothelium (Meso) tissue (derived from the abdominal wall of a pig), received 510(k) clearance from the FDA.
In our fiscal 2010, we announced two strategic porcine dermis ECM agreements, one with Synthes, and the other with Arthrex. Synthes launched the XCM Biologic™ Tissue Matrix, the first commercial Medeor™ Matrix
2
Table of Contents
product, initially focused on ventral hernia repair and breast reconstruction, in the U.S., in May 2010. European launch is expected in the second quarter of our fiscal year ended June 30, 2011 (fiscal 2011). Arthrex is expected to launch our rotator cuff repair Medeor™ Matrix product later in the second quarter of fiscal 2011. We are currently evaluating partnering opportunities for the Meso BioMatrix™ products, as well as other fields of use for the Medeor™ Matrix products.
The other key product in our development pipeline is the cartilage repair device, which consists of a proprietary bi-phasic, resorbable biomaterials implant designed to repair focal (primary) defects of articular cartilage in joints. The device received CE Mark approval in February 2010. We have engaged in discussions with potential European distributors and we believe that European commercialization could begin as early as the second quarter of fiscal 2011. We recently received FDA approval to initiate our U.S. pilot trial for the cartilage repair device and expect trial enrollment to begin in the first half of our fiscal 2011. Commercialization of our cartilage repair device in the U.S. is at least several years away.
OUR BIOMATERIALS BUSINESS
Overview
Biomaterials can be generally defined as materials that treat, augment, or replace tissue, organs or body functions. We have specialized in resorbable biomaterials, meaning biomaterials that are absorbed over time and allow the body’s natural tissue to take their place. In the late 1980s and early 1990s, we became an innovator in expanding the use of biomaterials to other types of medical applications with our development of the Angio-Seal device, a vascular closure system that incorporates resorbable materials as the primary basis for the product. Our experience in developing the necessary materials for the biomaterial components and the scale-up of manufacturing capabilities for this product are the foundation of our biomaterials business.
Medical device companies, focusing on a wide variety of market segments, are now taking advantage of advances in materials technology and a better understanding of the biological processes involved in tissue formation and healing to introduce resorbable biomaterials-based products. This trend has been observed in many medical markets, including cardiology, orthopaedic, general, urological, cosmetic and dental segments. Companies and physicians are widely seeking new solutions to long-standing clinical problems. Resorbable biomaterials-based products have shown to be attractive solutions in these markets for a number of reasons. For example they:
| • | Allow for the regeneration and remodeling of natural tissue as the resorbable biomaterial implant resorbs over time; |
| • | Offer the ability to modify the rate of absorption of products to promote healing as the biomaterials-based products work with and assist the body’s natural healing response; |
| • | Obviate the need for second surgeries, where traditionally needed, to remove non-resorbable implants; |
| • | Improve the ability for physicians to image healing progress in patients with biomaterial implants compared to metallic implants, which is critical to the ability to visualize and assess healing; and |
| • | Provide the potential for staged and sustained release of biologically active agents, including drugs, cells and growth factors and biologics specific for each clinical situation. |
Our Biomaterials Business Strategy
We intend to utilize our experience and expertise in biomaterials to continue to expand our business. Our strategy to accomplish this expansion is as follows:
| • | Develop New Proprietary Biomaterials Products. We continue to leverage our technology and expertise in materials and processes to develop new proprietary biomaterials products. By working with strategic partners or directly with surgeon clinicians, we can identify desirable attributes of new |
3
Table of Contents
| resorbable biomaterials products and advance them toward commercialization. We will continue to invest in research and development to enable us to innovate and expand our range of biomaterials products. |
| • | Expand Our Biomaterials Customer Base. We intend to broaden the product lines sold to our current customer base, and to expand our number of customers by providing proprietary and technologically superior biomaterials products that improve patient outcomes and reduce the cost of healthcare. We also intend to continue to invest in new manufacturing technology and processes to meet our customers’ requirements, support product development, and expand our marketing efforts to increase the demand for our biomaterials products. |
| • | Pursue Strategic Acquisitions and Alliances. We continually seek strategic acquisitions and alliances that add new and complementary technologies and expertise, broaden our intellectual property portfolio and strengthen our competitive position in our biomaterials business. We believe that our expertise in biomaterials allows us to identify and attract these opportunities. |
Our Biomaterials Technology
The technological challenges involved in developing biomaterials-based products can be substantial. As a result of our work with these types of materials and processes for approximately 25 years, we have built significant know-how and technology in the field.
| • | Materials Technology. Many of the products we have developed incorporate our highly proprietary bovine (cow) based collagen technology, which has an extensive safety profile and tailorable properties that make it uniquely suitable for multiple medical device applications. Our collagen can be fabricated in many forms, including powders, gels, pastes, sponges and other structural matrices. We often combine collagen with other materials, such as ceramics and other biomaterials to further create new properties and characteristics. Our ability to utilize multiple process variables, such as fiber structure, cross-linking (a process for strengthening the collagen material) and chemistry, further increases the number of product configurations and properties that we can offer. |
We have more recently developed expertise in the processing of porcine (pig) based natural tissue matrices which are used in the development and manufacture of our ECM products. By selecting various tissues from a pig and processing them in a proprietary manner, we are able to produce a unique biomaterial, which may help the body’s ability to repair damaged or diseased tissues.
We also have extensive experience with processing a wide range of bioresorbable synthetic polymers, including polylactic acid (PLA), polyglycolic acid (PGA), poly-lactic-co-glycolic acid (PLGA) and many others. We have strong expertise in controlling architecture and processing variations of such polymers, which allows us to create new materials with unique properties and composites from those original materials.
| • | Processing Technology. Our Porous Tissue Matrix (PTMTM) processing technology allows us to create porous implants from synthetic polymers that support cell growth and tissue regeneration and the potential to deliver biologics, growth factors and drugs. The PTM technology allows us to create customized porous architectures and, in some applications, combine different materials in a way that optimizes the tissue engineering. The resulting implants can be designed to facilitate wound healing in both bone and soft tissue that resorb at controlled rates for specific functions and tissues. We have a series of products and development programs underway, including our cartilage repair device, utilizing intellectual property related to our porous biodegradable regeneration matrices. |
Our expansion into the soft tissue repair market has been largely facilitated by our proprietary Optrix™ process which allows us to manufacture ECM products. The Optrix™ process gently disinfects tissues, inactivates viruses and removes cells while preserving extracellular matrix components. Our ability to apply this technology to multiple tissue sources enables us to create customized soft tissue regeneration
4
Table of Contents
products (e.g., biologic surgical scaffolds) for a variety of clinical applications. This process allows us to convert a wide variety of mammalian tissues into biological surgical scaffolds.
| • | Delivery Technology. Our biomaterials technology has potential for use in the controlled release of biologically active agents, including drugs, cells and growth factors. In these applications, the agent could be deposited or incorporated into a biomaterials delivery matrix. As the matrix dissolves or is degraded by the body, the agent is gradually released. The use of a biomaterials matrix for the controlled release of these biologically active agents permits a locally targeted, optimal release profile, improving the delivery of the agents. |
| • | Manufacturing/Scale-up Know-How. Resorbable biomaterials-based products tend to be particularly challenging to consistently manufacture on a large scale. There are variations in materials and material properties that must be continually controlled and monitored. We have core competencies in anticipating such variabilities and controlling them during our manufacturing processes. |
We believe the diversity of the applications, technology and materials, as well as the scale of commercialization, that we have built, and continue to build, within our Company all contribute to a sustainable competitive advantage in the biomaterials-based products markets in which we compete.
Biomaterials Product Lines and Product Applications
We have consistently focused on commercializing a broad array of products used in the orthopaedic markets, including the sports medicine and spinal markets, and supporting the Angio-Seal product line in the vascular closure market. Recently, we have also commercialized our ECM products in the general surgery market. In addition, to a lesser extent, we have commercialized biomaterials products for other market applications, such as diagnostic oncology and dentistry. While to date we have concentrated significant efforts on orthopaedic-related products and Angio-Seal components, we believe that there are also significant opportunities for our technologies in other markets.
Orthopaedic Market Products. We have commercialized a wide variety of products for the orthopaedic applications of biomaterials. Applications in the orthopaedic market for our biomaterials products include soft tissue and bone fixation, bone void fillers and scaffolds. In the future, we believe there will be application for our technologies in the regeneration of tendons, ligaments and cartilage, as well as other novel uses of materials in spinal orthopaedic procedures such as intervertebral disc repair.
| • | Soft Tissue and Bone Fixation. Many of our biomaterials products are designed to replace metallic devices used in the fixation and repair of musculoskeletal tissues. Among other advantages, use of resorbable biomaterials eliminates the need for a second surgery, which is frequently necessary to remove non-resorbable metallic implants, such as bone screws, plates and pins. The primary application for our biomaterials in the sports medicine arena is soft tissue fixation. Soft tissue fixation includes the repair of tendons and ligaments in the knee, such as the anterior cruciate ligament; in the shoulder, such as the rotator cuff; and in the extremities. We manufacture products such as suture anchors, interference screws and reinforcement materials for all of these applications from resorbable synthetic polymers and synthetic polymer/ceramic composites. We also manufacture pins, plates and screws of various designs for repair of the small bones of the extremities, for certain applications in the spine, and for other orthopaedic trauma applications. Key customers of these products include Arthrex and Stryker. |
| • | Bone Void Fillers and Scaffolds. Synthetic bone void fillers are increasingly being used as alternatives to autograft (bone harvested from another area of the patient’s body) or allograft (bone harvested from cadavers). We have developed or co-developed several different bone void fillers, essentially synthetic bone graft substitutes, for use in various clinical applications. We have fabricated these products from collagen, collagen/ceramic composites, synthetic polymers and synthetic/ceramic composite biomaterials. Key customers of these products include Orthovita, Medtronic, Zimmer and Johnson & Johnson. |
5
Table of Contents
Cardiovascular Market Products. We have developed the original Angio-Seal device, a vascular closure device, and manufactured two of the key resorbable components of the Angio-Seal device for St. Jude Medical. The collagen plug and the polymer anchor components form the basis for the resorbable implant that acts to seal a hole in the artery, created during a catheterization procedure, and are critical to the functionality of the Angio-Seal device. See “St. Jude Medical Customer Relationship” below for additional information. We also manufacture other products within the cardiovascular market, none of which materially contribute to our revenue at this time.
General Surgery Market Products. We have recently commercialized with our partner, Synthes, our first ECM product, a porcine dermis surgical mesh used for abdominal wall reconstruction, breast reconstruction and select head and neck plastic surgery repair. See “Biomaterials Research and Development Programs- Extracellular Matrices” below for an expanded discussion of our ECM development activities. In addition, we manufacture resorbable carriers for breast biopsy markers for the Ethicon Endo-Surgery Breast Care unit, a former unit of Johnson & Johnson, which was recently acquired by Devicor Medical Products, Inc.
Other Biomaterials Market Applications. While not yet a large part of our business, we develop, manufacture and sell a variety of biomaterials-based products designed for other market applications. These products include dental barrier membranes and resorbable materials used in ophthalmology and oncology applications.
Biomaterials Customer Relationships
We sell our biomaterials products to over 30 companies that ultimately sell them into the end-user marketplace. Our largest biomaterials customers include St. Jude Medical, to which we supply Angio-Seal components; Arthrex, to which we supply a broad range of sports medicine and trauma products; and Orthovita, to which we supply products for use in repair of spinal and orthopaedic trauma injuries. We also supply biomaterials products and development expertise to other orthopaedic companies including, BioMimetic Therapeutics, Johnson & Johnson, Medtronic, Stryker, Synthes and Zimmer. In August 2009, we entered into a strategic agreement with Synthes to market and distribute our porcine dermis-based ECM products for select reconstructive surgical applications. In June 2010, we announced a second strategic distribution agreement for our ECM products with Arthrex for rotator cuff and other tendon repair procedures. We continue to seek to expand relationships with companies, targeting new markets, including general, pelvic and urological surgery.
Our customer relationships are generally long-term and contractual in nature, with contracts specifying various terms which govern the relationship including, for example, product development, regulatory responsibilities and pricing. We often work with customers and potential customers at very early stages of feasibility and provide significant input in co-development types of programs. Once a product is approved for sale, we generally provide our customers fully packaged and sterilized products ready for sale or their further distribution or, in the case with Angio-Seal components, provide a resorbable biomaterials product that is ready to be incorporated into a finished device. Our products often represent a key strategic source for these customers and partners. In many cases, our proprietary technology is incorporated in the product and cannot be replicated by other companies.
St. Jude Medical Customer Relationship
Our largest customer during our fiscal 2010 was, and for several years has been, St. Jude Medical, to which we supply Angio-Seal device components. During fiscal 2010, 35% of our net sales and 49% of our total revenues, including royalty income, were derived from our relationship with St. Jude Medical.
Angio-Seal Vascular Closure Device Overview
We pioneered the concept of vascular closure, as the inventor and original developer of the Angio-Seal device marketed by St. Jude Medical. The Angio-Seal device is a biomaterials-based product which acts to close and seal femoral artery punctures made during diagnostic and therapeutic cardiovascular catheterizations. The device utilizes resorbable components to form a sandwich closure concept at the
6
Table of Contents
arterial puncture site to provide hemostasis (stoppage of bleeding) and speed the post-procedure recovery process.
The Angio-Seal device has been shown to have several advantages over traditional manual or mechanical compression procedures, including reduced time to hemostasis and ambulation, reduced staffing and hospital time, possible reduction in procedure costs, increased patient comfort, greater flexibility in post-procedure blood thinning therapy and increased blood flow to the leg.
The Angio-Seal device is widely recognized as the leading product in the worldwide vascular puncture closure market (which consists of products developed for the purpose of closing and sealing of femoral artery punctures made during cardiovascular catheterizations). The Angio-Seal device has been sold in Europe since 1995, in the U.S. since 1996 and in Japan since late 2003. There have been over 15 million Angio-Seal devices sold since its commercialization, making it what we believe is one of the most successful resorbable biomaterials-based medical products. The Angio-Seal device generated approximately $335 million in revenue for St. Jude Medical during our fiscal 2010.
Other treatment options include manual pressure and device based therapy. Existing device-based treatment options consist of biomaterial-based devices, suture-based devices, clip-based devices and staple-based devices. There are also many topical patch devices which require adjunct manual pressure, and are used mostly for diagnostic catheterizations. There are alternative methods of diagnosis and treatments, such as non-invasive imaging methods and cardiac catheterization procedures performed from other access sites, such as the radial artery, that may become more prevalent in the future. These non-invasive imaging methods and catheterization procedures through alternative access sites could adversely impact the market use of vascular puncture closure devices designed for femoral artery puncture closure.
St. Jude Medical Angio-Seal License and Component Supply Agreement
The Angio-Seal technology is licensed to St. Jude Medical, which manufactures, markets and sells the Angio-Seal device worldwide. Under our license agreement, St. Jude Medical has exclusive worldwide rights to manufacture, market and distribute the patented Angio-Seal device for hemostatic puncture closure. We retain the rights to use this technology for applications outside the cardiovascular system. We receive an approximate 6% royalty on Angio-Seal end-user sales by St. Jude Medical. The term of the license agreement extends to the expiration of the last claim of any of the licensed patents.
St. Jude Medical may terminate the license agreement at any time, for any reason, upon 12 months notice. However, upon termination, all rights granted under the license, including sales, marketing, manufacturing and distribution rights would revert back to our Company. The Angio-Seal trademark is owned and would be retained by St. Jude Medical.
In June 2005, we entered into an Angio-Seal component supply agreement with St. Jude Medical that expires in December 2010. Under this supply agreement, we are the exclusive supplier of the collagen plug component of the Angio-Seal device, as well as a 30% supplier of the anchor component. In June 2010, we entered into a new two-year supply agreement for the period from January 1, 2011 to December 31, 2012. The new supply agreement provides for us to be the exclusive outside supplier of collagen plugs, one of the key resorbable components of the Angio-Seal device. The new supply agreement provides for calendar year 2011 minimum order levels equivalent to approximately 25% of our fiscal year 2010 collagen plug sales and calendar year 2012 minimum order levels equivalent to approximately 20% of our fiscal year 2010 collagen plug sales. The new supply agreement does not call for us to supply any polymer anchors. In fiscal year 2010, collagen plug sales to St. Jude Medical were approximately $17.1 million and polymer anchor sales were approximately $1.9 million. Under the new supply agreement, if St. Jude Medical only purchases the minimum levels of collagen plugs, our related product sales will be substantially lower than under the agreement that expires at the end of calendar year 2010. Royalties under the Angio-Seal license agreement between our Company and St. Jude Medical, which are based on total net end-user sales of the Angio-Seal device, are not affected by this new supply agreement.
7
Table of Contents
Other Customer Relationships
Our second largest customer during fiscal 2010 was Arthrex, a privately held worldwide leader in sports medicine product development and distribution. We provide to Arthrex a large number of soft tissue and bone fixation devices, including anchors, screws and pins, which are often required in sports medicine procedures, such as anterior cruciate ligament repairs and tendon repairs. During fiscal 2010, 29% of our net sales and 20% of our total revenues were derived from our relationship with Arthrex. In June 2010, we announced a strategic distribution agreement for our ECM products with Arthrex for rotator cuff and other tendon repair procedures.
Orthovita has become a major customer during the past six years. Since 2003, we have partnered with them to co-develop and commercialize a series of unique and proprietary bone void filler products used in the spinal market, branded VitossTM Foam and VitossTM Bioactive Foam technology, the first of which was launched in March 2004 and the most recent, VitossTM Bioactive Foam technology, which was launched during the fourth quarter of fiscal 2008. Under our agreement with Orthovita, we manufacture the products and they market and sell the products worldwide. Multiple versions of these co-developed products have been launched since March 2004. During fiscal 2010, 15% of our net sales and 17% of our total revenues, including royalty income, were derived from our relationship with Orthovita.
BioMimetic Therapeutics, Johnson & Johnson, Medtronic, Stryker, Synthes, and Zimmer are other partners/customers of ours that have launched, or are in various stages of developing, their respective product lines that incorporate our product and technologies. See “Biomaterials Research and Development Programs” below.
Business development activities for our biomaterials business are primarily conducted by our senior management team. Technology and product evaluations and the related business agreements can take long periods of time to complete. Our marketing efforts are focused on the partnering of our technology and expertise to new potential customers, as well as seeking segment leading sales and marketing organizations for those specific products that we have developed.
Biomaterials Research and Development Programs
In addition to our relationships with partners and customers to commercialize near-term biomaterials product concepts, we have also been advancing development programs that are longer term in nature and are based on our proprietary technology in the following areas:
| • | Extracellular Matrices. We have developed a technology platform of porcine-derived extracellular matrix tissues to expand our presence in the soft tissue repair market. Our expansion into the soft tissue repair markets has been largely facilitated by our proprietary Optrix™ process, which allows us to manufacture ECM products. This process allows us to convert a wide variety of mammalian tissues into biological surgical scaffolds. Our first product, Medeor™ Matrix is made from porcine dermis (pigs skin) and received 510(k) clearance from the FDA in November 2009 and CE Mark approval in April 2010. It is indicated for use as a surgical mesh for abdominal wall reconstruction, plastic and reconstructive surgery, urologic and gynecologic surgeries and tendon repair (U.S. only). In May 2010, our second ECM product, the Meso BioMatrix™ product, which is made from porcine-mesothelium (Meso) tissue derived from the abdominal wall of a pig, received 510(k) clearance from the FDA. The clearance allows for the use of Meso BioMatrix™ in general surgery for the reinforcement and repair of soft tissue, including hernia repair, plastic and reconstructive surgery, and urologic, gynecologic and gastroenterological applications. Medeor™ Matrix and Meso BioMatrix™ product are the first soft tissue products developed from our new Optrix™ ECM biologic surgical mesh platform. |
In August 2009, we signed a strategic distribution agreement with Synthes, which represents an important milestone in our plans to build upon our leadership position as a developer of innovative regenerative medicine products. Under the terms of the agreement with Synthes, we will develop and manufacture porcine dermis-based products, which Synthes will market and distribute for abdominal
8
Table of Contents
wall and chest reconstruction and for several applications in head and neck surgery. Synthes launched the XCM Biologic™ Tissue Matrix, the first commercial Medeor™ Matrix product in May 2010, and the European launch is expected in the second quarter of fiscal 2011. In June 2010, we announced a strategic distribution agreement with Arthrex for rotator cuff and other tendon repair procedures.
We are currently evaluating partnering opportunities for the Meso BioMatrix™ products in the urogynecology, wound care, orthopaedic fields of use for the Medeor™ Matrix products. Our ability to apply the Optrix™ tissue processing technology to multiple tissue sources enables us to create customized soft tissue repair products for a variety of clinical applications. We expect these efforts to yield new collaborative partners and products in the rapidly growing biologic surgery market that will provide significant diversification and expansion of our product portfolio.
| • | Articular Cartilage Regeneration Matrix. We are developing a cartilage repair device, which consists of a proprietary bi-phasic, resorbable biomaterials implant designed to repair focal (primary) defects of articular cartilage in joints. The design has a collagen-based cartilage region and a ceramic/polymer subchondral bone region based on our PTM technology. These compartmentalized architectures are designed to allow for the regeneration of both cartilage and bone elements while maintaining their natural interface. We submitted an IDE application to the FDA to study the use of our cartilage repair device for treating articular cartilage defects of the knee. This device received CE mark approval in February 2010. We recently received FDA approval to initiate our U.S. pilot trial for the cartilage repair device and expect trial enrollment to begin in the first half of fiscal 2011. Commercialization of our cartilage repair device in the U.S. is at least several years away. We are engaged in discussions with potential European distributors and we believe that European commercialization could begin as early as the second quarter of fiscal 2011. We expect to initiate a European post market study to collect safety and efficacy data on the cartilage repair device in the first half of fiscal 2011. We are currently working on next generation products that are expected to address larger and more difficult cartilage lesions. |
ENDOVASCULAR BUSINESS
In May 2008, we completed the sale of our Endovascular business to The Spectranetics Corporation (Spectranetics). This transaction included the sale of the ThromCat® (ThromCat), QuickCat™ (QuickCat) and Safe-Cross® (Safe-Cross) product lines in consideration for a $10.0 million cash payment at closing, with an opportunity for up to an additional $8.0 million in research and development milestone payments, a $6.0 million cumulative sales milestone payment and additional royalty payments based on future sales of the ThromCat and Safe-Cross products after the transition of manufacturing of the products from us to Spectranetics. Since the sale of our Endovascular business to Spectranetics, we have earned $2.5 million of the research and development milestone payments. We continue to work with Spectranetics in the development of a next generation endovascular product. Endovascular net sales were 3% of our total revenue in fiscal 2010.
Spectranetics is exclusively responsible for sales and marketing of the endovascular product line. In early fiscal 2010, Spectranetics announced that they had discontinued sales of Safe-Cross products. In addition, effective December 31, 2009, Spectranetics assumed manufacturing responsibility of the QuickCat products. ThromCat manufacturing is expected to be transferred to Spectranetics late in the second half of fiscal 2011, and we expect limited revenues from this product in fiscal 2011. The achievement of the $6.0 million cumulative sales milestone and our receipt of any royalties, as well as the remaining research and development milestone payments, could be negatively affected by the performance of Spectranetics, and has been impacted by its discontinuance of sales of Safe-Cross products. See Note 19 to the Consolidated Financial Statements included in this Form 10-K.
See “Item 1A. Risk Factors – Spectranetics is exclusively responsible for worldwide sales and marketing of the endovascular product line. If any or all of these products fail to gain market acceptance or if Spectranetics fails to successfully commercialize them, our business may suffer.”
9
Table of Contents
OTHER INFORMATION CONCERNING OUR BUSINESSES
Patents and Proprietary Rights
Our intellectual property covers many fields and many areas of technology including vascular puncture closure, blood vessel location detection, arterial revascularization, embolic protection systems, drug/biologics delivery, bone repair/regeneration, wound care, periodontics and angiogenesis products, and various collagen and polymer processes which are used to manufacture these devices, as well as surgical instruments which may be used to implant such devices. We protect our technology by, among other things, filing patent applications for the patentable technologies that we consider material to our business.
We also rely heavily on trade secrets and non-patented proprietary know-how that we seek to protect through non-disclosure agreements with individuals, corporations, institutions and other entities exposed to proprietary information. As a condition of employment, we require that all full-time and part-time employees enter into an invention assignment and non-disclosure agreement. Additionally, non-compete agreements are utilized for certain employees who are exposed to our most sensitive trade secrets.
We intend to continue to aggressively protect new manufacturing processes, biomaterials products and technologies and medical products and devices that we have invented or developed.
Manufacturing
We have developed various unique manufacturing and processing capabilities for resorbable biomaterials. We have our own capabilities in tool-and-die making, injection molding, extrusion, compounding, machining, model making, laser welding and bovine and porcine collagen processing, which allow us to manufacture and engineer our developmental products on site. For our bovine collagen products, we have developed, and continue to expand, a closed-herd (i.e., closely monitored for disease and having no contact with other herds) sourcing infrastructure, which is helpful in allowing our bovine collagen-based products to be sold more broadly worldwide. Closed-herd sourcing of bovine materials provides an additional level of risk management that is recognized by many regulatory entities worldwide as an important means of documenting the safety of the animal-derived materials. Our methods and processes have allowed us to maintain EDQM (European Directorate and Quality of Medicines) certification, which documents the safety of our collagen products. We believe our biomaterials manufacturing capabilities and raw material sourcing infrastructure provide us with a competitive advantage.
We purchase raw materials, parts and peripheral components, which are used in our products. Although many of these supplies are off-the-shelf items readily available from several supply sources, others are custom-made to meet our specifications. We maintain safety stock levels of these custom materials to prevent any product downtime in the case of supply interruption. In addition, we believe that, in most of these cases, alternative sources of supply for custom-made materials are available or could be developed within a reasonable period of time. An exception to this is our raw material sourcing for collagen, which would be extremely time consuming and costly to duplicate.
We have an in-house quality assurance department that sets standards, monitors production, creates and reviews operating procedures and protocols and performs in-process and final testing of sample devices and products manufactured by or for us.
Facility
All of our operations and our corporate headquarters are housed in a single 202,500 square foot facility in Exton, Pennsylvania, which maximizes efficiencies and facilitates our future growth. Our facility is subject to a Secured Commercial Mortgage (Mortgage), secured by the building and land, under which the outstanding principal balance was $31.4 million as of June 30, 2010. See Note 8 to our Consolidated Financial Statements included in this Form 10-K.
10
Table of Contents
This facility has been optimized for our unique businesses and is equipped with state-of-the-art equipment for developing and manufacturing biomaterials-based products. We hold ISO 13485:2003 and CMDCAS certification. Certification is based on adherence to established standards of design, service, quality assurance and manufacturing process control. Our manufacturing facility is subject to regulatory requirements and periodic inspection by regulatory authorities.
Research and Development
Our research and development and regulatory and clinical staff consisted of 82 employees as of August 31, 2010. Our research and development efforts are focused on the continued development of our biomaterial capabilities. We incurred total research and development expenses of $17.9 million, $18.1 million and $17.2 million in fiscal 2010, 2009 and 2008, respectively. See Item 7- “Management’s Discussion and Analysis” below and the Notes to the Financial Statements included in this Form 10-K for further information.
In addition to the resources dedicated to the product development process, we have an internal regulatory affairs and clinical management staff responsible for managing our clinical trials and obtaining regulatory approvals for our products. Our regulatory department also works closely with several of our customers to obtain regulatory approvals for their products in the U.S., the European Union and several other countries.
Sales and Marketing
Our existing business model is to maintain and develop partnerships where partners’ sales and marketing teams sell and distribute our products to the end-user. During fiscal 2007 and most of fiscal 2008, we had a direct sales force responsible for the sales and marketing of our endovascular products in the U.S. and Germany, with distributors covering most of Europe, Russia and India. After the sale of our Endovascular business to Spectranetics in May 2008, all worldwide sales and marketing of these products became their responsibility. At this time, we do not have a sales force and do not anticipate marketing and selling our biomaterials products directly to the end-user market.
Competition
The markets for our current and proposed products are fragmented, intensely competitive, subject to rapid change and sensitive to new product introductions and enhancements. We expect that the competitive environment for our products will become more intense as additional companies enter the markets in which our products compete and as new techniques and technologies are adopted. Our biomaterials and medical devices compete directly and indirectly for customers with a range of products and technologies produced by a wide variety of companies, as well as other processes and procedures that do not require the use of our products or those of our competitors. Many of the competitors in these markets have longer operating histories in these markets, greater name recognition, larger customer bases and greater financial, technical and marketing resources. Generally, we believe that the principal competitive factors for our products include the following:
| • | regulatory approvals; |
| • | safety and effectiveness; |
| • | performance and quality; |
| • | ease of use; |
| • | marketing; |
| • | distribution; |
| • | pricing; |
| • | cost effectiveness; |
11
Table of Contents
| • | customer service; |
| • | improvements to existing technologies; |
| • | reimbursement; and |
| • | compliance with regulations. |
Our biomaterials products compete with products made by large companies, by small companies under OEM relationships and by start-up, new technology groups. However, we are not aware of competitors in the resorbable biomaterials medical device field that have the breadth of capabilities and size that we have, and that also make their technologies available to other companies. In many cases, our biomaterials-based products incorporate new technologies compared to what is in the marketplace, and therefore the competitive landscape is still developing.
The Angio-Seal device competes primarily with products sold by Abbott Laboratories, Inc. and Access Closure, Inc. There are also a few other smaller competitors, some of which recently gained approval for their devices, such as Arstasis, Inc. In addition, Cordis Corporation, a division of Johnson & Johnson, introduced a new competitive product. The mechanisms of action and designs of these products vary significantly and the products compete primarily on ease of use and clinical effectiveness. While we consider the use of an Angio-Seal device to be a preferred method of post-procedure care, many diagnostic and interventional procedures still rely on manual compression, which represents the primary competition for the Angio-Seal device.
Our orthopaedic market products, which include soft tissue and bone fixation products, and bone void filler and scaffolds, face substantial competition from large and small companies. The orthopaedic market is very competitive. Our largest customers in this market, Arthrex and Orthovita, generally compete against larger, more recognized companies.
The ECM products we have or which we are developing compete with human and animal-derived products from such companies as Kinetic Concepts, Inc., Johnson & Johnson, Covidien, C.R. Bard Medical, Cook Medical, Wright Medical and several other private and public companies that offer biologic scaffolds and meshes.
Our cartilage repair development program competes with existing surgical procedures, such as microfracture, osteoarticular transfer system and allograft procedures. Currently in the U.S., there are no approved competitive implantable products to repair focal articular cartilage defects. We believe there is only one U.S. approved cartilage repair product which is commercialized by Genzyme Corporation, which is a cell-based product that requires two surgeries and is indicated to be used only after a failed microfracture procedure. We anticipate additional competition from several other companies that have cartilage products under various stages of development, including acellular cartilage repair products, as well as cell-based cartilage repair products. Our Company is currently working on next generation products that are expected to address larger and more involved cartilage lesions.
Government Regulation
Medical devices are subject to extensive regulation by the FDA and by foreign governments. Current medical device regulation includes, but is not limited to, clinical testing, design, manufacture, labeling, distribution and promotion of medical devices. Noncompliance with applicable requirements can result in fines, injunctions, civil penalties, seizure of products, total or partial suspension of production, failure to grant premarket clearance or premarket approval for devices, withdrawal of marketing approvals and criminal prosecution. Regulatory agencies also have the authority to recall or request repair, replacement or refund of the cost of any device we manufacture or distribute.
Authorization to commercially distribute a new medical device in the U.S. is generally received in one of two ways. The first, known as premarket notification or the 510(k) process, requires a company to demonstrate that a
12
Table of Contents
new medical device is substantially equivalent to a legally marketed medical device. In this process, a company must submit data that supports its equivalence claim. If human clinical data is required, it may need to be gathered in compliance with FDA investigational device exemption regulations. Before commercial distribution of the new medical device, the FDA must issue an order finding substantial equivalence of the medical device to another legally marketed medical device. The 510(k) process generally takes from three to 12 months from the time of submission, but may take longer. Under current FDA regulations, modifications to cleared medical devices can be made without using the 510(k) process if the changes do not significantly affect safety or effectiveness, or the intended use of the device. The FDA may, however, determine that a new or modified device is not substantially equivalent to a predicate device or may require additional information, including additional clinical data, prior to the FDA making a determination, which could significantly delay the introduction of new or modified products.
The second, more rigorous process, known as premarket approval (PMA), requires a company to independently demonstrate that a new medical device is safe and effective. This is done by collecting data regarding design, materials, bench and animal testing and human clinical data for the medical device. The FDA will authorize commercial release if it determines there is reasonable assurance that the medical device is safe and effective. This determination is based on the benefit outweighing the risk for the population intended to be treated with the device. As part of the PMA approval, the FDA may place restrictions on the device, such as requiring additional patient follow-up for an indefinite period of time. If the FDA’s evaluation of the PMA application is not favorable, the FDA may deny approval of the PMA application or issue a “not approvable” letter. This PMA process is more time-consuming and expensive than the 510(k) process, typically takes at least several years to complete, and presents a greater risk that the medical device will not obtain FDA approval.
International sales of medical devices are subject to the regulatory agency product registration requirements of each country in which they are sold. The regulatory review process varies from country to country. For example, the European Union has adopted numerous directives and standards relating to medical devices regulating their design, manufacture, clinical trials, labeling and adverse event reporting. Devices that comply with those requirements, as determined by a Notified Body authorized by the European Commission, are entitled to bear a CE Mark, indicating that the device conforms to the essential requirements of the applicable directives and can be commercially distributed in countries that are members of the European Union. As part of the CE marking process, the Notified Body may place restrictions on the device, such as requiring the company to perform a formal post-market clinical study to collect certain safety data. Many countries also impose product standards, packaging requirements, labeling requirements, price restraints and import restrictions on devices. Delays in receipt of, or a failure to receive, approvals or clearances, or the loss of any previously received approvals or clearances, could have a material adverse effect on our business, financial condition and results of operations. In addition, reimbursement coverage must be obtained in some countries.
In many cases, regulatory activities for our biomaterials products are the responsibility of our customers, since most of our sales in this area are on an OEM basis. As a result, our customers frequently are responsible for seeking FDA and other government approvals to market the products. For many of these customers, we provide significant regulatory support, which includes the ongoing development and maintenance of Master Files with the FDA. Master Files contain important information relating to the specifications, manufacturing, biochemical characterization, biocompatibility and viral safety of our biomaterials products. These confidential files, in addition to our technical expertise, help our clients in their regulatory approval process for products incorporating our biomaterials.
The Angio-Seal product line has received both European CE Mark and FDA approvals. St. Jude Medical is responsible for all regulatory activities related to the Angio-Seal device. We maintain a Master File with the FDA containing important technical information regarding the collagen material used in the Angio-Seal device.
Medical device clinical trials are sometimes required as part of the 510(k) approval process, and are almost always required to support a PMA application. In some cases, a safety pilot trial may have to be performed prior to initiating a clinical trial to provide the FDA with additional safety data in a small population of human subjects
13
Table of Contents
for specific targeted indications. For example, we must conduct a pilot trial with respect to our cartilage repair device. When human clinical trials are required in connection with our new proprietary products, and the device is classified as a significant risk device, we must file for the appropriate regulatory approval(s) relative to the geographical region(s) where the trial(s) will be conducted. The clinical trial application must be supported by data, typically including the results of animal and laboratory testing. If the application is approved, human clinical trials may begin at a specific number of investigational sites with a specific number of patients, as set out in our test plan. The conduct of human clinical trials is also subject to regulation. In some countries, sponsors of clinical trials are permitted to sell those devices distributed during the course of the trial, provided the consideration received does not exceed recovery of the costs of manufacture, research, development and handling.
Any products we manufacture or distribute pursuant to regulatory agency clearance or approval are subject to pervasive and continuing regulation, including product validations, recordkeeping requirements, post-market surveillance and reporting of adverse experiences with the use of the device. As a device manufacturer, we are required to register our manufacturing facility and list our devices with relevant governmental authorities and/or sanctioned third parties and are subject to periodic inspections by those bodies, as well as other agencies. Relevant national laws in the regions where we sell our products require devices to be manufactured in accordance with formally implemented quality management systems, which impose certain procedural and documentation requirements with respect to design, manufacturing and quality assurance activities. Labeling and promotional activities are subject to regulatory scrutiny and, in certain instances, by the U.S. Federal Trade Commission. Regulations prohibiting marketing of products for unapproved uses are actively enforced.
Our manufacturing operations are also subject to numerous federal, state and local laws relating to such matters as safe working conditions, manufacturing practices, environmental protection, fire hazard control and disposal of hazardous or potentially hazardous substances. We may be required to incur significant costs to comply with such laws and regulations in the future, and any failure to comply with such laws or regulations could have a material adverse effect upon our ability to do business.
Employees
As of August 31, 2010, we had 269 employees, including 156 employees in operations, 82 employees in research and development and clinical and regulatory affairs and 31 employees in general and administration. All of our employees are located at our headquarters in Exton, Pennsylvania. We believe that our success depends in large part on our ability to attract and retain employees in all areas of our business.
Corporate Governance and Internet Address
We recognize that good corporate governance is an important means of protecting the interests of our stockholders, employees, customers and the community. We have closely monitored and implemented relevant legislative and regulatory corporate governance reforms, including provisions of the Sarbanes-Oxley Act of 2002 (Sarbanes-Oxley), the rules of the Securities and Exchange Commission (SEC) interpreting and implementing Sarbanes-Oxley, and the corporate governance listing standards of the NASDAQ Global Select Market (NASDAQ).
Our corporate governance information and materials, including our Code of Business Conduct and Ethics, are posted on the corporate governance section of our website at www.kenseynash.com and are available in print upon request to our Investor Relations department at our offices in Exton, Pennsylvania. Our Board of Directors regularly reviews corporate governance developments and modifies these materials and practices as warranted.
Our website also provides information on how to contact us and other items of interest to investors. We make available on our website, free of charge, our annual reports on Form 10-K, quarterly reports on Form 10-Q, current reports on Form 8-K and all amendments to these reports, as soon as practical after we file these reports with the SEC.
14
Table of Contents
Additional Information
For financial information, see the Consolidated Financial Statements and the related Notes as well as “Management’s Discussion and Analysis of Financial Condition and Results of Operations,” which are included in this Annual Report on Form 10-K. We have a single reportable segment for all our operations and business. Financial information about geographic areas can be found in Note 13 to the Consolidated Financial Statements included in this Form 10-K.
15
Table of Contents
| ITEM 1A. | RISK FACTORS |
You should carefully consider the risks, uncertainties and other factors described below, in addition to the other information set forth in this report, because they could materially and adversely affect our business, operating results, financial condition, cash flows and prospects as well as adversely affect the value of an investment in our Common Stock.
Risks Related to Our Business
We derive a substantial portion of our revenues from the Angio-Seal device, which is manufactured, marketed and distributed by St. Jude Medical. We have entered into a new component supply agreement with St. Jude Medical, under which their component purchase commitments are reduced. A termination of, or other adverse change in, our relationship with St. Jude Medical could have a material adverse impact on our business.
Under our license agreements with St. Jude Medical, the Angio-Seal device is manufactured, marketed and sold on a worldwide basis by St. Jude Medical. Two of our significant sources of revenue are the sale of components to St. Jude Medical for incorporation into the Angio-Seal device, and royalty income from the sale of the Angio-Seal device by St. Jude Medical to the end-user market. The amount of revenue we receive from the Angio-Seal device depends, in part, on the time, effort and attention that St. Jude Medical devotes to it, and on their success in manufacturing, marketing and selling the device worldwide. For fiscal 2010, royalty income from, and sales of components to, St. Jude Medical represented approximately 49% of our total revenue. Under the terms of our licenses with St. Jude Medical, we have no control over the pricing and marketing strategy for the Angio-Seal product line. In addition, we depend on St. Jude Medical to successfully maintain levels of manufacturing sufficient to meet anticipated demand, abide by applicable manufacturing regulations and seek reimbursement approvals. Royalty income under our license agreements with St. Jude Medical will end upon the earlier of (1) the termination of the license agreements, which may be terminated by St. Jude Medical for any reason upon 12 months notice, or (2) the expiration of the last claim of any of the licensed patents. St. Jude Medical may not adequately perform its manufacturing, marketing and selling duties. Any such failure by St. Jude Medical may negatively impact Angio-Seal unit sales and, therefore, reduce our royalties.
Pursuant to our current supply agreement with St. Jude Medical, which expires in December 2010, we manufacture two of the key resorbable components of the Angio-Seal device for St. Jude Medical; 100% of their requirements for the collagen plug and at least 30% of their requirements for the polymer anchors. In fiscal year 2010, our collagen plug sales to St. Jude Medical were approximately $17.1 million and our polymer anchor sales to St. Jude Medical were approximately $1.9 million. In August 2008, St. Jude Medical acquired certain assets of Datascope Corporation providing St. Jude Medical with a potential alternative source for the collagen component that could reduce or eliminate the future sales of collagen supplied by us to St. Jude Medical. In February 2010, St. Jude Medical announced that they had received U.S. Food and Drug Administration approval as an alternative supplier for the collagen plug, and that they would be in a position to serve as a supplier of the collagen plug by December 2010. In June 2010, we entered into a new two-year supply agreement for the period from January 1, 2011 to December 31, 2012. The new supply agreement does not call for us to supply any polymer anchors to St. Jude Medical, and the new supply agreement substantially reduces the collagen plug quantities which St. Jude Medical is required to purchase from us. The new supply agreement provides for calendar year 2011 minimum order levels equivalent to approximately 25% of our fiscal 2010 collagen plug sales, and calendar year 2012 minimum order levels equivalent to approximately 20% of our fiscal 2010 collagen plug sales. As a result, if St. Jude Medical is able to, and does in fact, rely on its internal manufacturing to fulfill its requirements for collagen plugs for the Angio-Seal device in excess of the minimum it must purchase from us, our related product sales will be substantially lower. Royalties under the Angio-Seal license agreement between St. Jude Medical and us are not affected by the new supply agreement.
16
Table of Contents
We derive a substantial majority of our revenues from only three customers.
A substantial majority of our total revenues are derived from only three customers. For fiscal 2010, in addition to the approximate 49% of our total revenue derived from royalty income from and sales of components to St. Jude Medical, sales of biomaterials products to Arthrex represented approximately 20% of our total revenues, and royalty income from and sales of biomaterials products to Orthovita represented approximately 17% of our total revenue. It is not possible for us to predict the future level of demand for our products that will be generated by these customers or the future demand for the products in the end-user marketplace. Our customer concentration exposes us to the risk of changes in the business condition of any of our major customers and to the risk that the loss of a major customer would materially adversely affect our results of operations. Our relationship with these customers is subject to change.
In the past year, Orthovita’s sales efforts were focused on the launch of a new product developed by Orthovita, which is not part of any agreement with us. Although this new product does not compete with our co-developed products, the sales efforts may have negatively impacted sales of our co-developed products. Recently, Orthovita announced it will refocus its sales efforts on our co-developed products. There can be no assurance that such refocused efforts will result in higher sales.
If our biomaterials products are not successful, our operating results and business may be substantially impaired.
The success of our existing and future biomaterials products depends on a number of factors, including our ability to manufacture, sell and competitively price these products and the acceptance of these products by the medical community. We cannot predict how quickly, if at all, the medical community will accept our future products, or the extent to which our future products will be used. In addition, regulatory approvals will be required before biomaterials products in development can be sold. The bovine materials we use in some of our products are not always accepted for use in medical devices in all international markets. If we encounter difficulties introducing future products into our targeted markets, our operating results and business may be substantially impaired. In addition, new technologies and techniques may be developed which may render obsolete our current products, along with those under development.
We will require substantial additional funds to develop and market our biomaterials products. We expect to fund the growth of our biomaterials business from cash flows from operations and cash and investments on-hand, but this operating income may not be sufficient to develop new biomaterials products. We rely on strategic partners or customers to market and sell our biomaterials products. We will need to continue to attract third parties, and retain our relationships with our current partners, to distribute our products to the end-user market.
We depend on our customers to market and, in some cases, obtain regulatory approvals for products that include our biomaterials components.
We depend on the efforts of our biomaterials customers in marketing their products that include our biomaterials components. There can be no assurance that our customers’ end-use products that include our biomaterials components will be commercialized successfully by our customers or that our customers will otherwise be able to compete effectively in their markets. While we take steps toward obtaining regulatory approval under certain of our partnerships and for some of our customers, in other cases, we rely on others to do these activities independently. There can be no assurance that our partners or customers will be successful in obtaining such regulatory approvals.
The markets for our products are highly competitive and are likely to become more competitive, and our competitors may be able to respond more quickly to new or emerging technologies and changes in customer requirements.
The markets for our current and proposed products are fragmented, intensely competitive, subject to rapid change and sensitive to new product introductions and enhancements. We expect that the competitive environment for
17
Table of Contents
our products will become more intense as additional companies enter our markets, and as new techniques and technologies are adopted. Our biomaterials and medical devices compete directly and indirectly with a range of products and technologies produced by a wide variety of companies, as well as other processes and procedures which do not require the use of our products or those of our competitors. The bovine materials we use in some of our products are not always accepted for use in medical devices in all international markets. Many of our existing competitors, as well as a number of potential new competitors, have longer operating histories in these markets, greater name recognition, larger customer bases and greater financial, technical and marketing resources.
Our biomaterials products, including products under development, compete with the products of many companies in the industry, including some of the largest. In the vascular sealing device market, our products compete with products sold by Abbott Laboratories and Access Closure, Inc., along with other competitors and potential new entrants. The majority of vascular sealing is performed through manual compression, which represents our primary competition. The ECM products we are developing compete with human and animal-derived products from such companies as Kinetic Concepts, Johnson & Johnson, Covidien, C.R. Bard Medical, Cook Medical, Wright Medical, and several other private and public companies that offer biologic scaffolds and meshes. Our cartilage repair development program competes with existing surgical procedures, such as microfracture, osteoarticular transfer system and allograft procedures. Currently in the U.S, there are no approved competitive implantable products to address focal articular cartilage defects. We believe there is only one U.S. approved cartilage repair product which is commercialized by Genzyme, which is a cell-based product that requires two surgeries and indicated to be used only after a failed microfracture procedure. We anticipate additional competition from several other companies that have cartilage products under various stages of development, including acellular cartilage repair products, as well as cell-based cartilage repair products.
Our competitors may have broader product lines, which allow them to negotiate exclusive, long-term supply contracts and offer comprehensive pricing for their products. Broader product lines may also provide our competitors with a significant advantage in marketing competing products to group purchasing organizations and other managed care organizations that are increasingly seeking to reduce costs through centralized purchasing. Greater financial resources and product development capabilities may allow our competitors to respond more quickly to new or emerging technologies and changes in customer requirements that may render our products obsolete.
Competition faced by our customers could also have an adverse effect on our business for a variety of reasons, including that our customers may compete directly with larger, dominant manufacturers with extensive product lines and greater sales, marketing and distribution capabilities. We are also unable to control other factors that may impact the commercialization of our components for end use products, such as marketing and sales efforts and competitive pricing pressures within particular markets.
Spectranetics is exclusively responsible for worldwide sales and marketing of the endovascular product line. If any or all of these products fail to gain market acceptance or if Spectranetics fails to successfully commercialize them, our business may suffer.
The QuickCat and ThromCat endovascular products, which are sold and marketed exclusively by Spectranetics, have limited product and brand recognition, and limited usage to date. Although we do not know if these products will be successful over the long term, or if they will be adopted by the physician community at rates that in turn generate enough revenue for us to sustain our ongoing investment in this business, we are required by contract to continue such investment. Market acceptance of these products may be hindered if physicians are not presented with compelling data from long-term studies of the safety and efficacy of the products compared to alternative procedures. Further, the success of these products depends, in large part, on the time, effort and attention that Spectranetics devotes to them, and on Spectranetics’ success in manufacturing and selling them. Demand for the QuickCat and ThromCat products has not increased as quickly as we expected.
18
Table of Contents
As previously disclosed, Spectranetics publicly announced the discontinuation of sales of the Safe-Cross product line in our second quarter of fiscal 2010. Also, our second quarter of fiscal 2010 ended December 31, 2009 was the last quarter reflecting our sales of the QuickCat device, as the QuickCat manufacturing was transferred to Spectranetics as of December 2009. During the second quarter of fiscal 2010, pursuant to the terms of the Manufacturing and Licensing Agreement entered into with Spectranetics on May 30, 2008, we notified Spectranetics that we will not manufacture the ThromCat product at the end of our three-year manufacturing period, which is expected to be the fourth quarter of our fiscal 2011. Following the commencement of the manufacturing of the ThromCat product by Spectranetics or its designee, Spectranetics will pay a predetermined royalty rate on the end-user sales of the ThromCat product. As a result, our expectation for fiscal 2011, and thereafter, reflects that our manufacturing of the endovascular product line will be limited to the ThromCat product through the fourth quarter of our fiscal 2011, and sales of the ThromCat product continues to be dependent upon the sales and marketing efforts of Spectranetics. Furthermore, our achievement, in full of the $6.0 million cumulative sales milestone under the asset purchase agreement with Spectranetics, which is based upon sales of Safe-Cross (a product line which was discontinued in our fiscal 2010), ThromCat and QuickCat products, will at a minimum be delayed and may not occur at all.
On December 29, 2009, Spectranetics announced the settlement of matters related to the federal investigation initiated by the Food and Drug Administration (FDA) and U.S. Immigration and Customs Enforcement (ICE). According to Spectranetics’ public disclosure of the December 2009 settlement, the resolution includes an agreement with the United States Department of Justice (the DOJ), as well as a Corporate Integrity Agreement with the Office of the Inspector General for the United States Department of Health and Human Services. Significant terms of the agreements, subject to certain conditions outlined therein, include an agreement by the DOJ not to prosecute Spectranetics, a $4.9 million payment by Spectranetics in consideration of a release from certain civil or administrative monetary claims resulting from certain alleged conduct associated with the federal investigation, and a separate agreement that specifies certain corporate integrity obligations. On August 30, 2010, the U.S. Attorney’s Office and the FDA’s Office of Criminal Investigations announced the indictment by a federal grand jury of the former Spectranetics CEO John Schulte and two other former company executives on conspiracy to defraud the federal government, lying to investigators, import violations and other charges. Although we do not believe the FDA or ICE investigation or settlement with Spectranetics, or the claims against the former Spectranetics executives, relate to any of our endovascular products sold to Spectranetics, our business may be adversely impacted if Spectranetics is hindered in its ability to market and sell the QuickCat and ThromCat products as a result of the federal investigation, its settlement, the indictment or related matters. Further, our ability to receive timely milestone payments from Spectranetics for our research and development achievements may be adversely impacted by Spectranetics’ cash requirements for settlement payments.
Spectranetics announced on October 22, 2008, the appointment of Emile J. Geisenheimer, its chairman, to the additional roles of President and Chief Executive Officer, following the resignation of John G. Schulte as President, Chief Executive Officer and Director of Spectranetics. In addition, on April 2, 2010, Johnathan W. McGuire, resigned from his position as Chief Operating Officer, with Mr. Geisenheimer assuming those responsibilities. Our business, including revenues derived from endovascular sales, may be adversely impacted by the change in management if such change diverts focus and attention away from selling the endovascular products we sold to Spectranetics, and which we continue to develop and manufacture for Spectranetics.
The loss of, or interruption of supply from, key vendors could limit our ability to manufacture our products.
We purchase many materials and components for our products from various suppliers. Certain of these materials and components are custom made for us, and we have no ready alternative source. We also rely heavily on our closed-herd sourcing infrastructure for our collagen manufacturing, which cannot be readily replicated. Any loss of, problems with, or interruption of supply from, key vendors may require us to find new vendors. We could experience production or development delays while we attempt to seek new vendors, if we can find them.
19
Table of Contents
We may have problems manufacturing and delivering our biomaterials products to our customers.
The biomaterials industry is an emerging area, using many materials which are untested or whose properties are still not known. In addition, many of our products are derived from natural materials, such as collagen, which can have varying properties, may be subject to international standards concerning their use in medical devices and require careful sourcing and handling controls. Consequently, from time to time we may experience unanticipated difficulties in manufacturing and delivering our biomaterials products to our customers. These difficulties may include an inability to meet customer supply demands, delays in delivering products, quality control problems or the need to react to changes in any standard that we adhere to. There can be no assurance that our closed-herd sourcing infrastructure will provide us with an adequate risk management protection mechanism for preventing animal derived diseases from entering the human medical device industry.
Our products may be the subject of recalls, which may result in other future expense or changes to product strategy.
The FDA and similar foreign governmental authorities have the authority to require the recall of our products in the event of any failure to comply with applicable laws and regulations or defects in design or manufacture. A government mandated or voluntary product recall by us could occur if any of our biomaterial products do not meet approved specifications or data demonstrates that any such products may be unsafe or ineffective. A product recall may have an adverse affect on our net sales and operating results. In addition to lost sales directly resulting from recalls, and the direct expenses associated with such resolution, a recall may have other materially adverse, and potentially longer-term effects, including a negative impact on our reputation in the marketplace with respect to these and other of our products, changes to future product marketing plans, changes to clinical trial plans, and discontinuation of the recalled products.
Our use of hazardous materials exposes us to the risk of material environmental liabilities.
We use hazardous substances in our research and development and manufacturing operations, and therefore, are potentially subject to material liabilities related to personal injuries or property damages that could be caused by hazardous substance releases or exposures at or from our facility. Decontamination costs, other clean-up costs and related damages or liabilities could substantially impair our business and operating results. We are required to comply with increasingly stringent laws and regulations governing environmental protection and workplace safety, including requirements governing the handling, storage and disposal of hazardous substances.
A substantial portion of our revenue is derived directly or indirectly from international markets.
St. Jude Medical derives a significant portion of its Angio-Seal revenue from international markets. Many of our other biomaterials products are also sold by our customers in international markets. Our sales and royalties from international sales of the Angio-Seal product line by St. Jude Medical and our revenues from other international sales are subject to several risks, including:
| • | the impact of recessions in economies outside the United States; |
| • | changes in regulatory requirements, reimbursement policies, tariffs or other trade barriers; |
| • | weaker intellectual property rights protection in some countries; |
| • | fluctuations in currency exchange rates; |
| • | potentially adverse tax consequences; and |
| • | political and economic instability. |
20
Table of Contents
Our financial position, results of operations or cash flows may be negatively impacted by the current challenging economic conditions in the U.S. and the recent financial crisis.
The current challenging economic conditions in the U.S. could adversely affect our operating results and financial condition. Among other things, we believe this challenging economic climate has contributed to fewer patients electing to undergo elective procedures for which our products, or the products of our partners, are used. Further, the challenging economic environment and the decline in federal and state revenues resulting from these conditions may create additional pressures to reduce reimbursements for procedures performed by physicians, hospitals and other users of our products from third party insurance providers, as well as Medicare, Medicaid and other government sponsored programs. In particular, the recent weakness in the spinal market has been attributed to the ongoing high unemployment rate and increased insurance costs, which reduced doctor visits and negatively affected pricing, as well as, greater difficulty in obtaining insurance company procedure approvals.
The majority of our investments are in highly rated U.S. government agency bonds and municipal bonds issued by states, cities, counties and other governmental entities. We have not experienced any liquidity or impairment issues with our investments. However, due to recent economic conditions, bond issuers’ financial condition and the credit markets have continued to be highly volatile, and there can be no assurance that these conditions will not in the future adversely affect the liquidity or value of our investments in U.S. government agency bonds or municipal bonds. If these challenging economic conditions continue, or any investments in our portfolio experience any ratings downgrades, we may incur impairments to our investment portfolio, which could negatively affect our financial condition, cash flows and results of operation.
The recent financial troubles affecting the banking system and financial markets and the on-going concerns and threats to investment banks and other financial institutions have resulted in a tightening in the credit markets, a low level of liquidity in many financial markets, and extreme volatility in fixed income, credit and equity markets. There could be a number of follow-on effects from the credit crisis on our business, including insolvency of key suppliers resulting in product delays; inability of customers to obtain credit to finance purchases of our products and/or customer insolvencies; and counterparty failures negatively impacting our debt and treasury activities.
Our business could be harmed if we lose the services of our key personnel.
Our business depends upon our ability to attract and retain highly qualified personnel, including managerial and technical personnel. The know-how and capabilities of many of our current employees is highly specialized and difficult to replicate or replace in short timeframes. We compete for key personnel with other medical device companies, healthcare institutions, and other organizations. Our ability to maintain and expand our business may be impaired if we are unable to retain our current key personnel or hire or retain other qualified personnel in the future.
Any acquisitions that we undertake could be difficult to integrate, disrupt our business, dilute stockholder value or harm our operating results.
We may acquire or make investments in complementary businesses, technologies, services or products if appropriate opportunities arise. The process of integrating any acquired business, technology, service or product into our business and operations may result in unforeseen operating difficulties and expenditures. Integration of any acquired company also may consume much of our management’s time and attention that could otherwise be available for ongoing development of our business. Moreover, the anticipated benefits of any acquisition may not be realized. Furthermore, we may be unable to identify, negotiate or finance future acquisitions successfully. Future acquisitions could result in potentially dilutive issuances of equity securities or the incurrence of debt, contingent liabilities or charges related to goodwill and other intangible assets.
21
Table of Contents
Our future operating results are difficult to predict and may vary significantly from quarter to quarter.
Our operating results have varied significantly from quarter to quarter in the past and are likely to vary substantially in the future as a result of a number of factors, some of which are not in our control, including:
| • | ordering patterns by our customers/partners; |
| • | the focus and resources that our customers/partners place on developing/marketing the products that we develop and manufacture; |
| • | acceptance of the products we develop and manufacture in the end-user marketplace; |
| • | our ability to attract partners for our biomaterials products and technologies; |
| • | our efforts to gain European CE Mark and FDA approval for biomaterials and endovascular devices; |
| • | the loss of significant orders; |
| • | changes in our relationship with St. Jude Medical and other major customers; |
| • | establishment of strategic alliances or acquisitions; |
| • | timely implementation of new and improved products; |
| • | delays in obtaining regulatory approvals; |
| • | reimbursement rates for our products; |
| • | fluctuations in exchange rates; and |
| • | changes in the competitive environment. |
You should not rely upon our results of operations for any particular quarter as an indication of our results for a full year or any other quarter.
Our products are subject to clinical trials, which may delay commercialization of our products and may impact our use of time and resources in a material manner.
A clinical trial is almost always required to support a PMA application, and is sometimes required for a 510(k) premarket notification. Accordingly, many of our products are subject to clinical trials, which must be conducted before our products can be marketed. These trials are for the purpose of confirming the safety and effectiveness of the product. We try to plan clinical trials prudently, but there is no guarantee that a proper balance of speed and testing will be made in each case. The length of time for each clinical trial may vary substantially according to the type, complexity and intended use of the product. Delays associated with products for which we are conducting clinical trials may cause us to incur additional expenses. Further, we may be affected by delays in clinical testing of certain products of our strategic partners, over which we may have no control. Unfavorable or inconsistent clinical data from existing or future clinical trials conducted by us, by our strategic partners, by our competitors or by other third parties, or the market’s perception of this clinical data, may adversely impact our ability to obtain product approvals, our position in, and share of, the markets in which we participate and our business, financial condition, results of operations or future prospects.
Risks Related to Our Intellectual Property
If we are unable to protect our patents and proprietary rights, our reputation and competitiveness in the marketplace may be materially damaged.
We regard our patents, biomaterials trade secrets and other intellectual property as important to our success. We rely upon patent law, trade secret protection, confidentiality agreements and license agreements to protect our proprietary rights. Although we have registered certain of our patents with applicable international governmental
22
Table of Contents
authorities, effective patent protection may not be available in every country in which our products are made available, and we have not sought protection for our intellectual property in every country where our products may be sold. The steps we take to protect our proprietary rights may not be adequate to ensure that third parties will not infringe or otherwise violate our patents or similar proprietary rights. Furthermore, patents are of limited duration and may not provide protection for the entire useful life of a product or product line.
We may be accused of infringing upon the proprietary rights of others and any related litigation could materially damage our operating results and business.
Third parties may claim that we have violated their intellectual property rights. An adverse determination in any intellectual property litigation or interference proceedings brought against us could prohibit us from selling our products, subject us to significant liabilities to third parties or require us to seek licenses from third parties. The costs associated with these license arrangements may be substantial and could include ongoing royalties. Furthermore, the necessary licenses may not be available to us on satisfactory terms, if at all. Adverse determinations in a judicial or administrative proceeding or failure to obtain necessary licenses could prevent us from manufacturing and selling our products. Any of these claims, with or without merit, could subject us to costly litigation and divert the attention of key personnel.
The validity of our patents may be challenged by a competitor.
Third parties may claim that one of our patents is invalid based on their prior disclosure or that of another party, whether such disclosure is in a patent application or not. This type of challenge may be made in any country where our patents are issued. While we undertake to search the prior art, there is no guarantee that we find all existing incidences of disclosure of devices or technologies related to our inventions. Any of these claims, with or without merit, could subject us to costly litigation and divert the attention of key personnel.
We do not own or control the use of the Angio-Seal device trademark.
The term “Angio-Seal” is a trademark of St. Jude Medical. All goodwill generated by the marketing and sales of devices bearing the Angio-Seal trademark belongs to St. Jude Medical and not to us. Should the St. Jude Medical license agreements terminate, we would not have the right to call any of our products “Angio-Seal” unless we purchase or license the trademark from St. Jude Medical.
Risks Related to Our Industry
We may face product liability claims that could result in costly litigation and significant liabilities.
The clinical testing, manufacture and sale of medical products involve an inherent risk that human subjects in clinical testing or consumers of the products may suffer serious bodily injury or death due to side effects or other unintended negative reactions to our products. Accordingly, the clinical testing, manufacture and sale of our products entail significant risk of product liability claims. The medical device industry in general has been subject to significant product liability litigation. Any product liability claims, with or without merit, could result in costly litigation, reduced sales, significant liabilities and diversion of our management’s time, attention and resources. We cannot be sure that our product liability insurance coverage is adequate or that it will continue to be available to us on acceptable terms, if at all.
We face uncertainty relating to third party reimbursement for our products.
We could be seriously harmed by changes in reimbursement policies of governmental or private healthcare payers, particularly to the extent any changes affect reimbursement for catheterization procedures in which our Angio-Seal products are used. Physicians, hospitals and other users of our products, including our products under development such as our ECM and cartilage repair products, may fail to obtain sufficient reimbursement from
23
Table of Contents
healthcare payers for procedures in which our products are used, or are expected to be used, or adverse changes may occur in governmental and private third-party payers’ policies toward reimbursement for these procedures. For example, the decision by the Centers for Medicare and Medicaid Services (CMS) not to reimburse for treatment of asymptomatic patients suffering from carotid artery disease was a major factor in our fiscal 2007 decision not to continue to commercialize our embolic protection product line. Further, there have been, and continue to be, proposals by legislators, regulators and third-party payors to keep healthcare costs down. Certain proposals, if passed, would impose limitations on the prices we will be able to charge for our products, or the amounts of reimbursement available for our products from governmental agencies or third-party payors. These limitations, and other changes to reimbursement policy, could harm our business.
The adoption of healthcare reform in the United States may adversely affect our business, results of operations and/or financial condition.
In March 2010, the Patient Protection and Affordable Care Act, and the Health Care and Education Reconciliation Act of 2010 (collectively, being commonly referred to as, healthcare reform, and referred to below as, the Act), were enacted into law in the United States. The Act, which will effect major changes to the U.S. healthcare system, includes provisions that, among other things, will reduce and/or limit Medicare reimbursement, require all individuals to have health insurance (with limited exceptions) and impose new and/or increased taxes. Specifically, the Act will require the medical device industry to subsidize healthcare reform in the form of a 2.3% excise tax on U.S. sales of most medical devices beginning in 2013. Under our current business model, we sell substantially all of our products through strategic partners; as a result, we are still evaluating the impact, if any, of this tax on our overall business. At a minimum, this excise tax will be an additional cost incurred by our customers. Various healthcare reform proposals have also emerged at the state level. The Act and these proposals, if passed into law, could reduce medical procedure volumes and impact the demand for our products or the prices at which we or our customers can sell our products. In addition, the excise tax may increase our cost of doing business. While we believe the Act may have the impact on our business as described above, it is too early to understand and predict the full impact of the Act on our business, as many of the details of the Act will be included in new and revised regulations, which have not yet been promulgated, and require additional guidance and specificity to be provided by the Department of Health and Human Services, the Department of Labor and the Department of Treasury.
Our products and manufacturing activities are subject to extensive governmental regulation that could make it more expensive and time consuming for us to introduce new and improved products or cause us to withdraw products from certain markets.
Our products and manufacturing activities are subject to extensive regulation by a number of governmental agencies, including the FDA and comparable international agencies. We are required to:
| • | obtain the approval of the FDA and international agencies before we can market and sell new products; |
| • | satisfy these agencies’ requirements for all of our labeling, sales and promotional materials in connection with our existing products; |
| • | comply with all applicable design and manufacturing regulations; and |
| • | undergo rigorous inspections by these agencies. |
Compliance with the regulations of these agencies may delay or prevent us from introducing any new or improved products. Furthermore, we may be subject to sanctions, including temporary or permanent suspension of operations, product recalls and marketing restrictions if we fail to comply with the laws and regulations pertaining to our business.
The FDA clearance and approval processes for a medical device, particularly for a device subject to PMA, can be expensive, uncertain and lengthy. There can be no assurance that we will be able to obtain necessary regulatory
24
Table of Contents
clearances or approvals for any product on a timely basis or at all. As an example, our cartilage repair device is subject to the PMA process. As with other medical devices subject to this rigorous process, our efforts to obtain FDA approval will be time consuming and expensive. The FDA ultimately may deny our PMA application for this device, and/or may require additional clinical trials, which could delay the PMA approval process by several years.
The requirements governing the conduct of clinical trials and manufacturing and marketing of our products internationally vary from country to country. Foreign approvals may take longer to obtain than FDA approvals and can require, among other things, additional testing and different clinical trial designs. If we fail to comply with these regulatory requirements or obtain and maintain required approvals in any foreign country, we will not be able to sell our products (or our partners will not be able to sell their products which incorporate our devices) in that country.
We are also required to demonstrate compliance with the FDA’s Quality System Regulations. The FDA enforces its Quality System Regulations through pre-approval and periodic post-approval inspections. These regulations relate to product testing, vendor qualification, manufacturing control, design control and quality assurance, as well as the maintenance of records and documentation. If we are found to be out of compliance with FDA regulations, it could be costly and difficult for us to correct the non-compliances and could seriously harm our business.
The FDA and international regulatory agencies may also limit the indications for which our products are promoted. These regulatory agencies may restrict or withdraw approvals if information becomes available to support this action, which could include actions based on sourcing of animal derived tissue.
In addition, regulations regarding the development, manufacture and sale of medical devices are subject to future change, including the adoption of more rigorous regulation. We cannot predict what impact, if any, those changes might have on our business, the businesses of our strategic partners, or the businesses of our competitors.
The adoption of reform to the FDA’s 510(k) process, as proposed by the FDA in its recently released preliminary recommendations, may adversely affect our business, results of operations and/or financial condition.
Our products are generally subject to the FDA’s 510(k) approval requirements, among other governmental regulations. In August 2010, the FDA issued its preliminary recommendations on reform of the 510(k) process for premarket approval of medical devices. The FDA’s preliminary recommendations include, among other things, granting to the FDA of authority to rescind 510(k) clearance, revising existing guidance to clarify what types of modifications to existing 510(k) cleared devices warrant submission of a new 510(k), exploring the possibility of potentially requiring manufacturers to provide periodic updates to the FDA’s Center for Devices and Radiological Health listing modifications without submitting a new 510(k), adopting a framework for 510(k) submissions that requires formal validation of claims with supporting evidence and developing guidance requiring that the complete device description and intended use information be submitted and described in detail in a single section of a 510(k). While the FDA has indicated that these recommendations are preliminary in nature, if implemented, these recommendations could have the effect of making it more difficult and expensive for us, and other companies, to obtain 510(k) clearance and potentially jeopardizing the regulatory status of certain 510(k) cleared devices. It is too early to understand and predict the full impact that any modifications to the FDA’s 510(k) process may have on our business, as the FDA has emphasized that these recommendations are only preliminary in nature, and the FDA will solicit and evaluate public comments on these recommendations.
25
Table of Contents
Risks Related To Our Securities
The trading price of our Common Stock is likely to fluctuate substantially in the future.
The trading price of our Common Stock may fluctuate widely as a result of a number of factors, some of which are not in our control, including:
| • | changes in our own forecasts or earnings estimates by analysts; |
| • | our customers and licensees’ ability to meet or exceed the forecasts or expectations of analysts or investors; |
| • | our ability to meet or exceed our own forecasts or expectations of analysts or investors; |
| • | quarter-to-quarter variations in our operating results; |
| • | announcements regarding clinical activities or new products by us or our competitors; |
| • | general conditions in the medical device industry; |
| • | price and volume fluctuations in the overall stock market, which have particularly affected the market prices of many medical device companies; |
| • | our stock repurchase programs; and |
| • | general economic conditions. |
In addition, the market for our stock has experienced, and may continue to experience, price and volume fluctuations unrelated or disproportionate to our operating performance. As a result, our stockholders may not be able to sell shares of our Common Stock at or above the price at which they purchase them. In the past, following periods of volatility in the market price of a company’s securities, securities class action litigation has often been instituted against that company. If any securities litigation is initiated against us, with or without merit, we could incur substantial costs, and our management’s attention and resources could be diverted from our business.
Our second amended and restated certificate of incorporation, third amended and restated bylaws, stockholders rights plan and Delaware law may discourage an attempt to acquire our Company.
Provisions of our second amended and restated certificate of incorporation, third amended and restated bylaws, stockholders rights plan and Delaware law may render more difficult or discourage any attempt to acquire our Company, even if such acquisition may be favorable to the interests of our stockholders, discourage bids for our Common Stock at a premium over market price or adversely affect the market price of our Common Stock. In particular, our stockholders rights plan, adopted in June 2009, may cause substantial dilution to any person or group that attempts to acquire us without the approval of our Board of Directors.
| ITEM 1B. | UNRESOLVED STAFF COMMENTS |
None.
| ITEM 2. | PROPERTIES |
We own our corporate headquarters, which is a 202,500 square foot facility housing our executive offices, manufacturing and research and development activities, located at 735 Pennsylvania Drive, Exton, Pennsylvania 19341. We believe that our facility is adequate to meet our needs for the foreseeable future. See Item 1 – “Business – Facility” for additional information.
| ITEM 3. | LEGAL PROCEEDINGS |
From time to time, in the normal course of business, we are a party to various legal proceedings. We do not expect that any currently pending proceedings will have a material adverse effect on our business, results of operations or financial condition.
26
Table of Contents
| ITEM 5. | MARKET FOR REGISTRANT’S COMMON EQUITY, RELATED STOCKHOLDER MATTERS AND ISSUER PURCHASES OF EQUITY SECURITIES |
Our Common Stock is listed on the NASDAQ Global Select Market, under the symbol “KNSY” and has been traded publicly since our initial public offering in December 1995. The following table sets forth the high and low sale prices per share of our Common Stock as reported by NASDAQ for the periods indicated.
| High | Low | |||||
| Fiscal Year Ended June 30, 2009 |
||||||
| First Quarter |
$ | 37.70 | $ | 31.40 | ||
| Second Quarter |
32.02 | 16.66 | ||||
| Third Quarter |
21.26 | 15.76 | ||||
| Fourth Quarter |
27.41 | 20.25 | ||||
| Fiscal Year Ended June 30, 2010 |
||||||
| First Quarter |
$ | 29.96 | $ | 24.75 | ||
| Second Quarter |
29.43 | 22.18 | ||||
| Third Quarter |
26.57 | 19.70 | ||||
| Fourth Quarter |
25.50 | 20.54 | ||||
On September 8, 2010 the last reported sale price of our Common Stock in the NASDAQ Global Select Market was $26.94 per share. As of September 7, 2010, there were 57 record owners of our Common Stock. There were also approximately 5,600 beneficial owners of the shares of our Common Stock at that date.
27
Table of Contents
Performance Graph
The following graph compares the cumulative 5-year total return that would have been attained by shareholders of Kensey Nash Corporation’s Common Stock relative to the cumulative total returns of the NASDAQ Composite index, the NASDAQ Medical Equipment index and a customized peer group of 12 companies, which are Anika Therapeutics, Inc., BioMimetic Therapeutics, Inc., Cryolife, Inc., Exactech, Inc., Greatbatch, Inc., Orthovita, Inc., RTI Biologics, Inc., Stereotaxis, Inc., Surmodics, Inc., Synovis Life Technologies, Inc., The Spectranetics Corporation and Vascular Solutions, Inc. This customized peer group includes only publicly-traded, similar sized companies within the medical device industry (specifically cardiovascular or orthopaedics), with similar financial metrics, which include, but are not limited to, annual total revenue and market capitalization, and with similarities to our Company in terms of financial profile, development stage, product focus and growth potential. Our management uses this customized peer group for financial performance benchmarking, and the Compensation Committee of our Board of Directors uses this peer group for compensation practices benchmarking. The graph tracks the performance of a $100 investment in our Common Stock, in each index and in the peer group (with the reinvestment of all dividends) from June 30, 2005 through June 30, 2010.
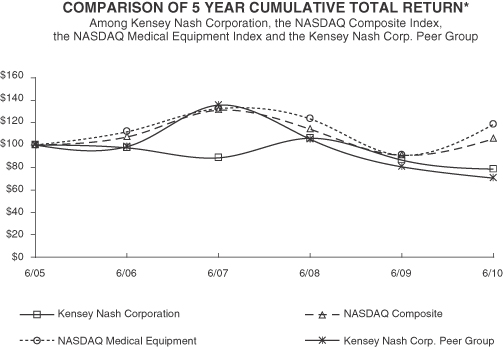
* Assumes $100 invested on 6/30/05 in KNSY shares or in a stock index, including reinvestment of dividends, if any.
| Cumulative Total Return | ||||||||||||||||||
| 6/30/05 | 6/30/06 | 6/30/07 | 6/30/08 | 6/30/09 | 6/30/10 | |||||||||||||
| Kensey Nash Corporation |
$ | 100.00 | $ | 97.55 | $ | 88.66 | $ | 105.99 | $ | 86.67 | $ | 78.41 | ||||||
| NASDAQ Composite |
$ | 100.00 | $ | 107.08 | $ | 130.99 | $ | 114.02 | $ | 90.79 | $ | 105.54 | ||||||
| NASDAQ Medical Equipment |
$ | 100.00 | $ | 111.90 | $ | 132.46 | $ | 123.32 | $ | 90.96 | $ | 118.30 | ||||||
| Kensey Nash Corp. Peer Group |
$ | 100.00 | $ | 98.46 | $ | 135.43 | $ | 105.07 | $ | 80.66 | $ | 70.53 | ||||||
The above graph, including the related table, is not "soliciting material," is not deemed to be "filed" with the SEC and is not incorporated by reference in any of our filings under the Securities Act or the Exchange Act whether made before or after the date hereof and irrespective of any general incorporation language in any such filing.
28
Table of Contents
We have not declared or paid cash dividends and do not anticipate declaring or paying any dividends on our Common Stock in the near future. Any future determination as to the declaration and payment of dividends will be at the discretion of our Board of Directors and will depend on the then existing conditions, including our financial conditions, results of operations, contractual restrictions, capital requirements, business prospects and other relevant factors.
During the fiscal year ended June 30, 2010, we repurchased and retired 1,794,705 shares of Common Stock at a cost of approximately $41,309,000, or an average market price of $23.02 per share, using available cash. The stock repurchases were executed under the various stock repurchase programs established by our Board of Directors. As of June 30, 2010, approximately $29,189,000 remained under our June 16, 2010 stock repurchase program to repurchase shares of our Common Stock.
During the fiscal year ended June 30, 2009, we repurchased and retired 806,666 shares of Common Stock at a cost of approximately $19,295,000 or an average market price of $23.92 per share, using available cash, executed under various stock repurchase programs.
The following table contains information about our purchases of our equity securities during April, May and June 2010:
| Period |
Total number of shares purchased * |
Average price paid per share (1) |
Maximum number (or approximate dollar value) of shares that may yet be repurchased under the plans or programs |
||||||
| April 1-30, 2010 |
378,234 | $ | 23.01 | (2) | |||||
| May 1-31, 2010 |
292,356 | 23.20 | (2) | ||||||
| June 1-30, 2010 |
— | — | $ | 30,000,000 | (3) | ||||
| Total |
670,590 | $ | 23.09 | ||||||
| * | All shares purchased under a publicly announced plan on the purchase date (i.e., settlement date). |
| (1) | Average price paid per share is calculated on the purchase date and excludes commissions paid to brokers. |
| (2) | As of April 30, 2010, there were 292,356 shares of our Common Stock that remained that may be purchased under the February 9, 2010 repurchase program. The repurchase program was completed as of May 31, 2010. |
| (3) | Represents the remaining approximate dollar amount of our issued and outstanding Common Stock that may yet be repurchased under the $30,000,000 repurchase program which was announced on June 16, 2010, which has no scheduled expiration date. This table does not reflect the repurchase of 34,400 shares, at a cost of approximately $811,000, of our Common Stock for which the trade date was on or prior to June 30, 2010, but for which the settlement date was after June 30, 2010. |
29
Table of Contents
| ITEM 6. | SELECTED FINANCIAL DATA |
The following table sets forth selected Consolidated Statement of Operations and Consolidated Balance Sheet data for the fiscal years ended June 30, 2010, 2009, 2008, 2007 and 2006. The selected financial data for each such fiscal year listed below has been derived from our consolidated financial statements for those years, which have been audited by Deloitte & Touche LLP, an independent registered public accounting firm, whose report for fiscal years 2010, 2009 and 2008 is included elsewhere herein. The following data for fiscal years 2010, 2009, and 2008 should be read in conjunction with “Management’s Discussion and Analysis of Financial Condition and Results of Operations” and with our Consolidated Financial Statements and the related notes and other financial information included herein.
| Fiscal Year Ended June 30, | ||||||||||||||||||||
| 2010 | 2009 | 2008 | 2007 | 2006 | ||||||||||||||||
| (in thousands, except per share amounts) | ||||||||||||||||||||
| Statement of Income Data: |
||||||||||||||||||||
| Revenues: |
||||||||||||||||||||
| Net sales |
||||||||||||||||||||
| Biomaterial sales |
$ | 52,096 | $ | 51,046 | $ | 47,539 | $ | 41,116 | $ | 36,699 | ||||||||||
| Endovascular sales |
2,180 | 3,858 | 6,222 | 3,786 | 1,179 | |||||||||||||||
| Total net sales |
54,276 | 54,904 | 53,761 | 44,902 | 37,878 | |||||||||||||||
| Royalty income |
26,371 | 27,177 | 26,030 | 24,592 | 22,519 | |||||||||||||||
| Total revenues |
80,647 | 82,081 | 79,791 | 69,494 | 60,397 | |||||||||||||||
| Operating costs and expenses: |
||||||||||||||||||||
| Cost of products sold |
23,507 | 24,194 | 27,212 | 24,622 | 20,645 | |||||||||||||||
| Research and development |
17,877 | 18,134 | 17,201 | 20,265 | 18,990 | |||||||||||||||
| Selling, general and administrative |
9,009 | 9,219 | 27,575 | 20,824 | 17,259 | |||||||||||||||
| Loss on sale of endovascular assets |
— | — | 1,212 | — | — | |||||||||||||||
| Total operating costs and expenses |
50,393 | 51,547 | 73,200 | 65,711 | 56,894 | |||||||||||||||
| Income from operations |
30,254 | 30,533 | 6,591 | 3,783 | 3,503 | |||||||||||||||
| Other income (expense): |
||||||||||||||||||||
| Interest income |
704 | 1,180 | 1,775 | 1,087 | 1,043 | |||||||||||||||
| Interest expense |
(2,087 | ) | (2,075 | ) | (1,540 | ) | (427 | ) | (71 | ) | ||||||||||
| Other (loss) income |
(19 | ) | 151 | (220 | ) | (23 | ) | 82 | ||||||||||||
| Total other (expense) income – net |
(1,402 | ) | (744 | ) | 15 | 637 | 1,054 | |||||||||||||
| Income before income tax expense |
28,852 | 29,789 | 6,606 | 4,420 | 4,557 | |||||||||||||||
| Income tax expense |
(9,388 | ) | (9,710 | ) | (1,816 | ) | (787 | ) | (838 | ) | ||||||||||
| Net income |
$ | 19,464 | $ | 20,079 | $ | 4,790 | $ | 3,633 | $ | 3,719 | ||||||||||
| Basic earnings per common share |
$ | 1.83 | $ | 1.74 | $ | 0.40 | $ | 0.31 | $ | 0.32 | ||||||||||
| Diluted earnings per common share |
$ | 1.78 | $ | 1.69 | $ | 0.38 | $ | 0.29 | $ | 0.30 | ||||||||||
| Weighted average common shares outstanding |
10,624 | 11,547 | 11,891 | 11,773 | 11,494 | |||||||||||||||
| Diluted weighted average common shares outstanding |
10,937 | 11,898 | 12,471 | 12,581 | 12,319 | |||||||||||||||
| June 30, | ||||||||||||||||||||
| 2010 | 2009 | 2008 | 2007 | 2006 | ||||||||||||||||
| (in thousands) | ||||||||||||||||||||
| Balance Sheet Data: |
||||||||||||||||||||
| Cash, cash equivalents and investments |
$ | 65,674 | $ | 79,704 | $ | 63,496 | $ | 34,331 | $ | 27,128 | ||||||||||
| Inventory |
8,886 | 10,585 | 9,271 | 7,392 | 7,198 | |||||||||||||||
| Working capital |
80,320 | 95,048 | 82,893 | 53,157 | 44,348 | |||||||||||||||
| Total assets |
154,121 | 171,090 | 162,429 | 140,525 | 130,191 | |||||||||||||||
| Long-term debt, net of current portion |
29,983 | 31,383 | 32,783 | 7,813 | 8,000 | |||||||||||||||
| Other long-term liabilities |
8,879 | 6,312 | 3,416 | 2,347 | 1,405 | |||||||||||||||
| Total stockholders’ equity |
104,823 | 123,275 | 114,570 | 123,650 | 113,192 | |||||||||||||||
30
Table of Contents
| ITEM 7. | MANAGEMENT’S DISCUSSION AND ANALYSIS OF FINANCIAL CONDITION AND RESULTS OF OPERATIONS |
The following discussion and analysis should be read in conjunction with “Selected Consolidated Financial Data” and our financial statements and the related notes included in this report.
This discussion and analysis below contains forward-looking statements relating to future events or our future financial performance. These statements are only predictions and actual events or results may differ materially. In evaluating such statements, you should carefully consider the various factors identified in this report which could cause actual results to differ materially from those expressed in, or implied by, any forward-looking statements, including those set forth in “Risk Factors” in this Annual Report on Form 10-K. See “—Cautionary Note Regarding Forward-Looking Statements.”
OVERVIEW
Kensey Nash Corporation is a medical device company primarily focused in the field of regenerative medicine, which is the application of devices, materials and other therapies to help repair damaged or diseased tissues. We are recognized as a leader for innovative product development, as well as for our broad portfolio of resorbable biomaterials products. We have an extensive range of products, which are sold through strategic partners in multiple large medical markets, including cardiology, orthopaedic, sports medicine, spinal and general surgery. We also have an ongoing development and manufacturing program for products in the endovascular market. We sell our products through strategic partners and do not sell direct to the end-user. Our revenues consist of two components: net sales, which include biomaterials sales and endovascular sales, and royalty income.
Net Sales
Biomaterials Sales
Sales of biomaterial orthopaedic products, including products with applications primarily in the sports medicine and spinal markets, and cardiovascular products, consisting primarily of Angio-Seal components sold to St. Jude Medical, continue to be our primary source of revenue. The table below shows the five-year trend in our biomaterials sales, including orthopaedic product sales, cardiovascular product sales and general surgery product sales:
| (in thousands) |
Fiscal Year Ended | %
change FY10 vs FY09 |
||||||||||||||||
| 6/30/06 | 6/30/07 | 6/30/08 | 6/30/09 | 6/30/10 | ||||||||||||||
| Net Sales of |
||||||||||||||||||
| Orthopaedic Products |
$ | 20,592 | $ | 21,804 | $ | 29,403 | $ | 29,790 | $ | 28,623 | (4 | %) | ||||||
| Cardiovascular Products |
14,931 | 17,632 | 15,861 | 18,334 | 19,326 | 5 | % | |||||||||||
| General Surgery Products |
699 | 1,102 | 1,304 | 2,102 | 3,650 | 74 | % | |||||||||||
| Other Products |
477 | 578 | 971 | 820 | 497 | (39 | %) | |||||||||||
| Total Net Sales – Biomaterials |
$ | 36,699 | $ | 41,116 | $ | 47,539 | $ | 51,046 | $ | 52,096 | 2 | % | ||||||
Net sales of biomaterials products increased 2% to $52.1 million in fiscal 2010 compared to $51.0 million in the prior fiscal year primarily due to an increase in general surgery, sports medicine and cardiovascular product sales. General surgery product sales increased due to the initial shipment of products for the launch of the XCM Biologic™ Tissue Matrix products and variations in ordering patterns from another customer. Fiscal 2009 cardiovascular product sales included a one-time cancellation fee of $781,000 for a research and development project. Partially offsetting the increase in sports medicine, general surgery and cardiovascular product sales was a decrease in spine product sales. The decline in sales of spine products was due to the overall weakness in the spinal market as well as Orthovita’s shift in sales’ focus in the past year away from our co-developed products. Additionally, in fiscal 2009, spine product sales included a one-time cancellation fee of $825,000 for a research and development project.
31
Table of Contents
In fiscal 2011, we expect to achieve double digit percentage growth in our sales of biomaterials products, excluding our cardiology products, as a result of the combination of new product launches of our ECM products in the U.S. and European markets, along with the launch of our cartilage repair device in Europe and overall growth in our core biomaterials business.
Our net sales in the orthopaedic portion of our business are dependent on several factors, including (1) the success of our current partners in the orthopaedic markets of sports medicine, spine and extremities, (2) the continued acceptance of biomaterials-based products in these markets, as well as expanded future acceptance of such products, (3) competitive pricing, and (4) our ability to offer new products and technologies and to attract new partners in these markets. Due to these dependencies, and other factors, sales to our orthopaedic customers can vary significantly from quarter to quarter.
As the primary part of our cardiovascular sales, we manufacture two of the key resorbable components of the Angio-Seal device for St. Jude Medical. Specifically, we currently supply 100% of their requirements for the collagen plug and at least 30% of their requirements for the polymer anchors under a supply agreement that expires in December 2010. Sales to St. Jude Medical are highly dependent on ordering patterns of components used in the manufacturing of the Angio-Seal device by St. Jude Medical and can vary significantly from quarter to quarter. In June 2010, we entered into a new two-year supply agreement with St. Jude Medical effective for the period from January 1, 2011 to December 31, 2012. Under the new supply agreement, we will be the exclusive outside supplier to St. Jude Medical of collagen plugs, and we will not supply any polymer anchors. The new supply agreement provides for calendar year 2011 minimum order levels equivalent to approximately 25% of our fiscal year 2010 collagen plug sales. As a result, if St. Jude Medical’s purchase levels are at the minimum levels under this new supply agreement, our related product sales in fiscal 2011 will be substantially lower than in fiscal 2010.
We also have developed and manufacture products used in the general surgery markets. These products primarily include products from our ECM program, as well as a resorbable collagen product for use in breast biopsies. In May 2010, we launched our new ECM product, the XCM Biologic™ Tissue Matrix, in the U.S. through our strategic partner Synthes, which represents an opportunity for expansion of our growth in the general surgery market. In June 2010, we announced a strategic distribution agreement of our ECM products with Arthrex for rotator cuff and other tendon repair procedures. Additionally, we received CE mark approval for our ECM technology in April 2010 and anticipate Synthes’ European launch of the product in the second quarter of our fiscal 2011.
Royalty Income
We also derive a significant portion of our revenue and profitability from royalty income from proprietary products that we have developed or co-developed.
Angio-SealTM Royalty Income. We are the inventor and original developer of the Angio-Seal device, a vascular closure device that reduces recovery time and enhances patient comfort following both diagnostic and therapeutic cardiovascular catheterizations. St. Jude Medical has the exclusive worldwide rights for the development, manufacturing and sales and marketing of the Angio-Seal device, pursuant to an agreement that provides us with an approximate 6% royalty on all end-user product sales. Royalty income under the Angio-Seal device license agreement is not affected by our new supply agreement with St. Jude Medical. We believe this is a mature market and anticipate that sales of the Angio-Seal device by St. Jude Medical are expected to be relatively flat in the upcoming years.
Vitoss™ Foam, Vitoss™, and Vitoss™ Bioactive Foam Royalty Income. Since 2003, we have partnered with Orthovita to co-develop and commercialize a series of unique and proprietary bone void filler products, branded VitossTM Foam, the first of which was launched in March 2004, and the most recent, VitossTM Bioactive Foam technology, which was launched during the fourth quarter of fiscal 2008. We receive a royalty on Orthovita’s end-user sales of VitossTM Foam and VitossTM Bioactive Foam products. In addition,
32
Table of Contents
in August 2004, we entered into an agreement to acquire the proprietary rights of a third party inventor of the VitossTM technology for $2.6 million (the Assignment Agreement). Under the Assignment Agreement, we receive an additional royalty from Orthovita on the end-user sales of all Orthovita products containing the VitossTM technology, up to a total royalty to be received of $4.0 million, with approximately $625,000 received in fiscal 2010 and $580,000 remaining to be received as of June 30, 2010. We expect the royalty income under the Assignment Agreement to come to an end during fiscal 2011. We believe the unique technology associated with the VitossTM Foam and VitossTM Bioactive Foam products, including product extensions, will result in the Orthovita component of our royalty income continuing to grow over the next fiscal year.
We have other royalty generating relationships, none of which materially contributes to revenue at this time, but which we expect to provide increased revenue as the related products gain market acceptance and additional products are commercialized.
Share-Based Compensation
The following table summarizes total share-based compensation expense within each operating expense category of our Consolidated Statements of Income for the fiscal years presented:
| Share-Based Compensation Fiscal Year Ended June 30, | |||||||||||||||
| 2010 | 2009 | 2008 | |||||||||||||
| Total Share-Based Compensation |
Total Share-Based Compensation |
Pre-Acceleration Share-Based Compensation |
Acceleration of Share-Based Compensation Charge (1) |
Total Share-Based Compensation | |||||||||||
| Cost of products sold |
$ | 806,073 | $ | 504,552 | $ | 353,599 | $ | 251,732 | $ | 605,331 | |||||
| Research and development |
1,343,954 | 741,357 | 831,556 | 834,682 | 1,666,238 | ||||||||||
| Selling, general and administrative |
1,234,996 | 816,548 | 1,163,967 | 1,887,619 | 3,051,586 | ||||||||||
| Total Share-Based Compensation Expense |
$ | 3,385,023 | $ | 2,062,457 | $ | 2,349,122 | $ | 2,974,033 | $ | 5,323,155 | |||||
| (1) | See “Acceleration of Stock Awards” below. |
Share-based compensation expense consists of (a) stock options granted to employees, non-employee members of our Board of Directors, executive officers and non-employee outside consultants, (b) nonvested stock awards (i.e., restricted stock) granted to non-employee members of our Board of Directors, an executive officer and a non-employee outside consultant, and (c) cash-settled stock appreciation rights (SARs) granted to executive officers and other non-executive employees of our Company. We cannot predict the market value of our Common Stock at the time of exercise for these grants, nor the magnitude of exercises at any particular time over the terms of these grants. Our cash-settled SARs, which are classified as liability awards, have been, and will continue to be, remeasured at each reporting period until all awards are settled. Fluctuations in the fair value of a liability award are recorded as increases or decreases in compensation cost, either immediately or over the remaining service period, depending on the vesting status of the award.
Total share-based compensation expense for fiscal 2010 increased in relation to the corresponding period of the prior year, primarily due to the amortized expense related to three years of equity grants versus two years of equity grants. Additionally, fiscal 2009 had higher favorable adjustments in the fair value of our cash-settled SARs than fiscal 2010, which were remeasured based on, among other factors, our closing stock price on June 30, 2010 and 2009. See Note 12 to the Consolidated Financial Statements included in this Form 10-K for additional information concerning our share-based compensation.
33
Table of Contents
Acceleration of Stock Awards
As we publicly announced on September 26, 2007, there was a “Change in Control” as defined in our Fifth Amended and Restated Kensey Nash Corporation Employee Incentive Compensation Plan (the Kensey Nash Corporation Employee Incentive Compensation Plan, as amended through the relevant date, the “Employee Plan”), due to the purchase in the open market by an institutional investor of more than 20% of our shares of outstanding stock. As a result, all then outstanding unvested stock options, stock appreciation rights and nonvested stock held by officers, employees, directors and others under the Employee Plan automatically became vested (and, in the case of options and stock appreciation rights, exercisable) in full. The accelerated vesting resulted in a non-cash charge of approximately $3.0 million primarily during the quarter ended September 30, 2007 of fiscal 2008. The charge represented a significant portion of our operating expenses in fiscal 2008, and, therefore, we have disclosed in the table above under “Share-Based Compensation” the amount related to the acceleration of share-based compensation charges included within each operating expense category of our income statement for the fiscal year ended June 30, 2008. The acceleration removed all future equity compensation expense related to the then outstanding stock options and nonvested shares under the plan as of the date of acceleration. However, all remaining cash-settled SARs, including the rights in which the vesting was accelerated, continue to be marked-to-market on a quarterly basis and equity compensation expense is incurred with respect to all new stock compensation awards granted after this event. See Note 12 to the Consolidated Financial Statements included in this Form 10-K for a discussion of our purchase of a substantial majority of our SARs.
The following table summarizes our share-based compensation expense, by fiscal year grant, for our fiscal years ended June 30, 2010, 2009 and 2008.
| Fiscal Year Ended June 30, | |||||||||||||
| 2010 | 2009 | 2008 | |||||||||||
| SARS |
$ | (163,928 | ) | $ | (390,503 | ) | $ | 940,993 | |||||
| Stock Options |
|||||||||||||
| Fiscal Year 2005 Grant |
$ | — | $ | — | $ | 2,422 | |||||||
| Fiscal Year 2006 Grant |
— | — | 103,835 | ||||||||||
| Fiscal Year 2007 Grant |
— | — | 9,347 | ||||||||||
| Fiscal Year 2008 Grant |
787,462 | 940,746 | 865,775 | ||||||||||
| Fiscal Year 2009 Grant |
1,214,237 | 998,584 | — | ||||||||||
| Fiscal Year 2010 Grant |
948,092 | — | — | ||||||||||
| Other Share-Based Compensation Adjustment |
61,908 | — | — | ||||||||||
| $ | 3,011,699 | $ | 1,939,330 | $ | 981,379 | ||||||||
| Nonvested Stock Awards |
|||||||||||||
| Fiscal Year 2005 Grant |
$ | — | $ | — | $ | 36,328 | |||||||
| Fiscal Year 2006 Grant |
— | — | 160,873 | ||||||||||
| Fiscal Year 2007 Grant |
— | — | 34,569 | ||||||||||
| Fiscal Year 2008 Grant |
201,556 | 336,963 | 194,980 | ||||||||||
| Fiscal Year 2009 Grant |
231,311 | 176,667 | — | ||||||||||
| Fiscal Year 2010 Grant |
104,385 | — | — | ||||||||||
| $ | 537,252 | $ | 513,630 | $ | 426,750 | ||||||||
| Total Acceleration Charge of Stock-Based Awards (a) |
$ | — | $ | — | $ | 2,974,033 | |||||||
| Total Share-Based Compensation Expense |
$ | 3,385,023 | $ | 2,062,457 | $ | 5,323,155 | |||||||
(a) See “Acceleration of Stock Awards” above.
In fiscal 2011, we expect an increase of approximately $800,000 in share-based compensation expense over the $3.4 million recorded in fiscal 2010. This increase is primarily a result of our fiscal 2011 stock option expense
34
Table of Contents
reflecting amortized expense related to 36 months of equity grants, whereas fiscal 2010 amortized expense related to 33 months of equity grants, as well as additional expense relating to unfavorable mark-to-market adjustments on cash-settled SARs. Our share-based compensation expense is derived using the Black-Scholes option-pricing valuation model, which is dependent on several factors, such as weighted average assumptions, stock volatilities, employee termination behavior and other factors that differ each fiscal year. The expense may vary significantly if there is a change in any one of these valuation assumptions.
Cost Reduction Plan
In the second quarter of fiscal 2010, we implemented a cost reduction plan, primarily associated with our reduced endovascular activities and lower production volume. This cost reduction plan was comprised of headcount reductions, primarily through a voluntary retirement program, as well as reduced work schedules. In connection with this plan, we incurred $1.9 million in pre-tax charges in our second quarter of fiscal 2010 consisting of a $1.0 million pre-tax severance charge and a $944,000 pre-tax unabsorbed overhead expense charge.
The following table summarizes the cost reduction plan pre-tax charges within each operating expense category of our Consolidated Statements of Income for fiscal 2010:
| Fiscal Year Ended June 30, 2010 | |||||||||
| Severance Charge |
Unabsorbed Overhead Expense Charge |
Total Cost Reduction Plan Charges | |||||||
| Cost of products sold |
$ | 404,474 | $ | 943,666 | $ | 1,348,140 | |||
| Research and development |
535,640 | — | 535,640 | ||||||
| Selling, general and administrative |
70,944 | — | 70,944 | ||||||
| Total Cost Reduction Plan Charges |
$ | 1,011,058 | $ | 943,666 | $ | 1,954,724 | |||
Property Insurance Claim
In fiscal 2010, a fire occurred which was contained to a small manufacturing area within the Company’s corporate headquarters building. The Company’s property insurance policy covered all remediation efforts and fixed asset replacements, subject to a $25,000 deductible. We recognized a gain of $775,000 within cost of products sold upon final settlement with the insurance carrier as remediation and recovery efforts were completed. We received $1.3 million in total insurance proceeds for remediation efforts, replacement value of fixed assets and other expenses. We have replaced damaged fixed assets with a total value of approximately $480,000. The remaining insurance proceeds were used by the Company to pay for other related expenses and added to general Company funds. The total insurance proceeds, including amounts relating to the outside remediation services and fixed assets, have been classified within the investing activities section of the Consolidated Statement of Cash Flows, and the balance of the insurance proceeds, used by the Company to pay for other related expenses, has been classified within the operating activities section of the Consolidated Statement of Cash Flows.
CRITICAL ACCOUNTING POLICIES
Our critical accounting policies are those that require application of management’s most difficult, subjective or complex judgments, often as a result of the need to make estimates about matters that are inherently uncertain and may change in future periods. We have identified the following as our critical accounting policies: revenue recognition, accounting for share-based compensation, accounting for investments in debt and equity securities, valuation of financial instruments, inventory valuation and income taxes.
Revenue Recognition. We recognize revenue in accordance with FASB ASC Topic 605, “Revenue Recognition” (ASC 605-10-S99). We also follow FASB ASC Subtopic 605-25, “Multiple Element Arrangements” (ASC
35
Table of Contents
605-25) for customer arrangements containing multiple revenue elements that were entered into, or materially amended, after June 30, 2003.
Sales Revenue. Sales revenue is generally recognized when the related product is shipped or the service is completed. Advance payments received for products or services are generally recorded as deferred revenue and are recognized when the product is shipped or services are performed; the timing of the performance of such services could be subjective. We reduce sales for estimated customer returns and other allowances, if applicable. Our products are primarily manufactured according to our customers’ specifications and are subject to return only for failure to meet those specifications.
Royalty Revenue. Royalty revenue is recognized as the related product is sold by our customers to end-users. We recognize substantially all of our royalty revenue at the end of each month, in accordance with our customer agreements. See Note 1 to the Consolidated Financial Statements included in this Form 10-K for additional information concerning our royalty revenue recognition.
Accounting for Share-Based Compensation. We use various forms of equity compensation, including stock options, nonvested stock awards and cash-settled SARs, as a major part of our compensation programs to retain and provide incentives to our top management team members and other employees. We account for equity compensation in accordance with FASB ASC Topic 718, “Compensation — Stock Compensation.” Revisions to any of our estimates or methodologies could have a material impact to our financial statements.
| • | Fair value of option grants is estimated on the date of grant using the Black-Scholes option-pricing model, which uses weighted average assumptions. Expected volatilities are based on historical volatility of our Common Stock and other factors. We use historical data to estimate option exercise and employee termination behavior within the valuation model. We separate groups of employees that have similar historical exercise behavior and consider them separately for valuation purposes. The expected term of options is derived from historical exercise behavior and represents the period of time that options granted are expected to be outstanding. The risk-free rate for periods within the contractual life of the option is based on U.S. treasuries with constant maturities in effect at the time of grant. |
| • | Nonvested stock awards (i.e. restricted stock) granted to non-employee members of our Board of Directors, executive officers and a non-employee consultant are accounted for using the fair value method. Fair value for nonvested stock awards is based upon the closing price of our Common Stock on the date of the grant. |
| • | Cash-settled SARs awarded in share-based payment transactions are classified as liability awards; accordingly, we record these awards as a component of Other current liabilities on our Consolidated Balance Sheets. The fair value of each SAR is estimated using the Black-Scholes option-pricing model, which uses weighted average assumptions. Expected volatilities are based on the historical volatility of our Common Stock, as well as other factors. For liability awards, the fair value of the award, which determines the measurement of the liability on our Consolidated Balance Sheet, is remeasured at each reporting period until the award is settled. Fluctuations in the fair value of the liability award are recorded as increases or decreases in compensation cost, either immediately or over the remaining service period, depending on the vested status of the award. We use historical data to estimate employee termination within the valuation model; employees that have similar historical exercise behavior are considered separately for valuation purposes. The expected term of cash-settled SARs has been determined using the simplified method in accordance with ASC 718-10-S99. |
Accounting for Investments in Debt Securities. We account for our investment portfolio in accordance with FASB ASC Topic 320, “Investments — Debt and Equity Securities.” We have classified our entire investment portfolio as available-for-sale securities with secondary or resale markets and report the portfolio at fair value, with unrealized gains and losses included in Stockholders’ equity and realized gains and losses in Other income. We currently have various investment securities with fair values that are less than their amortized costs and, therefore, contain unrealized losses. The unrealized losses related to these investments were due to either changes in interest rates or investments obtained at a premium. We have evaluated these securities and have determined
36
Table of Contents
that the decline in value is not related to any Company or industry specific event. We have no intent to sell any of these investments until there is a recovery of the fair value, and there is no current requirement that we sell any of these investments. We anticipate full recovery of amortized costs with respect to these securities at maturity or sooner in the event of a more favorable market interest rate environment. Revisions to our classification of these investments, and/or a determination other than the anticipation of a full recovery of the amortized costs at maturity or sooner, could result in our realizing gains and losses on these investments and, therefore, have a material impact on our financial statements.
Valuation of Financial Instruments. We adopted the provisions of FASB ASC Topic 820, “Fair Value Measurements and Disclosures,” (ASC 820) for financial assets and liabilities, which provides guidance for using fair value to measure financial assets and liabilities by defining fair value as the exit price, or the amount that would be received from selling an asset or paid to transfer a liability in an orderly transaction between market participants as of the measurement date. Categorization is based on a three-tier valuation hierarchy, which prioritizes the inputs used in measuring fair value. Our assessment of the significance of a particular input to the fair value measurement requires judgment and may affect the valuation of financial assets and financial liabilities and their placement within the fair value hierarchy. See Note 9 to the Consolidated Financial Statements included in this Form 10-K for further discussion regarding the fair value of financial assets and liabilities.
Inventory Valuation. Our inventory is stated at the lower of cost or market. Adjustments to inventory are made at the individual part level for estimated excess, obsolescence or impaired balances, to reflect inventory at the lower of cost or market. Factors influencing these adjustments include changes in demand, technological changes, product life cycle and development plans, component cost trends, product pricing, physical deterioration and quality concerns. Revisions to these adjustments would be required if any of these factors differ from our estimates.
Income Taxes. In the course of estimating our estimated annual effective tax rate and recording our quarterly income tax provisions, we consider many factors, including our expected earnings, state income tax apportionment, estimated manufacturing and research and development tax credits, non-taxable interest income and other estimates. Material changes in, or differences from, these estimates, including the extension of the research and development tax credit, could have a significant impact on our effective tax rate.
RESULTS OF OPERATIONS
Comparison of Fiscal Years 2010 and 2009
Total Revenues. Total revenues of $80.6 million in fiscal 2010 decreased 2% from total revenues of $82.1 million in fiscal 2009.
Total Net Sales. Net sales of products decreased 1% to $54.3 million for fiscal 2010, compared to net sales of $54.9 million for fiscal 2009. We had a $1.1 million, or 2%, increase in our biomaterials sales and a $1.7 million, or 43%, decrease in our endovascular sales.
Biomaterials Sales. Biomaterials sales were $52.1 million in fiscal 2010, a 2% increase compared to $51.0 million in fiscal 2009. Biomaterials sales include revenue recognized from products shipped, as well as revenue generated from product development programs with, and milestone revenue earned from, biomaterials customers.
The biomaterials sales increase was primarily due to our cardiovascular and general surgery product lines. Cardiovascular product sales, primarily consisting of sales of Angio-Seal components to St. Jude Medical, of $19.3 million in fiscal 2010 increased $1.0 million, or 5%, from $18.3 million in fiscal 2009 due to favorable variations in ordering patterns of components used in the manufacture of the Angio-Seal device by St. Jude Medical. Cardiovascular product sales in fiscal 2009 included a cancellation fee charged to a customer of approximately $800,000 for cardiovascular product-related research and development work we performed. Also contributing to the increase in biomaterials sales
37
Table of Contents
was our continued growth in general surgery product sales, which were $3.6 million for fiscal 2010, an increase of $1.5 million, or 74%, from $2.1 million in fiscal 2009. This increase was due to initial shipments to Synthes related to the U.S. launch of our new ECM product, the XCM Biologic™ Tissue Matrix, as well as due to the timing of increased orders of collagen product sales to a customer for use in breast biopsies.
These increases in product sales were offset in part by a decrease in orthopaedic product sales. Orthopaedic product sales, consisting primarily of sports medicine and spine products, were $28.6 million for fiscal 2010, a decrease of $1.2 million, or 4%, from $29.8 million in fiscal 2009. Sales of spine products decreased $2.1 million, or 16%, to $11.6 million in fiscal 2010 from $13.7 million in fiscal 2009. The decline in sales of spine products was due to the overall weakness in the spinal market, as well as Orthovita’s shift in sales focus in the past year away from our co-developed products. Additionally, in fiscal 2009, spine product sales included a one-time cancellation fee of $825,000 charged to a customer for research and development work performed. This decrease in spine products was offset by an increase in our sports medicine product sales of $980,000, or 6%, to $16.4 million in fiscal 2010 from $15.5 million in fiscal 2009, which was due primarily to favorable variations in ordering patterns.
Endovascular Sales. Endovascular sales were $2.2 million in fiscal 2010, a 43% decrease compared to sales of $3.9 million in fiscal 2009. Endovascular sales include revenue recognized from products shipped to, as well as milestone revenue recognized from product development programs with, Spectranetics.
The endovascular sales decrease was primarily due to a decrease in Safe-Cross and QuickCat product sales. Our second quarter of fiscal 2010 ended December 31, 2009 was the last quarter reflecting our sales of the QuickCat device, as the QuickCat manufacturing was transferred to Spectranetics as of December 2009. Further, Spectranetics publicly announced the discontinuation of sales of the Safe-Cross product line in the second quarter of fiscal 2010. In fiscal 2010, we recognized revenue of $577,000 as compared to $625,000 in fiscal 2009 for two milestones achieved in that year under our Development and Regulatory Service Agreement with Spectranetics.
Royalty Income. Royalty income decreased 3% to $26.4 million in fiscal 2010 from $27.2 million in fiscal 2009.
Royalty income of $20.3 million from St. Jude Medical’s Angio-Seal net end-user sales in fiscal 2010 decreased 4% from $21.2 million in fiscal 2009, primarily due to fewer shipping days in fiscal 2010 compared to fiscal 2009, in combination with product mix changes and the effects of foreign currency exchange rate fluctuations in fiscal 2010. End-user sales of the Angio-Seal device decreased 4% in fiscal 2010 over the prior fiscal year.
Royalty income of $5.8 million from Orthovita’s Vitoss™, Vitoss™ Foam and Vitoss™ Bioactive Foam products net end-user sales in fiscal 2010 were consistent with fiscal 2009. End-user sales of our co-developed Vitoss™ Foam and Vitoss™ Bioactive Foam products increased 4% in fiscal 2010 from the prior fiscal year.
Cost of Products Sold.
| Fiscal Year 6/30/10 |
Fiscal Year 6/30/09 |
% Change Prior Period to Current Period | ||||
| Cost of products sold |
$23,507,351 | $24,193,941 | (3%) | |||
| Gross Margin on Net Sales |
57% | 56% |
38
Table of Contents
Cost of products sold was $23.5 million in fiscal 2010, a $687,000, or 3%, decrease from $24.2 million in fiscal 2009. Gross margin on net sales was 57% and 56% for fiscal 2010 and fiscal 2009, respectively. The decrease in cost of products sold was a result of our recognition of $775,000 in net gain from property insurance proceeds for a claim under our property insurance policy, as well as, a $600,000 reduction in expense for a provision to upgrade the Safe-Cross product that was no longer necessary due to the cancellation of the Safe-Cross product line by Spectranetics. Further contributing to the reduction of cost of products sold was the $1.0 million decrease in net sales, excluding net milestone revenue recognized of $1.0 million in fiscal 2010 and $625,000 in fiscal 2009. Offsetting these decreases within cost of products sold for fiscal 2010, as a result of the fiscal 2010 second quarter cost reduction plan, was $944,000 in unabsorbed overhead charges due to reduced work schedules during the quarter and $404,000 in severance charges. We believe gross margin on net sales for fiscal 2011 will decrease slightly as compared to fiscal 2010 due to product mix changes, primarily relating to introduction of new product lines and the expected reduction of sales of Angio-Seal components.
Research and Development Expense.
| Fiscal Year 6/30/10 |
Fiscal Year 6/30/09 |
% Change Prior Period to Current Period | ||||
| Research & Development |
$17,876,748 | $18,134,442 | (1%) | |||
| Research & Development as a % of Revenue |
22% | 22% |
Research and development expense was $17.9 million in fiscal 2010, a $258,000, or 1%, decrease from $18.1 million in fiscal 2009. The decrease in research and development expense was due to a $352,000 decrease in animal studies and outside services costs, a $275,000 decrease in design, development and supply expenses, a $233,000 decrease in engineering consulting costs and $197,000 decrease in expenses due to a charge incurred in the prior fiscal year in connection with a customer cancellation of research and development projects. Offsetting these decreases within research and development expense for fiscal 2010, as a result of the previously disclosed fiscal 2010 second quarter cost reduction plan, was $536,000 in severance charges that increased research and development expense. Additionally, there was an increase in personnel costs, including salaries and equity compensation expense, of $239,000.
Research and development expense was 22% of our revenue in both fiscal 2010 and fiscal 2009. We believe research and development expense in fiscal 2011 will increase as compared to fiscal 2010, primarily as a result of our plans to increase our clinical activities in our cartilage and ECM technologies both in the U.S. and in Europe. We recently received FDA approval to initiate our U.S. pilot trial for our cartilage repair device, and we expect to begin this trial in the first half of fiscal 2011. Clinical efforts in pursuit of FDA approval and continuing development of the cartilage repair device application, as well as our continued development of proprietary biomaterials products and technologies, require significant research and development expenditures. We cannot make any assurances as to the successful completion of these studies or subsequent regulatory approval for the cartilage repair product application or for future applications in the U.S. or internationally.
Selling, General and Administrative Expense.
| Fiscal Year 6/30/10 |
Fiscal Year 6/30/09 |
% Change Prior Period to Current Period | ||||
| Selling, General and Administrative |
$9,009,329 | $9,219,001 | (2%) | |||
| Selling, General and Administrative as a % of Revenue |
11% | 11% |
39
Table of Contents
Selling, general and administrative expense was $9.0 million in fiscal 2010, a $210,000, or 2%, decrease from $9.2 million in fiscal 2009. Selling, general and administrative expense decreased from the prior fiscal year primarily as a result of reduced professional fees of $360,000, partially offset by $71,000 in severance charges, as a result of the previously disclosed fiscal 2010 second quarter cost reduction plan.
Selling, general and administrative expenses were 11% of our revenue for each of the fiscal years ended 2010 and 2009, respectively. We believe selling, general and administrative expenditures in total as a percentage of revenue will remain consistent in fiscal 2011 with fiscal 2010.
Interest Income & Interest Expense. Interest income decreased by 40% to $704,000 in fiscal 2010 from $1.2 million in fiscal 2009. This decrease was due to significant decreases in interest rates earned on our average cash and investment balances during the fiscal year ended June 30, 2010 over the prior fiscal year.
Interest expense on our Mortgage during fiscal 2010 was essentially flat at $2.1 million compared to the prior year. We have borrowed $35 million under the Mortgage with Citibank, F.S.B., which the outstanding principal balance was $31.4 million as of June 30, 2010. The Mortgage is hedged by a fixed interest rate Swap bearing interest of 6.44%. See Note 8 to the Consolidated Financial Statements included in this Form 10-K for additional information concerning the Mortgage and the Swap.
Other Income/Loss. Other non-operating loss was $19,000 in fiscal 2010, a decrease of $170,000, from non-operating income of $151,000 in fiscal 2009. Other non-operating loss in fiscal 2010 primarily represents non-operating items, including loss on foreign currency exchange. Other non-operating income for fiscal 2009 primarily represents non-operating items, including the $134,000 of deferred revenue recognized as a component of Other income, as a result of the August 2008 final settlement of outstanding items related to our Opportunity Grant Program of the Department of Community and Economic Development of the Commonwealth of Pennsylvania Governor’s Action Team and net gain/loss on foreign currency exchange. There was no remaining deferred revenue from the Opportunity Grant Program as of June 30, 2009.
Income Tax Expense. Our tax expense in fiscal 2010 was $9.4 million, resulting in an effective tax rate of approximately 33%. We could only claim research and development tax credits through December 31, 2009 as a component of our 2010 tax provision related to our ongoing performance of qualified research and development under the previously approved October 2008 Congressional extension of the Research & Experimentation (R&E) Tax Credit. Our fiscal 2009 effective tax rate of 33% included a retroactive adjustment to our tax provision during our second fiscal quarter ended December 31, 2008 as a result of the October 2008 extension of the R&E Tax Credit. See Note 16 to the Consolidated Financial Statements included in this Form 10-K for additional information concerning our effective tax rate.
RESULTS OF OPERATIONS
Comparison of Fiscal Years 2009 and 2008
Total Revenues. Total revenues increased 3% to $82.1 million in fiscal 2009 from $79.8 million in fiscal 2008.
Total Net Sales. Net sales of products increased 2% to $54.9 million for fiscal 2009 compared to net sales of $53.8 million for fiscal 2008. We had a $3.5 million, or 7%, increase in our biomaterials sales, offset by a $2.4 million, or 38%, decrease in our endovascular sales.
Biomaterials Sales. Biomaterials sales were $51.0 million in fiscal 2009, a 7% increase compared to $47.5 million in fiscal 2008. Biomaterials sales includes revenue recognized from products shipped as well as revenue generated from product development programs with biomaterials customers. The increase in biomaterials sales was primarily the result of strong sales in both the cardiovascular and orthopaedic product lines. Cardiovascular product sales, primarily consisting of sales of Angio-Seal components to St. Jude Medical, were $18.3 million in fiscal 2009, a 16% increase compared to $15.9
40
Table of Contents
million in fiscal 2008. Fiscal 2009 cardiovascular revenue included a cancellation fee charged to a customer of approximately $800,000 for cardiovascular product-related research and development work we performed.
Orthopaedic sales were $29.8 million in fiscal 2009, a 1% increase compared to $29.4 million in fiscal 2008. The orthopaedic product sales increase was primarily the result of an increase in spine products sales by 6% to $13.7 million in fiscal 2009, from $12.9 million in fiscal 2008. The increase in sales of spine products was primarily attributable to strong sales of current and new product lines to Orthovita, and cancellation fees charged to a customer for research and development work performed, offset, in part by weaker sales of our bone void filler products based on customer inventory levels and what we believe to be increased competition in this market. Sports medicine product sales of $15.5 million decreased by 1% from $15.6 million in fiscal 2008. Sports medicine product sales in fiscal 2009 were positively impacted due to new product launches and stronger sales of existing products, but were offset by exceptionally high orders in the fourth quarter of fiscal 2008 from two major customers and current economic conditions, which negatively impacted customer inventory levels.
Endovascular Sales. Endovascular sales were $3.9 million in fiscal 2009, a 38% decrease compared to sales of $6.2 million in fiscal 2008. Endovascular sales include revenue recognized from products shipped, as well as milestone revenue recognized from product development programs with Spectranetics. During fiscal 2009, endovascular product sales to Spectranetics were at a reduced transfer price compared to the direct to market price reflected in our prior sales figures. The decrease in endovascular sales in fiscal 2009 from fiscal 2008 was a direct result of this reduced transfer price, as overall net unit sales to Spectranetics increased as compared to fiscal 2008 end-user unit sales. During fiscal 2009, we announced the accomplishment of two milestones under our Development and Regulatory Service Agreement with Spectranetics, which resulted in $2.5 million of cash payments and our recognition of $625,000 in revenue.
Royalty Income. Royalty income increased 4% to $27.2 million in fiscal 2009 from $26.0 million in fiscal 2008.
Angio-Seal royalty income from St. Jude Medical end-user sales of $21.2 million decreased 1% compared to $21.4 million in fiscal 2008. We estimate that Angio-Seal royalties for fiscal 2009 were negatively impacted due to foreign currency exchange by approximately $600,000 compared to fiscal 2008. Despite the negative impact of foreign currency exchange, St. Jude Medical’s end-user sales of the Angio-Seal device, which included the negative impact of foreign currency exchange, only declined by 1% in fiscal 2009 from the prior fiscal year.
Royalty income from net end-user sales of Orthovita’s Vitoss, Vitoss Foam and Vitoss Bioactive Foam products in fiscal 2009 of $5.8 million increased 31% compared to $4.4 million in fiscal 2008. End- user sales of our co-developed Vitoss Foam and Vitoss Bioactive Foam products increased 38% in fiscal 2009 compared to fiscal 2008. The successful introduction of the new Vitoss Bioactive Foam products, as well as continued sales of existing Vitoss Foam products by Orthovita in the end-user marketplace, contributed to the increase in royalty income.
Cost of Products Sold.
|
Fiscal Year 6/30/09 |
Fiscal Year 6/30/08 |
% Change Prior Period to Current Period | ||||
| Cost of products sold |
$24,193,941 | $27,211,681 | (11%) | |||
| Gross Margin on Net Sales |
56% | 49% |
Cost of products sold was $24.2 million in fiscal 2009, a $3.0 million, or 11%, decrease from $27.2 million in fiscal 2008. The decrease in cost of products sold for the period was primarily related to (i) prior year charges of
41
Table of Contents
$2.0 million for the sale of our Endovascular business to Spectranetics, (ii) prior year charges of $252,000 for the acceleration of share-based awards, (iii) prior year charges of $155,000 for the discontinuance of the embolic protection platform, which were included within cost of products sold in the prior fiscal year and not applicable to fiscal 2009, and (iv) start-up costs associated with the new Safe-Cross product line in fiscal 2008 that did not recur in fiscal 2009, offset by a $1.1 million increase in total net sales.
Gross margin on net sales in fiscal 2009 was 56% compared to gross margin on net sales of 49% in fiscal 2008. The increase in gross margin in fiscal 2009 compared to the prior fiscal year was due in part to product mix, as well as higher volumes, process improvements and revenue generated from product development programs with biomaterials customers and the decrease in costs of products sold discussed above. The gross margin in the same period of the prior fiscal year was negatively affected by start-up costs associated with the Safe-Cross product line, as we initiated and continued to refine the manufacturing process on this new product line. Also negatively impacting the gross margin in the prior fiscal year by approximately 5% were the charges related to the sale of our endovascular division, the acceleration of share-based awards and the discontinuance of the embolic protection platform.
Research and Development Expense.
|
Fiscal Year 6/30/09 |
Fiscal Year 6/30/08 |
% Change Prior Period to Current Period | ||||
|
Research & Development |
$18,134,442 | $17,200,762 | 5% | |||
|
Research & Development |
22% | 22% |
Research and development expense was $18.1 million in fiscal 2009, a $934,000, or 5%, increase from $17.2 million in fiscal 2008. The increase in research and development expense for the period over the prior fiscal year was due to (i) a $1.3 million increase in our biomaterials research and development expenses primarily due to design and development expenses related to the commencement of, and increased focus in, our articular cartilage regeneration matrix and ECM projects and expenses incurred in connection with a customer cancellation of research and development projects and (ii) a $471,000 increase in our personnel costs, primarily related to an increase in share-based equity compensation costs. These increases are offset by an $835,000 charge incurred for the acceleration of share-based awards in the prior fiscal year, which was not applicable to fiscal 2009. During fiscal 2009, we furthered our cartilage preclinical studies in preparation for a U.S. clinical trial and, in February 2009, filed an IDE submission for a cartilage U.S. clinical trial. Research and development expenses were 22% of our total revenues for each of the fiscal years ended 2009 and 2008.
Selling, General and Administrative Expense.
|
Fiscal Year 6/30/09 |
Fiscal Year 6/30/08 |
% Change Prior Period to Current Period | ||||
|
Selling, General and Administrative |
$9,219,001 | $27,575,105 | (67%) | |||
|
Selling, General and Administrative as a % of Revenue |
11% | 35% |
Selling, general and administrative expense was $9.2 million in fiscal 2009, an $18.4 million, or 67% decrease from $27.6 million in fiscal 2008. The decrease in selling, general and administrative expense from the prior fiscal year was due to (i) a $14.1 million decrease in our sales and marketing efforts, primarily due to the
42
Table of Contents
elimination of our direct sales and marketing efforts for our endovascular products after the sale of these product lines to Spectranetics in May 2008, (ii) a $2.3 million decrease in our share-based equity compensation costs, primarily due to a charge of $1.9 million incurred for the acceleration of share-based awards in the prior year which was not applicable to fiscal 2009, (iii) an approximate $76,000 decrease due to the charge incurred in the prior year related to the discontinuance of the embolic protection platform, which was not applicable to fiscal 2009 and (iv) a charge of $2.5 million incurred for the sale of our Endovascular business to Spectranetics in May 2008, which was not applicable to fiscal 2009. All of these decreases were partially offset by a $478,000 aggregate increase in professional fees, including legal, audit and tax fees, and our Board of Director fees. Selling, general and administrative expenses were 11% and 35% of our total revenues for each of the fiscal years ended 2009 and 2008, respectively.
Interest Income & Interest Expense. Interest income decreased by 34% to $1.2 million in fiscal 2009 from $1.8 million for fiscal 2008. This decrease was due primarily to lower interest rates, partially offset by an increase of 46% in our average cash and investment balance during the fiscal year ended June 30, 2009 over the prior fiscal year.
Interest expense on our Mortgage during fiscal 2009 was $2.1 million compared to $1.5 million during the prior year. In November 2007, we borrowed the remaining $27.0 million available under the Mortgage with Citibank, F.S.B., increasing our outstanding balance to $35 million. The Mortgage is hedged by a fixed interest rate Swap bearing interest of 6.44%. The Mortgage balance was $32.8 million as of June 30, 2009.
Other Income/Loss. Other non-operating income was $151,000 in fiscal 2009, a fluctuation of $371,000 from a non-operating loss of $220,000 for fiscal 2008. This non-operating income for fiscal 2009 was due to final settlement of outstanding items related to our Opportunity Grant Program of the Department of Community and Economic Development of the Commonwealth of Pennsylvania Governor’s Action Team. The non-operating loss for fiscal 2008 represented non-operating items, including gain/loss on foreign currency exchange, gain/loss on sales of assets and the loss from the sale of our mutual fund investment, offset by gains from the sale of selected municipal obligations.
Income Tax Expense. Our tax expense in fiscal 2009 was $9.7 million, resulting in an effective tax rate of approximately 33%. Our fiscal 2008 effective tax rate was 27%. As a result of the October 2008 Congressional approval of an extension of the R&E Tax Credit, we recorded a retroactive adjustment to our tax provision during our second fiscal quarter ended December 31, 2008, which reduced our effective tax rate for fiscal 2009 to 33%.
LIQUIDITY AND CAPITAL RESOURCES
Our cash, cash equivalents and investments were $65.7 million as of June 30, 2010, a decrease of $14.0 million from our balance of $79.7 million at June 30, 2009, the end of our prior fiscal year. Our working capital was $80.3 million as of June 30, 2010, a decrease of $14.7 million from our working capital of $95.0 million at June 30, 2009.
Cash Flows
Operating Activities
Net cash provided by our operating activities was $30.1 million in the fiscal year ended June 30, 2010. For the fiscal year ended June 30, 2010, we had net income of $19.5 million, non-cash depreciation and amortization of $7.3 million, and the net effect of non-cash employee share-based compensation and related tax events of $3.4 million. The increases in cash were offset in part by a net change in deferred income taxes of $1.2 million, which was primarily the result of the change in our non-current deferred tax assets. The increases in cash provided by our operating activities were further offset by $1.0 million related to our gain from a property insurance claim and related expenses. Cash provided by operations as a result of changes in
43
Table of Contents
asset and liability balances was $2.1 million. This increase in cash was primarily a result of a decrease in our inventory balances of $1.7 million, primarily associated with our lower production volume as anticipated from our second quarter cost reduction plan, and an increase in deferred revenue of approximately $1.1 million related to the receipt of milestone payments from research and development and manufacturing agreements with customers. Offsetting these increases was a decrease in accounts payable and accrued expenses of $303,000, related to endovascular transaction exit costs. Also reducing cash provided by operations was an increase in our receivable balances of $174,000 and an increase in prepaid expenses and other assets of $191,000.
Investing Activities
Cash used in investing activities was $14.7 million for the fiscal year ended June 30, 2010. This use of cash was primarily the result of net investment activity of $13.0 million, related to $40.1 million of purchased investments, offset by a $27.1 million increase in cash from maturities of investments within our investment portfolio. In addition, we used cash of $2.7 million for capital expenditures to continue to expand our research and development and manufacturing capabilities and improve our information technology systems, and $331,000 for the purchase of certain intangible assets. These uses of cash were offset in part by $1.3 million related to proceeds from a property insurance claim.
Financing Activities
Cash used in financing activities was $41.8 million for the fiscal year ended June 30, 2010. This amount was primarily the result of $41.4 million in Common Stock repurchases and $1.4 million in repayments of long-term debt, offset in part by $1.0 million in net cash proceeds from the exercise of share-based awards.
Stock Repurchase Program
From time to time, we have made repurchases of our Common Stock, executed under the various stock repurchase programs established by our Board of Directors, and through other miscellaneous transactions.
On December 10, 2009, we announced that our Board of Directors approved a stock repurchase program which allowed us to repurchase up to a total of 400,000 of our issued and outstanding shares of Common Stock. On February 9, 2010, we announced that our Board of Directors approved a new stock repurchase program allowing us to repurchase up to a total of $30 million of our issued and outstanding shares of Common Stock. On June 16, 2010, we announced that our Board of Directors approved an additional stock repurchase program allowing us to repurchase up to an additional $30 million of our issued and outstanding shares of Common Stock.
During fiscal 2010, we repurchased and retired 1,794,705 shares of Common Stock at a total cost of approximately $41.3 million, or an average price of $23.02 per share, using available cash. Commissions and other related costs associated with these stock repurchases totaled $55,788. An additional 34,400 shares were repurchased in June 2010, in trades that settled in July 2010, at a cost of $811,054, or an average market price per share of $23.58. See Note 11 to the Consolidated Financial Statements included in this Form 10-K and Part II. Item 5 (Market for Registrant’s Common Equity, Related Stockholder Matters and Issuer Purchases of Equity Securities) of this Form 10-K.
General
We plan to continue to increase our research and development activities for our biomaterials products and continue our endovascular product research and development activities based on our development contract with Spectranetics.
We believe our current cash and investment balances and expected future cash generated from operations will be sufficient to meet our operating, financing and capital requirements for the next 12 months. Although we believe our cash and investment balances will also be sufficient on a longer term basis, that will depend on numerous factors, including the following: continuation of our existing customer relationships and royalty streams; market
44
Table of Contents
acceptance of our existing and future products; the successful commercialization of products in development; the costs associated with that commercialization; progress in our product development efforts; the magnitude and scope of such efforts; progress with pre-clinical studies, future clinical trials and product clearance by the FDA and other agencies; the cost and timing of any efforts to expand our manufacturing, sales and marketing capabilities; the cost of filing, prosecuting, defending and enforcing patent claims and other intellectual property rights; competing technological and market developments; the development of strategic alliances for the marketing of certain of our products; and the timing and extent of our stock repurchase programs.
The terms of any future equity financing we undertake may be dilutive to our stockholders and the terms of any debt financing may contain restrictive covenants that limit our ability to pursue certain courses of action. Our ability to obtain financing is dependent on the status of our future business prospects, as well as conditions prevailing in the relevant capital markets. No assurance can be given that any additional financing will be available to us, or will be available to us on acceptable terms, should such a need arise. As of June 30, 2010 we were in compliance with all of our affirmative, restrictive and financial maintenance covenants relating to our Mortgage.
Contractual Obligations and Other Contingent Commitments
Presented below is a summary of our approximate aggregate contractual obligations and other contingent commitments at June 30, 2010, for future payments under contracts and other contingent commitments, for fiscal 2011 and beyond:
| Payments Due by Period | |||||||||||||||
| Total | Less than 1 year |
1-3 years | 3-5 years | More than 5 years | |||||||||||
| Contractual Obligations |
|||||||||||||||
| Long-Term Debt Obligations (1): |
|||||||||||||||
| Secured Commercial Mortgage |
$ | 31,383,330 | $ | 1,399,997 | $ | 2,800,000 | $ | 2,800,000 | $ | 24,383,333 | |||||
| Interest on mortgage |
23,073,925 | 2,018,227 | 3,735,170 | 3,375,052 | 13,945,476 | ||||||||||
| Purchase Obligations (2): |
1,093,443 | 1,093,443 | — | — | — | ||||||||||
| Other Obligations: |
|||||||||||||||
| Research and Development Contractual Obligations (3) |
2,720,157 | — | — | — | — | ||||||||||
| Employment Agreements (4) |
1,615,663 | 992,333 | 623,330 | — | — | ||||||||||
| FIN 48 Tax Obligations (5) |
— | — | — | — | — | ||||||||||
| Other Long-Term Liabilities |
|||||||||||||||
| Deferred Revenue Non-Current (6) |
3,336,780 | — | 1,357,466 | 636,312 | 1,343,002 | ||||||||||
| Other Non-Current Liabilities (7) |
5,542,509 | — | — | — | — | ||||||||||
| Total Contractual Obligations |
$ | 68,765,807 | $ | 5,504,000 | $ | 8,515,966 | $ | 6,811,364 | $ | 39,671,811 | |||||
These obligations are related to the Mortgage and agreements to purchase goods or services that are legally binding and enforceable against us.
| (1) | The long-term debt obligations consist of principal and interest on the Mortgage outstanding principal balance of $31.4 million as of June 30, 2010. In accordance with accounting principles generally accepted in the United States of America (U.S. GAAP), the future interest obligations are not recorded on our Consolidated Balance Sheet. See Note 8 to the Consolidated Financial Statements included in this Form 10-K. |
45
Table of Contents
| (2) | These obligations consist of cancelable and non-cancelable purchase commitments related to inventory, capital expenditures and other goods or services. In accordance with U.S. GAAP, these obligations are not recorded on our Consolidated Balance Sheets. See Note 14 to the Consolidated Financial Statements included in this Form 10-K. |
| (3) | Under the Development and Regulatory Services Agreement with Spectranetics, as amended, our contributions are limited to a maximum amount of $2,750,000 toward the expenses associated with clinical studies to obtain approval from the FDA for certain next-generation endovascular products, which is reduced by the total cumulative expenses incurred through June 30, 2010. We are unable to reliably estimate the amount and timing of these contributions because they are dependent on the type and complexity of the clinical studies and intended uses of the products, which have not been established. In accordance with U.S. GAAP, these obligations are not recorded on our Consolidated Balance Sheets. |
| (4) | We have entered into employment agreements with certain of our named executive officers. These employment agreements provided for, among other things, annual base salaries in an aggregate amount of not less than $1,615,663, from June 30, 2010 through fiscal 2012. In accordance with U.S. GAAP, these obligations are not recorded on our Consolidated Balance Sheets. See Note 14 to the Consolidated Financial Statements included in this Form 10-K. |
| (5) | Liabilities for uncertain tax positions in the aggregate amount of $118,981 have been omitted from the table above due to an inability to reliably estimate the period of cash settlement of these liabilities. See Note 16 to the Consolidated Financial Statements included in this Form 10-K. |
| (6) | Non-current deferred revenue includes milestone payments received by us pursuant to customer agreements, as well as advance payments from customers for future services. Several of these deferred milestone revenues are non-refundable and may not require future performance from our Company. These liabilities are recorded in accordance with U.S. GAAP, and are reported on our Consolidated Balance Sheets. |
| (7) | This amount represents the estimated amount we would pay to terminate the Swap as of June 30, 2010 if we were to prepay the Mortgage as of June 30, 2010, prior to the Swap Agreement term end date which is May 2016. We currently do not intend to prepay the Mortgage and, therefore, are unable to reliably estimate the period of cash settlement of the Swap, if any. In accordance with U.S. GAAP, this liability is recorded on our Consolidated Balance Sheets. See Note 8 to the Consolidated Financial Statements included in this Form 10-K. |
Our estimate of the time periods for which our cash and cash equivalents will be adequate to fund operations is a forward looking statement within the meaning of Private Securities Litigation Reform Act of 1995 and is subject to risks and uncertainties. Actual results may differ materially from those contemplated in such forward-looking statements. In addition to those described above, factors which may cause such a difference are set forth in Item 1A (Risk Factors) of this Annual Report on Form 10-K. See “—Cautionary Note Regarding Forward-Looking Statements.”
| ITEM 7A. | QUANTITATIVE AND QUALITATIVE DISCLOSURES ABOUT MARKET RISK |
Our interest income and expense are sensitive to changes in the general level of interest rates. In this regard, changes in interest rates affect the interest earned on our cash, cash equivalents and investments, as well as the fair value of our investments and the Swap.
Investment Portfolio
Our investment portfolio consists of highly rated U.S. government agency bonds and municipal bonds issued by states, cities, counties and other governmental entities. The majority of these investments have maturities ranging from less than one year to approximately three years. We mitigate default risk by investing in what we believe are safe and high credit quality securities and by monitoring the credit rating of investment issuers. Our portfolio includes only securities with secondary or resale markets. We have an audit committee-approved investment
46
Table of Contents
strategy, which currently limits the duration and types of our investments relative to diversification and maturities to maintain safety and liquidity. These available-for-sale securities are subject to interest rate risk and decreases in market value if interest rates increase. As of June 30, 2010, our total investment portfolio consisted of approximately $42.6 million of investments. While our investments generally may be sold at any time because the portfolio includes available-for-sale securities with secondary or resale markets, we generally hold securities until the earlier of their call date or their maturity. We do not expect our results of operations or cash flows to be materially impacted due to a sudden change in interest rates. We review our investments to identify and evaluate investments that have an indication of possible impairment. We have not experienced any liquidity or impairment issues with our investments. However, due to recent economic conditions, bond issuers’ financial condition and the credit markets have continued to be highly volatile, and there can be no assurance that these conditions will not in the future adversely affect the liquidity or value of our investments in government agency bonds or municipal bonds. If these challenging economic conditions continue, or any investments in our portfolio experience any additional ratings downgrades, we may incur impairments to our investment portfolio, which could negatively affect our financial condition, cash flows and results of operation. We have no intent to sell any of these investments until a recovery of their respective fair values, which may be at maturity, and we have no current requirement to sell any of these investments. Additional information regarding our investments is located in Note 2 to the Consolidated Financial Statements included herein in this Form 10-K.
Debt
On May 25, 2006, we entered into a $35 million aggregate ten-year fixed interest rate Swap, with Citibank, N.A., to manage the market risk from changes in interest rates under the Mortgage. As of June 30, 2010, the outstanding principal under the Mortgage was $31.4 million (See Note 8 to the Consolidated Financial Statements included in this Form 10-K). Our objective and strategy for undertaking the Swap was to hedge our exposure to variability in cash flows and interest expense associated with the future interest rate payments under the Mortgage and to reduce our interest rate risk in the event of an unfavorable interest rate environment. We currently utilize the Hypothetical Derivative Method in determining the hedge effectiveness of the hedged item each period. We do not expect our results of operations or cash flows to be materially impacted due to a sudden change in interest rates. If the conditions underlying the Swap or the hedge item change, there is a risk that our hedged item would be deemed an ineffective hedge, and therefore, we would record changes in the fair value of the Swap within our Consolidated Statements of Income, as well as our Consolidated Statements of Cash Flows. Additional information regarding the Swap is located in Note 8 – under the heading “Interest Rate Swap Agreement” to the Consolidated Financial Statements included in this Form 10-K.
Foreign Currency Exchange Rate Risk
The Company’s business is not directly dependent on foreign operations, as the Company’s sales to customers outside the U.S. are not significant. However, a portion of the Company’s total revenues, including sales and royalties, are dependent on U.S. based customers selling to end-users outside the U.S. There is a risk related to the changes in foreign currency exchange rates as it relates to our royalties paid to us in U.S. dollars for which royalties are received on end-user sales within foreign countries. We are currently not taking any affirmative steps to hedge the risk of fluctuations in foreign currency exchange rates. We do not expect our financial position, results of operations or cash flows to be materially impacted due to a sudden change in foreign currency exchange rates fluctuations relative to the U.S. Dollar.
47
Table of Contents
| ITEM 8. | FINANCIAL STATEMENTS AND SUPPLEMENTARY DATA |
The following Consolidated Financial Statements, and the related Notes thereto, of Kensey Nash Corporation, and the Report of Independent Registered Public Accounting Firm are filed as a part of this Form 10-K.
All other schedules are omitted either because they are not applicable or because information required therein is shown in the Consolidated Financial Statements or Notes thereto.
48
Table of Contents
REPORT OF INDEPENDENT REGISTERED PUBLIC ACCOUNTING FIRM
To the Board of Directors and Stockholders of
Kensey Nash Corporation
Exton, Pennsylvania
We have audited the accompanying consolidated balance sheets of Kensey Nash Corporation and subsidiaries (the “Company”) as of June 30, 2010 and 2009, and the related consolidated statements of income, stockholders’ equity, and cash flows for each of the three years in the period ended June 30, 2010. These financial statements are the responsibility of the Company’s management. Our responsibility is to express an opinion on these financial statements based on our audits.
We conducted our audits in accordance with the standards of the Public Company Accounting Oversight Board (United States). Those standards require that we plan and perform the audit to obtain reasonable assurance about whether the financial statements are free of material misstatement. An audit includes examining, on a test basis, evidence supporting the amounts and disclosures in the financial statements. An audit also includes assessing the accounting principles used and significant estimates made by management, as well as evaluating the overall financial statement presentation. We believe that our audits provide a reasonable basis for our opinion.
In our opinion, such consolidated financial statements present fairly, in all material respects, the financial position of Kensey Nash Corporation and subsidiaries as of June 30, 2010 and 2009, and the results of their operations and their cash flows for each of the three years in the period ended June 30, 2010, in conformity with accounting principles generally accepted in the United States of America.
We have also audited, in accordance with the standards of the Public Company Accounting Oversight Board (United States), the Company’s internal control over financial reporting as of June 30, 2010, based on the criteria established in Internal Control—Integrated Framework issued by the Committee of Sponsoring Organizations of the Treadway Commission and our report dated September 10, 2010 expressed an unqualified opinion on the Company’s internal control over financial reporting.
/s/ DELOITTE & TOUCHE LLP
Philadelphia, Pennsylvania
September 10, 2010
49
Table of Contents
CONSOLIDATED BALANCE SHEETS
| June 30, 2010 |
June 30, 2009 |
|||||||
| ASSETS |
||||||||
| CURRENT ASSETS: |
||||||||
| Cash and cash equivalents |
$ | 23,102,362 | $ | 49,474,255 | ||||
| Investments |
42,571,544 | 30,230,131 | ||||||
| Trade receivables, net of allowance for doubtful accounts of $13,513 and $13,513 at June 30, 2010 and 2009, respectively |
5,307,563 | 4,657,850 | ||||||
| Royalties receivable |
5,818,310 | 6,426,072 | ||||||
| Other receivables (including approximately $2,582 and $2,614 at June 30, 2010 and 2009, respectively, due from employees) |
1,119,703 | 362,805 | ||||||
| Inventory |
8,885,875 | 10,585,065 | ||||||
| Deferred tax asset, current portion |
2,857,262 | 2,490,406 | ||||||
| Prepaid expenses and other |
1,091,760 | 941,966 | ||||||
| Total current assets |
90,754,379 | 105,168,550 | ||||||
| PROPERTY, PLANT AND EQUIPMENT, AT COST: |
||||||||
| Land |
4,883,591 | 4,883,591 | ||||||
| Building |
46,489,239 | 46,380,229 | ||||||
| Machinery, furniture and equipment |
32,728,301 | 31,287,825 | ||||||
| Construction in progress |
63,322 | 238,030 | ||||||
| Total property, plant and equipment |
84,164,453 | 82,789,675 | ||||||
| Accumulated depreciation |
(29,179,563 | ) | (24,816,780 | ) | ||||
| Net property, plant and equipment |
54,984,890 | 57,972,895 | ||||||
| OTHER ASSETS: |
||||||||
| Deferred tax asset, non-current portion |
1,872,619 | 807,538 | ||||||
| Acquired patents and other intangibles, net of accumulated amortization of $6,628,605 and $5,661,326 at June 30, 2010 and 2009, respectively |
2,048,595 | 2,685,040 | ||||||
| Goodwill |
4,366,273 | 4,366,273 | ||||||
| Other non-current assets |
93,973 | 90,134 | ||||||
| Total other assets |
8,381,460 | 7,948,985 | ||||||
| TOTAL |
$ | 154,120,729 | $ | 171,090,430 | ||||
| LIABILITIES AND STOCKHOLDERS’ EQUITY |
||||||||
| CURRENT LIABILITIES: |
||||||||
| Accounts payable |
$ | 2,460,740 | $ | 2,100,245 | ||||
| Accrued expenses |
5,494,910 | 5,541,804 | ||||||
| Other current liabilities |
131,836 | 295,764 | ||||||
| Current portion of debt |
1,399,997 | 1,399,997 | ||||||
| Deferred revenue |
947,378 | 782,906 | ||||||
| Total current liabilities |
10,434,861 | 10,120,716 | ||||||
| OTHER LIABILITIES: |
||||||||
| Long-term debt |
29,983,333 | 31,383,333 | ||||||
| Deferred revenue, non-current |
3,336,780 | 1,808,902 | ||||||
| Other non-current liabilities |
5,542,509 | 4,502,900 | ||||||
| Total liabilities |
49,297,483 | 47,815,851 | ||||||
| COMMITMENTS AND CONTINGENCIES (Note 14) |
— | — | ||||||
| STOCKHOLDERS’ EQUITY: |
||||||||
| Preferred stock, $.001 par value, 100,000 shares authorized, of which 25,000 shares are designated as Series A junior participating preferred stock, $.001 par value, no shares issued or outstanding at June 30, 2010 and June 30, 2009 |
— | — | ||||||
| Common stock, $.001 par value, 25,000,000 shares authorized, 9,437,236 and 11,145,562 shares issued and outstanding at June 30, 2010 and 2009, respectively |
9,403 | 11,142 | ||||||
| Capital in excess of par value |
27,528,282 | 65,035,608 | ||||||
| Retained earnings |
80,561,830 | 61,097,706 | ||||||
| Accumulated other comprehensive loss |
(3,276,269 | ) | (2,869,877 | ) | ||||
| Total stockholders’ equity |
104,823,246 | 123,274,579 | ||||||
| TOTAL |
$ | 154,120,729 | $ | 171,090,430 | ||||
See notes to consolidated financial statements.
50
Table of Contents
CONSOLIDATED STATEMENTS OF INCOME
| Year Ended June 30, | ||||||||||||
| 2010 | 2009 | 2008 | ||||||||||
| REVENUES: |
||||||||||||
| Net sales |
||||||||||||
| Biomaterial sales |
$ | 52,096,283 | $ | 51,045,578 | $ | 47,538,923 | ||||||
| Endovascular sales |
2,180,421 | 3,858,187 | 6,221,942 | |||||||||
| Total net sales |
54,276,704 | 54,903,765 | 53,760,865 | |||||||||
| Royalty income |
26,370,841 | 27,177,085 | 26,030,032 | |||||||||
| Total revenues |
80,647,545 | 82,080,850 | 79,790,897 | |||||||||
| OPERATING COSTS AND EXPENSES: |
||||||||||||
| Cost of products sold |
23,507,351 | 24,193,941 | 27,211,681 | |||||||||
| Research and development |
17,876,748 | 18,134,442 | 17,200,762 | |||||||||
| Selling, general and administrative |
9,009,329 | 9,219,001 | 27,575,105 | |||||||||
| Loss on sale of endovascular assets |
— | — | 1,212,478 | |||||||||
| Total operating costs and expenses |
50,393,428 | 51,547,384 | 73,200,026 | |||||||||
| INCOME FROM OPERATIONS |
30,254,117 | 30,533,466 | 6,590,871 | |||||||||
| OTHER INCOME (EXPENSE): |
||||||||||||
| Interest income |
704,435 | 1,179,851 | 1,775,044 | |||||||||
| Interest expense |
(2,087,157 | ) | (2,075,486 | ) | (1,539,624 | ) | ||||||
| Other (loss) income |
(18,970 | ) | 151,435 | (220,332 | ) | |||||||
| Total other (expense)/income – net |
(1,401,692 | ) | (744,200 | ) | 15,088 | |||||||
| INCOME BEFORE INCOME TAX |
28,852,425 | 29,789,266 | 6,605,959 | |||||||||
| Income tax expense |
(9,388,301 | ) | (9,710,156 | ) | (1,816,180 | ) | ||||||
| NET INCOME |
$ | 19,464,124 | $ | 20,079,110 | $ | 4,789,779 | ||||||
| BASIC EARNINGS PER SHARE |
$ | 1.83 | $ | 1.74 | $ | 0.40 | ||||||
| DILUTED EARNINGS PER SHARE |
$ | 1.78 | $ | 1.69 | $ | 0.38 | ||||||
| WEIGHTED AVERAGE COMMON SHARES OUTSTANDING |
10,623,926 | 11,547,266 | 11,891,469 | |||||||||
| DILUTED WEIGHTED AVERAGE COMMON |
||||||||||||
| SHARES OUTSTANDING |
10,936,590 | 11,897,835 | 12,471,298 | |||||||||
See notes to consolidated financial statements.
51
Table of Contents
CONSOLIDATED STATEMENTS OF STOCKHOLDERS’ EQUITY
| Common Stock | Capital in Excess of Par Value |
Retained Earnings |
Accumulated Other Comprehensive (Loss)/Income |
Comprehensive Income/(Loss) |
Total | ||||||||||||||||||||||
| Shares | Amount | ||||||||||||||||||||||||||
| BALANCE, JUNE 30, 2007 |
11,930,796 | $ | 11,931 | $ | 87,435,283 | $ | 36,433,432 | $ | (230,859 | ) | $ | 123,649,787 | |||||||||||||||
| Cumulative effect adjustment for adoption of FIN 48 |
(204,615 | ) | (204,615 | ) | |||||||||||||||||||||||
| Exercise/issuance of: |
|||||||||||||||||||||||||||
| Stock options |
492,148 | 492 | 6,377,005 | 6,377,497 | |||||||||||||||||||||||
| Nonvested stock awards |
103,517 | 103 | (103 | ) | — | ||||||||||||||||||||||
| Exchange of nonvested shares for taxes |
(18,401 | ) | (18 | ) | (441,380 | ) | (441,398 | ) | |||||||||||||||||||
| Stock repurchase |
(867,839 | ) | (868 | ) | (24,461,871 | ) | (24,462,739 | ) | |||||||||||||||||||
| Tax benefit/(deficiency) from exercise/issuance of: |
|||||||||||||||||||||||||||
| Stock options |
2,532,819 | 2,532,819 | |||||||||||||||||||||||||
| Nonvested stock awards |
(181,703 | ) | (181,703 | ) | |||||||||||||||||||||||
| Share based compensation granted to non-employee |
115,013 | 115,013 | |||||||||||||||||||||||||
| Employee stock-based compensation: |
|||||||||||||||||||||||||||
| Stock options |
1,849,884 | 1,849,884 | |||||||||||||||||||||||||
| Nonvested stock awards |
2,017,318 | 2,017,318 | |||||||||||||||||||||||||
| Net Income |
4,789,779 | $ | 4,789,779 | 4,789,779 | |||||||||||||||||||||||
| Foreign currency translation adjustment |
(135,608 | ) | (135,608 | ) | (135,608 | ) | |||||||||||||||||||||
| Change in unrealized loss on investments (net of tax) |
102,694 | 102,694 | 102,694 | ||||||||||||||||||||||||
| Change in interest rate swap unrealized loss (net of tax) |
(1,439,072 | ) | (1,439,072 | ) | (1,439,072 | ) | |||||||||||||||||||||
| Comprehensive income |
$ | 3,317,793 | |||||||||||||||||||||||||
| BALANCE, JUNE 30, 2008 |
11,640,221 | $ | 11,640 | $ | 75,242,265 | $ | 41,018,596 | $ | (1,702,845 | ) | $ | 114,569,656 | |||||||||||||||
| Exercise/issuance of: |
|||||||||||||||||||||||||||
| Stock options |
301,930 | 302 | 5,148,912 | 5,149,214 | |||||||||||||||||||||||
| Nonvested stock awards |
14,852 | 15 | (15 | ) | — | ||||||||||||||||||||||
| Stock repurchase |
(814,941 | ) | (815 | ) | (19,493,613 | ) | (19,494,428 | ) | |||||||||||||||||||
| Tax benefit/(deficiency) from exercise/issuance of: |
|||||||||||||||||||||||||||
| Stock options |
1,756,244 | 1,756,244 | |||||||||||||||||||||||||
| Nonvested stock awards |
(48,748 | ) | (48,748 | ) | |||||||||||||||||||||||
| Employee stock-based compensation: |
|||||||||||||||||||||||||||
| Stock options |
1,990,956 | 1,990,956 | |||||||||||||||||||||||||
| Nonvested stock awards |
439,607 | 439,607 | |||||||||||||||||||||||||
| Net Income |
20,079,110 | $ | 20,079,110 | 20,079,110 | |||||||||||||||||||||||
| Change in unrealized gain on investments (net of tax) |
123,869 | 123,869 | 123,869 | ||||||||||||||||||||||||
| Change in interest rate swap unrealized loss (net of tax) |
(1,290,901 | ) | (1,290,901 | ) | (1,290,901 | ) | |||||||||||||||||||||
| Comprehensive income |
$ | 18,912,078 | |||||||||||||||||||||||||
| BALANCE, JUNE 30, 2009 |
11,142,062 | $ | 11,142 | $ | 65,035,608 | $ | 61,097,706 | $ | (2,869,877 | ) | $ | 123,274,579 | |||||||||||||||
| Exercise/issuance of: |
|||||||||||||||||||||||||||
| Stock options |
65,722 | 66 | 880,202 | 880,268 | |||||||||||||||||||||||
| Nonvested stock awards |
21,577 | 22 | (22 | ) | — | ||||||||||||||||||||||
| Exchange of nonvested shares for taxes |
(920 | ) | (1 | ) | (20,976 | ) | (20,977 | ) | |||||||||||||||||||
| Stock repurchase |
(1,825,605 | ) | (1,826 | ) | (42,088,971 | ) | (42,090,797 | ) | |||||||||||||||||||
| Tax benefit from exercise/issuance of: |
|||||||||||||||||||||||||||
| Stock options |
192,407 | 192,407 | |||||||||||||||||||||||||
| Nonvested stock awards |
5,015 | 5,015 | |||||||||||||||||||||||||
| Employee stock-based compensation: |
|||||||||||||||||||||||||||
| Stock options |
3,011,699 | 3,011,699 | |||||||||||||||||||||||||
| Nonvested stock awards |
513,320 | 513,320 | |||||||||||||||||||||||||
| Net Income |
19,464,124 | $ | 19,464,124 | 19,464,124 | |||||||||||||||||||||||
| Change in unrealized gain on investments (net of tax) |
269,354 | 269,354 | 269,354 | ||||||||||||||||||||||||
| Change in interest rate swap unrealized loss (net of tax) |
(675,746 | ) | (675,746 | ) | (675,746 | ) | |||||||||||||||||||||
| Comprehensive income |
$ | 19,057,732 | |||||||||||||||||||||||||
| BALANCE, JUNE 30, 2010 |
9,402,836 | $ | 9,403 | $ | 27,528,282 | $ | 80,561,830 | $ | (3,276,269 | ) | $ | 104,823,246 | |||||||||||||||
See notes to consolidated financial statements.
52
Table of Contents
CONSOLIDATED STATEMENTS OF CASH FLOWS
| Year Ended June 30, | ||||||||||||
| 2010 | 2009 | 2008 | ||||||||||
| OPERATING ACTIVITIES: |
||||||||||||
| Net income |
$ | 19,464,124 | $ | 20,079,110 | $ | 4,789,779 | ||||||
| Adjustments to reconcile net income to net cash provided by operating activities: |
||||||||||||
| Depreciation and amortization |
7,276,947 | 6,723,345 | 7,250,397 | |||||||||
| Employee stock-based compensation: |
||||||||||||
| Stock options |
3,011,699 | 1,939,330 | 1,901,510 | |||||||||
| Nonvested stock awards |
537,252 | 513,630 | 2,050,892 | |||||||||
| Cash-settled stock appreciation rights |
(163,928 | ) | (390,503 | ) | 1,370,753 | |||||||
| Tax benefit/(deficiency) from exercise of stock options |
||||||||||||
| Stock options |
192,407 | 1,756,244 | 2,532,819 | |||||||||
| Nonvested stock awards |
5,015 | (48,748 | ) | (181,703 | ) | |||||||
| Excess tax benefits from share-based payment arrangements |
(150,480 | ) | (987,707 | ) | (1,654,946 | ) | ||||||
| Deferred income taxes |
(1,344,317 | ) | 1,218,097 | (1,839,544 | ) | |||||||
| SAR exercise/repurchase |
— | — | (1,126,457 | ) | ||||||||
| Loss on retirement of property, plant and equipment |
20,901 | 45,726 | 132,263 | |||||||||
| Gain on property insurance claim and related expenses |
(1,024,144 | ) | — | — | ||||||||
| Loss on sale of endovascular business |
— | — | 1,212,478 | |||||||||
| Changes in assets and liabilities which provided (used) cash: |
||||||||||||
| Accounts receivable |
(774,144 | ) | 2,827,150 | (2,152,616 | ) | |||||||
| Prepaid expenses and other current assets |
(190,755 | ) | 860,485 | 73,056 | ||||||||
| Inventory |
1,699,190 | (1,314,200 | ) | (2,148,784 | ) | |||||||
| Accounts payable and accrued expenses |
(171,076 | ) | (1,474,752 | ) | 2,676,188 | |||||||
| Deferred revenue |
164,472 | 181,775 | 250,392 | |||||||||
| Deferred revenue, non-current |
1,527,878 | 1,503,963 | (103,554 | ) | ||||||||
| Other current liabilities |
— | — | 441,971 | |||||||||
| Other non-current liabilities |
— | (202,704 | ) | 308,325 | ||||||||
| Net cash provided by operating activities |
30,081,041 | 33,230,241 | 15,783,219 | |||||||||
| INVESTING ACTIVITIES: |
||||||||||||
| Additions to property, plant and equipment |
(2,668,175 | ) | (3,679,240 | ) | (4,122,865 | ) | ||||||
| Acquisition of MacroPore Biosurgery, Inc. |
— | — | (62,298 | ) | ||||||||
| Purchase of proprietary rights |
(330,833 | ) | — | (150,000 | ) | |||||||
| Proceeds from maturity of investments |
27,095,000 | 7,430,000 | 37,635,817 | |||||||||
| Purchase of investments |
(40,106,459 | ) | (22,900,352 | ) | (25,415,138 | ) | ||||||
| Proceeds from property insurance claim |
1,313,892 | — | — | |||||||||
| Proceeds from sale of endovascular business |
— | — | 10,000,000 | |||||||||
| Net cash (used in) provided by investing activities |
(14,696,575 | ) | (19,149,592 | ) | 17,885,516 | |||||||
| FINANCING ACTIVITIES: |
||||||||||||
| Proceeds from secured commercial mortgage |
— | — | 27,000,000 | |||||||||
| Repayments of long term debt |
(1,400,000 | ) | (1,400,000 | ) | (816,670 | ) | ||||||
| Stock repurchases |
(41,366,130 | ) | (19,423,525 | ) | (24,462,739 | ) | ||||||
| Excess tax benefits from share-based payment arrangements |
150,480 | 987,707 | 1,654,946 | |||||||||
| Exchange of nonvested shares for taxes |
(20,977 | ) | — | (441,398 | ) | |||||||
| Proceeds from exercise of stock options |
880,268 | 6,523,192 | 5,003,519 | |||||||||
| Net cash (used in) provided by financing activities |
(41,756,359 | ) | (13,312,626 | ) | 7,937,658 | |||||||
| EFFECT OF EXCHANGE RATE ON CASH |
— | — | 11,870 | |||||||||
| (DECREASE)/INCREASE IN CASH |
(26,371,893 | ) | 768,023 | 41,618,263 | ||||||||
| CASH AND CASH EQUIVALENTS, BEGINNING OF YEAR |
49,474,255 | 48,706,232 | 7,087,969 | |||||||||
| CASH AND CASH EQUIVALENTS, END OF YEAR |
$ | 23,102,362 | $ | 49,474,255 | $ | 48,706,232 | ||||||
| SUPPLEMENTAL DISCLOSURE OF CASH FLOW INFORMATION: |
||||||||||||
| Cash paid for interest (net of interest capitalized of $10,758, $119,171, and $48,146 at June 30, 2010, 2009 and 2008, respectively) |
$ | 2,098,891 | $ | 2,108,229 | $ | 1,494,222 | ||||||
| Cash paid for income taxes |
$ | 9,745,800 | $ | 5,453,622 | $ | 500,000 | ||||||
| Retirement of fully depreciated property, plant and equipment |
$ | 721,641 | $ | 817,341 | $ | 4,349,137 | ||||||
See notes to consolidated financial statements.
53
Table of Contents
NOTES TO CONSOLIDATED FINANCIAL STATEMENTS
YEARS ENDED JUNE 30, 2010, 2009 AND 2008
| 1. | SUMMARY OF SIGNIFICANT ACCOUNTING POLICIES |
Description of the Company – Kensey Nash Corporation is a medical device company primarily focused in the field of regenerative medicine, which is the application of devices, materials and other therapies to help repair damaged or diseased tissues. The Company is recognized as a leader for innovative product development, as well as for our broad portfolio of resorbable biomaterials products. The Company has an extensive range of products, which are sold through strategic partners in multiple large medical markets, including cardiology, orthopaedic, sports medicine, spinal and general surgery. The Company also has an ongoing development and manufacturing program for products in the endovascular market.
Kensey Nash Corporation was incorporated in Delaware on August 6, 1984.
Principles of Consolidation and Basis of Presentation – The consolidated financial statements include the accounts of Kensey Nash Corporation and its wholly owned subsidiaries (the Company). All intercompany transactions and balances have been eliminated.
The preparation of the financial statements in conformity with accounting principles generally accepted in the United States of America (U.S. GAAP) and the notes to the financial statements requires management to make estimates and assumptions. These estimates and assumptions, which may differ from actual results, will affect the reported amounts of assets and liabilities and disclosure of contingent assets and liabilities at the date of the financial statements, as well as the reported amounts of revenues, expenses and cash flows for the periods presented.
Subsequent Events – The Company has evaluated events and transactions subsequent to the balance sheet date. Based on this evaluation, the Company is not aware of any events or transactions that occurred subsequent to the balance sheet date, but prior to the filing of this Form 10-K, which would require recognition or disclosure in its Consolidated Financial Statements.
Sale of Endovascular Division – On May 13, 2008, the Company announced that it had entered into a definitive agreement to sell its Endovascular business to Spectranetics. This transaction includes the sale of the ThromCat®, QuickCat™ and Safe-Cross® product lines and established a strategic partnership between the Company and Spectranetics. See Note 19 for additional information and a discussion of the transaction and other related charges.
Cash and Cash Equivalents – Cash and cash equivalents represent cash in banks and short-term investments having an original maturity of less than three months.
Fair Value of Financial Instruments – The carrying amounts of financial instruments, including cash and cash equivalents, investments, accounts receivable, accounts payable and debt approximated fair value as of June 30, 2010 and 2009. See Note 2 and Note 9 regarding the fair value determination of certain of these instruments.
Comprehensive Income – The Company accounts for comprehensive income under the disclosure provisions of Financial Accounting Standards Board (FASB) Accounting Standards Codification (ASC) Topic 220, “Comprehensive Income.” Accordingly, accumulated other comprehensive (loss)/income is shown in the Consolidated Statements of Stockholders’ Equity at June 30, 2010, 2009 and 2008, and is comprised of net unrealized gains and losses on the Company’s available-for-sale securities, foreign currency translation adjustments and change in interest rate swap value. Included in the Company’s net income for the fiscal year ended June 30, 2008 is $(237,413) of currency translation adjustments that were written off as a result of the sale
54
Table of Contents
of the Kensey Nash Europe GmbH subsidiary to Spectranetics on May 30, 2008. The net tax effects (benefit) for fiscal 2010, 2009 and 2008 of other comprehensive loss were $(218,826), $(658,775) and $(697,759), respectively.
Property, Plant and Equipment – Property, plant and equipment consist primarily of building, land, machinery and equipment and construction in progress and are recorded at cost. Maintenance and repairs are typically expensed as incurred. Building, machinery, furniture and equipment are depreciated using the straight-line method over their useful lives ranging from two to 30 years. Depreciation expense on property, plant and equipment was $5,212,039, $5,367,713 and $5,806,925 for the fiscal years ended June 30, 2010, 2009 and 2008, respectively.
In fiscal 2010, a fire occurred which was contained to a small manufacturing area within the Company’s corporate headquarters building. The Company’s property insurance policy covered all remediation efforts and fixed asset replacements, subject to a $25,000 deductible. The Company recognized a gain of $775,000 within cost of products sold upon final settlement with the insurance carrier, as remediation and recovery efforts were completed. A total of $1.3 million was received in insurance proceeds for remediation efforts, replacement value of fixed assets and other expenses. The Company replaced damaged fixed assets with a total value of approximately $480,000. The remaining insurance proceeds were used by the Company to pay for other related expenses and added to general Company funds. The total insurance proceeds, including amounts relating to the outside remediation services and fixed assets, have been classified within the investing activities section of the Consolidated Statement of Cash Flows, and the balance of the insurance proceeds, used by the Company to pay for other related expenses, has been classified within the operating activities section of the Consolidated Statement of Cash Flows.
Goodwill – Goodwill represents the excess of cost over the fair market value of the identifiable net assets of THM Biomedical, Inc. (THM), a company acquired in September 2000, and MacroPore Biosurgery Business Unit (MacroPore), acquired in May 2007. All of the acquisitions were accounted for under the provisions of FASB ASC Topic 805, “Business Combinations” and FASB ASC Topic 350, “Intangibles – Goodwill and Other.” The net carrying amount of goodwill at June 30, 2010 was $4,366,273 and remained unchanged from the year ended June 30, 2009.
The accounting standards provide that goodwill and intangible assets with indefinite useful lives are not amortized, but are subject to impairment tests on an annual basis or at an interim date if certain events or circumstances indicate that an impairment loss may have been incurred. Intangible assets with definite useful lives will continue to be amortized over their respective useful lives. The annual assessments as of June 30, 2010, 2009 and 2008 indicated that goodwill was not impaired.
Impairment of Long-Lived Assets – Long-lived assets are reviewed for impairment whenever events or circumstances indicate that the carrying amount of an asset may not be recoverable. If the undiscounted expected future cash flows to be generated by the related asset are less than the carrying value of the asset, the Company measures the amount of the impairment by comparing the carrying amount of the asset to its fair value. The estimation of fair value is generally measured by discounting expected future cash flows.
Accounts Receivable Allowance – The Company had a trade receivable allowance balance of $13,513 at June 30, 2010 and 2009. Included in Selling, general and administrative expense for the fiscal years ended June 30, 2010, 2009 and 2008 were write offs totaling $0, $1,200 and $5,506, respectively.
Revenue Recognition
Sales Revenue
The Company recognizes revenue in accordance with FASB ASC Subtopic 605-10-S99, “Revenue Recognition.” In addition, the Company accounts for certain customer arrangements containing multiple
55
Table of Contents
revenue elements that were entered into, or materially amended, after June 30, 2003, in accordance with FASB ASC Subtopic 605-25, “Multiple Element Arrangements.”
Sales revenue is generally recognized when the products are shipped or the services are completed. Advance payments received for products or services are recorded as deferred revenue and are recognized when the product is shipped or services are performed. The Company reduces sales revenue for estimated customer returns and other allowances. The Company recorded net sales return provisions, credits and discounts of $30,064, $33,000 and $51,886 for the years ended June 30, 2010, 2009 and 2008, respectively.
Royalty Income
The Company generally recognizes its royalty revenue at the end of each month, when the relevant net total end-user product sales dollars are reported to the Company for the month. Royalty payments are generally received within 45 days after the end of each calendar quarter.
Research and Development Costs – Research and development costs are charged to expense as they are incurred.
Income Taxes – The Company accounts for income taxes under the provisions of FASB ASC Subtopic 740, “Income Taxes” (See Note 16).
Earnings Per Share – Earnings per share (EPS) are calculated in accordance with FASB ASC Topic 260, “Earnings Per Share” (ASC 260). Basic and diluted EPS are computed using the weighted average number of shares of Common Stock outstanding, with common equivalent shares from options and nonvested stock awards included in the diluted computation when their effect is dilutive (See Note 17). There were no nonvested stock awards included for the years ended June 30, 2010, 2009 and 2008 that were antidilutive. Options to purchase shares of the Company’s Common Stock that were outstanding for the years ended June 30, 2010, 2009 and 2008, but were not included in the computation of diluted EPS because the options would have been antidilutive are shown in the table below:
| June 30, | ||||||
| 2010 | 2009 | 2008 | ||||
| Number of options |
1,180,611 | 978,193 | 570,516 | |||
| Option exercise price range |
$23.45 - $35.71 | $25.55 - $35.71 | $24.90 - $34.36 | |||
Share-Based Compensation – The Company accounts for its share-based compensation plans in accordance with FASB ASC Topic 718, “Compensation – Stock Expense”(ASC 718), whereby all share-based compensation cost is measured at the grant date, based on the estimated fair value of the award, and is recognized as an expense in the income statement over the requisite service period.
The Company generally recognizes compensation expense for share-based awards granted over the relevant vesting period of the awards. Fair value for stock options and cash-settled stock appreciation rights (SARs) is determined using the Black-Scholes model, and the relevant expense is amortized over the applicable vesting period for stock options and marked to market for the SARs (See Note 12). Compensation expense related to share-based awards is classified on the Consolidated Statements of Income within the same line items as salary or consulting expense with respect to the award recipients, and is recorded over the awards’ relevant vesting periods. Compensation expense related to share-based awards granted to the members of the Board of Directors is recorded as a component of Selling, general and administrative expense on the Consolidated Statements of Income.
Derivative Instruments and Hedging Activities – The Company recognizes its only derivative as a cash flow hedge and measures this instrument at its fair value as either an asset or liability in the balance sheet, depending
56
Table of Contents
on the Company’s rights or obligations under the derivative contract, (See Note 9). The change in the derivative’s fair value is recorded each period in Accumulated other comprehensive loss on the Consolidated Balance Sheets (OCI).
New Accounting Pronouncements –
ADOPTED:
In June 2009, the FASB issued ASC Topic 105 (ASC 105), “Generally Accepted Accounting Principles” (formerly Statement of Financial Accounting Standards (SFAS) No. 168, “The FASB Accounting Standards Codification and Hierarchy of Generally Accepted Accounting Principles”). ASC 105 establishes the FASB ASC (the Codification) as the single source of authoritative nongovernmental U.S. GAAP. All existing accounting standard documents, such as FASB, American Institute of Certified Public Accountants, Emerging Issues Task Force and other related literature, excluding rules and guidance from the Securities and Exchange Commission, have been superseded by the Codification. All other accounting literature not included in the Codification has become non-authoritative. The Codification is effective for interim and annual periods ending after September 15, 2009. The Company adopted the standard in the first quarter of fiscal 2010. All references to authoritative accounting literature are referenced in accordance with the Codification. The FASB will issue Accounting Standards Updates (ASU), which will serve to update the Codification, provide background information about the guidance and provide the basis for conclusions on changes to the Codification.
In November 2007, the FASB issued ASC Topic 808, “Collaborative Arrangements.” This standard requires the Company to disclose the nature and purpose of its collaborative arrangements in its annual financial statements, its rights and obligations under its collaborative arrangements, the stage of the underlying endeavor’s life cycle, the Company’s accounting policies for the arrangements and the statement of income classification and amount of significant financial statement amounts related to the collaborative arrangements. The standard is effective for fiscal years beginning after December 15, 2008, which for the Company was July 1, 2009 (fiscal 2010). Companies are required to apply the provisions through retrospective application to all collaborative arrangements existing at adoption as a change in accounting principle. If it is impracticable to apply consensus to a specific arrangement, disclosure is required regarding the reason why retrospective application is not practicable and the effects of reclassification on the current period. The Company’s adoption of the standard has not had a material impact on the Company’s financial position, results of operations or cash flows.
In December 2007, the FASB issued ASC Topic 805, “Business Combinations.” The standard requires recognition of assets acquired, liabilities assumed, and any noncontrolling interest in the acquiree at the acquisition date, measured at their fair values as of that date. In a business combination achieved in stages, the standard requires recognition of identifiable assets and liabilities, as well as the non-controlling interest in the acquiree, at the full amounts of their fair values. This standard also requires the fair value of acquired in-process research and development (IPR&D) to be recorded as indefinite lived intangibles, contingent consideration to be recorded on the acquisition date, and restructuring and acquisition-related deal costs to be expensed as incurred. In addition, any excess of the fair value of net assets acquired over purchase price and any subsequent changes in estimated contingencies are to be recorded in earnings. The standard is effective prospectively for business combinations for which the acquisition date is on or after fiscal years beginning on or after December 15, 2008, which for the Company was July 1, 2009 (fiscal 2010). The impact of the standard on the Company’s financial position, results of operations or cash flows will depend upon the nature, terms and size of the acquisitions the Company may consummate in the future.
In April 2008, the FASB issued accounting guidance contained within ASC Subtopic 350-30, “Intangibles – Goodwill and Other” (ASC 350-30) and FASB ASC topic 275, “Risk and Uncertainties” (ASC 275). The standard amended the factors that should be considered in developing renewal or extension assumptions used to determine the useful life of a recognized intangible asset under previously issued goodwill and intangible assets topics. The requirements for determining useful lives and the related disclosure requirements must be applied prospectively to all intangible assets recognized as of, and subsequent to, the effective date. The standard is
57
Table of Contents
effective for fiscal years beginning after December 15, 2008, which for the Company was July 1, 2009 (fiscal 2010). The Company’s adoption of the standard has not had a material impact on the Company’s financial position, results of operations or cash flows.
In April 2009, the FASB issued ASC Topic 825, “Financial Instruments.” The standard requires disclosures about fair value of financial instruments for interim reporting periods, as well as in annual financial statements, whether or not then reflected on the balance sheet date at fair value. The Company adopted the disclosure requirements of the standard in its first quarter of fiscal 2010. The Company’s adoption of the standard has not had a material impact on the Company’s financial position, results of operations or cash flows; however, it did result in enhanced disclosure about fair value of financial instruments. See Note 9 for the fair value of the Company’s financial instruments.
In August 2009, the FASB issued ASU 2009-05, “Fair Value Measurements and Disclosure” (ASC Topic 820), which was effective immediately for the Company’s first quarter of fiscal 2010, and which provides guidance on fair value measurements of liabilities and amended ASC Subtopic 820-10. The Company’s adoption of this update has not had a material impact on the Company’s financial position, results of operations or cash flows. See Note 9 for the fair value of the Company’s financial instruments.
In January 2010, the FASB issued ASU 2010-06, “Fair Value Measurements and Disclosures ASC Topic 820,” to improve and clarify existing fair value disclosures, including requirements for entities to disclose any significant transfers in and out of fair value hierarchy levels 1 and 2, along with a description of the reasons for the transfers, as well as to disclose the inputs and valuation techniques used for fair value measurements for Level 2 and Level 3 hierarchy. The Company adopted the disclosure requirements of the standard in its third quarter of fiscal 2010. As this guidance provides only disclosure requirements, the Company’s adoption of this update did not have a material impact on the Company’s financial position, results of operations or cash flows. See Note 9 for the fair value of the Company’s financial instruments.
TO BE ADOPTED:
In October 2009, the FASB issued ASU 2009-13, “Revenue Recognition for Multiple-Deliverable Revenue Arrangements of FASB ASC Topic 605,” which amends ASC Subtopic 605-25, and will be effective prospectively for revenue arrangements entered into or materially modified in fiscal years beginning on or after June 15, 2010, which for the Company is its fiscal 2011. Alternatively, adoption may be on a retrospective basis, and early application is permitted. This statement provides principles for allocation of consideration among its multiple-elements based on an element’s estimated selling price if vendor-specific (VSOE) or other third-party evidence (TPE) of value is not available. This statement allows more flexibility in identifying and accounting for separate deliverables under an arrangement, introduces an estimated selling price method for valuing the elements of a bundled arrangement if VSOE or TPE of selling price is not available, and significantly expands related disclosure requirements. The Company’s adoption of this new accounting update on July 1, 2010 (fiscal 2011) did not have a significant impact on the Company’s consolidated financial position, results of operations or cash flows, however, the Company will continue to assess the impact of any future arrangements entered into or materially modified after the Company’s adoption.
In April 2010, the FASB issued ASU 2010-17, “Milestone Method of Revenue Recognition of FASB ASC Topic 605,” which will be effective prospectively for revenue arrangements entered into or materially modified in fiscal years beginning on or after June 15, 2010, which for the Company is its fiscal 2011. This statement provides criteria for recognizing the achievement of a milestone in its entirety as revenue in the period in which the milestone is achieved, only if the milestone meets all criteria considered substantive made at the inception of the arrangement. The Company’s adoption of this new accounting update on July 1, 2010 (fiscal 2011) did not have a significant impact on the Company’s consolidated financial position, results of operations or cash flows, however, the Company will continue to assess the impact of any future arrangements entered into or materially modified after the Company’s adoption.
58
Table of Contents
| 2. | INVESTMENTS |
Investments as of June 30, 2010 consist of non-taxable and taxable high quality municipal obligations and non-taxable and taxable U.S. government securities. In accordance with FASB ASC Topic 320, “Investments – Debt and Equity Securities,” the Company has classified its entire investment portfolio as available-for-sale securities with secondary or resale markets and, as such, its portfolio is reported at fair value with unrealized gains and losses included in Comprehensive Income in stockholders’ equity and realized gains and losses included in Other income/expense. The following is a summary of available-for-sale securities as of June 30, 2010 and June 30, 2009:
| June 30, 2010 | |||||||||||||
| Amortized Cost |
Gross Unrealized | Estimated Fair Value | |||||||||||
| Description |
Gain | Loss | |||||||||||
| Municipal Obligations |
$ | 33,693,441 | $ | 509,300 | $ | (9,683 | ) | $ | 34,193,058 | ||||
| U.S. Government Securities |
8,376,007 | 2,479 | — | $ | 8,378,486 | ||||||||
| Total Investments |
$ | 42,069,448 | $ | 511,779 | $ | (9,683 | ) | $ | 42,571,544 | ||||
| June 30, 2009 | |||||||||||||
| Amortized Cost |
Gross Unrealized | Fair Value | |||||||||||
| Description |
Gain | Loss | |||||||||||
| Municipal Obligations |
$ | 30,142,428 | $ | 164,364 | $ | (76,661 | ) | $ | 30,230,131 | ||||
| U.S. Government Securities |
— | — | — | — | |||||||||
| Total Investments |
$ | 30,142,428 | $ | 164,364 | $ | (76,661 | ) | $ | 30,230,131 | ||||
The Company’s U.S. government securities are comprised of U.S. government agency debt instruments. As of June 30, 2010, the Company’s investments had maturities ranging from less than one year to approximately three years. The fair values of the Company’s municipal obligations and U.S. government agency debt instruments are obtained from broker quotes using pricing matrices based on inputs that may include quoted prices for identical or similar assets in the municipal and U.S. government bond market and based on other various inputs that are directly or indirectly observable.
Certain investment securities shown below as of June 30, 2010 had fair values less than their amortized costs and, therefore, contained unrealized losses. The Company has evaluated these investments and has determined that the decline in value was not related to any Company or industry specific event. As of June 30, 2010, there were 8 out of 56 investments with unrealized losses. The gross unrealized losses related to these investments were due to either changes in interest rates or investments having been obtained at a premium. Given that the Company has no intent to sell any of these investments until a recovery of its fair value, which may be at maturity, and there is no current requirement to sell any of these investments, the Company did not consider these investments to be other-than-temporarily impaired as of June 30, 2010. The Company anticipates full recovery of amortized costs with respect to these investments at maturity or sooner in the event of a more favorable market interest rate environment. The duration of time the investments had been in a continuous unrealized loss position as of June 30, 2010 were as follows:
| Description |
Loss < 12 months | Loss > or equal to 12 months | Total | |||||||||||||||||
| Fair Value | Gross Unrealized Losses |
Fair Value |
Gross Unrealized Losses |
Fair Value |
Gross Unrealized Losses |
|||||||||||||||
| Municipal Obligations |
$ | 8,596,297 | $ | (9,683 | ) | $ | — | $ | — | $ | 8,596,297 | $ | (9,683 | ) | ||||||
| Total Investments |
$ | 8,596,297 | $ | (9,683 | ) | $ | — | $ | — | $ | 8,596,297 | $ | (9,683 | ) | ||||||
59
Table of Contents
| 3. INVENTORY |
Inventory is stated at the lower of cost (determined by the average cost method, which approximates first-in, first-out) or market value. Inventory primarily includes the cost of material utilized in the processing of the Company’s products and is as follows:
| June 30, | ||||||||
| 2010 | 2009 | |||||||
| Raw materials |
$ | 7,550,043 | $ | 7,974,295 | ||||
| Work in process |
1,425,174 | 1,541,386 | ||||||
| Finished goods |
2,018,512 | 2,640,419 | ||||||
| Gross inventory |
10,993,729 | 12,156,100 | ||||||
| Provision for inventory obsolescence |
(2,107,854 | ) | (1,571,035 | ) | ||||
| Inventory |
$ | 8,885,875 | $ | 10,585,065 | ||||
Adjustments to inventory are made at the individual part level for estimated excess, obsolescence or impaired balances, to reflect inventory at the lower of cost or market. Factors influencing these adjustments include: changes in demand, rapid technological changes, product life cycle and development plans, component cost trends, product pricing, physical deterioration and quality concerns. Revisions to these adjustments would be required if any of these factors differ from the Company’s estimates.
The June 30, 2010 inventory balances also reflect the Company’s implemented cost reduction plan, which occurred in its second quarter of fiscal 2010, primarily associated with its reduced endovascular activities and lower production volume, which included reduced work schedules. In connection with this plan, the Company incurred a $944,000 pre-tax unabsorbed overhead expense charge in its second quarter of fiscal 2010.
| 4. | SELECT CUSTOMER AGREEMENTS |
St. Jude Medical, Inc.
The License Agreements – Under license agreements with St. Jude Medical, St. Jude Medical has exclusive worldwide rights to manufacture and market the Angio-SealTM Vascular Closure Device (the Angio-Seal), for which the Company receives an approximate 6% royalty on end-user product sales by St. Jude Medical.
Existing Component Supply Contract – Under a supply agreement executed with St. Jude Medical in 2005, the Company is the exclusive supplier of 100% of the collagen plug and at least 30% of the bioresorbable polymer anchor components for the Angio-Seal over the term of the agreement, which expires in December 2010. As part of the agreement, the Company received a $1.0 million origination fee upon execution, as consideration for the Company’s ongoing investments in collagen research and development. As of June 30, 2010 the Company had recognized $958,460 of this origination fee and the remaining $41,540 had been recorded as deferred revenue to be recognized over the remaining period of the contract.
New Collagen Supply Agreement – On June 23, 2010, the Company entered into a new two-year supply agreement with St. Jude Medical effective for the period from January 1, 2011 to December 31, 2012. Under this new supply agreement, the Company will be the exclusive outside supplier of collagen plugs to St. Jude Medical. The new supply agreement provides for calendar year 2011 minimum order levels equivalent to approximately 25% of fiscal year 2010 annual collagen plug sales and calendar year 2012 minimum order levels equivalent to approximately 20% of our fiscal year 2010 collagen plug sales. The new supply agreement does not call for the Company to supply polymer anchors to St. Jude Medical.
Orthovita, Inc.
The Company has a development, manufacturing and supply agreement with Orthovita under which the Company develops and commercializes products based on Orthovita’s proprietary Vitoss™ Bone Graft
60
Table of Contents
Substitute Material in combination with the Company’s proprietary biomaterials (the Orthovita Agreement). Under the Orthovita Agreement, the Company manufactures the products, while Orthovita markets and sells the products worldwide. Under the Orthovita Agreement, the Company receives royalty payments on co-developed Vitoss™, Vitoss™ Foam and Vitoss™ Bioactive Foam products based upon Orthovita’s net total end-user sales of such products.
In a separate transaction in August 2004, the Company entered into an agreement (the Assignment Agreement) whereby the Company acquired the intellectual property rights of a third party having rights in the Vitoss™ technology, an inventor of the Vitoss™ technology (the Inventor), for $2,600,000. Under the Assignment Agreement, the Company received all intellectual property rights of the Inventor that had not previously been assigned to Orthovita. Also under the Assignment Agreement, the Company generally receives a royalty on the sale of all Orthovita products containing the Vitoss™ technology, up to a total to be received of $4,035,782. The entire cost of these proprietary rights is expected to be amortized over an approximate 82 month period. As of June 30, 2010, the Company had recognized cumulative royalty income of $3,452,283 under the Assignment Agreement and $583,499 was yet to be received. The Company currently anticipates receiving the remaining economic benefit in relation to these proprietary rights during fiscal 2011.
| 5. | CONCENTRATION OF CREDIT RISK |
Financial instruments that potentially subject the Company to significant concentrations of credit risk consist primarily of cash and cash equivalents, investments, accounts receivable and debt (See Note 8). The Company manages its cash, cash equivalents and investments based on established guidelines relative to diversification and maturities to maintain safety and liquidity. No single component of the Company’s investment portfolio represented more than 11% or 4% of the total investments as of June 30, 2010 and 2009, respectively.
Trade receivables are primarily due from St. Jude Medical, Arthrex and Orthovita and represented approximately 40%, 29% and 13% of the Company’s total trade receivables, respectively, at June 30, 2010. Trade receivables from the same companies represented approximately 31%, 26% and 22% of the Company’s total trade receivables, respectively, at June 30, 2009. Royalty receivables are primarily due from St. Jude Medical and Orthovita, and represented approximately 90% and 9%, respectively, of the Company’s total royalty receivable balance at June 30, 2010. Royalty receivables from St. Jude Medical and Orthovita represented approximately 83% and 16%, respectively, of the Company’s total royalty receivable balance at June 30, 2009 (See Note 4). If any of these customers’ receivable balances should be deemed uncollectible, it would have a material adverse effect on the Company’s results of operations and financial condition. The Company performs ongoing credit evaluations on all of its customers’ financial conditions, but does not require collateral to support customer receivables. See Note 13 for additional information regarding significant customer revenue disclosure.
| 6. | ACQUIRED PATENTS AND OTHER INTANGIBLE ASSETS |
The costs of internally developed patents are expensed when incurred due to the long development cycle for products and the Company’s inability to measure the recoverability of these costs when incurred. From time to time, the Company has acquired portfolios of patents and other intangibles that it believes are beneficial and complementary to the Company’s existing intellectual property and material processing knowledge platform. These acquisitions have included a portfolio of puncture closure patents acquired in November 1997, patents acquired in the asset purchase of THM Biomedical, Inc. (THM) in 2000, certain intellectual property and other rights related to the Vitoss™ product line acquired from a third party inventor in 2004 (See Note 4) and certain assets of MacroPore Biosurgery, Inc. (MacroPore) acquired in 2007, as well as other smaller purchases.
The Company amortizes the entire cost of acquired patents and intangible assets over their respective remaining periods of economic benefit, ranging from approximately 1 to 6 years as of June 30, 2010. The gross carrying amount of such patents and intangible assets as of June 30, 2010 was $8,677,200, with accumulated amortization of $6,628,605.
61
Table of Contents
Amortization expense on these patents and intangible assets was $967,279, $1,122,937 and $1,075,914 for the fiscal years ended June 30, 2010, 2009 and 2008, respectively. Included in this expense for the fiscal year ended June 30, 2008, was $176,756 of amortization expense related to certain patents sold to Spectranetics. The table below details the estimated amortization expense as of June 30, 2010, for the next five fiscal years on the patents and intangible assets previously acquired by the Company:
| Fiscal year ending |
Amortization Expense | |
| 2011 |
$960,031 | |
| 2012 |
629,181 | |
| 2013 |
242,444 | |
| 2014 |
198,504 | |
| 2015 |
17,997 | |
| Thereafter |
438 |
| 7. | ACCRUED EXPENSES |
As of June 30, 2010 and 2009, accrued expenses consisted of the following:
| June 30, 2010 |
June 30, 2009 | |||||
| Accrued payroll and related compensation |
$ | 2,987,702 | $ | 3,032,145 | ||
| Accrued endovascular transaction exit costs |
327,698 | 1,058,990 | ||||
| Taxes payable |
1,627,630 | 909,410 | ||||
| Other |
551,880 | 541,259 | ||||
| Total |
$ | 5,494,910 | $ | 5,541,804 | ||
The Company incurred a severance charge of $1,011,058 during its second quarter ended December 31, 2009, primarily as a result of a voluntary retirement program, which was included in the same line items as salary expense on the Consolidated Statements of Income. As of June 30, 2010, there was $82,277 remaining related to the severance charge included in accrued payroll and related compensation.
| 8. | DEBT |
Secured Commercial Mortgage – On May 25, 2006, the Company entered into an agreement for a $35 million Secured Commercial Mortgage (the Mortgage) with Citibank, F.S.B. The Mortgage is secured by the Company’s facility and land in Exton, Pennsylvania and bears interest at one-month LIBOR plus an 0.82% Loan Credit Spread.
At June 30, 2010, the outstanding Mortgage balance was $31.4 million. The remaining principal payments due are detailed below:
| Fiscal Year ending June 30, |
Principal Payments | |
| 2011 |
$1,399,997 | |
| 2012 |
1,400,000 | |
| 2013 |
1,400,000 | |
| 2014 |
1,400,000 | |
| 2015 |
1,400,000 | |
| Thereafter |
24,383,333 |
62
Table of Contents
The Mortgage contains various conditions to borrowing, including affirmative, restrictive and financial maintenance covenants. Certain of the more significant covenants require the Company to maintain a Minimum Fixed Charge Coverage Ratio of EBITDA (as defined in the Mortgage) to debt service equal to or greater than 1.50–to–1.0 and an interest rate hedge of at least 50 percent of the outstanding principal balance of the Mortgage through an interest rate protection product reasonably acceptable to Citibank, F.S.B.
Interest Rate Swap Agreement – In order to hedge its interest rate risk under the Mortgage, the Company entered into a $35 million aggregate 10-year fixed interest rate swap agreement (the Swap) with Citibank, N.A. in May 2006. The Swap is secured by the Company’s facility and land in Exton, Pennsylvania. The Company is using the Swap as a cash flow hedge of the Company’s interest payments under the Mortgage. The Swap converts the variable LIBOR portion of the Mortgage payments to a fixed rate of 6.44% (5.62% fixed interest rate plus a 0.82% Loan Credit Spread).
The Company follows the provisions of FASB ASC Topic 815, “Derivatives and Hedging,” to account for the Swap as a cash flow hedge due to the hedging of forecasted interest rate payments and to record the Swap at its fair value on the Consolidated Balance Sheets. This value represents the estimated amount the Company would receive or pay to terminate the Swap. As such, the Company records a mark-to-market adjustment at the end of each period. In establishing the fair value, the Company includes and evaluates dealer quotes, the counterparty’s ability to settle the asset or liability and the counterparty’s creditworthiness. Additionally, current interest rates, collateralization of the Mortgage and the Swap by the land and building and any adverse Company or industry specific events that would impact the fair value measurement are considered.
The Company utilizes the Hypothetical Derivative Method in determining hedge effectiveness each period. Transactions that would cause ineffectiveness would include the prepayment of the Mortgage or an adverse Company or industry specific event that would impact the fair value measurement, which would result in the Company reclassifying the ineffective portion into current earnings and an impact to the Consolidated Statements of Cash Flows. If the conditions underlying the Swap or the hedge item do not change, the Swap will be considered to be highly effective. The effective portion of the Swap’s gain or loss, due to a change in the fair value, is reported as a component of Accumulated other comprehensive loss and has no impact on the Consolidated Statements of Income or Cash Flows.
As of June 30, 2010 and 2009, the fair value of the Swap was in an unrealized loss position of $5,542,509 ($3,602,631, net of tax) and $4,502,900 ($2,926,885, net of tax), respectively, with the gross unrealized loss position included in Other non-current liabilities and the net of tax position included in Accumulated other comprehensive loss on the Consolidated Balance Sheets. Interest expense under the Swap is recorded in earnings at the fixed rate set forth in the Swap.
For the fiscal years ended June 30, 2010, 2009 and 2008, no amounts were recognized in current earnings due to ineffectiveness or amounts excluded from the assessment of hedge effectiveness. The Company does not anticipate any material unrealized losses to be recognized within the next 12 months as the anticipated transactions under the Mortgage and Swap occur, unless the Mortgage or a portion thereof, is prepaid.
The following table summarizes the fair value of the Swap as of June 30, 2010 and June 30, 2009 on the Consolidated Balance Sheet:
| Derivative Designed as a Hedging Instrument |
Location in the Condensed Consolidated Balance Sheet |
Fair Value as of June 30, 2010 |
Fair Value as of June 30, 2009 | |||||
| Interest Rate Swap Contract |
Other non-current liabilities | $ | 5,542,509 | $ | 4,502,900 | |||
| Total Derivative |
$ | 5,542,509 | $ | 4,502,900 | ||||
63
Table of Contents
The following tables summarize the Swap’s impact on Accumulated other comprehensive loss and earnings for the years ended June 30, 2010 and 2009:
| Amount of Gain/(Loss) Recognized in Other Comprehensive Loss on Derivative (Effective Portion) For the Year Ended June 30, |
||||||||
| Derivative in Cash Flow Hedging Relationship |
2010 | 2009 | ||||||
| Interest Rate Swap Contract |
$ | (2,786,046 | ) | $ | (1,290,901 | ) | ||
| Total |
$ | (2,786,046 | ) | $ | (1,290,901 | ) | ||
| Amount of Gain/(Loss) Reclassed From Accumulated Other Comprehensive Loss Into Income (Effective Portion) |
||||||||
| For the Year Ended June 30, | ||||||||
| Location of Loss Reclassed From Accumulated Other Comprehensive Loss Into Income |
2010 | 2009 | ||||||
| Interest expense |
$ | (1,746,437 | ) | $ | (1,398,298 | ) | ||
| Total |
$ | (1,746,437 | ) | $ | (1,398,298 | ) | ||
| Amount of Gain /(Loss) Recognized in Income on Derivative (Ineffective Portion) | ||||||
| For the Year Ended June 30, | ||||||
| Location of Loss Reclassed From Accumulated Other Comprehensive Loss Into Income |
2010 | 2009 | ||||
| Interest expense |
$ | — | $ | — | ||
| Total |
$ | — | $ | — | ||
| 9. | FAIR VALUE OF FINANCIAL ASSETS AND FINANCIAL LIABILITIES |
The Company follows the provisions of FASB ASC Topic 820 for fair value measurement recognition and disclosure purposes for its financial assets and financial liabilities that are remeasured and reported at fair value each reporting period. The Company measures certain financial assets and liabilities at fair value on a recurring basis, including cash equivalents, available-for-sale securities and the Swap. The Company’s assessment of the significance of a particular input to the fair value measurement requires judgment and may affect the valuation of financial assets and financial liabilities and their placement within the fair value hierarchy. Categorization is based on a three-tier valuation hierarchy, which prioritizes the inputs used in measuring fair value, as follows:
| • | Level 1 – Observable inputs such as quoted prices (unadjusted) in active markets for identical assets or liabilities; |
| • | Level 2 – Inputs that are other than quoted prices in active markets for identical assets and liabilities, inputs that are quoted prices for identical or similar assets or liabilities in inactive markets, or other inputs that are either directly or indirectly observable; and |
| • | Level 3 – Unobservable inputs in which little or no market data exists, therefore requiring an entity to develop its own assumptions. |
64
Table of Contents
The following table presents the Company’s financial assets and liabilities measured at fair value on a recurring basis as of June 30, 2010 and June 30, 2009:
| Fair Value Measurements as of June 30, 2010 | |||||||||
| Level 1 | Level 2 | Level 3 | |||||||
| Assets |
|||||||||
| Money market funds (a) |
$ | 21,813,659 | $ | — | $ | — | |||
| Available-for-sale marketable securities: |
|||||||||
| Municipal Obligations and U.S. Government Securities (See Note 2) |
— | 42,571,544 | — | ||||||
| Total Assets |
$ | 21,813,659 | $ | 42,571,544 | $ | — | |||
| Liabilities |
|||||||||
| Interest rate swap (See Note 8) |
$ | — | $ | 5,542,509 | $ | — | |||
| Total Liabilities |
$ | — | $ | 5,542,509 | $ | — | |||
| Fair Value Measurements as of June 30, 2009 | |||||||||
| Level 1 | Level 2 | Level 3 | |||||||
| Assets |
|||||||||
| Money market funds (a) |
$ | 48,416,426 | $ | — | $ | — | |||
| Available-for-sale marketable securities: |
|||||||||
| Municipal Obligations (See Note 2) |
— | 30,230,131 | — | ||||||
| Total Assets |
$ | 48,416,426 | $ | 30,230,131 | $ | — | |||
| Liabilities |
|||||||||
| Interest rate swap (See Note 8) |
$ | — | $ | 4,502,900 | $ | — | |||
| Total Liabilities |
$ | — | $ | 4,502,900 | $ | — | |||
| (a) | The Company’s money market funds are classified along with the Company’s cash balances as Cash and cash equivalents within the Consolidated Balance Sheets. Money market funds are valued at quoted prices in active markets. |
The Company follows the disclosure provisions of FASB ASC Topic 825, “Financial Instruments” (ASC 825), for disclosure purposes for financial assets and financial liabilities that are not measured at fair value. As of June 30, 2010, the financial assets and liabilities recorded on the Consolidated Balance Sheets that are not measured at fair value on a recurring basis include accounts receivable, net, accounts payable and debt obligations. The carrying value of accounts receivable, net, accounts payable and current debt obligations, approximate fair value due to the short-term nature of these instruments. The fair value of long-term debt, where a quoted market price was not available, is evaluated based on, among other factors, interest rates currently available to the Company for debt with similar terms, remaining payments and considerations of the Company’s creditworthiness. The Company determined that the recorded book value of long-term debt approximates fair value at June 30, 2010 due to the variable LIBOR portion of the Mortgage payments.
| 10. | PREFERRED STOCK |
The Company has authorized Preferred Stock consisting of 100,000 shares with a $.001 par value, 25,000 of which are designated as Series A Junior Participating Preferred Stock, as discussed below, and 75,000 of which are undesignated. The Board of Directors may authorize the issuance of Preferred Stock, which ranks senior to the Common Stock with respect to the payment of dividends and the distribution of assets on liquidation. In addition, the Board of Directors is authorized to fix the limitations and restrictions, if any, upon the payment of
65
Table of Contents
dividends on Common Stock to be effective while any shares of Preferred Stock are outstanding. The Board of Directors, without stockholder approval, can issue Preferred Stock with voting and conversion rights, which could adversely affect the voting power of the holders of Common Stock. At June 30, 2010 and 2009, no shares of Preferred Stock were outstanding. The Company has no present intention to issue shares of Preferred Stock (except that shares of Series A Preferred Stock (as defined below) may be issued pursuant to a stockholders’ rights plan, as described below).
Stockholders’ Rights Plan
On June 19, 2009, the Company announced that its Board of Directors adopted a stockholders’ rights plan (rights plan) that is designed to protect the Company and its stockholders from potentially coercive takeover practices or bids, and to prevent an acquiror from gaining control of the Company without offering a fair price to the stockholders. The Company adopted the plan in order to give its Board of Directors time to evaluate and respond to any unsolicited potential takeover attempts.
Under the rights plan, the Company distributed, as a dividend, one preferred stock purchase right for each share of Common Stock held of record as of the close of business on June 19, 2009. The rights plan has a term of 10 years and will expire on June 19, 2019, unless the Company earlier redeems the rights or the Board of Directors terminates the rights plan. Each right, if and when it becomes exercisable, entitles a holder to buy one one-thousandth of a share of Series A Junior Participating Preferred Stock (collectively, Preferred Shares) for $200.00, subject to certain conditions in the plan under which the exercise price may change.
Pursuant to the Certificate of Designations of Series A Junior Participating Preferred Stock (Series A Preferred Stock), there are 25,000 shares of Series A Preferred Stock authorized for issuance. Each share of Series A Preferred Stock will entitle the holder thereof to 1,000 votes on all matters submitted to a vote of the stockholders of the Company, and the holders of the shares of Series A Preferred Stock and the holders of shares of Common Stock of the Company and any other capital stock of the Company having general voting rights will vote together as one class on all matters submitted to a vote of the stockholders of the Company. Holders of the shares of Series A Preferred Stock will be entitled to receive, if declared by the Board of Directors, dividends payable when and as dividends are declared on the shares of Common Stock of the Company in an amount, subject to adjustment, equal to 1,000 times the aggregate per share amount of all cash dividends, and 1,000 times the aggregate per share amount of all non-cash dividends or other distributions, declared on the shares of the Company’s Common Stock. At June 30, 2010 and 2009, no shares of Series A Preferred Stock were outstanding.
| 11. | STOCK REPURCHASE PROGRAM |
From time to time, the Company has made repurchases of its stock, as authorized by the various stock repurchase programs established by the Company’s Board of Directors, and through other miscellaneous transactions. On June 16, 2010, the Company announced that its Board of Directors approved a stock repurchase program allowing the Company to repurchase up to a total of $30 million of its issued and outstanding shares of Common Stock.
During the year ended June 30, 2010, the Company repurchased and retired 1,794,705 shares of Common Stock at a total cost of approximately $41,309,153, or an average market price of $23.02 per share, using available cash. Commissions and other related costs associated with these stock repurchases totaled $55,788. An additional 34,400 shares were repurchased in June 2010, and were settled in July 2010 at a cost of $811,054, or an average market price per share of $23.58. As of June 30, 2010, there was $29,188,946 remaining available for repurchase under the current stock repurchase program and no amount was remaining for repurchase under the Company’s prior stock repurchase programs.
During the year ended June 30, 2009, the Company repurchased and retired 806,666 shares of Common Stock at a cost of $19,294,595, or an average market price of $23.92 per share, using available cash. Commissions and
66
Table of Contents
other related costs associated with these stock repurchases totaled $32,265. An additional 3,500 shares were repurchased in June 2009, and were settled in July 2009 at a cost of $87,279, or an average market price per share of $24.94.
For the year ended June 30, 2008, the Company repurchased and retired 867,839 shares of Common Stock at a cost of $24,426,699, or an average market price of $28.15 per share, using available cash. Commissions and other related costs associated with the stock repurchased totaled $36,040. All such share repurchases were settled as of June 30, 2008.
| 12. | SHARE-BASED COMPENSATION |
The Company accounts for its share-based compensation plans in accordance with ASC 718. Compensation expense related to share-based awards is classified on the Consolidated Statements of Income within the same line items as salary or consulting expense with respect to the award recipients, and is recorded over the awards’ relevant vesting periods. Compensation expense related to share-based awards granted to the members of the Board of Directors is recorded as a component of Selling, general and administrative expense on the Consolidated Statements of Income.
The following table provides a summary of the Company’s share-based compensation expense:
| Year Ending June 30, | Estimated Unrecognized Share-based Compensation as of June 30, 2010 |
Weighted Average Period Remaining of Share-based Compensation as of June 30, 2010 | ||||||||||||||
| 2010 | 2009 | 2008 | ||||||||||||||
| Stock options |
$ | 3,011,699 | $ | 1,939,330 | $ | 1,901,510 | $ | 4,383,204 | 1.71 | |||||||
| Non-vested stock awards |
537,252 | 513,630 | 2,050,892 | 896,000 | 1.98 | |||||||||||
| SARs |
(163,928 | ) | (390,503 | ) | 1,370,753 | — | 1.17 | |||||||||
| Total share-based compensation |
$ | 3,385,023 | $ | 2,062,457 | $ | 5,323,155 | $ | 5,279,204 | ||||||||
The share-based compensation expense during fiscal year 2008 included a one-time accelerated vesting charge of $2,974,033 as described in detail below.
Accelerated Vesting of all Equity Awards
The acquisition by Ramius Capital Group, L.L.C. and its affiliates, of more than 20 percent of the Company’s outstanding Common Stock on August 30, 2007, constituted a “Change in Control” as defined under the Employee Plan as it then existed. As a result, all outstanding unvested stock options, cash-settled stock appreciation rights (SARs) and nonvested stock awards held by officers, employees, directors and others under this plan automatically became vested (and, in the case of options and stock appreciation rights, exercisable) in full.
As part of the accelerated vesting, unvested stock option grants to purchase 114,405 shares of the Company’s Common Stock became fully vested and exercisable. Of these options, non-employee members of the Board of Directors held options to purchase 37,500 shares, and non-executive employees held options to purchase the remaining 76,905 shares. There were no unvested stock options held by executive officers. Compensation expense that would otherwise have been recorded over a weighted average period of 1.85 years was $920,131, or $607,286 net of related tax effects, and was recognized as an accelerated vesting charge during the fiscal year ended June 30, 2008.
67
Table of Contents
A total of 94,537 shares of nonvested stock awards became fully vested and were released at a market value of $23.97 per share, the closing price of the Company’s Common Stock on August 30, 2007. Non-employee members of the Board of Directors held 34,780 shares, 45,031 shares were held by officers, and other employees held the remaining 14,726 shares. Compensation expense of $1,624,142, or $1,071,934 net of related tax effects, that otherwise would have been recorded over a weighted average period of 1.36 years was recognized during the fiscal year ended June 30, 2008 as an accelerated vesting charge.
In addition, 283,690 SARs also became fully vested and exercisable on August 30, 2007. Of these SARs, 179,690 awards had been granted to employees at a stock price of $29.88, and the remaining 104,000 SARs awards had been granted to officers at a stock price of $31.36. An accelerated vesting charge of $429,760, or $283,642 net of related tax effects, was recognized during the fiscal year ended June 30, 2008.
Stock Options
Stock options have been granted to officers and other employees and members of the Board of Directors of the Company, as well as non-employee outside consultants under the Company’s Seventh Amended and Restated Kensey Nash Corporation Employee Incentive Compensation Plan, and prior versions of this incentive compensation plan (the Employee Plan). The Company also has a Non-employee Directors’ Stock Option Plan (the Directors’ Plan). No shares are available for new awards under this plan and any awards of the type granted previously under the Directors’ Plan are now granted under the Employee Plan. The fair value of each option grant was estimated on the date of grant using the Black-Scholes option-pricing model that uses the assumptions noted in the following table.
| Granted During Year Ended June 30, | ||||||
| 2010 | 2009 | 2008 | ||||
| Dividend yield |
0% | 0% | 0% | |||
| Expected volatility |
||||||
| Employee Plan |
33% - 49% | 35% | 35% | |||
| Directors’ Plan |
— | — | — | |||
| Weighted-average volatility |
||||||
| Employee Plan |
39.36% | 35% | 35% | |||
| Directors’ Plan |
— | — | — | |||
| Risk-free interest rate |
||||||
| Employee Plan |
.060% - 3.160% | 1.14% - 3.492% | 1.63% - 4.286% | |||
| Directors’ Plan |
— | — | — | |||
| Expected lives (in years): |
||||||
| Employee Plan |
0.25 - 7.57 | 0.25 - 6.30 | 0.25 - 6.33 | |||
| Directors’ Plan |
— | — | — | |||
Options are exercisable over a maximum term of ten years from the date of grant and typically vest over periods of zero to four years from the grant date. Expected volatilities are based on historical volatility of the Company’s Common Stock, and other factors. The Company uses historical data to estimate option exercise and employee termination within the valuation model; separate groups of employees that have similar historical exercise behavior are considered separately for valuation purposes. The expected terms of options are derived from historical exercise behavior and represent the periods of time that options granted are expected to be outstanding. The total intrinsic value of options exercised during the years ended June 30, 2010, 2009 and 2008, was $787,511, $5,052,764 and $7,717,073, respectively.
68
Table of Contents
A summary of the stock option activity under both plans for the fiscal years ended June 30, 2010, 2009 and 2008, is as follows:
| Employee Plan | Directors’ Plan | |||||||||||||||||||||||
| Shares | Weighted Avg Exercise Price |
Aggregate Intrinsic Value |
Weighted Avg Remaining Contractual Term |
Shares | Weighted Avg Exercise Price |
Aggregate Intrinsic Value |
Weighted Avg Remaining Contractual Term | |||||||||||||||||
| Balance at June 30, 2007 |
1,859,985 | $ | 18.56 | $ | 17,478,258 | 4.72 | 327,500 | $ | 20.12 | $ | 2,471,815 | 5.10 | ||||||||||||
| Granted |
332,240 | $ | 28.02 | — | — | |||||||||||||||||||
| Cancelled |
(78,033 | ) | $ | 28.99 | — | — | ||||||||||||||||||
| Exercised |
(475,148 | ) | $ | 12.91 | (17,000 | ) | $ | 14.40 | ||||||||||||||||
| Balance at June 30, 2008 |
1,639,044 | $ | 21.62 | $ | 17,547,996 | 4.78 | 310,500 | $ | 20.43 | $ | 3,607,560 | 4.00 | ||||||||||||
| Granted |
364,970 | $ | 30.86 | — | — | |||||||||||||||||||
| Cancelled |
(89,180 | ) | $ | 29.08 | (19,500 | ) | $ | 26.69 | ||||||||||||||||
| Exercised |
(243,930 | ) | $ | 17.43 | (58,000 | ) | $ | 15.47 | ||||||||||||||||
| Balance at June 30, 2009 |
1,670,904 | $ | 23.85 | $ | 8,222,304 | 5.04 | 233,000 | $ | 21.14 | $ | 1,441,568 | 3.53 | ||||||||||||
| Granted |
364,590 | $ | 28.55 | — | — | |||||||||||||||||||
| Cancelled |
(152,066 | ) | $ | 30.65 | — | — | ||||||||||||||||||
| Exercised |
(42,944 | ) | $ | 13.56 | (22,500 | ) | $ | 13.25 | ||||||||||||||||
| Balance at June 30, 2010 |
1,840,484 | $ | 24.46 | $ | 5,966,212 | 4.93 | 210,500 | $ | 21.98 | $ | 736,218 | 2.52 | ||||||||||||
| Shares vested + expected to vest |
1,823,368 | $ | 24.42 | $ | 5,958,631 | 4.88 | 210,500 | $ | 21.98 | $ | 736,218 | 2.52 | ||||||||||||
| Exercisable portion |
1,257,181 | $ | 22.29 | $ | 5,814,327 | 3.20 | 210,500 | $ | 21.98 | $ | 736,218 | 2.52 | ||||||||||||
| Available for future grant |
794,205 | — | ||||||||||||||||||||||
| Weighted-average fair value of options granted during the year ended June 30, |
||||||||||||||||||||||||
| 2008 |
$ | 10.67 | $ | — | ||||||||||||||||||||
| 2009 |
$ | 11.08 | $ | — | ||||||||||||||||||||
| 2010 |
$ | 10.51 | $ | — | ||||||||||||||||||||
Nonvested Stock Awards
Nonvested stock awards have been granted to the non-employee members of the Board of Directors, executive officers, certain other management of the Company and a non-employee outside consultant, pursuant to the Employee Plan, and generally vest in three equal annual installments based solely on continued employment or service, as applicable, with the Company. Nonvested stock awards granted to executive officers, management, non-employee members of the Board of Directors and non-employee consultants usually are referred to as restricted stock, but ASC 718 reserves that term for fully vested and outstanding shares, the sale of which is contractually or governmentally prohibited for a specified period of time. Fair value is based upon the closing price of the Company’s Common Stock on the date of grant.
The total fair value of shares vested during the years ended June 30, 2010, 2009 and 2008 was $496,692, $271,714 and $2,487,246, respectively.
69
Table of Contents
The following table outlines nonvested stock award activity for the fiscal years ended June 30, 2010, 2009 and 2008:
| Employee Plan | |||||||
| Shares | Weighted Average Price Per Share | ||||||
| Balance June 30, 2007 |
105,035 | $ | 29.90 | ||||
| Granted: |
|||||||
| Non-employee Directors |
32,179 | 29.37 | |||||
| Issued: |
|||||||
| Non-employee Directors |
(35,760 | ) | 27.82 | ||||
| Executive officers & management |
(67,757 | ) | 29.91 | ||||
| Cancelled: |
|||||||
| Non-employee Directors |
(1,998 | ) | 23.36 | ||||
| Executive officers & management |
(500 | ) | 27.47 | ||||
| Balance June 30, 2008 |
31,199 | $ | 29.37 | ||||
| Granted: |
|||||||
| Non-employee Directors |
50,309 | 17.72 | |||||
| Executive officers |
10,000 | 17.00 | |||||
| Issued: |
|||||||
| Non-employee Directors |
(14,852 | ) | 27.67 | ||||
| Cancelled: |
|||||||
| Non-employee Directors |
(18,200 | ) | 21.06 | ||||
| Balance June 30, 2009 |
58,456 | $ | 18.75 | ||||
| Granted: |
|||||||
| Non-employee Directors |
25,186 | 22.86 | |||||
| Issued: |
|||||||
| Non-employee Directors |
(19,077 | ) | 22.48 | ||||
| Executive officers & management |
(2,500 | ) | 17.00 | ||||
| Cancelled: |
|||||||
| Non-employee Directors |
(5,631 | ) | 20.42 | ||||
| Balance June 30, 2010 |
56,434 | $ | 21.05 | ||||
| Weighted-average fair value of nonvested stock awards granted during the year ended June 30, |
|||||||
| 2008 |
$ | 29.37 | |||||
| 2009 |
$ | 17.85 | |||||
| 2010 |
$ | 22.86 | |||||
Cash Settled Stock Appreciation Rights
Cash-settled stock appreciation rights (SARs) awards were granted to eligible employees during the fiscal year ended June 30, 2007, and provided each participant with the right to receive payment in cash, upon exercise, for the appreciation in market value of a specified number of shares of the Company’s Common Stock over the award’s exercise price. No SARs awards were granted during the fiscal years ended June 30, 2010, 2009 or 2008. The per-share exercise price of a SAR is equal to the closing market price of a share of the Company’s Common Stock on the date of grant.
On November 14, 2007, the Company offered to buy back the SARs from all current eligible employees, excluding the executive officers, at the fair market value (Buyout Price) based on the closing price of the
70
Table of Contents
Company’s Common Stock on December 14, 2007. This offer resulted in the Company purchasing 173,940 SARs at a Buyout Price of $6.47 per SAR, for a total of $1,125,392 (excluding the Company’s portion of payroll taxes) paid to the participating eligible employees, which represented approximately 99% participation by eligible employees of the SARs outstanding.
As of June 30, 2010 the average fair market value of each remaining SAR was $1.39 and the related liability for all remaining SARs was $131,836. These SARs will continue to be remeasured at each reporting period until all awards are settled. No cash settled SARs were exercised or repurchased during the Company’s fiscal years 2010 and 2009. A total of $1,126,457 (excluding Company payroll tax) in share-based liabilities were paid for cash settled SARs exercised and repurchased during fiscal year 2008.
The following table outlines cash-settled SAR award activity for the fiscal years ended June 30, 2010, 2009 and 2008.
| Shares | Weighted Average Price Per Share | ||||||
| Balance June 30, 2007 |
291,940 | $ | 30.41 | ||||
| Repurchased |
(173,940 | ) | 29.88 | ||||
| Exercised |
(900 | ) | 29.88 | ||||
| Cancelled |
(12,400 | ) | 29.88 | ||||
| Balance June 30, 2008 |
104,700 | $ | 31.35 | ||||
| Cancelled |
(10,000 | ) | 31.36 | ||||
| Balance June 30, 2009 |
94,700 | $ | 31.34 | ||||
| No activity |
— | — | |||||
| Balance June 30, 2010 |
94,700 | $ | 31.34 | ||||
| Weighted-average fair value of cash-settled SARs granted during the years ended June 30, |
|||||||
| 2008 |
$ | — | (a) | ||||
| 2009 |
$ | — | (a) | ||||
| 2010 |
$ | — | (a) | ||||
| (a) | There were no grants during the fiscal year. |
The fair value of each SAR award is remeasured at each reporting period using the Black-Scholes option-pricing model that uses the assumptions noted in the following table.
| Year Ended June 30, | ||||||
| 2010 | 2009 | 2008 | ||||
| Dividend yield |
0% | 0% | 0% | |||
| Expected volatility |
35% | 35% | 35% | |||
| Risk-free interest rate |
.388% - .820% | .566% - 2.451% | 1.598% - 4.859% | |||
| Expected lives (in years) |
1.17 - 1.63 | 1.30 - 1.80 | 1.63 - 2.85 | |||
SARs are exercisable over a maximum term of five years from the date of grant and originally were to vest over a period of three years from the grant date. Expected volatilities are based on historical volatility of the Company’s Common Stock and other factors. The Company uses historical data to estimate SAR employee termination behavior within the valuation model; separate groups of employees that have similar historical exercise behavior are considered separately for valuation purposes. The risk-free rate for periods within the contractual life of the SAR is based on U.S. treasuries with constant maturities in effect at the time of grant.
71
Table of Contents
| 13. | SEGMENT REPORTING |
The Company’s operations and products have been aggregated into a single reportable segment since they have similar economic characteristics, production processes, types of customers and distribution methods under the provisions of FASB ASC Topic 280, “Segment Reporting” (ASC 280). Operating segments are identified as components of an enterprise, about which separate discrete financial information is available for evaluation by the chief operating decision-making group in making decisions regarding how to allocate resources and assess performance.
The Company generates revenue from the sale of biomaterials products sold primarily in the cardiovascular, orthopaedic, sports medicine, spinal and general surgery markets. The largest biomaterials customers include St. Jude Medical, Arthrex and Orthovita. The Company also recognizes revenue from the shipment of certain endovascular products manufactured under the Manufacturing and Licensing Agreement, as well as recognizes revenue generated from product development programs with Spectranetics. The Company also receives royalty income generated primarily from the net end-user sale of Angio-Seal units by St. Jude Medical and from the sales of Vitoss™ Foam and Vitoss™ Bioactive Foam products by Orthovita.
Net sales by product line and a reconciliation to total revenue are as follows:
| Fiscal Year Ended June 30, | |||||||||
| 2010 | 2009 | 2008 | |||||||
| Biomaterials |
$ | 52,096,283 | $ | 51,045,578 | $ | 47,538,923 | |||
| Endovascular |
2,180,421 | 3,858,187 | 6,221,942 | ||||||
| Net Sales |
54,276,704 | 54,903,765 | 53,760,865 | ||||||
| Royalty income |
26,370,841 | 27,177,085 | 26,030,032 | ||||||
| Total Revenue |
$ | 80,647,545 | $ | 82,080,850 | $ | 79,790,897 | |||
For the years ended June 30, 2010, 2009 and 2008, revenues from St. Jude Medical, Arthrex and Orthovita represented the following percentages of total revenues to the Company:
| Percentage of Total Revenue for the Year Ended June 30, |
|||||||||
| 2010 | 2009 | 2008 | |||||||
| St. Jude Medical: |
|||||||||
| Net sales |
24 | % | 22 | % | 19 | % | |||
| Royalty Income (see Note 4) |
25 | % | 26 | % | 27 | % | |||
| Arthrex: |
|||||||||
| Net sales |
20 | % | 18 | % | 18 | % | |||
| Orthovita: |
|||||||||
| Net sales |
10 | % | 10 | % | 9 | % | |||
| Royalty Income (see Note 4) |
7 | % | 7 | % | 6 | % | |||
72
Table of Contents
Revenues are attributed to a country based on the location of the customer. The Company’s business is not directly dependent on foreign operations, as the Company’s sales to customers outside the U.S. are not significant. However, a portion of the Company’s revenues, including sales and royalties, are dependent on U.S. based customers selling to end-users outside the U.S. For the year ended June 30, 2008 the Company’s revenues associated with foreign countries included direct sales of its endovascular products. These product lines were subsequently sold to Spectranetics in May 2008. No one country where the Company sells its products, other than the U.S., represented more than 10% of the Company’s revenues in fiscal 2010. In addition, all of the Company’s long-lived assets are located in the U.S. The Company’s revenues are categorized geographically below:
| Revenues for the Year Ended June 30, | |||||||||
| 2010 | 2009 | 2008 | |||||||
| United States |
$ | 79,987,176 | $ | 81,518,199 | $ | 76,757,715 | |||
| Other foreign countries |
660,369 | 562,651 | 3,033,182 | ||||||
| Total |
$ | 80,647,545 | $ | 82,080,850 | $ | 79,790,897 | |||
| 14. | COMMITMENT AND CONTIGENCIES |
Certain Compensation and Employment Agreements
The Company has entered into employment agreements with certain of its named executive officers. As of June 30, 2010, these employment agreements provided for, among other things, annual base salaries in an aggregate amount of not less than $1,615,663, from that date through fiscal 2012.
Purchase Commitments
As of June 30, 2010, the Company had outstanding non-cancelable and cancelable purchase commitments in the amount of $1,093,443 related to inventory, capital expenditures and other goods or services.
Research and Development Contractual Obligations
Under the Development and Regulatory Services Agreement with Spectranetics, as amended, the Company’s contributions are limited to a maximum amount of $2,750,000 toward the expenses associated with clinical studies to obtain approval from the FDA for certain next-generation endovascular products, which is reduced by the total cumulative expenses incurred through June 30, 2010 of approximately $30,000. See Note 19 for additional information and a discussion of the agreement.
| 15. | RETIREMENT PLAN |
The Company has a voluntary 401(k) Salary Reduction Plan and Trust (the 401(k) Plan) in which all employees that are at least 21 years of age are eligible to participate. The Company provides a 50% discretionary matching contribution on up to 6% of an employee’s total salaried compensation, for all employee contributions. Total Company contributions to the 401(k) plan for fiscal years ended June 30, 2010, 2009 and 2008 were $388,720, $427,540 and $490,658, respectively.
73
Table of Contents
| 16. | INCOME TAXES |
Income Tax Expense
Net income before income taxes earned within or outside the United States are shown below:
| June 30, | |||||||||
| 2010 | 2009 | 2008 | |||||||
| United States |
$ | 28,852,425 | $ | 29,789,266 | $ | 6,573,454 | |||
| Foreign |
— | — | 32,505 | ||||||
| Net income before income taxes |
$ | 28,852,425 | $ | 29,789,266 | $ | 6,605,959 | |||
The provision for income taxes is composed of the following:
| June 30, | ||||||||||||
| 2010 | 2009 | 2008 | ||||||||||
| Taxes on U.S. earnings |
||||||||||||
| Federal |
||||||||||||
| Current |
$ | 10,588,087 | $ | 7,685,165 | $ | 3,025,291 | ||||||
| Deferred |
(1,252,458 | ) | 1,404,428 | (1,233,901 | ) | |||||||
| State |
||||||||||||
| Current |
144,531 | 806,422 | 22,607 | |||||||||
| Deferred |
— | 8,946 | (8,946 | ) | ||||||||
| Valuation allowance |
(91,859 | ) | (194,805 | ) | — | |||||||
| Taxes on foreign earnings |
||||||||||||
| Deferred |
— | — | 11,129 | |||||||||
| Total income tax expense |
$ | 9,388,301 | $ | 9,710,156 | $ | 1,816,180 | ||||||
The differences between the Company’s income tax expense and the income tax expense (benefit) computed using the U.S. federal income tax rate were as follows:
| June 30, | ||||||||||||
| 2010 | 2009 | 2008 | ||||||||||
| Net income before income taxes |
$ | 28,852,425 | $ | 29,789,266 | $ | 6,605,959 | ||||||
| Tax provision at U.S. statutory rate |
10,098,349 | 10,426,243 | 2,246,173 | |||||||||
| State income tax provision, net of federal benefit |
93,945 | 524,174 | 9,016 | |||||||||
| Reconciliation to actual tax rate: |
||||||||||||
| Non-deductible meals and entertainment |
10,106 | 9,778 | 33,400 | |||||||||
| Capital loss valuation allowance |
7,093 | 25,901 | 38,876 | |||||||||
| Release of state valuation allowance |
(91,859 | ) | (194,805 | ) | — | |||||||
| Research and development credits |
(265,249 | ) | (464,362 | ) | (219,232 | ) | ||||||
| Domestic production deduction |
(221,056 | ) | (148,317 | ) | — | |||||||
| Non-taxable municipal bond interest income |
(236,243 | ) | (345,862 | ) | (325,864 | ) | ||||||
| Other |
(6,785 | ) | (122,594 | ) | 33,811 | |||||||
| Income tax expense |
$ | 9,388,301 | $ | 9,710,156 | $ | 1,816,180 | ||||||
| Current income tax expense |
$ | 10,732,618 | $ | 8,296,782 | $ | 3,047,898 | ||||||
| Deferred income tax (benefit) expense |
$ | (1,344,317 | ) | $ | 1,413,374 | $ | (1,231,718 | ) | ||||
74
Table of Contents
Deferred Taxes
Significant components of the Company’s deferred tax assets and liabilities are as follows:
| June 30, | ||||||||||||||||
| 2010 | 2009 | |||||||||||||||
| Current | Noncurrent | Current | Noncurrent | |||||||||||||
| Deferred Tax Asset: |
||||||||||||||||
| Accrued expenses |
$ | 775,561 | $ | — | $ | 840,132 | $ | — | ||||||||
| Basis difference – patents & proprietary rights |
— | 553,435 | — | 455,985 | ||||||||||||
| Inventory |
1,249,734 | — | 1,120,282 | — | ||||||||||||
| Goodwill |
— | 174,150 | — | 430,302 | ||||||||||||
| Stock options |
700,197 | 1,800,507 | 95,955 | 1,503,293 | ||||||||||||
| Nonvested stock awards |
107,510 | — | 95,015 | — | ||||||||||||
| Severance & endovascular transaction fees |
— | — | 255,952 | — | ||||||||||||
| Milestone payments |
286,682 | 1,278,557 | 202,327 | 521,769 | ||||||||||||
| Mortgage interest swap |
— | 1,939,878 | — | 1,576,015 | ||||||||||||
| Other |
(156,513 | ) | 65,044 | (24,522 | ) | 65,920 | ||||||||||
| Net operating loss carryforwards |
— | 3,896,100 | — | 3,896,100 | ||||||||||||
| 2,963,171 | 9,707,671 | 2,585,141 | 8,449,384 | |||||||||||||
| Less valuation allowance |
— | (3,968,238 | ) | — | (3,962,020 | ) | ||||||||||
| Deferred tax asset |
2,963,171 | 5,739,433 | 2,585,141 | 4,487,364 | ||||||||||||
| Deferred Tax Liability: |
||||||||||||||||
| Basis difference – fixed assets |
— | (3,866,814 | ) | — | (3,679,826 | ) | ||||||||||
| Prepaid insurance |
(105,909 | ) | — | (94,735 | ) | — | ||||||||||
| Deferred tax liability |
(105,909 | ) | (3,866,814 | ) | (94,735 | ) | (3,679,826 | ) | ||||||||
| Net Deferred Tax Asset |
$ | 2,857,262 | $ | 1,872,619 | $ | 2,490,406 | $ | 807,538 | ||||||||
A portion of the Company’s deferred tax asset is offset by a valuation allowance relating to state net operating loss (NOL) carryforwards due to restrictions imposed and uncertainty surrounding its use. The valuation allowance reduces deferred tax assets to an amount that represents management’s best estimate of the amount of such deferred tax assets that more than likely will be realized. At June 30, 2010, the Company had a state NOL carryforward of approximately $60.0 million, which will expire through 2028, and no longer had a federal NOL carryforward. The Company has recorded a full valuation allowance against the state net operating losses of approximately $60.0 million. The Company no longer has a foreign NOL as a result of the sale of its Endovascular business in May 2008.
The Company is awaiting Congressional approval extending the Research and Experimentation (R&E) Tax Credit for calendar year 2010. Unless and until such time the R&E Tax Credit extension is approved, the Company can only claim research and development tax credits through December 31, 2009 as a component of its tax provision related to its ongoing performance of qualified research and development under the previously approved October 2008 Congressional extension of the R&E Tax Credit. In fiscal 2009, the Company recorded R&E Tax Credit adjustments to its tax provision and also a retroactive adjustment during the second quarter ended December 31, 2008. The Company recorded tax credits of $265,249, $464,362 and $219,232, for the fiscal years ended June 30, 2010, 2009 and 2008, respectively.
Uncertain Tax Positions
The Company adopted the provisions of FASB ASC Subtopic 740-10, “Income Taxes,” on July 1, 2007. In connection with the adoption, the Company recorded a net decrease to retained earnings of $204,615 in
75
Table of Contents
unrecognized tax liabilities, plus $18,330 for potential interest and penalties. The amount of unrecognized tax benefits at June 30, 2010, 2009 and 2008 were $117,216, $140,650 and $193,132, respectively. If these gross unrecognized tax benefits were recognized, $115,359, $139,183 and $176,795 would impact the Company’s tax rate at June 30, 2010, 2009 and 2008, respectively. The Company recorded interest and penalties of $1,222, $1,211 and $14,667 during the fiscal years ended June 30, 2010, 2009 and 2008, respectively. Interest and penalties are included in Interest expense and Other income (loss) respectively on the Consolidated Statements of Income.
Changes in the Company’s uncertain tax positions for the years ended June 30, 2010, 2009 and 2008 were as follows:
| Year ended June 30, | ||||||||||||
| 2010 | 2009 | 2008 | ||||||||||
| Balance at beginning of year |
$ | 140,650 | $ | 193,132 | $ | 204,045 | ||||||
| Increases related to current year tax positions |
1,114 | — | — | |||||||||
| Increases related to prior year tax positions |
21,866 | 64,907 | 14,188 | |||||||||
| Settlements/payments |
— | (71,121 | ) | — | ||||||||
| Decreases related to prior year tax positions |
— | (2,098 | ) | — | ||||||||
| Reduction due to lapse in statute of limitations |
(46,414 | ) | (44,170 | ) | (25,101 | ) | ||||||
| Balance at end of year |
$ | 117,216 | $ | 140,650 | $ | 193,132 | ||||||
The Company and its subsidiaries file U.S. federal and various state income tax returns. The Company is no longer subject to U.S. federal income tax examination for years prior to fiscal 2006 due to the expiration of applicable statutes of limitation. The Company does not expect the total amount of unrecognized tax benefits to change significantly in the next 12 months.
| 17. | EARNINGS PER SHARE |
The following table shows the reconciliation between the numerators and denominators for the basic and diluted EPS calculations, where income is the numerator and the weighted average number of shares is the denominator.
| Year Ended June 30, 2010 | ||||||||
| Income | Shares | Per Share Amount | ||||||
| Basic EPS |
||||||||
| Income available to common shareholders |
$ | 19,464,124 | 10,623,926 | $ | 1.83 | |||
| Effect of Dilutive Securities |
||||||||
| Options & nonvested stock |
— | 312,664 | ||||||
| Diluted EPS |
||||||||
| Income available to common shareholders including assumed conversions |
$ | 19,464,124 | 10,936,590 | $ | 1.78 | |||
76
Table of Contents
| Year Ended June 30, 2009 | Year Ended June 30, 2008 | |||||||||||||||
| Income | Shares | Per Share Amount |
Income | Shares | Per Share Amount | |||||||||||
| Basic EPS |
||||||||||||||||
| Income available to common shareholders |
$ | 20,079,110 | 11,547,266 | $ | 1.74 | $ | 4,789,779 | 11,891,469 | $ | 0.40 | ||||||
| Effect of Dilutive Securities |
||||||||||||||||
| Options & nonvested stock |
— | 350,569 | — | 579,829 | ||||||||||||
| Diluted EPS |
||||||||||||||||
| Income available to common shareholders including assumed conversions |
$ | 20,079,110 | 11,897,835 | $ | 1.69 | $ | 4,789,779 | 12,471,298 | $ | 0.38 | ||||||
| 18. | QUARTERLY FINANCIAL DATA (UNAUDITED) |
The summarized quarterly results of operations of the Company for the years ended June 30, 2010 and 2009 are presented below:
| Year Ended June 30, 2010 | ||||||||||||
| 1st Quarter | 2nd Quarter | 3rd Quarter | 4th Quarter | |||||||||
| Total revenues |
$ | 19,741,818 | $ | 19,070,632 | $ | 19,946,414 | $ | 21,888,681 | ||||
| Gross profit |
$ | 7,894,302 | $ | 5,977,706 | $ | 7,551,135 | $ | 9,346,210 | ||||
| Operating costs and expenses |
$ | 11,993,902 | $ | 13,282,807 | $ | 12,332,722 | $ | 12,783,997 | ||||
| Net income |
$ | 4,880,809 | $ | 3,659,529 | $ | 5,001,560 | $ | 5,922,226 | ||||
| Basic earnings per share |
$ | 0.44 | $ | 0.33 | $ | 0.47 | $ | 0.61 | ||||
| Diluted earnings per share |
$ | 0.43 | $ | 0.32 | $ | 0.46 | $ | 0.60 | ||||
| Year Ended June 30, 2009 | ||||||||||||
| 1st Quarter | 2nd Quarter | 3rd Quarter | 4th Quarter | |||||||||
| Total revenues |
$ | 20,149,683 | $ | 20,797,828 | $ | 20,623,803 | $ | 20,509,535 | ||||
| Gross profit |
$ | 7,750,270 | $ | 7,481,897 | $ | 7,694,301 | $ | 7,783,357 | ||||
| Operating costs and expenses |
$ | 12,422,803 | $ | 13,151,827 | $ | 13,052,792 | $ | 12,919,961 | ||||
| Net income |
$ | 5,247,557 | $ | 5,240,270 | $ | 4,875,649 | $ | 4,715,635 | ||||
| Basic earnings per share |
$ | 0.45 | $ | 0.45 | $ | 0.42 | $ | 0.42 | ||||
| Diluted earnings per share |
$ | 0.43 | $ | 0.44 | $ | 0.42 | $ | 0.41 | ||||
Quarterly and total year earnings per share are calculated independently based on the weighted average number of shares outstanding during each period.
| 19. | SALE OF ENDOVASCULAR BUSINESS |
On May 30, 2008, the Company completed the sale of its Endovascular business to Spectranetics.
Pursuant to an Asset Purchase Agreement, dated as of May 12, 2008, the Company sold to Spectranetics the assets related to the QuickCat™ (QuickCat), ThromCat® (ThromCat) and Safe-Cross® (Safe-Cross) product lines, including the stock of its European subsidiary Kensey Nash Europe GmbH, for a $10.0 million cash payment at closing, with an opportunity for up to an additional $8.0 million in research and development milestone payments, a $6.0 million cumulative sales milestone payment and additional royalty payments based on future sales of the ThromCat and Safe-Cross products after the transition of manufacturing of the products from the Company to Spectranetics. These payments and other related agreements are described below.
77
Table of Contents
On May 30, 2008, the Company and Spectranetics also entered into a Manufacturing and Licensing Agreement pursuant to which the Company agreed to manufacture for Spectranetics the endovascular products acquired by Spectranetics under the Asset Purchase Agreement for a minimum of six months for QuickCat and for an initial three year period ending May 2011 for ThromCat and Safe-Cross, and Spectranetics will purchase such products for the same specified time periods. Spectranetics further agreed that, during the manufacturing period, it would pay transfer prices for the products based on the Company’s cost to manufacture such products plus a percentage of the end-user sales price of the ThromCat and Safe-Cross products. Additionally, Spectranetics agreed that, after the Company’s manufacture of the ThromCat and Safe-Cross products was transferred to Spectranetics, Spectranetics will be obligated to pay the Company a royalty on the end-user sales of such products.
Spectranetics extended the Company’s manufacturing period for the QuickCat product through December 31, 2009. The Company’s second quarter of fiscal 2010 was the last quarter reflecting product sales of the QuickCat device as the QuickCat manufacturing was transferred to Spectranetics as of December 31, 2009. Spectranetics has no obligation to make royalty payments to the Company related to end-user sales of the QuickCat product.
As previously disclosed, Spectranetics publicly announced the discontinuation of sales of the Safe-Cross product line during the Company’s second quarter of fiscal 2010. Spectranetics’ decision to discontinue the Safe-Cross product line negatively impacts the Company’s ability to receive future royalties based on sales of the Safe-Cross product, and at a minimum delays the Company’s achievement of the $6.0 million cumulative sales milestone, which is based upon sales of the Safe-Cross, ThromCat and QuickCat products.
As of June 2010, the Company’s manufacturing of the endovascular product line is limited to the ThromCat product. During the second quarter of fiscal 2010, pursuant to the terms of the Manufacturing and Licensing Agreement with Spectranetics, the Company notified Spectranetics that Spectranetics will begin to manufacture the ThromCat product at the end of the three-year manufacturing period, which is expected to be the fourth quarter of fiscal 2011. Following the transition of manufacturing of the ThromCat product to Spectranetics, Spectranetics will pay to the Company a predetermined royalty rate on the end-user sales of the ThromCat product. The amount of this royalty will be based upon the timing and reason for the manufacturing transfer and, in certain cases, upon the amount of revenue generated by the ThromCat products during the applicable year. The royalty is subject to reduction depending upon the scope of the patent protection obtained for the ThromCat product.
On May 30, 2008, the Company and Spectranetics also entered into a Development and Regulatory Services Agreement, pursuant to which the Company agreed to conduct work to develop and obtain regulatory approval from the FDA for certain next-generation Safe-Cross and ThromCat products at the Company’s expense on behalf of Spectranetics. Spectranetics owns all intellectual property resulting from this development work. If clinical studies are required to obtain approval from the FDA for those next-generation products, the costs will be shared equally by the Company and Spectranetics; however, pursuant to an amendment to the Development and Regulatory Services Agreement the Company’s contributions are limited to a maximum amount of $2,750,000 toward these clinical studies. Spectranetics will pay the Company up to $8.0 million upon completion of such product development activities and regulatory approvals for certain of the next-generation products. These milestones will be recorded as revenue and recognized over the period of the agreement (including through the date of receipt of the latest expected regulatory approvals and/or completion of product development activities). In fiscal 2009, the Company announced the accomplishment of two milestones under this agreement, which resulted in a $2.5 million of payments. The Company recognized $577,000 and $625,000, respectively, in revenue for these milestones during fiscal years 2010 and 2009.
78
Table of Contents
| ITEM 9. | CHANGES IN AND DISAGREEMENTS WITH ACCOUNTANTS ON ACCOUNTING AND FINANCIAL DISCLOSURE |
None.
| ITEM 9A. | CONTROLS AND PROCEDURES |
Disclosure Controls and Procedures
We carried out an evaluation, under the supervision and with the participation of our management, including our Chief Executive Officer and Chief Financial Officer, of the design and operation of our disclosure controls and procedures (as such term is defined in Rules 13a-15(e) and 15d-15(e) under the Securities Exchange Act of 1934, as amended (the Exchange Act)), as of the end of the period covered by this report. Our disclosure controls and procedures are designed to provide reasonable assurance that information required to be disclosed by us in the reports that we file or submit under the Exchange Act is recorded, processed, summarized and reported accurately and within the time frames specified in the SEC’s rules and forms and that information required to be disclosed by us in the reports that we file or submit under the Exchange Act is accumulated and communicated to our management, including our Chief Executive Officer and Chief Financial Officer, as appropriate to allow timely decisions regarding required disclosure. Based on such evaluation, our Chief Executive Officer and Chief Financial Officer have concluded that, as of the end of fiscal 2010, our disclosure controls and procedures are effective at the reasonable assurance level.
Changes In Internal Control Over Financial Reporting
There have not been any changes in our internal control over financial reporting (as such term is defined in Rules 13a-15(f) and 15d-15(f) under the Exchange Act) during the fourth quarter of the fiscal year ended June 30, 2010 that have materially affected, or are reasonably likely to materially affect, our internal control over financial reporting.
Management’s Report on Internal Control Over Financial Reporting
Our management is responsible for establishing and maintaining adequate internal control over financial reporting, as such term is defined in the rules promulgated under the Exchange Act. Under the supervision and with the participation of our management, including our Chief Executive Officer and Chief Financial Officer, we have conducted an evaluation of the effectiveness of our internal control over financial reporting based on the framework in “Internal Control-Integrated Framework” issued by the Committee of Sponsoring Organizations of the Treadway Commission. Based on this evaluation, our management has concluded that, as of June 30, 2010, we did not have any material weaknesses in our internal control over financial reporting and our internal control over financial reporting was effective.
Inherent Limitations on the Effectiveness of Controls
Our management does not expect that our disclosure controls and procedures or our internal controls will prevent or detect all errors and all fraud. A control system, no matter how well conceived and operated, can provide only reasonable, not absolute, assurance that the objectives of the control system are met. Further, the design of a control system must reflect the fact that there are resource constraints, and the benefits of controls must be considered relative to their costs. Because of the inherent limitations in a cost-effective control system, no evaluation of controls can provide absolute assurance that misstatements due to error or fraud will not occur or that all control issues and instances of fraud, if any, within our Company have been detected.
These inherent limitations include the realities that judgments in decision-making can be faulty and that breakdowns can occur because of simple error or mistake. Controls can also be circumvented by the individual acts of some persons, by collusion of two or more people, or by management override of the controls. The design
79
Table of Contents
of any system of controls is based in part on certain assumptions about the likelihood of future events, and there can be no assurance that any design will succeed in achieving its stated goals under all potential future conditions. Projections of any evaluation of controls effectiveness to future periods are subject to risks. Over time, controls may become inadequate because of changes in conditions or deterioration in the degree of compliance with policies and procedures.
Our independent registered public accounting firm, Deloitte & Touche LLP, has issued an audit report on the effectiveness of our internal control over financial reporting. This audit report appears below.
Report of Independent Registered Public Accounting Firm
To the Board of Directors and Stockholders of
Kensey Nash Corporation
Exton, Pennsylvania
We have audited the internal control over financial reporting of Kensey Nash Corporation and subsidiaries (the “Company”) as of June 30, 2010, based on criteria established in Internal Control — Integrated Framework issued by the Committee of Sponsoring Organizations of the Treadway Commission. The Company’s management is responsible for maintaining effective internal control over financial reporting and for its assessment of the effectiveness of internal control over financial reporting, included in the accompanying Management’s Report on Internal Control Over Financial Reporting. Our responsibility is to express an opinion on the Company’s internal control over financial reporting based on our audit.
We conducted our audit in accordance with the standards of the Public Company Accounting Oversight Board (United States). Those standards require that we plan and perform the audit to obtain reasonable assurance about whether effective internal control over financial reporting was maintained in all material respects. Our audit included obtaining an understanding of internal control over financial reporting, assessing the risk that a material weakness exists, testing and evaluating the design and operating effectiveness of internal control based on the assessed risk, and performing such other procedures as we considered necessary in the circumstances. We believe that our audit provides a reasonable basis for our opinion.
A company’s internal control over financial reporting is a process designed by, or under the supervision of, the company’s principal executive and principal financial officers, or persons performing similar functions, and effected by the company’s board of directors, management and other personnel to provide reasonable assurance regarding the reliability of financial reporting and the preparation of financial statements for external purposes in accordance with generally accepted accounting principles. A company’s internal control over financial reporting includes those policies and procedures that (1) pertain to the maintenance of records that, in reasonable detail, accurately and fairly reflect the transactions and dispositions of the assets of the company; (2) provide reasonable assurance that transactions are recorded as necessary to permit preparation of financial statements in accordance with generally accepted accounting principles, and that receipts and expenditures of the company are being made only in accordance with authorizations of management and directors of the company; and (3) provide reasonable assurance regarding prevention or timely detection of unauthorized acquisition, use, or disposition of the company’s assets that could have a material effect on the financial statements.
Because of the inherent limitations of internal control over financial reporting, including the possibility of collusion or improper management override of controls, material misstatements due to error or fraud may not be prevented or detected on a timely basis. Also, projections of any evaluation of the effectiveness of the internal control over financial reporting to future periods are subject to the risk that the controls may become inadequate because of changes in conditions, or that the degree of compliance with the policies or procedures may deteriorate.
In our opinion, the Company maintained, in all material respects, effective internal control over financial reporting as of June 30, 2010, based on the criteria established in Internal Control — Integrated Framework issued by the Committee of Sponsoring Organizations of the Treadway Commission.
80
Table of Contents
We have also audited, in accordance with the standards of the Public Company Accounting Oversight Board (United States), the consolidated financial statements as of and for the year ended June 30, 2010 of the Company and our report dated September 10, 2010 expressed an unqualified opinion on those financial statements.
/s/ DELOITTE & TOUCHE LLP
Philadelphia, Pennsylvania
September 10, 2010
81
Table of Contents
| ITEM 9B. | OTHER INFORMATION |
Not applicable.
82
Table of Contents
| ITEM 10. | DIRECTORS, EXECUTIVE OFFICERS AND CORPORATE GOVERNANCE |
Information required by this item is incorporated by reference to the information under the captions “Proposal 1–Election of Directors,” “–Nominees,” “–Other Continuing Directors,” “–Executive Officers,” “–Governance of the Company,” and “–Section 16(a) Beneficial Ownership Reporting Compliance” in our definitive Proxy Statement in connection with our 2010 Annual Meeting of Stockholders scheduled to be held on December 1, 2010 (the 2010 Proxy Statement), which will be filed with the Securities and Exchange Commission no later than 120 days after June 30, 2010, or October 28, 2010, pursuant to Regulation 14A.
| ITEM 11. | EXECUTIVE COMPENSATION |
Information in response to this item is incorporated by reference to the information under the caption “Proposal 1–Election of Directors–Board of Director Compensation” and “–Executive Compensation” in the 2010 Proxy Statement.
| ITEM 12. | SECURITY OWNERSHIP OF CERTAIN BENEFICIAL OWNERS AND MANAGEMENT AND RELATED STOCKHOLDER MATTERS |
The information required by this item is incorporated by reference to the information under the captions “Security Ownership of Management and Certain Stockholders,” and “–Equity Compensation Plan Information” in the 2010 Proxy Statement.
| ITEM 13. | CERTAIN RELATIONSHIPS, RELATED TRANSACTIONS AND DIRECTOR INDEPENDENCE |
Information required by this item is incorporated by reference to the information under the caption “Certain Transactions” in the 2010 Proxy Statement.
| ITEM 14. | PRINCIPAL ACCOUNTANT FEES AND SERVICES |
Information required by this item is incorporated by reference to the information under the caption “Proposal 2–Ratification of Appointment of Independent Registered Public Accounting Firm–Independent Auditor Fees” in the 2010 Proxy Statement.
83
Table of Contents
| ITEM 15. | FINANCIAL STATEMENT SCHEDULES, EXHIBITS |
| 15 (a) CONSOLIDATED | FINANCIAL STATEMENTS AND SCHEDULES |
Incorporated by reference to Item 8 of this Report on Form 10-K.
15 (b) and 15 (c) FINANCIAL STATEMENT SCHEDULES, EXHIBITS
FINANCIAL STATEMENT SCHEDULES
All other schedules are omitted because they are not required, are not applicable or the information is scheduled in our financial statements or notes thereto.
EXHIBITS
| Exhibit |
Description |
Incorporation By Reference To | ||
| 2.1 | Asset Purchase Agreement dated September 1, 2000 by and among Kensey Nash Corporation, THM Acquisition Sub, Inc., THM Biomedical, Inc. and the stockholders of THM Biomedical, Inc. | Exhibit 2.1 in our Annual Report on Form 10-K for the annual period ended June 30, 2006. | ||
| 3.1 | Second Amended and Restated Certificate of Incorporation of Kensey Nash Corporation | Exhibit 3.1 in our Registration Statement on Form S-1, Registration No. 33-98722. | ||
| 3.2 | Third Amended and Restated Bylaws of Kensey Nash Corporation, as amended | Exhibit 3.1 in our Current Report on Form 8-K filed with the SEC on June 19, 2009. | ||
| 3.3 | Certificate of Designations of Series A Junior Participating Preferred Stock of Kensey Nash Corporation | Exhibit 3.2 in our Current Report on Form 8-K filed with the SEC on June 19, 2009. | ||
| 4.1 | Specimen stock certificate representing Kensey Nash Corporation common stock | Exhibit 3.1 in our Registration Statement on Form S-1, Registration No. 33-98722. | ||
| 4.2 | Rights Agreement, dated as of June 18, 2009, by and between Kensey Nash Corporation and Computershare Trust Company, N.A., as Rights Agent | Exhibit 4.1 in our Current Report on Form 8-K filed with the SEC on June 19, 2009. | ||
| 10.1 | Kensey Nash Corporation Seventh Amended and Restated Kensey Nash Corporation Employee Incentive Compensation Plan† | Exhibit 10.1 to our Current Report on Form 8-K filed with the SEC on December 16, 2008. | ||
| 10.2 | Kensey Nash Corporation Fourth Amended and Restated Nonemployee Directors’ Stock Option Plan and form of Stock Option Agreement† | Exhibit 4.5 in our Registration Statement on Form S-8, Registration No. 333-71050. | ||
| 10.3 | Form of Stock Option Agreement† | Exhibit 10.2 to our Current Report on Form 8-K filed with the SEC on December 16, 2008. | ||
| 10.4 | Form of Restricted Stock Agreement† | Exhibit 10.3 to our Current Report on Form 8-K filed with the SEC on December 16, 2008. | ||
84
Table of Contents
| Exhibit |
Description |
Incorporation By Reference To | ||
| 10.5 | Form of Cash Settled Stock Appreciation Rights Agreement† | Exhibit 10.5 Current Report on Form 8-K filed with the SEC on December 6, 2006. | ||
| 10.6 | Form of Directors’ Indemnification Agreement | Exhibit 3.1 in our Registration Statement on Form S-1, Registration No. 33-98722. | ||
| 10.7 | License Agreement (United States) dated September 4, 1991, by and between Kensey Nash Corporation and American Home Products Corporation (assumed by St. Jude Medical, Inc.) | Exhibit 3.1 in our Registration Statement on Form S-1, Registration No. 33-98722. | ||
| 10.8 | License Agreement (Foreign) dated September 4, 1991, by and between Kensey Nash Corporation and American Home Products Corporation (assumed by St. Jude Medical, Inc.) | Exhibit 3.1 in our Registration Statement on Form S-1, Registration No. 33-98722. | ||
| 10.9 | Amendment to the Development and Distribution Agreement dated February 28, 2005 between Kensey Nash Corporation and Orthovita, Inc. | Exhibit 10.9 our Quarterly Report on Form 10-Q for the quarterly period ended March 31, 2005. | ||
| 10.10 | Supply Agreement, dated June 15, 2005, by and between Kensey Nash Corporation and St. Jude Medical, Daig Division, Inc. | Exhibit Number 10 in our Current Report on Form 8-K filed with the SEC on June 21, 2005. | ||
| 10.11 | Secured Commercial Mortgage, dated May 25, 2006, between Kensey Nash Corporation and Citibank, F.S.B. | Exhibit 10.11 in our Current Report on Form 8-K filed with the SEC on June 1, 2006. | ||
| 10.12 | Swap Agreement, dated May 24, 2006, between Kensey Nash Corporation and Citibank, N.A. | Exhibit 10.12 in our Current Report on Form 8-K filed with the SEC on June 1, 2006. | ||
| 10.13 | Settlement Agreement with Ramius Group dated October 24, 2007 | Exhibit Number 10.1 in our Current Report on Form 8-K filed with the SEC on October 24, 2007. | ||
| 10.14 | Confidentiality Agreement with Ramius Group dated October 24, 2007 | Exhibit Number 10.2 in our Current Report on Form 8-K filed with the SEC on October 24, 2007. | ||
| 10.15 | Asset Purchase Agreement dated May 12, 2008 by and among Kensey Nash Corporation, ILT Acquisition Sub, Inc., Kensey Nash Holding Corporation and The Spectranetics Corporation | Exhibit Number 10.1 in our Current Report on Form 8-K filed with the SEC on May 16, 2008. | ||
| 10.16 | Amended and Restated Employment Agreement for Joseph W. Kaufmann, Chief Executive Officer† | Exhibit 10.1 to our Current Report on Form 8-K filed with the SEC on January 7, 2009. | ||
| 10.17 | Amended and Restated Employment Agreement for Douglas G. Evans, P.E., Chief Operating Officer† | Exhibit 10.2 to our Current Report on Form 8-K filed with the SEC on January 7, 2009. | ||
| 10.18 | Amended and Restated Employment Agreement dated January 1, 2009, by and between Kensey Nash Corporation and Todd M. DeWitt† | Exhibit 10.2 to our Quarterly Report on Form 10-Q for the quarterly period ended December 31, 2008. | ||
85
Table of Contents
| Exhibit |
Description |
Incorporation By Reference To | ||
| 10.19 | Amended and Restated Employment Agreement dated January 1, 2009, by and between Kensey Nash Corporation and Russell T. Kronengold, Ph.D.† | Exhibit 10.3 to our Quarterly Report on Form 10-Q for the quarterly period ended December 31, 2008. | ||
| 10.20 | Amended and Restated Employment Agreement dated January 1, 2009, by and between Kensey Nash Corporation and James T. Rauth, P.E.† | Exhibit 10.4 to our Quarterly Report on Form 10-Q for the quarterly period ended December 31, 2008. | ||
| 10.21 | Employment Agreement, effective as of March 10, 2009, between Kensey Nash Corporation and Michael Celano, Chief Financial Officer† | Exhibit 10.1 to our Current Report on Form 8-K filed with the SEC on March 9, 2009. | ||
| 10.22 | Mutual Consent to Extend Employment Term for Joseph W. Kaufmann, President and Chief Executive Officer, dated March 16, 2010.† | Exhibit 10.1 to our Current Report on Form 8-K filed with the SEC on March 22, 2010. | ||
| 10.23 | Mutual Consent to Extend Employment Term for Douglas G. Evans, P.E., Chief Operating Officer, dated March 16, 2010.† | Exhibit 10.2 to our Current Report on Form 8-K filed with the SEC on March 22, 2010. | ||
| 10.24 | Supply Agreement, dated June 23, 2010, by and between Kensey Nash Corporation and St. Jude Medical, Cardiology Division, Inc. | Exhibit 10.1 to our Current Report on Form 8-K filed with the SEC on June 28, 2010. | ||
| 21.1 | Subsidiaries of Kensey Nash Corporation | |||
| 23.1 | Consent of Independent Registered Public Accounting Firm | |||
| 31.1 | Certification of Chief Executive Officer pursuant to Exchange Act Rule 13a-14(a). | |||
| 31.2 | Certification of Chief Financial Officer pursuant to Exchange Act Rule 13a-14(a). | |||
| 32.1 | Certification of the Chief Executive Officer pursuant to Section 906 of the Sarbanes Oxley Act of 2002. | |||
| 32.2 | Certification of the Chief Financial Officer pursuant to Section 906 of the Sarbanes Oxley Act of 2002. | |||
| † | Management contract or compensatory plan or arrangement. |
86
Table of Contents
Pursuant to the requirements of Section 13 or 15(d) of the Securities Exchange Act of 1934, the registrant has duly caused this Report to be signed on its behalf by the undersigned, thereunto duly authorized, on the 10th day of September 2010.
| KENSEY NASH CORPORATION | ||
| By: | /S/ MICHAEL CELANO | |
| Michael Celano Chief Financial Officer | ||
Pursuant to the requirements of the Securities Exchange Act of 1934, this Report has been signed below by the following persons on behalf of the Registrant and in the capacities indicated on the 10th day of September 2010.
| Signature |
Titles | |
| /s/ JOSEPH W. KAUFMANN |
Chief Executive Officer (principal executive officer), President, | |
| Joseph W. Kaufmann |
Secretary and Director | |
| /s/ DOUGLAS G. EVANS, P.E. |
Chief Operating Officer, Assistant Secretary and Director | |
| Douglas G. Evans, P.E. |
||
| /s/ MICHAEL CELANO |
Chief Financial Officer (principal financial and accounting officer) | |
| Michael Celano |
||
| /s/ ROBERT J. BOBB |
Director | |
| Robert J. Bobb |
||
| /s/ HAROLD N. CHEFITZ |
Director | |
| Harold N. Chefitz |
||
| /s/ WALTER R. MAUPAY, JR. |
Director | |
| Walter R. Maupay, Jr. |
||
| /s/ C. MCCOLLISTER EVARTS, M.D. |
Director | |
| C. McCollister Evarts, M.D. |
||
| /s/ DONALD E. MOREL, JR., PH.D. |
Director | |
| Donald E. Morel, Jr., Ph.D. |
||
87