Attached files
| file | filename |
|---|---|
| 8-K - CURRENT REPORT - Frontier Communications Parent, Inc. | form8k.htm |
| EX-99.2 - PRESS RELEASE - Frontier Communications Parent, Inc. | ex99-2.htm |
Exhibit 99.1

Investor Presentation September 2010
Safe Harbor Statement Forward-Looking Language This presentation contains forward-looking statements that are made pursuant to the safe harbor provisions of The Private Securities Litigation Reform Act of 1995. These statements are made on the basis of management’s views and assumptions regarding future events and business performance. Words such as “believe,”“anticipate,”“expect” and similar expressions are intended to identify forward-looking statements. Forward-looking statements (including oral representations) involve risks and uncertainties that may cause actual results to differ materially from any future results, performance or achievements expressed or implied by such statements. These risks and uncertainties are based on a number of factors, including but not limited to: For two years after our acquisition of access lines from Verizon, we will be limited in the amount of capital stock that we can issue to make acquisitions or to raise additional capital; our indemnity obligation to Verizon may discourage, delay or prevent a third party from acquiring control of us during the two-year period following the merger in a transaction that stockholders might consider favorable; our ability to successfully integrate the Verizon operations into Frontier’s existing operations; the effects of increased expenses incurred due to activities related to the integration of the Verizon operations; the risk that the growth opportunities and cost synergies from the Verizon transaction may not be fully realized or may take longer to realize than expected; our ability to maintain relationships with customers, employees or suppliers; the effects of greater than anticipated competition requiring new pricing, marketing strategies or new product or service offerings and the risk that we will not respond on a timely or profitable basis; reductions in the number of our access lines that cannot be offset by increases in high-speed Internet subscribers and sales of other products; the effects of ongoing changes in the regulation of the communications industry as a result of federal and state legislation and regulation; the effects of changes in the availability of federal and state universal funding to us and our competitors; the effects of competition from cable, wireless and other wireline carriers (through Voice over Internet Protocol (VOIP), DOCSIS 3.0, 4G or otherwise); our ability to adjust successfully to changes in the communications industry and to implement strategies for growth; adverse changes in the credit markets or in the ratings given to our debt securities by nationally accredited ratings organizations, which could limit or restrict the availability, or increase the cost, of financing; continued reductions in switched access revenues as a result of regulation, competition or technology substitutions; the effects of changes in both general and local economic conditions on the markets we serve, which can affect demand for our products and services, customer purchasing decisions, collectability of revenues and required levels of capital expenditures related to new construction of residences and businesses; our ability to effectively manage service quality in our territories; our ability to successfully introduce new product offerings, including the ability to offer bundled service packages on terms that are both profitable to us and attractive to customers; changes in accounting policies or practices adopted voluntarily or as required by generally accepted accounting principles or regulations; our ability to manage effectively our operations, operating expenses and capital expenditures, and to repay, reduce or refinance our debt; the effects of bankruptcies and home foreclosures, which could result in difficulty in collection of revenues and loss of customers; the effects of technological changes and competition on our capital expenditures and product and service offerings, including the lack of assurance that our network improvements will be sufficient to meet or exceed the capabilities and quality of competing networks; the effects of increased medical, retiree and pension expenses and related funding requirements; changes in income tax rates, tax laws, regulations or rulings, or federal or state tax assessments; the effects of state regulatory cash management policies on our ability to transfer cash among our subsidiaries and to the parent company; our ability to successfully renegotiate union contracts expiring in 2010 and thereafter; declines in the value of our pension plan assets, which could require us to make contributions to the pension plans in 2011 and beyond; our ability to pay dividends on our common shares, which may be affected by our cash flow from operations, amount of capital expenditures, debt service requirements, cash paid for income taxes and liquidity; the effects of any unfavorable outcome with respect to any of our current or future legal, governmental or regulatory proceedings, audits or disputes; the possible impact of adverse changes in political or other external factors over which we have no control; and the effects of hurricanes, tornados, ice storms or other natural or man-made disasters. These and other uncertainties related to our business are described in greater detail in our filings with the Securities and Exchange Commission, including our reports on Forms 10-K and 10-Q, and the foregoing information should be read in conjunction with these filings. We undertake no obligation to publicly update or revise any forward-looking statements or to make any other forward-looking statement, whether as a result of new information, future events or otherwise unless required to do so by securities laws.
Non-GAAP Financial Measures The Company uses certain non-GAAP financial measures in evaluating its performance. These include free cash flow, EBITDA or “operating cash flow”, which we define as operating income plus depreciation and amortization, and Adjusted EBITDA; a reconciliation of the differences between EBITDA and free cash flow and the most comparable financial measures calculated and presented in accordance with GAAP is included in the tables that follow. The non-GAAP financial measures are by definition not measures of financial performance under generally accepted accounting principles and are not alternatives to operating income or net income reflected in the statement of operations or to cash flow as reflected in the statement of cash flows and are not necessarily indicative of cash available to fund all cash flow needs. The non-GAAP financial measures used by the Company may not be comparable to similarly titled measures of other companies. The Company believes that presentation of non-GAAP financial measures provides useful information to investors regarding the Company’s financial condition and results of operations because these measures, when used in conjunction with related GAAP financial measures, (i) together provide a more comprehensive view of the Company’s core operations and ability to generate cash flow, (ii) provide investors with the financial analytical framework upon which management bases financial, operational, compensation and planning decisions, and (iii) presents measurements that investors and rating agencies have indicated to management are useful to them in assessing the Company and its results of operations. Management uses these non-GAAP financial measures to plan and measure the performance of its core operations, and its divisions measure performance and report to management based upon these measures. In addition, the Company believes that free cash flow and EBITDA, as the Company defines them, can assist in comparing performance from period to period, without taking into account factors affecting cash flow reflected in the statement of cash flows, including changes in working capital and the timing of purchases and payments. The Company has shown adjustments to its financial presentations to exclude non-cash pension costs in 2009 and in the second quarter of and first six months of 2009 and 2010, acquisition and integration costs in 2009 and the second quarter and first six months of 2010, severance and early retirement costs in 2005, 2006, 2007, 2008 and 2009 and in the second quarter and first six months of 2009 and 2010, a pension curtailment gain in 2007, the favorable impact of a significant carrier dispute settlement in 2007, and legal settlement costs and related expenses in 2007 and 2008 because the Company believes that the magnitude of such costs incurred in any one period materially exceeds that which has been incurred by the Company in any other period during 2005 through the first six months of 2010 and/or because investors have indicated to management that such adjustments are useful to them in assessing the Company and its results of operations. Management uses these non-GAAP financial measures to (i) assist in analyzing the Company’s underlying financial performance from period to period, (ii) evaluate the financial performance of its business units, (iii) analyze and evaluate strategic and operational decisions, (iv) establish criteria for compensation decisions, and (v) assist management in understanding the Company’s ability to generate cash flow and, as a result, to plan for future capital and operational decisions. Management uses these non-GAAP financial measures in conjunction with related GAAP financial measures. The Company believes that the non-GAAP financial measures are meaningful and useful for the reasons outlined above. While the Company utilizes these non-GAAP financial measures in managing and analyzing its business and financial condition and believes they are useful to management and to investors for the reasons described above, these non-GAAP financial measures have certain shortcomings. In particular, free cash flow does not represent the residual cash flow available for discretionary expenditures, since items such as debt repayments and dividends are not deducted in determining such measure. EBITDA has similar shortcomings as interest, income taxes, capital expenditures, debt repayments and dividends are not deducted in determining this measure. Management compensates for the shortcomings of these measures by utilizing them in conjunction with their comparable GAAP financial measures. The information in this presentation should be read in conjunction with the financial statements and footnotes contained in our documents filed with the U.S. Securities and Exchange Commission.
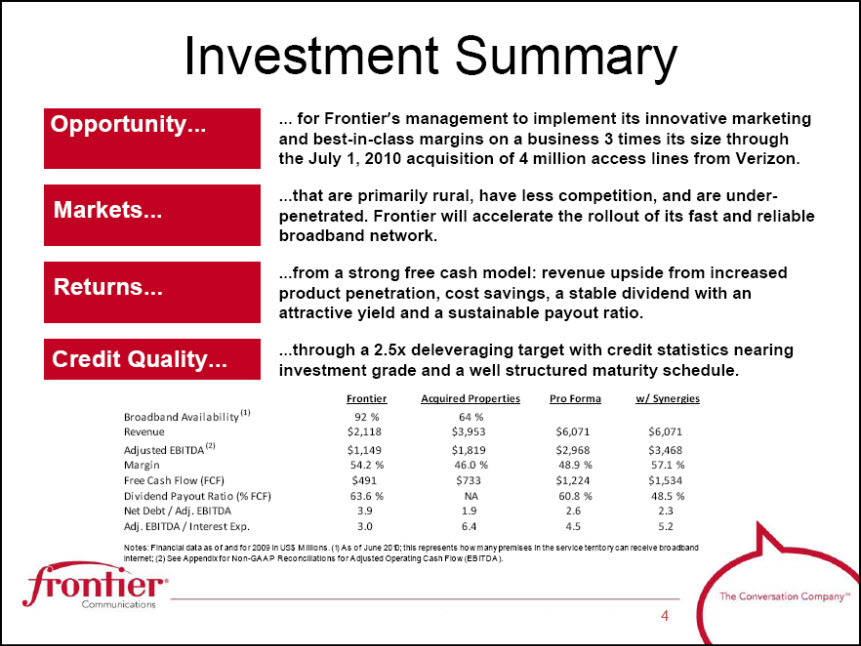
Investment Summary Opportunity for Frontier’s management to implement its innovative marketing and best-in-class margins on a business 3 times its size through the July 1, 2010 acquisition of 4 million access lines from Verizon. Markets that are primarily rural, have less competition, and are under- penetrated. Frontier will accelerate the rollout of its fast and reliable broadband network. Returns from a strong free cash model: revenue upside from increased product penetration, cost savings, a stable dividend with an attractive yield and a sustainable payout ratio. Credit Quality through a 2.5x deleveraging target with credit statistics nearing investment grade and a well structured maturity schedule. FrontierAcquired PropertiesPro Formaw/ Synergies Broadband Availability (1)92% 64% Revenue $2,118 $3,953 $6,071 $6,071 Adjusted EBITDA (2) $1,149 $1,819 $2,968 $3,468 Margin 54.2% 46.0% 48.9% 57.1% Free Cash Flow (FCF) $491 $733 $1,224 $1,534 Dividend Payout Ratio (% FCF) 63.6% NA 60.8% 48.5% Net Debt / Adj. EBITDA 3.9 1.9 2.6 2.3 Adj. EBITDA / Interest Exp.3.0 6.4 4.5 5.2 Notes: Financial data as of and for 2009 in US$ Millions. (1) As of June 2010; this represents how many premises in the service territory can receive broadband internet; (2) See Appendix for Non-GAAP Reconciliations for Adjusted Operating Cash Flow (EBITDA).
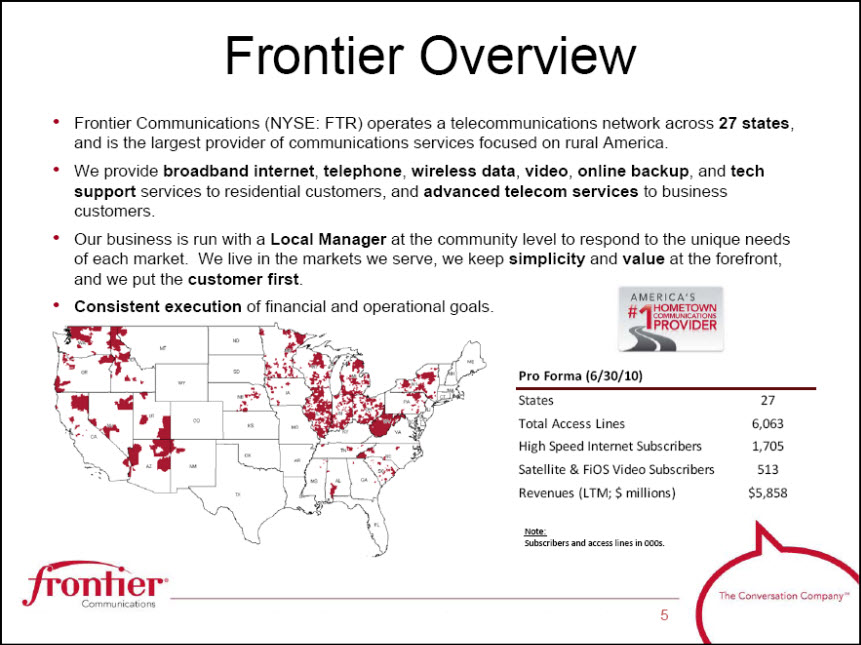
Frontier Overview Frontier Communications (NYSE: FTR) operates a telecommunications network across 27 states, and is the largest provider of communications services focused on rural America. We provide broadband internet, telephone, wireless data, video, online backup, and tech support services to residential customers, and advanced telecom services to business customers. Our business is run with a Local Manager at the community level to respond to the unique needs of each market. We live in the markets we serve, we keep simplicity and value at the forefront, and we put the customer first. Consistent execution of financial and operational goals. Pro Forma (6/30/10) States 27 Total Access Lines 6,063 High Speed Internet Subscribers 1,705 Satellite & FiOS Video Subscribers 513 Revenues (LTM; $ millions) $5,858 Note: Subscribers and access lines in 000s.

Unique Customer Experience Delivering a “Peace of Mind” Experience Big Company Advantages, Small Company Feel Local Manager Structure Unique Welcome Process Exceptional Service Levels 2 Hour Appointment Windows 100% US-based customer service Broad Spectrum of Products and Services Simple Double Play & Triple Play Bundles Good, Better, Best Choices for Voice, Video, Data Peace of Mind Product Suite Directory Advertising Wireless Data myfitv.com Innovative Marketing Programs Multi-Year Price Protection Plans Loyalty Programs Aspirational Gifts Community Connections Take The Lead Referrals
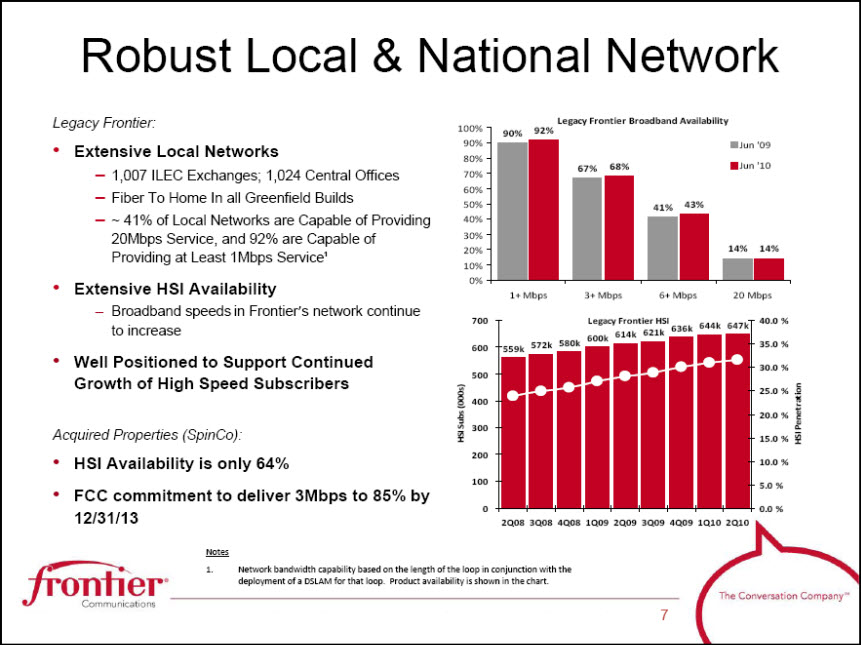
Robust Local & National Network Legacy Frontier Broadband Availability 100% 90% 80% 70% 60% 50% 40% 30% 20% 10% 0% 90% 92% 67%68% 41% 43% 14% 14% 1+ Mbps 3+ Mbps 6+ Mbps 20 Mbps Jun '09 Jun '10 Legacy Frontier HIS 559k 572k 580k 600k 614k 621k 636k 644k 647k 0 100 200 300 400 500 600 700 2Q08 3Q08 4Q08 1Q09 2Q09 3Q09 4Q09 1Q10 2Q10 HSI Subs (000s) 0.0% 5.0% 10.0% 15.0% 20.0% 25.0% 30.0% 35.0% 40.0% HSI Penetration Legacy Frontier: Extensive Local Networks 1,007 ILEC Exchanges; 1,024 Central Offices Fiber To Home In all Greenfield Builds ~ 41% of Local Networks are Capable of Providing 20Mbps Service, and 92% are Capable of Providing at Least 1Mbps Service¹ Extensive HSI Availability Broadband speeds in Frontier’s network continue to increase Well Positioned to Support Continued Growth of High Speed Subscribers Acquired Properties (SpinCo): HSI Availability is only 64% FCC commitment to deliver 3Mbps to 85% by 12/31/13 Notes 1. Network bandwidth capability based on the length of the loop in conjunction with the deployment of a DSLAM for that loop. Product availability is shown in the chart.
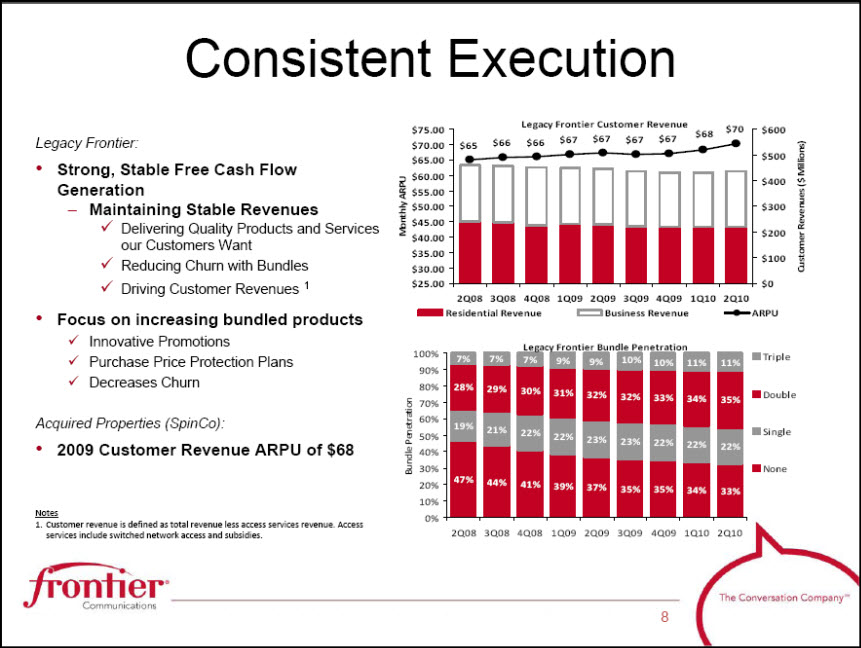
Consistent Execution Legacy Frontier Customer Revenue $65 $66 $66 $67 $67 $67 $67 $70 $68 $25.00 $30.00 $35.00 $40.00 $45.00 $50.00 $55.00 $60.00 $65.00 $70.00 $75.00 2Q08 3Q08 4Q08 1Q09 2Q09 3Q09 4Q09 1Q10 2Q10 Monthly ARPU $0 $100 $200 $300 $400 $500 $600 Customer Revenues ($ Millions) Residential Revenue Business Revenue ARPU Legacy Frontier Bundle Penetration 47% 44% 41% 39% 37% 35% 35% 34% 33% 19% 21% 22% 22% 23% 23% 22% 22% 22% 28% 29% 30% 31% 32% 32% 33% 34% 35% 7% 7% 7% 9% 9% 10% 11% 11% 10% 0% 10% 20% 30% 40% 50% 60% 70% 80% 90% 100% 2Q08 3Q08 4Q08 1Q09 2Q09 3Q09 4Q09 1Q10 2Q10 Bundle Penetration Triple Double Single None Legacy Frontier: Strong, Stable Free Cash Flow Generation Maintaining Stable Revenues Delivering Quality Products and Services our Customers Want Reducing Churn with Bundles Driving Customer Revenues 1 Focus on increasing bundled products Innovative Promotions Purchase Price Protection Plans Decreases Churn Acquired Properties (SpinCo): 2009 Customer Revenue ARPU of $68 Notes 1. Customer revenue is defined as total revenue less access services revenue. Access services include switched network access and subsidies.

FTR’s Solid Industry Metrics Legacy Frontier Results Figures not pro forma for Acquired Properties EBITDA Margin(1) 54% 51% 50% 42% 38% 37% 37% 32% 27% 23% 22% 0% 10% 20% 30% 40% 50% 60% FTR CTL WIN CVC CMCSA Q TWC T DTV VZ DISH Change in Lines + HSI Subs (2) (0.6)% (2.5)% (3.7)% (6.6)% (6.7)% (7.1)% (10)% (9)% (8)% (7)% (6)% (5)% (4)% (3)% (2)% (1)% 0% WIN CTL FTR T VZ Q Line Loss Yr/Yr (3) (12)% (11)% (10)% (9)% (8)% (7)% (6)% (5)% (4)% (3)% 4Q08 1Q09 2Q09 3Q09 4Q09 1Q10 2Q10 WIN FTR CTL VZ Q T Notes: 1. Data for the 3‐months ended 6/30/10. Adjusted EBITDA; excludes wireless; Cable is network operations only. 2. Data for the 3‐months ended 6/30/10. Represents the yr/yr change in the combined ending base of total access lines and HSI subscribers. 3. Data for the 3‐months ended 6/30/10. Source: SEC filings; Wall Street research; Frontier.
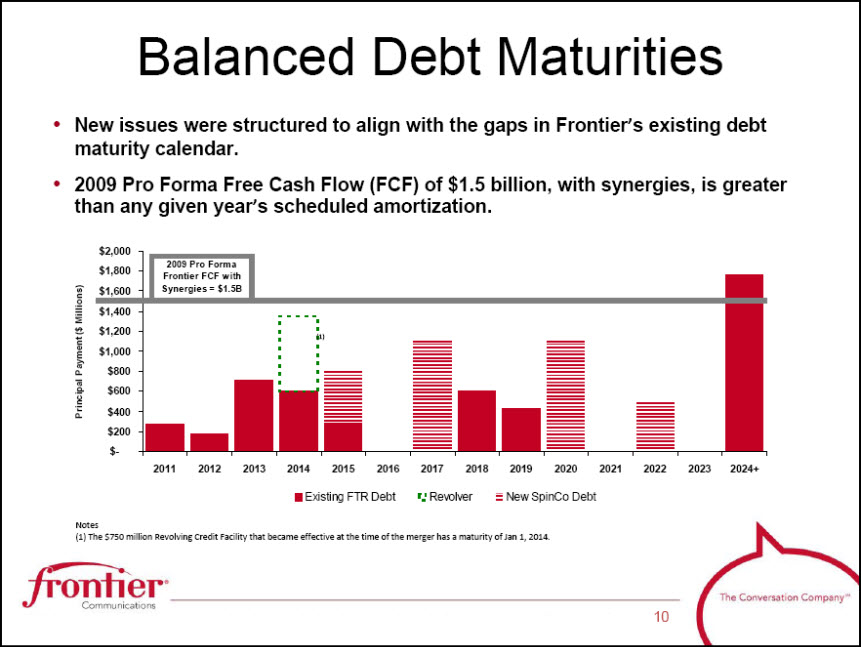
New issues were structured to align with the gaps in Frontier’s existing debt maturity calendar. 2009 Pro Forma Free Cash Flow (FCF) of $1.5 billion, with synergies, is greater than any given year’s scheduled amortization. Balanced Debt Maturities 2009 Pro Forma Frontier FCF with Synergies = $1.5B Principal Payment ( $ Millions) $- $200 $400 $600 $800 $1,000 $1,200 $1,400 $1,600 $1,800 $2,000 2011 2012 2013 2014 (1) 2015 2016 2017 2018 2019 2020 2021 2022 2023 2024+ Existing FTR Debt Revolver New SpinCo Debt Notes (1) The $750 million Revolving Credit Facility that became effective at the time of the merger has a maturity of Jan 1, 2014.
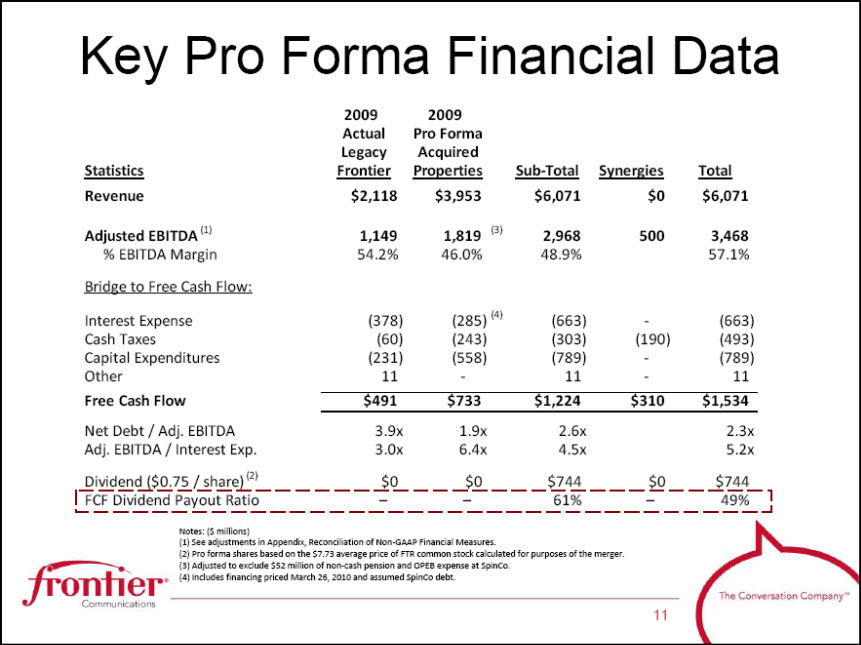
Key Pro Forma Financial Data Statistics 2009 Actual Legacy Frontier 2009 Pro Forma Acquired Properties Sub-Total Synergies Total Revenue $2,118 $3,953 $6,071 $0 $6,071 Adjusted EBITDA (1) 1,149 1,819 (3) 2,968 500 3,468 % EBITDA Margin 54.2% 46.0% 48.9% 57.1% Bridge to Free Cash Flow: Interest Expense (378) (285) (4) (663) ‐ (663) Cash Taxes (60) (243) (303) (190) (493) Capital Expenditures (231) (558) (789) ‐ (789) Other 11 ‐ 11 ‐ 11 Free Cash Flow $491 $733 $1,224 $310 $1,534 Net Debt / Adj. EBITDA 3.9x 1.9x 2.6x 2.3x Adj. EBITDA / Interest Exp.3.0x 6.4x 4.5x 5.2x Dividend ( $0.75 / share) (2) $0 $0 $744 $0 $744 FCF Dividend Payout Ratio - - 61% - 49% Notes: ( $ millions) (1) See adjustments in Appendix, Reconciliation of Non‐GAAP Financial Measures. (2) Pro forma shares based on the $7.73 average price of FTR common stock calculated for purposes of the merger. (3) Adjusted to exclude $52 million of non‐cash pension and OPEB expense at SpinCo. (4) Includes financing priced March 26, 2010 and assumed SpinCo debt
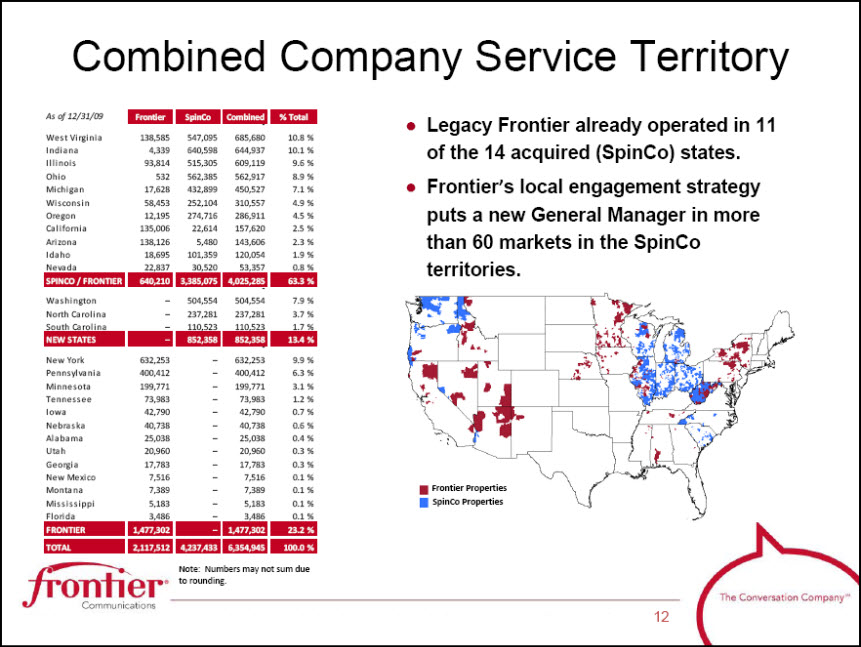
Combined Company Service Territory As of 12/31/09 Frontier SpinCo Combined % Total‐ West Virginia 138,585 547,095 685,680 10.8% Indiana 4,339 640,598 644,937 10.1% Illinois 93,814 515,305 609,119 9.6% Ohio 532 562,385 562,917 8.9% Michigan 17,628 432,899 450,527 7.1% Wisconsin 58,453 252,104 310,557 4.9% Oregon 12,195 274,716 286,911 4.5% California 135,006 22,614 157,620 2.5% Arizona 138,126 5,480 143,606 2.3% Idaho 18,695 101,359 120,054 1.9% Nevada 22,837 30,520 53,357 0.8% SPINCO / FRONTIER 640,210 3,385,075 4,025,285 63.3% ‐ Washington – 504,554 504,554 7.9% North Carolina – 237,281 237,281 3.7% South Carolina – 110,523 110,523 1.7% NEW STATES – 852,358 852,358 13.4% ‐ New York 632,253 – 632,253 9.9% Pennsylvania 400,412 – 400,412 6.3% Minnesota 199,771 – 199,771 3.1% Tennessee 73,983 – 73,983 1.2% Iowa 42,790 – 42,790 0.7% Nebraska 40,738 – 40,738 0.6% Alabama 25,038 – 25,038 0.4% Utah 20,960 – 20,960 0.3% Georgia17,783 –17,783 0.3% New Mexico 7,516 – 7,516 0.1% Montana 7,389 – 7,389 0.1% Mississippi 5,183 – 5,183 0.1% Florida 3,486 – 3,486 0.1% FRONTIER 1,477,302 – 1,477,302 23.2% TOTAL 2,117,512 4,237,433 6,354,945 100.0% Legacy Frontier already operated in 11 of the 14 acquired (SpinCo) states. Frontier’s local engagement strategy puts a new General Manager in more than 60 markets in the SpinCo territories. Frontier Properties SpinCo PropertiesNote: Numbers may not sum due to rounding.
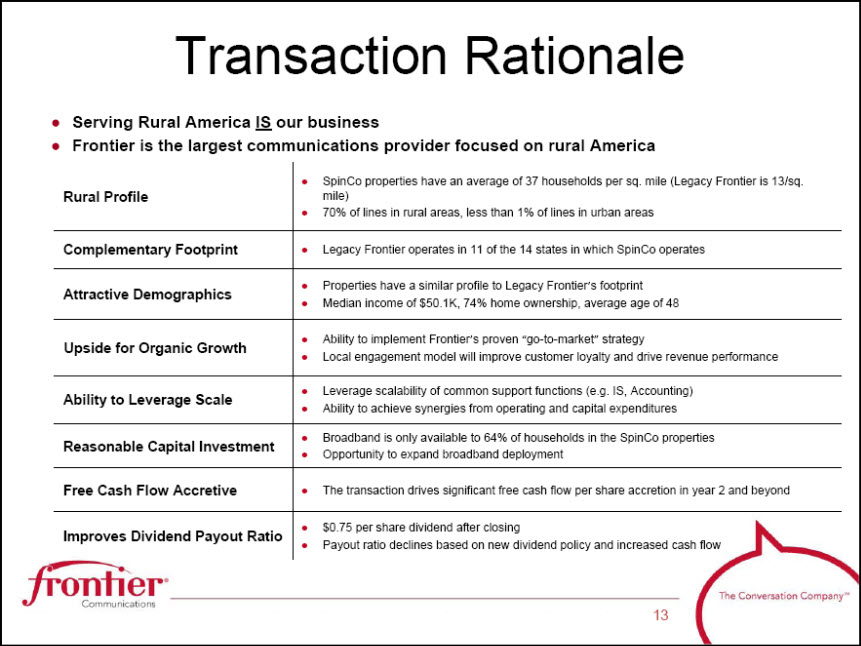
Transaction Rationale Serving Rural America IS our business Frontier is the largest communications provider focused on rural America Rural Profile SpinCo properties have an average of 37 households per sq. mile (Legacy Frontier is 13/sq. mile) 70% of lines in rural areas, less than 1% of lines in urban areas Complementary Footprint Legacy Frontier operates in 11 of the 14 states in which SpinCo operates Attractive Demographics Properties have a similar profile to Legacy Frontier’s footprint Median income of $50.1K, 74% home ownership, average age of 48 Upside for Organic Growth Ability to implement Frontier’s proven “go-to-market” strategy Local engagement model will improve customer loyalty and drive revenue performance Ability to Leverage Scale Leverage scalability of common support functions (e.g. IS, Accounting) Ability to achieve synergies from operating and capital expenditures Reasonable Capital Investment Broadband is only available to 64% of households in the SpinCo properties Opportunity to expand broadband deployment Free Cash Flow Accretive The transaction drives significant free cash flow per share accretion in year 2 and beyond Improves Dividend Payout Ratio $0.75 per share dividend after closing Payout ratio declines based on new dividend policy and increased cash flow
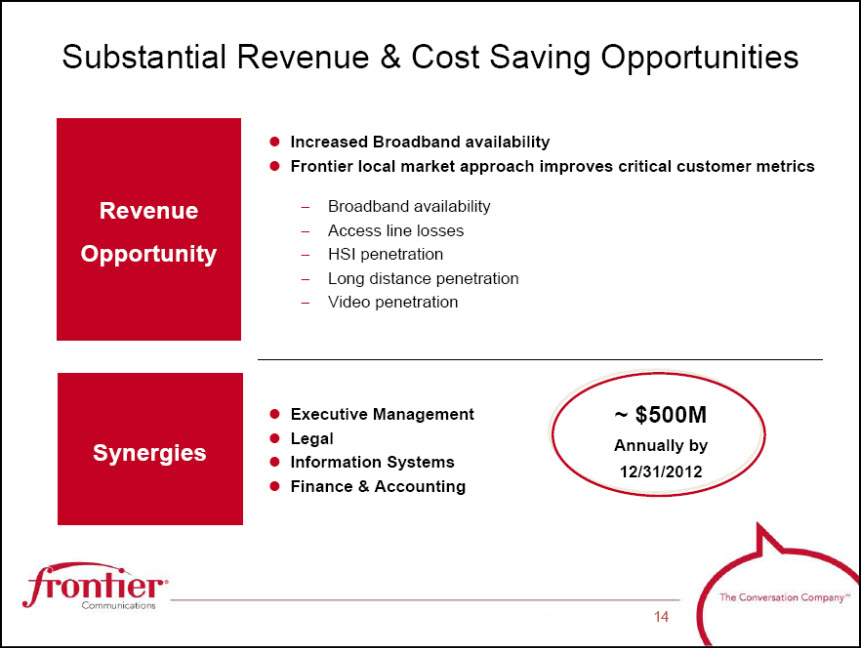
Substantial Revenue & Cost Saving Opportunities Revenue Opportunity Increased Broadband availability Frontier local market approach improves critical customer metrics Broadband availability Access line losses HSI penetration Long distance penetration Video penetration Synergies Executive Management Legal Information Systems Finance & Accounting ~ $500M Annually by 12/31/2012
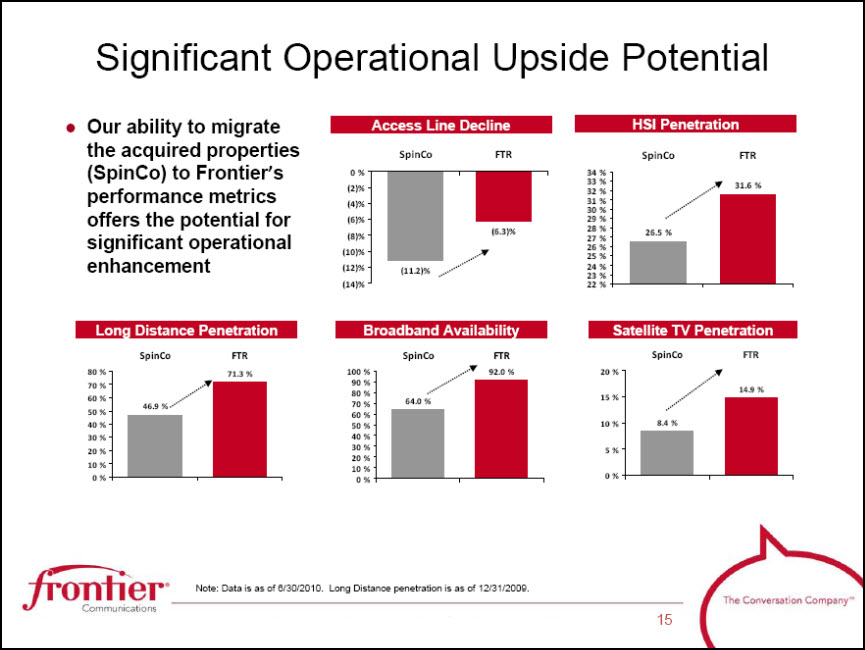
Significant Operational Upside Potential Our ability to migrate the acquired properties (SpinCo) to Frontier’s performance metrics offers the potential for significant operational enhancement Access Line Decline (11.2)% (6.3)% (14)% (12)% (10)% (8)% (6)% (4)% (2)% 0% SpinCoFTR HSI Penetration 26.5% 31.6% 22% 23% 24% 25% 26% 27% 28% 29% 30% 31% 32% 33% 34% SpinCoFTR Long Distance Penetration 46.9% 71.3% 0% 10% 20% 30% 40% 50% 60% 70% 80% SpinCo FTR Broadband Availability 64.0% 92.0% 0% 10% 20% 30% 40% 50% 60% 70% 80% 90% 100% SpinCoFTR Satellite TV Penetration 8.4% 14.9% 0% 5% 10% 15% 20% SpinCoFTR Note: Data is as of 6/30/2010. Long Distance penetration is as of 12/31/2009.
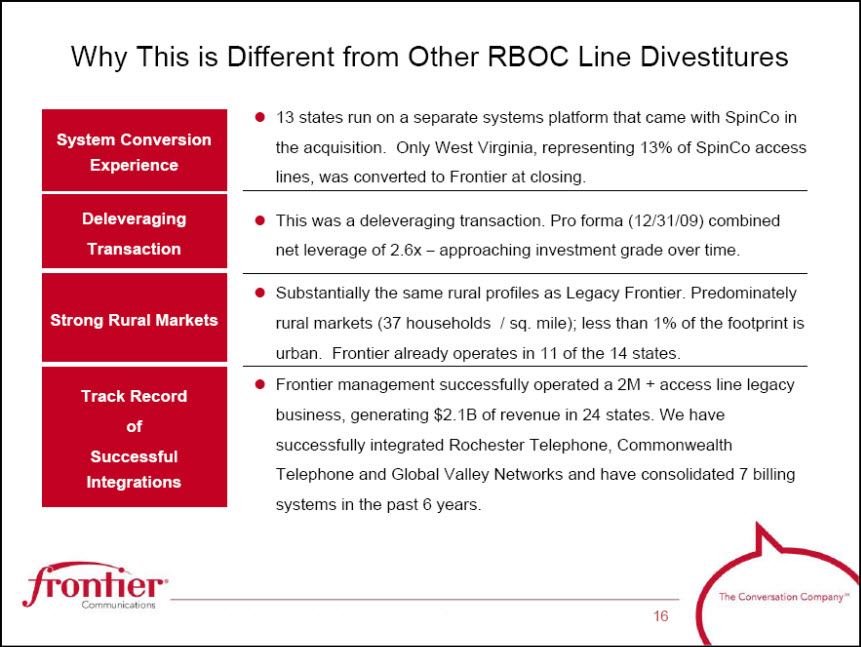
Why This is Different from Other RBOC Line Divestitures System Conversion Experience 13 states run on a separate systems platform that came with SpinCo in the acquisition. Only West Virginia, representing 13% of SpinCo access lines, was converted to Frontier at closing. Deleveraging Transaction This was a deleveraging transaction. Pro forma (12/31/09) combined net leverage of 2.6x – approaching investment grade over time. Strong Rural Markets Substantially the same rural profiles as Legacy Frontier. Predominately rural markets (37 households / sq. mile); less than 1% of the footprint is urban. Frontier already operates in 11 of the 14 states. Track Record of Successful Integrations Frontier management successfully operated a 2M + access line legacy business, generating $2.1B of revenue in 24 states. We have successfully integrated Rochester Telephone, Commonwealth Telephone and Global Valley Networks and have consolidated 7 billing systems in the past 6 years.
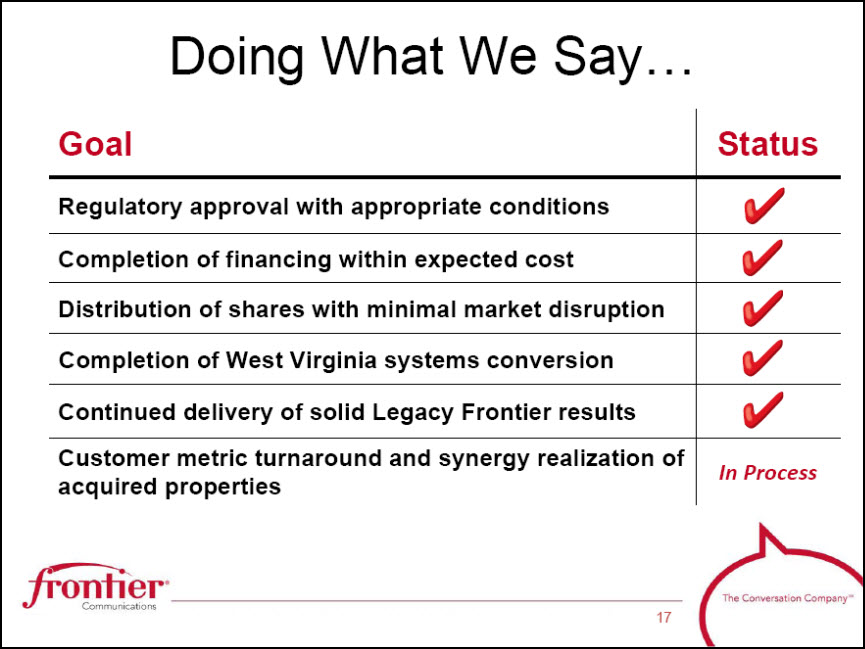
Doing What We Say… Goal Status Regulatory approval with appropriate conditions Completion of financing within expected cost Distribution of shares with minimal market disruption Completion of West Virginia systems conversion Continued delivery of solid Legacy Frontier results Customer metric turnaround and synergy realization of acquired properties In Process
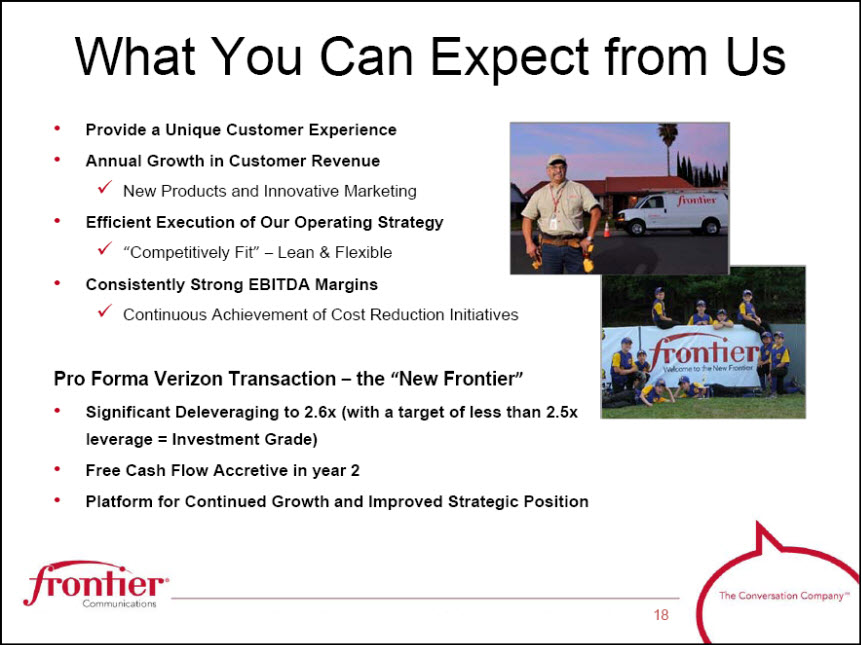
What You Can Expect from Us Provide a Unique Customer Experience Annual Growth in Customer Revenue New Products and Innovative Marketing Efficient Execution of Our Operating Strategy “Competitively Fit”–Lean & Flexible Consistently Strong EBITDA Margins Continuous Achievement of Cost Reduction Initiatives Pro Forma Verizon Transaction – the “New Frontier” Significant Deleveraging to 2.6x (with a target of less than 2.5x leverage = Investment Grade) Free Cash Flow Accretive in year 2 Platform for Continued Growth and Improved Strategic Position
Appendix

Legacy Frontier Selected Financial Metrics $ Millions 2005 2006 2007 2008 2009 Revenue (1) $ 2,017 $ 2,025 $ 2,249 $ 2,237 $ 2,118 Customer Revenue (2) $ 1,586 $ 1,597 $ 1,809 $ 1,832 $ 1,758 Adjusted EBITDA (3) $ 1,116 $ 1,128 $ 1,213 $ 1,214 $ 1,149 EBITDA Margin 55.3% 55.7% 53.9% 54.3% 54.2% Capital Expenditures (4) 259 $ 269 $ 306 $ 288 $ 231 Revenue 12.9% 13.3% 13.6% 12.9% 10.9% Free Cash Flow (5) $ 544 $ 562 $ 538 $ 493 $ 491 Access Lines 2,238 2,127 2,429 2,254 2,118 High Speed Internet 318 393 523 580 636 Penetration 14.2% 18.5% 21.5% 25.7% 30.0% Notes 1. Revenue for 2007 excludes the favorable one‐time impact of $38.7 million for a significant settlement of a carrier dispute. 2. Customer revenue is defined as total revenue less access services. Access services include switched network access and subsidies. 3. Represents Operating Cash Flow (EBITDA), as adjusted. Please see Non‐GAAP Reconciliations. 4. Capital expenditures for 2007 and 2009 exclude $9.6 million and $25.0 million, respectively, related to integration activities. 5. Free cash flow includes ELI for all years prior to its sale in July 2006. Please see Non‐GAAP Reconciliations.

Reconciliation of Non-GAAP Financial Measures Reconciliation of Non‐GAAP Financial Measures For the year ended December 31, 2009 ($ in millions) Frontier Verizon's Separate Telephone Operations Pro Forma Adjustments Total Pro Forma EBITDA Operating Income $ 606 $ 542 $ 219 $ 1,367 Add back: Depreciation and amortization 477 781 253 1,511 EBITDA, as reported 1,083 $ 1,323 $ 472 $ 2,878 Add/(subtract): Non-cash pension and other postretirement costs34 52 ‐ 86 Severance and early retirement costs4 ‐ ‐ 4 Acquisition and integration costs 28 ‐ (28) ‐ Adjusted EBITDA $ 1,149 $ 1,375 $ 444 $ 2,968 2009 Pro Forma Frontier and SpinCo
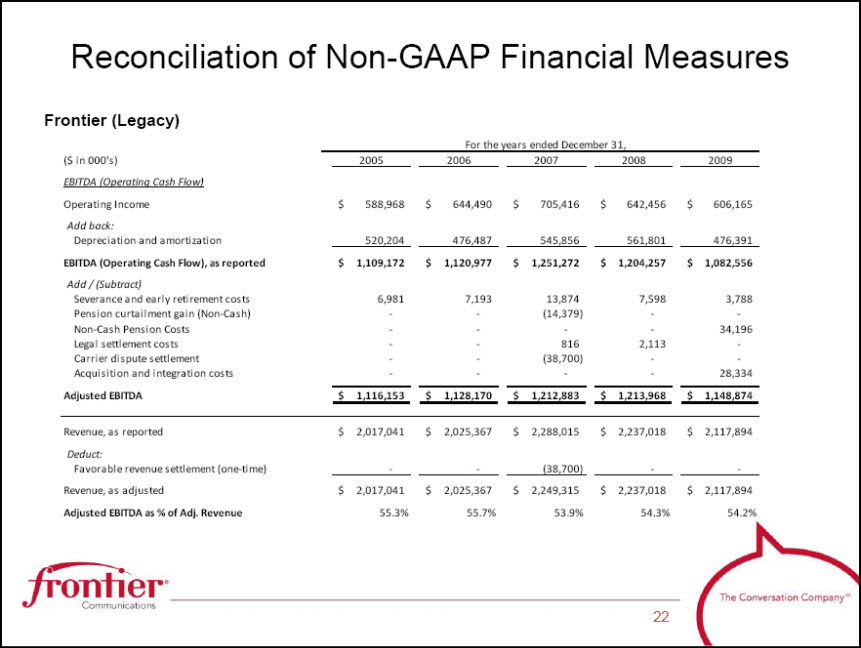
Reconciliation of Non-GAAP Financial Measures ( $ in 000's)2005 2006 2007 2008 2009 EBITDA (Operating Cash Flow) Operating Income $ 588,968 $ 644,490 $ 705,416 $ 642,456 $ 606,165 Add back: Depreciation and amortization 520,204 476,487 545,856 561,801 476,391 EBITDA (Operating Cash Flow), as reported $ 1,109,172 $ 1,120,977 $ 1,251,272 $ 1,204,257 $ 1,082,556 Add / (Subtract) Severance and early retirement costs 6,981 7,193 13,874 7,598 3,788 Pension curtailment gain (Non-Cash)‐ ‐ (14,379) ‐ ‐ Non-Cash Pension Costs‐ ‐ ‐ ‐ 34,196 Legal settlement costs‐ ‐ 816 2,113 ‐ Carrier dispute settlement‐ ‐ (38,700) ‐ ‐ Acquisition and integration costs‐ ‐ ‐ ‐ 28,334 Adjusted EBITDA $ 1,116,153 $ 1,128,170 $ 1,212,883 $ 1,213,968 $ 1,148,874 Revenue, as reported $ 2,017,041 $ 2,025,367 $ 2,288,015 $ 2,237,018 $ 2,117,894 Deduct:Favorable revenue settlement (one‐time)‐ ‐ (38,700) ‐ ‐ Revenue, as adjusted $ 2,017,041 $ 2,025,367 $ 2,249,315 $ 2,237,018 $ 2,117,894 Adjusted EBITDA as % of Adj. Revenue 55.3% 55.7% 53.9% 54.3% 54.2% For the years ended December 31, Frontier (Legacy)

Reconciliation of Non-GAAP Financial Measures Frontier (Legacy) ( $ in 000's) For the years ended December 31,2005 2006 2007 2008 2009 Net income $ 202,375 $ 344,555 $ 214,654 $ 184,274 $ 123,181 Add back: Depreciation and amortization 520,204 476,487 545,856 561,801 476,391 Income tax expense 75,270 136,479 128,014 106,496 69,928 Acquisition and integration costs‐ ‐ ‐ ‐ 28,334 Pension expense (non-cash)‐ ‐ ‐ ‐ 34,196 Stock based compensation 8,427 10,340 9,022 7,788 9,368 Subtract: Cash paid (refunded) for income taxes 4,711 5,365 54,407 78,878 59,735 Pension Curtailment Gain (Non‐Cash)‐ ‐ 14,379 ‐ ‐ Other income (loss), net (2,843) 60,271 (15,038) 20 (40,133) Capital expenditures ‐ business operations 259,448 268,806 306,203 288,264 230,966 Gain on sale of discontinued operations 1,167 71,635 ‐ ‐ ‐ Free cash flow $ 543,793 $ 561,784 $ 537,595 $ 493,197 $ 490,830 Revenue $ 2,017,041 $ 2,025,367 $ 2,288,015 $ 2,237,018 $ 2,117,894 Free cash flow as % of Revenue, as reported 27.0% 27.7% 23.5% 22.0% 23.2%
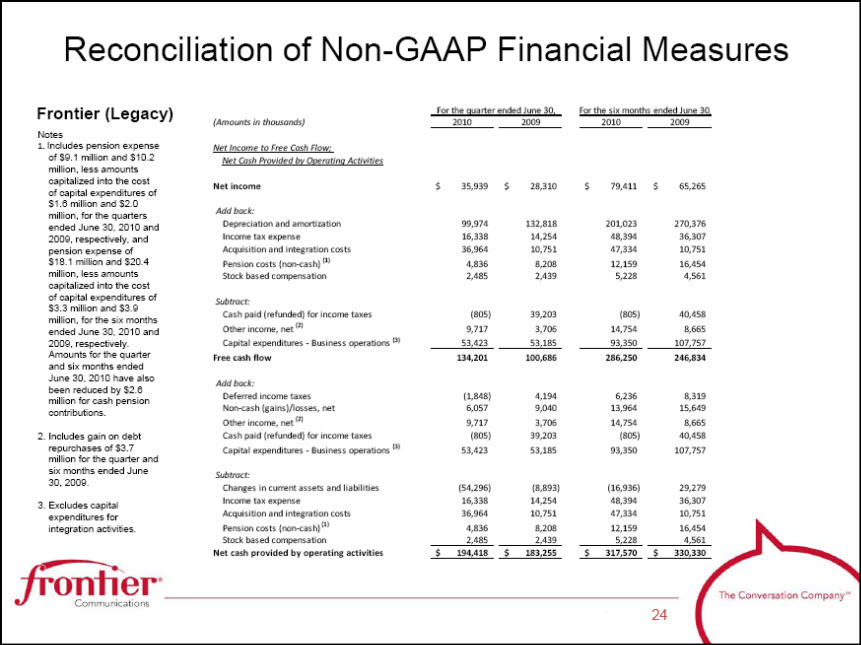
Reconciliation of Non-GAAP Financial Measures Frontier (Legacy) (Amounts in thousands) For the quarter ended June 30, 2010 2009 For the six months ended June 30, 2010 2009 Net Income to Free Cash Flow; Net Cash Provided by Operating ActivitiesNet income $ 35,939 $ 28,310 $ 79,411 $ 65,265 Add back: Depreciation and amortization 99,974 132,818 201,023 270,376 Income tax expense 16,338 14,254 48,394 36,307 Acquisition and integration costs 36,964 10,751 47,334 10,751 Pension costs (non‐cash) (1) 4,836 8,208 12,159 16,454 Stock based compensation 2,485 2,439 5,228 4,561 Subtract: Cash paid (refunded) for income taxes (805) 39,203 (805) 40,458 Other income, net (2) 9,717 3,706 14,754 8,665 Capital expenditures ‐ Business operations (3) 53,423 53,185 93,350 107,757 Free cash flow 134,201 100,686 286,250 246,834 Add back: Deferred income taxes (1,848) 4,194 6,236 8,319 Non‐cash (gains)/losses, net 6,057 9,040 13,964 15,649 Other income, net (2) 9,717 3,706 14,754 8,665 Cash paid (refunded) for income taxes(805) 39,203 (805) 40,458 Capital expenditures ‐ Business operations (3) 53,423 53,185 93,350 107,757 Subtract: Changes in current assets and liabilities (54,296) (8,893) (16,936) 29,279 Income tax expense 16,338 14,254 48,394 36,307 Acquisition and integration costs 36,964 10,751 47,334 10,751 Pension costs (non‐cash) (1) 4,836 8,208 12,159 16,454 Stock based compensation 2,485 2,439 5,228 4,561 Net cash provided by operating activities $ 194,418 $ 183,255 $ 317,570 $ 330,330 Notes 1. Includes pension expense of $9.1 million and $10.2 million, less amounts capitalized into the cost of capital expenditures of $1.6 million and $2.0 million, for the quarters ended June 30, 2010 and 2009, respectively, and pension expense of $18.1 million and $20.4 million, less amounts capitalized into the cost of capital expenditures of $3.3 million and $3.9 million, for the six months ended June 30, 2010 and 2009, respectively. Amounts for the quarter and six months ended June 30, 2010 have also been reduced by $2.6 million for cash pension contributions. 2. Includes gain on debt repurchases of $3.7 million for the quarter and six months ended June 30, 2009. 3. Excludes capital expenditures for integration activities.
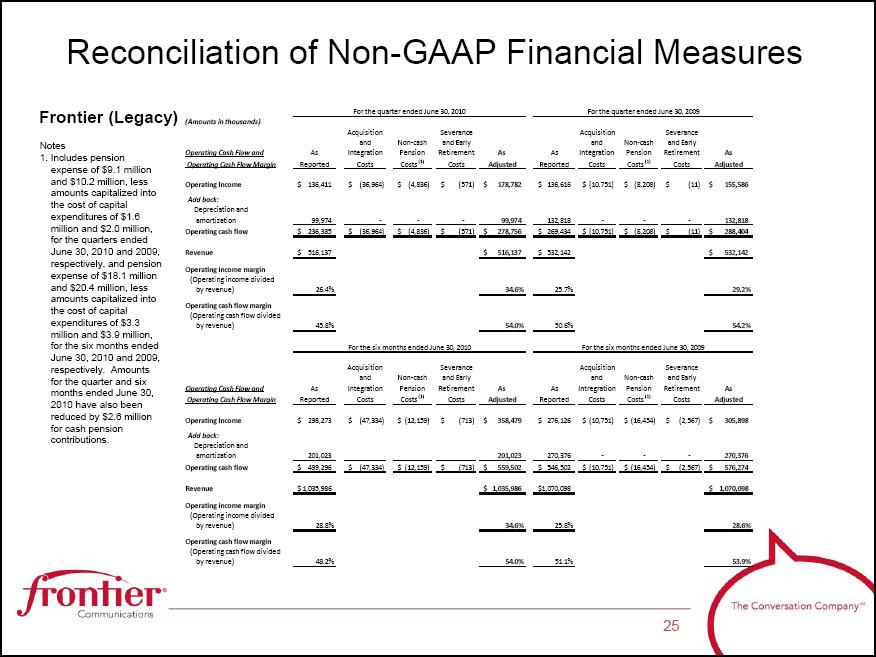
Reconciliation of Non-GAAP Financial Measures Frontier (Legacy) (Amounts in thousands) For the quarter ended June 30, 2010For the quarter ended June 30, 2009 As Reported Acquisition and Integration Costs Non-cash Pension Costs (1) Severance and Early Retirement Costs As Adjusted As Reported Acquisition and Integration Costs Non‐cash Pension Costs (1) Severance and Early Retirement Costs As Adjusted Operating Cash Flow and Operating Cash Flow Margin Operating Income136,411 $ (36,964) $ (4,836) $ (571) $ 178,782 $ 136,616 $ (10,751) $ (8,208) $ (11) $ 155,586 $ Add back: Depreciation and amortization 99,974 ‐ ‐ ‐ 99,974132,818 ‐ ‐ ‐ 132,818 Operating cash flow236,385 $ (36,964) $ (4,836) $ (571) $ 278,756 $ 269,434 $ (10,751) $ (8,208) $ (11) $ 288,404 $ Revenue516,137 $ 516,137 $ 532,142 $ 532,142 $ Operating income margin (Operating income divided by revenue)26.4% 34.6% 25.7% 29.2% Operating cash flow margin (Operating cash flow divided by revenue)45.8% 54.0% 50.6% 54.2% AcquisitionSeveranceAcquisitionSeveranceandNon‐cashand EarlyandNon‐cashand EarlyOperating Cash Flow andAsIntegrationPensionRetirementAs AsIntregrationPensionRetirementAs Operating Cash Flow MarginReportedCostsCosts (1)CostsAdjustedReportedCostsCosts (1)CostsAdjustedOperating Income298,273 $ (47,334) $ (12,159) $ (713) $ 358,479 $ 276,126 $ (10,751) $ (16,454) $ (2,567) $ 305,898 $ Add back: Depreciation and amortization 201,023 201,023270,376 ‐ ‐ ‐ 270,376 Operating cash flow499,296 $ (47,334) $ (12,159) $ (713) $ 559,502 $ 546,502 $ (10,751) $ (16,454) $ (2,567) $ 576,274 $ Revenue1,035,986 $ 1,035,986 $ 1,070,098 $ 1,070,098 $ Operating income margin (Operating income divided by revenue)28.8% 34.6% 25.8% 28.6% Operating cash flow margin (Operating cash flow divided by revenue)48.2% 54.0% 51.1% 53.9% For the six months ended June 30, 2010For the six months ended June 30, 2009 Notes 1. Includes pension expense of $9.1 million and $10.2 million, less amounts capitalized into the cost of capital expenditures of $1.6 million and $2.0 million, for the quarters ended June 30, 2010 and 2009, respectively, and pension expense of $18.1 million and $20.4 million, less amounts capitalized into the cost of capital expenditures of $3.3 million and $3.9 million, for the six months ended June 30, 2010 and 2009, respectively. Amounts for the quarter and six months ended June 30, 2010 have also been reduced by $2.6 million for cash pension contributions.
Frontier Communications Corp. NYSE: FTR Investor Relations 3 High Ridge Park Stamford, CT 06905 203.614.4606 IR@FTR.com