Attached files
| file | filename |
|---|---|
| 8-K - FORM 8-K - PINNACLE FINANCIAL PARTNERS INC | g24594e8vk.htm |

| Investor Presentation Terry Turner, President and CEO Harold Carpenter, EVP and CFO Harvey White, Chief Credit Officer September 9, 2010 1 |
| Forward-looking statements Certain of the statements and information in this presentation may constitute forward-looking statements within the meaning of Section 27A of the Securities Act of 1933, as amended, and Section 21E of the Securities Exchange Act of 1934, as amended. The words "expect," "anticipate," "goal," "objective," "intend," "plan," "believe," "should," "seek," "estimate" and similar expressions are intended to identify such forward-looking statements, but other statements not based on historical information may also be considered forward-looking. All forward-looking statements are subject to risks, uncertainties and other factors that may cause the actual results, performance or achievements of Pinnacle Financial to differ materially from any results expressed or implied by such forward-looking statements. Such factors include, without limitation, (i) deterioration in the financial condition of borrowers resulting in significant increases in loan losses and provisions for those losses; (ii) continuation of the historically low short-term interest rate environment; (iii) the continued reduction of Pinnacle Financial's loan balances, and conversely, the inability of Pinnacle Financial to ultimately grow its loan portfolio in the Nashville-Davidson-Murfreesboro-Franklin MSA and the Knoxville MSA; (iv) changes in loan underwriting, credit review or loss reserve policies associated with economic conditions, examination conclusions, or regulatory developments; (v) increased competition with other financial institutions; (vi) greater than anticipated deterioration or lack of sustained growth in the national or local economies including the Nashville-Davidson-Murfreesboro-Franklin MSA and the Knoxville MSA, particularly in commercial and residential real estate markets; (vii) rapid fluctuations or unanticipated changes in interest rates; (viii) the results of regulatory examinations; (ix) the development of any new market other than Nashville or Knoxville; (x) a merger or acquisition; (xi) any matter that would cause Pinnacle Financial to conclude that there was impairment of any asset, including goodwill and other intangible assets; (xii) the impact of governmental restrictions on entities participating in the Capital Purchase Program, of the U.S. Department of the Treasury (the "Treasury"); (xiii) further deterioration in the valuation of collateral securing residential and commercial real estate loans or other real estate owned; (xiv) inability to comply with regulatory capital requirements and to secure any required regulatory approvals for capital actions; and (xv) changes in state and federal legislation, regulations or policies applicable to banks and other financial service providers, including implementation of the Dodd-Frank Wall Street Reform and Consumer Protection Act; and (xvi) Pinnacle Financial recording a further valuation allowance related to its deferred tax asset. A more detailed description of these and other risks is contained in Pinnacle Financial's most recent annual report on Form 10-K filed with the Securities and Exchange Commission on February 26, 2010 and most recent quarterly reports on Form 10-Q filed with the Securities and Exchange Commission on May 7 and July 21, 2010. Many of such factors are beyond Pinnacle Financial's ability to control or predict, and readers are cautioned not to put undue reliance on such forward-looking statements. Further, short-term unaudited results may be subject to significant volatility and may not be indicative of results for longer periods. Pinnacle Financial disclaims any obligation to update or revise any forward-looking statements contained in this presentation, whether as a result of new information, future events or otherwise. Safe Harbor Statements 2 |
| Aggressively dealing with credit issues Building the core earnings capacity of the firm Stabilizing market trends Continuing to seize on competitive vulnerabilities Opening Comments 3 |
| Aggressively Dealing with Credit Issues 4 Routine regulatory exam completed Forecast significant quarter to quarter reduction in NCOs NPAs should be flat to down Second quarterly reduction in NPLs 3Q10 growth in OREO facilitates our ability to accelerate and manage disposition of troubled assets in future periods Continued rapid reduction in C&D book 3Q10 Progress |
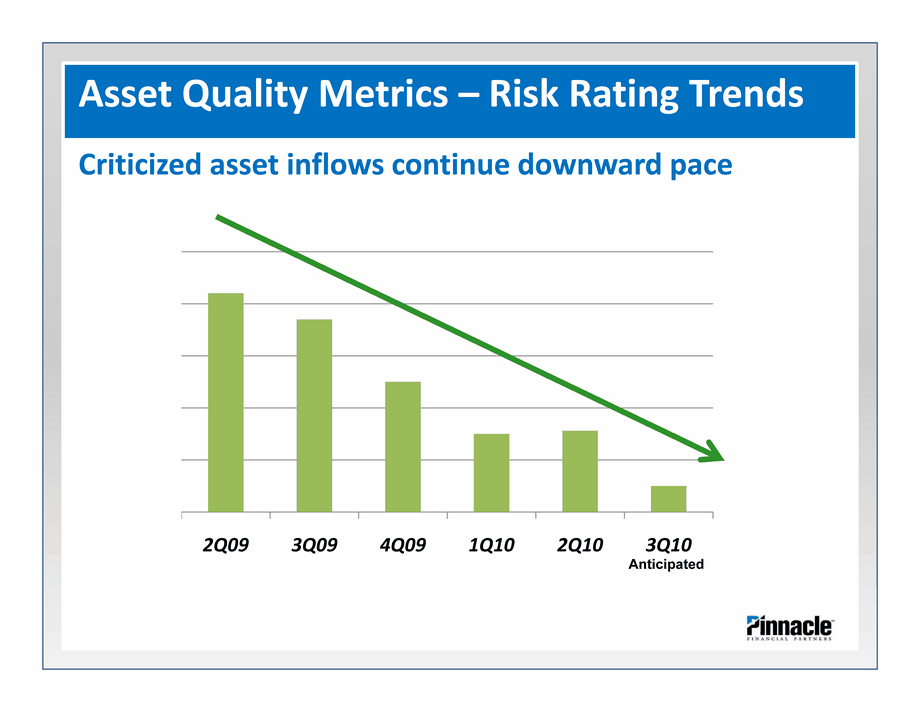
| (CHART) Asset Quality Metrics - Risk Rating Trends Criticized asset inflows continue downward pace Anticipated |
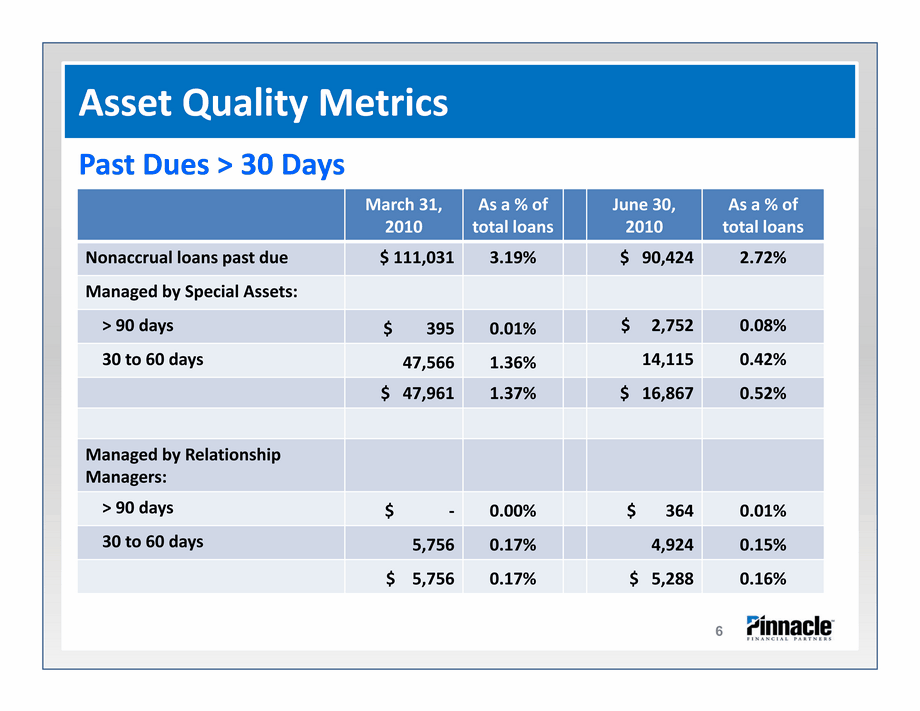
| Asset Quality Metrics 6 March 31, 2010 As a % of total loans June 30, 2010 As a % of total loans Nonaccrual loans past due $ 111,031 3.19% $ 90,424 2.72% Managed by Special Assets: > 90 days $ 395 0.01% $ 2,752 0.08% 30 to 60 days 47,566 1.36% 14,115 0.42% $ 47,961 1.37% $ 16,867 0.52% Managed by Relationship Managers: > 90 days $ - 0.00% $ 364 0.01% 30 to 60 days 5,756 0.17% 4,924 0.15% $ 5,756 0.17% $ 5,288 0.16% Past Dues > 30 Days |
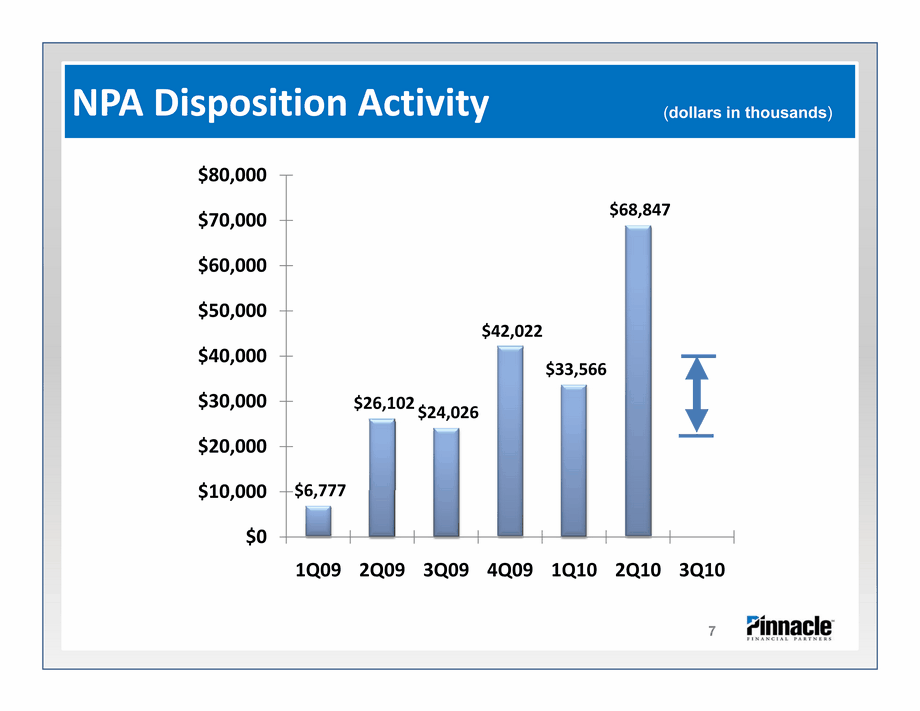
| NPA Disposition Activity NPA Disposition Activity (dollars in thousands) 7 |
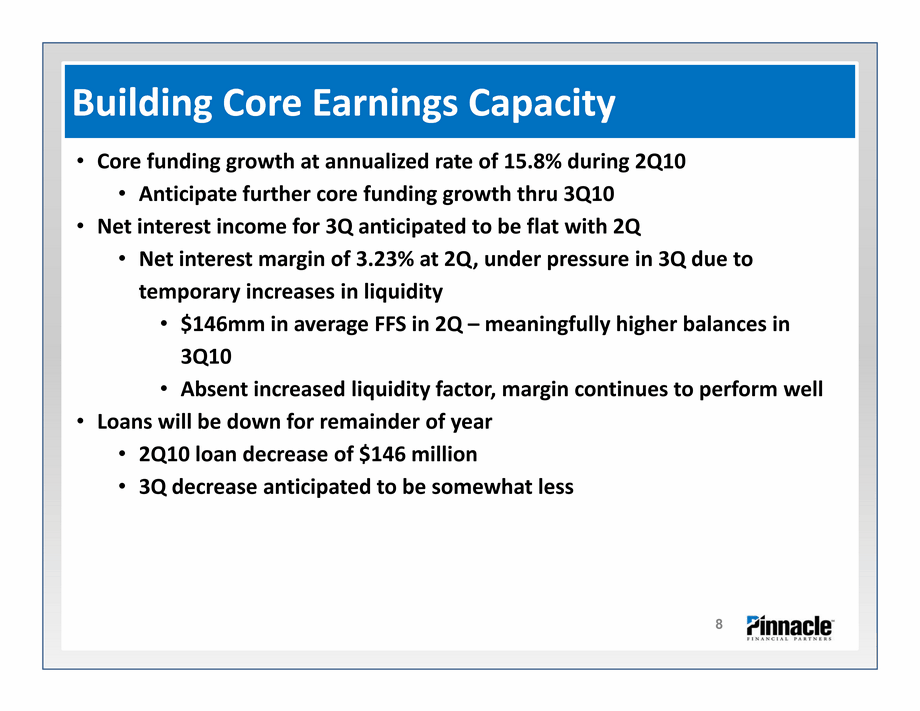
| Core funding growth at annualized rate of 15.8% during 2Q10 Anticipate further core funding growth thru 3Q10 Net interest income for 3Q anticipated to be flat with 2Q Net interest margin of 3.23% at 2Q, under pressure in 3Q due to temporary increases in liquidity $146mm in average FFS in 2Q - meaningfully higher balances in 3Q10 Absent increased liquidity factor, margin continues to perform well Loans will be down for remainder of year 2Q10 loan decrease of $146 million 3Q decrease anticipated to be somewhat less Building Core Earnings Capacity 8 |
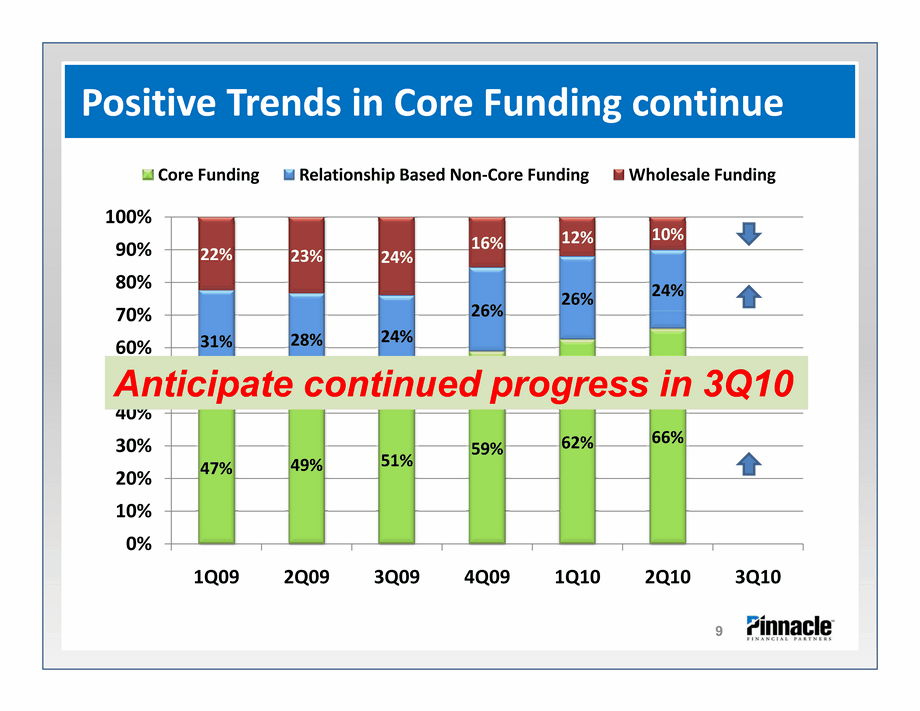
| 9 (CHART) Positive Trends in Core Funding continue Anticipate continued progress in 3Q10 |
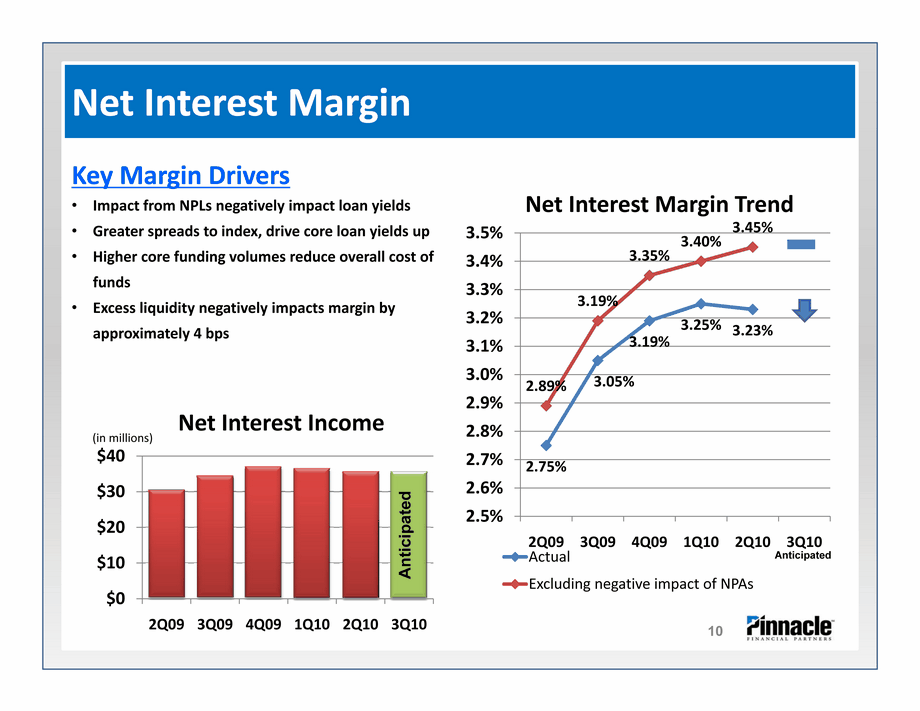
| Net Interest Margin (CHART) (CHART) 10 Key Margin Drivers Impact from NPLs negatively impact loan yields Greater spreads to index, drive core loan yields up Higher core funding volumes reduce overall cost of funds Excess liquidity negatively impacts margin by approximately 4 bps Anticipated Anticipated |
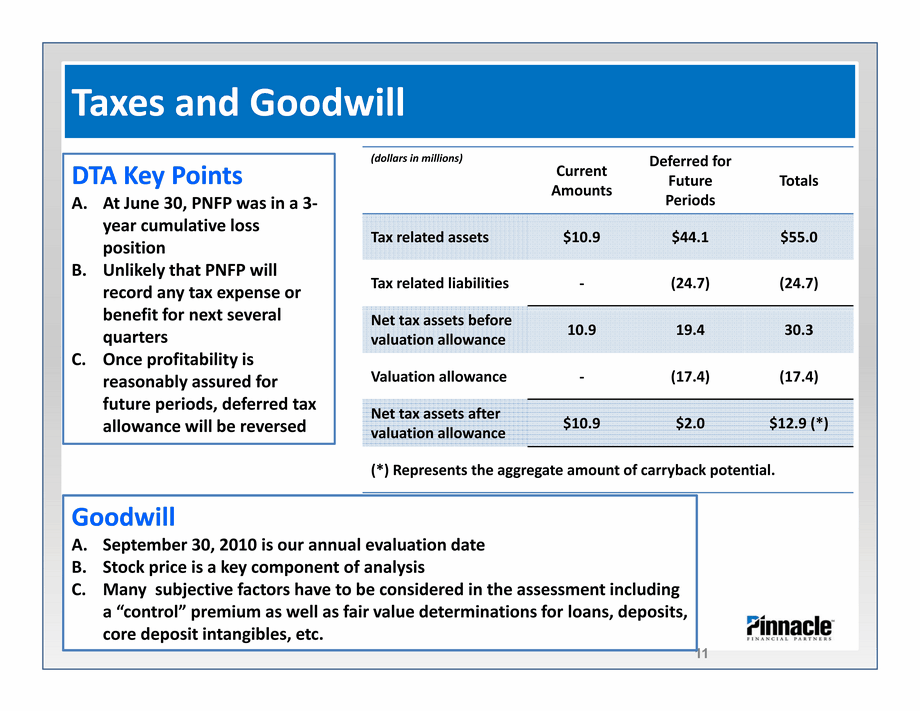
| Taxes and Goodwill Taxes and Goodwill 11 DTA Key Points At June 30, PNFP was in a 3- year cumulative loss position Unlikely that PNFP will record any tax expense or benefit for next several quarters Once profitability is reasonably assured for future periods, deferred tax allowance will be reversed Goodwill September 30, 2010 is our annual evaluation date Stock price is a key component of analysis Many subjective factors have to be considered in the assessment including a "control" premium as well as fair value determinations for loans, deposits, core deposit intangibles, etc. |
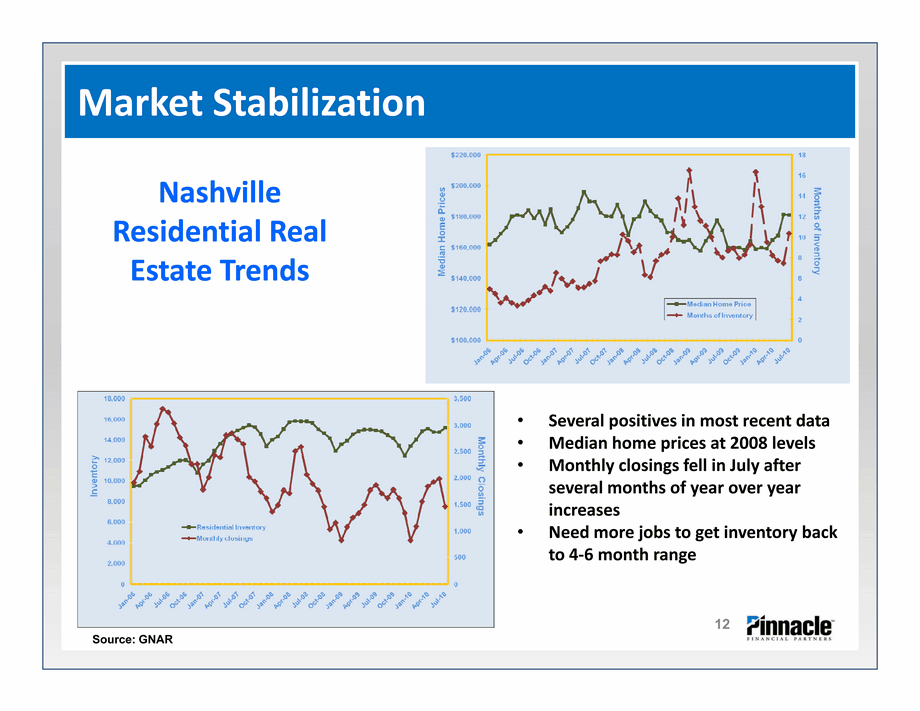
| Several positives in most recent data Median home prices at 2008 levels Monthly closings fell in July after several months of year over year increases Need more jobs to get inventory back to 4-6 month range Market Stabilization 12 Source: GNAR Nashville Residential Real Estate Trends |
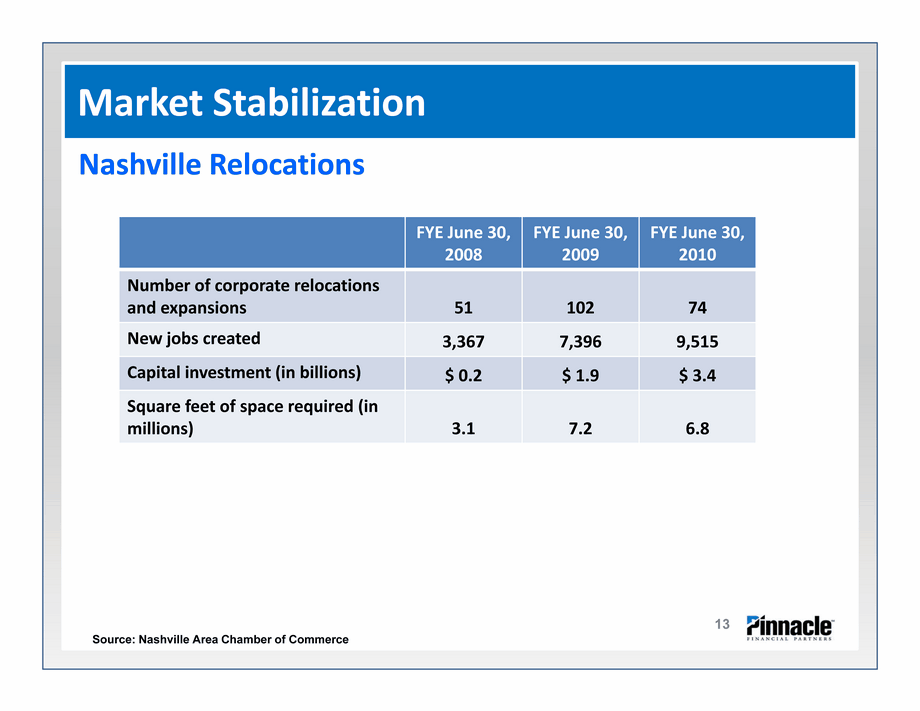
| Market Stabilization 13 Nashville Relocations FYE June 30, 2008 FYE June 30, 2009 FYE June 30, 2010 Number of corporate relocations and expansions 51 102 74 New jobs created 3,367 7,396 9,515 Capital investment (in billions) $ 0.2 $ 1.9 $ 3.4 Square feet of space required (in millions) 3.1 7.2 6.8 Source: Nashville Area Chamber of Commerce |
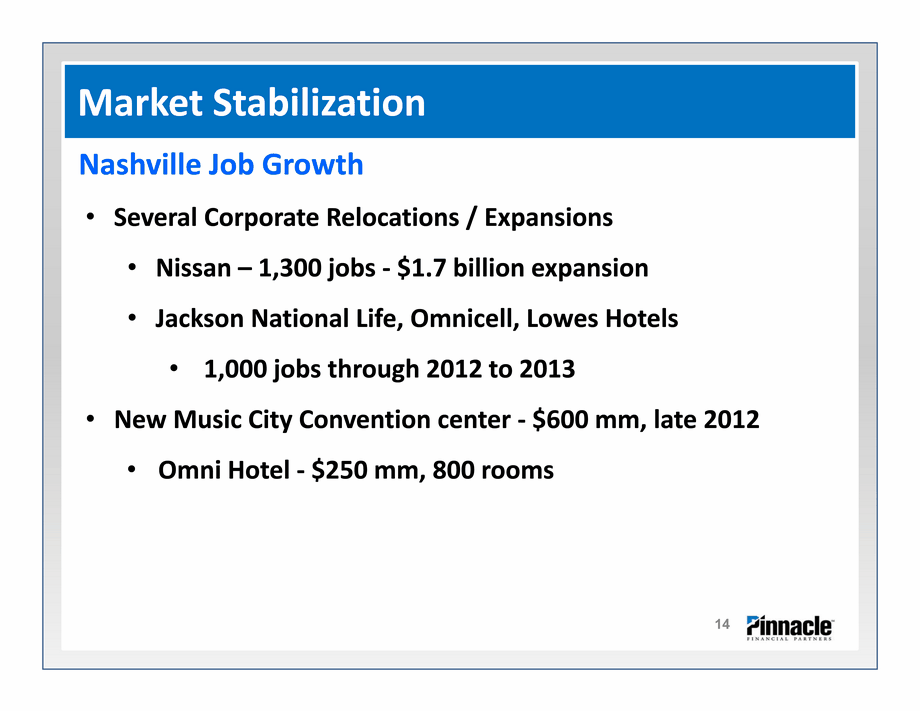
| Several Corporate Relocations / Expansions Nissan - 1,300 jobs - $1.7 billion expansion Jackson National Life, Omnicell, Lowes Hotels 1,000 jobs through 2012 to 2013 New Music City Convention center - $600 mm, late 2012 Omni Hotel - $250 mm, 800 rooms Market Stabilization 14 Nashville Job Growth |
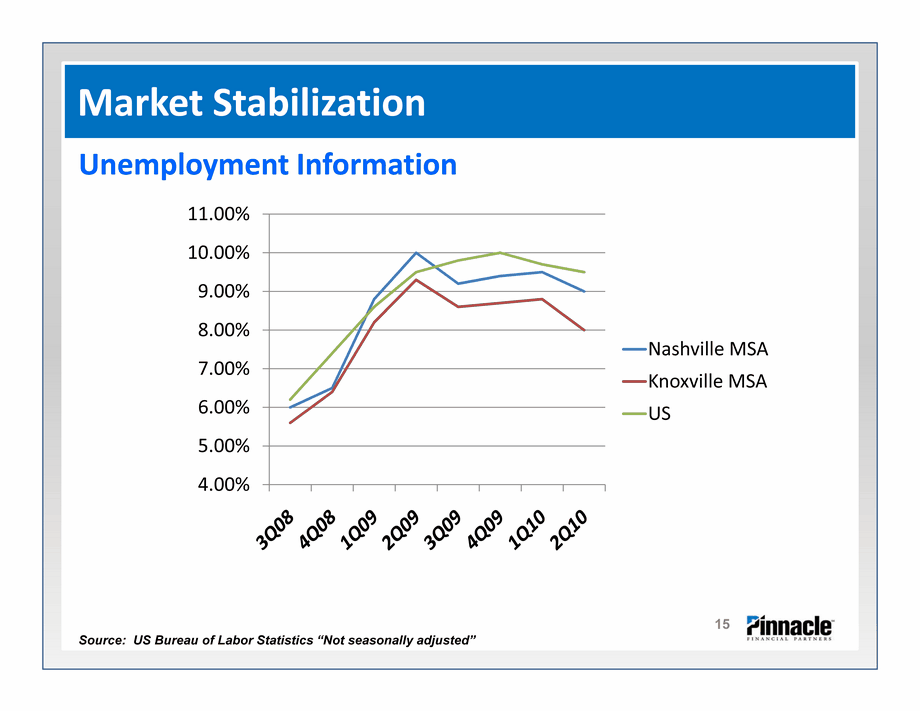
| Market Stabilization 15 Unemployment Information (CHART) Source: US Bureau of Labor Statistics "Not seasonally adjusted" |
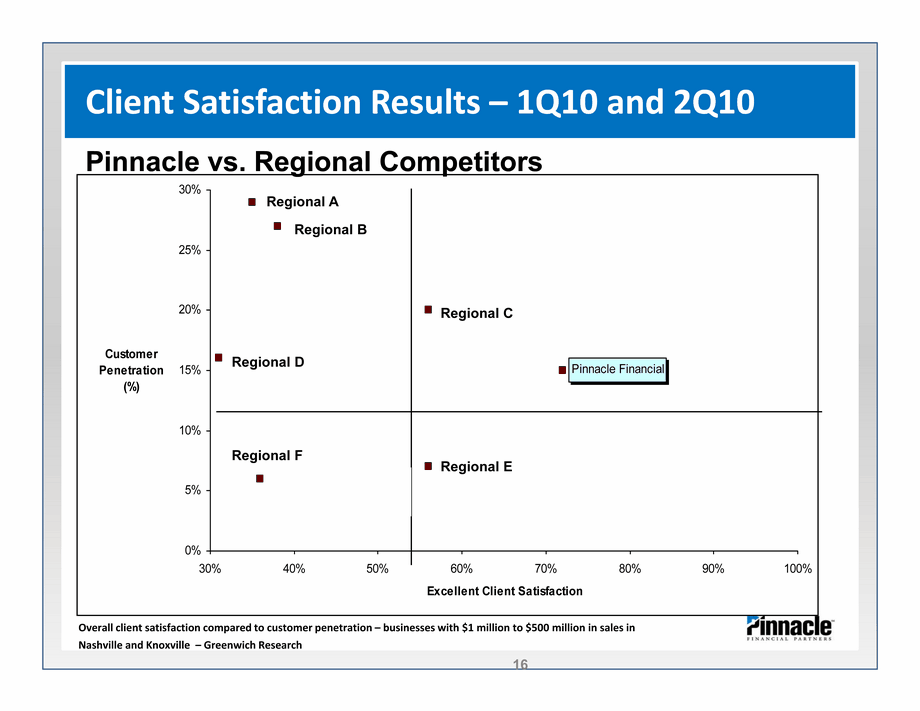
| {Header} Excellent Client Satisfaction Customer Penetration Regions Bank 0.35 0.29 SunTrust 0.38 0.27 First Tennessee 0.56 0.2 Pinnacle Financial 0.72 0.15 BofA/ML 0.31 0.16 BB&T 0.56 0.07 Home Federal Bank of Tennessee 0.49 0.06 Wells Fargo/Wachovia 0.36 0.06 Wilson Bank & Trust 0.93 0.02 FSGBank 0.76 0.02 avg 0.54 0.13 16 Client Satisfaction Results - 1Q10 and 2Q10 Overall client satisfaction compared to customer penetration - businesses with $1 million to $500 million in sales in Nashville and Knoxville - Greenwich Research Pinnacle vs. Regional Competitors Regional A Regional F Regional E Regional D Regional C Regional B |
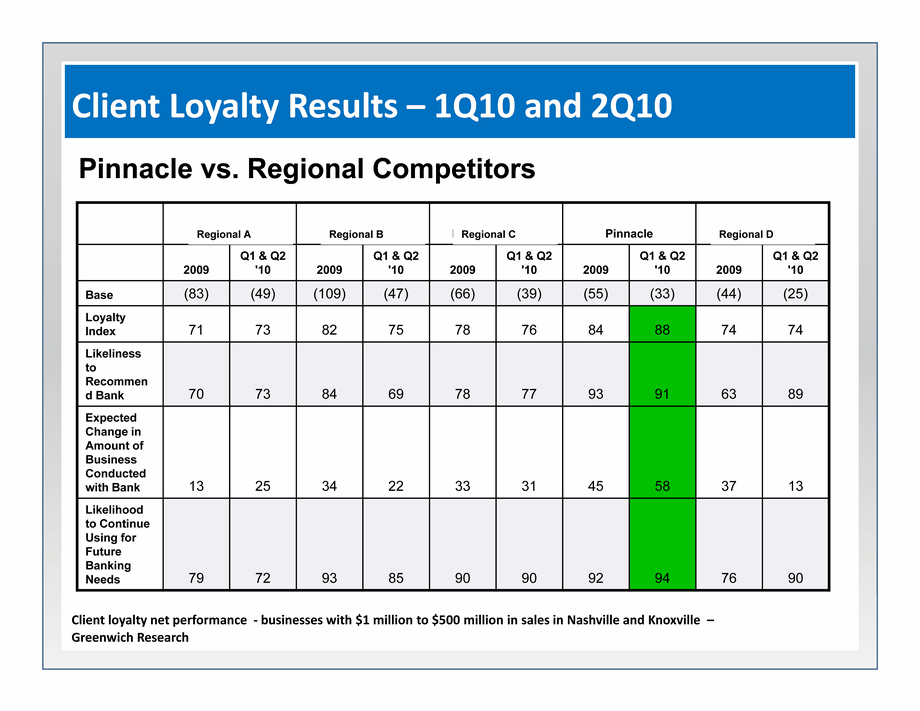
| Regions Bank Regions Bank SunTrust SunTrust First Tennessee First Tennessee Pinnacle Pinnacle Bank of America Bank of America 2009 Q1 & Q2 '10 2009 Q1 & Q2 '10 2009 Q1 & Q2 '10 2009 Q1 & Q2 '10 2009 Q1 & Q2 '10 Base (83) (49) (109) (47) (66) (39) (55) (33) (44) (25) Loyalty Index 71 73 82 75 78 76 84 88 74 74 Likeliness to Recommend Bank 70 73 84 69 78 77 93 91 63 89 Expected Change in Amount of Business Conducted with Bank 13 25 34 22 33 31 45 58 37 13 Likelihood to Continue Using for Future Banking Needs 79 72 93 85 90 90 92 94 76 90 Client Loyalty Results - 1Q10 and 2Q10 Client loyalty net performance - businesses with $1 million to $500 million in sales in Nashville and Knoxville - Greenwich Research Pinnacle vs. Regional Competitors Regional A Regional D Regional C Regional B |
| Aggressively addressing problem credits Pursuing meaningful NPA resolution Continued reductions in exposure to C&D Attractive markets Market stabilization and recovery Ability to seize competitive vulnerabilities Responsibly growing core earnings capacity Final Thoughts 18 |

| Investor Presentation Supplemental Information Terry Turner, President and CEO Harold Carpenter, EVP and CFO Harvey White, Chief Credit Officer September 9, 2010 19 |
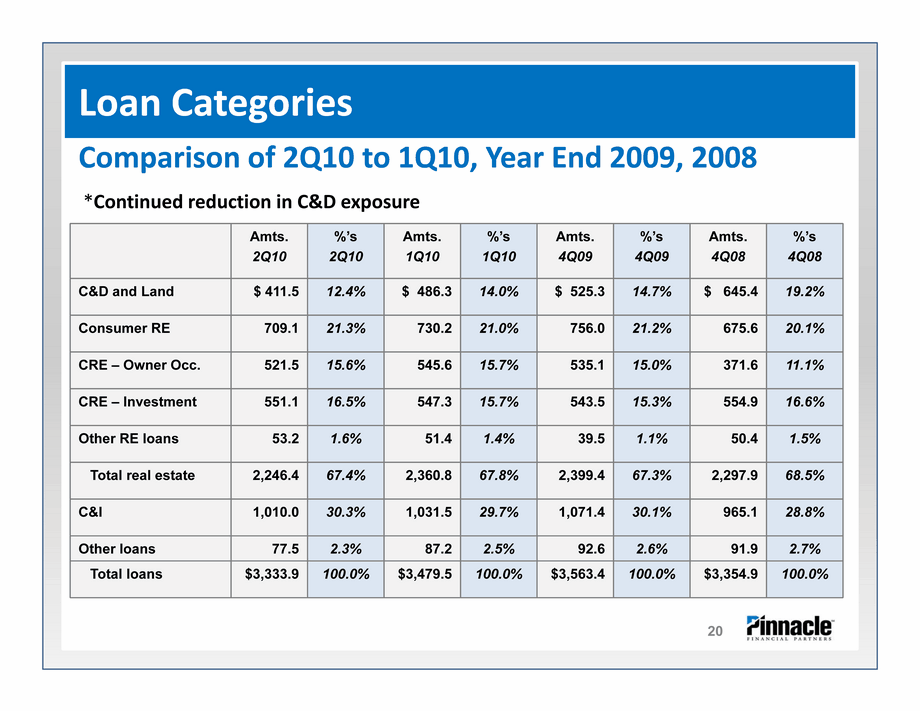
| Comparison of 2Q10 to 1Q10, Year End 2009, 2008 *Continued reduction in C&D exposure Amts.2Q10 %'s2Q10 Amts.1Q10 %'s1Q10 Amts.4Q09 %'s4Q09 Amts.4Q08 %'s4Q08 C&D and Land $ 411.5 12.4% $ 486.3 14.0% $ 525.3 14.7% $ 645.4 19.2% Consumer RE 709.1 21.3% 730.2 21.0% 756.0 21.2% 675.6 20.1% CRE - Owner Occ. 521.5 15.6% 545.6 15.7% 535.1 15.0% 371.6 11.1% CRE - Investment 551.1 16.5% 547.3 15.7% 543.5 15.3% 554.9 16.6% Other RE loans 53.2 1.6% 51.4 1.4% 39.5 1.1% 50.4 1.5% Total real estate 2,246.4 67.4% 2,360.8 67.8% 2,399.4 67.3% 2,297.9 68.5% C&I 1,010.0 30.3% 1,031.5 29.7% 1,071.4 30.1% 965.1 28.8% Other loans 77.5 2.3% 87.2 2.5% 92.6 2.6% 91.9 2.7% Total loans $3,333.9 100.0% $3,479.5 100.0% $3,563.4 100.0% $3,354.9 100.0% Loan Categories 20 |
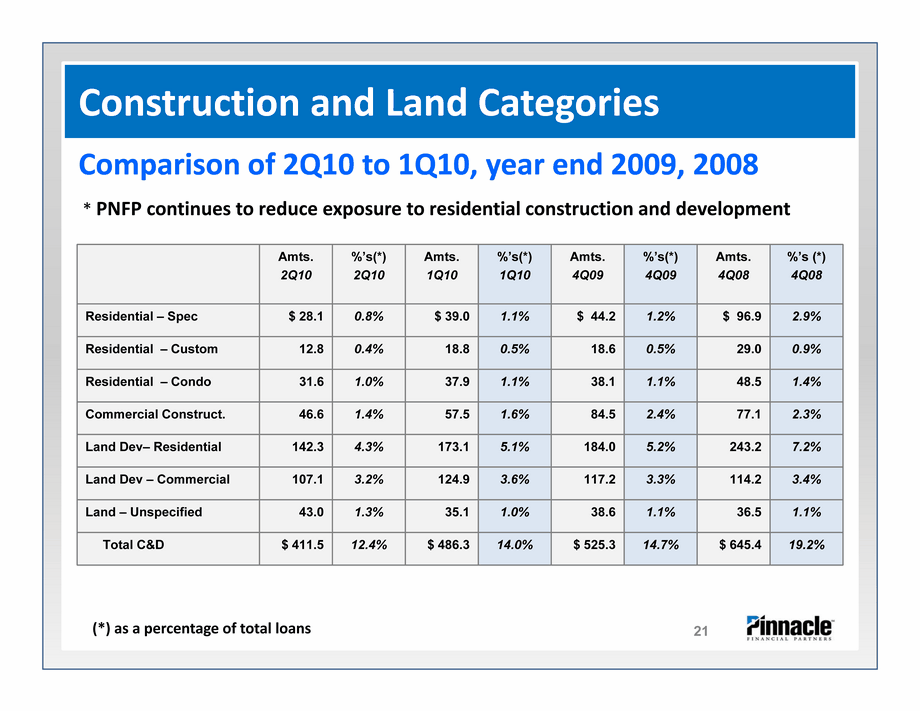
| Amts.2Q10 %'s(*)2Q10 Amts.1Q10 %'s(*)1Q10 Amts.4Q09 %'s(*)4Q09 Amts.4Q08 %'s (*)4Q08 Residential - Spec $ 28.1 0.8% $ 39.0 1.1% $ 44.2 1.2% $ 96.9 2.9% Residential - Custom 12.8 0.4% 18.8 0.5% 18.6 0.5% 29.0 0.9% Residential - Condo 31.6 1.0% 37.9 1.1% 38.1 1.1% 48.5 1.4% Commercial Construct. 46.6 1.4% 57.5 1.6% 84.5 2.4% 77.1 2.3% Land Dev- Residential 142.3 4.3% 173.1 5.1% 184.0 5.2% 243.2 7.2% Land Dev - Commercial 107.1 3.2% 124.9 3.6% 117.2 3.3% 114.2 3.4% Land - Unspecified 43.0 1.3% 35.1 1.0% 38.6 1.1% 36.5 1.1% Total C&D $ 411.5 12.4% $ 486.3 14.0% $ 525.3 14.7% $ 645.4 19.2% (*) as a percentage of total loans Construction and Land Categories Comparison of 2Q10 to 1Q10, year end 2009, 2008 * PNFP continues to reduce exposure to residential construction and development 21 |
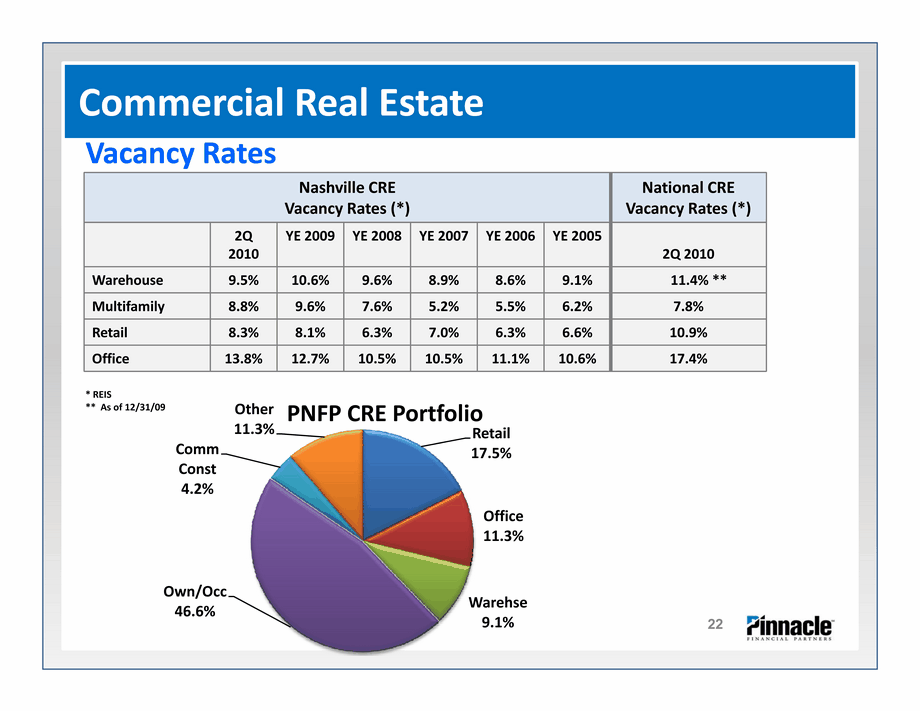
| Vacancy Rates Nashville CRE Vacancy Rates (*) Nashville CRE Vacancy Rates (*) Nashville CRE Vacancy Rates (*) Nashville CRE Vacancy Rates (*) Nashville CRE Vacancy Rates (*) Nashville CRE Vacancy Rates (*) Nashville CRE Vacancy Rates (*) National CRE Vacancy Rates (*) 2Q2010 YE 2009 YE 2008 YE 2007 YE 2006 YE 2005 2Q 2010 Warehouse 9.5% 10.6% 9.6% 8.9% 8.6% 9.1% 11.4% ** Multifamily 8.8% 9.6% 7.6% 5.2% 5.5% 6.2% 7.8% Retail 8.3% 8.1% 6.3% 7.0% 6.3% 6.6% 10.9% Office 13.8% 12.7% 10.5% 10.5% 11.1% 10.6% 17.4% * REIS ** As of 12/31/09 Commercial Real Estate (CHART) 22 |
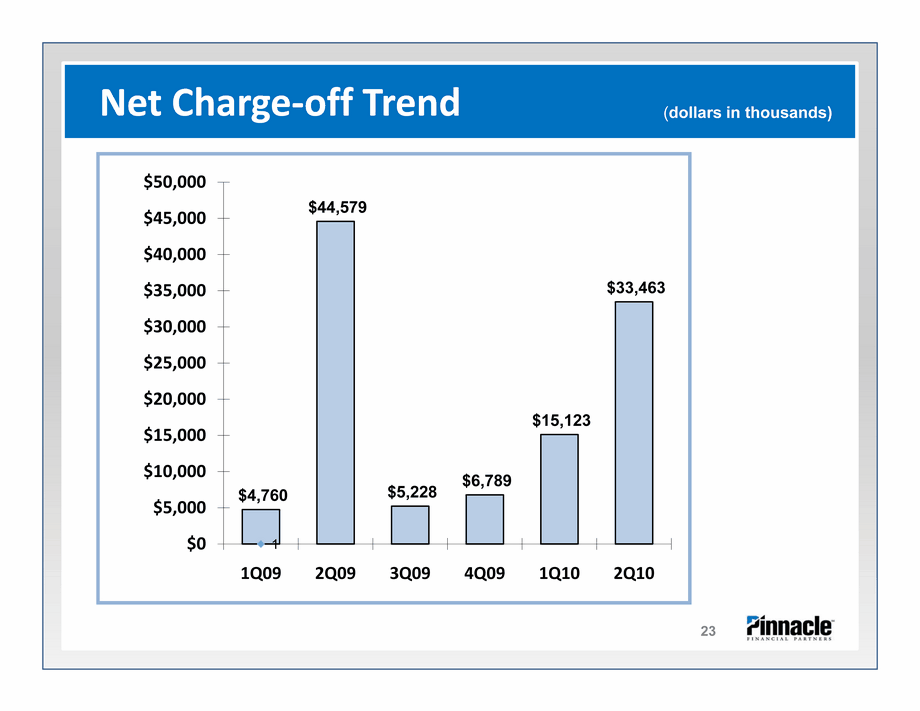
| Net Charge-off Trend Net Charge-off Trend (dollars in thousands) 23 |
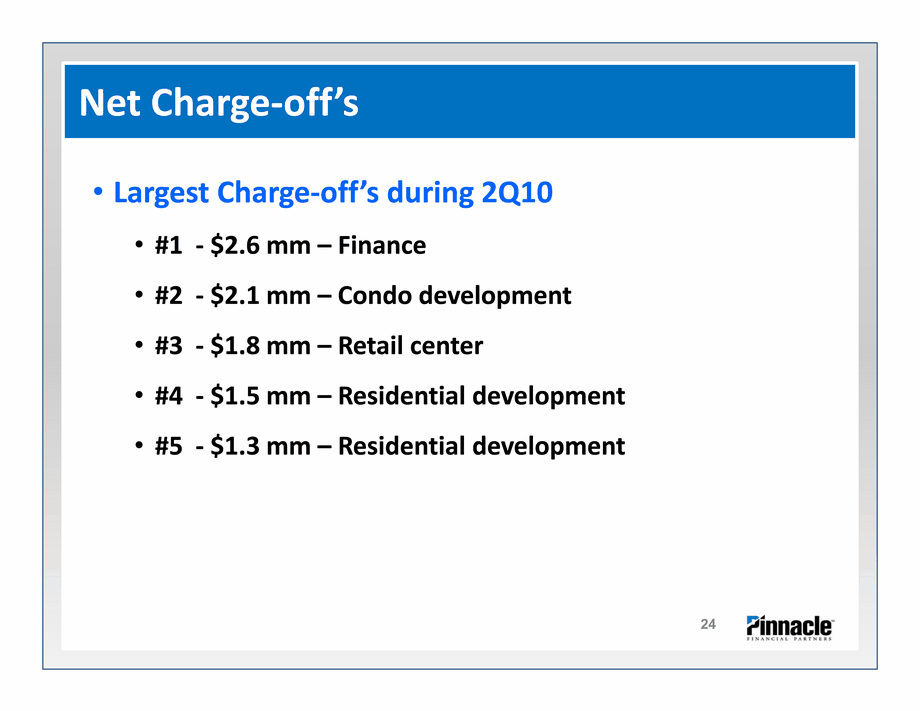
| Largest Charge-off's during 2Q10 #1 - $2.6 mm - Finance #2 - $2.1 mm - Condo development #3 - $1.8 mm - Retail center #4 - $1.5 mm - Residential development #5 - $1.3 mm - Residential development Net Charge-off's 24 |
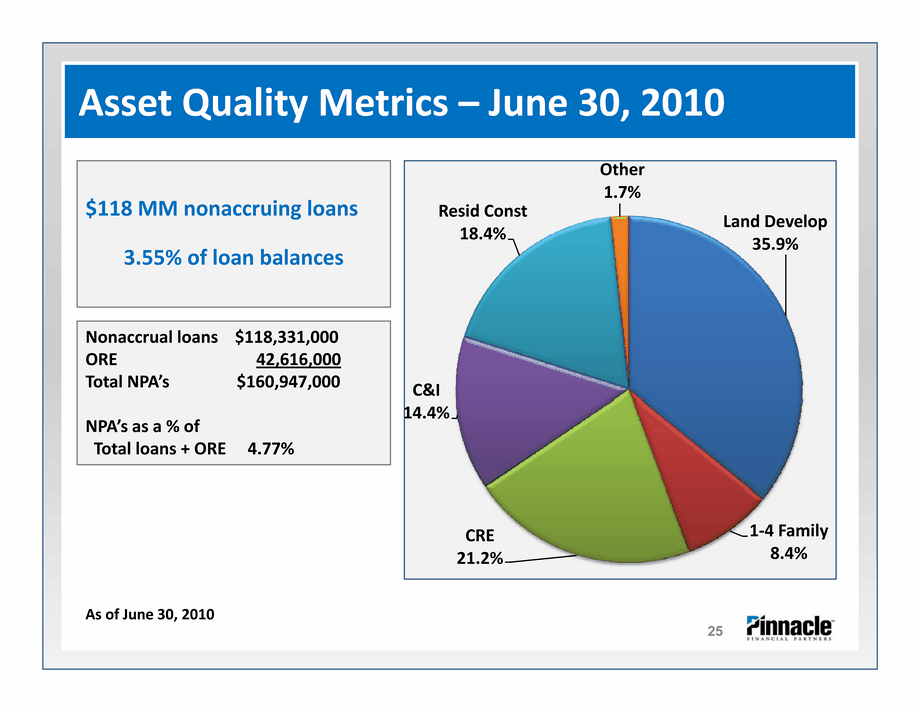
| $118 MM nonaccruing loans 3.55% of loan balances As of June 30, 2010 Nonaccrual loans $118,331,000 ORE 42,616,000 Total NPA's $160,947,000 NPA's as a % of Total loans + ORE 4.77% Asset Quality Metrics - June 30, 2010 (CHART) 25 |
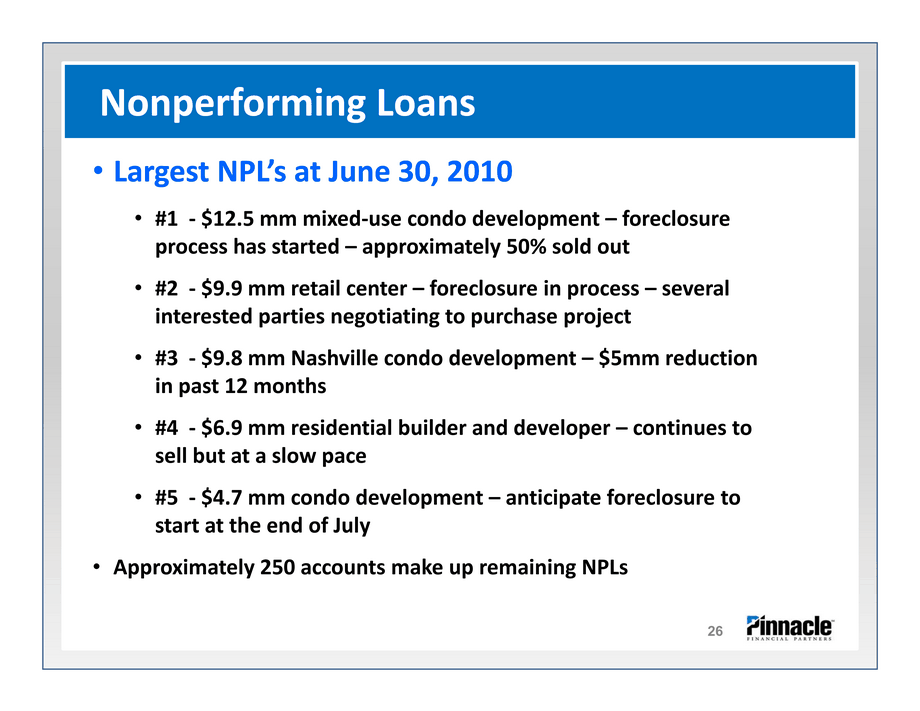
| Largest NPL's at June 30, 2010 #1 - $12.5 mm mixed-use condo development - foreclosure process has started - approximately 50% sold out #2 - $9.9 mm retail center - foreclosure in process - several interested parties negotiating to purchase project #3 - $9.8 mm Nashville condo development - $5mm reduction in past 12 months #4 - $6.9 mm residential builder and developer - continues to sell but at a slow pace #5 - $4.7 mm condo development - anticipate foreclosure to start at the end of July Approximately 250 accounts make up remaining NPLs Nonperforming Loans 26 |
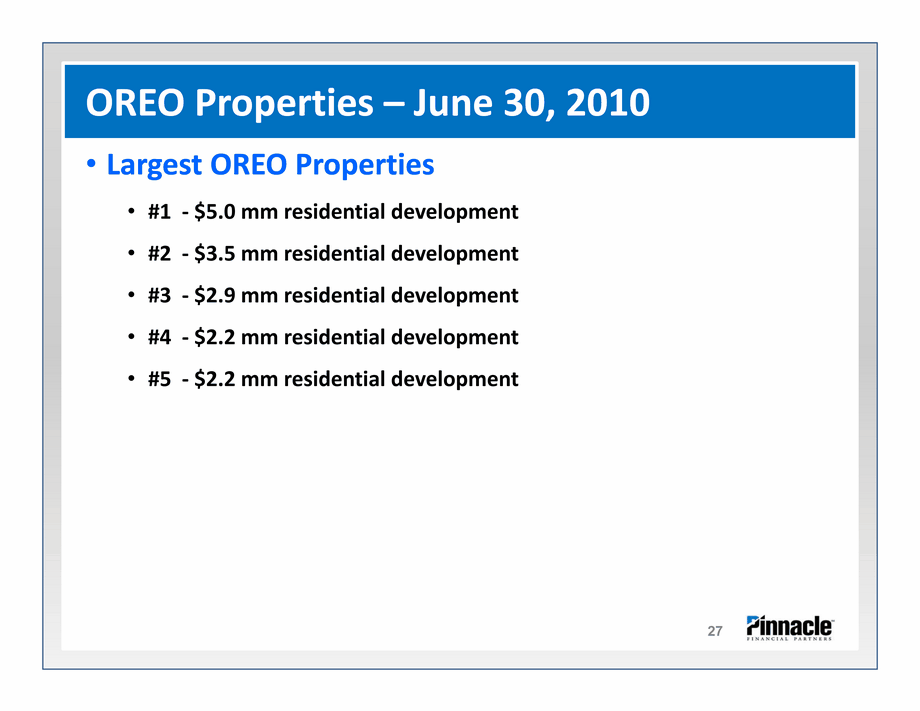
| Largest OREO Properties #1 - $5.0 mm residential development #2 - $3.5 mm residential development #3 - $2.9 mm residential development #4 - $2.2 mm residential development #5 - $2.2 mm residential development OREO Properties - June 30, 2010 27 |
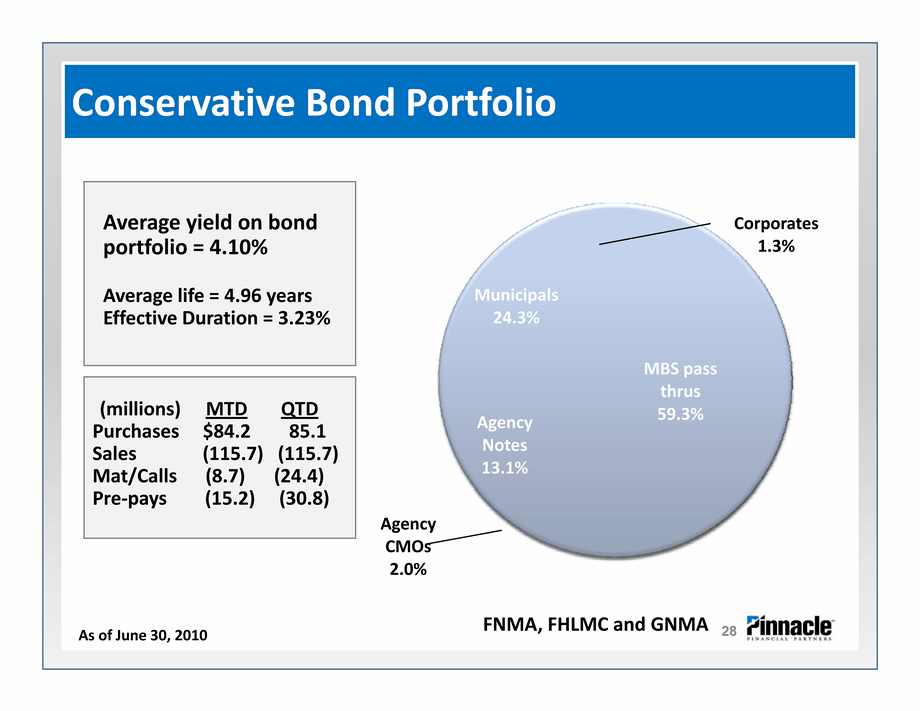
| Conservative Bond Portfolio (CHART) FNMA, FHLMC and GNMA Average yield on bond portfolio = 4.10% Average life = 4.96 years Effective Duration = 3.23% As of June 30, 2010 28 (millions) MTD QTD Purchases $84.2 85.1 Sales (115.7) (115.7) Mat/Calls (8.7) (24.4) Pre-pays (15.2) (30.8) |
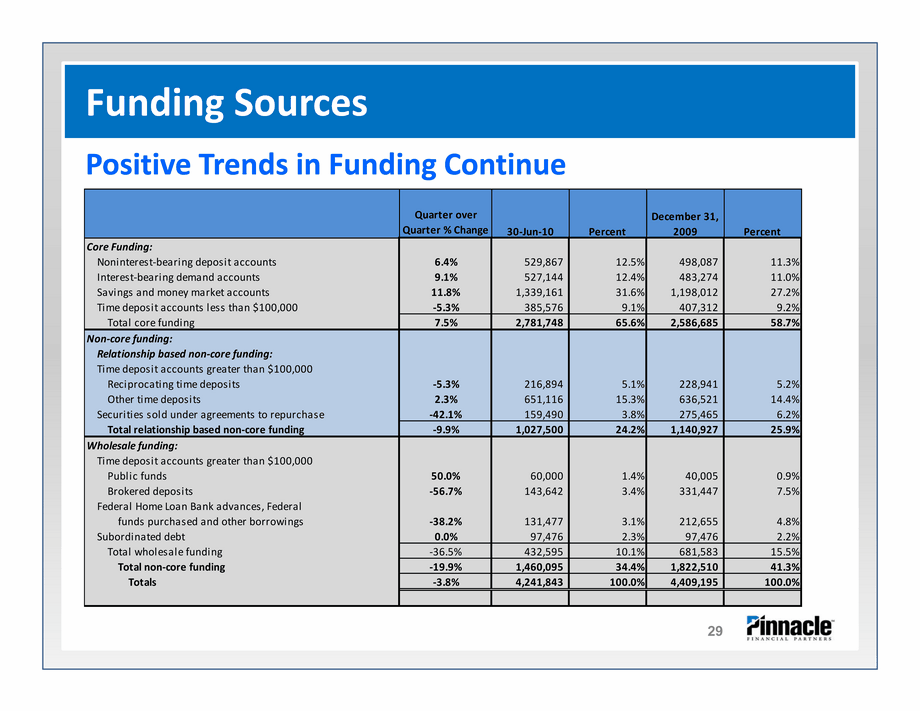
| Positive Trends in Funding Continue Funding Sources 29 |
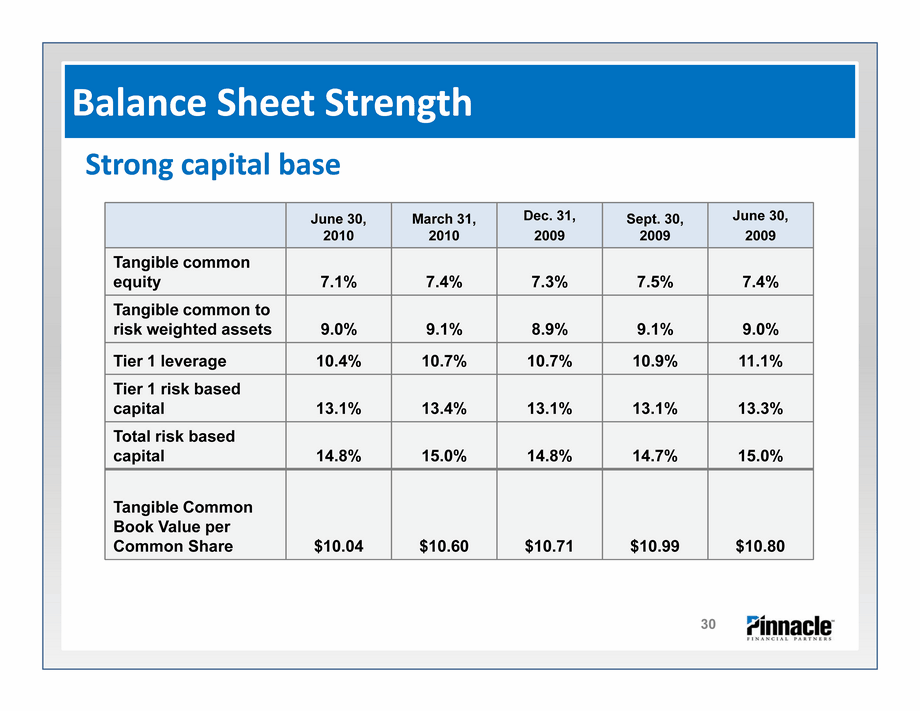
| Strong capital base June 30, 2010 March 31, 2010 Dec. 31, 2009 Sept. 30, 2009 June 30, 2009 Tangible common equity 7.1% 7.4% 7.3% 7.5% 7.4% Tangible common to risk weighted assets 9.0% 9.1% 8.9% 9.1% 9.0% Tier 1 leverage 10.4% 10.7% 10.7% 10.9% 11.1% Tier 1 risk based capital 13.1% 13.4% 13.1% 13.1% 13.3% Total risk based capital 14.8% 15.0% 14.8% 14.7% 15.0% Tangible Common Book Value per Common Share $10.04 $10.60 $10.71 $10.99 $10.80 Balance Sheet Strength 30 |
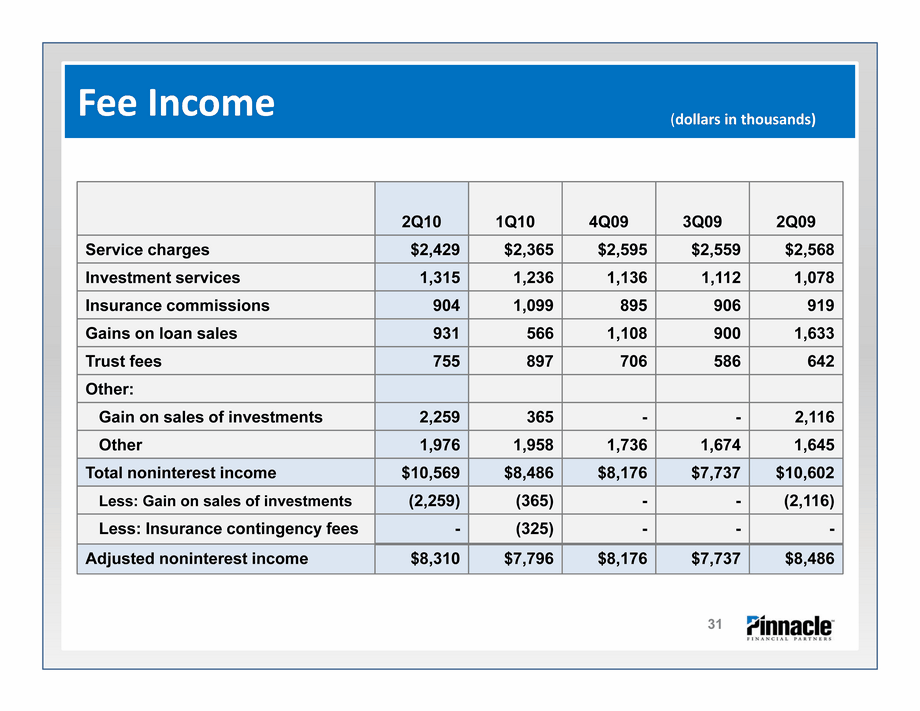
| 2Q10 1Q10 4Q09 3Q09 2Q09 Service charges $2,429 $2,365 $2,595 $2,559 $2,568 Investment services 1,315 1,236 1,136 1,112 1,078 Insurance commissions 904 1,099 895 906 919 Gains on loan sales 931 566 1,108 900 1,633 Trust fees 755 897 706 586 642 Other: Gain on sales of investments 2,259 365 - - 2,116 Other 1,976 1,958 1,736 1,674 1,645 Total noninterest income $10,569 $8,486 $8,176 $7,737 $10,602 Less: Gain on sales of investments (2,259) (365) - - (2,116) Less: Insurance contingency fees - (325) - - - Adjusted noninterest income $8,310 $7,796 $8,176 $7,737 $8,486 Fee Income 31 (dollars in thousands) |
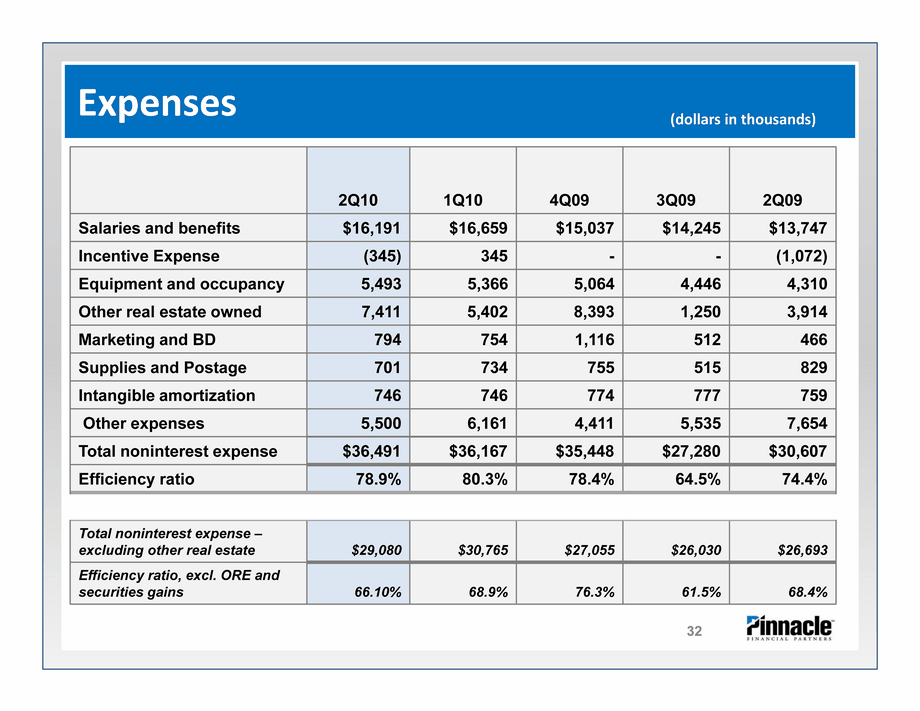
| 2Q10 1Q10 4Q09 3Q09 2Q09 Salaries and benefits $16,191 $16,659 $15,037 $14,245 $13,747 Incentive Expense (345) 345 - - (1,072) Equipment and occupancy 5,493 5,366 5,064 4,446 4,310 Other real estate owned 7,411 5,402 8,393 1,250 3,914 Marketing and BD 794 754 1,116 512 466 Supplies and Postage 701 734 755 515 829 Intangible amortization 746 746 774 777 759 Other expenses 5,500 6,161 4,411 5,535 7,654 Total noninterest expense $36,491 $36,167 $35,448 $27,280 $30,607 Efficiency ratio 78.9% 80.3% 78.4% 64.5% 74.4% Total noninterest expense - excluding other real estate $29,080 $30,765 $27,055 $26,030 $26,693 Efficiency ratio, excl. ORE and securities gains 66.10% 68.9% 76.3% 61.5% 68.4% Expenses 32 (dollars in thousands) |
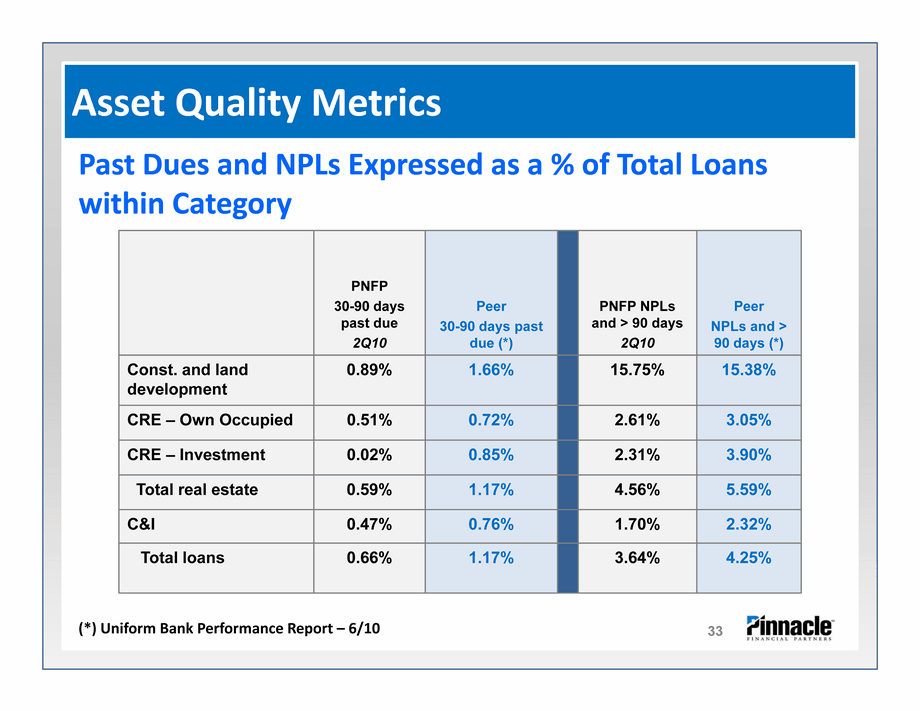
| (*) Uniform Bank Performance Report - 6/10 PNFP 30-90 days past due2Q10 Peer 30-90 days past due (*) PNFP NPLs and > 90 days2Q10 Peer NPLs and > 90 days (*) Const. and land development 0.89% 1.66% 15.75% 15.38% CRE - Own Occupied 0.51% 0.72% 2.61% 3.05% CRE - Investment 0.02% 0.85% 2.31% 3.90% Total real estate 0.59% 1.17% 4.56% 5.59% C&I 0.47% 0.76% 1.70% 2.32% Total loans 0.66% 1.17% 3.64% 4.25% Past Dues and NPLs Expressed as a % of Total Loans within Category Asset Quality Metrics 33 |
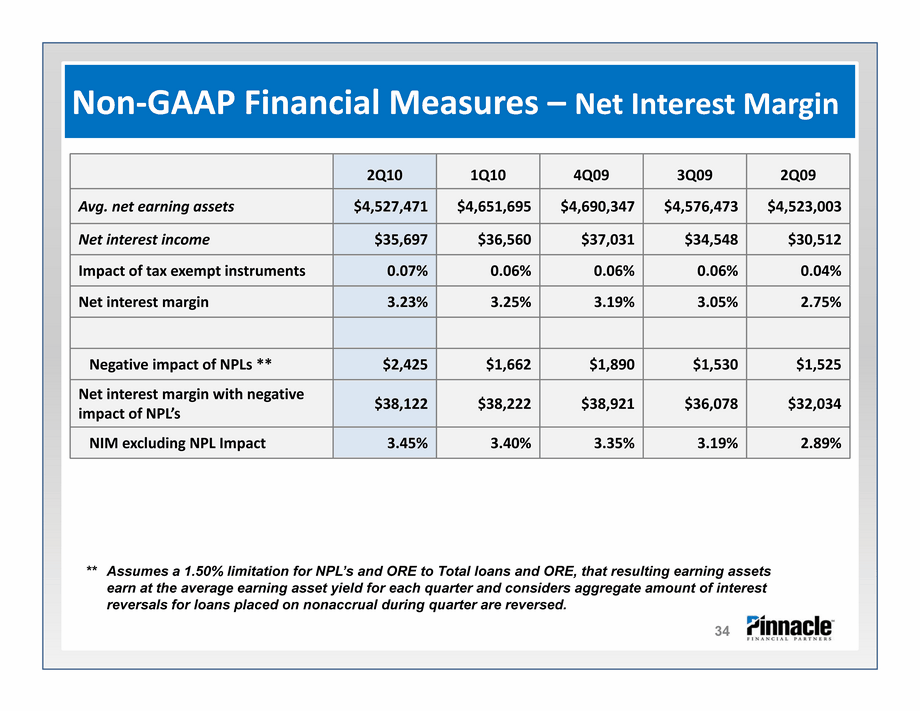
| 2Q10 1Q10 4Q09 3Q09 2Q09 Avg. net earning assets $4,527,471 $4,651,695 $4,690,347 $4,576,473 $4,523,003 Net interest income $35,697 $36,560 $37,031 $34,548 $30,512 Impact of tax exempt instruments 0.07% 0.06% 0.06% 0.06% 0.04% Net interest margin 3.23% 3.25% 3.19% 3.05% 2.75% Negative impact of NPLs ** $2,425 $1,662 $1,890 $1,530 $1,525 Net interest margin with negative impact of NPL's $38,122 $38,222 $38,921 $36,078 $32,034 NIM excluding NPL Impact 3.45% 3.40% 3.35% 3.19% 2.89% Non-GAAP Financial Measures - Net Interest Margin ** Assumes a 1.50% limitation for NPL's and ORE to Total loans and ORE, that resulting earning assets earn at the average earning asset yield for each quarter and considers aggregate amount of interest reversals for loans placed on nonaccrual during quarter are reversed. 34 |
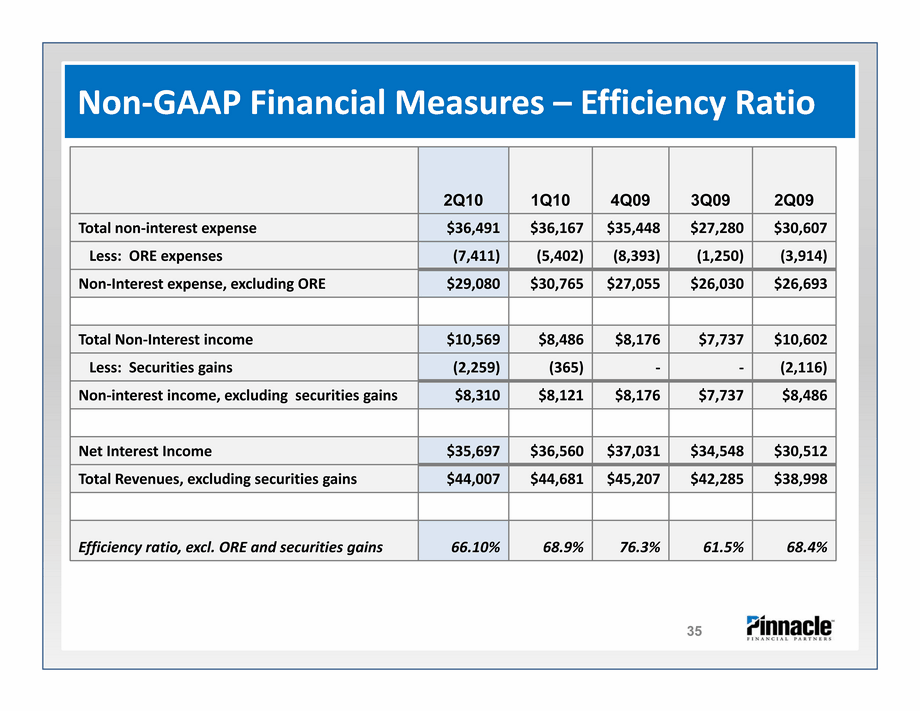
| 2Q10 1Q10 4Q09 3Q09 2Q09 Total non-interest expense $36,491 $36,167 $35,448 $27,280 $30,607 Less: ORE expenses (7,411) (5,402) (8,393) (1,250) (3,914) Non-Interest expense, excluding ORE $29,080 $30,765 $27,055 $26,030 $26,693 Total Non-Interest income $10,569 $8,486 $8,176 $7,737 $10,602 Less: Securities gains (2,259) (365) - - (2,116) Non-interest income, excluding securities gains $8,310 $8,121 $8,176 $7,737 $8,486 Net Interest Income $35,697 $36,560 $37,031 $34,548 $30,512 Total Revenues, excluding securities gains $44,007 $44,681 $45,207 $42,285 $38,998 Efficiency ratio, excl. ORE and securities gains 66.10% 68.9% 76.3% 61.5% 68.4% Non-GAAP Financial Measures - Efficiency Ratio 35 |
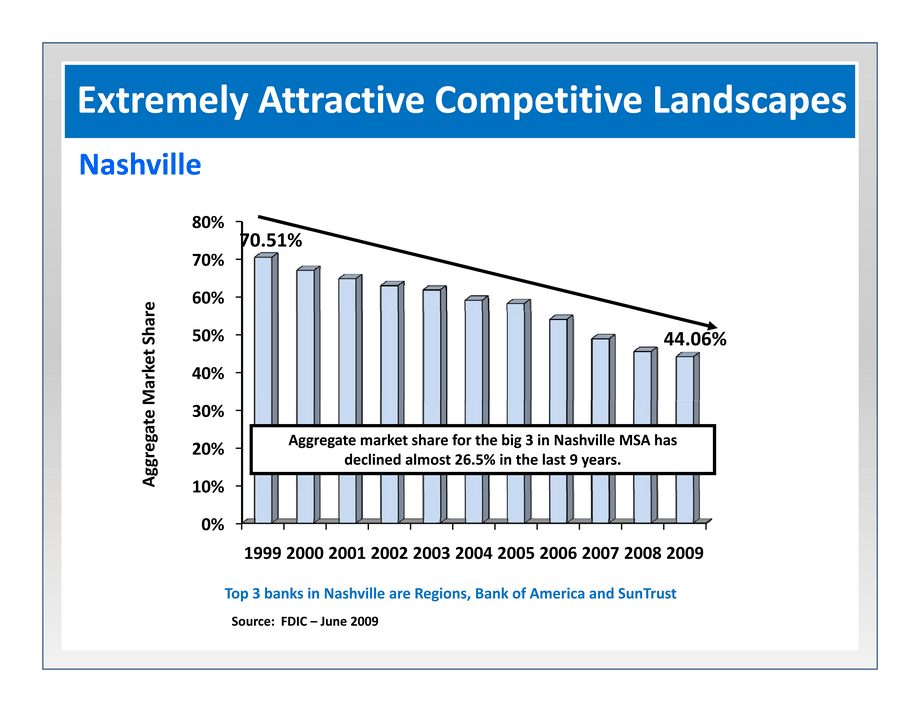
| Source: FDIC - June 2009 Source: FDIC - June 2009 Extremely Attractive Competitive Landscapes Nashville Top 3 banks in Nashville are Regions, Bank of America and SunTrust Aggregate Market Share Aggregate market share for the big 3 in Nashville MSA has declined almost 26.5% in the last 9 years. |
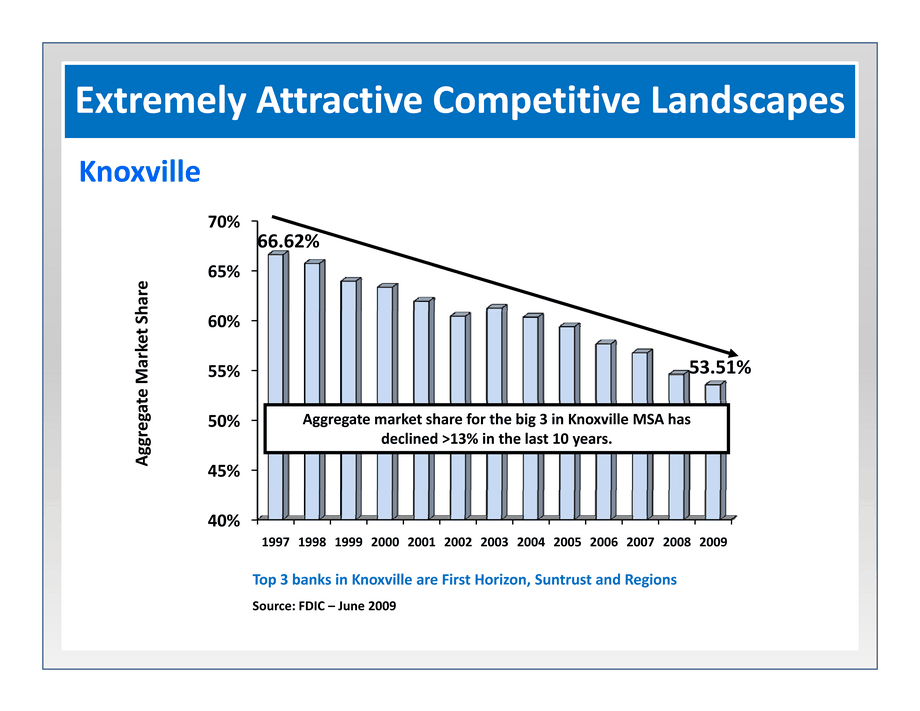
| Aggregate Market Share Source: FDIC - June 2009 Top 3 banks in Knoxville are First Horizon, Suntrust and Regions Aggregate market share for the big 3 in Knoxville MSA has declined >13% in the last 10 years. Extremely Attractive Competitive Landscapes Knoxville |
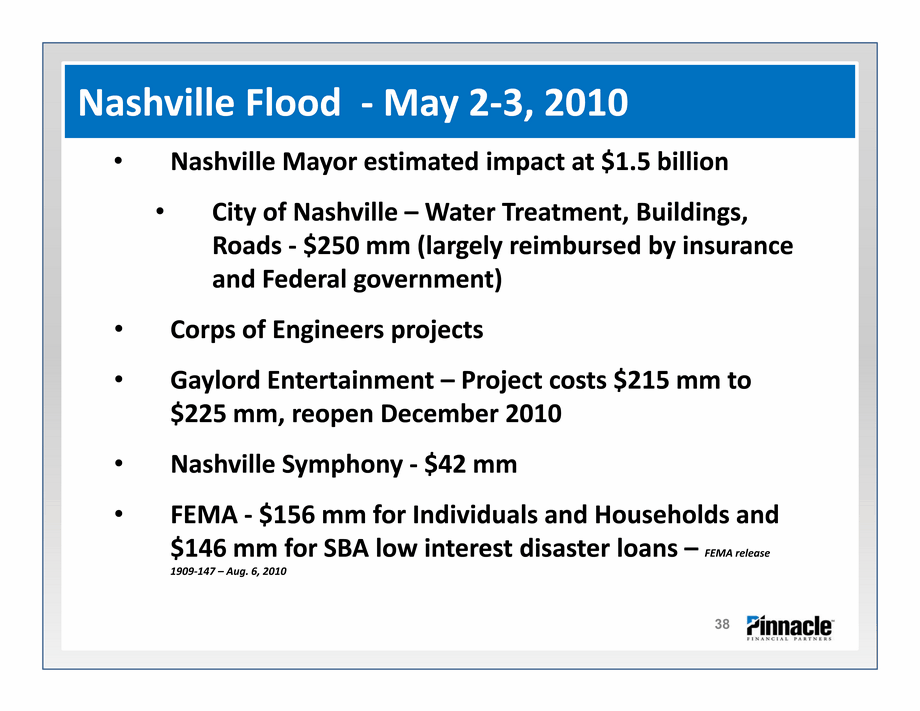
| Nashville Flood - May 2-3, 2010 38 Nashville Mayor estimated impact at $1.5 billion City of Nashville - Water Treatment, Buildings, Roads - $250 mm (largely reimbursed by insurance and Federal government) Corps of Engineers projects Gaylord Entertainment - Project costs $215 mm to $225 mm, reopen December 2010 Nashville Symphony - $42 mm FEMA - $156 mm for Individuals and Households and $146 mm for SBA low interest disaster loans - FEMA release 1909-147 - Aug. 6, 2010 |
