Attached files
| file | filename |
|---|---|
| 8-K - FORM 8-K - DTE Electric Co | c05470e8vk.htm |
Exhibit 99.1

| Business and Financial Update August 27 - September 1, 2010 |

| Safe Harbor Statement The information contained herein is as of the date of this presentation. Many factors may impact forward-looking statements including, but not limited to, the following: economic conditions resulting in changes in demand, customer conservation and increased thefts of electricity and gas; changes in the economic and financial viability of our customers, suppliers, and trading counterparties, and the continued ability of such parties to perform their obligations to the Company; economic climate and population growth or decline in the geographic areas where we do business; high levels of uncollectible accounts receivable; access to capital markets and capital market conditions and the results of other financing efforts which can be affected by credit agency ratings; instability in capital markets which could impact availability of short and long-term financing; the timing and extent of changes in interest rates; the level of borrowings; the potential for losses on investments, including nuclear decommissioning and benefit plan assets and the related increases in future expense and contributions; the potential for increased costs or delays in completion of significant construction projects; the effects of weather and other natural phenomena on operations and sales to customers, and purchases from suppliers; environmental issues, laws, regulations, and the increasing costs of remediation and compliance, including actual and potential new federal and state requirements that include or could include carbon and more stringent mercury emission controls, a renewable portfolio standard, energy efficiency mandates, a carbon tax or cap and trade structure and ash landfill regulations; nuclear regulations and operations associated with nuclear facilities; impact of electric and gas utility restructuring in Michigan, including legislative amendments and Customer Choice programs; employee relations and the impact of collective bargaining agreements; unplanned outages; changes in the cost and availability of coal and other raw materials, purchased power and natural gas; volatility in the short-term natural gas storage markets impacting third-party storage revenues; cost reduction efforts and the maximization of plant and distribution system performance; the effects of competition; the uncertainties of successful exploration of gas shale resources and challenges in estimating gas reserves with certainty; impact of regulation by the FERC, MPSC, NRC and other applicable governmental proceedings and regulations, including any associated impact on rate structures; changes in and application of federal, state and local tax laws and their interpretations, including the Internal Revenue Code, regulations, rulings, court proceedings and audits; the amount and timing of cost recovery allowed as a result of regulatory proceedings, related appeals or new legislation; the cost of protecting assets against, or damage due to, terrorism or cyber attacks; the availability, cost, coverage and terms of insurance and stability of insurance providers; changes in and application of accounting standards and financial reporting regulations; changes in federal or state laws and their interpretation with respect to regulation, energy policy and other business issues; and binding arbitration, litigation and related appeals. New factors emerge from time to time. We cannot predict what factors may arise or how such factors may cause our results to differ materially from those contained in any forward-looking statement. Any forward-looking statements refer only as of the date on which such statements are made. We undertake no obligation to update any forward- looking statement to reflect events or circumstances after the date on which such statement is made or to reflect the occurrence of unanticipated events. This presentation should also be read in conjunction with the "Forward-Looking Statements" section in each of DTE Energy's and Detroit Edison's 2009 Forms 10-K and 2010 Forms 10-Q (which sections are incorporated herein by reference), and in conjunction with other SEC reports filed by DTE Energy and Detroit Edison. Cautionary Note - The Securities and Exchange Commission permits oil and gas companies, in their filings with the SEC, to disclose only proved reserves that a company has demonstrated by actual production or conclusive formation tests to be economically and legally producible under existing economic and operating conditions. We use certain terms in this presentation such as "probable reserves" that the SEC's guidelines strictly prohibit us from including in filings with the SEC. You are urged to consider closely the disclosure in DTE Energy's 2009 Form 10-K and 2010 Forms 10-Q, File No. 1-11607, available from our offices or from our website at www.dteenergy.com. You can also obtain these Forms from the SEC by calling 1-800-SEC-0330. 2 |

| 3 Overview 2010 Priorities Growth Opportunities |

| Gas Storage and Pipelines Power & Industrial Projects Unconventional Gas Production Detroit Edison MichCon DTE Energy is an Integrated Energy Company Complementary Non-Utility Businesses Strong, Stable and Growing Utilities Electric generation and distribution 2.1 million customers Fully regulated by Michigan Public Service Commission (MPSC) Natural gas distribution 1.2 million customers Fully regulated by MPSC Energy Trading ~75% of DTE Energy's 2009 Earnings ~25% of DTE Energy's 2009 Earnings 4 |
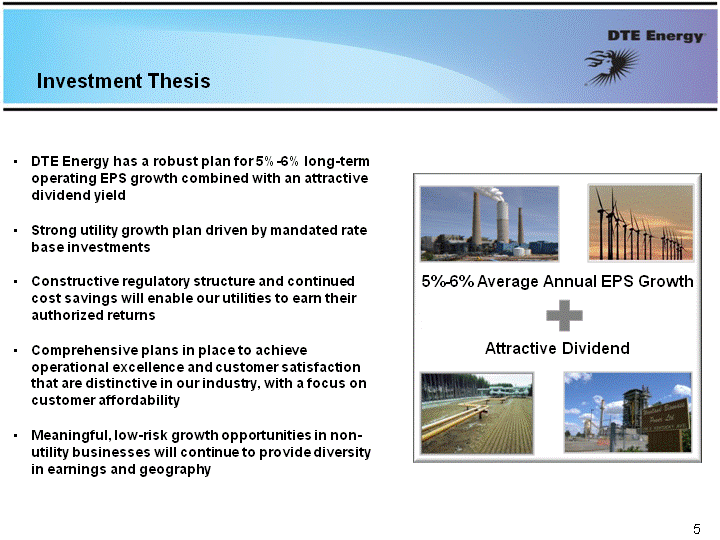
| Investment Thesis DTE Energy has a robust plan for 5%-6% long-term operating EPS growth combined with an attractive dividend yield Strong utility growth plan driven by mandated rate base investments Constructive regulatory structure and continued cost savings will enable our utilities to earn their authorized returns Comprehensive plans in place to achieve operational excellence and customer satisfaction that are distinctive in our industry, with a focus on customer affordability Meaningful, low-risk growth opportunities in non- utility businesses will continue to provide diversity in earnings and geography 5%-6% Average Annual EPS Growth Attractive Dividend 5 |

| 6 Overview 2010 Priorities Growth Opportunities |
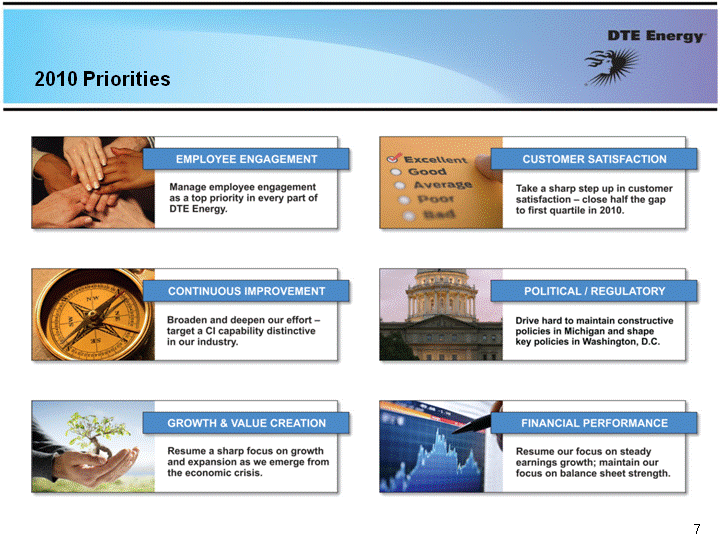
| 2010 Priorities 7 |

| Priorities are Key to DTE's Continued Success We have a constructive regulatory environment Critical that we "do our part" to maintain our solid regulatory structure Two key areas we must focus on are continuous improvement (CI) and customer satisfaction We have demonstrated ability to drive down costs Bringing same focus and intensity to customer satisfaction Employee engagement helps drive continuous improvement & improved customer satisfaction 8 |

| Priority: Political / Regulatory Build Upon Constructive Relationships in 2010 Received constructive order in MichCon rate case June 2010 11% allowed ROE Revenue decoupling MichCon filed for a $51 million rate increase July 2010 Continue to evaluate timing and need for next Detroit Edison rate filing Continue to Build Constructive Relationships to Maintain our Solid Regulatory Environment and Ensure the Financial Health of our Utilities 9 File & Use Rates 6 month self- implementation Forward-looking test year Renewable Portfolio Standard (RPS)/Energy Optimization (EO) with prefunding Certificate of Need for large capital projects 11% allowed ROE Revenue decoupling Removes disincentive for Energy Optimization Addresses uncertain demand Approved in Detroit Edison rate case Uncollectible tracker at Detroit Edison Comparable to MichCon 80/20 split 2008 Legislation 2009 Detroit Edison Rate Case 2010 Regulatory Actions |
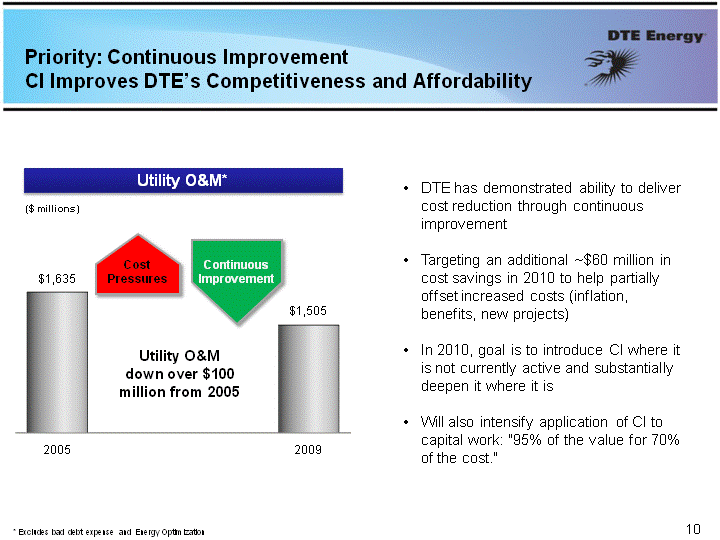
| Priority: Continuous Improvement CI Improves DTE's Competitiveness and Affordability 10 10 * Excludes bad debt expense and Energy Optimization Utility O&M* ($ millions) Cost Pressures Continuous Improvement Utility O&M down over $100 million from 2005 DTE has demonstrated ability to deliver cost reduction through continuous improvement Targeting an additional ~$60 million in cost savings in 2010 to help partially offset increased costs (inflation, benefits, new projects) In 2010, goal is to introduce CI where it is not currently active and substantially deepen it where it is Will also intensify application of CI to capital work: "95% of the value for 70% of the cost." |

| 11 Priority: Customer Satisfaction Customer Satisfaction is a Key Enabler of Growth Call ~400k customers to solicit feedback on field service quality Close ~600k inbound calls by asking customer if fully satisfied Use the ~1 million calls to identify defects, drive CI efforts Call Center Field Operations Communications Much increased focus on communication Highly targeted messages by segment Special focus on low-income customers Intense focus on improving quality, reliability of service Meeting service windows/commitments Reduced outage frequency/duration Addressing high outage "pockets" CI focused on O&M/capital efficiency |

| * Reconciliation to GAAP reported earnings included in the appendix Priority: Financial Performance Achieve Solid Earnings Growth (CHART) $2.89 Operating Earnings Per Share* ($ millions) $3.30 $3.45 - $3.80 2008A 2009A 2010 Guidance 12 Overall, YTD results are tracking to plan Expect 10% operating EPS growth in 2010; 12% annualized growth from 2008 to 2010 Targeted long-term growth rate of 5%-6% |

| 13 2010 Operating Earnings* Guidance (millions, except EPS) 2010 Guidance * Reconciliation to GAAP reported earnings included in the appendix YTD June 2010 Actual ? ? ? ? Overall, YTD results are tracking to plan Utility results remain on target to meet full year guidance Expect Power & Industrial earnings to come in higher than current guidance range, driven by new projects and industrial rebound Energy Trading earnings will likely be below current guidance range Favorable taxes at Corporate & Other Continue to expect 10% operating EPS growth in 2010; higher than targeted long-term 5%-6% rate |
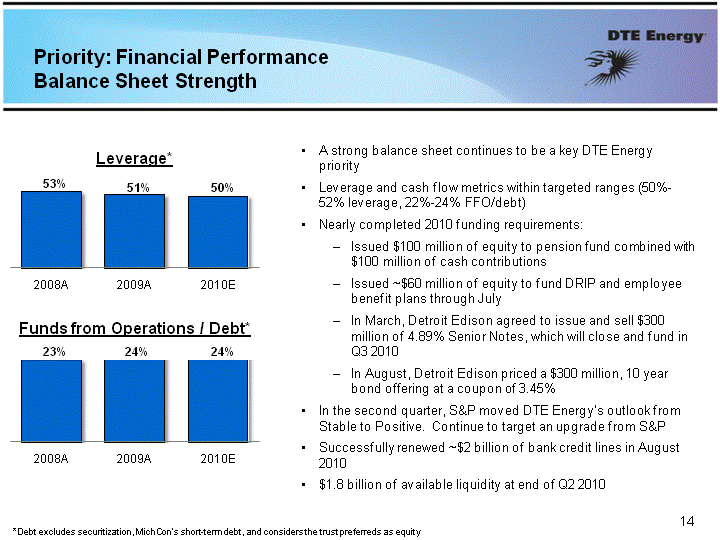
| 14 Leverage* Funds from Operations / Debt* (CHART) 53% 51% 50% (CHART) 23% 24% 24% *Debt excludes securitization, MichCon's short-term debt, and considers the trust preferreds as equity Priority: Financial Performance Balance Sheet Strength A strong balance sheet continues to be a key DTE Energy priority Leverage and cash flow metrics within targeted ranges (50%- 52% leverage, 22%-24% FFO/debt) Nearly completed 2010 funding requirements: Issued $100 million of equity to pension fund combined with $100 million of cash contributions Issued ~$60 million of equity to fund DRIP and employee benefit plans through July In March, Detroit Edison agreed to issue and sell $300 million of 4.89% Senior Notes, which will close and fund in Q3 2010 In August, Detroit Edison priced a $300 million, 10 year bond offering at a coupon of 3.45% In the second quarter, S&P moved DTE Energy's outlook from Stable to Positive. Continue to target an upgrade from S&P Successfully renewed ~$2 billion of bank credit lines in August 2010 $1.8 billion of available liquidity at end of Q2 2010 |

| Our Dividend is Well Supported 15 Recently increased annualized dividend from $2.12 per share to $2.24 per share; 5.7% increase Dividend yield currently in-line with utility peers Our annualized payout ratio based on the midpoint of 2010 guidance is now 62%, in-line with 60%-70% target Our dividend remains well supported Dividend Yield (as of August 2010) (CHART) 4.8% |

| Priority: 2010 Growth & Value Creation Successfully execute our first major investments in Detroit Edison renewable assets Tightly execute investments on environmental controls at our Monroe Power Plant Invest to exceed our Energy Efficiency targets Execute non-utility investments focused on premium returns and shareholder value creation 2010 Goals 16 (CHART) Capital Investment ($ billions) $0.7 $0.6 $0.6 - $0.9 $0.4 - $0.5 $3.0 - $3.4 $2.6 $3.9 $4.0 - $4.8 Scale/nature of investments supports 5-6% annual operating EPS growth rate Capital Investment Summary Utility growth over the next three years driven by mandated environmental and renewable investment Non-Utility investments focus on projects that generate premium returns and create long- term shareholder value |

| 17 Overview 2010 Priorities Growth Opportunities |

| 18 Detroit Edison Investment Profile Environmental Energy Efficiency Base Infrastructure Significant investment to meet environmental requirements $500 - $600 million investment 2010-2012 Investments to meet mandated targets and improve customer affordability $100 million investment 2010-2012 Infrastructure investments to ensure the reliability of our generation fleet and distribution systems $2.1 - $2.3 billion investment 2010-2012 Renewable Energy New generation to meet Renewable Portfolio Standard (RPS) $300 - $400 million investment 2010-2012 |

| Gas Storage and Pipelines Growth 19 Michigan's access to the North American pipeline infrastructure enhances the market reach and value of storage providing future growth opportunities Changes in gas flows increase demand and provide for future expansions of Vector and Millennium Pipelines Millennium Pipeline is well positioned to capitalize on boom in Marcellus Shale production Pipeline Growth Storage Growth |

| EES Coke Battery Industrial Utility services at industrial sites Fuel supply and transportation for industrial customers 35 projects Detroit, Michigan Own and operate wood-fired power plants and landfill gas projects 21 landfill gas sites 4 waste wood power plants Woodland Biomass Renewables Woodland, California Industrial sector demand - especially steel - strengthening Stronger coke demand results in 2010 operating earnings* guidance of $65 - $75 million Operating earnings guidance up sharply versus 2009 actual ($35 million) and 2010 early outlook ($40 - $50 million) Most significant growth coming from coal-to-wood conversions to meet state Renewable Portfolio requirements Wisconsin plant retrofit nearing completion (operational in 2010) Construction to start on California plant in 2010 (operational in 2013) Opportunities for similar facilities are being considered 20 * Reconciliation to GAAP reported earnings included in the appendix Power & Industrial Projects Growth |

| Unconventional Gas Overview Near-term capital spend of $25 million / year Drill 10-15 wells and produce 5 Bcfe net in 2010 Develop existing properties to create maximum value Monetize properties at right time in development cycle and in favorable commodity markets Provides cash for asset investments elsewhere at DTE Energy (CHART) Gross Producing Wells 169 Reserves (Bcfe) YE2008 156 (CHART) YE2009 YE2008 Probable Proved 265 167 432 255 234 489 Barnett Shale Operating Metrics Future YE2009 21 Plan to Continue Development and Monetization of Unconventional Gas Assets for Premium Returns |

| Summary 22 On track to achieve solid 2010 financial results Constructive regulatory structure and continued focus on operational excellence and customer satisfaction enables meaningful growth at utilities Continue to see attractive/premium return non-utility investment opportunities Executing robust plan to achieve 5% - 6% long-term operating EPS growth |

| Contact Us DTE Energy Investor Relations www.dteenergy.com/investors 313-235-8030 23 |

| Appendix |

| Michigan Governor's Race 25 Latest Polling* Overview Democratic Nominee Virg Bernero Republican Nominee Rick Snyder 49% 37% Venture Capitalist, former President and COO of Gateway Emerged victorious from a 5-way primary campaign with 36% of the vote Courted independent and disaffected Democratic voters during the primary campaign Mayor of Lansing, former State Representative and Senator Successful campaign largely financed by union funds Sounded populist themes during primary campaign * Rasmussen Reports, 500 likely voters, 8/4/2010 |

| (CHART) DTE Gas Storage & Pipelines 2003 - 2009 CAGR: 28% Gas Storage and Pipelines Operating Earnings* ($ millions) 26 History of Strong Growth Significant Investment Opportunities Potential to invest $50-$100 million over the next 5 years in low-risk projects Potential incremental earnings of $5 to $10 million by 2015 Potential to invest $200-$300 million over the next 5 years in strong growth projects Potential incremental earnings of $15 to $20 million by 2015 $49 $50-$55 * Reconciliation to GAAP reported earnings included in the appendix DTE Gas Storage Business DTE Pipeline Business |

| DTE's Gas Asset Portfolio Is Well Positioned to Take Advantage of Attractive Market Dynamics 27 Fully contracted (7.5 year avg. duration) 90 Bcf of storage capacity in Michigan 26,200 H.P. of reciprocal compression DTE owns 26.25% Over 80% contracted (15 year avg. duration) 222 miles of pipe; 15,000 H.P. of compression DTE owns 40% Fully contracted (7 year avg. duration) 348 miles of pipe; 120,000 H.P. of compression at five stations Vector Pipeline Millennium Pipeline DTE Gas Storage |

| Millennium Well Positioned To Serve Marcellus Production Millennium 28 NE Marcellus core region Thickness of shale in feet Blue 0 - 75 Green 75 - 150 Yellow 150 - 175 Orange 175 - 225 Pink 225 + ** Source: CERA Millennium located near northern core in highly prolific part of formation Current drilling primarily in northeast Pennsylvania (Tioga, Bradford & Susquehanna counties) Future production in northeast Pennsylvania expected to increase From 0.2 Bcf/d in 2009 to 2.9 - 3.7 Bcf/d by 2020** |

| (CHART) Energy Trading Variance Analysis * Reconciliation to GAAP reported earnings included in the appendix ($ millions) Drivers YTD Energy Trading Operating Earnings* Variance YTD June 2009 Operating Earnings Economic Performance Timing One-time 2009 Tax Benefit YTD June 2010 Operating Earnings 29 Decrease in earnings driven mainly by timing, which represents transactions where the accounting income is recognized in future periods Results impacted by increasing gas prices and negative performance from transmission portfolio in Q2 2010, in addition to a one time tax benefit taken in 2009 |

| (CHART) DTE Energy Trading Reconciliation of Operating Earnings* to Economic Net Income ** Consists of the income statement effect of not recognizing changes in the fair market value of certain non-derivative contracts including physical inventory and capacity contracts for transportation, transmission and storage. These contracts are not marked-to-market, instead are recognized for accounting purposes on an accrual basis. ($ millions) YTD June 2010 Economic Net Income Accounting Adjustments** YTD June 2010 Operating Earnings* $12 $19 $31 Economic net income equals economic gross margin*** minus O&M expenses and taxes. DTE Energy management uses economic net income as one of the performance measures for external communications with analysts and investors. Internally, DTE Energy uses economic net income as one of the measures to review performance against financial targets and budget. * Reconciliation to GAAP reported earnings included in the appendix *** Economic gross margin is the change in net fair value of realized and unrealized purchase and sale contracts including certain non-derivative contract costs Energy Trading Operating Earnings* Realized Unrealized O&M / Other YTD June 2009 YTD June 2010 $27 $21 19 60 (20) (28) ($ millions, after-tax) $67 $12 (CHART) $67 ($13) $54 YTD June 2009 Operating Earnings* YTD June 2009 Economic Net Income Accounting Adjustments** 30 |

| 31 2010 Capital Expenditures & Cash Flow Guidance Capital Expenditures ($ millions) Cash Flow Summary ($ billions) Equity issued for employee benefit programs is considered non-cash and not included in financing activities: (2009 Actual $0.1; 2010 Guidance $0.2) |

| 32 Use of Operating Earnings Information - DTE Energy management believes that operating earnings provide a more meaningful representation of the company's earnings from ongoing operations and uses operating earnings as the primary performance measurement for external communications with analysts and investors. Internally, DTE Energy uses operating earnings to measure performance against budget and to report to the Board of Directors. Reconciliation of YTD June 30, 2010 Reported to Operating Earnings * Deferral of previously expensed cost to achieve as allowed for in June 3, 2010 MPSC order (case - U-15985) |

| Reconciliation of 2009 Reported to Operating Earnings Use of Operating Earnings Information - DTE Energy management believes that operating earnings provide a more meaningful representation of the company's earnings from ongoing operations and uses operating earnings as the primary performance measurement for external communications with analysts and investors. Internally, DTE Energy uses operating earnings to measure performance against budget and to report to the Board of Directors. 33 |

| Reconciliation of 2008 Reported to Operating Earnings Use of Operating Earnings Information - DTE Energy management believes that operating earnings provide a more meaningful representation of the company's earnings from ongoing operations and uses operating earnings as the primary performance measurement for external communications with analysts and investors. Internally, DTE Energy uses operating earnings to measure performance against budget and to report to the Board of Directors. 34 |
| Reconciliation of Other Reported to Operating Earnings Use of Operating Earnings Information - DTE Energy management believes that operating earnings provide a more meaningful representation of the company's earnings from ongoing operations and uses operating earnings as the primary performance measurement for external communications with analysts and investors. Internally, DTE Energy uses operating earnings to measure performance against budget and to report to the Board of Directors. In this presentation, DTE Energy provides 2010 guidance for operating earnings. It is likely that certain items that impact the company's 2010 reported results will be excluded from operating results. A reconciliation to the comparable 2010 reported earnings/net income guidance is not provided because it is not possible to provide a reliable forecast of specific line items. These items may fluctuate significantly from period to period and may have a significant impact on reported earnings. Gas Storage and Pipelines Operating earnings were equivalent to reported earnings for Gas Storage and Pipelines for each of 2003 to 2009. Energy Trading Operating earnings were equivalent to reported earnings for Energy Trading for each of YTD June 2009 and YTD June 2010. 35 |
