Attached files
| file | filename |
|---|---|
| EX-23 - CONSENT OF INDEPENDENT REGISTERED PUBLIC ACCOUNTING FIRM - FLEXSTEEL INDUSTRIES INC | flexsteel104151_ex23.htm |
| EX-32 - CERTIFICATION OF CEO/CFO PURSUANT TO SECTION 906 - FLEXSTEEL INDUSTRIES INC | flexsteel104151_ex32.htm |
| EX-31.2 - CERTIFICATION OF CFO PURSUANT TO SECTION 302 - FLEXSTEEL INDUSTRIES INC | flexsteel104151_ex31-2.htm |
| EX-31.1 - CERTIFICAITON OF CEO PURSUANT TO SECTION 302 - FLEXSTEEL INDUSTRIES INC | flexsteel104151_ex31-1.htm |
| EX-21.1 - SUBSIDIARIES OF THE COMPANY - FLEXSTEEL INDUSTRIES INC | flexsteel104151_ex21-1.htm |
UNITED STATES
SECURITIES AND EXCHANGE COMMISSION
Washington, D.C. 20549
Form 10-K
x Annual Report Pursuant to Section 13 or 15(d) of the Securities Exchange Act of 1934
For the fiscal year ended June 30, 2010
or
o Transition Report Pursuant to Section 13 or 15(d) of the Securities Exchange Act of 1934
For the transition period from to
Commission file number 0-5151
_______________________________________________
FLEXSTEEL INDUSTRIES, INC.
(Exact name of registrant as specified in its charter)
|
Minnesota |
42-0442319 |
|
(State or other jurisdiction of incorporation or organization) |
(I.R.S. Employer Identification No.) |
|
3400 Jackson Street, Dubuque, Iowa |
52004-0877 |
|
(Address of principal executive offices) |
(Zip Code) |
|
Registrant’s telephone number, including area code: |
(563) 556-7730 |
_______________________________________________
Securities registered pursuant to Section 12(b) of the Act:
|
Title of each class |
Name of each exchange on which registered |
|
Common Stock, $1.00 Par Value |
The NASDAQ Stock Market LLC |
Securities registered pursuant to Section 12(g) of the Act:
None
(Title of Class)
Indicate by check mark whether the registrant is a well-known seasoned issuer, as defined in Rule 405 of the Securities Act.
Yes o No x
Indicate by check mark if the registrant is not required to file reports pursuant to Section 13 or Section 15(d) of the Act.
Yes o No x
Indicate by check mark whether the registrant (1) has filed all reports required to be filed by Section 13 or 15(d) of the Securities Exchange Act of 1934 during the preceding 12 months (or for such shorter period that the registrant was required to file such reports), and (2) has been subject to such filing requirements for the past 90 days. Yes x No o
Indicate by check mark whether the registrant has submitted electronically and posted on its corporate Website, if any, every Interactive Data File required to be submitted and posted pursuant to Rule 405 of Regulation S-T during the preceding 12 months (or for such shorter period that the registrant was required to submit and post such files). Yes o No o
Indicate by check mark if disclosure of delinquent filers pursuant to Item 405 of Regulation S-K is not contained herein, and will not be contained, to the best of registrant’s knowledge, in definitive proxy or information statements incorporated by reference in Part III of this Form 10-K or any amendment to this Form 10-K. o
Indicate by check mark whether the Registrant is a large accelerated filer, an accelerated filer, a non-accelerated filer, or a smaller reporting company. See definitions of “large accelerated filer”, “accelerated filer” and “smaller reporting company” in Rule 12b-2 of the Exchange Act (check one).
Large accelerated filer o Accelerated filer o Non-accelerated filer o Smaller reporting company x
Indicate by check mark whether the registrant is a shell company (as defined in Rule 12b-2 of the Act). Yes o No x
The aggregate market value of the voting stock held by non-affiliates, computed by reference to the last sales price on December 31, 2009 (which was the last business day of the registrant’s most recently completed second quarter) was $42,346,870.
Indicate the number of shares outstanding of each of the registrant’s classes of Common Stock, as of the latest practicable date. 6,645,532 Common Shares ($1 par value) as of August 18, 2010.
DOCUMENTS INCORPORATED BY REFERENCE
In Part III, portions of the registrant’s 2010 Proxy Statement to be filed with the Securities and Exchange Commission within 120 days of the Registrant’s fiscal year end.
1
PART I
Cautionary Statement Relevant to Forward-Looking Information for the Purpose of “Safe Harbor” Provisions of the Private Securities Litigation Reform Act of 1995
The Company and its representatives may from time to time make written or oral forward-looking statements with respect to long-term goals or anticipated results of the Company, including statements contained in the Company’s filings with the Securities and Exchange Commission and in its reports to stockholders.
Statements, including those in this Annual Report on Form 10-K, which are not historical or current facts, are “forward-looking statements” made pursuant to the safe harbor provisions of the Private Securities Litigation Reform Act of 1995. There are certain important factors that could cause our results to differ materially from those anticipated by some of the statements made herein. Investors are cautioned that all forward-looking statements involve risk and uncertainty. Some of the factors that could affect results are the cyclical nature of the furniture industry, the effectiveness of new product introductions and distribution channels, the product mix of sales, pricing pressures, the cost of raw materials and fuel, foreign currency valuations, actions by governments including laws, regulations, taxes and tariffs, inflation, the amount of sales generated and the profit margins thereon, competition (both foreign and domestic), changes in interest rates, credit exposure with customers and general economic conditions. For further information regarding these risks and uncertainties, see the “Risk Factors” section in Item 1A of this Annual Report on Form 10-K.
The Company specifically declines to undertake any obligation to publicly revise any forward-looking statements that have been made to reflect events or circumstances after the date of such statements or to reflect the occurrence of anticipated or unanticipated events.
Item 1. Business
General
Flexsteel Industries, Inc. and Subsidiaries (the “Company”) was incorporated in 1929 and is one of the oldest and largest manufacturers, importers and marketers of residential and commercial upholstered and wooden furniture products in the country. Product offerings include a wide variety of upholstered and wood furniture such as sofas, loveseats, chairs, reclining and rocker-reclining chairs, swivel rockers, sofa beds, convertible bedding units, occasional tables, desks, dining tables and chairs and bedroom furniture. The Company’s products are intended for use in home, office, hotel and other commercial applications. Featured as a basic component in most of the upholstered furniture is a unique steel drop-in seat spring from which our name “Flexsteel” is derived. The Company distributes its products throughout the United States through the Company’s sales force and various independent representatives. The Company’s products are also sold to several national and regional chains, some of which sell on a private label basis. No single customer accounted for more than 10% of net sales.
The Company has one active wholly-owned subsidiary: DMI Furniture, Inc. (“DMI”), which is a Louisville, Kentucky-based, manufacturer, importer and marketer of residential and commercial office furniture with manufacturing and warehouses in Indiana and manufacturing sources in Asia; DMI’s divisions are WYNWOOD, Homestyles and DMI Commercial Office Furniture.
The Company operates in one reportable operating segment, furniture products. Our furniture products business involves the distribution of manufactured and imported products consisting of a broad line of upholstered and wooden furniture for residential and commercial markets. Set forth below is information for the past three fiscal years showing the Company’s net sales attributable to each of the areas of application (in thousands):
|
|
|
FOR THE YEARS ENDED JUNE 30, |
| |||||||
|
|
|
2010 |
|
2009 |
|
2008 |
| |||
|
Residential |
|
$ |
246,041 |
|
$ |
230,727 |
|
$ |
258,084 |
|
|
Commercial |
|
|
80,425 |
|
|
93,431 |
|
|
147,571 |
|
|
|
|
$ |
326,466 |
|
$ |
324,158 |
|
$ |
405,655 |
|
Manufacturing and Offshore Sourcing
We integrate our manufactured products with finished products acquired from offshore suppliers who can meet our quality specification and scheduling requirements. We will continue to pursue and refine this blended strategy, offering customers manufactured goods, products manufactured utilizing imported component parts, and ready-to-deliver imported products. The Company believes that it best serves customers by offering products from each of these categories to assist customers in reaching specific consumers with varied price points, styles and product categories. This blended focus on products allows the Company to provide a wide range of options to satisfy customer requirements.
2
We operate manufacturing facilities that are located in Arkansas, California, Georgia, Indiana, Iowa, Mississippi and Juarez, Mexico. These manufacturing operations are integral to our product offerings and distribution strategy by offering smaller and more frequent product runs of a wider product selection. We identify and eliminate manufacturing inefficiencies and adjust manufacturing schedules on a daily basis to meet customer requirements. We have established relationships with key suppliers to ensure prompt delivery of quality component parts. Our production includes the use of selected offshore component parts to enhance our product quality and value in the marketplace.
Competition
The furniture industry is highly competitive and includes a large number of domestic and foreign manufacturers and distributors, none of which dominates the market. Our competition includes foreign manufacturers, in countries such as China, which have lower production costs, and through direct importing by certain large retailers. The markets in which we compete include a large number of relatively small manufacturers; however, certain competitors have substantially greater sales volumes and financial resources than we have. Our products compete based on style, quality, price, delivery, service and durability. We believe that our manufacturing capabilities, facility locations, commitment to customers, product quality and value and experienced production, marketing and management teams, aided by offshore sourced components and finished product, are our competitive advantages.
Seasonality
The Company’s business is not considered seasonal.
Foreign Operations
The Company makes minimal export sales. At June 30, 2010, the Company had approximately 80 employees located in Asia to inspect and coordinate the delivery of purchased products.
Customer Backlog
The approximate backlog of customer orders believed to be firm as of the end of the current fiscal year and the prior two fiscal years were as follows (in thousands):
|
June 30, 2010 |
|
June 30, 2009 |
|
June 30, 2008 |
|
$ 49,000 |
|
$ 35,200 |
|
$ 45,700 |
Raw Materials
The Company utilizes various types of wood, fabrics, leathers, upholstered filling material, high carbon spring steel, bar and wire stock, polyurethane and other raw materials in manufacturing furniture. While the Company purchases these materials from numerous outside suppliers, both domestic and offshore, it is not dependent upon any single source of supply. The costs of certain raw materials fluctuate, but all continue to be readily available.
Working Capital Practices
For a discussion of the Company’s working capital practices, see “Liquidity and Capital Resources” in Item 7 of this Annual Report on Form 10-K.
Industry Factors
The Company has exposure to actions by governments, including tariffs, see “Risk Factors” in Item 1A of this Annual Report on Form 10-K.
Government Regulations
The Company is subject to various local, state, and federal laws, regulations and agencies that affect businesses generally, see “Risk Factors” in Item 1A of this Annual Report on Form 10-K.
Environmental Matters
The Company is subject to environmental laws and regulations with respect to product content and industrial waste, see “Risk Factors” in Item 1A of this Annual Report on Form 10-K.
Trademarks and Patents
The Company owns the American and Canadian improvement patents to its Flexsteel seat spring, as well as patents on convertible beds. The Company has patents and owns certain trademarks in connection with its furniture products, which are due to expire on dates ranging from 2011 to 2028. The Company does not consider its trademarks and patents material to its business.
3
It is not common in the furniture industry to obtain a patent for a furniture design. If a particular design of a furniture manufacturer is well accepted in the marketplace, it is common for other manufacturers to imitate the same design without recourse by the furniture manufacturer who initially introduced the design. Furniture products are designed by the Company’s own design staff and through the services of independent designers. New models and designs of furniture, as well as new fabrics, are introduced continuously. In the last three fiscal years, these design activities involved the following expenditures (in thousands):
|
Fiscal Year Ended June 30, |
|
Expenditures |
|
2010 |
|
$2,040 |
|
2009 |
|
$2,680 |
|
2008 |
|
$3,130 |
Employees
The Company had 1,400 employees as of June 30, 2010 including 300 employees that are covered by collective bargaining agreements. Management believes it has good relations with employees.
Website and Available Information
Our website is located at www.flexsteel.com. Information on the website does not constitute part of this Annual Report on Form 10-K.
A copy of the Company’s Annual Report on Form 10-K, as filed with the Securities and Exchange Commission (“SEC”), other SEC reports filed or furnished and our Guidelines for Business Conduct are available, without charge, on the Company’s website at www.flexsteel.com or by writing to the Office of the Secretary, Flexsteel Industries, Inc., P. O. Box 877, Dubuque, IA 52004-0877.
Item 1A. Risk Factors
Our business is subject to a variety of risks. You should carefully consider the risk factors detailed below in conjunction with the other information contained in this Annual Report on Form 10-K. Should any of these risks actually materialize, our business, financial condition, and future prospects could be negatively impacted. These risks are not the only ones we face. There may be additional factors that are presently unknown to us or that we currently believe to be immaterial that could affect our business.
We may lose market share due to competition, which would decrease our future sales and earnings.
The furniture industry is very competitive and fragmented. We compete with many domestic and foreign manufacturers and distributors. Some competitors have greater financial resources than we have and some often offer extensively advertised, well-recognized, branded products. Foreign producers typically have lower selling prices due to their lower operating costs. As a result, we may not be able to maintain or raise the prices of our products in response to such competitive pressures or increasing costs. Also, due to the large number of competitors and their wide range of product offerings, we may not be able to differentiate our products (through styling, finish and other construction techniques) from those of our competitors. Large retail furniture dealers have the ability to obtain offshore sourcing on their own. As a result, we are continually subject to the risk of losing market share, which may lower our sales and earnings.
Our offshore capabilities provide flexibility in product offerings and pricing to meet competitive pressures, but this approach may adversely affect our ability to service customers, which could lower future sales and earnings.
We acquire a portion of our finished goods and components used in our manufacturing operations from foreign vendors. These vendors are located primarily in Southeast Asia. The delivery of goods from these vendors may be delayed for reasons not typically encountered with U.S. suppliers including shipment delays caused by customs, labor issues, changes in political, economic and social conditions, laws and regulations. This could make it more difficult to service our customers resulting in lower sales and earnings.
If we experience the loss of large customers through business failures (or for other reasons) or any extended business interruptions at our manufacturing facilities, this could decrease our future sales and earnings.
Although we have no customers that individually represent 10% or more of our net sales, the possibility of business failures by, or the loss of, large customers could decrease our future sales and earnings. Lost sales may be difficult to replace and any amounts owed to us may become uncollectible. Our inability to fill customer orders during an extended business interruption could negatively impact existing customer relationships resulting in market share decreases.
4
At times it is necessary we discontinue certain relationships with customers who do not meet our growth, credit or profitability standards. Until realignment is established, there can be a decrease in near-term sales and earnings. We continually review relationships with our customers and future realignments are possible based upon such ongoing reviews.
Our failure to anticipate or respond to changes in consumer tastes and fashions in a timely manner could adversely affect our business and decrease our sales and earnings.
Furniture is a styled product and is subject to rapidly changing consumer trends and tastes and is highly fashion oriented, and if we are not able to acquire sufficient fabric variety, or if we are unable to predict or respond to changes in fashion trends, we may lose sales and have to sell excess inventory at reduced prices.
If we experience fluctuations in the price, availability and quality of raw materials, this could cause manufacturing delays, adversely affect our ability to provide goods to our customers and increase our costs, any of which could decrease our sales and earnings.
We use various types of wood, fabrics, leathers, upholstered filling material, high carbon spring steel, bar and wire stock and other raw materials in manufacturing furniture. Because we are dependent on outside suppliers for all of our raw material needs, we must obtain sufficient quantities of quality raw materials from our suppliers at acceptable prices and in a timely manner. We do not utilize long-term supply contracts with our suppliers. Unfavorable fluctuations in the price, quality and availability of these raw materials could negatively affect our ability to meet demands of our customers and have a negative impact on product margin. The inability to meet our customers’ demands could result in the loss of future sales, and we may not always be able to pass along price increases to our customers due to competitive and marketing pressures.
Future costs of complying with various laws and regulations may adversely impact future operating results.
Our business is subject to various laws and regulations, such as the Patient Protection and Affordable Care Act of 2010, the Pension Protection Act of 2006, the Lacey Act, as amended in 2008 to cover plants and trees, the Consumer Product Safety Improvement Act of 2008, the Security and Accountability for Every (SAFE) Port Act of 2006, the Maritime Transportation Security Act of 2002, the Fair and Accurate Credit Transactions Act as well as many others. Partially in response to the financial markets crises and the global economic recession, regulatory initiatives have accelerated in the United States and abroad. These initiatives could have a significant impact on our operations and the cost to comply with such laws and regulations could adversely impact our financial position, results of operations and cash flows. In addition, failure to comply with such laws and regulations, even inadvertently, could produce negative consequences which could adversely impact our operations.
Terms of collective bargaining agreements and labor disruptions could adversely impact our results of operations.
We employ approximately 1,400 people, 20% of whom are covered by union contracts. Where a significant portion of our workers are unionized, our ability to implement productivity improvements and effect savings with respect to health care, pension and other retirement costs is more restricted than in many nonunion operations as a result of various restrictions specified in our collective bargaining agreements. Terms of collective bargaining agreements that prevent us from competing effectively could adversely affect our financial condition, results of operations and cash flows. We are committed to working with those groups to resolve conflicts as they arise. However, there can be no assurance that these efforts will be successful.
Due to our participation in three multi-employer pension plans, we may have exposures under those plans that could extend beyond what our obligations would be with respect to our employees.
We participate in, and make periodic contributions to, three multi-employer pension plans that cover 60% of our union employees. Multi-employer pension plans are managed by trustee boards comprised of participating employer and labor union representatives, and the employers participating in a multi-employer pension plan are jointly responsible for maintaining the plan’s funding requirements. Based on the most recent information available to us, we believe that the present value of actuarially accrued liabilities in the multi-employer pension plans substantially exceeds the value of the assets held in trust to pay benefits. As a result of our participation, we could experience greater volatility in our overall pension funding obligations. Our obligations may be impacted by the funded status of the plans, the plans investment performance, changes in the participant demographics, financial stability of contributing employers and changes in actuarial assumptions. Proposed changes in generally accepted accounting principles could result in a requirement to record a portion of the multi-employer plan’s funded status as a liability in our financial statements.
5
We are, and may in the future be, a party to legal proceedings and claims, including those involving product liability or environmental matters, some of which claim significant damages and could adversely affect our business, operating results and financial condition.
We face the business risk of exposure to product liability claims in the event that the use of any of our products results in personal injury or property damage. In the event any of our products prove to be defective, we may be required to recall or redesign such products. We maintain insurance against product liability claims, but there can be no assurance such coverage will continue to be available on terms acceptable to us or that such coverage will be adequate for liabilities actually incurred.
Given the inherent uncertainty of litigation, we can offer no assurance future litigation will not have a material adverse impact on our business, operating results or financial condition. We are also subject to various laws and regulations relating to environmental protection and the discharge of materials into the environment and we could incur substantial costs as a result of the noncompliance with, or liability for cleanup or other costs or damages under, environmental laws.
Item 1B. Unresolved Staff Comments
None.
Item 2. Properties
The Company owns the following facilities as of June 30, 2010:
|
Location |
|
Approximate |
|
Principal Operations |
|
Dubuque, Iowa |
|
719,000 |
|
Manufacturing, Distribution and Corporate Offices |
|
Lancaster, Pennsylvania |
|
216,000 |
|
Distribution |
|
Riverside, California |
|
236,000 |
|
Manufacturing |
|
Dublin, Georgia |
|
300,000 |
|
Manufacturing |
|
Harrison, Arkansas |
|
221,000 |
|
Manufacturing |
|
Starkville, Mississippi |
|
349,000 |
|
Manufacturing |
|
New Paris, Indiana |
|
168,000 |
|
Held for sale |
|
Huntingburg, Indiana |
|
612,000 |
|
Distribution |
The Company leases the following facilities as of June 30, 2010:
|
Location |
|
Approximate |
|
Principal Operations |
|
Vancouver, Washington |
|
16,000 |
|
Distribution |
|
Louisville, Kentucky |
|
15,000 |
|
Administrative Offices |
|
Ferdinand, Indiana |
|
133,000 |
|
Distribution |
|
Juarez, Mexico |
|
48,000 |
|
Manufacturing |
The Company’s operating plants are well suited for their manufacturing purposes and have been updated and expanded from time to time as conditions warrant. Management believes there is adequate production and distribution capacity at the Company’s facilities to meet present market demands.
The Company leases showrooms for displaying its products in the furniture markets in High Point, North Carolina and Las Vegas, Nevada.
Item 3. Legal Proceedings
From time to time, the Company is subject to various legal proceedings, including lawsuits, which arise out of, and are incidental to, the conduct of the Company’s business. The Company does not consider any of such proceedings that are currently pending, individually or in the aggregate, to be material to its business or likely to result in a material adverse effect on its consolidated operating results, financial condition, or cash flows.
Item 4. Reserved
6
PART II
Item 5. Market for the Registrant’s Common Equity, Related Stockholder Matters and Issuer Purchases of Equity Securities
Share Investment Performance
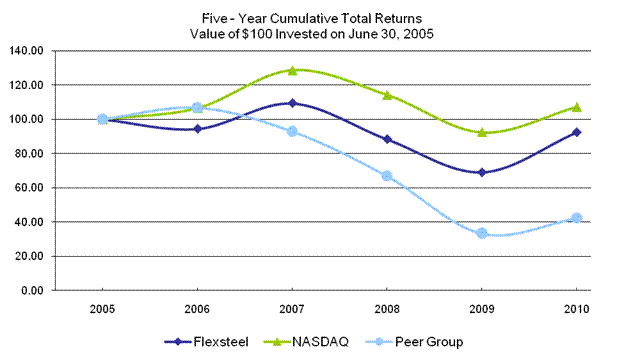
The following graph is based upon the SIC Code #251 Household Furniture Index as a peer group. It shows changes over the past five-year period in the value of $100 invested in: (1) Flexsteel’s common stock; (2) The NASDAQ Global Market; and (3) an industry peer group of the following: Bassett Furniture Ind., Chromcraft Revington Inc., Ethan Allen Interiors, Furniture Brands Intl., Hooker Furniture Corp., Kimball International, La-Z-Boy Inc., Natuzzi S.P.A., and Stanley Furniture Inc.
|
|
|
2005 |
|
2006 |
|
2007 |
|
2008 |
|
2009 |
|
2010 |
|
|
Flexsteel |
|
100.00 |
|
94.34 |
|
109.27 |
|
88.34 |
|
69.02 |
|
92.34 |
|
|
Peer Group |
|
100.00 |
|
106.68 |
|
92.86 |
|
66.82 |
|
33.33 |
|
42.16 |
|
|
NASDAQ |
|
100.00 |
|
106.47 |
|
128.53 |
|
114.15 |
|
92.32 |
|
107.12 |
|
The NASDAQ Global Market is the principal market on which the Company’s common stock is traded.
|
|
|
Sale Price of Common Stock * |
|
Cash Dividends |
| ||||||||||||||
|
|
|
Fiscal 2010 |
|
Fiscal 2009 |
|
Per Share |
| ||||||||||||
|
|
|
High |
|
Low |
|
High |
|
Low |
|
Fiscal 2010 |
|
Fiscal 2009 |
| ||||||
|
First Quarter |
|
$ |
8.84 |
|
$ |
6.64 |
|
$ |
12.18 |
|
$ |
9.50 |
|
$ |
0.05 |
|
$ |
0.13 |
|
|
Second Quarter |
|
|
10.34 |
|
|
7.77 |
|
|
10.99 |
|
|
6.68 |
|
|
0.05 |
|
|
0.13 |
|
|
Third Quarter |
|
|
16.50 |
|
|
9.33 |
|
|
7.96 |
|
|
5.11 |
|
|
0.05 |
|
|
0.05 |
|
|
Fourth Quarter |
|
|
15.74 |
|
|
10.75 |
|
|
9.00 |
|
|
4.98 |
|
|
0.05 |
|
|
0.05 |
|
* Reflects the market price as reported on The NASDAQ Global Market.
The Company estimates there were approximately 1,450 holders of common stock of the Company as of June 30, 2010.
There were no repurchases of the Company’s common stock during the quarter ended June 30, 2010.
7
Item 6. Selected Financial Data
The selected financial data presented below should be read in conjunction with the Company’s consolidated financial statements and notes thereto included in Item 8 of this Annual Report on Form 10-K and with “Management’s Discussion and Analysis of Financial Condition and Results of Operations” included in Item 7 of this Annual Report on Form 10-K. The selected consolidated statement of operations data of the Company is derived from the Company’s consolidated financial statements.
Five-Year Review
(Amounts in thousands, except certain ratios and per share data)
|
|
|
2010 |
|
2009 |
|
2008 |
|
2007 |
|
2006 |
| |||||
|
SUMMARY OF OPERATIONS |
|
|
|
|
|
|
|
|
|
|
|
|
|
|
|
|
|
Net sales |
|
$ |
326,466 |
|
$ |
324,158 |
|
$ |
405,655 |
|
$ |
425,400 |
|
$ |
426,408 |
|
|
Cost of goods sold |
|
|
251,685 |
|
|
263,083 |
|
|
327,165 |
|
|
344,177 |
|
|
345,068 |
|
|
Operating income (loss) |
|
|
17,529 |
|
|
(2,272 |
) |
|
7,596 |
|
|
14,699 |
|
|
8,561 |
|
|
Interest and other income |
|
|
361 |
|
|
661 |
|
|
469 |
|
|
1,277 |
|
|
775 |
|
|
Interest expense |
|
|
439 |
|
|
968 |
|
|
1,469 |
|
|
1,491 |
|
|
1,557 |
|
|
Income (loss) before income taxes |
|
|
17,451 |
|
|
(2,579 |
) |
|
6,596 |
|
|
14,484 |
|
|
7,778 |
|
|
Income tax provision (benefit) |
|
|
6,650 |
|
|
(1,070 |
) |
|
2,360 |
|
|
5,150 |
|
|
3,060 |
|
|
Net income (loss) (1) (2) |
|
|
10,801 |
|
|
(1,509 |
) |
|
4,236 |
|
|
9,334 |
|
|
4,718 |
|
|
Earnings (loss) per common share: (1) (2) |
|
|
|
|
|
|
|
|
|
|
|
|
|
|
|
|
|
Basic |
|
|
1.63 |
|
|
(0.23 |
) |
|
0.64 |
|
|
1.42 |
|
|
0.72 |
|
|
Diluted |
|
|
1.61 |
|
|
(0.23 |
) |
|
0.64 |
|
|
1.42 |
|
|
0.72 |
|
|
Cash dividends declared per common share |
|
$ |
0.20 |
|
$ |
0.36 |
|
$ |
0.52 |
|
$ |
0.52 |
|
$ |
0.52 |
|
|
SELECTED DATA AS OF JUNE 30 |
|
|
|
|
|
|
|
|
|
|
|
|
|
|
|
|
|
Average common shares outstanding: |
|
|
|
|
|
|
|
|
|
|
|
|
|
|
|
|
|
Basic |
|
|
6,608 |
|
|
6,576 |
|
|
6,574 |
|
|
6,568 |
|
|
6,558 |
|
|
Diluted |
|
|
6,697 |
|
|
6,576 |
|
|
6,611 |
|
|
6,583 |
|
|
6,577 |
|
|
Total assets |
|
$ |
157,670 |
|
$ |
150,971 |
|
$ |
179,906 |
|
$ |
185,014 |
|
$ |
184,176 |
|
|
Property, plant and equipment, net |
|
|
21,614 |
|
|
23,298 |
|
|
26,372 |
|
|
28,168 |
|
|
24,158 |
|
|
Capital expenditures |
|
|
1,251 |
|
|
1,203 |
|
|
1,228 |
|
|
10,839 |
|
|
3,411 |
|
|
Long-term debt |
|
|
— |
|
|
— |
|
|
20,811 |
|
|
21,336 |
|
|
21,846 |
|
|
Working capital (current assets less current liabilities) |
|
|
90,800 |
|
|
78,416 |
|
|
100,920 |
|
|
97,902 |
|
|
95,551 |
|
|
Shareholders’ equity |
|
$ |
117,612 |
|
$ |
106,998 |
|
$ |
112,752 |
|
$ |
112,679 |
|
$ |
106,066 |
|
|
SELECTED RATIOS |
|
|
|
|
|
|
|
|
|
|
|
|
|
|
|
|
|
Net income (loss), as a percent of sales |
|
|
3.3 |
|
|
(0.5 |
) |
|
1.0 |
|
|
2.2 |
|
|
1.1 |
|
|
Current ratio |
|
|
3.9 to 1 |
|
|
3.2 to 1 |
|
|
3.5 to 1 |
|
|
3.2 to 1 |
|
|
2.9 to 1 |
|
|
Return on ending shareholders’ equity |
|
|
9.2 |
|
|
(1.4 |
) |
|
3.8 |
|
|
8.3 |
|
|
4.5 |
|
|
Average number of employees |
|
|
1,400 |
|
|
1,600 |
|
|
2,140 |
|
|
2,290 |
|
|
2,400 |
|
|
(1) |
Fiscal 2009 net loss and per share amounts reflect facility consolidation and other costs (after tax) of $1.5 million or $(0.23) per share. |
|
(2) |
Fiscal 2007 net income and per share amounts reflect the net gain (after tax) on sale of building of approximately $2.5 million or $0.37 per share, the gain on life insurance of $0.6 million or $0.08 per share and the net gain (after tax) on the sale of vacant land of approximately $0.2 million or $0.04 per share. |
8
Item 7. Management’s Discussion and Analysis of Financial Condition and Results of Operations
General
The following analysis of the results of operations and financial condition of the Company should be read in conjunction with the consolidated financial statements and related notes included elsewhere in this Annual Report on Form 10-K.
Critical Accounting Policies
The discussion and analysis of the Company’s consolidated financial statements and results of operations are based on consolidated financial statements prepared in accordance with accounting principles generally accepted in the United States of America. Preparation of these consolidated financial statements requires the use of estimates and judgments that affect the reported results. The Company uses estimates based on the best information available in recording transactions and balances resulting from business operations. Estimates are used for such items as collectibility of trade accounts receivable and inventory valuation. Ultimate results may differ from these estimates under different assumptions or conditions.
Allowance for doubtful accounts – the Company establishes an allowance for doubtful accounts through review of open accounts, and historical collection and allowances amounts. The allowance for doubtful accounts is intended to reduce trade accounts receivable to the amount that reasonably approximates their net realizable fair value due to their short-term nature. The amount ultimately realized from trade accounts receivable may differ from the amount estimated in the consolidated financial statements based on collection experience and actual returns and allowances.
Inventories – the Company values inventory at the lower of cost or market. A portion of our finished goods inventory is made to order and many of our raw material parts are interchangeable between products. Management assesses the inventory on hand and if necessary writes down the obsolete or excess inventory to market.
Revenue recognition – is upon delivery of product to our customer and when collectibility is reasonably assured. Delivery of product to our customer is evidenced through the shipping terms indicating when title and risk of loss is transferred. Our ordering process creates persuasive evidence of the sale arrangement and the sales amount is determined. The delivery of the goods to our customer completes the earnings process. Net sales consist of product sales and related delivery charge revenue, net of adjustments for returns and allowances. Shipping and handling costs are included in cost of goods sold.
Recently Issued Accounting Pronouncements
See Item 8. Note 1 to the Company’s Consolidated Financial Statements.
Results of Operations
The following table has been prepared as an aid in understanding the Company’s results of operations on a comparative basis for the fiscal years ended June 30, 2010, 2009 and 2008. Amounts presented are percentages of the Company’s net sales.
|
|
|
FOR THE YEARS ENDED JUNE 30, |
| ||||
|
|
|
2010 |
|
2009 |
|
2008 |
|
|
Net sales |
|
100.0 |
% |
100.0 |
% |
100.0 |
% |
|
Cost of goods sold |
|
(77.2 |
) |
(81.2 |
) |
(80.7 |
) |
|
Gross margin |
|
22.8 |
|
18.8 |
|
19.3 |
|
|
Selling, general and administrative |
|
(17.5) |
|
(18.8 |
) |
(17.5 |
) |
|
Facility consolidation and other charges |
|
— |
|
(0.8 |
) |
— |
|
|
Operating income (loss) |
|
5.3 |
|
(0.8 |
) |
1.8 |
|
|
Other expense, net |
|
0.0 |
|
0.0 |
|
(0.2 |
) |
|
Income (loss) before income taxes |
|
5.3 |
|
(0.8 |
) |
1.6 |
|
|
Income tax (provision) benefit |
|
(2.0 |
) |
0.3 |
|
(0.6 |
) |
|
Net income (loss) |
|
3.3 |
% |
(0.5 |
)% |
1.0 |
% |
9
Fiscal 2010 Compared to Fiscal 2009
Net sales for fiscal 2010 were $326.5 million compared to $324.2 million in the prior fiscal year, an increase of 1%. Residential net sales were $246.0 million compared to $230.7 million in fiscal 2009, an increase of 7%. Commercial net sales were $80.5 million for fiscal 2010, a decrease of 14% from net sales of $93.5 million for fiscal 2009.
The Company’s operating income improved by $19.8 million in fiscal year 2010 in comparison to the prior year. The Company benefited from strategies implemented and actions taken during fiscal year 2009 including consolidation of manufacturing operations and workforce reductions that brought production capacity and fixed overhead more in line with current product demand. During the prior fiscal year, the Company recorded pre-tax charges of approximately $2.6 million related to facility consolidation and employee separation costs. Company-wide employment was reduced approximately 30% through plant closures and workforce reductions and remains at these reduced levels. These factors contributed significantly to gross margin improvements and selling, general and administrative expense reductions.
Gross margin for fiscal year 2010 was 22.8% compared to 18.8% for the prior year period. The gross margin improvements for the year were greatly impacted by the operational changes discussed above. In addition, gross margin improved due to stability in material and product costs and lower ocean freight costs.
For the fiscal years ended 2010 and 2009, selling, general and administrative expenses were 17.5% and 18.8% of net sales, respectively. These percentage improvements are due to the operational changes discussed above, as well as, lower bad debt and advertising costs.
Interest expense decreased $0.6 million to $0.4 million for fiscal year 2010 due to lower borrowings.
The effective tax rate for the fiscal year ended June 30, 2010 was 38.1%. The effective income tax benefit rate was 41.5% for fiscal year 2009 due to losses or low level of earnings in various tax jurisdictions.
The above factors resulted in net income for the fiscal year ended June 30, 2010 of $10.8 million or $1.61 per share compared to a net loss of $1.5 million or $0.23 per share in fiscal 2009.
All earnings per share amounts are on a diluted basis.
Fiscal 2009 Compared to Fiscal 2008
Net sales for the fiscal year ended June 30, 2009 were $324.2 million compared to $405.7 million in the prior fiscal year, a decrease of 20.1%. Residential net sales were $230.7 million compared to $258.1 million in the fiscal year ended June 30, 2008, a decrease of 10.6%. Commercial net sales were $93.5 million for the fiscal year ended June 30, 2009, a decrease of 36.9% from net sales of $147.6 million for the fiscal year ended June 30, 2008.
We believe that our residential product category has performed reasonably well in relation to our competition. However, residential furniture remains a deferrable purchase item and is adversely impacted by tighter consumer credit, higher unemployment and low levels of consumer confidence. Within commercial sales, the recreational vehicle industry was the hardest hit product category with the initial impact of high fuel costs compounded by credit tightening and lack of consumer confidence in the economy as a whole. Commercial office and hospitality sales held up well early in our fiscal year, but fell considerably as the U.S. economy contracted and credit tightened.
Gross margin for the fiscal years ended June 30, 2009 and 2008 was 18.8% and 19.3%, respectively. The decrease in gross margin percentage for the year is primarily due to an approximate $2.0 million adjustment to realizable value on inventory and to a lesser extent to under-utilization of capacity on significantly lower sales volume. These factors were partially offset by a LIFO benefit increase of approximately $0.6 million.
Selling, general and administrative expenses were 18.8% and 17.5% of net sales for the fiscal years ended June 30, 2009 and 2008, respectively. The percentage increase in selling, general and administrative costs is primarily due to under-absorption of fixed costs on the lower sales volume and the lag time in reducing advertising and other sales support costs to the lower volume.
The Company recorded $2.6 million in facility consolidation and employee separation costs during fiscal year 2009. These costs related to consolidating manufacturing operations and workforce reductions to bring production capacity in line with current and expected demand for the Company’s products.
10
Interest expense decreased $0.5 million to $1.0 million for the fiscal year ended June 30, 2009 due to lower borrowings and interest rates.
Although the Company’s full year tax rate is typically in the 35% - 39% range, fiscal year ended June 30, 2009 reflects an effective income tax benefit rate of 41.5% due to losses or low level of earnings in various tax jurisdictions. The effective income tax expense rate was 35.8% for the fiscal year ended June 30, 2008.
The above factors resulted in net loss for the fiscal year ended June 30, 2009 of $1.5 million or $0.23 per share compared to net income of $4.2 million or $0.64 per share for the fiscal year ended June 30, 2008.
All earnings per share amounts are on a diluted basis.
Liquidity and Capital Resources
Working capital (current assets less current liabilities) at June 30, 2010 was $90.8 million as compared to $78.4 million at June 30, 2009. Significant changes in working capital from June 30, 2009 to June 30, 2010 included increased cash of $6.6 million and increased accounts receivable of $4.5 million. The increase in receivables is primarily related to higher shipment volume in the fourth quarter.
Net cash provided by operating activities was $19.1 million for fiscal year 2010 reflecting net income of $10.8 million, working capital changes of $4.4 million and non-cash charges of $3.9 million. The change in net cash provided by operating activities of $17.3 million in fiscal year 2009 was comprised primarily of reductions in inventory of $11.9 million and accounts receivable of $12.5 million partially offset by reductions in accounts payable of $4.8 million. The Company expects that due to the nature of our operations that there will be continuing fluctuations in accounts receivable, inventory, accounts payable, and cash flows from operations due to the following: (i) we purchase inventory from overseas suppliers with long lead times and depending on the timing of the delivery of those orders, inventory levels can be greatly impacted, and (ii) we have various customers that purchase large quantities of inventory periodically and the timing of those purchases can significantly impact inventory levels, accounts receivable, accounts payable and short-term borrowings. As discussed below the Company believes it has adequate financing arrangements and access to capital to absorb these fluctuations in operating cash flow.
Net cash used in investing activities was $1.6 million in fiscal year 2010 compared to cash provided by investing activities of $0.4 million in fiscal year 2009. Net purchases of investments were $0.7 million. Capital expenditures were $1.3 million for the fiscal year ended 2010. Depreciation expense was $3.0 million and $3.7 million for the fiscal years ended June 30, 2010 and 2009, respectively. The Company expects that capital expenditures will be approximately $4.0 million in fiscal year 2011.
Net cash used in financing activities was $11.0 million in fiscal year 2010 compared to $18.8 million in fiscal year 2009. Cash from operating activities was used to reduce borrowings by $10.0 million and pay dividends of $1.3 million.
Management believes that the Company has adequate cash and credit arrangements to meet its operating and capital requirements for fiscal year 2011. In the opinion of management, the Company’s liquidity and credit resources provide it with the ability to react to opportunities as they arise, to pay quarterly dividends to its shareholders, and to purchase productive capital assets that enhance safety and improve operations.
At June 30, 2010, the Company has no long-term debt obligations and therefore, no contractual interest payments are included in the table below. The following table summarizes the Company’s contractual obligations at June 30, 2010 and the effect these obligations are expected to have on the Company’s liquidity and cash flow in the future (in thousands):
|
|
|
Total |
|
Less than |
|
1 – 3 |
|
3 – 5 |
|
More than |
| |||||
|
Operating lease obligations |
|
$ |
5,295 |
|
$ |
1,730 |
|
$ |
3,400 |
|
$ |
165 |
|
$ |
— |
|
Contractual obligations associated with the Company’s deferred compensation plans were excluded from the table above as the Company cannot predict when the events that trigger payment will occur. Total accumulated deferred compensation liabilities were $5.1 million at June 30, 2010. At June 30, 2010 the Company had no capital lease obligations, and no purchase obligations for raw materials or finished goods. The purchase price on all open purchase orders was fixed and denominated in U.S. dollars. Additionally, the Company has excluded the tax contingency reserve from the above table, as the timing of payments, if any, cannot be reasonably estimated.
11
Financing Arrangements
See Note 6 to the Consolidated Financial Statements of this Annual Report on Form 10-K.
Outlook
We enter the 2011 fiscal year with a strong balance sheet reflecting working capital in excess of $90.0 million and no bank borrowings. We had an increase in sales volume for the current quarter over the prior year quarter, and anticipate modest improvement in sales volume will continue in fiscal 2011. We believe that we have the necessary manufacturing capacity, importing capability and fixed cost controls in place to meet current and expected demand for our products. However, we are experiencing selected cost increases on various manufacturing component materials and increases on ocean freight rates in comparison to prior year rates.
Our residential product category has performed well in relation to our competition, and we anticipate continued improvement in the residential sales category. However, residential furniture remains a highly deferrable item and can be adversely impacted by factors, such as, low levels of consumer confidence, a depressed market for housing, limited consumer credit and high unemployment. Demand for our commercial product shipments fell considerably as the U.S. economy contracted and credit tightened. While we believe that commercial product sales are at or near the bottom of the downward cycle and should level off, we do not anticipate significant improvements in commercial markets before the second half of fiscal year 2011.
We remain committed to our core strategies, which include a wide range of quality product offerings and price points to the residential and commercial markets, combined with a conservative approach to business. We will maintain our focus on a strong balance sheet through emphasis on cash flow and improving profitability. We believe these core strategies will be in the best interest of our shareholders in the longer term.
Item 7A. Quantitative and Qualitative Disclosures About Market Risk
General – Market risk represents the risk of changes in the value of a financial instrument, derivative or non-derivative, caused by fluctuations in interest rates, foreign exchange rates and equity prices. As discussed below, management of the Company does not believe that changes in these factors could cause material fluctuations in the Company’s results of operations or cash flows. The ability to import furniture products can be adversely affected by political issues in the countries where suppliers are located, disruptions associated with shipping distances and negotiations with port employees. Other risks related to furniture product importation include government imposition of regulations and/or quotas; duties and taxes on imports; and significant fluctuation in the value of the U.S. dollar against foreign currencies. Any of these factors could interrupt supply, increase costs and decrease earnings.
Foreign Currency Risk – During fiscal years 2010, 2009 and 2008, the Company did not have sales, purchases, or other expenses denominated in foreign currencies. As such, the Company is not exposed to market risk associated with currency exchange rates and prices.
Interest Rate Risk – The Company’s primary market risk exposure with regard to financial instruments is changes in interest rates. At June 30, 2010, the Company does not have any debt outstanding.
Tariffs – The Company has exposure to actions by governments, including tariffs. Tariffs are a possibility on any imported or exported products.
Inflation – Increased operating costs are reflected in product or services pricing with any limitations on price increases determined by the marketplace. Inflation or other pricing pressures could impact raw material costs, labor costs and interest rates which are important components of costs for the Company and could have an adverse effect on our profitability, especially where increases in these costs exceed price increases on finished products.
Item 8. Financial Statements and Supplementary Data
|
|
|
Page(s) |
|
Report of Independent Registered Public Accounting Firm |
|
13 |
|
Consolidated Balance Sheets at June 30, 2010 and 2009 |
|
14 |
|
Consolidated Statements of Operations for the Years Ended June 30, 2010, 2009 and 2008 |
|
15 |
|
Consolidated Statements of Changes in Shareholders’ Equity for the Years Ended June 30, 2010, 2009 and 2008 |
|
16 |
|
Consolidated Statements of Cash Flows for the Years Ended June 30, 2010, 2009 and 2008 |
|
17 |
|
Notes to Consolidated Financial Statements |
|
18 |
12
REPORT OF INDEPENDENT REGISTERED PUBLIC ACCOUNTING FIRM
To the Board of Directors and Stockholders of Flexsteel Industries, Inc.
We have audited the accompanying consolidated balance sheets of Flexsteel Industries, Inc. and subsidiaries (the “Company”) as of June 30, 2010 and 2009, and the related consolidated statements of income, stockholders’ equity, and cash flows for each of the three years in the period ended June 30, 2010. Our audits also included the financial statement schedule listed in the Index at Item 15. We also have audited the Company’s internal control over financial reporting as of June 30, 2010, based on criteria established in Internal Control — Integrated Framework issued by the Committee of Sponsoring Organizations of the Treadway Commission. The Company’s management is responsible for these financial statements and financial statement schedule, for maintaining effective internal control over financial reporting, and for its assessment of the effectiveness of internal control over financial reporting, included in the accompanying Management’s Annual Report on Internal Control Over Financial Reporting. Our responsibility is to express an opinion on these financial statements and financial statement schedule and an opinion on the Company’s internal control over financial reporting based on our audits.
We conducted our audits in accordance with the standards of the Public Company Accounting Oversight Board (United States). Those standards require that we plan and perform the audit to obtain reasonable assurance about whether the financial statements are free of material misstatement and whether effective internal control over financial reporting was maintained in all material respects. Our audits of the financial statements included examining, on a test basis, evidence supporting the amounts and disclosures in the financial statements, assessing the accounting principles used and significant estimates made by management, and evaluating the overall financial statement presentation. Our audit of internal control over financial reporting included obtaining an understanding of internal control over financial reporting, assessing the risk that a material weakness exists, testing and evaluating the design and operating effectiveness of internal control based on the assessed risk. Our audits also included performing such other procedures as we considered necessary in the circumstances. We believe that our audits provide a reasonable basis for our opinions.
A company’s internal control over financial reporting is a process designed by, or under the supervision of, the company’s principal executive and principal financial officers, or persons performing similar functions, and effected by the company’s board of directors, management, and other personnel to provide reasonable assurance regarding the reliability of financial reporting and the preparation of financial statements for external purposes in accordance with generally accepted accounting principles. A company’s internal control over financial reporting includes those policies and procedures that (1) pertain to the maintenance of records that, in reasonable detail, accurately and fairly reflect the transactions and dispositions of the assets of the company; (2) provide reasonable assurance that transactions are recorded as necessary to permit preparation of financial statements in accordance with generally accepted accounting principles and that receipts and expenditures of the company are being made only in accordance with authorizations of management and directors of the company; and (3) provide reasonable assurance regarding prevention or timely detection of unauthorized acquisition, use, or disposition of the company’s assets that could have a material effect on the financial statements.
Because of the inherent limitations of internal control over financial reporting, including the possibility of collusion or improper management override of controls, material misstatements due to error or fraud may not be prevented or detected on a timely basis. Also, projections of any evaluation of the effectiveness of the internal control over financial reporting to future periods are subject to the risk that the controls may become inadequate because of changes in conditions, or that the degree of compliance with the policies or procedures may deteriorate.
In our opinion, the consolidated financial statements referred to above present fairly, in all material respects, the financial position of Flexsteel Industries, Inc. and subsidiaries as of June 30, 2010 and 2009, and the results of their operations and their cash flows for each of the three years in the period ended June 30, 2010, in conformity with accounting principles generally accepted in the United States of America. Also, in our opinion, such financial statement schedule, when considered in relation to the basic consolidated financial statements taken as a whole, presents fairly, in all material respects, the information set forth therein. Also, in our opinion, the Company maintained, in all material respects, effective internal control over financial reporting as of June 30, 2010, based on the criteria established in Internal Control — Integrated Framework issued by the Committee of Sponsoring Organizations of the Treadway Commission.
DELOITTE & TOUCHE LLP
Minneapolis, Minnesota
August 25, 2010
13
FLEXSTEEL INDUSTRIES, INC. AND SUBSIDIARIES
Consolidated Balance Sheets
(Amounts in thousands, except share and per share data)
|
|
|
JUNE 30, |
| ||||
|
ASSETS |
|
2010 |
|
2009 |
| ||
|
|
|
|
|
|
|
|
|
|
CURRENT ASSETS: |
|
|
|
|
|
|
|
|
Cash and cash equivalents |
|
$ |
8,278 |
|
$ |
1,714 |
|
|
Trade receivables – less allowance for doubtful accounts: 2010, $2,020; 2009, $1,760 |
|
|
35,748 |
|
|
31,282 |
|
|
Inventories |
|
|
72,637 |
|
|
73,844 |
|
|
Deferred income taxes |
|
|
4,050 |
|
|
3,960 |
|
|
Other |
|
|
1,076 |
|
|
3,913 |
|
|
Total current assets |
|
|
121,789 |
|
|
114,713 |
|
|
NONCURRENT ASSETS: |
|
|
|
|
|
|
|
|
Property, plant and equipment, net |
|
|
21,614 |
|
|
23,298 |
|
|
Deferred income taxes |
|
|
3,010 |
|
|
2,145 |
|
|
Other assets |
|
|
11,257 |
|
|
10,815 |
|
|
TOTAL |
|
$ |
157,670 |
|
$ |
150,971 |
|
|
|
|
|
|
|
|
|
|
|
LIABILITIES AND SHAREHOLDERS’ EQUITY |
|
|
|
|
|
|
|
|
|
|
|
|
|
|
|
|
|
CURRENT LIABILITIES: |
|
|
|
|
|
|
|
|
Accounts payable – trade |
|
$ |
10,815 |
|
$ |
9,745 |
|
|
Notes payable and current maturities on long-term debt |
|
|
— |
|
|
10,000 |
|
|
Accrued liabilities: |
|
|
|
|
|
|
|
|
Payroll and related items |
|
|
7,023 |
|
|
4,938 |
|
|
Insurance |
|
|
6,192 |
|
|
6,519 |
|
|
Other |
|
|
6,959 |
|
|
5,095 |
|
|
Total current liabilities |
|
|
30,989 |
|
|
36,297 |
|
|
LONG-TERM LIABILITIES: |
|
|
|
|
|
|
|
|
Deferred compensation |
|
|
5,096 |
|
|
4,991 |
|
|
Other liabilities |
|
|
3,973 |
|
|
2,685 |
|
|
Total liabilities |
|
|
40,058 |
|
|
43,973 |
|
|
|
|
|
|
|
|
|
|
|
COMMITMENTS AND CONTINGENCIES (Note 12) |
|
|
|
|
|
|
|
|
|
|
|
|
|
|
|
|
|
SHAREHOLDERS’ EQUITY: |
|
|
|
|
|
|
|
|
Cumulative preferred stock – $50 par value; authorized 60,000 shares; outstanding – none |
|
|
|
|
|
|
|
|
Undesignated (subordinated) stock – $1 par value; authorized 700,000 shares; outstanding – none |
|
|
|
|
|
|
|
|
Common stock – $1 par value; authorized 15,000,000 shares; outstanding 2010, 6,645,532 shares; 2009, 6,576,373 shares |
|
|
6,646 |
|
|
6,576 |
|
|
Additional paid-in capital |
|
|
5,425 |
|
|
4,370 |
|
|
Retained earnings |
|
|
107,293 |
|
|
97,816 |
|
|
Accumulated other comprehensive loss |
|
|
(1,752 |
) |
|
(1,764 |
) |
|
Total shareholders’ equity |
|
|
117,612 |
|
|
106,998 |
|
|
TOTAL |
|
$ |
157,670 |
|
$ |
150,971 |
|
See accompanying Notes to Consolidated Financial Statements.
14
FLEXSTEEL INDUSTRIES, INC. AND SUBSIDIARIES
Consolidated Statements of Operations
(Amounts in thousands, except per share data)
|
|
|
FOR THE YEARS ENDED JUNE 30, |
| |||||||
|
|
|
2010 |
|
2009 |
|
2008 |
| |||
|
|
|
|
|
|
|
|
|
|
|
|
|
NET SALES |
|
$ |
326,466 |
|
$ |
324,158 |
|
$ |
405,655 |
|
|
COST OF GOODS SOLD |
|
|
(251,685 |
) |
|
(263,083 |
) |
|
(327,165 |
) |
|
GROSS MARGIN |
|
|
74,781 |
|
|
61,075 |
|
|
78,490 |
|
|
SELLING, GENERAL AND ADMINISTRATIVE |
|
|
(57,252 |
) |
|
(60,792 |
) |
|
(70,894 |
) |
|
FACILITY CONSOLIDATION AND OTHER CHARGES |
|
|
— |
|
|
(2,555 |
) |
|
— |
|
|
OPERATING INCOME (LOSS) |
|
|
17,529 |
|
|
(2,272 |
) |
|
7,596 |
|
|
OTHER INCOME (EXPENSE): |
|
|
|
|
|
|
|
|
|
|
|
Interest and other income |
|
|
361 |
|
|
661 |
|
|
469 |
|
|
Interest expense |
|
|
(439 |
) |
|
(968 |
) |
|
(1,469 |
) |
|
Total |
|
|
(78 |
) |
|
(307 |
) |
|
(1,000 |
) |
|
INCOME (LOSS) BEFORE INCOME TAXES |
|
|
17,451 |
|
|
(2,579 |
) |
|
6,596 |
|
|
INCOME TAX (PROVISION) BENEFIT |
|
|
(6,650 |
) |
|
1,070 |
|
|
(2,360 |
) |
|
NET INCOME (LOSS) |
|
$ |
10,801 |
|
$ |
(1,509 |
) |
$ |
4,236 |
|
|
|
|
|
|
|
|
|
|
|
|
|
|
WEIGHTED AVERAGE NUMBER OF COMMON SHARES OUTSTANDING: |
|
|
|
|
|
|
|
|
|
|
|
Basic |
|
|
6,608 |
|
|
6,576 |
|
|
6,574 |
|
|
Diluted |
|
|
6,697 |
|
|
6,576 |
|
|
6,611 |
|
|
|
|
|
|
|
|
|
|
|
|
|
|
EARNINGS (LOSS) PER SHARE OF COMMON STOCK: |
|
|
|
|
|
|
|
|
|
|
|
Basic |
|
$ |
1.63 |
|
$ |
(0.23 |
) |
$ |
0.64 |
|
|
Diluted |
|
$ |
1.61 |
|
$ |
(0.23 |
) |
$ |
0.64 |
|
|
|
|
|
|
|
|
|
|
|
|
|
|
CASH DIVIDENDS DECLARED PER COMMON SHARE |
|
$ |
0.20 |
|
$ |
0.36 |
|
$ |
0.52 |
|
See accompanying Notes to Consolidated Financial Statements.
15
FLEXSTEEL INDUSTRIES, INC. AND SUBSIDIARIES
Consolidated Statements of Changes in Shareholders’ Equity
(Amounts in thousands)
|
|
|
Total Par |
|
Additional |
|
Retained |
|
Accumulated |
|
Total |
| |||||
|
|
|
|
|
|
|
|
|
|
|
|
|
|
|
|
|
|
|
Balance at July 1, 2007 |
|
$ |
6,570 |
|
$ |
4,013 |
|
$ |
100,985 |
|
$ |
1,110 |
|
$ |
112,678 |
|
|
Adoption of FIN 48 |
|
|
— |
|
|
— |
|
|
(110 |
) |
|
— |
|
|
(110 |
) |
|
Issuance of common stock: |
|
|
|
|
|
|
|
|
|
|
|
|
|
|
|
|
|
Stock options exercised, net |
|
|
2 |
|
|
14 |
|
|
— |
|
|
— |
|
|
16 |
|
|
401(k) plan shares |
|
|
4 |
|
|
43 |
|
|
— |
|
|
— |
|
|
47 |
|
|
Unrealized loss on available for sale investments, net of tax |
|
|
— |
|
|
— |
|
|
— |
|
|
(85 |
) |
|
(85 |
) |
|
Stock-based compensation |
|
|
— |
|
|
186 |
|
|
— |
|
|
— |
|
|
186 |
|
|
Interest rate swaps valuation adjustment, net of tax |
|
|
— |
|
|
— |
|
|
— |
|
|
(273 |
) |
|
(273 |
) |
|
Minimum pension liability adjustment, net of tax |
|
|
— |
|
|
— |
|
|
— |
|
|
(524 |
) |
|
(524 |
) |
|
Cash dividends declared |
|
|
— |
|
|
— |
|
|
(3,419 |
) |
|
— |
|
|
(3,419 |
) |
|
Net income |
|
|
— |
|
|
— |
|
|
4,236 |
|
|
— |
|
|
4,236 |
|
|
Balance at June 30, 2008 |
|
|
6,576 |
|
|
4,256 |
|
|
101,692 |
|
|
228 |
|
|
112,752 |
|
|
Unrealized loss on available for sale investments, net of tax |
|
|
— |
|
|
— |
|
|
— |
|
|
(1,022 |
) |
|
(1,022 |
) |
|
Stock-based compensation |
|
|
— |
|
|
114 |
|
|
— |
|
|
— |
|
|
114 |
|
|
Interest rate swaps valuation adjustment, net of tax |
|
|
— |
|
|
— |
|
|
— |
|
|
(1 |
) |
|
(1 |
) |
|
Minimum pension liability adjustment, net of tax |
|
|
— |
|
|
— |
|
|
— |
|
|
(969 |
) |
|
(969 |
) |
|
Cash dividends declared |
|
|
— |
|
|
— |
|
|
(2,367 |
) |
|
— |
|
|
(2,367 |
) |
|
Net loss |
|
|
— |
|
|
— |
|
|
(1,509 |
) |
|
— |
|
|
(1,509 |
) |
|
Balance at June 30, 2009 |
|
|
6,576 |
|
|
4,370 |
|
|
97,816 |
|
|
(1,764 |
) |
|
106,998 |
|
|
Issuance of common stock: |
|
|
|
|
|
|
|
|
|
|
|
|
|
|
|
|
|
Stock options exercised, net |
|
|
70 |
|
|
274 |
|
|
— |
|
|
— |
|
|
344 |
|
|
Unrealized loss on available for sale investments, net of tax |
|
|
— |
|
|
— |
|
|
— |
|
|
39 |
|
|
39 |
|
|
Long-Term Incentive compensation |
|
|
— |
|
|
510 |
|
|
— |
|
|
— |
|
|
510 |
|
|
Stock-based compensation |
|
|
— |
|
|
271 |
|
|
— |
|
|
— |
|
|
271 |
|
|
Interest rate swaps valuation adjustment, net of tax |
|
|
— |
|
|
— |
|
|
— |
|
|
177 |
|
|
177 |
|
|
Minimum pension liability adjustment, net of tax |
|
|
— |
|
|
— |
|
|
— |
|
|
(204 |
) |
|
(204 |
) |
|
Cash dividends declared |
|
|
— |
|
|
— |
|
|
(1,324 |
) |
|
— |
|
|
(1,324 |
) |
|
Net income |
|
|
— |
|
|
— |
|
|
10,801 |
|
|
— |
|
|
10,801 |
|
|
Balance at June 30, 2010 |
|
$ |
6,646 |
|
$ |
5,425 |
|
$ |
107,293 |
|
$ |
(1,752 |
) |
$ |
117,612 |
|
See accompanying Notes to Consolidated Financial Statements.
16
FLEXSTEEL INDUSTRIES, INC. AND SUBSIDIARIES
Consolidated Statements of Cash Flows
(Amounts in thousands)
|
|
|
FOR THE YEARS ENDED JUNE 30, |
| |||||||
|
|
|
2010 |
|
2009 |
|
2008 |
| |||
|
OPERATING ACTIVITIES: |
|
|
|
|
|
|
|
|
|
|
|
Net income (loss) |
|
$ |
10,801 |
|
$ |
(1,509 |
) |
$ |
4,236 |
|
|
Adjustments to reconcile net income (loss) to net cash provided by (used in) operating activities: |
|
|
|
|
|
|
|
|
|
|
|
Depreciation |
|
|
2,986 |
|
|
3,733 |
|
|
4,438 |
|
|
Deferred income taxes |
|
|
(963 |
) |
|
449 |
|
|
349 |
|
|
Stock-based compensation expense |
|
|
781 |
|
|
114 |
|
|
186 |
|
|
Provision for losses on accounts receivable |
|
|
920 |
|
|
1,240 |
|
|
1,050 |
|
|
Other non-cash, net |
|
|
218 |
|
|
14 |
|
|
(88 |
) |
|
Gain on disposition of capital assets |
|
|
(9 |
) |
|
(252 |
) |
|
(49 |
) |
|
Gain on sale of investments |
|
|
— |
|
|
(462 |
) |
|
— |
|
|
Impairment of long-lived assets |
|
|
— |
|
|
138 |
|
|
— |
|
|
Changes in operating assets and liabilities: |
|
|
|
|
|
|
|
|
|
|
|
Trade receivables |
|
|
(5,386 |
) |
|
11,261 |
|
|
11,441 |
|
|
Inventories |
|
|
1,207 |
|
|
11,947 |
|
|
(7,034 |
) |
|
Other current assets |
|
|
2,837 |
|
|
(781 |
) |
|
(655 |
) |
|
Other assets |
|
|
(18 |
) |
|
(288 |
) |
|
(293 |
) |
|
Accounts payable – trade |
|
|
994 |
|
|
(4,849 |
) |
|
(2,188 |
) |
|
Accrued liabilities |
|
|
3,618 |
|
|
(2,918 |
) |
|
(2,273 |
) |
|
Other long-term liabilities |
|
|
1,028 |
|
|
(178 |
) |
|
(198 |
) |
|
Deferred compensation |
|
|
105 |
|
|
(352 |
) |
|
(192 |
) |
|
Net cash provided by operating activities |
|
|
19,119 |
|
|
17,307 |
|
|
8,730 |
|
|
|
|
|
|
|
|
|
|
|
|
|
|
INVESTING ACTIVITIES: |
|
|
|
|
|
|
|
|
|
|
|
Purchases of investments |
|
|
(721 |
) |
|
(520 |
) |
|
(632 |
) |
|
Proceeds from sales of investments |
|
|
359 |
|
|
1,460 |
|
|
763 |
|
|
Proceeds from sale of capital assets |
|
|
34 |
|
|
676 |
|
|
74 |
|
|
Capital expenditures |
|
|
(1,251 |
) |
|
(1,203 |
) |
|
(1,228 |
) |
|
Net cash (used in) provided by investing activities |
|
|
(1,579 |
) |
|
413 |
|
|
(1,023 |
) |
|
|
|
|
|
|
|
|
|
|
|
|
|
FINANCING ACTIVITIES: |
|
|
|
|
|
|
|
|
|
|
|
Proceeds from (repayments of) short-term borrowings, net |
|
|
(10,000 |
) |
|
4,857 |
|
|
(1,913 |
) |
|
Repayment of long-term borrowings |
|
|
— |
|
|
(20,811 |
) |
|
(500 |
) |
|
Dividends paid |
|
|
(1,320 |
) |
|
(2,893 |
) |
|
(3,415 |
) |
|
Proceeds from issuance of common stock |
|
|
344 |
|
|
— |
|
|
62 |
|
|
Net cash used in financing activities |
|
|
(10,976 |
) |
|
(18,847 |
) |
|
(5,766 |
) |
|
|
|
|
|
|
|
|
|
|
|
|
|
Increase (decrease) in cash and cash equivalents |
|
|
6,564 |
|
|
(1,127 |
) |
|
1,941 |
|
|
Cash and cash equivalents at beginning of year |
|
|
1,714 |
|
|
2,841 |
|
|
900 |
|
|
Cash and cash equivalents at end of year |
|
$ |
8,278 |
|
$ |
1,714 |
|
$ |
2,841 |
|
|
|
|
FOR THE YEARS ENDED JUNE 30, |
| |||||||
|
|
|
2010 |
|
2009 |
|
2008 |
| |||
|
SUPPLEMENTAL INFORMATION CASH PAID DURING THE PERIOD FOR: |
|
|
|
|
|
|
|
|
|
|
|
Interest |
|
$ |
439 |
|
$ |
979 |
|
$ |
1,473 |
|
|
Income taxes paid (refunded) |
|
$ |
3,587 |
|
$ |
(62 |
) |
$ |
3,205 |
|
See accompanying Notes to Consolidated Financial Statements.
17
FLEXSTEEL INDUSTRIES, INC. AND SUBSIDIARIES
Notes to Consolidated Financial Statements
1. SUMMARY OF SIGNIFICANT ACCOUNTING POLICIES
DESCRIPTION OF BUSINESS – Flexsteel Industries, Inc. and subsidiaries (the “Company”) is one of the oldest and largest manufacturers, importers and marketers of residential and commercial upholstered and wooden furniture products in the country. The Company’s furniture products include a broad line of quality upholstered and wooden furniture for residential and commercial use. Product offerings include a wide variety of upholstered and wood furniture such as sofas, loveseats, chairs, reclining and rocker-reclining chairs, swivel rockers, sofa beds, convertible bedding units, occasional tables, desks, dining tables and chairs, bedroom furniture and home and commercial office furniture. The Company has one active wholly-owned subsidiary: DMI Furniture, Inc. (“DMI”), which is a Louisville, Kentucky-based, manufacturer, importer and marketer of residential and commercial office furniture with manufacturing and warehouses in Indiana and manufacturing sources in Asia; DMI’s divisions are WYNWOOD, Homestyles and DMI Commercial Office Furniture.
PRINCIPLES OF CONSOLIDATION – the consolidated financial statements include the accounts of Flexsteel Industries, Inc. and its wholly owned subsidiaries. All intercompany transactions and accounts have been eliminated in consolidation.
USE OF ESTIMATES – the preparation of consolidated financial statements in conformity with accounting principles generally accepted in the United States of America requires management to make estimates and assumptions that affect the amounts reported in the consolidated financial statements and accompanying notes. Ultimate results could differ from those estimates.
FAIR VALUE – the Company’s cash, accounts receivable, other assets, accounts payable, accrued liabilities, and other liabilities are carried at amounts which reasonably approximate their fair value due to their short-term nature. Generally accepted accounting principles on fair value measurement for certain financial assets and liabilities requires that each asset and liability carried at fair value be classified into one of the following categories: Level 1: Quoted market prices in active markets for identical assets and liabilities; Level 2: Observable market based inputs or unobservable inputs that are corroborated by market data; or Level 3: Unobservable inputs that are not corroborated by market data. The Company has not changed its valuation techniques in measuring the fair value of any financial assets and liabilities during the period.
CASH EQUIVALENTS – the Company considers highly liquid investments with original maturities of three months or less as the equivalent of cash.
ALLOWANCE FOR DOUBTFUL ACCOUNTS – the Company establishes an allowance for doubtful accounts through review of open accounts, and historical collection and allowances amounts. The allowance for doubtful accounts is intended to reduce trade accounts receivable to the amount that reasonably approximates their net realizable fair value due to their short-term nature. The amount ultimately realized from trade accounts receivable may differ from the amount estimated in the consolidated financial statements based on collection experience and actual returns and allowances.
INVENTORIES – are stated at the lower of cost or market. Raw steel is valued on the last-in, first-out (“LIFO”) method. Other inventories are valued on the first-in, first-out (“FIFO”) method.
PROPERTY, PLANT AND EQUIPMENT – is stated at cost and depreciated using the straight-line method over the estimated useful lives of the assets. For internal use software, the Company’s policy is to capitalize external direct costs of materials and services, directly related internal payroll and payroll-related costs, and interest costs. These costs are amortized using the straight-line method over the useful lives.
VALUATION OF LONG–LIVED ASSETS – the Company periodically reviews the carrying value of long-lived assets and estimated depreciable or amortizable lives for continued appropriateness. This review is based upon projections of anticipated future cash flows and is performed whenever events or changes in circumstances indicate that asset carrying values may not be recoverable or that the estimated depreciable or amortizable lives may have changed. These evaluations could result in a change in estimated useful lives in future periods.
18
WARRANTY – the Company estimates the amount of warranty claims on sold product that may be incurred based on current and historical data. The actual warranty expense could differ from the estimates made by the Company based on product performance.
REVENUE RECOGNITION – is upon delivery of product to the Company’s customer and collectibility is reasonably assured. The Company’s ordering process creates persuasive evidence of the sale arrangement and the sales amount is determined. The delivery of the goods to the customer completes the earnings process. Net sales consist of product sales and related delivery charge revenue, net of adjustments for returns and allowances. Shipping and handling costs are included in cost of goods sold.
ADVERTISING COSTS – are charged to selling, general and administrative expense in the periods incurred. The Company conducts no direct-response advertising programs and there are no assets related to advertising recorded on the consolidated balance sheet. Advertising expenditures, primarily shared customer advertising in which an identifiable benefit is received and national trade-advertising programs, were approximately $4.1 million, $4.5 million and $4.6 million in fiscal 2010, 2009 and 2008, respectively.
DESIGN, RESEARCH AND DEVELOPMENT COSTS – are charged to selling, general and administrative expense in the periods incurred. Expenditures for design, research and development costs were approximately $2.0 million, $2.7 million and $3.1 million in fiscal 2010, 2009 and 2008, respectively.
INSURANCE – the Company is self-insured for health care and most workers’ compensation up to predetermined amounts above which third party insurance applies. The Company purchases specific stop-loss insurance for individual health care claims in excess of $150,000 per plan year, with a $1.0 million individual lifetime maximum. For workers’ compensation the Company retains the first $350,000 per claim and purchases excess coverage up to the statutory limits for amounts in excess of the retention limit. Losses are accrued based upon the Company’s estimates of the aggregate liability for claims incurred using certain actuarial assumptions followed in the insurance industry and based on Company experience. The Company records these insurance accruals within the accrued liabilities insurance account on the consolidated balance sheets.
INCOME TAXES – the Company uses the liability method of accounting for income taxes. Under this method, deferred tax assets and liabilities are determined based on differences between the financial reporting and tax bases of assets and liabilities and are measured using the enacted tax rates and laws that will be in effect when the differences are expected to reverse. The Company recognizes in its financial statements the tax benefit from an uncertain tax position only if it is more likely than not that the tax position will be sustained on examination by the taxing authorities, based on the technical merits of the position.
EARNINGS (LOSS) PER SHARE – basic earnings (loss) per share of common stock is based on the weighted-average number of common shares outstanding during each fiscal year. Diluted earnings per share of common stock includes the dilutive effect of potential common shares outstanding. The Company’s only potential common shares outstanding are stock options and shares associated with the long-term management incentive compensation plan, which resulted in a dilutive effect of 89,403 shares and 37,137 shares in fiscal 2010 and 2008, respectively. No long-term management incentive shares were granted in fiscal 2008. The Company calculates the dilutive effect of outstanding options using the treasury stock method. The dilutive effect of 42,539 shares of stock options is excluded in fiscal 2009 because the net loss caused the effect of the options to be anti-dilutive. Options to purchase 716,939 shares, 759,689 shares and 567,411 shares of common stock were outstanding in fiscal 2010, 2009 and 2008, respectively, but were not included in the computation of diluted earnings per share as their exercise prices were greater than the average market price of the common shares.
STOCK–BASED COMPENSATION – the Company recognizes compensation expense related to the cost of employee services received in exchange for Company equity interests based on the award’s fair value at the date of grant. See Note 8 Stock-Based Compensation.
ACCOUNTING DEVELOPMENTS – no accounting pronouncements have been adopted or have become effective during fiscal 2010 that impact the Company.
19
2. INVENTORIES
Inventories valued on a LIFO basis (principally steel) would have been approximately $1.7 million and $2.2 million higher at June 30, 2010 and 2009, respectively, if they had been valued on a FIFO basis. At June 30, 2010 and 2009 the total value of LIFO inventory was $2.3 million and $1.8 million, respectively. During 2009, inventory levels were reduced resulting in a liquidation of LIFO inventory quantities carried at lower costs prevailing in prior years as compared with the cost of 2009 purchases, the effect of which decreased cost of goods sold by approximately $0.8 million. There was no material liquidation of LIFO inventory in 2010 and 2008. A comparison of inventories is as follows (in thousands):
|
|
|
|
|
June 30, |
| ||||
|
|
|
|
|
2010 |
|
2009 |
| ||
|
Raw materials |
|
|
|
$ |
9,696 |
|
$ |
9,832 |
|
|
Work in process and finished parts |
|
|
|
|
4,943 |
|
|
5,124 |
|
|
Finished goods |
|
|
|
|
57,998 |
|
|
58,888 |
|
|
Total |
|
|
|
$ |
72,637 |
|
$ |
73,844 |
|
3. PROPERTY, PLANT AND EQUIPMENT
|
(in thousands) |
|
Estimated |
|
June 30, |
| ||||
|
|
|
Life (Years) |
|
2010 |
|
2009 |
| ||
|
Land |
|
|
|
$ |
3,984 |
|
$ |
3,984 |
|
|
Buildings and improvements |
|
5-39 |
|
|
40,248 |
|
|
40,857 |
|
|
Machinery and equipment |
|
3-7 |
|
|
28,251 |
|
|
28,894 |
|
|
Delivery equipment |
|
3-5 |
|
|
18,269 |
|
|
18,872 |
|
|
Furniture and fixtures |
|
3-7 |
|
|
4,291 |
|
|
4,095 |
|
|
Total |
|
|
|
|
95,043 |
|
|
96,702 |
|
|
Less accumulated depreciation |
|
|
|
|
(73,429 |
) |
|
(73,404 |
) |
|
Net |
|
|
|
$ |
21,614 |
|
$ |
23,298 |
|
4. OTHER ASSETS
|
(in thousands) |
|
|
|
June 30, |
| ||||
|
|
|
|
|
2010 |
|
2009 |
| ||
|
Cash value of life insurance |
|
|
|
$ |
6,560 |
|
$ |
6,520 |
|
|
Rabbi Trust assets (see Note 9) |
|
|
|
|
4,683 |
|
|
4,259 |
|
|
Other |
|
|
|
|
14 |
|
|
36 |
|
|
Total |
|
|
|
$ |
11,257 |
|
$ |
10,815 |
|
5. ACCRUED LIABILITIES – OTHER
|
(in thousands) |
|
|
|
June 30, |
| ||||
|
|
|
|
|
2010 |
|
2009 |
| ||
|
Dividends |
|
|
|
$ |
332 |
|
$ |
329 |
|
|
Income taxes |
|
|
|
|
1,445 |
|
|
— |
|
|
Advertising |
|
|
|
|
2,200 |
|
|
1,951 |
|
|
Warranty |
|
|
|
|
980 |
|
|
850 |
|
|
Other |
|
|
|
|
2,002 |
|
|
1,965 |
|
|
Total |
|
|
|
$ |
6,959 |
|
$ |
5,095 |
|
6. BORROWINGS AND CREDIT ARRANGEMENTS
The Company maintains a credit agreement which provides short-term working capital financing up to $15.0 million with interest of LIBOR plus 1% including $10.0 million of letters of credit availability. No amounts were outstanding at June 30, 2010 under the working capital facility. The credit agreement contains financial covenants. The primary covenant is an interest coverage ratio of 3.0 to 1.0. The ratio is computed as net (loss) income plus interest expense and stock-based compensation expense less dividends divided by interest expense. In addition, the Company must maintain working capital of $60 million. At June 30, 2010, the Company was in compliance with all of the financial covenants contained in the credit agreement. The Company is contingently liable to insurance carriers under its comprehensive general, product, and vehicle liability policies, as well as some workers’ compensation, and has provided letters of credit in the amount of $2.6 million.
20
An officer of the Company is a director at a bank where the Company maintains an unsecured $5.0 million line of credit, cumulative letter of credit facilities and where its routine daily banking transactions are processed. In addition, the Rabbi Trust assets (Note 9) are administered by this bank’s trust department. The Company is contingently liable to insurance carriers under its comprehensive general, product, and vehicle liability policies, as well as some workers’ compensation, and has provided letters of credit in the amount of $0.7 million. The Company receives no special services or pricing on the services performed by the bank due to the directorship of this officer. No amount was outstanding on the line of credit at prime minus 1.0% at June 30, 2010.
At June 30, 2009, $10 million was outstanding under the Company’s former credit facility.
7. INCOME TAXES
In determining the provision for income taxes, the Company uses an estimated annual effective tax rate that is based on the annual income (loss), statutory tax rates and tax planning opportunities available in the various jurisdictions in which the Company operates. This includes recognition of deferred tax assets and liabilities for the expected future tax consequences of events that have been included in the financial statements or tax returns to the extent pervasive evidence exists that they will be realized in future periods. The deferred tax balances are adjusted to reflect tax rates by tax jurisdiction, based on currently enacted tax laws, which are expected to be in effect in the years in which the temporary differences are expected to reverse. In accordance with the Company’s income tax policy, significant or unusual items are separately recognized when they occur.
The components of the gross liabilities related to unrecognized tax benefits and the related deferred tax assets are as follows (in thousands):
|
|
|
June 30, |
| ||||
|
|
|
2010 |
|
2009 |
| ||
|
Gross unrecognized tax benefits |
|
$ |
995 |
|
$ |
404 |
|
|
Accrued Interest and penalties |
|
|
215 |
|
|
161 |
|
|
Gross liabilities related to unrecognized tax benefits |
|
$ |
1,210 |
|
$ |
565 |
|
|
|
|
|
|
|
|
|
|
|
Deferred tax assets |
|
$ |
230 |
|
$ |
164 |
|
A reconciliation of the beginning and ending amount of unrecognized tax benefits is as follows (in thousands):
|
Balance at June 30, 2008 |
|
$ |
549 |
|
|
Reduction based on tax positions related to fiscal year 2009 |
|
|
(145 |
) |
|
Balance at June 30, 2009 |
|
|
404 |
|
|
Addition based on tax positions related to the current year |
|
|
591 |
|
|
Balance at June 30, 2010 |
|
$ |
995 |
|
The Company records interest and penalties related to income taxes as income tax expense in the Consolidated Statements of Operations. As of June 30, 2010 and 2009, the Company had approximately $0.2 million of accrued interest and penalties related to uncertain tax positions. The total income tax provision in fiscal years 2010, 2009 and 2008 was 38.1%, 41.5% and 35.8%, respectively, of income (loss) before income taxes. The Company does not expect that there will be any positions for which it is reasonably possible that the total amounts of unrecognized tax benefits will significantly increase or decrease within the next twelve months.
The income tax provision (benefit) is as follows for the years ended June 30 (in thousands):
|
|
|
2010 |
|
2009 |
|
2008 |
| |||
|
Federal – current |
|
$ |
6,630 |
|
$ |
(1,410 |
) |
$ |
1,510 |
|
|
State – current |
|
|
975 |
|
|
(110 |
) |
|
270 |
|
|
Deferred |
|
|
(955 |
) |
|
450 |
|
|
580 |
|
|
Total |
|
$ |
6,650 |
|
$ |
(1,070 |
) |
$ |
2,360 |
|
21
A reconciliation between the U.S. federal statutory tax rate and the effective tax rate is as follows for the years ended June 30:
|
|
|
2010 |
|
2009 |
|
2008 |
| |||
|
Federal statutory tax rate |
|
|
35.0 |
% |
|
34.0 |
% |
|
34.0 |
% |
|
State taxes, net of federal effect |
|
|
3.7 |
|
|
2.7 |
|
|
2.7 |
|
|
Other |
|
|
(0.6 |
) |
|
4.8 |
|
|
(0.9 |
) |
|
Effective tax rate |
|
|
38.1 |
% |
|
41.5 |
% |
|
35.8 |
% |
Although the Company’s effective full year tax expense rate has historically ranged from 35% to 39%, fiscal year ended June 30, 2009 reflects an effective income tax benefit rate of 41.5% due to losses or low level of earnings in various tax jurisdictions.
The primary components of deferred tax assets and (liabilities) are as follows (in thousands):
|
|
June 30, 2010 |
|
June 30, 2009 |
| ||||||||
|
|
Current |
|
Long-term |
|
Current |
|
Long-term |
| ||||
|
Accounts receivable |
$ |
750 |
|
$ |
— |
|
$ |
650 |
|
$ |
— |
|
|
Inventory |
|
1,100 |
|
|
— |
|
|
1,180 |
|
|
— |
|
|
Self insurance |
|
690 |
|
|
— |
|
|
780 |
|
|
— |
|
|
Employee benefits |
|
680 |
|
|
— |
|
|
700 |
|
|
— |
|
|
Accrued expenses |
|
830 |
|
|
— |
|
|
650 |
|
|
— |
|
|
Property, plant and equipment |
|
— |
|
|
(340 |
) |
|
— |
|
|
(570 |
) |
|
Deferred compensation |
|
— |
|
|
2,280 |
|
|
— |
|
|
1,900 |
|
|
Other |
|
— |
|
|
1,070 |
|
|
— |
|
|
815 |
|
|
Total |
$ |
4,050 |
|
$ |
3,010 |
|
$ |
3,960 |
|
$ |
2,145 |
|
The Company is subject to U.S. federal income tax as well as income tax of multiple state and foreign jurisdictions. Generally, tax years 2006–2010 remain open to examination by the Internal Revenue Service or other taxing jurisdictions to which we are subject.
8. STOCK-BASED COMPENSATION
The Company has two stock-based compensation methods available when determining employee compensation.
|
(1) |
2007 Long-Term Management Incentive Compensation Plan – The plan provides for shares of common stock and cash to be awarded to officers and key employees based on performance targets set by the Nominating and Compensation Committee of the Board of Directors (the “Committee”). The Company’s shareholders approved 500,000 shares to be issued under the plan. No shares have been issued as of June 30, 2010. The Committee selected consolidated operating results for organic net sales growth and fully-diluted earnings per share for the three-year performance periods beginning July 1, 2008 and ending on June 30, 2011, beginning July 1, 2009 and ending on June 30, 2012, and beginning July 1, 2010 and ending on June 30, 2013. The Committee has also specified that payouts, if any, for awards earned under the fiscal years 2009-2011, 2010-2012 and 2011-2013 performance periods will be 60% stock and 40% cash. Awards will be paid to participants as soon as practicable following the end of the performance periods and verification of results. The compensation cost related to the number of shares to be granted under each performance period is fixed on the grant date, which is the date the performance period begins. The compensation cost related to the cash portion of the award is re-measured based on the award’s estimated fair value at the end of each reporting period. The accrual is based on the probable outcomes of the performance conditions. The portion of the accrued award payable in stock is classified within equity and the portion of the accrued award payable in cash is classified within other long-term liabilities. At June 30, 2010, the Company has accrued $0.9 million for estimated awards of stock and cash under the long-term incentive plan. No compensation costs were accrued at June 30, 2009. |
22
|
|
At the date of grant, the aggregate number of shares and cash that could be awarded to key executives if the minimum, target and maximum performance goals are met are as follows (in thousands): |
|
|
|
At Minimum |
|
At Target |
|
At Maximum | |||||||||
|
Performance Period |
|
Stock |
|
Cash |
|
Stock |
|
Cash |
|
Stock |
|
Cash | |||
|
Fiscal Year 2009 – 2011 |
|
16 |
|
$ |
117 |
|
45 |
|
$ |
335 |
|
72 |
|
$ |
536 |
|
Fiscal Year 2010 – 2012 |
|
20 |
|
$ |
114 |
|
58 |
|
$ |
325 |
|
93 |
|
$ |
520 |
|
Fiscal Year 2011 – 2013 |
|
17 |
|
$ |
122 |
|
48 |
|
$ |
349 |
|
76 |
|
$ |
558 |
|
|
If the target performance goals would be achieved, the total amount of compensation cost recognized over the requisite service periods would be $0.8 million (2009-2011), $0.9 million (2010-2012) and $0.9 million (2011-2013) based on the estimated fair values at June 30, 2010. |
|
(2) |
Stock Option Plans – The stock option plans for key employees and directors provide for the granting of incentive and nonqualified stock options. Under the plans, options are granted at an exercise price equal to the fair market value of the underlying common stock at the date of grant, and may be exercisable for up to 10 years. All options are exercisable when granted. |
|
|
|
|
|
In fiscal years 2010, 2009 and 2008, the Company issued options for 165,000, 265,000 and 120,000 common shares at weighted average exercise prices of $8.43, $6.82 and $12.40 (the fair market value on the date of grant), respectively. The options were immediately available for exercise and may be exercised for a period of 10 years. The Company recorded compensation expense of $0.3 million, $0.1 million and $0.2 million during fiscal years 2010, 2009 and 2008, respectively. The assumptions used in determining the compensation expense are discussed below. |
|
|
|
|
|
The fair value of each option grant is estimated on the date of grant using the Black-Scholes option-pricing model with the following weighted-average assumptions used for grants in fiscal 2010, 2009 and 2008, respectively; dividend yield of 2.4%, 7.6% and 4.2%, expected volatility of 25.3%, 21.8% and 19.5%; risk-free interest rate of 2.2%, 1.6% and 3.3%; and an expected life of 5, 6 and 5 years, respectively. The expected volatility and expected life are determined based on historical data. |
|
|
|
|
|
The weighted-average grant date fair value of stock options granted during fiscal years 2010, 2009 and 2008 was $1.64, $0.45 and $1.55, respectively. The cash proceeds, income tax benefit and aggregate intrinsic value of options (the amount by which the market price of the stock on the date of exercise exceeded the market price of stock on the date of grant) exercised during the fiscal years ended June 30, 2010, 2009 and 2008, respectively, were not material. |
|
|
|
|
|
At June 30, 2010, 508,950 shares were available for future grants. It is the Company’s policy to issue new shares upon exercise of stock options. The Company accepts shares of the Company’s common stock as payment for the exercise price of options. These shares received as payment are retired upon receipt. |
|
|
|
|
|
A summary of the status of the Company’s stock option plans as of June 30, 2010, 2009 and 2008 and the changes during the years then ended is presented below: |
|
|
|
Shares |
|
|
Weighted Average |
|
|
Aggregate |
|
|
Outstanding and exercisable at June 30, 2008 |
|
893 |
|
$ |
15.05 |
|
$ |
0 |
|
|
Granted |
|
265 |
|
|
6.82 |
|
|
|
|
|
Exercised |
|
(4 |
) |
|
6.81 |
|
|
|
|
|
Canceled |
|
(134 |
) |
|
14.93 |
|
|
|
|
|
Outstanding and exercisable at June 30, 2009 |
|
1,020 |
|
|
12.94 |
|
|
407 |
|
|
Granted |
|
165 |
|
|
8.43 |
|
|
|
|
|
Exercised |
|
(99 |
) |
|
7.52 |
|
|
|
|
|
Canceled |
|
(34 |
) |
|
13.40 |
|
|
|
|
|
Outstanding and exercisable at June 30, 2010 |
|
1,052 |
|
$ |
12.70 |
|
$ |
1,168 |
|
23
The following table summarizes information for options outstanding and exercisable at June 30, 2010:
|
|
|
|
|
|
Weighted Average |
| ||||
|
Range of |
|
Options Outstanding |
|
|
Remaining |
|
Exercise |
| ||
|
|
$ 6.81 – 10.75 |
|
342 |
|
|
8.7 |
|
|
$ 7.58 |
|
|
|
12.35 – 13.59 |
|
231 |
|
|
7.0 |
|
|
12.51 |
|
|
|
14.40 – 16.52 |
|
356 |
|
|
4.3 |
|
|
15.44 |
|
|
|
19.21 – 20.27 |
|
123 |
|
|
3.4 |
|
|
19.34 |
|
|
|
$ 6.81 – 20.27 |
|
1,052 |
|
|
6.2 |
|
|
$12.70 |
|
9. BENEFIT AND RETIREMENT PLANS
The Company sponsors various defined contribution pension and retirement plans, which cover substantially all employees, other than employees covered by multi-employer pension plans under collective bargaining agreements. Total pension and retirement plan expense was $1.5 million, $1.8 million and $2.0 million in fiscal years 2010, 2009 and 2008. The amounts include $0.4 million in fiscal year 2010 and $0.5 million in each of the fiscal years 2009 and 2008, for the Company’s matching contribution to retirement savings plans. The Company’s cost for pension plans is generally determined as 2% - 6% of each covered employee’s wages. The Company’s matching contribution for the retirement savings plans is generally 25% - 50% of employee contributions (up to 4% of employee earnings).
In addition to the above, amounts charged to pension expense and contributed to multi-employer defined benefit pension plans administered by others under collective bargaining agreements were $0.5 million, $0.5 million and $0.8 million in fiscal 2010, 2009 and 2008, respectively. The cumulative cost to exit the Company’s multi-employer plans was approximately $7.3 million on June 30, 2010.
The Company has unfunded deferred compensation plans with executive officers. The plans require various annual contributions for the participants based upon compensation levels and age. All participants are fully vested. For fiscal 2010, 2009 and 2008, the benefit obligation was increased by interest expense of $0.2 million, $0.1 million and $0.3 million, service costs of $0.3 million, $0.2 million and $0.3 million, and decreased by payments of $0.4 million, $0.6 million and $0.8 million, respectively. At June 30, 2010 and 2009, the deferred compensation liability was $5.1 million and $5.0 million, respectively. Funds of the deferred compensation plans are held in a Rabbi Trust. The assets held in the Rabbi Trust are not available for general corporate purposes. The Rabbi Trust is subject to creditor claims in the event of insolvency, but otherwise must be used only for purposes of providing benefits under the plans. As of June 30, 2010, the Company’s deferred compensation plan assets, held in the Rabbi Trust, were invested in stock and bond funds. As of June 30, 2010 and 2009, the fair market value of the assets held in the Rabbi Trust were $4.7 million and $4.3 million, respectively, and are classified as “Other Assets” in the Consolidated Balance Sheets. These assets are classified as Level 2 in accordance with fair value accounting as discussed in Note 1.
Under provisions of the Company’s Voluntary Deferred Compensation Plan, executive officers may defer common stock awards received as participants of the 2007 Long-Term Incentive Plan until retirement. Under the plan, no shares were deferred during the fiscal years ended June 30, 2010 and 2009. At June 30, 2010 and 2009, 42,094 shares and 47,322 shares with an award date value of $0.6 million and $0.7 million, respectively, had been deferred and are being held on behalf of the employees. Under the plan, 5,228 shares and 6,253 shares were distributed in fiscal years 2010 and 2009, respectively.
The Company’s defined benefit pension plan covers 56 active hourly production employees of DMI. There are a total of 456 participants in the plan. Retirement benefits are based on years of credited service multiplied by a dollar amount negotiated under collective bargaining agreements. The Company’s policy is to fund normal costs and amortization of prior service costs at a level that is equal to or greater than the minimum required under the Employee Retirement Income Security Act of 1974 (ERISA). According to an agreement reached with the collective bargaining unit, all benefits and participants are fixed. Future benefits will accrue to current participants; however, new participants cannot be added to the plan. As of June 30, 2010 and 2009, the Company recorded an accrued benefit liability related to the funded status of the defined benefit pension plan recognized on the Company’s consolidated balance sheets in other long-term liabilities of $2.4 million and $1.8 million, respectively. The accumulated benefit obligation was $6.6 million and $5.7 million at fiscal years ended June 30, 2010 and 2009, respectively. The Company recorded expense of $0.2 million, $0 and $0 during fiscal years 2010, 2009 and 2008, respectively, related to the plan.
24
10. COMPREHENSIVE INCOME (LOSS)
The components of comprehensive income (loss), net of income taxes, for the years ended June 30, were as follows (in thousands):
|
|
|
2010 |
|
2009 |
|
2008 |
| |||
|
Net income (loss) |
|
$ |
10,801 |
|
$ |
(1,509 |
) |
$ |
4,236 |
|
|
Other comprehensive income (loss) (OCI): |
|
|
|
|
|
|
|
|
|
|
|
Change in fair value of derivatives, net of income taxes of $(109), $5 and $176, respectively |
|
|
177 |
|
|
(1 |
) |
|
(273 |
) |
|
Change in fair value of available-for-sale, Securities, net of income taxes of $(24), $631, $54, respectively |
|
|
39 |
|
|
(1,022 |
) |
|
(84 |
) |
|
Change in minimum pension liability, net of income taxes of $124, $595 and $321, respectively |
|
|
(204 |
) |
|
(969 |
) |
|
(524 |
) |
|
Total other comprehensive income (loss) |
|
|
12 |
|
|
(1,992 |
) |
|
(881 |
) |
|
Total comprehensive income (loss) |
|
$ |
10,813 |
|
$ |
(3,501 |
) |
$ |
3,355 |
|
The components of accumulated other comprehensive loss, net of income taxes, are as follows (in thousands):
|
|
June 30, |
| ||||
|
|
2010 |
|
2009 |
| ||
|
Available-for-sale securities |
$ |
(11 |
) |
$ |
(47 |
) |
|
Interest rate swaps |
|
— |
|
|
(180 |
) |
|
Pension and other post-retirement benefit adjustments |
|
(1,741 |
) |
|
(1,537 |
) |
|
Total accumulated other comprehensive loss |
$ |
(1,752 |
) |
$ |
(1,764 |
) |
11. LITIGATION
From time to time, the Company is subject to various legal proceedings, including lawsuits, which arise out of, and are incidental to, the conduct of the Company’s business. The Company does not consider any of such proceedings that are currently pending, individually or in the aggregate, to be material to its business or likely to result in a material adverse effect on its consolidated operating results, financial condition, or cash flows.
12. COMMITMENTS AND CONTINGENCIES
FACILITY LEASES – the Company leases certain facilities and equipment under various operating leases. These leases require the Company to pay the lease cost, operating costs, including property taxes, insurance, and maintenance. Total lease expense related to the various operating leases was approximately $3.4 million, $4.3 million and $4.0 million in fiscal 2010, 2009 and 2008, respectively.
Expected future minimum commitments under operating leases as of June 30, 2010 were as follows (in thousands):
|
Fiscal Year Ended June 30, | ||
|
2011 |
$ |
1,730 |
|
2012 |
|
1,504 |
|
2013 |
|
1,148 |
|
2014 |
|
748 |
|
2015 |
|
165 |
|
Thereafter |
|
— |
|
|
$ |
5,295 |
13. FACILITY CONSOLIDATION COSTS
During fiscal year ended June 30, 2009, the Company recorded charges for facility consolidation and related costs of $2.6 million. The charges represent employee separation costs of $2.0 million and facility closing costs of $0.6 million with no future benefit to the Company. At June 30, 2009, there were no facility consolidation liabilities remaining.
25
14. SEGMENTS
The Company operates in one reportable operating segment, furniture products. Our operations involve the distribution of manufactured and imported furniture for residential and commercial markets. The Company’s furniture products are sold primarily throughout the United States by the Company’s internal sales force and various independent representatives. The Company makes minimal export sales. No single customer accounted for more than 10% of net sales.
Set forth below is information for the past three fiscal years showing the Company’s net sales attributable to each of the areas of application (in thousands):
|
|
|
FOR THE YEARS ENDED JUNE 30, |
| |||||||
|
|
|
2010 |
|
2009 |
|
2008 |
| |||
|
Residential |
|
$ |
246,041 |
|
$ |
230,727 |
|
$ |
258,084 |
|
|
Commercial |
|
|
80,425 |
|
|
93,431 |
|
|
147,571 |
|
|
|
|
$ |
326,466 |
|
$ |
324,158 |
|
$ |
405,655 |
|
15. SUPPLEMENTARY QUARTERLY FINANCIAL INFORMATION – UNAUDITED
|
(in thousands, except per share amounts) |
|
FOR THE QUARTER ENDED | ||||||||||
|
|
|
September 30 |
|
December 31 |
|
March 31 |
|
June 30 | ||||
|
Fiscal 2010: |
|
|
|
|
|
|
|
|
|
|
|
|
|
Net sales |
|
$ |
75,941 |
|
$ |
83,524 |
|
$ |
81,451 |
|
$ |
85,550 |
|
Gross margin |
|
|
16,556 |
|
|
20,041 |
|
|
18,033 |
|
|
20,151 |
|
Net income |
|
|
1,380 |
|
|
2,964 |
|
|
2,320 |
|
|
4,137 |
|
Earnings per share: |
|
|
|
|
|
|
|
|
|
|
|
|
|
Basic |
|
$ |
0.21 |
|
$ |
0.45 |
|
$ |
0.35 |
|
$ |
0.62 |
|
Diluted |
|
$ |
0.21 |
|
$ |
0.45 |
|
$ |
0.34 |
|
$ |
0.61 |
|
(in thousands, except per share amounts) |
|
FOR THE QUARTER ENDED | ||||||||||
|
|
|
September 30 |
|
December 31 |
|
March 31 |
|
June 30 | ||||
|
Fiscal 2009: |
|
|
|
|
|
|
|
|
|
|
|
|
|
Net sales |
|
$ |
91,417 |
|
$ |
84,550 |
|
$ |
73,627 |
|
$ |
74,564 |
|
Gross margin |
|
|
17,136 |
|
|
16,131 |
|
|
12,168 |
|
|
15,639 |
|
Net (loss) income (1) |
|
|
(749 |
) |
|
296 |
|
|
(1,854 |
) |
|
798 |
|
(Loss) earnings per share: |
|
|
|
|
|
|
|
|
|
|
|
|
|
Basic |
|
$ |
(0.11 |
) |
$ |
0.04 |
|
$ |
(0.28 |
) |
$ |
0.12 |
|
Diluted |
|
$ |
(0.11 |
) |
$ |
0.04 |
|
$ |
(0.28 |
) |
$ |
0.12 |
|
(1) |
The quarters ended September 30, 2008, December 31, 2008, March 31, 2009 and June 30, 2009 include facility consolidation and other charges after-tax of $0.8 million or $0.13 per share, $0.3 million or $0.05 per share, $0.3 million or $0.05 per share and $0.1 million or $0.02 per share, respectively. |
Item 9. Changes in and Disagreements with Accountants on Accounting and Financial Disclosure
None.
Item 9A. Controls and Procedures
Evaluation of disclosure controls and procedures – Based on their evaluation as of the end of the period covered by this Annual Report on Form 10-K, the Company’s Chief Executive Officer (“CEO”) and Chief Financial Officer (“CFO”) have concluded that the Company’s disclosure controls and procedures (as defined in Rules 13a-15(e) or 15d-15(e)) under the Securities Act of 1934, as amended) were effective as of June 30, 2010.
26
Changes in internal control over financial reporting – During the quarter ended June 30, 2010, there was no change in the Company’s internal control over financial reporting (as defined in Rule 13a-15(f) under the Securities Exchange Act of 1934) that has materially affected, or is reasonably likely to materially affect the Company’s internal control over financial reporting.
Management’s Annual Report on Internal Control Over Financial Reporting – Management is responsible for establishing and maintaining adequate internal control over financial reporting, as such term is defined in Rules 13a-15(f) or 15d-15(f) of the Securities Exchange Act of 1934, as amended. We performed an evaluation under the supervision and with the participation of our management, including the CEO and CFO, to assess the effectiveness of the design and operation of our disclosure controls and procedures under the Exchange Act as of June 30, 2010. In making this assessment, we used the criteria set forth by the Committee of Sponsoring Organizations of the Treadway Commission in Internal Control — Integrated Framework. Based on that criteria, management concluded that the internal control over financial reporting is effective as of June 30, 2010.
Deloitte & Touche LLP, the independent registered public accounting firm that has audited our consolidated financial statements included in this Annual Report on Form 10-K, has issued their attestation report on our internal control over financial reporting, a copy of which is included in this Annual Report on Form 10-K.
Item 9B. Other Information
None.
PART III
Item 10. Directors, Executive Officers and Corporate Governance
The information contained in the Company’s 2010 definitive proxy statement to be filed with the Securities and Exchange Commission under the sections captioned “Proposal 1 Election of Directors,” “Corporate Governance – Audit and Ethics Committee” and “Section 16(a) Beneficial Ownership Reporting Compliance” is incorporated herein by reference.
The Company has adopted a code of ethics called the Guidelines for Business Conduct that applies to the Company’s employees, including the principal executive officer, principal financial officer, principal accounting officer or controller, and persons performing similar functions. A copy of the code of ethics is posted on our website at www.flexsteel.com.
The executive officers of the Company, their ages, positions (in each case as of June 30, 2010), and the year they were first elected or appointed an officer of the registrant, are as follows:
|
Name (age) |
|
Position (date first became officer) |
|
Ronald J. Klosterman (62) |
|
President & Chief Executive Officer (1989) |
|
James R. Richardson (66) |
|
Senior Vice President of Residential Sales and Marketing (1979) |
|
Thomas D. Burkart (67) |
|
Senior Vice President of Vehicle Seating (1984) |
|
Patrick M. Crahan (62) |
|
Senior Vice President of Commercial Seating (1989) |
|
Jeffrey T. Bertsch (55) |
|
Senior Vice President of Corporate Services (1989) |
|
Donald D. Dreher (61) |
|
Senior Vice President (2004), President & CEO of DMI Furniture, Inc. (1986) |
|
James E. Gilbertson (60) |
|
Vice President of Vehicle Seating (1989) |
|
Timothy E. Hall (52) |
|
Vice President-Finance, Chief Financial Officer, Secretary & Treasurer (2000) |
Item 11. Executive Compensation
The information contained in the Company’s 2010 definitive proxy statement to be filed with the Securities and Exchange Commission under the sections captioned “Executive Compensation,” and “Director Compensation,” is incorporated herein by reference.
27
Item 12. Security Ownership of Certain Beneficial Owners and Management and Related Stockholder Matters
The information contained in the Company’s 2010 definitive proxy statement to be filed with the Securities and Exchange Commission under the sections captioned “Ownership of Stock By Directors and Executive Officers,” “Ownership of Stock by Certain Beneficial Owners,” and “Equity Compensation Plan Information” is incorporated herein by reference.
Item 13. Certain Relationships and Related Transactions, and Director Independence
This information contained under the sections “Interest of Management and Others in Certain Transactions” and “Corporate Governance – Board of Directors” in the Company’s 2010 definitive proxy statement to be filed with the Securities and Exchange Commission is incorporated herein by reference.
Item 14. Principal Accountant Fees and Services
Deloitte & Touche LLP was the Company’s independent registered public accounting firm in fiscal 2010. In addition to performing the audit of the Company's consolidated financial statements, Deloitte & Touche LLP provided various audit-related services during fiscal 2010.
The Audit and Ethics Committee pre-approves both the type of services to be provided by Deloitte & Touche LLP and the estimated fees related to these services. The Audit and Ethics Committee reviewed professional services and the possible effect on Deloitte & Touche LLP’s independence was considered. The Audit and Ethics Committee has considered and found the provision of services for non-audit services compatible with maintaining Deloitte & Touche LLP’s independence. All services provided by Deloitte & Touche LLP during fiscal 2010 were pre-approved by the Audit and Ethics Committee.
The aggregate fees billed were $0.4 million in each of the fiscal years 2010 and 2009. Professional fees and expenses for audit of financial statements and internal control over financial reporting services for fiscal 2010 and 2009, as applicable, and consisted of (i) audit of the Company’s annual consolidated financial statements; (ii) reviews of the Company’s quarterly consolidated financial statements; (iii) employee benefit plan audits; (iv) consents and other services related to Securities and Exchange Commission matters; and (v) consultations on financial accounting and reporting matters arising during the course of the audit and reviews.
PART IV
Item 15. Exhibits, Financial Statement Schedules, and Reports on Form 8-K
|
(a) |
(1) Financial Statements |
|
|
|
|
|
The financial statements of the Company are set forth above in Item 8. |
|
|
|
|
|
(2) Schedules |
The following financial statement schedules for the years ended June 30, 2010, 2009 and 2008 are submitted herewith:
SCHEDULE II
RESERVES
For the Years Ended June 30, 2010, 2009 and 2008
|
|
|
|
|
|
|
|
|
|
|
|
|
|
|
|
|
|
Description |
|
Balance at |
|
Additions |
|
Deductions |
|
Balance at |
| ||||
|
|
Allowance for Doubtful Accounts: |
|
|
|
|
|
|
|
|
|
|
|
|
|
|
|
2010 |
|
$ |
1,760,000 |
|
$ |
920,000 |
|
$ |
(660,000 |
) |
$ |
2,020,000 |
|
|
|
2009 |
|
$ |
2,110,000 |
|
$ |
1,240,000 |
|
$ |
(1,590,000 |
) |
$ |
1,760,000 |
|
|
|
2008 |
|
$ |
2,090,000 |
|
$ |
1,050,000 |
|
$ |
(1,030,000 |
) |
$ |
2,110,000 |
|
Other schedules are omitted because they are not required or are not applicable or because the required information is included in the financial statements.
28
|
|
(3) |
Exhibit No. |
|
|
|
|
|
|
3.1 |
The 1983 Restated Articles of Incorporation of the Company, as amended through February 14, 2007 (incorporated by reference to the Company’s Annual Report on Form 10-K for the fiscal year ended June 30, 2007). |
|
|
|
|
|
|
3.2 |
By-Laws of the Company (incorporated by reference to the Company’s Annual Report on Form 10-K for the fiscal year ended June 30, 1993). |
|
|
|
|
|
|
3.3 |
Amendments to Restated By-Laws of the Company (incorporated by reference to Exhibit 3.1 to the Company’s Form 8-K filed on June 8, 2007). |
|
|
|
|
|
|
10.1 |
1995 Stock Option Plan incorporated by reference from the 1995 Flexsteel definitive proxy statement. * |
|
|
|
|
|
|
10.2 |
1999 Stock Option Plan incorporated by reference from the 1999 Flexsteel definitive proxy statement. * |
|
|
|
|
|
|
10.3 |
Flexsteel Industries, Inc. Voluntary Deferred Compensation Plan incorporated by reference to Exhibit No. 10.5 to the Annual Report on Form 10-K for the fiscal year ended June 30, 2001. * |
|
|
|
|
|
|
10.4 |
Flexsteel Industries, Inc. Restoration Retirement Plan incorporated by reference to Exhibit No. 10.6 to the Annual Report on Form 10-K for the fiscal year ended June 30, 2001. * |
|
|
|
|
|
|
10.5 |
Flexsteel Industries, Inc. Senior Officer Supplemental Retirement Plan incorporated by reference to Exhibit No. 10.7 to the Annual Report on Form 10-K for the fiscal year ended June 30, 2001. * |
|
|
|
|
|
|
10.6 |
2002 Stock Option Plan incorporated by reference to Appendix A from the 2002 Flexsteel definitive proxy statement. * |
|
|
|
|
|
|
10.7 |
Agreement and Plan of Merger, dated as of August 12, 2003, by and among Flexsteel, Churchill Acquisition Corp. and DMI (incorporated by reference to Exhibit 99(d)(1) of Flexsteel Industries, Inc.’s Tender Offer Statement on Schedule TO filed with the Securities and Exchange Commission on August 20, 2003) incorporated by reference to Form 8-K and Amendments No. 1 to Form 8-K, as filed with Securities and Exchange Commission on October 2, 2003. |
|
|
|
|
|
|
10.8 |
Flexsteel Industries, Inc. 2006 Stock Option Plan incorporated by reference to Appendix C from the 2006 Flexsteel Proxy Statement filed with the Securities and Exchange Commission on October 31, 2006. |
|
|
|
|
|
|
10.9 |
Employment Agreement dated October 1, 2006 between Flexsteel Industries, Inc. and Donald D. Dreher incorporated by reference to Exhibit 10.1 to Flexsteel’s Form 8-K filed with the Securities and Exchange Commission on October 5, 2006. * |
|
|
|
|
|
|
10.10 |
Amendment to Employment Agreement dated June 27, 2008 between Flexsteel Industries, Inc. and Donald D. Dreher incorporated by reference to Exhibit 10.3 to Flexsteel’s Form 8-K filed with the Securities and Exchange Commission on June 27, 2008.* |
|
|
|
|
|
|
10.11 |
Flexsteel Industries, Inc. 2007 Long-Term Management Compensation Plan (incorporated by reference to Appendix C to the Definitive Proxy Statement on Schedule 14A filed with the Commission on November 1, 2007). * |
|
|
|
|
|
|
10.12 |
2009 Stock Option Plan incorporated by reference to Appendix A from the 2009 Flexsteel definitive proxy statement. * |
|
|
|
|
|
|
10.13 |
Credit Agreement dated April 14, 2010 between Flexsteel Industries, Inc. and Wells Fargo Bank, N. A. |
|
|
|
|
|
|
10.14 |
Revolving Line of Credit Note dated April 14, 2010 between Flexsteel Industries, Inc. and Wells Fargo Bank, N. A. |
|
|
|
|
|
|
21.1 |
Subsidiaries of the Company. Filed herewith. |
29
|
|
23 |
Consent of Independent Registered Public Accounting Firm. Filed herewith. |
|
|
|
|
|
|
31.1 |
Certification . Filed herewith. |
|
|
|
|
|
|
31.2 |
Certification. Filed herewith. |
|
|
|
|
|
|
32 |
Certification by Chief Executive Officer and Chief Financial Officer Pursuant to 18 U.S.C. Section 1350 as Adopted Pursuant to Section 906 of the Sarbanes-Oxley Act of 2002. Filed herewith. |
|
|
|
|
|
|
|
*Management contracts, compensatory plans and arrangements required to be filed as an exhibit to this report. |
SIGNATURES
Pursuant to the requirements of Section 13 or 15(d) of the Securities Exchange Act of 1934, the registrant has duly caused this report to be signed on its behalf by the undersigned, thereunto duly authorized.
|
|
|
|
|
|
|
Date: |
August 25, 2010 |
|
|
FLEXSTEEL INDUSTRIES, INC. |
|
|
|
|
|
|
|
|
|
|
By: |
/S/ Ronald J. Klosterman |
|
|
|
|
|
Ronald J. Klosterman |
|
|
|
|
|
Chief Executive Officer |
|
|
|
|
|
and |
|
|
|
|
|
Principal Executive Officer |
|
|
|
|
|
|
|
|
|
|
By: |
/S/ Timothy E. Hall |
|
|
|
|
|
Timothy E. Hall |
|
|
|
|
|
Chief Financial Officer |
|
|
|
|
|
and |
|
|
|
|
|
Principal Financial and Accounting Officer |
30
Pursuant to the requirements of the Securities Exchange Act of 1934, this report has been signed below by the following persons on behalf of the registrant and in the capacities and on the dates indicated.
|
|
|
|
|
|
Date: |
August 25, 2010 |
|
/S/ L. Bruce Boylen |
|
|
|
|
L. Bruce Boylen |
|
|
|
|
Chairman of the Board of Directors |
|
|
|
|
|
|
Date: |
August 25, 2010 |
|
/S/ Ronald J. Klosterman |
|
|
|
|
Ronald J. Klosterman |
|
|
|
|
Director |
|
|
|
|
|
|
Date: |
August 25, 2010 |
|
/S/ Jeffrey T. Bertsch |
|
|
|
|
Jeffrey T. Bertsch |
|
|
|
|
Director |
|
|
|
|
|
|
Date: |
August 25, 2010 |
|
/S/ Mary C. Bottie |
|
|
|
|
Mary C. Bottie |
|
|
|
|
Director |
|
|
|
|
|
|
Date: |
August 25, 2010 |
|
/S/ Patrick M. Crahan |
|
|
|
|
Patrick M. Crahan |
|
|
|
|
Director |
|
|
|
|
|
|
Date: |
August 25, 2010 |
|
/S/ Lynn J. Davis |
|
|
|
|
Lynn J. Davis |
|
|
|
|
Director |
|
|
|
|
|
|
Date: |
August 25, 2010 |
|
/S/ Robert E. Deignan |
|
|
|
|
Robert E. Deignan |
|
|
|
|
Director |
|
|
|
|
|
|
Date: |
August 25, 2010 |
|
/S/ Thomas E. Holloran |
|
|
|
|
Thomas E. Holloran |
|
|
|
|
Director |
|
|
|
|
|
|
Date: |
August 25, 2010 |
|
/S/ Eric S. Rangen |
|
|
|
|
Eric S. Rangen |
|
|
|
|
Director |
|
|
|
|
|
|
Date: |
August 25, 2010 |
|
/S/ James R. Richardson |
|
|
|
|
James R. Richardson |
|
|
|
|
Director |
31