Attached files
| file | filename |
|---|---|
| 8-K - FORM 8-K - CONTINENTAL RESOURCES, INC | d8k.htm |
 Denver
August 23-25, 2010
ENERCOM Energy Conference 2010
Exhibit 99.1 |
 2
This presentation includes forward-looking information that is subject to a number of risks
and uncertainties, many of which are beyond the Company’s control. All information,
other than historical facts included in this presentation, regarding strategy, future
operations, drilling plans, estimated reserves, future production, estimated capital
expenditures, projected costs, the potential of drilling prospects and other plans and
objectives of management is forward-looking information. All forward-looking
statements speak only as of the date of this presentation. Although the Company believes
that the plans, intentions and expectations reflected in or suggested by the forward-looking
statements are reasonable, there is no assurance that these plans, intentions or expectations
will be achieved. Actual results may differ materially from those anticipated due to
many factors, including oil and natural gas prices, industry conditions, drilling
results, uncertainties in estimating reserves, uncertainties in estimating future production from
enhanced recovery operations, availability of drilling rigs, pipe and other services and
equipment, availability of oil and natural gas transportation capacity, availability of
capital resources and other factors listed in reports we have filed or may file with the
Securities and Exchange Commission. This presentation also includes information on
reserves potentially recoverable through additional drilling or enhanced recovery
operations. Non-proven estimates are generally not permitted to be disclosed in SEC filings and are subject to a
substantial risk of not being realized.
|
 3
#3 oil producer in the Rocky Mountains
Accelerating growth with oil-rich drilling inventory
Excellent 1H10 results
•
$392MM EBITDAX
•
20%> in EUR model to 518,000 Boe per well (ND Bakken)
•
#1 Land position in Bakken Shale play with 816,852 net acres
•
9% production growth in 2Q10 vs. 1Q10
•
2Q10: 41,913 Boepd
•
1Q10: 38,428 Boepd
•
2Q09: 37,347 Boepd
Continental Resources, Inc. |
 Organic growth
•
Inventory to 3X
production and reserves over the next five years
Crude-oil focused
•
75% of 2Q10 production
Advanced technology applied to unconventional
resource plays
Conservative fiscal discipline
4
Growth Strategy |
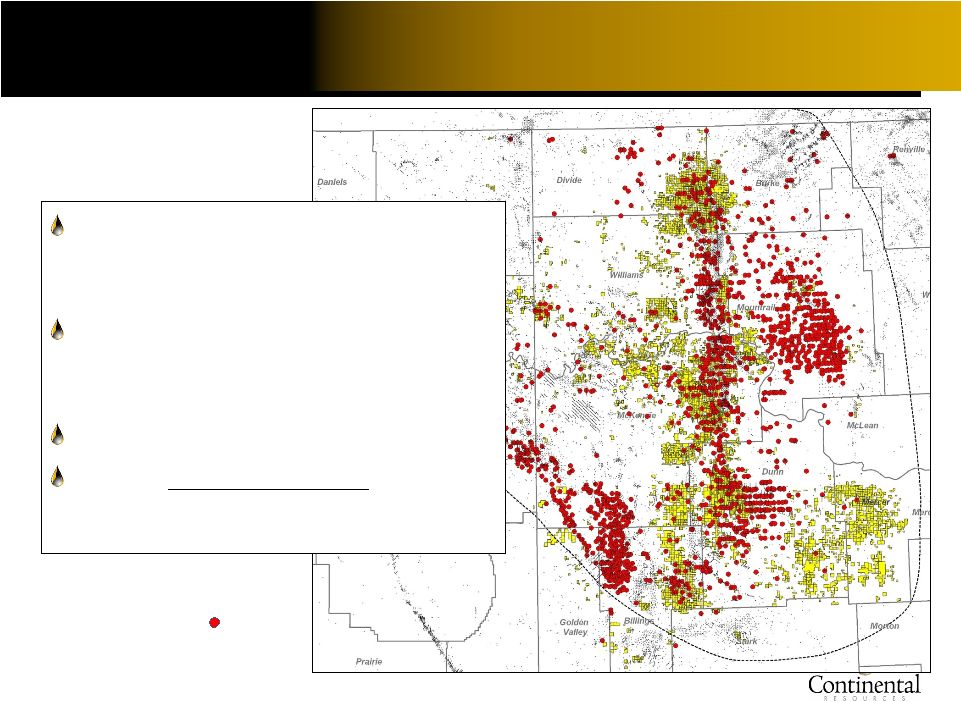
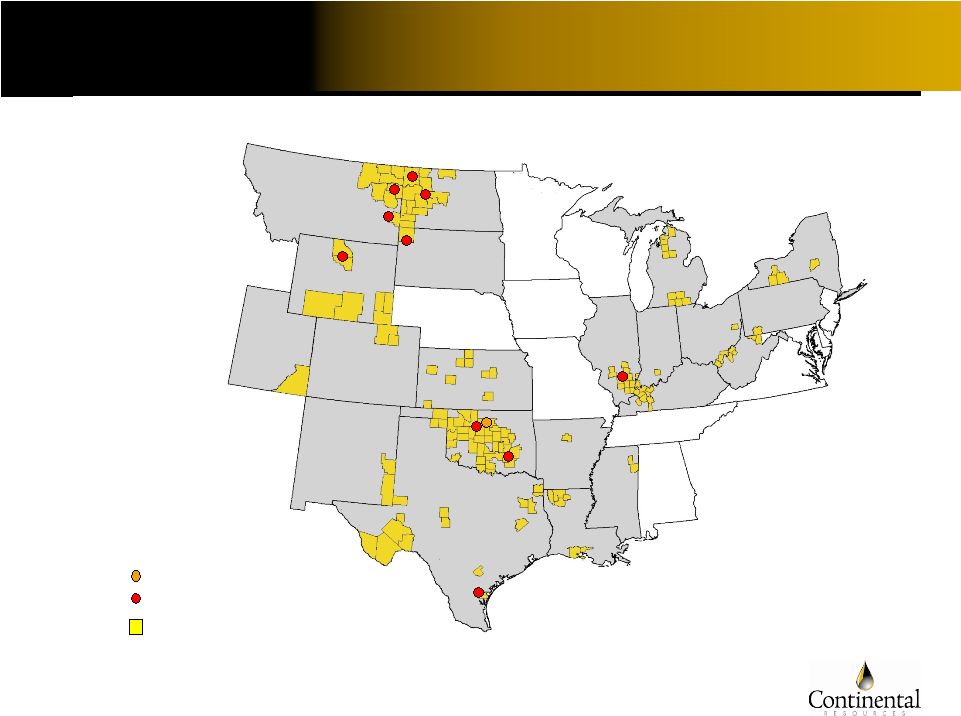 5
Operating Areas
Headquarters: Enid, Oklahoma
Field offices
Counties with acreage
holdings are highlighted |
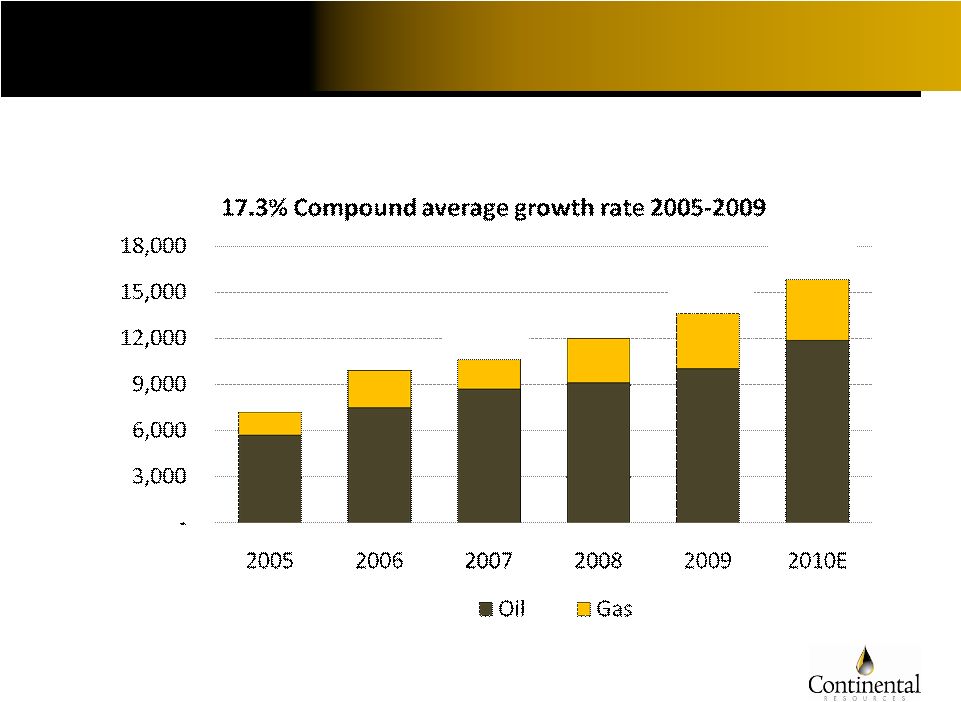 6
Strong Production Growth 2005-2009
7,209
9,018
10,621
12,006
13,623
79%
oil
83%
82%
76%
75%
MBoe
Est.
15,800
74%
*
CLR
2Q10
production
75%
crude
oil.
2010
production
guidance
is
for
15%
to
17%
growth. |
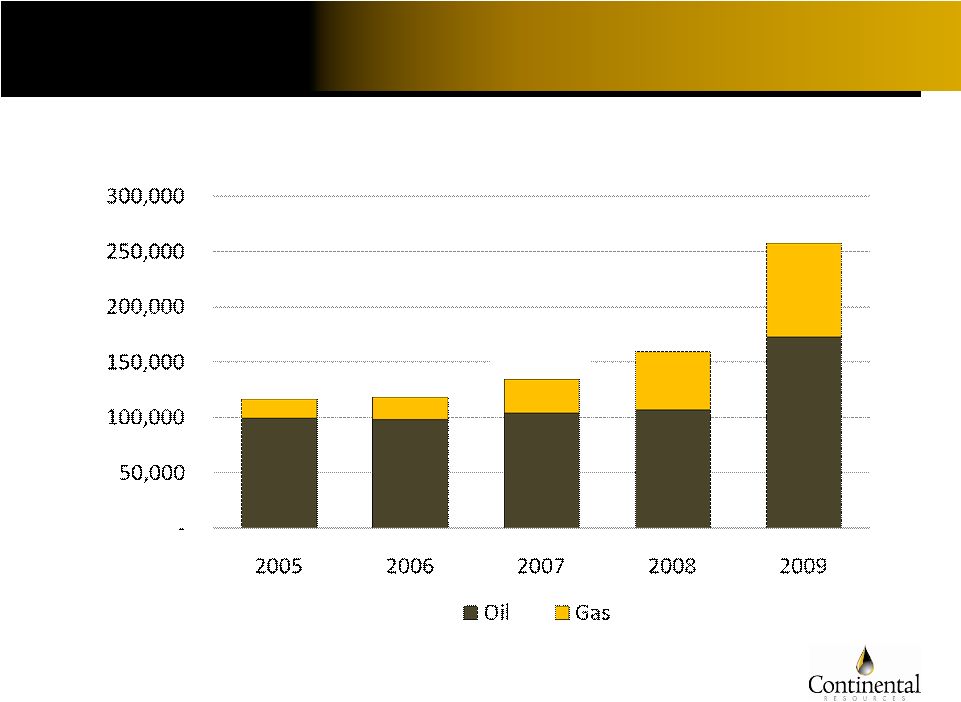 7
116,665
118,349
134,615
159,262
257,293
85%
oil
83%
77%
67%
67%
Growth in Reserves 2005-2009
MBoe |
 8
The Bakken
#1 crude oil play in
lower 48 (USGS)
4.3B barrels of
recoverable oil
CLR: +171,505 net
acres since
January 1, 2010
~ |
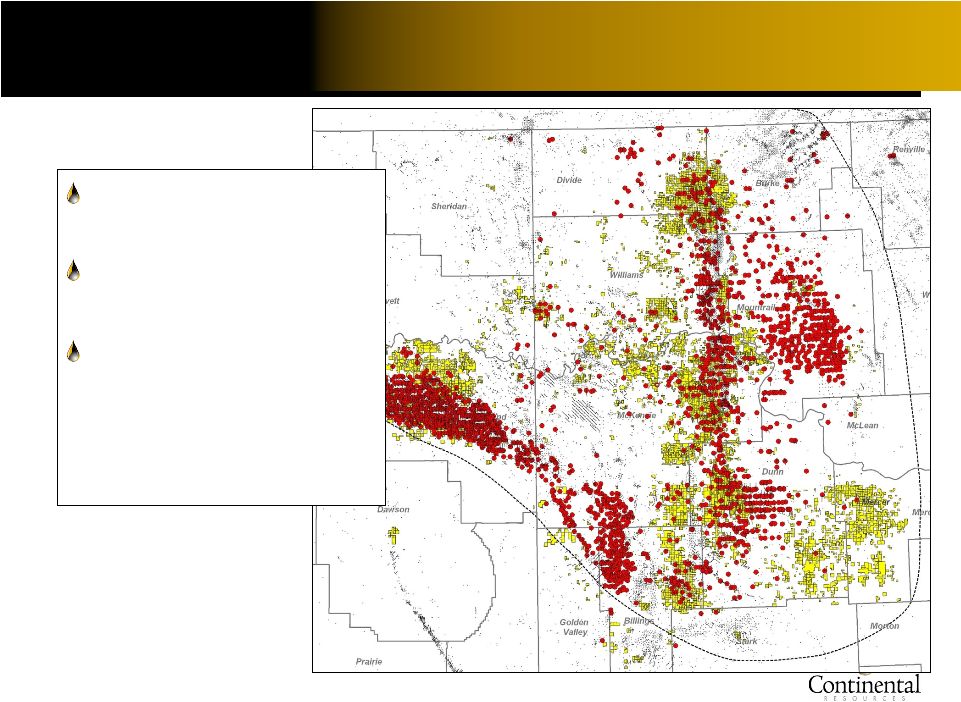
 9
Growth Driver: North Dakota Bakken
Hz producer
2Q10: 13,046 Boepd
•
+93% over 2Q09
•
+30% over 1Q10
41% of ‘09 proved reserves
•
616 gross (261.9 net) PUD
locations at YE09
589,937 net acres
2010: $588MM capex
(67% of
total drilling capex) |
 CLR firsts
•
Drilled the Three Forks in
May 2008
•
Dual zone development with
Mathistad 2-35H in 2009
•
ECO-Pad drilling in 2010
75% of acreage could
be prospective for dual
zone development
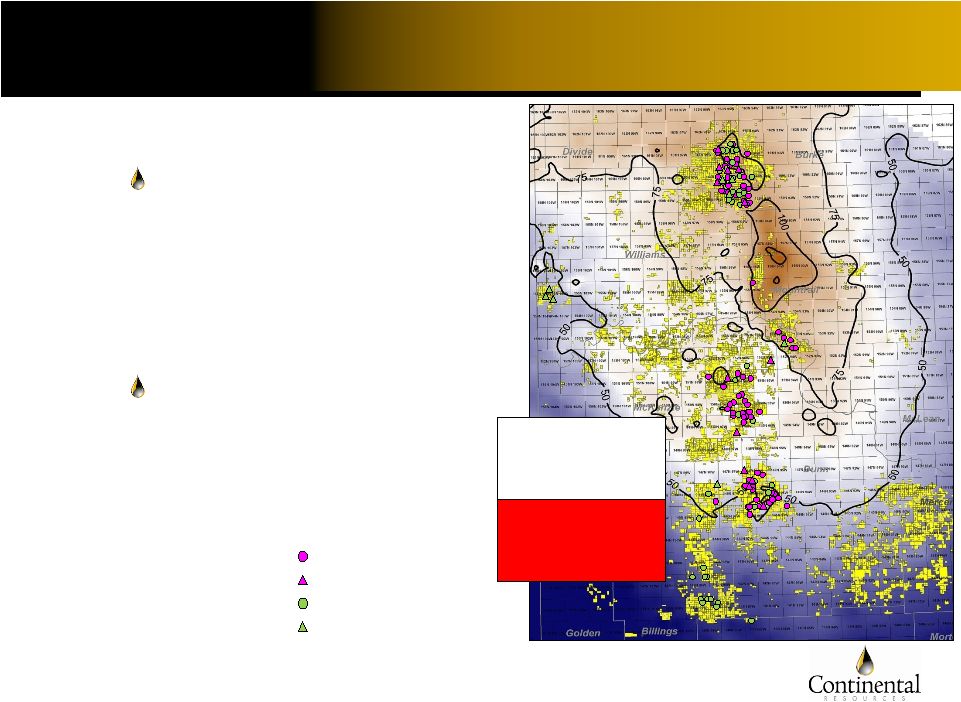
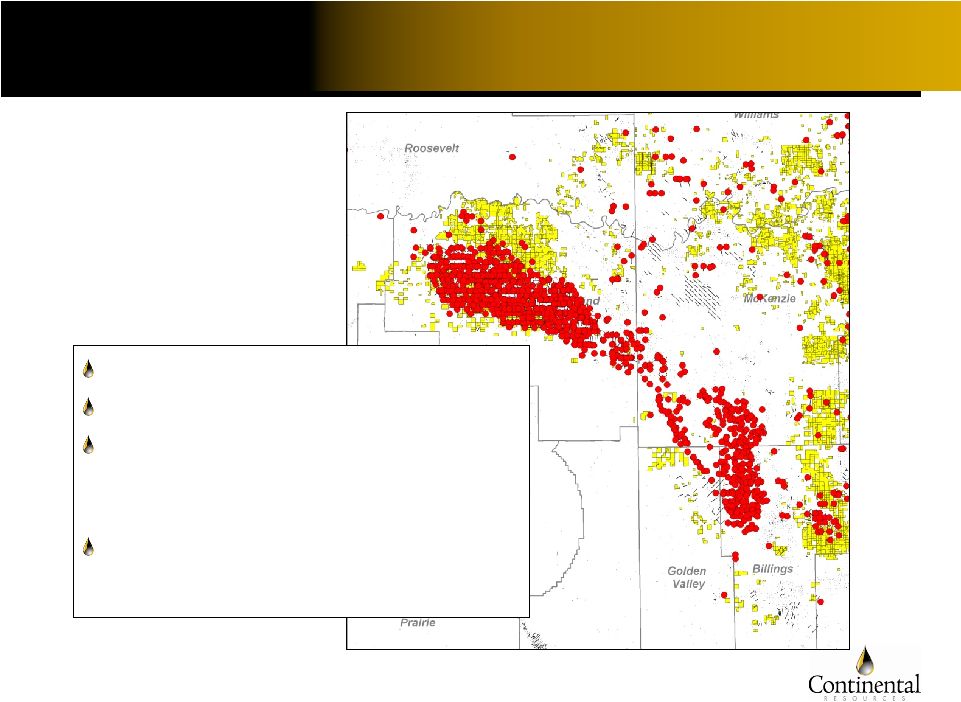
10
MB/TF Dual Reservoir Development
®
CLR TF producer
CLR Q2 MB completion
CLR Q2 TF completion
CLR MB producer
2Q10 TF Completions
Meldahl 1-23H –
2,489 Boe
Ole 1-29H –
1,864 Boe
Bang 2-33H –
1,860 Boe
Roger 1-18H –
1,486 Boe
2Q10 MB Completions
Franklin 1-20H –
1,288 Boe
Bohmbach 2-35H –
1,271 Boe
Brockmeier 1-1H –
1,217 Boe
Anseth 1-29H –
1,088 Boe |
 North Dakota
Industrial Commission reduced property
line set-back requirement
•
At least 5% longer lateral
Expect results from first ECO-
Pad projects in near future
10% less D&C cost
•
4 wells per ECO-Pad, versus 4
separate drilling pads
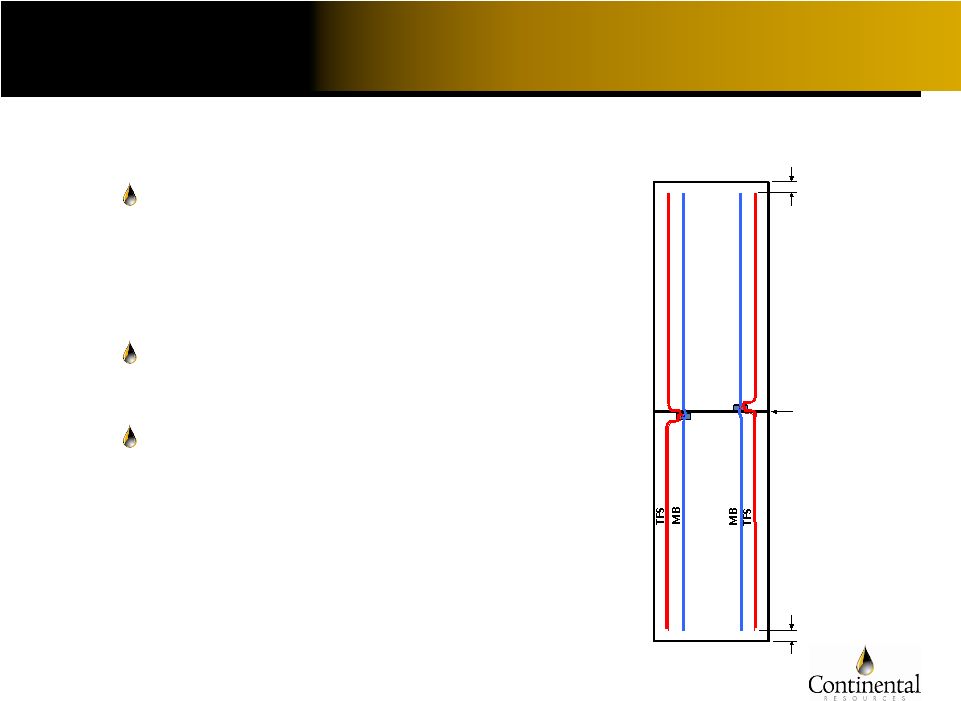
11
ECO-Pad Development
Spacing unit #2
1,280-acre spacing
unit #1
50’
set-back
500’
set-back
500’
set-back
® |
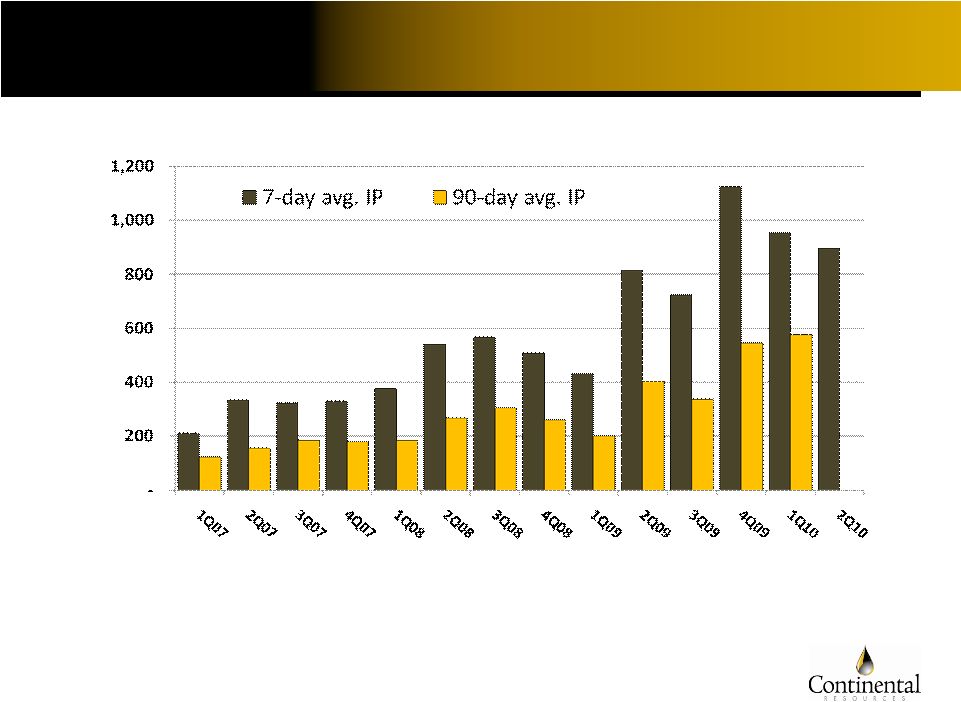 12
Improving ND Bakken Well Results
Boepd
Current standard is 24 stages; testing 30
210
333
323
329
376
539
567
507
432
815
722
1,123
954
122
155
184
179
185
267
306
260
201
402
335
546
576
895
Completions:
7
7
7
5
5
10
6
15
11
9
9
9
14
Avg. CLR stages:
1
1
4
9
8
10
11
13
11
12
15
18
20
23
24
NA |
 13
Expanding Montana Bakken
+63,416 net acres added in 2010
2Q10: 5,196 Boepd
11% of 2009 proved reserves
•
65 gross (44.7 net) PUD
locations
$55MM in 2010 capex
•
Added second rig to play |
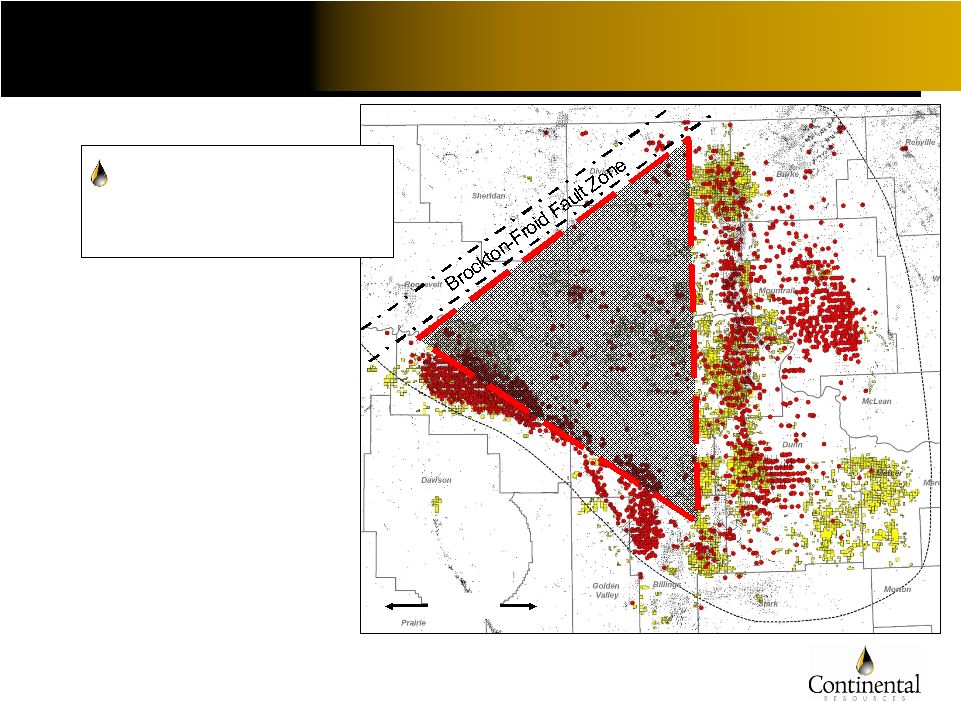 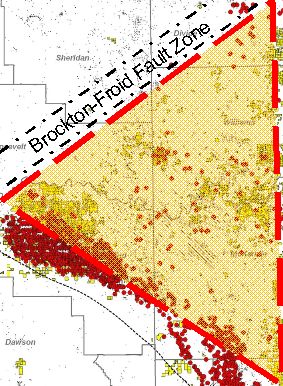  14
Good Plays Keep Getting Better
50 Miles
The Bakken
keeps growing |
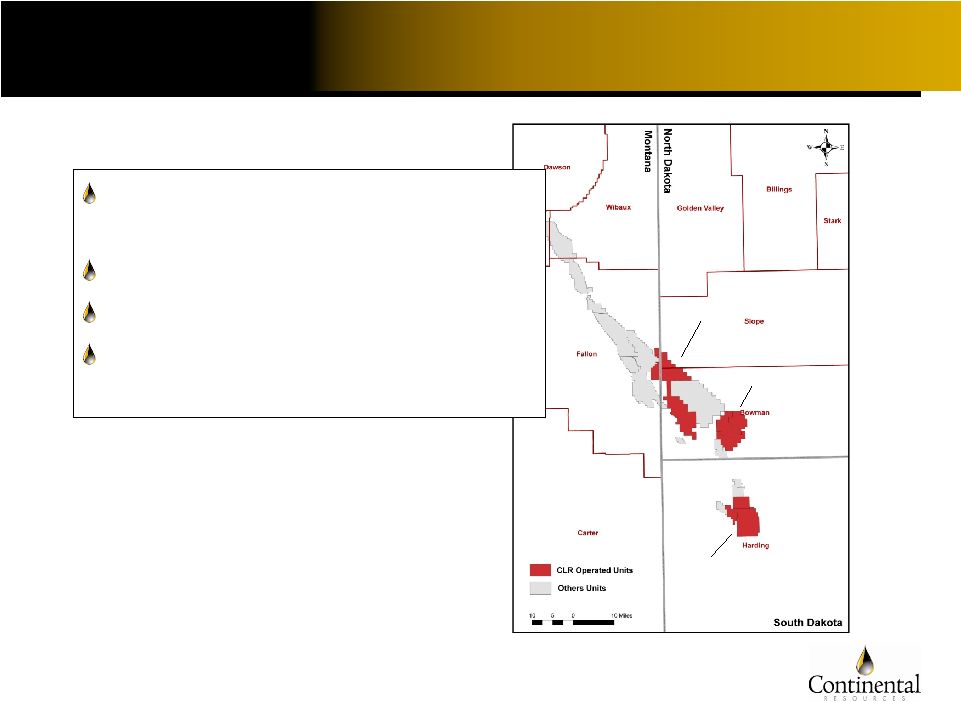 15
Production Base: Red River Units
Cedar Hills Units
Buffalo Units
Medicine Pole Hills
Units
Cedar Hills Units: 7 largest
onshore oil field in Lower 48
2Q10: 15,080 Boepd
21% of 2009 proved reserves
$82MM in 2010 capex
•
5 new producers drilled 2Q10
th |
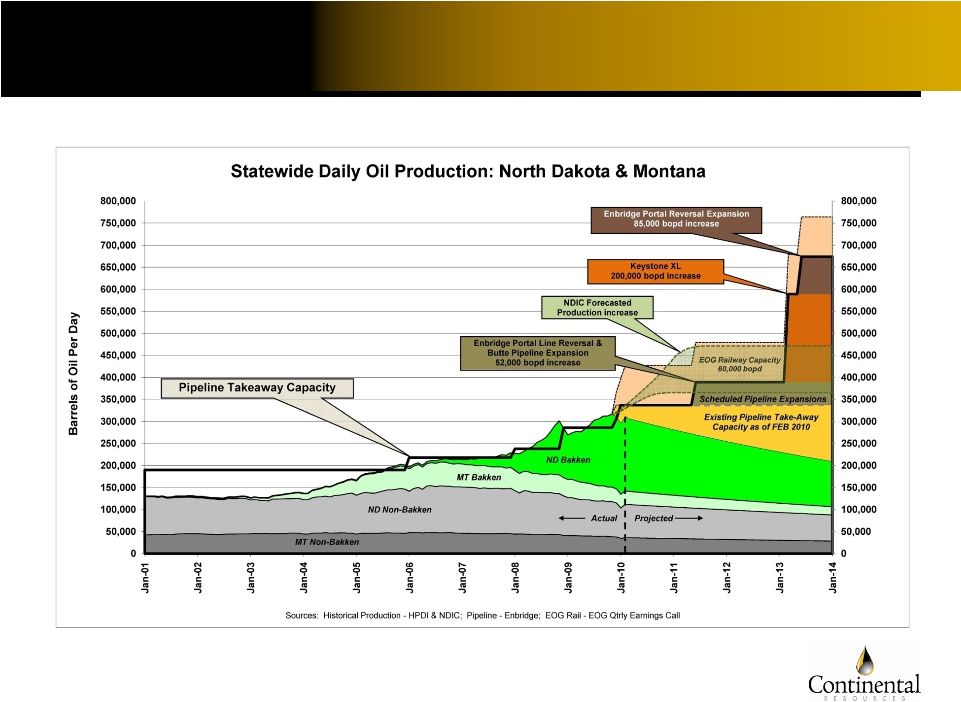 16
Williston Takeaway Capacity |
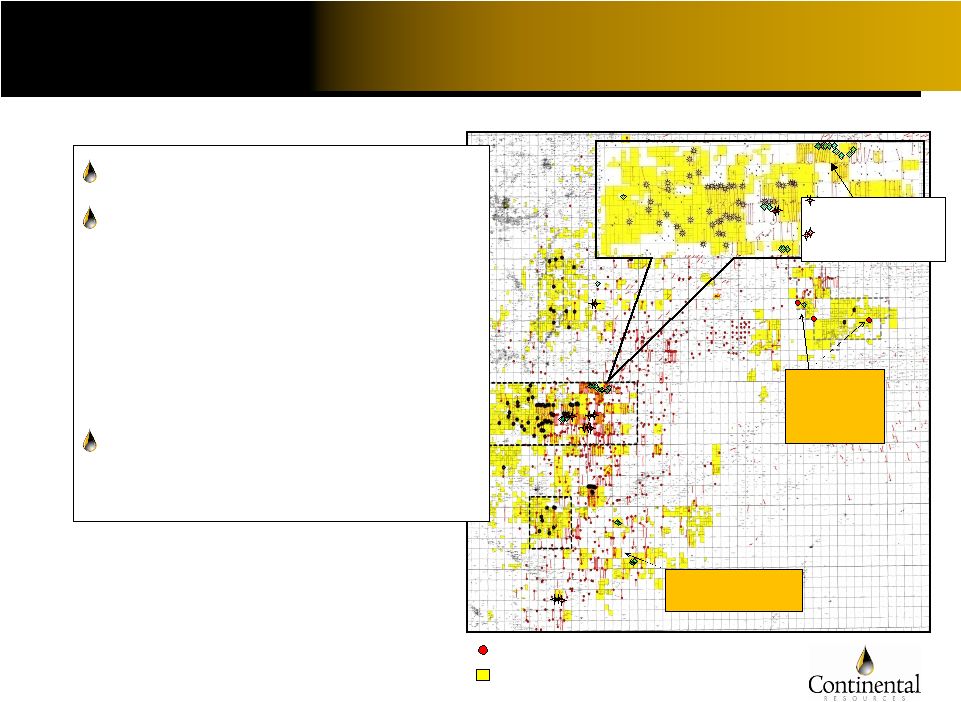 17
Arkoma Woodford: Working East
CLR Acreage
Woodford Producer
SALT CREEK
RUSHING
ASHLAND AMI
Foster Development
6 wells: avg. 2.4
MMcfpd
EAST KREBS
Ennis 7H-12 (non-op)
8.4 MMcfpd
Marilyn 1-29H
4.2 MMcfpd
Delphia
1-34H
2.1 MMcfpd
2Q10: 3,721 Boepd
17% of 2009 proved
reserves
•
401 gross (100 net) PUD
locations
•
46,074 net acre position; 47%
HBP
$41MM in 2010 capex |
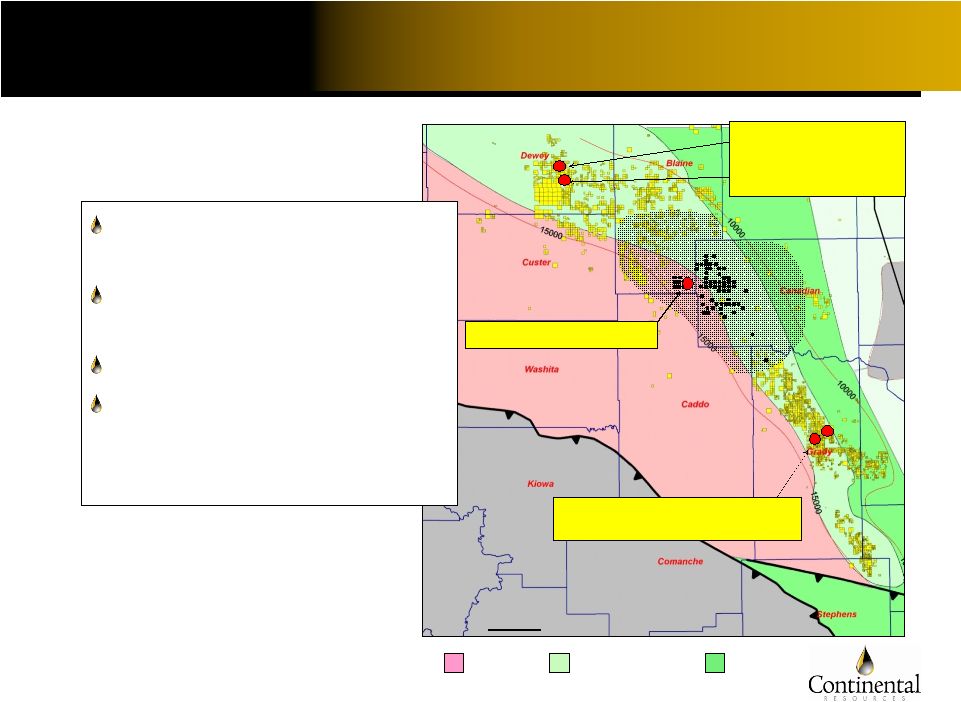   18
Anadarko Woodford: Coming on Strong
12 miles
Wichita
Uplift
Nemaha
Uplift
Cana
Gas/Condensate
Oil
Gas
Brown 1-2H
4.2 MMcfpd, 102 Bopd
Doris 1-25H
4.5 MMcfpd, 72 Bopd
McCalla
1-11H
Ballard 1-17H 750 Mcfpd, 200 Bopd
NW Cana
SE Cana
Young 2-22H 7.5 MMcfpd
Very encouraged by early
well results
Liquids content enhances
economics
251,626 net acres
$75MM in 2010 capex
•
3 operated rigs
•
Adding 4 by year end |
 19
Operating and Fiscal Discipline
1
See Non-GAAP Financial Measures in Form 10-K, Form 10-Q and earnings
release for a reconciliation of net income to EBITDAX. 2
Average costs per Boe
have been computed using sales volumes.
Realized oil price ($/bbl)
Realized natural gas price ($/Mcf)
Oil production (bopd)
Natural gas production (Mcfd)
Total production (boepd)
EBITDAX ($000’s)
Key Operational Statistics
Average oil equivalent price
Production expense
Production tax
G&A
Interest
Total cash costs
Cash margin
Cash margin %
Years ended December 31,
2009
$54.44
$3.22
27,459
59,194
37,324
$450,648
$45.10
6.89
3.37
3.03
1.72
$15.01
$30.09
66.7%
2008
$88.87
$6.90
24,993
46,861
32,803
$757,708
$77.66
8.40
4.84
2.95
1.01
$17.20
$60.46
77.9%
1H10
$69.87
$4.84
30,373
58,844
40,180
$391,578
$59.92
6.17
4.70
3.20
2.78
$16.85
$43.07
71.9%
1
2 |
 20
Plenty of Running Room
* CLR internal economic model, based on EUR of 518K Boe
and 640-acre spacing for the ND Bakken; 430K Boe
and 320-acre
spacing for the MT Bakken; 300K and 320-acre spacing for the Niobrara; 3
Bcf 80-acre spacing for the Arkoma Woodford; and
6 Bcf
and 160-acre spacing for the Anadarko Woodford.
ND Bakken
MB zone
600
253
1,932
MMBoe
additional reserves potential in the Bakken, Niobrara and Woodford;
7.5X 2009 reserves of 257.3 MMBoe.
In addition to our 62% increase in 2009 proved reserves...
Potential unbooked
locations (net)
Additional MMBoe
reserve potential
ND Bakken
TF zone
400
168
Arkoma
Woodford
425
174
(1.0 Tcf)
Anadarko
Woodford
1,500
1,218
(7.3 Tcf)
MT
Bakken
200
70
Niobrara
200
49 |
 21
Positioned for Value Creation
Low-cost, high-margin
operator
•
Operate 93% of our PV-10
Strong balance sheet
Hedged for operational
stability
Huge drilling inventory
Goal: 3X in 5 years
–
production and
reserves |
 Continental Resources, Inc. |
 23
Appendix |
 Year ended December
31, 2010 Production growth
Price differentials (1)
Oil (Bbl)
Gas (Mcf)
Operating expenses per Boe:
Production expense
Production tax (percent of sales)
Depreciation, depletion, amortization
and accretion
General and administrative expense (2)
Non-cash stock-based compensation
Income tax rate, percent of pre-tax income
Percent of income tax deferred
24
2010 Guidance
15% to 17%
$8 to $10
+/-
$0.25
$6.50 to $7.00
7.0% to 7.5%
$15 to $18
$2.00 to $2.40
$0.75 to $1.00
38%
95%
(1)
Differential to calendar month average NYMEX futures price for oil and to average
of last three trading days of prompt NYMEX futures contract for gas.
(2)
Excludes non-cash stock-based compensation.
|
 25
Crude Oil Hedge Positions
2010
Jul. to Sep.
Swaps
Collars
Oct. to Dec.
Swaps
Collars
2011
Jan. to Mar.
Swaps
Collars
Apr. to Dec.
Collars
2012
Jan. to Dec.
Collars
Volume in
Barrels
687,000
1,380,000
1,089,000
1,380,000
225,000
2,565,000
7,837,500
2,745,000
Weighted Avg.
of Swaps
$84.58
$83.99
$84.55
Range
$75-78
$75-78
$75-80
$75-80
$80
Weighted
Average
$76.00
$76.00
$78.95
$79.39
$80
Range
$88.75-96.75
$88.75-96.75
$88.65-97.25
$89.00-97.25
$93.25-93.65
Weighted
Average
$93.43
$93.43
$91.70
$91.27
$93.54
Collars: Floors
Collars: Ceilings |
 26
Natgas Swaps
2010
Jul. to Sep.
Oct. to Dec.
2011
Jan. to Dec.
Natgas Basis Swaps, Centerpoint East
2010
Jul. to Dec.
Natural Gas Swaps
MMBtus
3,778,000
3,778,000
11,862,500
3,600,000
Swaps
Weighted Avg.
$6.09
$6.09
$6.36
($0.62) |