Attached files
| file | filename |
|---|---|
| 8-K - RAMCO-GERSHENSON PROPERTIES TRUST 8-K - RPT Realty | a6403820.htm |
Exhibit 99.1
August 2010 Investor Presentation Ramco Gershenson Properties Trust
Ramco’s Long-Term Strategy Deliver superior total shareholder returns. Generate consistent, predictable earnings growth. Maintain a strong balance sheet and financial flexibility. Continue to improve the quality of the portfolio through value-added investments and diversification into new, top growth markets. Grow annual dividend.
Growing Shareholder Value Our business plan is simple, to produce sustainable FFO growth and deliver long-term value for our shareholders. Capitalize on high-quality shopping center portfolio Drive internal and external growth Dominant locations in major metropolitan markets. Existing diverse, stable and credit-quality tenant base. Strengthen the balance sheet Significant embedded leasing and redevelopment opportunities in core portfolio. Acquire shopping centers opportunistically and pursue development projects conservatively. Continue to improve debt metrics. Extend debt maturities, enhance liquidity and promote financial flexibility.
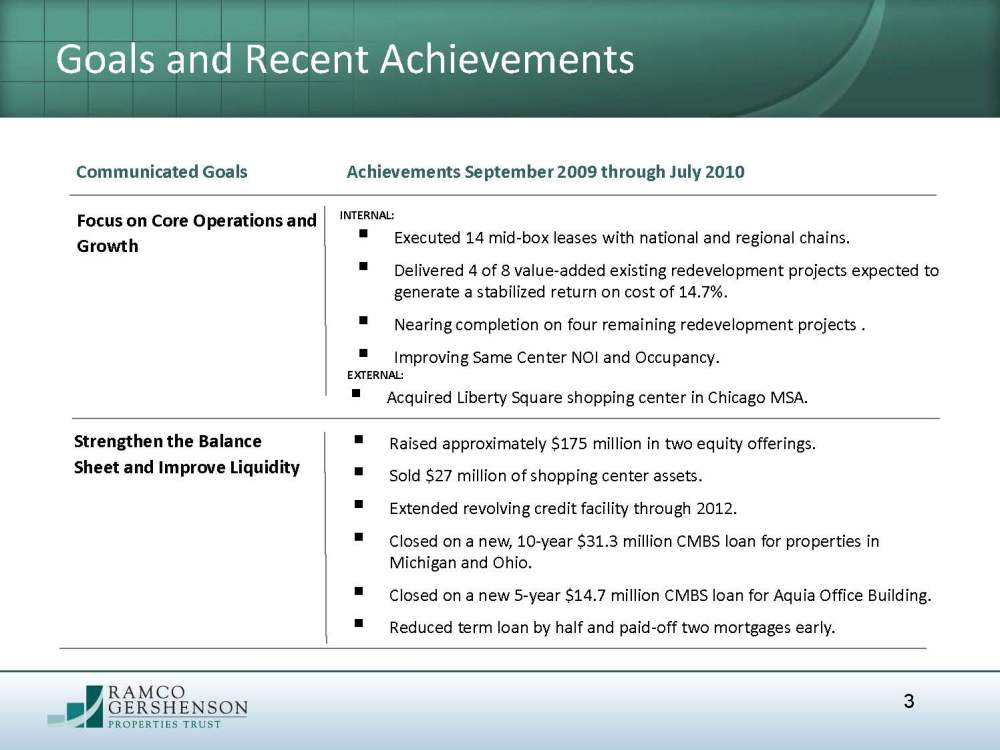
Strengthen the Balance Sheet and Improve Liquidity Executed 14 mid-box leases with national and regional chains. Delivered 4 of 8 value-added existing redevelopment projects expected to generate a stabilized return on cost of 14.7%. Nearing completion on four remaining redevelopment projects. Improving Same Center NOI and Occupancy. Raised approximately $175 million in two equity offerings. Sold $27 million of shopping center assets. Extended revolving credit facility through 2012. Closed on a new, 10-year $31.3 million CMBS loan for properties in Michigan and Ohio. Closed on a new 5-year $14.7 million CMBS loan for Aquia Office Building. Reduced term loan by half and paid-off two mortgages early. Goals and Recent Achievements Focus on Core Operations and Growth Communicated Goals Achievements September 2009 through July 2010 INTERNAL: EXTERNAL: Acquired Liberty Square shopping center in Chicago MSA.
Strong Markets and High-Quality Centers
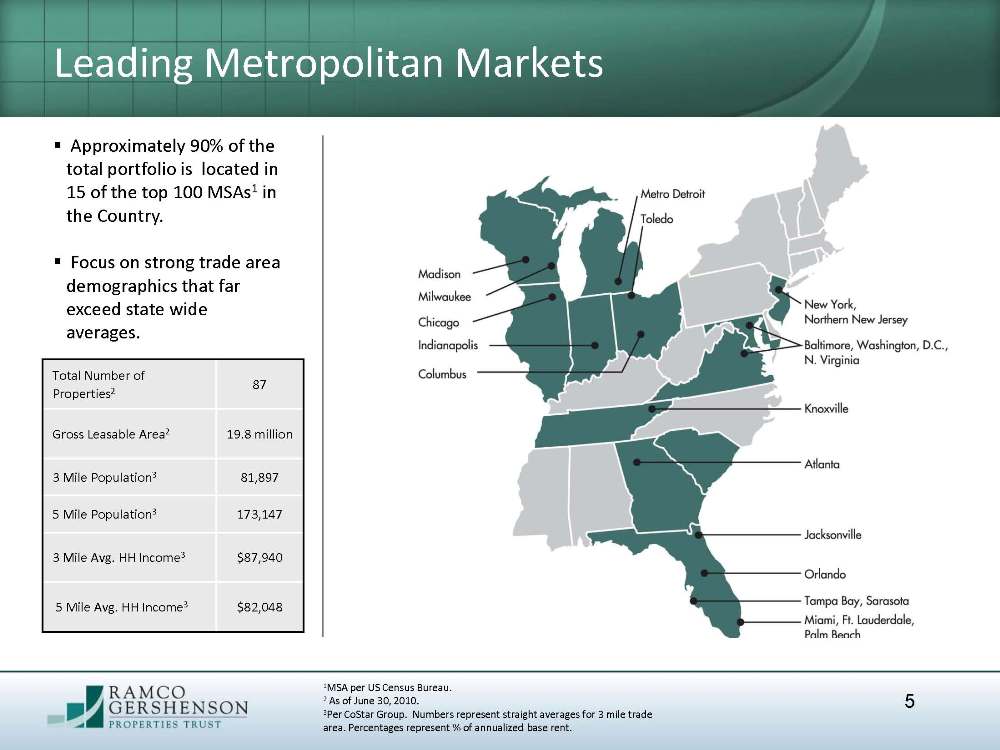
1 MSA per US Census Bureau. 2 As of June 30, 2010. 3 Per CoStar Group. Numbers represent straight averages for 3 mile trade area. Percentages represent % of annualized base rent. Total Number of Properties 2 87 Gross Leasable Area 2 19.8 million 3 Mile Population 3 81,897 5 Mile Population 3 173,147 3 Mile Avg. HH Income 3 $87,940 5 Mile Avg. HH Income 3 $82,048 Approximately 90% of the total portfolio is located in 15 of the top 100 MSAs 1 in the Country. Focus on strong trade area demographics that far exceed state wide averages. Leading Metropolitan Markets
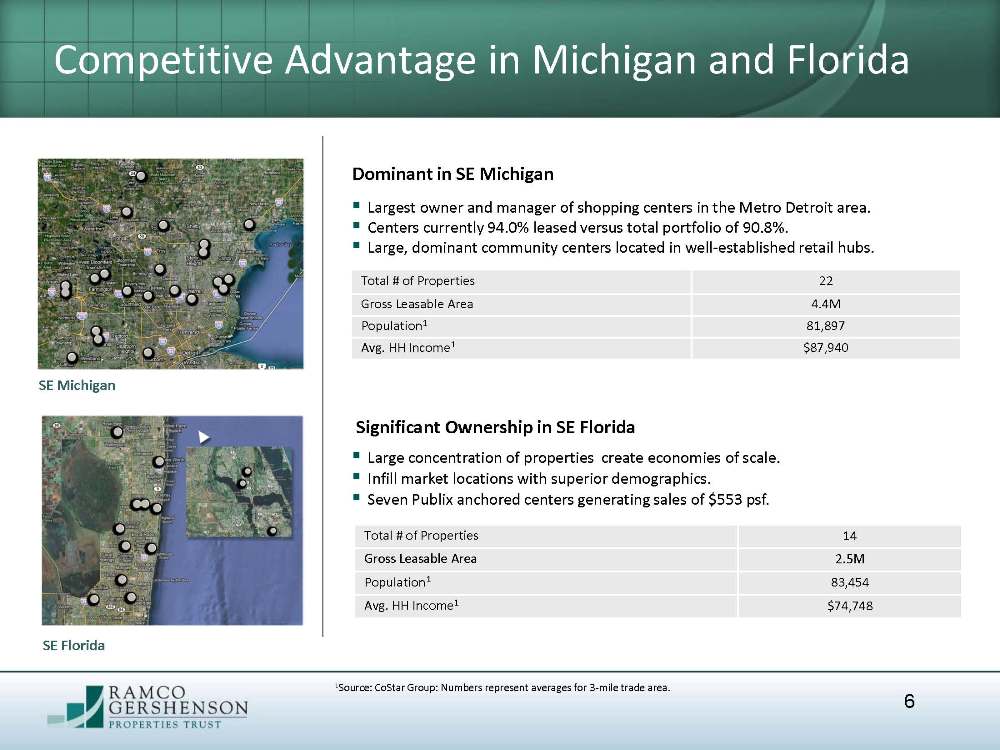
Largest owner and manager of shopping centers in the Metro Detroit area. Centers currently 94.0% leased versus total portfolio of 90.8%. Large, dominant community centers located in well-established retail hubs. Total # of Properties 22 Gross Leasable Area 4.4M Population1 81,897 Avg. HH Income1 $87,940 1 Source: CoStar Group: Numbers represent averages for 3-mile trade area. Dominant in SE Michigan SE Florida Large concentration of properties create economies of scale. Infill market locations with superior demographics. Seven Publix anchored centers generating sales of $553 psf. Total # of Properties 14 Gross Leasable Area 2.5M Population1 83,454 Avg. HH Income 1 $74,748 Significant Ownership in SE Florida Competitive Advantage in Michigan and Florida
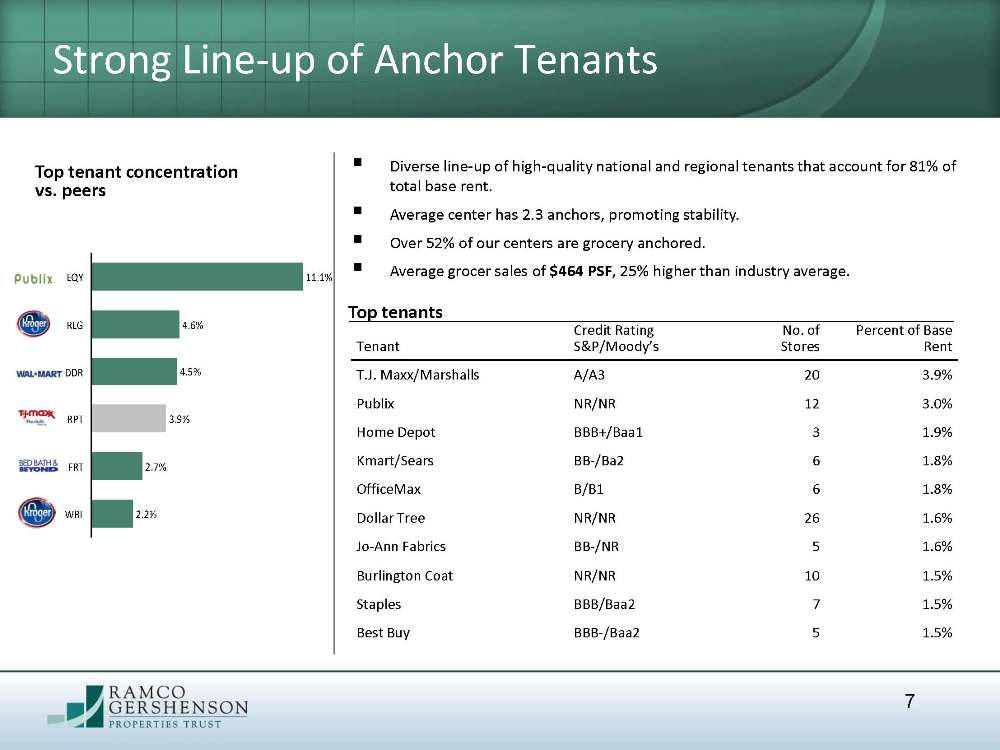
Diverse line-up of high-quality national and regional tenants that account for 81% of total base rent. Average center has 2.3 anchors, promoting stability. Over 52% of our centers are grocery anchored. Average grocer sales of $464 PSF, 25% higher than industry average. 2.2% 2.7% 3.9% 4.5% 4.6% 11.1% Tenant Credit Rating S&P/Moody’s No. of Stores Percent of Base Rent T.J. Maxx/Marshalls A/A3 20 3.9% Publix NR/NR 12 3.0% Home Depot BBB+/Baa1 3 1.9% Kmart/Sears BB-/Ba2 6 1.8% OfficeMax B/B1 6 1.8% Dollar Tree NR/NR 26 1.6% Jo-Ann Fabrics BB-/NR 5 1.6% Burlington Coat NR/NR 10 1.5% Staples BBB/Baa2 7 1.5% Best Buy BBB-/Baa2 5 1.5% Top tenant concentration vs. peers Top tenants Strong Line-up of Anchor Tenants
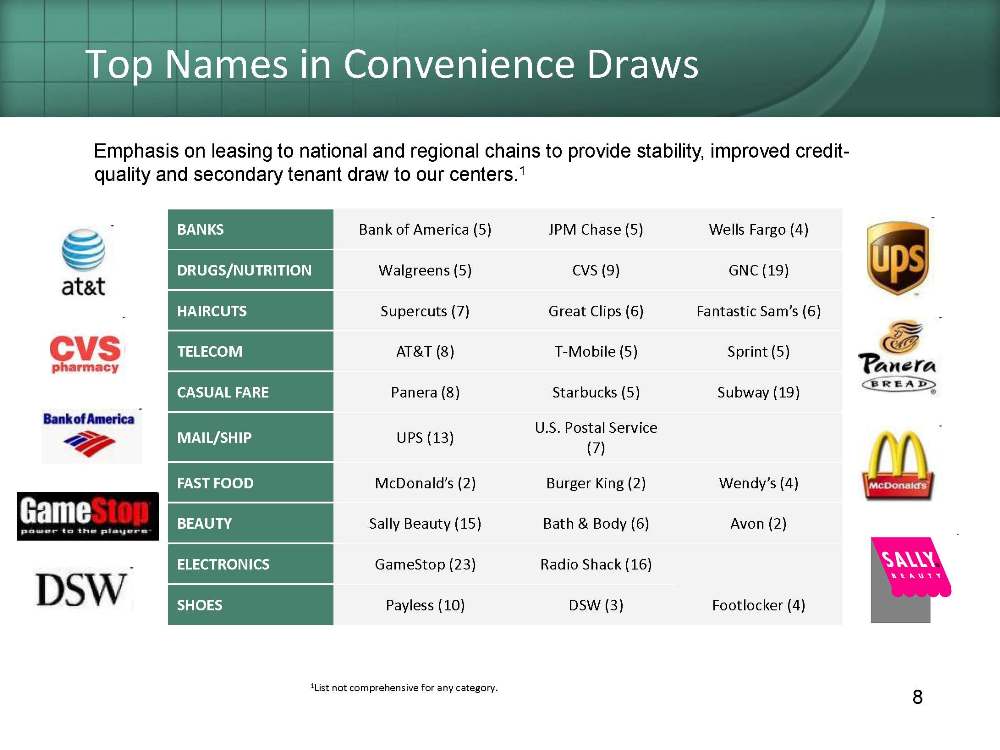
Top Names in Convenience Draws Emphasis on leasing to national and regional chains to provide stability, improved credit-quality and secondary tenant draw to our centers. 1 1 List not comprehensive for any category. BANKS Bank of America (5) JPM Chase (5) Wells Fargo (4) DRUGS/NUTRITION Walgreens (5) CVS (9) GNC (19) HAIRCUTS Supercuts (7) Great Clips (6) Fantastic Sam’s (6) TELECOM AT&T (8) T-Mobile (5) Sprint (5) CASUAL FARE Panera (8) Starbucks (5) Subway (19) MAIL/SHIP UPS (13) U.S. Postal Service (7) FAST FOOD McDonald’s (2) Burger King (2) Wendy’s (4) BEAUTY Sally Beauty (15) Bath & Body (6) Avon (2) ELECTRONICS GameStop (23) Radio Shack (16) SHOES Payless (10) DSW (3) Footlocker (4)
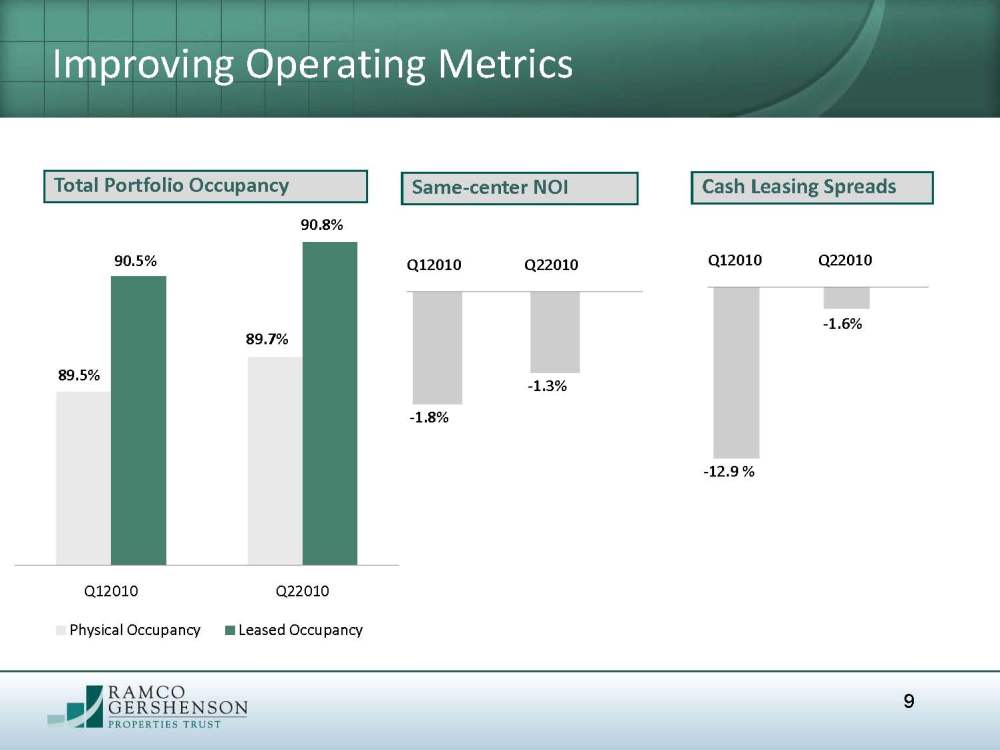
Q12010 Q22010 Physical Occupancy Leased Occupancy Improving Operating Metrics Total Portfolio Occupancy Same-center NOI Cash Leasing Spreads 89.7% Q12010 Q22010 89.5% 90.8% 90.5% -1.8% -1.3% Q12010 Q22010 -12.9 % -1.6%
Opportunities for Growth
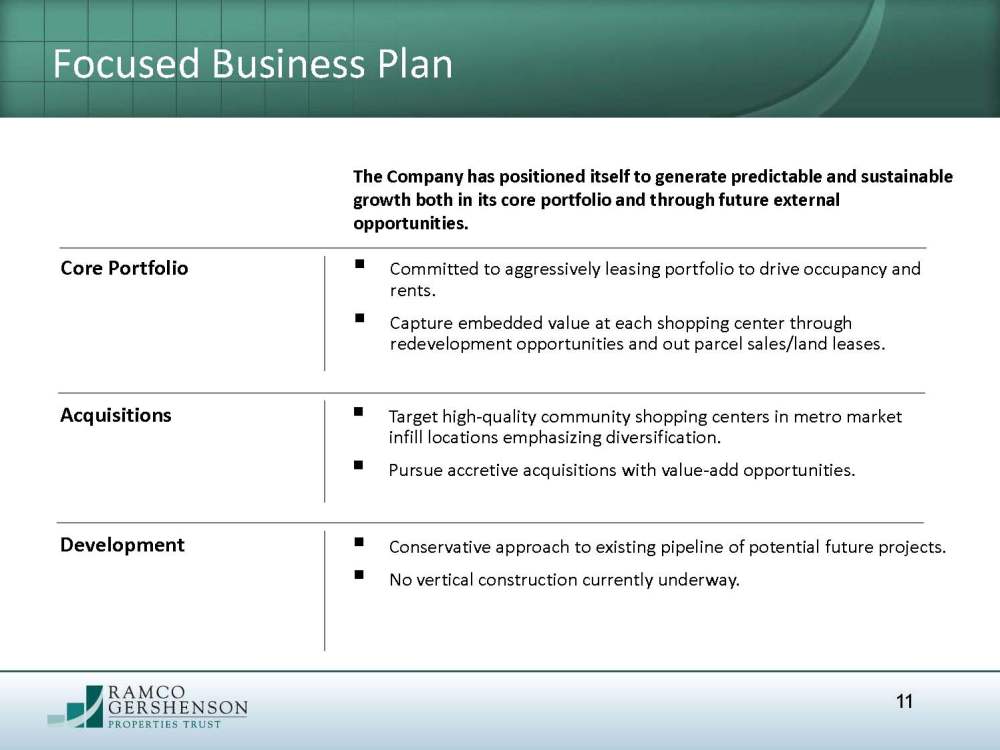
Development Acquisitions Committed to aggressively leasing portfolio to drive occupancy and rents. Capture embedded value at each shopping center through redevelopment opportunities and out parcel sales/land leases. Target high-quality community shopping centers in metro market infill locations emphasizing diversification. Pursue accretive acquisitions with value-add opportunities. Conservative approach to existing pipeline of potential future projects. No vertical construction currently underway. Core Portfolio The Company has positioned itself to generate predictable and sustainable growth both in its core portfolio and through future external opportunities. Focused Business Plan
Since 3Q2009, the Company has signed 14 mid-box leases totaling 370,000 square feet with national and regional chains including TJ Maxx, Best Buy, Ross Dress for Less, Staples, Golfsmith and Total Wine. In the second half of 2010, the Company anticipates signing at least three additional mid-box leases to fill vacancies totaling 86,000 square feet as well as signing five leases with new mid-box retailers to replace underperforming or at-risk anchor tenancies totaling 148,000 square feet. New anchor tenants will provide catalyst for lease-up of adjacent small shop tenant space further promoting growth. Significant opportunities to retenant, remerchandise and redevelop core portfolio properties, which have historically produced incremental returns of 12%. Tapping Embedded Growth in Core Portfolio
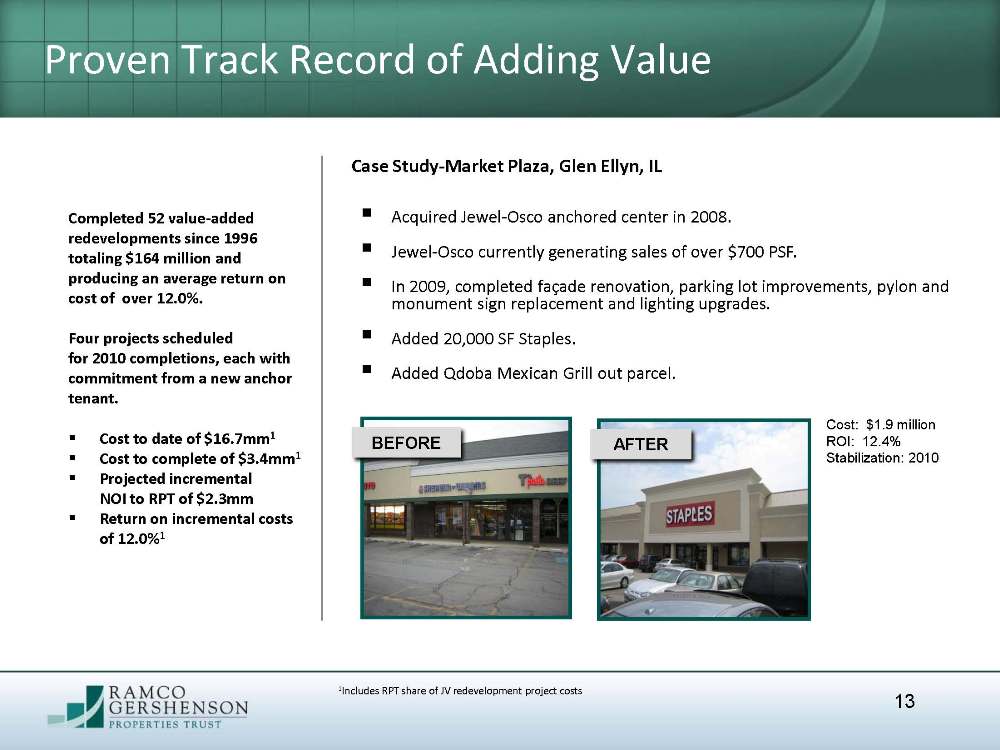
Completed 52 value-added redevelopments since 1996 totaling $164 million and producing an average return on cost of over 12.0%. Four projects scheduled for 2010 completions, each with commitment from a new anchor tenant. Cost to date of $16.7mm1 Cost to complete of $3.4mm1 Projected incremental NOI to RPT of $2.3mm Return on incremental costs of 12.0%1 Acquired Jewel-Osco anchored center in 2008. Jewel-Osco currently generating sales of over $700 PSF. In 2009, completed façade renovation, parking lot improvements, pylon and monument sign replacement and lighting upgrades. Added 20,000 SF Staples. Added Qdoba Mexican Grill out parcel. BEFORE AFTER 1 Includes RPT share of JV redevelopment project costs Case Study-Market Plaza, Glen Ellyn, IL Cost: $1.9 million ROI: 12.4% Stabilization: 2010 Proven Track Record of Adding Value
Metro markets in identified growth areas with value-added potential. Focus on market dominant community shopping centers with a grocery and/or discount anchor component. Geographic diversification is a critical element in RPT’s acquisition strategy. External Growth Opportunities Acquisitions Development. Pursue a conservative approach to existing pipeline of potential future projects. Developments will only be considered upon achieving certain, specific criteria: Critical mass of signed anchor leases. Demonstrated demand for small shop retail. Construction financing in place.
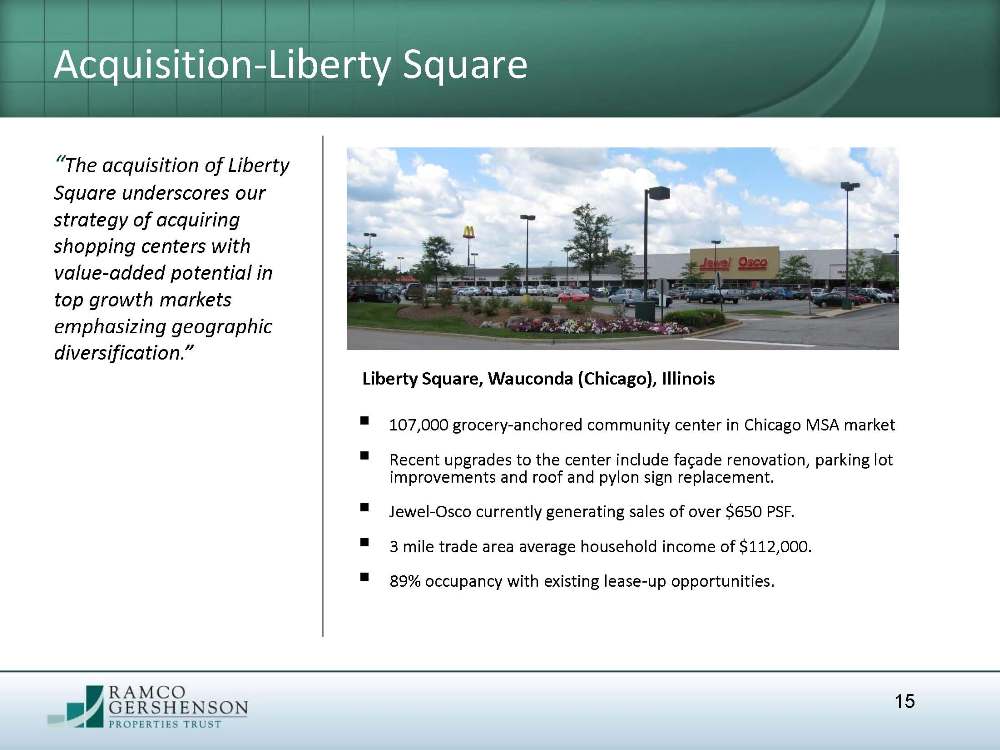
Acquisition-Liberty SquareLiberty square 143.jpg. 107,000 grocery-anchored community center in Chicago MSA market Recent upgrades to the center include façade renovation, parking lot improvements and roof and pylon sign replacement. Jewel-Osco currently generating sales of over $650 PSF. 3 mile trade area average household income of $112,000. 89% occupancy with existing lease-up opportunities. Liberty Square, Wauconda (Chicago), Illinois The acquisition of Liberty Square underscores our strategy of acquiring shopping centers with value-added potential in top growth markets emphasizing geographic diversification.
Strengthened Balance Sheet
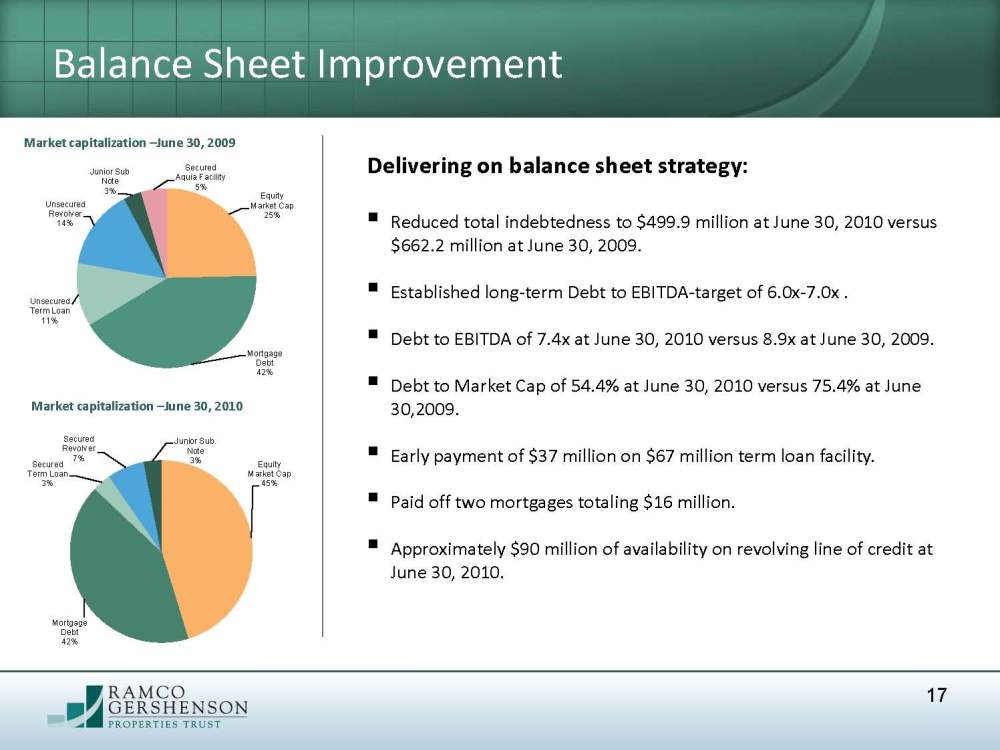
Delivering on balance sheet strategy: Reduced total indebtedness to $499.9 million at June 30, 2010 versus $662.2 million at June 30, 2009. Established long-term Debt to EBITDA-target of 6.0x-7.0x . Debt to EBITDA of 7.4x at June 30, 2010 versus 8.9x at June 30, 2009. Debt to Market Cap of 54.4% at June 30, 2010 versus 75.4% at June 30,2009. Early payment of $37 million on $67 million term loan facility. Paid off two mortgages totaling $16 million. Approximately $90 million of availability on revolving line of credit at June 30, 2010. Market capitalization June 30, 2010 Balance Sheet Improvement Equity Market Cap45% Mortgage Debt42% Secured Term Loan3% Secured Revolver7% Junior Sub. Note3% Equity Market Cap25% Mortgage Debt42% Unsecured Term Loan11% Unsecured Revolver14% Junior Sub Note3% Secured Aquia Facility5% Market capitalization June 30, 2009
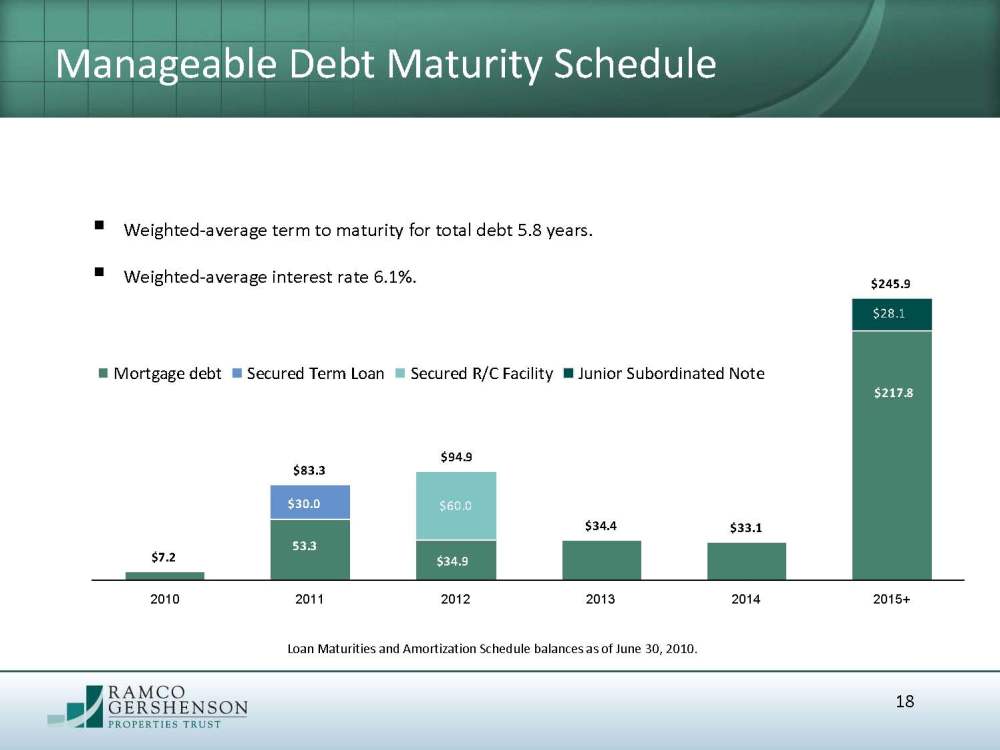
Manageable Debt Maturity Schedule $60.0 $28.1 $7.2 $34.4 $33.1 $94.9 $245.9 $83.3 2010 2011 2012 2013 2014 2015+ Mortgage debt Secured Term Loan Secured R/C Facility Junior Subordinated Note 53.3 53.3 217.8 $30.0 $34.9 Weighted-average term to maturity for total debt 5.8 years. Weighted-average interest rate 6.1%. Loan Maturities and Amortization Schedule balances as of June 30, 2010.
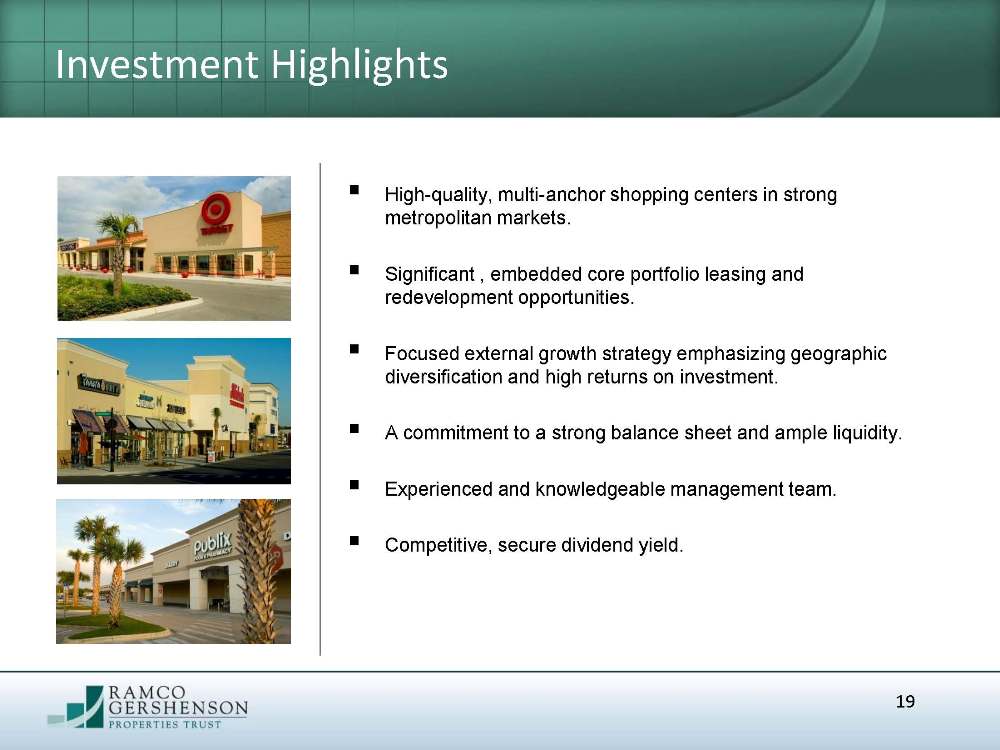
High-quality, multi-anchor shopping centers in strong metropolitan markets. Significant , embedded core portfolio leasing and redevelopment opportunities. Focused external growth strategy emphasizing geographic diversification and high returns on investment. A commitment to a strong balance sheet and ample liquidity. Experienced and knowledgeable management team. Competitive, secure dividend yield. Investment Highlights
Safe Harbor Statement Ramco-Gershenson Properties Trust considers portions of this information to be forward-looking statements within the meaning of Section 27A of the Securities Act of 1933 and Section 21E of the Securities Exchange Act of 1934, both as amended, with respect to the Company’s expectation for future periods. Although the Company believes that the expectations reflected in such forward-looking statements are based upon reasonable assumptions, it can give no assurance that its expectations will be achieved. For this purpose, any statements contained herein that are not historical fact may be deemed to be forward-looking statements. Certain factors could occur that might cause actual results to vary. These include our success or failure in implementing our business strategy, economic conditions generally and in the commercial real estate and finance markets specifically, our cost of capital, which depends in part on our asset quality, our relationships with lenders and other capital providers, our business prospects and outlook, changes in governmental regulations, tax rates and similar matters, and our continuing to qualify as a REIT, and other factors discussed in the Company’s reports filed with the Securities and Exchange Commission.
Quality Shopping Center Portfolio