Attached files
Table of Contents
UNITED STATES
SECURITIES AND EXCHANGE COMMISSION
Washington, D.C. 20549
FORM 10-K
| þ | ANNUAL REPORT PURSUANT TO SECTION 13 OR 15(d) OF THE SECURITIES EXCHANGE ACT OF 1934 |
For the fiscal year ended June 30, 2010
or
| ¨ | TRANSITION REPORT PURSUANT TO SECTION 13 OR 15(d) OF THE SECURITIES EXCHANGE ACT OF 1934 |
Commission File Number: 001-34273

CareFusion Corporation
(Exact name of Registrant as specified in its charter)
| Delaware | 26-4123274 | |
| (State or other jurisdiction of incorporation or organization) |
(I.R.S. Employer Identification No.) |
3750 Torrey View Court
San Diego, CA 92130
Telephone: (858) 617-2000
Securities registered pursuant to Section 12(b) of the Act:
| Title of Each Class |
Name of Each Exchange on which Registered | |
| Common Stock, par value $0.01 per share | New York Stock Exchange |
Securities registered pursuant to Section 12(g) of the Act:
None
Indicate by check mark if the registrant is a well-known seasoned issuer, as defined in Rule 405 of the Securities Act. Yes þ No ¨
Indicate by check mark if the registrant is not required to file reports pursuant to Section 13 or Section 15(d) of the Act. Yes ¨ No þ
Indicate by check mark whether the registrant (1) has filed all reports required to be filed by Section 13 or 15(d) of the Securities Exchange Act of 1934 during the preceding 12 months (or for such shorter period that the registrant was required to file such reports), and (2) has been subject to such filing requirements for the past 90 days. Yes þ No ¨
Indicate by check mark whether the registrant has submitted electronically and posted on its corporate Website, if any, every Interactive Data File required to be submitted and posted pursuant to Rule 405 of Regulation S-T (§ 232.405 of this chapter) during the preceding 12 months (or for such shorter period that the registrant was required to submit and post such files). Yes ¨ No ¨
Indicate by check mark if disclosure of delinquent filers pursuant to Item 405 of Regulation S-K (§ 229.405 of this chapter) is not contained herein, and will not be contained, to the best of registrant’s knowledge, in definitive proxy or information statements incorporated by reference in Part III of this Form 10-K or any amendment to this Form 10-K. ¨
Indicate by check mark whether the registrant is a large accelerated filer, an accelerated filer, a non-accelerated filer, or a smaller reporting company. See the definitions of “large accelerated filer”, “accelerated filer”, and “smaller reporting company” in Rule 12b-2 of the Exchange Act.
| Large accelerated filer ¨ |
Accelerated filer ¨ | Non-accelerated filer þ | Smaller reporting company ¨ |
Indicate by check mark whether the registrant is a shell company (as defined in Rule 12b-2 of the Act). Yes ¨ No þ
The aggregate market value of the voting common stock held by non-affiliates based on the closing stock price on December 31, 2009, was $5,551,367,009. For purposes of this computation only, all executive officers and directors have been deemed affiliates; neither Cardinal Health, Inc. nor any of the registrant’s 5% greater stockholders are affiliates.
Documents Incorporated by Reference:
Portions of the registrant’s Proxy Statement to be filed for its 2010 Annual Meeting of Stockholders are incorporated by reference into Part III of this Annual Report on Form 10-K.
Table of Contents
i
Table of Contents
Important Information Regarding Forward-Looking Statements
Portions of this Annual Report on Form 10-K (including information incorporated by reference) include “forward-looking statements” based on our current beliefs, expectations and projections regarding our business strategies, market potential, future financial performance, industry and other matters. This includes, in particular, “Item 7 — Management’s Discussion and Analysis of Financial Condition and Results of Operations” of this Annual Report on Form 10-K as well as other portions of this Annual Report on Form 10-K. The words “believe”, “expect”, “anticipate”, “project”, “could”, “would”, and similar expressions, among others, generally identify “forward-looking statements”, which speak only as of the date the statements were made. The matters discussed in these forward-looking statements are subject to risks, uncertainties and other factors that could cause actual results to differ materially from those projected, anticipated, or implied in the forward-looking statements. The most significant of these risks, uncertainties and other factors are described in this Annual Report on Form 10-K under “Item 1A — Risk Factors”. Except to the limited extent required by applicable law, we undertake no obligation to update or revise any forward-looking statements, whether as a result of new information, future events, or otherwise.
ii
Table of Contents
| ITEM 1. | BUSINESS |
Overview
We are a global medical technology company with clinically proven and industry-leading products and services designed to measurably improve the safety and quality of healthcare. Our offerings include established brands used in hospitals throughout the United States and in more than 130 countries worldwide.
We offer comprehensive product lines in the areas of intravenous (“IV”) infusion, medication and supply dispensing, respiratory care, infection prevention and surgical instruments. Our primary product brands include:
| • | Alaris IV infusion systems that feature our proprietary Guardrails software, an application that alerts the clinician when a parameter is outside the institution’s pre-established limitations for that medication, thereby helping to reduce IV medication errors; |
| • | Pyxis automated medication dispensing systems that provide comprehensive medication management and Pyxis automated medical supply dispensing systems; |
| • | AVEA and Pulmonetic Systems ventilation and respiratory products, and Jaeger and SensorMedics pulmonary products; |
| • | ChloraPrep skin antiseptic products that help prevent vascular and surgical-site infections and MedMined software and surveillance services that help target and reduce healthcare-associated infections (“HAIs”); and |
| • | V. Mueller surgical instruments and related products and services. |
For the fiscal years ended June 30, 2010 and 2009, we generated revenue of $3.9 billion and $3.6 billion respectively, and income from continuing operations of $171 million in fiscal year 2010 and $290 million in fiscal year 2009. Approximately 69% of our fiscal year 2010 revenue was from customers in the United States and 31% was from customers outside of the United States.
Separation from Cardinal Health
We were incorporated in Delaware on January 14, 2009 for the purpose of holding Cardinal Health, Inc.’s clinical and medical products businesses in anticipation of spinning off from Cardinal Health. We completed the spinoff from Cardinal Health on August 31, 2009. In connection with the spinoff, Cardinal Health contributed the majority of the businesses comprising its clinical and medical products segment to us (“the contribution”), and distributed approximately 81% of our outstanding common stock, or approximately 179.8 million shares, to its shareholders (“the distribution”), based on a distribution ratio of 0.5 shares of our common stock for each common share of Cardinal Health held on the record date of August 25, 2009. Cardinal Health retained approximately 19% of our outstanding common stock, or approximately 41.4 million shares, in connection with the spinoff. As a condition to the separation, Cardinal Health is required to dispose of the remaining 19% of our common stock within five years of the distribution date.
Until our separation from Cardinal Health on August 31, 2009, CareFusion Corporation was a wholly owned subsidiary of Cardinal Health. Accordingly, our historical financial information for the fiscal year ended June 30, 2009 and prior years does not reflect our results as a separate, stand-alone company. In this Annual Report on Form 10-K, we describe the businesses contributed to us by Cardinal Health in the spinoff as if they were our businesses for all historical periods described. References in this Annual Report on Form 10-K to our historical assets, liabilities, products, businesses or activities of our business are generally intended to refer to the historical assets, liabilities, products, businesses or activities of the contributed businesses, as conducted as part of Cardinal Health and its subsidiaries prior to the spinoff. In connection with the spinoff, Cardinal Health retained certain lines of business that manufacture and sell surgical and exam gloves, drapes and apparel and fluid management
1
Table of Contents
products in the United States markets that were historically managed by us prior to the spinoff, which were part of the clinical and medical products businesses of Cardinal Health. These lines of businesses are reflected in the CareFusion financial information included throughout this Annual Report on Form 10-K as discontinued operations.
Our Strengths
We possess a number of competitive advantages that distinguish us from our competitors, including:
Scale and focus. We are one of the largest medical technology companies in the world, with long-standing customer relationships, a global presence, and a focus on helping clinicians improve patient safety. The prevalence and magnitude of medical errors and HAIs have put patient safety among the top issues for hospitals, regulators and payers in the United States and increasingly, worldwide. We believe that we are well-positioned to address these global quality and patient safety needs by providing products and services that help hospitals and other healthcare providers prevent medication errors, reduce infections, and manage medications and supplies more efficiently.
Technology leadership and innovation. We have a long history of innovation and developing products and services that enable our customers to deliver safer and more cost-effective patient care. We pioneered the concept of a “smart” infusion pump that alerts the clinician when a parameter is outside the institution’s pre-established limitations for that medication, and we created the market for medication dispensing machines that automate the management of medications from the pharmacy to the nursing unit. We have also integrated our products with other information systems within the hospital, including financial and business systems that support patient admissions, discharges and transfers, operational systems that include inventory management and clinical systems that include pharmacy information and electronic medical records. We were the first to integrate automated supply dispensing systems with clinical information systems that enable clinicians to chart, charge and reorder supplies with the touch of a button. Today, we have an extensive library of healthcare information system interfaces, with almost 17,000 distinct interfaces to almost 300 vendor systems in almost 3,500 facilities domestically. These interfaces allow us to integrate our products with any of the major information technology products in healthcare. In the respiratory care arena, we have strong positions with technologies used in the diagnosis and treatment of pulmonary and sleep-related disorders. We believe that our strong heritage of leadership and innovation provides us with a solid foundation for the continued development of safe and cost-effective products that will enable us to continue to grow our revenue.
Industry expertise. We employ a wide range of experienced clinical professionals, including doctors, nurses and pharmacists, who bring a detailed understanding of how providers use our products and the current state of clinical practice, including best practices for infusion, medication management, infection prevention and respiratory therapy. These experts enable us to develop innovative and industry-leading products and services because of their in-depth understanding of the medical and clinical protocols for our products.
Focus on customer service. As of June 30, 2010, we employed more than 800 sales people in the United States and over 1,500 field, clinical and technical service personnel. We work with our customers to optimize their workflow as we meet their equipment needs, allowing them to deliver the highest level of patient care and reduce operating costs. We provide on-site clinical and technical support, product effectiveness tracking and customer training to provide the support necessary to maximize medication safety.
Strategy
We seek to grow our business by, among other things:
Focusing on healthcare safety and productivity. We intend to continue to address the global priority of quality and patient safety by providing products and services that help hospitals and other healthcare providers prevent
2
Table of Contents
medication errors, reduce infections and manage medications and supplies more efficiently, which helps to reduce overall costs for our customers. Productivity and safety are rapidly becoming the standards by which healthcare providers are measured and compensated. We intend to continue to expand our product portfolio with additional and enhanced products and services that enable hospitals and other healthcare providers to reduce medication errors and overall treatment costs.
Focusing on innovative and clinically proven products. With hospitals and other healthcare providers increasingly adopting outcome-based standards as a key part of their decision-making processes, we will offer additional and enhanced products and services that demonstrate clinical differentiation by providing a proven solution with simple and compelling economic benefits. We intend to increase our investment in research and development to bring to market products that make it easy for providers to follow evidence-based protocols in patient care. In fiscal year 2010, we introduced 27 new or enhanced products, and our innovation pipeline includes numerous additional new or enhanced products that are expected to be launched in the next few years.
Accelerating global growth. Our industry-leading positions in the United States markets in which we currently operate provide us with a platform for growth outside of the United States. Because our products and technologies have similar applications around the world, we intend to focus on expanding our operations in select developed and emerging markets outside the United States. We also intend to invest in expanding our research and development capabilities to better tailor products to the needs of markets outside the United States.
Pursuing strategic opportunities. We intend to continue to explore organic growth, strategic alliances and acquisition opportunities that enable us to address our customers’ key concerns of productivity and medication safety. We intend to selectively pursue strategic opportunities that give us access to innovative technologies, complementary product lines or new markets, yet remain consistent with our focus on productivity and safety. Our business strategy also involves assessing our portfolio of businesses with a view of divesting non-core businesses and product lines that do not align with our objectives.
Acquisitions and Dispositions
Our business was formed principally through a series of acquisitions by Cardinal Health of established healthcare companies. Since our separation from Cardinal Health, we have taken steps to expand our product offerings through acquisitions and to divest non-core businesses. In May 2010, we acquired Medegen, LLC (“Medegen”), a manufacturer of clinically differentiated IV needleless access valves and administration sets, for $224 million in cash. In addition, during fiscal year 2010 we divested our Audiology business and our Research Services business.
Business Segments
Our business consists of two reporting segments: Critical Care Technologies and Medical Technologies and Services.
| • | Critical Care Technologies includes our infusion, dispensing and respiratory care businesses that develop, manufacture and sell capital equipment and related dedicated and non-dedicated disposables. |
| • | Medical Technologies and Services includes our infection prevention and medical specialties products and services businesses that develop, manufacture and sell primarily single-use, disposable products and reusable surgical instruments. |
See note 16 to the audited consolidated and combined financial statements for certain segment financial data relating to our business.
3
Table of Contents
Critical Care Technologies Segment
In our Critical Care Technologies (“CCT”) segment, we develop, manufacture and market equipment and related supplies for infusion, medication and supply dispensing, and respiratory care. We believe our products enable healthcare professionals to improve patient safety by reducing medication errors and improving administrative controls, while simultaneously improving workflow and increasing operational efficiency. This segment primarily sells capital equipment and related dedicated and non-dedicated disposable products. We sell these products primarily through our direct sales force, but use third-party distributors as well, particularly outside the United States.
Our products in this segment are integrated with other information systems within the hospital, including financial and business systems that support patient admissions, discharges and transfers, operational systems that include inventory management and clinical systems that include pharmacy information and electronic medical records. Today, we have an extensive library of healthcare information system interfaces, with almost 17,000 distinct interfaces to almost 300 vendor systems in almost 3,500 facilities domestically.
In addition to our range of infusion and dispensing systems and respiratory products, we also offer a comprehensive group of value-added services and programs, software technical services and clinical education. Our project management teams help our customers develop a project implementation plan and help to ensure a rapid, seamless implementation of our products.
We offer a field service organization as well as customer call centers to support our customers before, during and after product installation. Our field service organization provides on-site expertise to resolve customers’ service issues, and we operate several customer call centers to provide additional support to our customers. We also maintain a remote access system to help us quickly diagnose and rapidly resolve customers’ service issues.
The following chart presents the CCT segment’s key product lines:
| Key Product Lines | ||
| Infusion |
IV medication safety and infusion therapy delivery systems, including dedicated and non-dedicated disposables, software applications and related patient monitoring equipment (sold under the Alaris, SmartSite, MaxPlus and MaxGuard brands) | |
| Dispensing |
Automated dispensing machines and related applications for distributing and managing medication and medical supplies (sold under the Pyxis brand) | |
| Respiratory Care |
Equipment and supplies for ventilation and respiratory and sleep diagnostics (sold under the AVEA, Pulmonetic Systems, Jaeger and SensorMedics brands) | |
Infusion
We are a leader in the design, development and marketing of IV medication technology, including IV infusion systems that deliver medications and other fluids directly into a patient’s veins in precise, measured quantities over a wide range of infusion rates. We have the largest installed base of large volume infusion pumps (a key component of the infusion system) in the United States. We sell infusion products primarily to hospitals, ambulatory surgical centers and transport services.
The international infusion systems market is more regionalized and fragmented than the United States market, and we have developed infusion products tailored to meet the different needs of this market. As regions become more aware of the importance of patient safety, we expect the demand for more sophisticated products will increase as it has in the United States. We have an established presence in countries that have already recognized the importance of patient safety, such as the United Kingdom and Australia.
4
Table of Contents
Our Alaris System enables healthcare professionals to administer intravenous fluids while at the same time monitoring vital signs such as respiratory activity and blood oxygen levels. The Guardrails software application alerts a clinician when a parameter is outside the institution’s pre-established limitations (known as a “data set”) for that medication, thereby helping to reduce IV medication errors. Using a centralized server, data sets can be uploaded wirelessly to the individual Alaris System units and continuous quality improvement (“CQI”) data can be downloaded from the Alaris System. The CQI data is then used to refine the data sets. In addition, the centralized server makes it possible to send infusion system data to other hospital information systems, including electronic medication administration records, pharmacy information systems, alarms, management applications and documentation systems.
We offer a full range of disposable IV administration sets and accessories, many of which feature our proprietary SmartSite needle-free valves and patented technology designed to help health care providers reduce catheter-related blood stream infections (“CRBSI”) and prevent catheter occlusions. In addition, our acquisition of Medegen in May 2010 expanded our product offerings to include clinically differentiated IV needleless access valves and administration sets, which we expect to drive continued market penetration and innovation. In North America, each of our current large volume infusion pumps uses only dedicated disposable administration sets designed and manufactured by or for us for that particular pump.
Dispensing
We are the leading provider of point-of-care systems that automate the dispensing of medications and supplies in hospitals and other healthcare facilities in the United States, where about one out of every two acute care hospitals use our flagship product line, the Pyxis MedStation system. We sell our dispensing products primarily to hospitals and other healthcare facilities including oncology clinics, ambulatory surgical centers, long-term care facilities and physician offices.
Internationally, the standards for clinical and pharmacy practice, the prevalence of clinical information systems and the regulatory and reimbursement policies tend to vary by country and region. As such, the current market for our medication and supply dispensing products is in an early stage of development. We consider the international market for these products to be a long-term growth opportunity.
Studies show that the medication process is the most complex and therefore one of the largest sources of hospital inefficiencies. In 1989, we championed the concept of decentralized medication management — where medications are securely maintained and accessed at the nurse’s unit — and became the first to introduce automated dispensing products to the market. Our products are designed to help healthcare professionals reduce medication errors, enhance administrative controls, improve clinician workflow, increase operational efficiency and improve billing accuracy. Our products enable healthcare professionals to provide safer patient care by helping to ensure that the right medications are delivered in the right doses via the right routes to the right patients at the right times.
Our Pyxis medication management products automate the management of medications from the pharmacy to the nursing unit and integrate with other operational and information systems within the hospital. Other Pyxis products that are focused on medication management include the Pyxis Anesthesia system for medication dispensing in the operating room and the PyxisConnect physician order management system, which streamlines the physician order process, decreases order turnaround time and reduces transcription errors. We have other product offerings that, among other things, help to secure, track and replenish supplies of controlled substances and help to ensure the accuracy of medications picked in the pharmacy and delivered to the Pyxis MedStation system.
In addition to medication dispensing, we also offer a comprehensive portfolio of medical supply management systems at the point of use, including the Pyxis SupplyStation system and the Pyxis ProcedureStation system, which are supply dispensing systems with controlled access and radio-frequency features that deliver custom solutions tailored to meet the needs of each customer.
5
Table of Contents
We also offer wireless handheld technology that supports both our infusion and dispensing businesses. Our positive patient identification applications for bedside verification are a critical enabler of our integrated medication management and patient safety capabilities. Using our wireless handheld technologies for positive patient identification can help healthcare providers ensure the safety and accuracy of medication administration, specimen collection and blood transfusions. We believe these technologies can also improve patient charting and review.
To help provide financial flexibility to our customers, we offer them the opportunity to lease our dispensing products. We provide the financing for the majority of our customers under our leasing program rather than relying on third-party providers of credit.
Respiratory Care
We develop, manufacture, market and service products for diagnosis and treatment of pulmonary and sleep-related disorders. Patients with respiratory conditions are among the highest cost, highest risk, largest and fastest-growing hospital populations. Ventilator-associated pneumonia (“VAP”) is the second most common HAI in the United States. We offer an extensive line of industry-leading mechanical ventilators marketed globally that treat respiratory insufficiency caused by illness, injury or premature birth and help to reduce the incidence of VAP. These products are used in a variety of settings, from intensive care units to homecare. We sell our respiratory care products worldwide to a variety of customers including hospitals, clinics, private physicians and research centers.
We also offer high-frequency oscillatory ventilators (“HFOV”) which are specialized devices designed to provide superior pulmonary gas exchange, while protecting the patient’s lungs from damage that may be caused by the cyclic expansion and contraction characteristic of conventional ventilators. Our HFOV products are primarily used to treat children and premature infants who suffer from acute respiratory failure and adults who suffer from acute respiratory distress syndrome.
We are one of the largest manufacturers of lung function testing equipment. We offer a broad line of pulmonary function testing equipment, from basic spirometry products, which measure the rate and volume of breathing, to complete pulmonary function and metabolic systems, which measure a wide range of heart, lung and metabolic functions. Other respiratory products we offer include dedicated disposables such as ventilator circuits (tubing used to connect patients to ventilator machines), oxygen masks, cannulae and suction catheters used to clear the trachea.
We also have an established presence in the sleep diagnostics market and sell products ranging from basic sleep diagnostic systems that monitor a single patient to networked, modular, expandable sleep labs that can monitor multiple patients simultaneously. Our range of products used to treat obstructive sleep apnea consists of face masks, headgear, replacement filters and tubing, and a continuous positive airway pressure (“CPAP”) device for providing the therapy.
Medical Technologies and Services Segment
In our Medical Technologies and Services (“MT&S”) segment, we develop, manufacture and market disposable infection prevention products, software-based infection detection services, surgical and diagnostic instrumentation and neurological monitoring equipment. The majority of products in this segment are used primarily in the operating room and interventional suites, and to a lesser degree in the critical care departments of hospitals. We sell these products and services through a combination of direct sales representatives and third-party distributors.
6
Table of Contents
The following chart presents the MT&S segment’s key product lines:
| Key Product Lines | ||
| Infection Prevention |
For the United States market, skin disinfectant and other patient-preparation, hair-removal and skin-care products and infection detection software (sold under the ChloraPrep and MedMined brands); for international markets, all of the above products and also third-party sourced surgical and exam gloves, drapes and apparel and fluid management products and custom surgical procedure kits | |
| Medical Specialties |
Surgical instruments and related products and services, interventional specialty products, such as diagnostic trays and biopsy needles, drainage catheters and vertebral augmentation products, and neurological monitoring and diagnostic products (surgical instruments sold under the V. Mueller brand) | |
Infection Prevention
Our infection prevention products consist mainly of single-use medical products used in surgical and vascular access procedures. Many of these products enhance patient outcomes by reducing HAIs, such as surgical-site infections and catheter-related bloodstream infections. HAIs are a significant issue for hospitals around the world, and a recent cost estimate by the Centers for Disease Control and Prevention (the “CDC”) puts the economic impact of HAIs between $35 billion and $45 billion per year in the United States alone. As of October 1, 2008, the Centers for Medicare and Medicaid Services no longer reimburse hospitals for the added cost of treating certain HAIs, placing an increased economic burden on hospitals. Most HAI’s are related to routine procedures and occurrences in hospitals; in fact, the CDC estimates that 32% of all HAI’s are urinary tract infections, 22% are surgical site infections, and 14% are bloodstream infections.
In our United States infection prevention business, our key product offering is our line of proprietary ChloraPrep sterile, single-use applicators for patient preoperative skin preparation in vascular access and surgical procedures. ChloraPrep products are used by hospitals and surgery centers to disinfect the skin before surgical and vascular procedures. We began to market the ChloraPrep products upon our acquisition of the assets of Enturia in fiscal year 2008.
ChloraPrep products use the clinically preferred concentration of the skin antiseptic chlorhexidine gluconate (“CHG”) with 70% isopropyl alcohol. Over 35 clinical studies have demonstrated the superiority of CHG to traditional iodine-based products. As a result, more than a dozen internationally recognized agencies and organizations, including the CDC, the Institute for Healthcare Improvement, the National Institutes of Health, the American Association of Critical Care Nurses and the American Academy of Pediatrics support the use of CHG-based formulations for patient skin preparation.
In addition to ChloraPrep products, we also manufacture and market a broad line of patient-preparation, hair-removal and skin-care products, including clippers and razors, special soaps, sponges and scrub brushes for surgeons and other operating room personnel. While our direct selling organization primarily promotes our infection prevention products to acute care hospitals, our products are also used in ambulatory surgical centers and other healthcare settings such as blood banks, dialysis centers and home health and reference labs.
In our international infection prevention business, we primarily sell third-party sourced surgical and exam gloves, drapes and apparel and fluid management products and assemble and sell custom surgical procedure kits. The four key categories in these markets are:
| • | single-use surgical drapes, gowns and apparel that provide barrier protection for patients, doctors and clinical staff during surgery, childbirth and other procedures; |
| • | surgical gloves in both latex and latex-free versions; |
7
Table of Contents
| • | fluid suction and collection systems that consist of disposable suction canisters and liners, suction tubing and supporting hardware and accessories; and |
| • | surgical procedure kits that we custom assemble and often include the surgical drapes we sell. |
We have sales representatives or commissioned agents outside the United States. We have regulatory approval in the United Kingdom to sell ChloraPrep products, and over time our intention is to use our direct selling organization outside the United States to bring ChloraPrep products to international markets.
We also offer MedMined services that feature infection detection software for hospitals, alerting clinicians to early signs of an emerging infection issue and allowing the hospital to target improvement efforts at the right place and the right time. This patented program automatically identifies patterns indicative of specific and correctable quality breakdowns to prevent and treat HAIs. More than 300 hospitals in the United States use MedMined services to help them detect, monitor, prevent and measure outcomes related to HAIs.
Medical Specialties
Our V. Mueller brand is the largest United States supplier of reusable stainless-steel surgical instruments primarily focused on the operating room. V. Mueller is an established brand that has been in business for over 100 years and today enables hospitals and surgeons to manage their surgical instruments to ensure the highest level of safety, productivity, quality and performance. We offer over 25,000 unique surgical instruments, as well as surgical instrument information tracking systems, surgical instrument sterilization container systems and surgical instrument repair services. Key products include clamps, needle holders, retractors, specialty scissors and forceps. Our V. Mueller products are sold predominantly in the United States directly to hospitals through a direct selling organization.
Additionally, we develop and manufacture a variety of medical devices used primarily by interventional radiologists and surgeons in combination with certain image guidance technologies (for example, x-ray, computed tomography and ultrasound). We offer an extensive line of products that support interventional medicine for a variety of clinical disciplines in body and spine pain interventions. Our products include diagnostic trays, bone marrow and soft tissue biopsy needles to diagnose cancer, drainage catheters and vertebral augmentation products to treat painful fractures of the spine. These products are sold predominantly in the United States directly to hospitals.
In addition to the products and services described above, we also develop, manufacture, market and service a comprehensive line of neurological and vascular diagnostic and monitoring products, as well as provide a complete line of accessories for these devices. We sell these neurocare products globally to a variety of customers, including hospitals and other healthcare facilities such as private practice and outpatient clinics, ambulatory surgery centers and physician offices.
Competition
The markets for our products are highly competitive. No one company competes with us across the breadth of our offerings, but individual product lines face significant competition in both our domestic and international markets. We compete based upon quality and reliability, technological innovation, price, customer service and support capabilities, brand recognition, patents and other intellectual property and the value proposition of helping improve patient outcomes while reducing overall costs associated with patient safety. We believe our superior product quality and brand strength give us a competitive advantage. We expect to continue to use our clinical expertise to offer innovative, industry-leading products for our customers.
Customers, Sales and Distribution
Sales to customers in the United States accounted for approximately 69% of our fiscal year 2010 revenue. Our primary end customers in the United States include hospitals, ambulatory surgical centers, clinics, long-term care facilities and physician offices. A substantial portion of our products in the United States are sold to hospitals
8
Table of Contents
that are members of a group purchasing organization (“GPO”), integrated delivery networks (“IDNs”), and through wholesalers and distributors. Included within our product sales to wholesalers and distributors are product sales to Cardinal Health, with whom we have a non-exclusive distribution relationship following the spinoff. We have purchasing agreements for specified products with a wide range of GPOs in the United States. The scope of products included in these agreements varies by GPO. Sales to customers outside the United States comprised approximately 31% of our fiscal year 2010 revenue, including sales to customers in over 130 countries worldwide. Our primary customers in markets outside the United States are hospitals and wholesalers, which are served through a direct sales force with a presence in more than 15 countries and a network of distributors.
Our capital equipment products generally are delivered from our manufacturing facilities directly to the customer. Our disposables and other non-capital equipment products generally are delivered from our manufacturing facilities and from third-party manufacturers to warehouses and from there, the products are delivered to the customer. We contract with a wide range of transport providers to deliver our products by road, rail, sea and air.
Intellectual Property
Patents, trademarks and other proprietary rights are very important to our business. We also rely upon trade secrets, manufacturing know-how, continuing technological innovations and licensing opportunities to maintain and improve our competitive position. We review third-party proprietary rights, including patents and patent applications, as available, in an effort to develop an effective intellectual property strategy, avoid infringement of third-party proprietary rights, identify licensing opportunities and monitor the intellectual property owned by others.
We hold numerous patents and have numerous patent applications pending in the United States and in other countries that relate to aspects of the technology used in many of our products. Our policy is to file patent applications in the United States and other countries when we believe it is commercially advantageous to do so. We do not consider our business to be materially dependent upon any individual patent.
We own or have rights to use the trademarks, service marks and trade names that we use in conjunction with the operation of our business. Some of the more important trademarks that we own or have rights to use that appear in this Annual Report on Form 10-K include: CareFusionTM, Alaris®, Guardrails®, Pyxis®, AVEA®, Pulmonetic SystemsTM, Jaeger®, SensorMedics®, ChloraPrep®, V. Mueller®, SmartSite®, MedStation®, PyxisConnect®, Pyxis SupplyStationTM, Pyxis ProcedureStationTM, MedMinedTM, Convertors®, Presource®, CardinalASSISTTM, EnVeTM, Valuelink®, MaxPlusTM and MaxGuardTM which may be registered or trademarked in the United States and other jurisdictions.
Research and Development
We continuously engage in research and development to introduce new products and enhance the effectiveness, ease of use, safety and reliability of our existing products. Our research and development efforts include internal initiatives as well as collaborative development opportunities with third parties and licensing or acquiring technology from third parties. We employ engineers, software developers, clinicians and scientists in research and development worldwide. These experts enable us to create innovative, industry-leading products and services because of their in-depth understanding of the medical and clinical protocols for our product lines. Our research and development expenses were $159 million, $160 million and $157 million in fiscal years 2010, 2009 and 2008, respectively. We evaluate developing technologies in areas where we have technological or marketing expertise for possible investment or acquisition.
We intend to continue our focus on research and development as a key strategy for growth, which will focus on internal and external investments in those fields that we believe will offer the greatest opportunity for growth and profitability.
9
Table of Contents
Quality Management
We place significant emphasis on providing quality products and services to our customers. Quality management plays an essential role in understanding and meeting customer requirements, effectively resolving quality issues and improving our products and services. We have a network of quality systems throughout our business units and facilities that relate to the design, development, manufacturing, packaging, sterilization, handling, distribution and labeling of our products. To assess and facilitate compliance with applicable requirements, we regularly review our quality systems to determine their effectiveness and identify areas for improvement. We also perform assessments of our suppliers of raw materials, components and finished goods. In addition, we conduct quality management reviews designed to inform management of key issues that may affect the quality of products and services.
From time to time, we may determine that products manufactured or marketed by us do not meet our specifications, published standards or regulatory requirements. When a quality issue is identified, we investigate the issue and seek to take appropriate corrective action, such as withdrawal of the product from the market, correction of the product at the customer location, notice to the customer of revised labeling or other actions. Any of these actions could have an adverse effect on our business.
Regulatory Matters
Regulation of Medical Devices in the United States
The development, manufacture, sale and distribution of our medical device products are subject to comprehensive governmental regulation. Most notably, all of our medical devices sold in the United States are subject to the Federal Food, Drug and Cosmetic Act (“FDC Act”), as implemented and enforced by the United States Food and Drug Administration (“FDA”). The FDA, and in some cases other government agencies, administers requirements covering the design, testing, safety, effectiveness, manufacturing, labeling, promotion and advertising, distribution and post-market surveillance of our products.
Unless an exemption applies, each medical device that we market must first receive either premarket notification clearance (by making a 510(k) submission) or premarket approval (by filing a premarket approval application (“PMA”)) from the FDA pursuant to the FDC Act. In addition, certain modifications made to marketed devices also may require 510(k) clearance or approval of a PMA supplement. The FDA’s 510(k) clearance process usually takes from four to twelve months, but it can last longer. The process of obtaining PMA approval is much more costly, lengthy and uncertain. It generally takes from one to three years or even longer. The FDA has recently announced recommendations following two task force investigations into the agency’s medical device 510(k) clearance process. If implemented, these recommendations would make the 510(k) clearance process more expensive for us, and could result in delays of future launches of new or modified medical devices. We cannot be sure that 510(k) clearance or PMA approval will be obtained for any product that we propose to market.
After a device is placed on the market, numerous regulatory requirements continue to apply. Those regulatory requirements include the following: product listing and establishment registration; adherence to the Quality System Regulation (“QSR”) which requires stringent design, testing, control, documentation and other quality assurance procedures; labeling requirements and FDA prohibitions against the promotion of off-label uses or indications; adverse event reporting; post-approval restrictions or conditions, including post-approval clinical trials or other required testing; post-market surveillance requirements; the FDA’s recall authority, whereby it can ask for, or require, the recall of products from the market; and requirements relating to voluntary corrections or removals.
Our manufacturing facilities, as well as those of certain of our suppliers, are subject to periodic and for-cause inspections to verify compliance with the QSR as well as other regulatory requirements. If the FDA were to find
10
Table of Contents
that we or certain of our suppliers have failed to comply with applicable regulations, it could institute a wide variety of enforcement actions, ranging from a public warning letter to more severe sanctions, such as product recalls or seizures, monetary sanctions, consent decrees, injunctions to halt manufacturing and distributing products, civil or criminal sanctions, refusal to grant clearances or approvals or delays in granting such clearances or approvals, import detentions of products made outside of the United States, restrictions on operations or withdrawal or suspension of existing approvals. The FDA also has the authority to request repair, replacement or refund of the cost of any medical device manufactured or distributed by us. Any of these actions could have an adverse effect on our business.
Regulation of Medical Devices Outside of the United States
Medical device laws also are in effect in many of the non-United States markets in which we do business. These laws range from comprehensive device approval requirements for some or all of our products to requests for product data or certifications. Inspection of and controls over manufacturing, as well as monitoring of device-related adverse events, also are components of most of these regulatory systems. Most of our business is subject to varying degrees of governmental regulation in the countries in which we operate, and the general trend is toward increasingly stringent regulation. For example, the European Commission (“EC”) has harmonized national regulations for the control of medical devices through European Medical Device Directives with which manufacturers must comply. Under these regulations, manufacturers must have received product EC certification from a “notified body” in order to be able to sell products within the member states of the European Union. Certification allows manufacturers to stamp the products with an “EC” mark. Products covered by the EC regulations that do not bear the EC mark may not be sold or distributed within the European Union.
Regulation of Drugs
We market a line of topical antiseptics under the ChloraPrep brand name that are regulated by the FDA and comparable international authorities as nonprescription or over-the-counter (“OTC”) drugs. Some of these products are marketed under a new drug application approved by the FDA or its international counterparts. OTC drugs are regulated in the same fashion as prescription drugs in that we must comply with good manufacturing practices, our manufacturing facilities (or those of our contract manufacturers) must be registered and all facilities are subject to inspection by federal and state authorities. Outside the United States, regulatory authorities regulate our OTC products in a manner similar to the FDA. In the United States, advertising of OTC drugs is regulated by the Federal Trade Commission, which imposes certain restrictions on our promotional activities for these products. If we (or our suppliers) fail to comply with regulatory requirements, we could face sanctions ranging from warning letters, injunctions, product seizures, civil or criminal enforcement actions, consent decrees, or removal of the product from distribution. Any of these actions could have an adverse effect on our business.
Healthcare Laws
We are subject to various federal, state and local laws in the United States targeting fraud and abuse in the healthcare industry, which generally prohibit us from soliciting, offering, receiving or paying any remuneration in order to induce the ordering or purchasing of items or services that are in any way paid for by Medicare, Medicaid or other government-sponsored healthcare programs. Healthcare costs have been and continue to be a subject of study, investigation and regulation by governmental agencies and legislative bodies around the world. The United States federal government continues to scrutinize potentially fraudulent practices affecting Medicare, Medicaid and other government healthcare programs. Payers have become more influential in the marketplace and increasingly are focused on drug and medical device pricing, appropriate drug and medical device utilization and the quality and costs of healthcare. Violations of fraud and abuse-related laws are punishable by criminal or civil sanctions, including substantial fines, imprisonment and exclusion from participation in healthcare programs such as Medicare and Medicaid.
11
Table of Contents
Other Regulatory Requirements
We are also subject to the United States Foreign Corrupt Practices Act and similar anti-bribery laws applicable in non-United States jurisdictions that generally prohibit companies and their intermediaries from making improper payments to non-United States government officials for the purpose of obtaining or retaining business. Because of the predominance of government-sponsored healthcare systems around the world, most of our customer relationships outside of the United States are with governmental entities and are therefore subject to such anti-bribery laws. Our policies mandate compliance with these anti-bribery laws. We operate in many parts of the world that have experienced governmental corruption to some degree, and in certain circumstances strict compliance with anti-bribery laws may conflict with local customs and practices. In the sale, delivery and servicing of our medical devices and software outside of the United States, we must also comply with various export control and trade embargo laws and regulations, including those administered by the Department of Treasury’s Office of Foreign Assets Control (“OFAC”) and the Department of Commerce’s Bureau of Industry and Security (“BIS”) which may require licenses or other authorizations for transactions relating to certain countries and/or with certain individuals identified by the United States government. Despite our global trade and compliance program, our internal control policies and procedures may not always protect us from reckless or criminal acts committed by our employees or agents. Violations of these requirements are punishable by criminal or civil sanctions, including substantial fines and imprisonment.
Raw Materials
We use a wide variety of resin, metals and electrical components for production of our products. We primarily purchase these materials from external suppliers, some of which are single-source suppliers. We purchase materials from selected suppliers based on quality assurance, cost effectiveness and constraints resulting from regulatory requirements, and we work closely with our suppliers to assure continuity of supply while maintaining high quality and reliability. Global commodity pricing can ultimately affect pricing of certain of these raw materials. Though we believe we have adequate available sources of raw materials, there can be no guarantee that we will be able to access the quantity of raw material needed to sustain operations as well as at a cost effective price.
Environmental
Our manufacturing operations worldwide are subject to many requirements under environmental laws. In the United States, the United States Environmental Protection Agency and similar state agencies administer laws that restrict the emission of pollutants into the air, discharges of pollutants into bodies of water and disposal of pollutants on the ground. Violations of these laws can result in significant civil and criminal penalties and incarceration. The failure to obtain a permit for certain activities may be a violation of environmental law and subject the owner and operator to civil and criminal sanctions. Most environmental agencies also have the power to shut down an operation if it is operating in violation of environmental law. United States laws also typically allow citizens to bring private enforcement actions in some situations. Outside the United States, the environmental laws and their enforcement vary and may be more burdensome. For example, some European countries impose environmental taxes or require manufacturers to take back used products at the end of their useful life, and others restrict the materials that manufacturers may use in their products and require redesign and labeling of products. Although such laws do not currently have a significant impact on our products, they are expanding rapidly in Europe. We have management programs and processes in place that are intended to minimize the potential for violations of these laws.
Other environmental laws, primarily in the United States, address the contamination of land and groundwater and require the clean-up of such contamination. These laws may apply not only to the owner or operator of an on-going business, but also to the owner of land contaminated by a prior owner or operator. In addition, if a parcel is contaminated by the release of a hazardous substance, such as through its historic use as a disposal site, any person or company that has contributed to that contamination, whether or not it has a legal interest in the land, may be subject to a requirement to clean up the parcel.
12
Table of Contents
Employees
At June 30, 2010, we employed over 15,000 people across our global operations, with approximately 7,100 employed in the United States. In Europe, some of our employees are represented by unions or works councils. Overall, we consider our employee relations to be good.
Available Information
We post on our public website our Annual Report on Form 10-K, Quarterly Reports on Form 10-Q, Current Reports on Form 8-K, and amendments to those reports filed or furnished pursuant to Section 13(a) or 15(d) of the Securities Exchange Act of 1934, as amended, as soon as reasonably practicable after we electronically file such material with, or furnish it to, the Securities and Exchange Commission (“SEC”). These materials can be found in the Investor Relations section of our website by clicking the “Financial Information” link and then the “SEC Filings” link. Copies of any of these documents may be obtained free of charge through our website or by contacting our Investor Relations Department at 3750 Torrey View Court, San Diego, California, 92130, or by calling 1-888-876-4287.
You may read and copy any materials we file with the SEC at the SEC’s Public Reference Room at 100 F Street, NE, Washington, DC 20549. You may obtain information on the operation of the Public Reference Room by calling the SEC at 1-800-SEC-0330. The SEC also maintains an Internet site that contains our reports, proxy and information statements, and other information at www.sec.gov.
We have included the certifications of our Chief Executive Officer and Chief Financial Officer required by Section 302 and 906 of the Sarbanes-Oxley Act of 2002 and related rules, relating to the quality of our public disclosure, as exhibits to this Annual Report on Form 10-K.
| ITEM 1A. | RISK FACTORS |
We urge you to carefully consider the following risks and other information in this Annual Report on Form 10-K in evaluating us and our common stock. Any of the following risks, as well as additional risks and uncertainties not currently known to us or that we currently deem immaterial, could materially and adversely affect our results of operations or financial condition. The risk factors generally have been separated into three groups: risks related to our business, risks related to the separation and risks related to our common stock.
Risks Related to Our Business
We may be unable to effectively enhance our existing products or introduce and market new products or may fail to keep pace with advances in technology.
The healthcare industry is characterized by evolving technologies and industry standards, frequent new product introductions, significant competition and dynamic customer requirements that may render existing products obsolete or less competitive. As a result, our position in the industry could erode rapidly due to unforeseen changes in the features and functions of competing products, as well as the pricing models for such products. The success of our business depends on our ability to enhance our existing products and to develop and introduce new products and adapt to these changing technologies and customer requirements. The success of new product development depends on many factors, including our ability to anticipate and satisfy customer needs, obtain regulatory approvals and clearances on a timely basis, develop and manufacture products in a cost-effective and
13
Table of Contents
timely manner, maintain advantageous positions with respect to intellectual property and differentiate our products from those of our competitors. To compete successfully in the marketplace, we must make substantial investments in new product development whether internally or externally through licensing, acquisitions or joint development agreements. Our failure to enhance our existing products or introduce new and innovative products in a timely manner would have an adverse effect on our results of operations and financial condition.
Even if we are able to develop, manufacture and obtain regulatory approvals and clearances for our new products, the success of those products would depend upon market acceptance. Levels of market acceptance for our new products could be affected by several factors, including:
| • | the availability of alternative products from our competitors; |
| • | the price and reliability of our products relative to that of our competitors; |
| • | the timing of our market entry; and |
| • | our ability to market and distribute our products effectively. |
We are subject to complex and costly regulation.
Our products are subject to regulation by the FDA and other national, supranational, federal and state governmental authorities. It can be costly and time-consuming to obtain regulatory clearance and/or approval to market a medical device or other product. Clearance and/or approval might not be granted for a new or modified device or other product on a timely basis, if at all. Regulations are subject to change as a result of legislative, administrative or judicial action, which may further increase our costs or reduce sales. In addition, we are subject to regulations covering manufacturing practices, product labeling and advertising, and adverse-event reporting that apply after we have obtained clearance or approval to sell a product. Our failure to maintain clearances or approvals for existing products, to obtain clearance or approval for new or modified products, or to adhere to regulations for manufacturing, labeling, advertising or adverse event reporting could adversely affect our results of operations and financial condition. Further, if we determine a product manufactured or marketed by us does not meet our specifications, published standards or regulatory requirements, we may seek to correct the product or withdraw the product from the market, which could have an adverse effect on our business. Many of our facilities and procedures and those of our suppliers are subject to ongoing oversight, including periodic inspection by governmental authorities. Compliance with production, safety, quality control and quality assurance regulations can be costly and time-consuming.
In addition, if our sales and marketing activities fail to comply with FDA regulations or guidelines, or other applicable laws, we may be subject to warnings or enforcement actions from the FDA or other enforcement bodies. A number of companies in the healthcare industry have been the subject of enforcement actions related to their sales and marketing practices, including their relationships with doctors and off-label promotion of products. If we were to become the subject of a similar enforcement action, it could result in negative publicity, penalties, fines, the exclusion of our products from reimbursement under federally-funded programs and/or prohibitions on our ability to sell our products, which could have an adverse effect on our results of operations and financial condition.
Cost-containment efforts of our customers, purchasing groups, third-party payers and governmental organizations could adversely affect our sales and profitability.
Many existing and potential customers for our products within the United States are members of GPOs and IDNs in an effort to reduce costs. GPOs and IDNs negotiate pricing arrangements with healthcare product manufacturers and distributors and offer the negotiated prices to affiliated hospitals and other members. Due to the highly competitive nature of the GPO and IDN contracting processes, we may not be able to obtain or maintain contract positions with major GPOs and IDNs across our product portfolio. Furthermore, the increasing leverage of organized buying groups may reduce market prices for our products, thereby reducing our profitability.
14
Table of Contents
While having a contract with a GPO or IDN can facilitate sales to members of that GPO or IDN, it is no assurance that sales volume of those products will be maintained. The members of such groups may choose to purchase from our competitors due to the price or quality offered by such competitors, which could result in a decline in our sales and profitability.
In addition, our capital equipment products typically represent a sizeable initial capital expenditure for healthcare organizations. Changes in the budgets of these organizations, the timing of spending under these budgets and conflicting spending priorities, including changes resulting from adverse economic conditions, can have a significant effect on the demand for our capital equipment products and related services. In addition, the implementation of healthcare reform in the United States, which may reduce or eliminate the amount that healthcare organizations may be reimbursed for our capital equipment products and related services, could further impact demand. Any such decreases in expenditures by these healthcare facilities and decreases in demand for our capital equipment products and related services could have an adverse effect on our results of operations and financial condition.
Distributors of our products may begin to negotiate terms of sale more aggressively in an effort to increase their profitability. Failure to negotiate distribution arrangements having advantageous pricing or other terms of sale could adversely affect our results of operations and financial condition. In addition, if we fail to implement distribution arrangements successfully, it could cause us to lose market share to our competitors.
Outside the United States, we have experienced downward pricing pressure due to the concentration of purchasing power in centralized governmental healthcare authorities and increased efforts by such authorities to lower healthcare costs. Our failure to offer acceptable prices to these customers could adversely affect our sales and profitability in these markets.
Current economic conditions have and may continue to adversely affect our results of operations and financial condition.
Disruptions in the financial markets and other macro-economic challenges currently affecting the economy and the economic outlook of the United States and other parts of the world have had and we expect will continue to have an adverse impact on our results of operations and financial condition. Recessionary conditions and depressed levels of consumer and commercial spending have caused and may continue to cause our customers to reduce, modify, delay or cancel plans to purchase our products and have caused and may continue to cause vendors to reduce their output or change terms of sales. We have observed certain hospitals delaying as well as prioritizing capital purchasing decisions, which has had and we expect will continue to have an adverse impact on our financial results into the foreseeable future. If our customers’ cash flow or operating and financial performance deteriorate or fail to improve, or if they are unable to make scheduled payments or obtain credit, they may not be able to pay, or may delay payment of, accounts receivable owed to us. Likewise, for similar reasons, vendors may restrict credit or impose different payment terms.
We also extend credit through an equipment leasing program for a substantial portion of sales to our dispensing product customers. We are subject to the risk that if these customers fail to pay or delay payment for the dispensing products they purchase from us, it could result in longer payment cycles, increased collection costs, defaults exceeding our expectations and an adverse impact on the cost or availability of financing. These risks related to our equipment leasing program may be exacerbated by a variety of factors, including adverse economic conditions, decreases in demand for our dispensing products and negative trends in the businesses of our leasing customers.
Any inability of current and/or potential customers to pay us for our products or any demands by vendors for different payment terms may adversely affect our results of operations and financial condition.
15
Table of Contents
We may be unable to realize any benefit from our cost reduction and restructuring efforts and our profitability may be hurt or our business otherwise might be adversely affected.
In August 2010, we announced plans for various cost reduction and restructuring activities. These plans are expected to generate operating expense savings of approximately $85 million to $95 million in fiscal year 2011, increasing to annualized savings of $110 million to $120 million in fiscal year 2012 and beyond, through direct and indirect overhead expense reductions and other savings. These types of cost reduction and restructuring activities are complex. If we do not successfully manage our current restructuring activities, or any other restructuring activities that we may take in the future, any expected efficiencies and benefits might be delayed or not realized, and our operations and business could be disrupted. In addition, the costs associated with implementing our restructuring plan might exceed expectations, which could result in additional future charges.
We may be unable to protect our intellectual property rights or may infringe on the intellectual property rights of others.
We rely on a combination of patents, trademarks, copyrights, trade secrets and nondisclosure agreements to protect our proprietary intellectual property. Our efforts to protect our intellectual property and proprietary rights may not be sufficient. We cannot be sure that our pending patent applications will result in the issuance of patents to us, that patents issued to or licensed by us in the past or in the future will not be challenged or circumvented by competitors or that these patents will be found to be valid or sufficiently broad to preclude our competitors from introducing technologies similar to those covered by our patents and patent applications. In addition, our ability to enforce and protect our intellectual property rights may be limited in certain countries outside the United States, which could make it easier for competitors to capture market position in such countries by utilizing technologies that are similar to those developed or licensed by us.
Competitors also may harm our sales by designing products that mirror the capabilities of our products or technology without infringing our intellectual property rights. If we do not obtain sufficient protection for our intellectual property, or if we are unable to effectively enforce our intellectual property rights, our competitiveness could be impaired, which would limit our growth and future revenue.
We operate in an industry characterized by extensive patent litigation. Patent litigation is costly to defend and can result in significant damage awards, including treble damages under certain circumstances, and injunctions that could prevent the manufacture and sale of affected products or force us to make significant royalty payments in order to continue selling the affected products. At any given time, we are involved as either a plaintiff or a defendant in a number of patent infringement actions, the outcomes of which may not be known for prolonged periods of time. We can expect to face additional claims of patent infringement in the future. A successful claim of patent or other intellectual property infringement against us could adversely affect our results of operations and financial condition.
Defects or failures associated with our products and/or our quality system could lead to the filing of adverse event reports, product recalls or safety alerts and negative publicity and could subject us to regulatory actions.
Manufacturing flaws, component failures, design defects, off-label uses or inadequate disclosure of product-related information could result in an unsafe condition or the injury or death of a patient. These problems could lead to a recall of, or issuance of a safety alert relating to, our products and result in significant costs and negative publicity. Due to the strong name recognition of our brands, an adverse event involving one of our products could result in reduced market acceptance and demand for all products within that brand, and could harm our reputation and our ability to market our products in the future. In some circumstances, adverse events arising from or associated with the design, manufacture or marketing of our products could result in the suspension or delay of regulatory reviews of our applications for new product approvals or clearances. We may also voluntarily undertake a recall of our products or temporarily shut down production lines based on internal safety and quality monitoring and testing data.
16
Table of Contents
Our future operating results will depend on our ability to sustain an effective quality control system and effectively train and manage our employee base with respect to our quality system. Our quality system plays an essential role in determining and meeting customer requirements, preventing defects and improving our products and services. While we have a network of quality systems throughout our business units and facilities, quality and safety issues may occur with respect to any of our products. A quality or safety issue may result in public warning letters, product recalls or seizures, monetary sanctions, consent decrees, injunctions to halt manufacturing and distribution of products, civil or criminal sanctions, refusal of a government to grant clearances or approvals or delays in granting such clearances or approvals, import detentions of products made outside the United States, restrictions on operations or withdrawal or suspension of existing approvals. Any of the foregoing events could disrupt our business and have an adverse effect on our results of operations and financial condition.
We are currently operating under an amended consent decree with the FDA and our failure to comply with the requirements of the amended consent decree may have an adverse effect on our business.
We are operating under an amended consent decree with the FDA related to our infusion pump business in the United States. We entered into a consent decree with the FDA in February 2007 related to our Alaris SE pumps, and in February 2009, we and the FDA amended the consent decree to include all infusion pumps manufactured by or for our subsidiary that manufactures and sells infusion pumps in the United States. In accordance with the amended consent decree, and in addition to the requirements of the original consent decree, we implemented a corrective action plan to bring the Alaris System and all other infusion pumps in use in the United States market into compliance, had our infusion pump facilities inspected by an independent expert and had our recall procedures and all ongoing recalls involving our infusion pumps inspected by an independent recall expert. In July 2010, the FDA notified us that we can proceed to the audit inspection phase of the amended consent decree, which includes the requirement to retain an independent expert to conduct periodic audits of our infusion pump facilities. The costs associated with these ongoing audits, and any actions that we may need to take resulting from these audits, could be significant.
We have no reserve in connection with the amended consent decree to cover any future costs and expenses of compliance with the amended consent decree. As such, we may be obligated to pay more costs in the future because, among other things, the FDA may determine that we are not fully compliant with the amended consent decree and therefore impose penalties under the amended consent decree, and/or we may be subject to future proceedings and litigation relating to the matters addressed in the amended consent decree. Moreover, the matters addressed in the amended consent decree could lead to negative publicity that could have an adverse impact on our business. The amended consent decree authorizes the FDA, in the event of any violations in the future, to order us to cease manufacturing and distributing, recall products and take other actions. We may also be required to pay monetary damages if we fail to comply with any provision of the amended consent decree. See note 13 to the audited consolidated and combined financial statements for more information. Any of the foregoing matters could disrupt our business and have an adverse effect on our results of operations and financial condition.
We may incur product liability losses and other litigation liability.
We are, and may be in the future, subject to product liability claims and lawsuits, including potential class actions, alleging that our products have resulted or could result in an unsafe condition or injury. Any product liability claim brought against us, with or without merit, could be costly to defend and could result in settlement payments and adjustments not covered by or in excess of insurance. In addition, we may not be able to obtain insurance on terms acceptable to us or at all because insurance varies in cost and can be difficult to obtain. Our failure to successfully defend against product liability claims or maintain adequate insurance coverage could have an adverse effect on our results of operations and financial condition.
We are involved in a number of legal proceedings. Legal proceedings are inherently unpredictable, and the outcome can result in excessive verdicts and/or injunctive relief that may affect how we operate our business, or
17
Table of Contents
we may enter into settlements of claims for monetary damages that exceed our insurance coverage, if any. Future court decisions and legislative activity may increase our exposure to litigation and regulatory investigations. In some cases, substantial non-economic remedies or punitive damages may be sought.
We rely on the performance of our information technology systems, the failure of which could have an adverse effect on our business and performance.
Our business requires the continued operation of sophisticated information technology systems and network infrastructure. These systems are vulnerable to interruption by fire, power loss, system malfunction and other events, which are beyond our control. Systems interruptions could reduce our ability to manufacture and provide service for our products, and could have an adverse effect on our operations and financial performance. The level of protection and disaster-recovery capability varies from site to site, and there can be no guarantee that any such plans, to the extent they are in place, will be totally effective.
An interruption in our ability to manufacture our products, an inability to obtain key components or raw materials or an increase in the cost of key components or raw materials may adversely affect our business.
Many of our key products are manufactured at single locations, with limited alternate facilities. If an event occurs that results in damage to one or more of our facilities, it may not be possible to timely manufacture the relevant products at previous levels or at all. In addition, for reasons of quality assurance or cost effectiveness, we purchase certain components and raw materials from sole suppliers. We may not be able to quickly establish additional or replacement sources for certain components or materials. A reduction or interruption in manufacturing, or an inability to secure alternative sources of raw materials or components that are acceptable to us, could have an adverse effect on our results of operations and financial condition.
Due to the highly competitive nature of the healthcare industry and the cost containment efforts of our customers and third-party payers, we may be unable to pass along cost increases for key components or raw materials through higher prices to our customers. If the cost of key components or raw materials increases and we are unable fully to recover these increased costs through price increases or offset these increases through other cost reductions, we could experience lower margins and profitability.
We may engage in strategic transactions, including acquisitions, investments, or joint development agreements that may have an adverse effect on our business.
We may pursue transactions, including acquisitions of complementary businesses, technology licensing arrangements and joint development agreements to expand our product offerings and geographic presence as part of our business strategy. These transactions could be material to our financial condition and results of operations. For example, in May 2010 we acquired Medegen, a leading innovator in clinically differentiated needleless access valves and administration sets that deliver intravenous medication to patients. We may not complete future transactions in a timely manner, on a cost-effective basis, or at all, and we may not realize the expected benefits of any acquisition, license arrangement or joint development agreement. Other companies may compete with us for these strategic opportunities. We also could experience negative effects on our results of operations and financial condition from acquisition-related charges, amortization of intangible assets and asset impairment charges, and other issues that could arise in connection with, or as a result of, the acquisition of the acquired company, including issues related to internal control over financial reporting, regulatory or compliance issues that could exist for an acquired company or business and potential adverse short-term effects on results of operations through increased costs or otherwise. These effects, individually or in the aggregate, could cause a deterioration of our credit profile and/or ratings and result in reduced availability of credit to us or in increased borrowing costs and interest expense.
We could experience difficulties, expenditures, or other risks in integrating an acquired company, business, or technology, including, among others:
| • | diversion of management resources and focus from ongoing business matters; |
18
Table of Contents
| • | retention of key employees following an acquisition; |
| • | demands on our operational resources and financial and internal control systems; |
| • | integration of an acquired company’s corporate and administrative functions and personnel; |
| • | liabilities of the acquired company, including litigation or other claims; and |
| • | consolidation of research and development operations. |
In addition, we may face additional risks related to foreign acquisitions, including risks related to cultural and language differences and particular economic, currency, political, and regulatory risks associated with specific countries. If an acquired business fails to operate as anticipated or cannot be successfully integrated with our existing business, our results of operations and financial condition could be adversely affected.
We may engage in the divestiture of some of our non-core businesses or product lines which may have an adverse effect on our business.
Our business strategy involves assessing our portfolio of businesses with a view of divesting non-core businesses and product lines that do not align with our objectives, such as the divestitures of our Audiology business in October 2009 and our Research Services business in May 2010. Any divestitures may result in a dilutive impact to our future earnings, as well as significant write-offs, including those related to goodwill and other intangible assets, which could have a material adverse effect on our results of operations and financial condition. Divestitures could involve additional risks, including difficulties in the separation of operations, services, products and personnel, the diversion of management’s attention from other business concerns, the disruption of our business and the potential loss of key employees. We may not be successful in managing these or any other significant risks that we encounter in divesting a business or product line.
We may face significant uncertainty in the industry due to government healthcare reform.
Political, economic and regulatory influences are subjecting the healthcare industry to fundamental changes. In March 2010, comprehensive healthcare reform legislation was signed into law in the United States through the passage of the Patient Protection and Affordable Health Care Act and the Health Care and Education Reconciliation Act. Among other initiatives, the legislation provides for a 2.3% annual excise tax on the sales of certain medical devices in the United States, commencing in January 2013. This enacted excise tax may adversely affect our operating expenses and results of operations. In addition, we anticipate that the current presidential administration, Congress and certain state legislatures will continue to review and assess alternative healthcare delivery systems and payment methods with an objective of ultimately reducing healthcare costs and expanding access. Public debate of these issues will likely continue in the future. We cannot predict with certainty what healthcare initiatives, if any, will be implemented at the state level, or what ultimate effect of federal healthcare reform or any future legislation or regulation may have on our customers’ purchasing decisions regarding our products and services. However, the implementation of new legislation and regulation may lower reimbursements for our products, reduce medical procedure volumes and adversely affect our business, possibly materially.
We may need additional financing in the future to meet our capital needs or to make opportunistic acquisitions and such financing may not be available on favorable terms, if at all, and may be dilutive to existing stockholders.
We intend to increase our investment in research and development activities, expand our sales and marketing activities, and may make acquisitions. Our ability to take these and other actions may be limited by our available liquidity, including our ability to access our foreign cash balances in a tax-efficient manner. As a consequence, in the future, we may need to seek additional financing. We may be unable to obtain any desired additional financing on terms favorable to us, if at all. If we lose an investment grade credit rating or adequate funds are not available on acceptable terms, we may be unable to fund our expansion, successfully develop or enhance products or respond to competitive pressures, any of which could negatively affect our business. If we raise
19
Table of Contents
additional funds through the issuance of equity securities, our stockholders will experience dilution of their ownership interest. If we raise additional funds by issuing debt, we may be subject to limitations on our operations due to restrictive covenants.
Additionally, our ability to make scheduled payments or refinance our obligations will depend on our operating and financial performance, which in turn is subject to prevailing economic conditions and financial, business and other factors beyond our control. Recent disruptions in the financial markets, including the bankruptcy or restructuring of a number of financial institutions and reduced lending activity, may adversely affect the availability, terms and cost of credit in the future. We cannot be sure that recent government initiatives in response to the disruptions in the financial markets will stabilize the markets in general or increase liquidity and the availability of credit to us.
We are subject to risks associated with doing business outside of the United States.
Our operations outside of the United States are subject to risks that are inherent in conducting business under non-United States laws, regulations and customs. Sales to customers outside of the United States made up approximately 31% of our revenue in fiscal year 2010, and we expect that non-United States sales will contribute to future growth. The risks associated with our operations outside the United States include:
| • | changes in non-United States government programs; |
| • | multiple non-United States regulatory requirements that are subject to change and that could restrict our ability to manufacture and sell our products; |
| • | possible failure to comply with anti-bribery laws such as the United States Foreign Corrupt Practices Act and similar anti-bribery laws in other jurisdictions; |
| • | different local product preferences and product requirements; |
| • | possible failure to comply with trade protection and restriction measures and import or export licensing requirements; |
| • | difficulty in establishing, staffing and managing non-United States operations; |
| • | different labor regulations; |
| • | changes in environmental, health and safety laws; |
| • | potentially negative consequences from changes in or interpretations of tax laws; |
| • | political instability and actual or anticipated military or political conflicts; |
| • | economic instability and inflation, recession or interest rate fluctuations; |
| • | uncertainties regarding judicial systems and procedures; |
| • | minimal or diminished protection of intellectual property in some countries; and |
| • | regulatory changes that may place our products at a disadvantage. |
These risks, individually or in the aggregate, could have an adverse effect on our results of operations and financial condition. For example, we are subject to compliance with the United States Foreign Corrupt Practices Act and similar anti-bribery laws, which generally prohibit companies and their intermediaries from making improper payments to foreign government officials for the purpose of obtaining or retaining business. While our employees and agents are required to comply with these laws, we cannot be sure that our internal policies and procedures will always protect us from violations of these laws, despite our commitment to legal compliance and corporate ethics. The occurrence or allegation of these types of risks may adversely affect our business, performance, prospects, value, financial condition, and results of operations.
We are also exposed to a variety of market risks, including the effects of changes in foreign currency exchange rates. If the United States dollar strengthens in relation to the currencies of other countries such as the Euro, where we sell our products, our United States dollar reported revenue and income will decrease. Additionally, we incur significant costs in foreign currencies and a fluctuation in those currencies’ value can negatively impact manufacturing and selling costs. Changes in the relative values of currencies occur regularly and, in some instances, could have an adverse effect on our results of operations and financial condition.
20
Table of Contents
We are subject to healthcare fraud and abuse regulations that could result in significant liability, require us to change our business practices and restrict our operations in the future.
We are subject to various United States federal, state and local laws targeting fraud and abuse in the healthcare industry, including anti-kickback and false claims laws. Violations of these laws are punishable by criminal or civil sanctions, including substantial fines, imprisonment and exclusion from participation in healthcare programs such as Medicare and Medicaid. These laws and regulations are wide ranging and subject to changing interpretation and application, which could restrict our sales or marketing practices. Furthermore, since many of our customers rely on reimbursement from Medicare, Medicaid and other governmental programs to cover a substantial portion of their expenditures, our exclusion from such programs as a result of a violation of these laws could have an adverse effect on our results of operations and financial condition.
Tax legislation initiatives or challenges to our tax positions could adversely affect our results of operation and financial condition.
We are a large multinational corporation with operations in the United States and international jurisdictions. As such, we are subject to the tax laws and regulations of the United States federal, state and local governments and of many international jurisdictions. From time to time, various legislative initiatives may be proposed that could adversely affect our tax positions. We cannot be sure that our effective tax rate or tax payments will not be adversely affected by these initiatives. In addition, United States federal, state and local, as well as international, tax laws and regulations are extremely complex and subject to varying interpretations. There can be no assurance that our tax positions will not be challenged by relevant tax authorities or that we would be successful in any such challenge.
Our reserves against disputed tax obligations may ultimately prove to be insufficient.
The IRS currently has ongoing audits of fiscal years 2001 through 2007 for Cardinal Health. During the quarter ended September 30, 2008, Cardinal Health received an IRS Revenue Agent’s Report for the fiscal tax years ending June 30, 2003 through 2005 that included Notices of Proposed Adjustment related to transfer pricing arrangements between our foreign and domestic subsidiaries and the transfer of intellectual property among our subsidiaries, which we have appealed. The amount of additional tax proposed by the IRS in these notices totals $462 million, excluding penalties and interest, which may be significant. We and Cardinal Health disagree with the IRS regarding the application of the United States Treasury regulations to the arrangements under review and the valuations underlying such adjustments and intend to vigorously contest them. We are still in the audit stage with respect to the fiscal tax years ending June 30, 2006 and 2007 and have received several proposed notices of adjustment to date. The IRS has not yet commenced any IRS audit for our fiscal tax years ending June 30, 2008, 2009 and 2010. The tax matters agreement that we entered into with Cardinal Health specifies that all tax matters related to our businesses, including the control of audit proceedings and payment of any additional liability, is our responsibility. Any such obligation could have an adverse effect on our results of operations and financial condition.
In addition, we regularly review our tax reserves and make adjustments to our reserves when appropriate. During the quarter ended March 31, 2010, we completed a detailed analysis of our tax reserves prompted by new information related to our potential tax positions, tax liabilities, and tax planning strategies. Based on this analysis, we determined it was appropriate to increase our existing tax reserves, which had a negative impact on our financial results and our effective tax rate. Accounting for tax reserves involves complex and subjective estimates by management, which can change over time based on new information or changing events or circumstances, including events or circumstances outside of our control. Although we believe that we have provided appropriate tax reserves for any potential tax exposures, we may not be fully reserved and it is possible that we may be obligated to pay amounts in excess of our reserves, including the full amount that the IRS is seeking in the appeals matter for the fiscal years ended June 30, 2003 through 2005. Any future change in estimate could adversely affect our results of operations and financial condition. See note 12 to the audited consolidated and combined financial statements for a discussion of the Notices of Proposed Adjustment and the change to our tax reserves.
21
Table of Contents
We have a significant amount of indebtedness, which could adversely affect our business and our ability to meet our obligations.
On July 1, 2009, we entered into two senior revolving credit facilities with an aggregate principal amount of $720 million, comprised of a $240 million 364-day revolving credit facility (maturing August 30, 2010) and a $480 million three-year revolving credit facility (maturing August 31, 2012). In addition, on July 14, 2009, we offered and sold $1.4 billion of senior unsecured notes that were utilized to finance our separation from Cardinal Health on August 31, 2009. This significant amount of debt has important risks to us and our investors, including:
| • | requiring a significant portion of our cash flow from operations to make interest payments on this debt; |
| • | making it more difficult to satisfy debt service and other obligations; |
| • | increasing the risk of a future credit ratings downgrade of our debt, which could increase future debt costs and limit the future availability of debt financing; |
| • | increasing our vulnerability to general adverse economic and industry conditions; |
| • | reducing the cash flow available to fund capital expenditures and other corporate purposes and to grow our business; |
| • | limiting our flexibility in planning for, or reacting to, changes in our business and the industry; |
| • | placing us at a competitive disadvantage to our competitors that may not be as highly leveraged with debt as we are; and |
| • | limiting our ability to borrow additional funds as needed or take advantage of business opportunities as they arise, pay cash dividends or repurchase common stock. |
To the extent that we incur additional indebtedness, the risks described above could increase. In addition, our actual cash requirements in the future may be greater than expected. Our cash flow from operations may not be sufficient to repay all of the outstanding debt as it becomes due, and we may not be able to borrow money, sell assets or otherwise raise funds on acceptable terms, or at all, to refinance our debt. In addition we may draw down our revolving credit facilities, which would have the effect of increasing our indebtedness.
As a result of various restrictive covenants in the agreements governing our senior revolving credit facilities and our senior unsecured notes, our financial flexibility will be restricted in a number of ways. The agreements governing the senior revolving credit facilities subject us and our subsidiaries to significant financial and other restrictive covenants, including restrictions on our ability to incur additional indebtedness, place liens upon assets, make distributions, pay dividends or make certain other restricted payments and investments, consummate certain asset sales, enter into transactions with affiliates, conduct businesses other than our current or related businesses, merge or consolidate with any other person or sell, assign, transfer, lease, convey or otherwise dispose of all or substantially all of our assets. Our senior revolving credit facilities also require us to meet certain financial ratio tests on an ongoing basis that may require us to take action and reduce debt or act in a manner contrary to our business objectives. Events beyond our control, including changes in general economic and business conditions, may affect our ability to meet those financial ratios and financial condition tests. We cannot be sure that we will be able to meet those tests or that the lenders will waive any failure to meet those tests. A breach of any of these covenants would result in a default under our senior revolving credit facilities. If an event of default under our senior revolving credit facilities or senior notes occurs, the lenders could elect to declare all amounts outstanding thereunder, together with accrued interest, to be immediately due and payable.
Risks Related to the Separation
We have a limited operating history as a separate publicly-traded company, and our historical financial information is not necessarily representative of the results that we would have achieved as a separate, publicly-traded company and may not be a reliable indicator of our future results.
Our stock began trading publicly on September 1, 2009. The audited combined financial statements for our fiscal year ended June 30, 2009 and the condensed consolidated and combined financial statements for periods ending
22
Table of Contents
prior to September 1, 2009 included in this Annual Report on Form 10-K do not necessarily reflect the financial condition, results of operations or cash flows that we would have achieved as a separate, publicly-traded company during the periods presented or those that we will achieve in the future primarily as a result of the following factors:
| • | prior to the separation, our business was operated by Cardinal Health as part of its broader corporate organization, rather than as an independent company. Cardinal Health or one of its affiliates performed various corporate functions for us, including, but not limited to, legal, treasury, accounting, auditing, risk management, information technology, human resources, corporate affairs, tax administration, certain governance functions (including compliance with the Sarbanes-Oxley Act of 2002 and internal audit) and external reporting. Our historical financial results reflect allocations of corporate expenses from Cardinal Health for these and similar functions. These allocations are likely to be less than the comparable expenses we believe we would have incurred had we operated as a separate publicly-traded company; |
| • | up until the separation, our business was integrated with the other businesses of Cardinal Health. Historically, we have shared economies of scope and scale in costs, employees, vendor relationships and customer relationships. While we have entered into transition agreements that govern certain commercial and other relationships among us and Cardinal Health, those transitional arrangements may not fully capture the benefits our businesses have enjoyed as a result of being integrated with the other businesses of Cardinal Health. Now that we are a separate, publicly-traded company, the loss of these benefits could have an adverse effect on our results of operations and financial condition; and |
| • | up until the separation, our working capital requirements and capital for our general corporate purposes, including acquisitions, research and development and capital expenditures, had historically been satisfied as part of the corporate-wide cash management policies of Cardinal Health. Given that we no longer receive capital from Cardinal Health under these cash management policies, we may need to obtain additional financing from banks, through public offerings or private placements of debt or equity securities, strategic relationships or other arrangements, which may not be available on acceptable terms, or at all. |
Other significant changes may occur in our cost structure, management, financing and business operations as a result of operating as a company separate from Cardinal Health.
If there is a determination that the separation is taxable for United States federal income tax purposes because the facts, assumptions, representations or undertakings underlying the IRS ruling or tax opinions are incorrect or for any other reason, then Cardinal Health and its shareholders that are subject to United States federal income tax could incur significant United States federal income tax liabilities and we could incur significant liabilities.
In connection with the separation, Cardinal Health received a private letter ruling from the IRS substantially to the effect that, among other things, the contribution and the distribution qualified as a transaction that is tax-free for United States federal income tax purposes under Sections 355 and 368(a)(1)(D) of the Internal Revenue Code of 1986, as amended, (“the Code”). In addition, Cardinal Health received opinions of Weil, Gotshal & Manges LLP and Wachtell, Lipton, Rosen & Katz, co-counsel to Cardinal Health, to the effect that the contribution and the distribution qualified as a transaction that is described in Sections 355(a) and 368(a)(1)(D) of the Code. The ruling and opinions relied on certain facts, assumptions, representations and undertakings from Cardinal Health and us regarding the past and future conduct of the companies’ respective businesses and other matters. If any of these facts, assumptions, representations or undertakings were incorrect or not otherwise satisfied, Cardinal Health and its shareholders may not be able to rely on the ruling or the opinions of tax counsel and could be subject to significant tax liabilities. Notwithstanding the private letter ruling and opinions of tax counsel, the IRS could determine on audit that the separation is taxable if it determines that any of these facts, assumptions, representations or undertakings are not correct, have been violated or if it disagrees with the conclusions in the opinions that are not covered by the private letter ruling, or for other reasons, including as a result of certain
23
Table of Contents
significant changes in the stock ownership of Cardinal Health or us after the separation. If the separation is determined to be taxable for United States federal income tax purposes, Cardinal Health and its shareholders that are subject to United States federal income tax could incur significant United States federal income tax liabilities and we could incur significant liabilities.
We may not be able to engage in certain corporate transactions after the separation.
To preserve the tax-free treatment to Cardinal Health of the contribution and the distribution, under the tax matters agreement that we entered into with Cardinal Health, we are restricted from taking any action that prevents the distribution and related transactions from being tax-free for United States federal income tax purposes. These restrictions may limit our ability to pursue certain strategic transactions or engage in other transactions, including use of our common stock to make acquisitions and equity capital market transactions, which might increase the value of our business. The retention by Cardinal Health of shares of our common stock may further exacerbate these restrictions.
Certain of our executive officers and directors may have actual or potential conflicts of interest because of their former positions in Cardinal Health.
The ownership by some of our executive officers and some of our directors of common shares, options, or other equity awards of Cardinal Health may create, or may create the appearance of, conflicts of interest. Because of their former positions with Cardinal Health, certain of our executive officers and non-employee directors own common shares of Cardinal Health, options to purchase common shares of Cardinal Health or other equity awards. The individual holdings of common shares, options to purchase common shares of Cardinal Health or other equity awards may be significant for some of these persons compared to these persons’ total assets. Even though our board of directors consists of a majority of directors who are independent, and our executive officers ceased to be employees of Cardinal Health upon the separation, ownership by our directors and officers of common shares or options to purchase common shares of Cardinal Health, or any other equity awards, creates, or may create the appearance of, conflicts of interest when these directors and officers are faced with decisions that could have different implications for Cardinal Health than the decisions have for us.
We may not achieve some or all of the expected benefits of the separation, and the separation may adversely affect our business.
We may not be able to achieve the full strategic and financial benefits expected to result from the separation, or such benefits may be delayed or not occur at all. These benefits include the following:
| • | improving strategic planning, increasing management focus and streamlining decision-making by providing us the flexibility to implement our unique strategic plans and to respond more effectively to our customer needs and the changing economic environment; |
| • | allowing us to adopt the capital structure, investment policy and dividend policy best suited to our financial profile and business needs, as well as resolving competition for capital among Cardinal Health and its investors; and |
| • | facilitating incentive compensation arrangements for employees more directly tied to the performance of our business, and enhancing employee hiring and retention by, among other things, improving the alignment of management and employee incentives with performance and growth objectives, while at the same time creating an independent equity structure that will facilitate our ability to effect future acquisitions utilizing our common stock. |
We may not achieve the anticipated benefits for a variety of reasons. There also can be no assurance that the separation will not adversely affect our business. In addition, we may be more susceptible to market fluctuations and other adverse events than we would have been as a subsidiary of Cardinal Health, and it is possible that investors and securities analysts will not place a greater value on our business as an independent company than on our business as a subsidiary of Cardinal Health.
24
Table of Contents
Cardinal Health may fail to perform under various transaction agreements that were executed as part of the separation or we may fail to have necessary systems and services in place when certain of the transaction agreements expire.
In connection with the separation, we and Cardinal Health entered into various agreements, including a separation agreement, a transition services agreement, a tax matters agreement, an employee matters agreement, intellectual property agreements and commercial agreements. The separation agreement, the tax matters agreement and employee matters agreement determined the allocation of assets and liabilities between the companies following the separation for those respective areas and provide for indemnifications related to liabilities and obligations. The transition services agreement sets forth certain services to be performed by each company for the benefit of the other for a period of time after the separation. We will rely on Cardinal Health to satisfy its performance and payment obligations under these agreements. If Cardinal Health does not satisfy its obligations under these agreements, including its indemnification obligations, we could incur operational difficulties or losses. If we do not have in place our own systems and services, or if we do not have agreements with other providers of these services once certain transaction agreements expire, we may not be able to operate our business effectively and our profitability may decline. We are in the process of creating our own, or engaging third parties to provide, systems and services to replace many of the systems and services Cardinal Health currently provides to us. We may not be successful in implementing these systems and services or in transitioning data from Cardinal Health’s systems to ours.
Risks Related to Our Common Stock
Future sales or distributions of our common stock could depress the market price for shares of our common stock.
As a result of the separation, Cardinal Health distributed approximately 179.8 million shares of our common stock to its shareholders, all of which are freely tradable under the Securities Act, unless held by Cardinal Health or our “affiliates” as that term is defined by the federal securities laws. It is possible that some Cardinal Health shareholders, including possibly some of its largest shareholders, may sell our common stock received in the distribution for reasons such as that our business profile or market capitalization as a separate, publicly-traded company does not fit their investment objectives. In addition, after completion of the separation, Cardinal Health retained approximately 19% of our total shares outstanding or approximately 41.4 million shares of our common stock. Pursuant to the private letter ruling from the IRS, Cardinal Health is required to dispose of such shares of our common stock that it owns as soon as practicable and consistent with its reasons for retaining such shares, but in no event later than five years after the distribution. Cardinal Health has since sold some of these shares, and in accordance with our obligations under the stockholder’s and registration rights agreement that we entered into with Cardinal Health, we filed a registration statement with the SEC to facilitate sales of our common stock by Cardinal Health. Any disposition by Cardinal Health, or any significant Cardinal Health shareholder, of our common stock in the public market, or the perception that such dispositions could occur, could adversely affect prevailing market prices for our common stock.
Your percentage of ownership in us may be diluted in the future.
As with any publicly-traded company, your percentage ownership in us may be diluted in the future because of equity issuances for acquisitions, capital market transactions or otherwise, including equity awards that we expect will be granted to our directors, officers and employees.
Our stock price may fluctuate significantly.
The market price of our common stock may fluctuate significantly due to a number of factors, some of which may be beyond our control, including:
| • | actual or anticipated fluctuations in our operating results; |
25
Table of Contents
| • | changes in earnings estimated by securities analysts or our ability to meet those estimates; |
| • | the operating and stock price performance of comparable companies; and |
| • | domestic and foreign economic conditions. |
Certain provisions in our amended and restated certificate of incorporation and amended and restated by-laws, and of Delaware law, may prevent or delay an acquisition of our company, which could decrease the trading price of our common stock.
Our amended and restated certificate of incorporation, our amended and restated by-laws and Delaware law contain provisions that are intended to deter coercive takeover practices and inadequate takeover bids by making such practices or bids unacceptably expensive to the raider and to encourage prospective acquirers to negotiate with our board of directors rather than to attempt a hostile takeover. These provisions include, among others:
| • | the inability of our stockholders to call a special meeting; |
| • | rules regarding how stockholders may present proposals or nominate directors for election at stockholder meetings; |
| • | the right of our board to issue preferred stock without stockholder approval; |
| • | the division of our board of directors into three classes of directors, with each class serving a staggered three-year term; |
| • | a provision that stockholders may only remove directors with cause; |
| • | the ability of our directors, and not stockholders, to fill vacancies on our board of directors; and |
| • | the requirement that stockholders holding at least 80% of our voting stock are required to amend certain provisions in our amended and restated certificate of incorporation and our amended and restated by-laws relating to the number, term and election of our directors, the filling of board vacancies, stockholder notice procedures and the calling of special meetings of stockholders. |
Delaware law also imposes some restrictions on mergers and other business combinations between us and any holder of 15% or more of our outstanding common stock.
We believe these provisions will protect our stockholders from coercive or otherwise unfair takeover tactics by requiring potential acquirers to negotiate with our board of directors and by providing our board of directors with more time to assess any acquisition proposal. These provisions are not intended to make our company immune from takeovers. However, these provisions will apply even if the offer may be considered beneficial by some stockholders and could delay or prevent an acquisition that our board of directors determines is not in the best interests of our company and our stockholders. These provisions may also prevent or discourage attempts to remove and replace incumbent directors.
| ITEM 1B. | UNRESOLVED STAFF COMMENTS |
None.
26
Table of Contents
| ITEM 2. | PROPERTIES |
Our principal executive offices are located in a facility that we own in San Diego, California. At June 30, 2010, we owned or leased a total of approximately 4 million square feet of facility space worldwide to handle manufacturing, production, assembly, research, quality assurance testing, distribution, packaging, and administrative functions. At June 30, 2010, we had 20 manufacturing facilities of which 10 were located in the United States. We consider our operating facilities to be well-maintained and suitable for the operations conducted in them. We periodically evaluate our operating properties, however, and we may make additions, improvements and consolidations, when appropriate. None of our facilities experienced any significant idle time during fiscal year 2010.
The following table summarizes our facilities that are greater than 10,000 square feet by segment and by country as of June 30, 2010:
| Square Feet (in thousands) | Number
of Facilities | |||||
| Leased | Owned | |||||
| Critical Care Technologies* |
||||||
| Australia |
20 | — | 1 | |||
| Belgium |
11 | — | 1 | |||
| Canada |
30 | — | 1 | |||
| France |
19 | — | 1 | |||
| Germany |
126 | — | 4 | |||
| India |
12 | — | 1 | |||
| Italy |
— | 124 | 1 | |||
| Mexico |
263 | 319 | 3 | |||
| Netherlands |
11 | — | 1 | |||
| New Zealand |
12 | — | 1 | |||
| South Africa |
16 | — | 1 | |||
| Spain |
13 | — | 1 | |||
| Switzerland |
22 | — | 1 | |||
| United Kingdom |
82 | 21 | 4 | |||
| United States |
1,067 | 472 | 14 | |||
| Critical Care Technologies Total |
1,704 | 936 | 36 | |||
| Medical Technologies and Services* |
||||||
| Australia |
35 | — | 1 | |||
| Dominican Republic |
— | 35 | 1 | |||
| France |
— | 59 | 1 | |||
| Germany |
166 | — | 3 | |||
| Ireland |
— | 29 | 1 | |||
| United States |
861 | 70 | 13 | |||
| Medical Technologies and Services Total |
1,062 | 193 | 20 | |||
| Total |
2,766 | 1,129 | 56 | |||
| * | Certain of the facilities included in the table are utilized by more than one segment. |
| ITEM 3. | LEGAL PROCEEDINGS |
See note 13 to the audited consolidated and combined financial statements for a summary of legal proceedings.
| ITEM 4. | (REMOVED AND RESERVED) |
27
Table of Contents
| ITEM 5. | MARKET FOR REGISTRANT’S COMMON EQUITY, RELATED STOCKHOLDER MATTERS AND ISSUER PURCHASES OF EQUITY SECURITIES |
Our common stock is traded on the New York Stock Exchange (“NYSE”) under the symbol “CFN”. A “when-issued” trading market for our common stock began on the NYSE on August 21, 2009, and “regular way” trading of our common stock began on September 1, 2009. Prior to August 21, 2009, there was no public market for our common stock. As of August 11, 2010, there were 13,697 stockholders of record and 222,356,353 outstanding shares.
Trading price data, as reported on the NYSE for the indicated periods is as follows:
| Fiscal 2010 | 1st Quarter1 | 2nd Quarter | 3rd Quarter | 4th Quarter | ||||||||
| High |
$ | 22.42 | $ | 26.99 | $ | 28.33 | $ | 30.06 | ||||
| Low |
18.32 | 20.65 | 24.23 | 22.67 | ||||||||
| 1 | Represents “regular way” trading activity from September 1, 2009 through September 30, 2009. |
Dividends
We currently intend to retain any earnings to finance research and development, acquisitions and the operation and expansion of our business and do not anticipate paying any cash dividends for the foreseeable future. The declaration and payment of any dividends in the future by us will be subject to the sole discretion of our board of directors and will depend upon many factors, including our financial condition, earnings, capital requirements of our operating subsidiaries, covenants associated with certain of our debt obligations, legal requirements, regulatory constraints and other factors deemed relevant by our board of directors. Moreover, should we pay any dividends in the future, there can be no assurance that we will continue to pay such dividends.
28
Table of Contents
Performance Graph
This performance graph is furnished and shall not be deemed “filed” with the SEC or subject to Section 18 of the Exchange Act, nor shall it be deemed incorporated by reference in any of our filings under the Securities Act of 1933, as amended.
The following graph compares the cumulative total stockholders return on our common stock from September 1, 2009, when “regular way” trading in our common stock began on the NYSE, through June 30, 2010, with the comparable cumulative return of the S&P 500 index and S&P 500 Health Care index. The graph assumes that $100 was invested in our common stock and each index on September 1, 2009 and the reinvestment of all dividends paid. The stock price performance on the following graph is not necessarily indicative of future stock price performance.
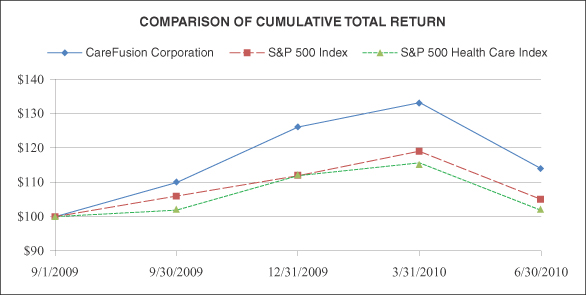
The following table shows total indexed return of stock price plus reinvestments of dividends, assuming an initial investment of $100 at September 1, 2009, for the indicated periods.
| 9/1/2009 | 9/30/2009 | 12/31/2009 | 3/31/2010 | 6/30/2010 | |||||||||||
| CareFusion Corporation |
$ | 100 | $ | 110 | $ | 126 | $ | 133 | $ | 114 | |||||
| S&P 500 Index |
100 | 106 | 112 | 119 | 105 | ||||||||||
| S&P 500 Health Care Index |
100 | 102 | 112 | 115 | 102 | ||||||||||
29
Table of Contents
Purchase of Equity Securities
The following table contains information about our company’s purchases of equity securities during the fourth quarter of fiscal year 2010:
| Issuer Purchases of Equity Securities | ||||||||||
| Period | Total Number of Shares Purchased1 |
Average Price Paid per Share |
Total Number of Shares Purchased as Part of Publicly Announced Program |
Maximum Number (or Approximate Dollar Value) of Shares that May Yet Be Purchased Under the Publicly Announced Program | ||||||
| April 1 – 30, 2010 |
106 | $ | 27.17 | — | $ | — | ||||
| May 1 – 31, 2010 |
1,546 | $ | 25.68 | — | — | |||||
| June 1 – 30, 2010 |
1,644 | $ | 25.79 | — | — | |||||
| Total |
3,296 | $ | 25.78 | — | $ | — | ||||
| 1 | Represents restricted stock awards surrendered by employees upon vesting to meet tax withholding obligations. |
| ITEM 6. | SELECTED FINANCIAL DATA |
The following table presents our selected historical condensed consolidated and combined financial data. The condensed consolidated and combined statements of income data for each of the three fiscal years in the period ending June 30, 2010 and the condensed consolidated and combined balance sheet data as of June 30, 2010 and 2009 are derived from our audited consolidated and combined financial statements included elsewhere in this Annual Report on Form 10-K. The condensed combined statements of income data for fiscal years 2007 and 2006 and the condensed combined balance sheet data as of June 30, 2008 and 2007 are derived from our audited combined financial statements that are not included in this Annual Report on Form 10-K. The condensed combined balance sheet data for fiscal year 2006 is derived from our unaudited combined financial statements that are not included in this Annual Report on Form 10-K. The unaudited combined financial statements have been prepared on the same basis as the audited condensed consolidated and combined financial statements and, in the opinion of our management, include all adjustments, consisting only of normal recurring adjustments, necessary for a fair presentation of the information set forth herein.
30
Table of Contents
The selected historical condensed consolidated and combined financial and other operating data presented below should be read in conjunction with our audited consolidated and combined financial statements and accompanying notes and “Management’s Discussion and Analysis of Financial Condition and Results of Operations” included elsewhere in this Annual Report on Form 10-K. Our consolidated and combined financial information may not be indicative of our future performance, and our financial information for periods prior to June 30, 2009 does not necessarily reflect what our financial position and results of operations would have been had we operated as an independent, publicly-traded company during such periods presented, including changes that occurred in our operations and capitalization as a result of the separation from Cardinal Health and the distribution.
| At or for the Fiscal Year Ended June 30,1,2, 3 | |||||||||||||||
| (in millions) | 2010 | 2009 | 2008 | 2007 | 2006 | ||||||||||
| Statements of Income Data: |
|||||||||||||||
| Revenue |
$ | 3,929 | $ | 3,595 | $ | 3,663 | $ | 2,659 | $ | 2,322 | |||||
| Gross Margin |
1,866 | 1,731 | 1,767 | 1,296 | 1,132 | ||||||||||
| Operating Income4 |
472 | 444 | 530 | 261 | 284 | ||||||||||
| Income before Income Taxes |
357 | 343 | 443 | 199 | 220 | ||||||||||
| Income from Continuing Operations |
171 | 290 | 333 | 168 | 162 | ||||||||||
| Income from Discontinued Operations, |
23 | 278 | 330 | 334 | 298 | ||||||||||
| Net Income |
194 | 568 | 663 | 502 | 460 | ||||||||||
| Basic Earnings per Common Share: |
|||||||||||||||
| Continuing Operations |
0.77 | 1.32 | 1.51 | 0.76 | 0.74 | ||||||||||
| Discontinued Operations |
0.10 | 1.26 | 1.49 | 1.52 | 1.35 | ||||||||||
| Basic Earnings per Common Share |
0.88 | 2.58 | 3.00 | 2.28 | 2.09 | ||||||||||
| Diluted Earnings per Common Share: |
|||||||||||||||
| Continuing Operations |
0.77 | 1.32 | 1.51 | 0.76 | 0.74 | ||||||||||
| Discontinued Operations |
0.10 | 1.26 | 1.49 | 1.52 | 1.35 | ||||||||||
| Diluted Earnings per Common Share |
0.87 | 2.58 | 3.00 | 2.28 | 2.09 | ||||||||||
| Weighted-Average Number of Common Share Outstanding6 |
|||||||||||||||
| Basic |
221.5 | 220.5 | 220.5 | 220.5 | 220.5 | ||||||||||
| Diluted |
223.0 | 220.5 | 220.5 | 220.5 | 220.5 | ||||||||||
| Balance Sheet Data: |
|||||||||||||||
| Total Assets |
$ | 7,943 | $ | 8,349 | $ | 8,329 | $ | 7,876 | $ | 5,118 | |||||
| Long-Term Obligations, less Current Portion and Other Short-Term Borrowings7 |
1,386 | 1,159 | 1,539 | 1,268 | 1,209 | ||||||||||
| Total Stockholders’ Equity or Parent Company Investment8 |
4,704 | 5,451 | 5,048 | 4,887 | 2,762 | ||||||||||
| 1 | Amounts reflect business combinations for all periods presented. See note 3 to the audited consolidated and combined financial statements for further information regarding the impact of acquisitions on fiscal years 2008 through 2010. The company completed the acquisition of Viasys in fiscal year 2007. The company did not complete any significant acquisitions in fiscal year 2006. |
| 2 | Amounts reflect restructuring and acquisition integration charges for all periods presented. Restructuring and acquisition integration charges were $19 million, $72 million, $35 million, $22 million and $23 million, in fiscal years 2010, 2009, 2008, 2007 and 2006, respectively. |
| 3 | For the two months ended August 31, 2009 and during fiscal years 2009, 2008, 2007 and 2006, Cardinal Health allocated to us general corporate expenses in the amount of $19 million, $406 million, $407 million, $428 million, and $219 million, respectively. Included within the $406 million, $407 million and $428 million of SG&A expenses allocated to us from Cardinal Health for the years ended June 30, 2009, 2008 and 2007, are $21 million, $23 million and $23 million, respectively, allocable to discontinued operations. None of the SG&A expenses allocated to us from Cardinal Health in 2010 and 2006 was attributable to discontinued |
31
Table of Contents
| operations. General corporate expenses include, but are not limited to, costs related to finance, legal, information technology, human resources, communications, ethics and compliance, shared services, employee benefits and incentives, and stock-based compensation. Effective with the separation, we assumed responsibility for all of these functions and related costs. |
| 4 | During fiscal years 2008 and 2007, we incurred charges related to acquired in-process research and development of $18 million and $85 million, respectively. |
| 5 | A summary of our discontinued operations is presented in note 2 in the notes to the audited consolidated and combined financial statements. |
| 6 | For fiscal year 2009 and earlier, basic and diluted earnings per common share are computed using the number of common stock outstanding on August 31, 2009, the date on which CareFusion common stock was distributed to shareholders of Cardinal Health. |
| 7 | Includes the long-term portion of debt allocated from Cardinal Health. Total debt allocated by Cardinal Health is as follows as of June 30 (in millions): |
| 2009 | 2008 | 2007 | 2006 | |||||||
| $ | 1,281 | $ | 1,597 | $ | 1,259 | $ | 1,124 | |||
| 8 |
On July 1, 2007, we adopted the accounting guidance associated with uncertain tax positions, the cumulative effect of which was a $35 million reduction in “Parent Company Equity”. Of the $35 million reduction in “Parent Company Equity”, $18 million is related to discontinued operations. |
| ITEM 7. | MANAGEMENT’S DISCUSSION AND ANALYSIS OF FINANCIAL CONDITION AND RESULTS OF OPERATIONS |
This management’s discussion and analysis of financial condition and results of operations (“MD&A”) presented below refer to and should be read in conjunction with the audited consolidated and combined financial statements and related notes included in this Annual Report on Form 10-K.
Unless the context otherwise requires, references to “CareFusion Corporation”, “CareFusion”, “we”, “us”, “our” and “our company” refer to CareFusion Corporation and its consolidated subsidiaries. References in this Annual Report on Form 10-K to “Cardinal Health” refers to Cardinal Health, Inc. and its consolidated subsidiaries.
Separation from Cardinal Health, Inc.
On September 29, 2008, Cardinal Health announced that it intended to separate its clinical and medical products businesses from the remainder of its businesses through a pro-rata distribution of the common stock of an entity holding the assets and liabilities associated with the clinical and medical products businesses. CareFusion Corporation was incorporated in Delaware on January 14, 2009 for the purpose of holding such businesses. We completed the spinoff from Cardinal Health on August 31, 2009. In connection with the spinoff, Cardinal Health contributed the majority of the businesses comprising its clinical and medical products segment to us (“the contribution”), and distributed approximately 81% of our outstanding common stock, or approximately 179.8 million shares, to its shareholders (“the distribution”), based on a distribution ratio of 0.5 shares of our common stock for each common share of Cardinal Health held on the record date of August 25, 2009. Cardinal Health retained approximately 19% of our outstanding common stock, or approximately 41.4 million shares, in connection with the spinoff. As a condition to the separation, Cardinal Health is required to dispose of the remaining 19% of our common stock within five years of the distribution date. Also in connection with the spinoff, Cardinal Health retained certain lines of business that manufacture and sell surgical and exam gloves, drapes and apparel and fluid management products in the United States markets that were historically managed by us prior to the spinoff, which were part of the clinical and medical products businesses of Cardinal Health. These lines of businesses are reflected in the CareFusion financial information included throughout this Annual Report on Form 10-K as discontinued operations.
32
Table of Contents
In connection with the separation and other restructuring activities not related to the separation, we expected to incur one-time expenditures (capital and expense) of between approximately $120 million to $130 million in fiscal year 2010. As of June 30, 2010, we have incurred approximately $120 million of expenditures. These expenditures primarily consist of employee-related costs, costs to start up certain stand-alone functions and information technology systems and other one-time transaction related costs. Also included are approximately $22 million of capitalized fees associated with our bridge loan facility that were expensed in the first quarter of fiscal year 2010 related to the termination of that agreement on August 31, 2009.
In fiscal year 2011, we expect to incur additional one-time expenditures associated with the separation from Cardinal Health (capital and expense) of between approximately $80 million and $90 million, after which all substantive expenditures associated with standing up operations from the spinoff are expected to be complete. We have funded, and expect to continue funding these costs through cash from operations and cash on hand. The capital portion of these expenditures will be amortized over their useful lives and others have been expensed as incurred, depending on their nature.
Additionally, we have incurred increased costs as an independent, publicly-traded company, primarily as a result of higher charges than in the past from Cardinal Health for transition services and from establishing or expanding the corporate support for our businesses, including information technology, human resources, treasury, tax, risk management, accounting and financial reporting, investor relations, legal, procurement and other services. We believe cash flow from operations will be sufficient to fund these additional corporate expenses going forward.
We do not anticipate that increased costs solely from becoming an independent, publicly-traded company will have an adverse effect on our growth rate in the future beyond fiscal year 2010.
We believe that the separation has allowed us, and will continue to allow us to:
| • | improve strategic planning, increase management focus and streamline decision-making by providing us the flexibility to implement our unique strategic plans and to respond more effectively to our customer needs and the changing economic environment; |
| • | allow us to adopt the capital structure, investment policy and dividend policy best suited to our financial profile and business needs, as well as resolving competition for capital among Cardinal Health and its investors; and |
| • | facilitate incentive compensation arrangements for employees more directly tied to the performance of our business, and enhance employee hiring and retention by, among other things, improving the alignment of management and employee incentives with performance and growth objectives, while at the same time creating an independent equity structure that will facilitate our ability to effect future acquisitions utilizing our common stock. |
Overview
We are a leading, global medical technology company with clinically proven and industry-leading products and services designed to measurably improve the safety and quality of healthcare. We offer comprehensive product lines in the areas of IV infusion, medication and supply dispensing, respiratory care, infection prevention and surgical instruments to customers in the United States and over 130 countries throughout the world. Our strategy is to enhance growth by focusing on healthcare safety and productivity, driving innovation and clinical differentiation, accelerating our global growth and pursing strategic opportunities.
In furtherance of our strategy, we may seek to acquire entities that meet our objectives of driving innovation and global growth. Consistent with this strategy, in May 2010 we completed the acquisition of Medegen, a leading innovator in clinically differentiated needleless access valves and administration sets that deliver IV medication to patients. At the same time, our strategy also involves assessing our portfolio of businesses with a view of divesting non-core businesses that do not align with our objectives, such as the divestitures of our Audiology business in October 2009 and our Research Services business in May 2010. See note 2 to the audited consolidated and combined financial statements for further information.
33
Table of Contents
Our primary customers in the United States include hospitals, ambulatory surgical centers, clinics, long-term care facilities and physician offices. For fiscal years 2010 and 2009, we generated revenue of $3.9 billion and $3.6 billion, respectively, and income from continuing operations of $171 million in fiscal year 2010 and $290 million in fiscal year 2009. Approximately 31% of our fiscal year 2010 revenue was from customers outside of the United States.
Our business consists of two reporting segments: Critical Care Technologies and Medical Technologies and Services.
| • | Critical Care Technologies includes our infusion, dispensing and respiratory care businesses that develop, manufacture and sell capital equipment and related dedicated and non-dedicated disposables. |
| • | Medical Technologies and Services includes our infection prevention and medical specialties products and services businesses that develop, manufacture and sell primarily single-use, disposable products and reusable surgical instruments. |
Our capital equipment revenues are subject to a certain degree of seasonality that aligns to our customer capital equipment purchasing cycles. As a normal course of business, this seasonality would manifest itself with higher sales in our second and fourth quarters and lower sales in the first and third quarters of our fiscal year.
Factors Affecting Our Results of Operations
The Overall Global Economic Environment, Industry Growth and Trends
Healthcare-related industries are generally less susceptible than some other industries to fluctuations in the overall economic environment. However, some of our businesses rely on capital spending from our customers (primarily hospitals), which spending can be influenced by a variety of economic factors, including interest rates, access to financing and endowment fluctuations. Significant changes in these economic factors can affect the sales of our capital equipment products, such as infusion pumps, dispensing equipment and ventilators. Additionally, sales volumes for some of our businesses are dependent on hospital admissions. Changes in admissions due to difficult economic times can affect our results for surgical and single-use products, such as infusion and respiratory disposable sets, surgical instruments and infection prevention products.
In addition to the factors discussed above, we are also affected by uncertainties in the healthcare industry related to healthcare reform. Comprehensive healthcare reform was recently enacted in the United States through the passage of the Patient Protection and Affordable Health Care and the Health Care and Education Reconciliation Acts in March 2010. In addition, we anticipate that the current presidential administration, Congress and certain state legislatures will continue to review and assess alternative healthcare delivery systems and payment methods with an objective of ultimately reducing healthcare costs and expanding access. The uncertainties regarding the implementation and impact of the enacted healthcare reform measures, as well as other potential reform initiatives in the future, may have an adverse effect on our customers’ purchasing decisions regarding our products and services.
Since the beginning of fiscal year 2009, we have observed certain hospitals delaying capital equipment purchase decisions, which had an adverse impact on our financial results for fiscal years 2010 and 2009. Moreover, while global healthcare expenditures are projected to grow over the coming years, reimbursement and funding for these expenditures is declining. These factors are creating both pressure and opportunity in the marketplace.
We continue to believe that challenges exist in the capital equipment market from delays in hospital capital spending, as well as prioritization of capital spending. While we continue to see small signs of improvement, we anticipate it will take some time before significant market improvements are realized. Despite these continued challenges, our fiscal year 2010 sales increased 9% over fiscal year 2009. We believe that we are positioned strategically to benefit from increases in hospital capital equipment spending as the market recovers.
34
Table of Contents
Primarily in response to the delay in hospital capital spending and the overall decline in the global economy, we implemented a global workforce reduction in the third quarter of fiscal year 2009, which reduced our workforce by approximately 800 people over the course of fiscal years 2009 and 2010, and eliminated an additional 500 positions through normal attrition and by not filling open roles. We recorded a $12 million and $19 million pre-tax restructuring charge for fiscal year 2010 and 2009, respectively, associated with these actions. In fiscal year 2010 and beyond, we have experienced, and expect to continue to experience, a benefit within our operating income due to reduced expenses as a result of these cost reduction initiatives.
Additionally, on August 10, 2010, we announced a global restructuring program pursuant to which we expect to reduce our cost structure and streamline operations. As part of this restructuring, we anticipate reducing our global workforce by approximately 700 positions. We expect these restructuring activities to be substantially complete by the end of fiscal year 2011. The pre-tax expense and cash outlay for the program is estimated to be approximately $40 million to $50 million in the fiscal year 2011, primarily related to one-time employee separation benefits and other costs. This program is expected to generate operating expense savings of approximately $85 million to $95 million in fiscal year 2011, increasing to annualized savings of $110 million to $120 million in fiscal year 2012 and beyond, through direct and indirect overhead expense reductions and other savings.
Innovation and New Products
Our business strategy relies significantly on innovation to develop and introduce new products and to differentiate our products from our competitors. Our investment expense in research and development during fiscal year 2010 was $159 million, or 4% of revenues. Excluding the revenues of our International Surgical Products business which requires no research and development investment, our fiscal year 2010 investment was 5% of revenues. Looking forward, we remain committed to producing a pipeline of innovative products to continue to support our growth strategies. We plan to increase our research and development expenditures with internal initiatives, as well as licensing or acquiring technology from third parties. Our internal and external investments will be focused on initiatives that we believe will offer the greatest opportunity for growth and profitability.
With a significant investment in research and development, a strong focus on innovation and a well-managed innovation process, we believe we can continue to innovate and grow. If, however, our future innovations are not successful in meeting customers’ needs or prove to be too costly versus their perceived benefit, our growth may slow.
International and Foreign Exchange
We sell our products in more than 130 countries and manufacture our products in nine countries in North America, Europe, Asia and Latin America. Due to the global nature of our business, our revenue and expenses are influenced by foreign exchange movements. In fiscal year 2010, approximately 26% of our sales were in currencies other than the United States dollar. Increases or decreases in the value of the United States dollar compared to other currencies will affect our reported results as we translate those currencies into United States dollars. The percentage of fiscal year 2010 sales by major currencies was as follows:
| United States Dollar |
74 | % | |
| Euro |
14 | % | |
| British Pound |
5 | % | |
| All Other |
7 | % | |
| 100 | % | ||
35
Table of Contents
Product Quality and Recalls
Product quality, particularly in life saving and sustaining technologies, plays a critical role in our success. A quality or safety issue may result in public warning letters, product recalls or seizures, monetary sanctions, consent decrees, injunctions to halt manufacture and distribution of products, civil or criminal sanctions, refusal of a government to grant clearances or approvals or delays in granting such clearances or approvals, import detentions of products made outside the United States, restrictions on operations or withdrawal or suspension of existing approvals. Any of the foregoing events could disrupt our business and have an adverse effect on our results of operations and financial condition. In addition, recalls may negatively affect sales due to customer concerns about product quality.
For the fiscal years ended June 30, 2010, 2009 and 2008, our results were negatively affected by net charges for the cost of product recalls of $3 million, $19 million and $18 million, respectively. We are operating under an amended consent decree with the FDA, related to our infusion pump business in the United States. We entered into a consent decree with the FDA in February 2007 related to our Alaris SE pumps, and in February 2009, we and the FDA amended the consent decree (“amended consent decree”) to include all infusion pumps manufactured by or for CareFusion 303, Inc., our subsidiary that manufactures and sells infusion pumps in the United States. The amended consent decree does not apply to intravenous administration sets and accessories.
While we remain subject to the amended consent decree, which includes the requirements of the consent decree, we have made substantial progress in our compliance efforts. In accordance with the consent decree, we reconditioned Alaris SE pumps that had been seized by the FDA, remediated Alaris SE pumps in use by customers, and had an independent expert inspect the Alaris SE pump facilities and provide a certification to the FDA as to compliance. As result of these efforts, in January 2010, we announced that the FDA had given us permission to resume the manufacturing and marketing of our Alaris SE pumps. In accordance with the amended consent decree, and in addition to the requirements of the original consent decree, we also implemented a corrective action plan to bring the Alaris System and all other infusion pumps in use in the United States market into compliance, had our infusion pump facilities inspected by an independent expert, and had our recall procedures and all ongoing recalls involving our infusion pumps inspected by an independent recall expert. In July 2010, the FDA notified us that we can proceed to the audit inspection phase of the amended consent decree, which includes the requirement to retain an independent expert to conduct periodic audits of our infusion pump facilities. The amended consent decree authorizes the FDA, in the event of any violations in the future, to order us to cease manufacturing and distributing, recall products and take other actions. We may be required to pay damages of $15,000 per day per violation if we fail to comply with any provision of the amended consent decree, up to $15 million per year.
We cannot currently predict the outcome of this matter, whether additional amounts will be incurred to resolve this matter, if any, or the matter’s ultimate impact on our business. We may be obligated to pay more or less than the amount that we reserved in connection with the amended consent decree because, among other things, the FDA may determine that we are not fully compliant with the amended consent decree and therefore impose penalties under the amended consent decree, and/or we may be subject to future proceedings and litigation relating to the matters addressed in the amended consent decree.
In response to infusion product recalls and the consent decree, we have made substantial investments in quality systems and quality personnel headcount over the past several years. While we believe that we have made significant improvements to our product quality and overall quality systems, further quality concerns, whether real or perceived, could adversely affect our results. Conversely, improving quality can be a competitive advantage and improve our results.
Income Taxes
Prior to the spinoff, our operations were included in Cardinal Health’s United States federal and state tax returns or non-United States jurisdictions tax returns. In connection with the spinoff, we and Cardinal Health entered into
36
Table of Contents
a tax matters agreement that governs the parties’ respective rights, responsibilities and obligations with respect to taxes. The tax matters agreement generally provides that the control of audit proceedings and payment of any additional liability related to our business is our responsibility.
For the period July 1, 2009 through the spinoff date from Cardinal Health on August 31, 2009, our operations were included in the consolidated income tax returns of Cardinal Health, however, income taxes were calculated and provided for CareFusion on a separate return basis for fiscal years 2010 and 2009. The amount of liabilities related to income taxes prior to the spinoff that were retained by Cardinal Health are reflected in “Parent Company Investment” in the consolidated statement of stockholders’ equity. Effective for the period beginning September 1, 2009, we will file stand-alone income tax returns in the United States federal jurisdiction, various United States state jurisdictions and various foreign jurisdictions.
Acquisitions
Acquisitions have historically played a significant role in our growth. Significant acquisitions made in the last five years include VIASYS Healthcare Inc. (“Viasys”) in 2007, the assets of Enturia, Inc. (“Enturia”) in 2008 and Medegen in 2010. While we believe that the integration of Viasys and Enturia have generally been successful, our failure to integrate Medegen or other future acquisitions successfully might negatively affect our results. For further information regarding acquisitions, see note 3 to the audited consolidated and combined financial statements.
Acquired In-Process Research and Development
During 2010 we acquired and capitalized $45 million of in-process research and development (“IPR&D”) through the acquisition of Medegen, which was valued based on a discounted cash flow method. Significant assumptions in valuing this IPR&D included timing of product deployment, revenues, margin, and associated discount rates. Effective July 1, 2009, IPR&D associated with business combinations is recorded in the balance sheet at fair value and tested for impairment annually until it is put into service. Prior to July 1, 2009, all acquired IPR&D was expensed immediately. See note 1 to the audited consolidated and combined financial statements.
The $45 million of IPR&D associated with Medegen is related to certain products that are under development and are expected to be launched in the next three to four years. Completion of these products is subject to certain regulatory approvals and logistics surrounding manufacturing the end products cost effectively. The value of this IPR&D will be reviewed at least annually for impairment based on changing facts and circumstances; however, we do not anticipate that any portion will be impaired based on lack of ability to launch these products or other factors.
Basis of Presentation
The audited consolidated and combined financial statements reflect the consolidated operations of CareFusion Corporation and its subsidiaries as a separate, stand-alone entity subsequent to August 31, 2009. Periods presented prior to our August 31, 2009 spinoff from Cardinal Health have been prepared on a stand-alone basis and are derived from the consolidated financial statements and accounting records of Cardinal Health. Certain lines of business that manufacture and sell surgical and exam gloves, drapes and apparel and fluid management products in the United States market that were historically managed by us prior to the spinoff and were part of the clinical and medical products business of Cardinal Health, were retained by Cardinal Health as a result of the spinoff, and are presented in these financial statements as discontinued operations.
Our audited consolidated and combined financial statements do not necessarily reflect what the results of operations, financial position and cash flows would have been had we operated as an independent, publicly-traded company during the periods prior to the spinoff from Cardinal Health. See note 15 to the audited consolidated and combined financial statements for further description of the transactions between Cardinal Health and us.
37
Table of Contents
CONSOLIDATED RESULTS OF OPERATIONS
Fiscal Year Ended June 30, 2010 Compared to Fiscal Year Ended June 30, 2009
Below is a summary of comparative results of operations and a more detailed discussion of results for the fiscal years ended June 30, 2010 and 2009:
| Fiscal Year Ended June 30, | |||||||||||
| (in millions) | 2010 | 2009 | Change | ||||||||
| Revenue |
$ | 3,929 | $ | 3,595 | $ | 334 | |||||
| Cost of Products Sold |
2,063 | 1,864 | 199 | ||||||||
| Gross Margin |
1,866 | 1,731 | 135 | ||||||||
| Selling, General and Administrative Expenses |
1,228 | 1,055 | 173 | ||||||||
| Research and Development Expenses |
159 | 160 | (1 | ) | |||||||
| Restructuring and Acquisition Integration Charges |
19 | 72 | (53 | ) | |||||||
| Gain on the Sale of Assets |
(12 | ) | — | (12 | ) | ||||||
| Operating Income |
472 | 444 | 28 | ||||||||
| Interest Expense and Other, Net |
115 | 101 | 14 | ||||||||
| Income Before Income Taxes |
357 | 343 | 14 | ||||||||
| Provision for Income Taxes |
186 | 53 | 133 | ||||||||
| Income from Continuing Operations |
171 | 290 | (119 | ) | |||||||
| Income from Discontinued Operations, Net of Tax |
23 | 278 | (255 | ) | |||||||
| Net Income |
$ | 194 | $ | 568 | $ | (374 | ) | ||||
Revenue
Revenue in our CCT segment increased by $215 million, or 9%, to $2,644 million for fiscal year 2010 compared to the prior fiscal year. The increase in revenue was attributable to increased sales in our respiratory products, primarily ventilators and disposables, as a result of emergency preparedness during fiscal year 2010, including the potential effects of influenza viruses. In addition, revenues increased as a result of the impact of commercial agreements executed in conjunction with our separation from Cardinal Health. Our infusion product revenues increased largely as a result of the net impact of the release of the shipping hold on the Alaris System that began in February 2009 and ended in July 2009 and the fulfillment of previously delayed customer orders that resulted from the shipping hold. However, infusion revenues were negatively impacted by delays in hospital capital spending, primarily for the first six months of fiscal year 2010 compared to fiscal year 2009. Dispensing equipment revenues declined due to the impact of delays in hospital capital spending through the first three quarters of fiscal year 2010, as well as the way in which hospitals prioritize and allocate their spending.
Revenue in our MT&S segment increased by $119 million, or 10%, to $1,285 million for fiscal year 2010 compared to the prior fiscal year. The revenue increase is attributable to growth in our international surgical products business, including the impact of foreign exchange; our interventional specialties products business; and growth in our infection prevention products business. Growth in the international surgical products business is primarily the result of emergency preparedness, including the potential effects of influenza viruses and continued growth in the sale of custom sterile kits. Interventional specialties growth primarily resulted from increased sales of chronic drainage products.
Gross Margin and Cost of Products Sold
Gross margin increased $135 million, or 8%, to $1,866 million for fiscal year 2010 compared to the prior fiscal year. As a percentage of revenue, gross margin was 48% of revenue for fiscal year 2010 and 2009.
38
Table of Contents
The increase in gross margin is primarily attributable to sales growth, combined with the favorable impacts in manufacturing costs. Manufacturing savings resulting from: (a) improved utilization of raw materials; (b) the impact of relocating certain of our manufacturing processes and those of our suppliers to lower cost jurisdictions; (c) favorable overhead absorption as a result of increased volume; and (d) controlled overhead spending. Also affecting the increase were infusion product recall charges for $18 million that impacted the quarter ended March 31, 2009 associated with the Alaris System shipping hold.
Gross margin as a percentage of revenue remained flat year over year. This was the result of the manufacturing efficiencies noted above, offset by a product mix that includes a higher proportion of respiratory sales, which generally have lower margins than our other capital equipment businesses.
Selling, General and Administrative Expenses
Selling, general and administrative (“SG&A”) expenses increased $173 million, or 16%, to $1,228 million for fiscal year 2010 compared to the prior fiscal year. The increase in SG&A is attributable to incremental operating costs related to standing up certain corporate functions; one-time costs associated with our spinoff from Cardinal Health of $59 million; and increases in discretionary variable compensation and share-based compensation of $84 million. Partially offsetting these increases are the favorable impacts of our March 2009 global workforce reduction program of $56 million.
SG&A expenses for fiscal year 2009 include allocated costs to us by Cardinal Health of $406 million. Included within the $406 million is $21 million of expenses associated with discontinued operations. Allocated SG&A expenses include expenses for shared functions, including management, finance, financial shared services, human resources, information technology, legal, legislative affairs and management incentive plan expenses. SG&A expenses historically allocated to us are not likely to be indicative of the actual amounts that we would have incurred had we been operating as an independent, publicly-traded company for the periods presented or for future periods following our separation from Cardinal Health.
Restructuring and Acquisition Integration Charges
Restructuring and acquisition integration charges decreased $53 million, or 74%, to $19 million for fiscal year 2010 compared to the prior fiscal year. During fiscal year 2009, we launched a series of restructuring programs with the goal to provide improved management focus through the re-alignment of the management structure and lowering its cost structure through a reduction in global workforce. During fiscal year 2010, we recorded $9 million of expense associated with these restructuring programs. In total, we recorded $66 million of expense for these restructuring programs, and as of March 31, 2010, all major activities of these programs have been completed. During fiscal year 2009, restructuring charges were primarily comprised of employee related and facility exit restructuring charges of $60 million, and acquisition integration expenses of $12 million were primarily related to our 2007 acquisition of Viasys.
Gain on the Sale of Assets
In May 2010, we completed the sale of our Research Services business, which was historically part of our MT&S segment, for $81 million in cash. Including estimated working capital adjustments as part of the definitive agreement, the pre-tax gain related to the disposition was approximately $12 million, or $1 million loss after tax. Income tax expense associated with the transaction was impacted by approximately $24 million of goodwill assigned to the disposition that was not deductible for tax purposes. This transaction is subject to customary closing conditions which includes potential adjustments for the final working capital. See note 2 to our audited consolidated and combined financial statements.
Operating Income
Operating income for fiscal year 2010 increased $28 million, or 6%, to $472 million. The increase in operating income was due to a reduction of restructuring and acquisition integration charges, the pre-tax gain on the sale of
39
Table of Contents
our Research Services business, and higher sales and associated margin. Partially offsetting these increases are higher SG&A expenses, primarily associated with one-time and incremental expenses related to standing up as a public company. We have, and expect to continue to, experience benefits from our restructuring programs initiated in March 2009.
Segment profit in our CCT reportable segment increased by $41 million, or 12%, to $395 million for fiscal year 2010 compared to the prior fiscal year. The increase in segment profit is attributable to higher sales in our infusion and respiratory businesses, decreases in restructuring and integration charges, and a decrease in infusion product recall charges relative to the $18 million product recall charge recorded for the quarter ended March 31, 2009.
Segment profit in our MT&S reportable segment decreased by $25 million, or 28%, to $65 million for fiscal year 2010 compared to the prior fiscal year. The decrease in segment profit is primarily attributable to the timing and increase of SG&A expenses. The decreases were partially offset by incremental gross margin and reductions in restructuring and acquisition integration expenses.
Interest Expense and Other
Interest expense and other, net for fiscal year 2010 increased $14 million, or 14%, to $115 million. The increase is attributable to a one-time write-off of debt issuance and related costs of $22 million associated with the bridge loan facility, which was terminated on August 31, 2009, and to a lesser extent, the difference in interest expense for our outstanding senior notes compared to interest expense associated with the allocated debt from Cardinal Health in the prior year. These increases were partially offset by decreases in foreign currency exchange losses of $22 million during fiscal year 2010 compared to fiscal year 2009.
In general, gains and losses resulting from foreign currency exchange rates are related to the remeasurement of receivables and payables, which are denominated in currencies other than the functional currency of the subsidiary that holds the receivable or payable.
Provision for Income Taxes
Income tax expense for fiscal year 2010 increased $133 million to $186 million compared to the prior fiscal year. The effective tax rate for fiscal year 2010 was 52.1% compared to 15.5% for fiscal year 2009. The change in expense and effective tax rates in aggregate were primarily the result of charges recorded during fiscal year 2010 of approximately $71 million and benefits recorded during fiscal year 2009 of approximately $45 million.
During fiscal year 2010, we completed a detailed analysis of our tax reserves prompted by new information related to our potential tax positions, tax liabilities, and tax planning strategies. For this analysis, we retained third-party advisors to assist in assessing whether, based on the new information, our tax risks had changed, and whether additional reserves in excess of those already recorded were necessary. This change in estimate of approximately $58 million was recorded as a charge to net income for the quarter ended March 31, 2010. Also during fiscal year 2010, the disposition of our Research Services business resulted in additional tax expense of approximately $13 million, primarily due to with non-deductible goodwill associated with the disposition.
During fiscal year 2009, a claim was filed by Cardinal Health with the Internal Revenue Service (“IRS”) to amend the filing position taken on its United States federal income tax return for fiscal years 2004 through 2006 related to a secured loan transaction involving certain of our sales-type lease receivables. Since our income taxes are presented on a separate return basis, we recognized a $24 million net tax benefit in the quarter ended March 31, 2009, related to this item. Also during fiscal year 2009, a benefit of approximately $21 million was recorded due to the impact of changes in state tax laws and a change in the estimated values of our deferred income tax liabilities due to the separation from Cardinal Health.
40
Table of Contents
Generally, fluctuations in our effective tax rate are primarily due to changes within international and state effective tax rates resulting from our business mix and changes in the tax impact of restructuring and acquisition integration charges and other discrete items, which may have unique tax implications depending on the nature of the item. The provision for income tax amounts historically calculated is not likely to be indicative of the actual amounts that we would have incurred had we been operating as an independent, publicly-traded company for the periods presented or for future periods following the separation.
For additional detail regarding the provision for income taxes, see note 12 to our audited consolidated and combined financial statements.
Income from Discontinued Operations, Net of Tax
Income from discontinued operations, net of tax, for fiscal year 2010 decreased 92% to $23 million compared to the prior fiscal year. Included in discontinued operations for fiscal year 2010 and 2009 are (a) certain lines of business that manufacture and sell surgical and exam gloves, drapes and apparel and fluid management products in the United States markets that were historically managed by us prior to the spinoff and were part of the clinical and medical products business of Cardinal Health, and were retained by Cardinal Health as a result of the spinoff; and (b) the Audiology business, which produces and markets hearing diagnostic equipment, which was sold on October 1, 2009. The businesses retained by Cardinal Health have been presented as discontinued operations for all periods reported through the date of our spinoff of August 31, 2009.
The net income earned by the businesses retained by Cardinal Health upon the spinoff is included within our income from discontinued operations until the date of our spinoff of August 31, 2009, or two months in fiscal year 2010; whereas the net income earned by these businesses for the entire fiscal year 2009 is included within our income from discontinued operations for that same period. The significant decrease in our income from discontinued operations is primarily due to the difference in the number of periods the businesses retained by Cardinal Health were included within our results in fiscal year 2010 compared to fiscal year 2009. Additionally, during fiscal year 2010, we recorded losses associated with the sale of the Audiology business. See note 2 to our audited consolidated and combined financial statements.
Fiscal Year Ended June 30, 2009 Compared to Fiscal Year Ended June 30, 2008
Below is a summary of comparative results of operations and a more detailed discussion of results for the fiscal years ended June 30, 2009 and 2008:
| Fiscal Year Ended June 30, | ||||||||||
| (in millions) | 2009 | 2008 | Change | |||||||
| Revenue |
$ | 3,595 | $ | 3,663 | $ | (68 | ) | |||
| Cost of Products Sold |
1,864 | 1,896 | (32 | ) | ||||||
| Gross Margin |
1,731 | 1,767 | (36 | ) | ||||||
| Selling, General and Administrative Expenses |
1,055 | 1,027 | 28 | |||||||
| Research and Development Expenses |
160 | 157 | 3 | |||||||
| Restructuring and Acquisition Integration Charges |
72 | 35 | 37 | |||||||
| Acquired In-Process Research and Development |
— | 18 | (18 | ) | ||||||
| Operating Income |
444 | 530 | (86 | ) | ||||||
| Interest Expense and Other, Net |
101 | 87 | 14 | |||||||
| Income Before Income Tax |
343 | 443 | (100 | ) | ||||||
| Provision for Income Tax |
53 | 110 | (57 | ) | ||||||
| Income from Continuing Operations |
290 | 333 | (43 | ) | ||||||
| Income from Discontinued Operations, Net of Tax |
278 | 330 | (52 | ) | ||||||
| Net Income |
$ | 568 | $ | 663 | $ | (95 | ) | |||
41
Table of Contents
Revenue
Total revenue decreased by $68 million, or 2%, to $3,595 million for fiscal year 2009 compared to the prior fiscal year. The revenue decline resulted from lower sales volume in our capital equipment businesses ($149 million), as a result of the deferral of capital spending by hospitals and a ship hold on our Alaris infusion devices. Hospitals delayed their capital spending during fiscal year 2009 due to the decline in the overall global economic environment, which we believe created uncertainty in regards to access to capital markets and reduced the size of hospital endowments that are utilized to provide funding for capital equipment products. For several months of fiscal year 2009, we also placed a hold on shipping the Alaris PCA module and related Alaris PC Unit while we sought FDA clearance for a software correction under the corrective action plan, which we received in July 2009. As a result of these items, the volume of our capital equipment sales decreased, and overall capital goods products revenues decreased. Additionally, revenue declined due to unfavorable changes in foreign exchange rates. Sales transactions denominated in currencies other than the United States dollar comprised approximately 26% of our total revenue in fiscal year 2009, of which the majority is denominated in euros and British pounds. On average during fiscal year 2009, the United States dollar strengthened relative to the euro and British pound by approximately 7% and 26%, respectively.
The revenue declines were partially offset by revenue increases associated with acquisitions ($170 million), primarily due to our acquisition of Enturia in fiscal year 2008; international growth, exclusive of effects of foreign exchange; and new products.
Our CCT segment revenue decreased $174 million, or 7%, to $2,429 million for fiscal year 2009 compared to the prior fiscal year. This decrease was due primarily to lower sales volume of capital equipment due to delays in hospital capital spending and the Alaris infusion device ship hold discussed above and the negative effect of changes in foreign exchange rates, partially offset by increases in revenues associated with new products, largely due to new respiratory ventilator equipment products.
Our MT&S segment revenue increased $106 million, or 10%, to $1,166 million, for fiscal year 2009 compared to the prior fiscal year. The revenue increase was primarily due to acquisitions (approximately $170 million); and international revenue growth, excluding effects of foreign exchange rates. These increases were partially offset by the negative effect of changes in foreign exchange rates, and a decline in diagnostic capital equipment and instrument revenues.
Gross Margin and Cost of Products Sold
Gross margin decreased $36 million, or 2%, to $1,731 million for fiscal year 2009 compared to the prior fiscal year. Gross margin as a percentage of revenue was 48% in both fiscal year 2009 and fiscal year 2008.
During fiscal year 2009, gross margin was affected by a variety of offsetting factors, including: international pricing pressure; the effects of foreign exchange, in which the benefits of changes in foreign exchange rates associated with our procurement transactions were more than outweighed by unfavorable impacts associated with sales transactions; the adverse effects of the under-utilization of our capital equipment manufacturing facilities; and increased sales volumes in certain of our infection prevention and skin preparation businesses and a shift in sales mix favoring disposable products within our CCT segment due to the decline in sales volume of capital equipment. Our infection prevention, skin preparation, and disposable products each recognize higher margins than our other product offerings.
Selling, General and Administrative Expenses
SG&A expenses increased $28 million, or 3%, to $1,055 million for fiscal year 2009 compared to the prior fiscal year. SG&A expenses increased primarily due to acquisitions ($50 million), additional investments in product
42
Table of Contents
quality processes ($11 million), and additional provisions for bad debts ($4 million). These increases were partially offset by a decrease due to favorable changes in foreign exchange rates ($25 million) and a decrease in management incentive compensation expense ($19 million).
SG&A expenses allocated by Cardinal Health to us during the fiscal years 2009 and 2008 were $406 million and $407 million, respectively. Included within the $406 million and $407 million of SG&A expenses allocated to us from Cardinal Health for fiscal years 2009 and 2008 are $21 million and $23 million, respectively, associated with discontinued operations. Allocated SG&A expenses include expenses for shared functions, including management, finance, financial shared services, human resources, information technology, legal, legislative affairs and management incentive plan expenses.
Restructuring and Acquisition Integration Charges
Restructuring and acquisition integration charges increased $37 million, or 106%, to $72 million during fiscal year 2009 compared to the prior fiscal year. Restructuring and acquisition integration charges incurred in fiscal year 2009 were primarily comprised of integration expenses associated with Viasys ($9 million); employee-related restructuring costs ($40 million); and facility exit costs ($20 million). As previously mentioned, in the third quarter of fiscal year 2009, we announced a cost reduction initiative primarily in response to the delay in hospital capital spending and the overall decline in the global economy. We recorded a $19 million pre-tax restructuring charge associated with this cost reduction initiative, included within employee-related restructuring costs identified above.
Restructuring and acquisition integration charges incurred in fiscal year 2008 were primarily comprised of integration costs associated with our acquisition of Viasys and restructuring costs related to the closure of a replenishment center, headcount reductions within existing operations and other facility exit costs.
Acquired In-process Research and Development
In connection with our acquisition of certain businesses in fiscal year 2008, we purchased IPR&D. At the time of acquisition, these projects had not yet achieved technological feasibility and were deemed to have no alternative use and, accordingly, the estimated fair value of the IPR&D was expensed at the acquisition date, under the accounting rules of fiscal year 2009 and prior years. During fiscal year 2008, we recorded charges to write off our preliminary estimates of fair values of the IPR&D associated with the Enturia acquisition ($18 million), other minor acquisitions ($25 million), and adjusted downward the IPR&D charges initially recorded in fiscal year 2007 associated with the Viasys acquisition based on the final valuation of its related IPR&D in fiscal year 2008 ($25 million).
Operating Income
Operating income decreased $86 million, or 16%, to $444 million during fiscal year 2009 compared to the prior fiscal year.
Our CCT segment profit decreased $158 million, or 31%, to $354 million for fiscal year 2009 compared to the prior fiscal year. The decrease in segment profit was primarily a result of a lower sales volume of capital equipment due to the delay in hospital capital spending and the Alaris infusion device ship hold ($85 million), the unfavorable changes in foreign exchange rates ($22 million) and the impact of the restructuring charges discussed previously.
Our MT&S segment profit increased $72 million to $90 million for fiscal year 2009 compared to the prior fiscal year. The increase in segment profit was primarily due to the profitability of prior year acquisitions ($51 million) and the impact of the change in IPR&D charges in fiscal year 2009 ($18 million). These increases were partially offset by unfavorable changes in foreign exchange rates ($11 million) and the impact of the restructuring charges discussed previously.
43
Table of Contents
Interest Expense and Other
Interest expense and other, net increased $14 million, or 16%, to $101 million during fiscal year 2009 compared to the prior fiscal year. The increase in interest expense and other, net was primarily the result of increases in losses due to changes in foreign exchange rates ($32 million), partially offset by a reduction in interest expense allocated to us by Cardinal Health ($8 million).
Interest expense allocated to us by Cardinal Health totaled $80 million and $88 million in fiscal year 2009 and 2008, respectively. The decrease in allocated interest expense was primarily due to lower levels of debt allocated to us by Cardinal Health. See note 11 to the audited consolidated and combined financial statements for further information.
Provision for Income Taxes
For fiscal year 2009, our provision for income taxes decreased $57 million to $53 million, compared to the prior fiscal year. The decrease in income tax expense was due to a reduction in income before income taxes, a decrease related to a claim filed with the IRS to amend our position relative to sales type lease transactions previously discussed ($24 million), and a decrease for the revaluation of our deferred tax assets and liabilities to account for the impact of internal reorganizations ($21 million). These decreases in tax are partially offset by an unfavorable tax adjustment for accrued interest related to proposed tax assessments and the impact of nondeductible IPR&D charges in fiscal year 2008. As a result of this activity, our effective tax rate decreased to 15.5% in fiscal year 2009 from 24.8% in fiscal year 2008.
Income from Discontinued Operations, Net of Tax
Income from discontinued operations, net of tax expense decreased $52 million, or 16%, to $278 million for fiscal year 2009 compared to the prior fiscal year. The decrease was attributable to a gross margin decline ($28 million) due to a shift in product mix towards lower margin products and increases in cost of petroleum based raw materials; the net effect of increased SG&A expenses ($23 million); a gain on the sale of a business unit in fiscal year 2008 ($11 million); and an increase in tax expense ($24 million). These decreases were partially offset by an increase in royalty income ($44 million).
Liquidity and Capital Resources
Overview
Following the spinoff, our capital structure, long-term capital commitments and sources of liquidity changed significantly from when our business operations were a component of Cardinal Health. We no longer receive cash from Cardinal Health to fund our operating or investing needs. Instead, our ability to fund our capital needs depends on our ongoing ability to generate cash from operations, the overall capacity and terms of our financing arrangements, and our access to the capital markets.
Historically, we have generated, and expect to continue to generate, positive cash flow from operations. Cash flow from operations primarily represents inflows from net income (adjusted for depreciation and other non-cash items) and outflows from investment in sales-type leases entered into, as we sell and install dispensing equipment, and other increases in working capital needed to grow the business. Cash flows from investing activities represent our investment in intellectual property and capital equipment required to grow our business, as well as acquisitions. Cash flows from financing activities are primarily related to the issuance of debt associated with our spinoff from Cardinal Health. Prior to our spinoff, cash flows from financing activities were primarily related to changes in Cardinal Health’s investment in us. In the past, Cardinal Health would fund our operating and investing activities as needed and transfer our excess cash at its discretion. Transfers of cash both to and from Cardinal Health’s cash management system are reflected as a component of “Parent Company Investment” within “Parent Company Equity” in the consolidated and combined balance sheets.
44
Table of Contents
Our cash balance at June 30, 2010 was $1,019 million. Of this balance, $896 million is held outside of the United States and is denominated in United States dollars as well as other currencies. We believe that our current domestic cash flow from operations and domestic cash balances are sufficient to meet domestic operating needs. However, should our domestic cash needs exceed our current or future domestic cash flows, we may be required to repatriate foreign cash or utilize our revolving credit facilities, both of which would result in increased expense.
We believe that our future cash from operations together with our access to funds available under our senior unsecured revolving credit facilities and the capital markets will provide adequate resources to fund both short-term and long-term operating requirements, capital expenditures, acquisitions and new business development activities.
Sources and Uses of Cash
The following table summarizes our statements of cash flows from continuing operations for the fiscal years ended June 30, 2010, 2009, and 2008:
| Fiscal Year Ended June 30, | ||||||||||||
| (in millions) | 2010 | 2009 | 2008 | |||||||||
| Cash Flow Provided by/(Used in) |
||||||||||||
| Operating Activities |
$ | 706 | $ | 515 | $ | 561 | ||||||
| Investing Activities |
$ | (256 | ) | $ | (133 | ) | $ | (788 | ) | |||
| Financing Activities |
$ | 21 | $ | (186 | ) | $ | 133 | |||||
Fiscal Years Ended June 30, 2010 and June 30, 2009
Net cash provided by operating activities from continuing operations increased $191 million to $706 million for the fiscal year ended June 30, 2010, compared to the prior fiscal year. The increase was due to increased cash flows associated with other accrued liabilities and operating items ($274 million), primarily related to an increase in uncertain tax position reserves, the timing of recognition of certain deferred tax items through our current tax provision and taxes payable, and accruals for employee related liabilities; increases in cash flows associated with accounts payable ($81 million), primarily due to longer payment cycles at the end of fiscal year 2010 compared to fiscal year 2009 to enhance our cash positions; and the impacts of converting inventory balances ($30 million), primarily related to the release of the shipping hold on the Alaris System. These increases were partially offset by the decrease in cash flows associated with accounts receivable ($60 million). The decrease in cash flow associated with accounts receivable is primarily a result of longer collection periods with Cardinal Health. Prior to the spinoff, accounts receivables from Cardinal Health were considered to be settled for cash immediately, as they were intercompany balances. Based on our focused efforts to improve collections surrounding accounts receivable over the course of fiscal year 2010, we have experienced increased collection rates and lower days outstanding associated with accounts receivable activity.
Net cash used in investing activities from continuing operations increased $123 million to $256 million for the fiscal year ended June 30, 2010, compared to the prior fiscal year. This increase was due to the purchase of Medegen ($224 million) and increases in capital expenditures ($12 million). The increase was partially offset by proceeds from the divestitures of our Research Services business ($81 million) and Audiology business ($27 million).
Within financing activities, we incurred indebtedness with a face value of $1.4 billion in connection with the spinoff from Cardinal Health. On August 31, 2009, we used the proceeds of this debt of $1.374 billion to pay a dividend to Cardinal Health, and as a result, those proceeds were not available for our business needs. Financing activities prior to fiscal year 2010 were primarily related to cash receipts and disbursements between us and Cardinal Health to fund business operations as a component of Cardinal Health.
Fiscal Years Ended June 30, 2009 and June 30, 2008
Net cash provided by operating activities decreased $46 million to $515 million for the fiscal year ended June 30, 2009, compared to the prior fiscal year. The decrease was primarily due to a decrease in net income, after
45
Table of Contents
adjustments for non-cash items ($163 million) and a reduction in cash flows related to other accrued liabilities and operating items ($86 million); partially offset by increased cash flows from collections of accounts receivable ($96 million) and sales-type capital leases ($88 million). Net cash used in investing activities decreased $655 million to $133 million compared to the prior fiscal year, primarily related to the cash purchase price of Enturia in fiscal year 2008 ($476 million) and reductions in capital expenditures ($71 million). The net cash used in financing for both years was primarily the result of net cash transfers to and from Cardinal Health.
Capital Resources
Senior Unsecured Notes. On July 14, 2009, we offered and sold $1.4 billion aggregate principal amount of senior unsecured notes and received net proceeds of $1.374 billion. As part of the spinoff, the net proceeds were subsequently distributed as a dividend payment to Cardinal Health.
The indenture for the senior notes limits our ability to incur certain secured debt and enter into certain sale and leaseback transactions. In accordance with the indenture, we may redeem the senior notes prior to maturity at a price that would equal or exceed the outstanding principal balance, as defined. In addition, if we undergo a change of control and experience a below investment grade rating event, we may be required to repurchase all of the senior notes at a purchase price equal to 101% of the principal balance plus any accrued and unpaid interest.
In connection with the issuance of the senior notes, we entered into a registration rights agreement with the initial purchasers of the notes pursuant to which we agreed to file a registration statement with the SEC to conduct an exchange offer for the notes. In accordance with the registration rights agreement, we filed a Form S-4 with the SEC and conducted an exchange offer for the notes, which we completed on February 4, 2010. The purpose of the exchange offer was to allow the holders of the senior notes, which were issued in a private placement transaction and were subject to transfer restrictions, to exchange their notes for new notes that did not have these restrictions and are registered under the Securities Act. All of the outstanding senior notes were exchanged in the exchange offer. Following the exchange offer, we continue to have $1.4 billion aggregate principal amount of senior notes outstanding.
Revolving Credit Facilities. On July 1, 2009, we entered into two senior unsecured revolving credit facilities with an aggregate available principal amount of $720 million, allocated as follows:
| • | $240 million — 364-day revolving credit facility (maturing August 30, 2010); and |
| • | $480 million — three-year revolving credit facility (maturing August 31, 2012) |
Borrowings under the 364-day revolving credit facility bear interest at a floating rate per annum based upon the London Interbank Offered Rate (“LIBOR”) or alternate base rate (“ABR”), in each case, plus an applicable margin, which in the case of LIBOR varies from 2.2% to 3.5% based upon CareFusion’s debt ratings and in the case of ABR varies from 1.2% to 2.5% based upon CareFusion’s debt ratings. At June 30, 2010, we had no amounts outstanding under our 364-day revolving credit facility.
Borrowings under the three-year revolving credit facility bear interest at a floating rate per annum based upon the LIBOR or the alternate base rate ABR, in each case, plus an applicable margin, which in the case of LIBOR varies from 2.1% to 3.375% depending on CareFusion’s debt ratings and in the case of ABR varies from 1.1% to 2.375% depending on CareFusion’s debt ratings. The commitments under the three-year revolving credit facility are subject to increase, upon our request and consent by the lenders, by up to an aggregate of $30 million. Subject to customary covenants, the three-year revolving credit facility allows for the stated borrowing amount, including $25 million of standby letters of credit. At June 30, 2010, we had no amounts outstanding under our three-year revolving credit facility.
The revolving credit facilities contain several customary covenants including, but not limited to, limitations on liens, subsidiary indebtedness, investments, dispositions, restricted payments, transactions with affiliates, change
46
Table of Contents
in control and sale and lease-back transactions. The revolving credit facilities also require that we maintain certain interest coverage and maximum leverage ratios. We were in compliance with all of our revolving credit agreement covenants at June 30, 2010. All obligations under the revolving credit facilities are guaranteed by each of our existing and future direct and indirect material domestic subsidiaries.
We may enter into new revolving facilities in the future. However, the expiration of the 364-day facility on August 30, 2010 is not expected to have a negative impact on our ability to access adequate financing in the future.
Bridge Loan Facility. On July 1, 2009, we entered into a senior unsecured bridge loan facility (the “bridge loan facility”) to provide financing for an aggregate principal amount of $1.4 billion, with a term of 364 days from the date of any funding, for payment of the dividend to Cardinal Health as part of our spinoff. As the senior unsecured note offering was successfully completed prior to the separation, those proceeds were used to finance the payment of the dividend to Cardinal Health in lieu of drawing the bridge loan facility. As a result, the bridge loan facility was terminated on August 31, 2009. In connection with this termination, we expensed approximately $22 million of capitalized fees to interest expense in the quarter ended September 30, 2009.
Dividends
We currently intend to retain any earnings to finance research and development, acquisitions and the operation and expansion of our business and do not anticipate paying any cash dividends in the foreseeable future. The declaration and payment of any dividends in the future by us will be subject to the sole discretion of our board of directors and will depend upon many factors, including our financial condition, earnings, capital requirements of our operating subsidiaries, covenants associated with certain of our debt obligations, legal requirements, regulatory constraints and other factors deemed relevant by our board of directors. Moreover, should we pay any dividend in the future, there can be no assurance that we will continue to pay such dividends.
Contractual Obligations
As of June 30, 2010, our contractual obligations, including estimated payments due by period, are as follows:
| Payments Due by Period | |||||||||||||||
| (in millions) | 2011 | 2012-2013 | 2014-2015 | Thereafter | Total | ||||||||||
| Long-Term Debt1 |
$ | 3 | $ | 250 | $ | 450 | $ | 700 | $ | 1,403 | |||||
| Capital Lease Obligations2 |
1 | 2 | — | — | 3 | ||||||||||
| Other Long-Term Liabilities3 |
61 | 32 | 10 | 7 | 110 | ||||||||||
| Interest on Long-Term Debt4 |
78 | 152 | 126 | 204 | 560 | ||||||||||
| Operating Leases5 |
44 | 71 | 49 | 33 | 197 | ||||||||||
| Purchase Obligations6 |
195 | 12 | 3 | 4 | 214 | ||||||||||
| Total Financial Obligations |
$ | 382 | $ | 519 | $ | 638 | $ | 948 | $ | 2,487 | |||||
| 1 | Represents maturities of our long-term debt obligations, excluding capital lease obligations described below, as described in note 11 to the audited consolidated and combined financial statements. Amounts are presented gross of debt purchase discounts of $16 million at June 30, 2010. |
| 2 | Represents maturities of our capital lease obligations included within long-term debt in the consolidated and combined balance sheet and the related estimated future interest payments. |
| 3 | Represents cash outflows by period for certain of our long-term liabilities in which cash outflows could be reasonably estimated. Certain long-term liabilities, such as unrecognized tax benefits of $269 million and deferred taxes of $671 million, tax associated accruals of $94 million, deferred compensation obligations of $9 million and other long-term liabilities of $7 million, have been excluded from the table above because of the inherent uncertainty of the underlying tax positions or because of the inability to reasonably estimate the timing of any cash outflow. See note 12 to the audited consolidated and combined financial statements for additional information. |
47
Table of Contents
| 4 | Interest obligation is calculated based on each outstanding debt stated or coupon rate, or existing variable rate as of June 30, 2010, as applicable. |
| 5 | Represents minimum rental payments and the related estimated future interest payments for operating leases having initial or remaining non-cancelable lease terms as described in note 13 to the audited consolidated and combined financial statements. |
| 6 | Purchase obligations are defined as an agreement to purchase goods or services that is enforceable and legally binding and specifying all significant terms, including the following: fixed or minimum quantities to be purchased; fixed, minimum or variable price provisions; and approximate timing of the transaction. The purchase obligation amounts disclosed above represent estimates of the minimum for which we are obligated and the time period in which cash outflows will occur. Purchase orders and authorizations to purchase that involve no firm commitment from either party are excluded from the above table. In addition, contracts that can be unilaterally cancelled with no termination fee or with proper notice are excluded from our total purchase obligations except for the amount of the termination fee or the minimum amount of goods that must be purchased during the requisite notice period. |
Off-Balance Sheet Arrangements
At June 30, 2010, we did not have any off-balance sheet arrangements.
Critical Accounting Policies and Sensitive Accounting Estimates
Our discussion and analysis of our results of operations and liquidity and capital resources are based on our audited consolidated and combined financial statements, which have been prepared in accordance with United States Generally Accepted Accounting Principles (“GAAP”). The preparation of these audited consolidated and combined financial statements requires us to make estimates and judgments that affect the reported amounts of assets, liabilities, revenue and expenses, and disclosure of contingent assets and liabilities. Critical accounting policies are those accounting policies that can have a significant effect on the presentation of our financial condition and results of operations, and require use of complex and subjective estimates based upon past experience, trends, and management’s judgment. We evaluate our estimates and judgments on an ongoing basis and believe our estimates to be reasonable. Other companies applying reasonable judgment to the same facts and circumstances could develop different estimates. Because of the uncertainty inherent in such estimates, actual results may differ from these estimates. Below are those policies applied in preparing our audited consolidated and combined financial statements that management believes are the most dependent on the application of estimates and assumptions. For additional accounting policies, see note 1 to our audited consolidated and combined financial statements.
Revenue Recognition
We generate revenue through the sale and lease of equipment, software, services, medical products, supplies, and the income associated with the financing of our equipment leases. We recognize revenue when:
| • | persuasive evidence of an arrangement exists; |
| • | product delivery has occurred or the services have been rendered; |
| • | the price is fixed or determinable; and |
| • | collectability is reasonably assured. |
The timing of revenue recognition and the amount of revenue actually recognized in each case depends on a variety of factors, including the specific terms of each arrangement and the nature of our obligations. Determination of the appropriate amount of revenue recognized may involve subjective or complex judgments and estimates that we believe are reasonable, but actual results may differ from our estimates. The significant judgments and uncertainties that are sufficiently sensitive and could result in material differences under other assumptions and conditions are those described below.
48
Table of Contents
Evaluation of the Significance of Embedded Software
We sell and lease products with embedded software. We regularly review these products to determine whether embedded software is more than incidental to the product as a whole. If the embedded software is more than incidental to the product as a whole, the product is classified as a software product.
In classifying our products, we consider the following characteristics to be indicators that embedded software is more than incidental to the product as whole:
| • | software is a significant focus of the marketing effort or the software application is sold separately; |
| • | significant internally developed software costs have been incurred; and |
| • | if we provide telephone support, bug-fixes, and/or unspecified upgrades specific to the embedded software. |
The evaluation process is often complex and subject to significant judgment as the products exhibit varying degrees of the indicators identified above, such as:
| • | certain products are marketed as systems or solutions wherein it is implied, but not explicitly stated within marketing and sales collateral, that embedded software provides the basis for significant functionalities identified within the marketing efforts; |
| • | internal software development costs are incurred during the product development process; |
| • | separately priced extended warranty services provide post-installation support relative to repair parts and services and also include telephone support and bug-fixes for the software embedded within the products; and |
| • | we are required by law to provide medical safety related bug-fixes for products with embedded software elements. |
We classify our infusion products, when sold with safety software, patient identification products, and certain diagnostic equipment as software. We have determined the embedded software within our other products, primarily our dispensing and respiratory products, is incidental to the products as a whole. Those products are therefore not classified as software.
Revenue Recognition for Leases
Our accounting for leases involves specific determinations under applicable lease accounting standards, which often involve complex and prescriptive provisions. If a lease qualifies as a sales-type capital lease, equipment revenue is recognized upon delivery or installation of the equipment as opposed to ratably over the lease term. Therefore, our lease classification procedures significantly affect the timing of revenue recognition. The critical element considered by us in determining the classification of our lease transactions is the fair value of the leased equipment, including its estimated fair value at the inception and conclusion of the lease, and the estimated useful life of our equipment. For the purposes of determining the fair value of leased equipment at the inception of the lease, we apply the percentage discount from rental list prices provided within the lease transaction against the purchase list price. This methodology assumes that purchase customers are provided similar discounts as lease customers. Periodically, we review discount levels provided to purchase customers and lease customers to validate this assumption. We estimate the useful life of our equipment based upon actual historical data which identifies the length of time our equipment has been in place and in service at customer facilities.
Multiple Element Arrangements
The majority of our transactions qualify as multiple element arrangements. We use the relative fair value method to allocate contract proceeds to each unit of accounting, which are then individually recognized to revenue. To the extent that fair value evidence does not exist for delivered elements of the transaction, we apply the residual method.
49
Table of Contents
Determination as to whether fair value exists and the valuation of our fair value estimates are critical to both the relative fair value method and residual method. The determination of fair value estimates associated with our products and services is generally based on historical evidence of sales of the same product in stand alone transactions and the contract renewal prices for post-contract support and separately priced extended warranty services.
For software and software related products, evidence used in the determination of fair value estimates are based solely on vendor-specific objective evidence. Third-party fair value evidence may be used for non-software products.
Different conclusions as to the existence and valuation of fair value estimates may significantly affect the timing and valuation of revenue recognition, the classification of leasing transactions, and the classification of revenue as product, service, rental or other income. It is impossible to determine the effects of potential different conclusions as they relate to the existence or valuation of fair value estimates.
We will adopt Accounting Standards Updates (“ASU”) 2009-13 — Multiple-Deliverable Revenue Arrangements and ASU 2009-14 — Certain Revenue Arrangements That Includes Software Elements on July 1, 2010. The adoption of these standards will cause the significant majority of our products, including infusion, patient identification, and diagnostic equipment to be excluded from the scope of software revenue recognition provisions. Additionally, we will utilize the relative selling price method in allocating contractual proceeds to units of accounting in multiple element arrangements. Neither the reclassification of our infusion, patient identification and diagnostic equipment, nor the use of the relative selling price method is anticipated to result in a significant change in the identification of units of accounting, or the timing or amount of our revenues. See note 1 to the audited consolidated and combined financial statements.
Business Combinations
Assumptions and estimates are used to determine the fair value of assets acquired and liabilities assumed in a business combination. A significant portion of the purchase price in many of our acquisitions is assigned to intangible assets, which requires management to use significant judgment in determining fair value. Current and future amortization expense for such intangibles is affected by purchase price allocations and by the assessment of estimated useful lives of such intangibles, excluding goodwill. We believe the assets recorded and the useful lives established are appropriate based upon current facts and circumstances.
In conjunction with the review of a transaction, the status of the acquired company’s research and development projects is assessed to determine the existence of IPR&D. In connection with certain acquisitions, we are required to estimate the fair value of acquired IPR&D, which requires selecting an appropriate discount rate and estimating future cash flows for each project. Management also assesses the current status of development, nature and timing of efforts to complete such development, uncertainties and other factors when estimating the fair value. Costs are not assigned to IPR&D unless future development is probable. Beginning with acquisitions completed on or after July 1, 2009, IPR&D is recorded as an unamortized intangible asset until the underlying products are either completed and put into service, which would require commencing amortization over the estimated product life, or determining the products will not complete development, which would require impairing the portion of IPR&D associated with that product. Until either determination is made, IPR&D is subject to periodic impairment review, with impairments, if any, expensed to our consolidated and combined statement of income. During fiscal year 2010, we completed the acquisition of Medegen, which resulted in approximately $45 million of IPR&D associated with new products under development being recorded as an intangible asset. The timing and recognition of both the in service date for these products as well as the potential of impairment involves significant judgment.
50
Table of Contents
Goodwill and Other Intangibles
Goodwill and indefinite lived intangible assets are subject to impairment reviews annually, and whenever indicators of impairment exist. Intangibles with definite lives are reviewed for impairment whenever events or changes in circumstances indicate that the carrying amount of the asset might not be recoverable.
In conducting the annual impairment test of our goodwill, the fair value of our reporting units is compared to its carrying amount, including goodwill. If the fair value exceeds the carrying amount, then no impairment exists. If the carrying amount exceeds the fair value, further analysis is performed to assess impairment. We perform our impairment testing at the operating segment level. There are no fluid active or inactive markets for our operating segments to derive approximate fair values, and accordingly, the valuation process is similar to the valuation of a closely-held company and considers valuation methods that are income-based and market-based. Our income-based approach is a discounted cash flow method which utilizes an estimated discount rate to the projected after-tax cash flows for the operating segment. Our market-based approach utilizes an estimated market-based multiple to the operating segments’ estimated earnings before interest, taxes, depreciation and amortization (“EBITDA”). The results of the income-based and market-based approaches are equally weighted to arrive at the total estimated fair value for each operating segment. Based on our annual impairment test as of April 1, 2010, we did not record any goodwill impairments.
The application of valuation methods requires significant judgment regarding appropriate inputs and assumptions and results in our best estimate of the fair value of an operating segment. As with any estimate, inputs and assumptions can be subject to varying degrees of uncertainty. Informed market participants can differ in their perception of value for a reporting unit. It is possible that one of our operating segments could experience a goodwill impairment in the future.
Restructuring and Acquisition Integration Charges
We separately identify restructuring and acquisition integration charges in SG&A expenses. A restructuring activity is a program whereby we fundamentally change our operations such as closing facilities, moving a product to another location or outsourcing the production of a product. Restructuring activities may also involve substantial re-alignment of the management structure of a business unit in response to changing market conditions.
Acquisition integration charges are activities and costs to integrate acquired companies into the operations of our existing activities, including such functions as selling, manufacturing, information systems, and corporate related functions.
The majority of the charges related to restructuring and acquisition integration can be classified in one of the following categories: employee-related costs, exit costs (including lease termination costs), asset impairments, and other integration costs. Employee-related costs include severance and termination benefits. Lease termination costs include lease cancellation fees, forfeited deposits and remaining payments due under existing lease agreements less estimated sublease income. Other facility exit costs include costs to move equipment or inventory out of a facility as well as other costs incurred to shut down a facility. Asset impairment costs include the reduction in value of our assets as a result of the integration or restructuring activities.
See note 5 to our audited consolidated and combined financial statements for additional information.
Provision for Income Taxes
Prior to August 31, 2009, our income taxes as presented are calculated on a separate tax return basis, although our operations have historically been included in Cardinal Health’s United States federal and state tax returns or non-Unites States jurisdictions tax returns. Cardinal Health’s global tax model was developed based on its entire portfolio of businesses. Accordingly, our tax results for periods prior to August 31, 2009 are not necessarily reflective of the results that we would have generated on a stand-alone basis.
51
Table of Contents
With the exception of certain dedicated foreign entities for periods prior to August 31, 2009, we did not maintain taxes payable to/from Cardinal Health, and we instead were deemed to settle the annual current tax balances immediately with the legal tax paying entities in the respective jurisdictions. These settlements are reflected as changes in “Parent Company Investment” in the consolidated and combined balance sheets.
Our income tax expense, deferred tax assets and liabilities and measurement of uncertain tax positions reflect management’s assessment of estimated future taxes to be paid on items in the audited consolidated and combined financial statements.
Deferred income taxes arise from temporary differences between financial reporting and tax reporting bases of assets and liabilities, as well as net operating loss and tax credit carryforwards for tax purposes. We had deferred income tax assets before valuation allowances of $350 million and $277 million as of June 30, 2010 and June 30, 2009, respectively. We also had deferred income tax liabilities of $859 million and $811 million as of June 30, 2010 and 2009, respectively. At June 30, 2010, we had gross federal, state and international loss and credit carryforwards of $3 million, $141 million and $31 million, respectively, the tax effect of which is an aggregate deferred tax asset of $16 million. Substantially all of these carryforwards are available for at least three years or have an indefinite carryforward period. The valuation allowance of $6 million at June 30, 2010 applies to certain federal, international, and state and local carryforwards that, in the opinion of management, are more likely than not to expire unutilized. However, to the extent that tax benefits related to these carryforwards are realized in the future, the reduction in the valuation allowance would be applied against income tax expense.
We believe that our estimates for the valuation allowances against deferred tax assets and measurement of uncertain tax positions are appropriate based on current facts and circumstances. However, other people applying reasonable judgment to the same facts and circumstances could develop a different estimate, and the amount ultimately paid upon resolution of issues raised may differ from the amounts accrued.
During the quarter ended September 30, 2008, Cardinal Health received an IRS Revenue Agent’s Report for the tax years 2003 through 2005 that included Notices of Proposed Adjustment related to transfer pricing arrangements between foreign and domestic subsidiaries and the transfer of intellectual property among our subsidiaries. The amount of additional tax proposed by the IRS in these notices totals $462 million, excluding penalties and interest, which may be significant. We and Cardinal Health disagree with the IRS regarding its application of the United States Treasury regulations to the arrangements under review and the valuations underlying such adjustments and intend to vigorously contest them. We are still in the audit stage with respect to the fiscal tax years ending June 30, 2006 and 2007 and have received several proposed notices of adjustment to date. The IRS has not yet commenced any IRS audit for our fiscal tax years ending June 30, 2008, 2009 and 2010. We believe that we have provided adequate contingent tax reserves for these matters. The tax matters agreement generally provides that the control of audit proceedings and payment of any additional liability related to our business is our responsibility.
During fiscal year 2010, we completed a detailed analysis of our tax reserves prompted by new information related to our potential tax positions, tax liabilities, and tax planning strategies. For this analysis, we retained third-party advisors to assist in assessing whether, based on the new information, our tax risks had changed, and whether additional reserves in excess of those already recorded were necessary. This change in estimate of approximately $58 million was recorded as a charge to net income for the quarter ended March 31, 2010. See note 12 to the audited consolidated and combined financial statements.
The proper transfer price to be charged among subsidiaries and the value of intellectual property transferred among subsidiaries are subjective determinations that depend on the specific facts and circumstances at issue. Management estimated a contingent tax reserve for these issues by first concluding that our positions are more likely than not to be sustained upon examination, including resolution of any related appeals or litigation processes. The reserve was then determined by evaluating and weighing the technical merits of alternative valuation methodologies against each other and concluding on the positions that provide the largest amount of
52
Table of Contents
tax benefit that is more likely than not of being realized upon ultimate resolution. To the extent there are any administrative or case law developments that provide additional evidence in favor or against the valuation methodologies utilized, the contingent tax reserve will be adjusted in the period that such developments occur.
Since it is not currently possible to predict whether and when any of these events will occur, we are unable to quantify potential changes. Although we believe that we have provided an appropriate contingent tax reserve for these matters, we may not be fully reserved for this matter and it is possible that we may be obligated to pay an amount in excess of the reserve, including the full amount that the IRS is seeking. Any such obligation could have an adverse effect on our results of operations and financial condition.
Loss Contingencies
We accrue for contingencies related to litigation and other claims arising out of our business based on degree of probability and range of possible loss. An estimated loss contingency is accrued in our audited consolidated and combined financial statements if it is probable that a liability has been incurred and the amount of the loss can be reasonably estimated. Because these claims are often inherently unpredictable and unfavorable resolutions could occur, assessing contingencies is highly subjective and requires judgments about future events. We regularly review contingencies to determine the adequacy of the accruals and related disclosures. The amount of ultimate loss may differ from these estimates.
Share-Based Compensation
We maintain a stock incentive plan that provides for awards of non-qualified and incentive stock options, restricted stock and restricted stock units and performance share units for the benefit of certain of our officers, directors and employees. At the time of the spinoff, Cardinal Health converted or adjusted outstanding stock options, restricted stock and restricted stock units (collectively, “share-based awards”) with respect to Cardinal Health common shares held by Cardinal Health and CareFusion employees. The manner of conversion for each employee was determined based on the date of the original share-based award and the employment status of the employee at the spinoff date of August 31, 2009.
We record share-based compensation expense for the share-based awards held by our employees, regardless of whether such share-based awards are based on common stock of CareFusion or common shares of Cardinal Health, with the offsetting impact recorded to “Additional Paid-In Capital” in our consolidated and combined balance sheets. The fair value of the stock options granted during the fiscal year ended June 30, 2009, was estimated by Cardinal Health utilizing a Lattice valuation model. The fair value of stock options granted by CareFusion during the fiscal year ended June 30, 2010 and subsequent to the spinoff was estimated by CareFusion utilizing a Black-Scholes-Merton valuation model. Our estimate of an option’s fair value depends on a complex process that requires the estimation of future uncertain events. These events, estimates of which are entered within the option valuation model include, but are not limited to, stock price volatility, the expected option life, expected dividend yield and option forfeiture rates. Once employee stock option values are determined, current accounting practices do not permit them to be changed, even if the estimates used in the valuation model are different from actual results. We are required to compare our estimated share-based forfeiture rates to actual forfeiture rates and record any adjustments as necessary. See note 18 to our audited consolidated and combined financial statements for additional information regarding share-based compensation including the valuation process.
New Accounting Pronouncements
See note 1 to the audited consolidated and combined financial statements included in Item 8 of this Form 10-K for a description of recently issued accounting pronouncements, including the expected dates of adoption and estimated effects on our results of operations, financial positions and cash flows.
53
Table of Contents
| ITEM 7A. | QUANTITATIVE AND QUALITATIVE DISCLOSURES ABOUT MARKET RISK |
In the normal course of business, our operations are exposed to risks associated with changes in interest rates and foreign exchange rates. We seek to manage these risks using hedging strategies that involve the use of derivative instruments. We do not enter into any derivative agreements for trading or speculative purposes.
While we believe we have designed an effective risk management program, there are inherent limitations in our ability to forecast our exposures, and therefore we cannot guarantee that our programs will completely mitigate all risks associated with unfavorable movement in either foreign exchange rates or interest rates.
Additionally, the timing of the recognition of gains and losses related to derivative instruments can be different from the recognition of the underlying economic exposure. This may impact our consolidated operating results and financial position.
Interest Rate Risk
Interest income and expense on variable-rate instruments are sensitive to fluctuations in interest rates across the world. Changes in interest rates primarily affect the interest earned on our cash and equivalents and to a significantly lesser extent the interest expense on our debt.
As of June 30, 2010, the majority of our outstanding debt balances are fixed rate debt. While changes in interest rates will have no impact on the interest we pay on this debt, interest on any borrowings under our revolving credit facilities will be exposed to interest rate fluctuations as the rate on these facilities is variable. At June 30, 2010, we had no drawn amounts on our $240 million and $480 million revolving credit facilities.
The tables below present information about our investment portfolio and debt obligations:
| June 30, 2010 | ||||||||||||||||||||||||||||||
| Maturing in Fiscal Year | Fair Market Value 3 | |||||||||||||||||||||||||||||
| (in millions) | 2011 | 2012 | 2013 | 2014 | 2015 | Thereafter | Total | |||||||||||||||||||||||
| ASSETS |
||||||||||||||||||||||||||||||
| Cash and Cash Equivalents |
||||||||||||||||||||||||||||||
| Cash |
$ | 207 | $ | — | $ | — | $ | — | $ | — | $ | — | $ | 207 | $ | 207 | ||||||||||||||
| Cash Equivalents |
$ | 812 | $ | — | $ | — | $ | — | $ | — | $ | — | $ | 812 | $ | 812 | ||||||||||||||
| Weighted Average Interest Rate1 |
0.10 | % | — | — | — | — | — | 0.10 | % | — | ||||||||||||||||||||
| LIABILITIES |
||||||||||||||||||||||||||||||
| Debt Obligations |
||||||||||||||||||||||||||||||
| Fixed Rate Debt2 |
$ | — | $ | — | $ | 250 | $ | — | $ | 450 | $ | 700 | $ | 1,400 | $ | 1,534 | ||||||||||||||
| Weighted Average Interest Rate |
— | — | 4.13 | % | — | 5.13 | % | 6.38 | % | 5.57 | % | — | ||||||||||||||||||
| Other Obligations |
$ | 4 | $ | 1 | $ | 1 | $ | — | $ | — | $ | — | $ | 6 | $ | 6 | ||||||||||||||
| Weighted Average Interest Rate |
2.61 | % | 2.80 | % | 4.74 | % | — | — | — | 2.82 | % | — | ||||||||||||||||||
54
Table of Contents
| June 30, 2009 | ||||||||||||||||||||||||||||||
| Maturing in Fiscal Year | Fair Market Value3 | |||||||||||||||||||||||||||||
| (in millions) | 2010 | 2011 | 2012 | 2013 | 2014 | Thereafter | Total | |||||||||||||||||||||||
| ASSETS |
||||||||||||||||||||||||||||||
| Cash and Cash Equivalents |
||||||||||||||||||||||||||||||
| Cash |
$ | 412 | $ | — | $ | — | $ | — | $ | — | $ | — | $ | 412 | $ | 412 | ||||||||||||||
| Cash Equivalents |
$ | 214 | $ | — | $ | — | $ | — | $ | — | $ | — | $ | 214 | $ | 214 | ||||||||||||||
| Weighted Average Interest Rate1 |
0.4 | % | — | — | — | — | — | 0.4 | % | — | ||||||||||||||||||||
| LIABILITIES |
||||||||||||||||||||||||||||||
| Debt Obligations |
||||||||||||||||||||||||||||||
| Allocated Corporate Debt |
$ | 129 | $ | 183 | $ | 113 | $ | 106 | $ | — | $ | 750 | $ | 1,281 | $ | 1,209 | ||||||||||||||
| Weighted Average Interest Rate |
1.79 | % | 6.53 | % | 5.31 | % | 5.47 | % | — | 5.44 | % | 5.22 | % | — | ||||||||||||||||
| Other Obligations |
$ | 1 | $ | 2 | $ | 1 | $ | 1 | $ | — | $ | 3 | $ | 8 | $ | 8 | ||||||||||||||
| Weighted Average Interest Rate |
6.35 | % | 4.80 | % | 4.54 | % | 4.14 | % | — | 1.30 | % | 3.30 | % | — | ||||||||||||||||
| 1 | Represents weighted average interest rate for cash equivalents only; cash balances generally earn no interest. |
| 2 | Fixed rate notes are presented gross of a $16 million purchase discount at June 30, 2010. |
| 3 | The estimated fair value of our long-term obligations and other short-term borrowings was $1,540 million and $1,217 million at June 30, 2010 and June 30, 2009, respectively. The fair value of our senior notes at June 30, 2010 was based on quoted market prices. The fair value of the other obligations at June 30, 2010 and June 30, 2009, including debt allocated to us by Cardinal Health, was based on either the quoted market prices for the same or similar debt and the current interest rates offered for debt of the same remaining maturities or estimated discounted cash flows. |
Included in the table above are debt obligations and related interest expense, including the effects of interest rate swap agreements, that were allocated to CareFusion by Cardinal Health for the year ended June 30, 2009 prior to the spinoff. These allocated debt instruments were retained by Cardinal Health as a result of the spinoff and were effectively replaced with the senior notes offered and sold on July 14, 2009. See the “Liquidity and Capital Resources” section within “Management’s Discussion and Analysis of Financial Condition and Results of Operations” for further details.
Foreign Currency Risk
We are a global company with operations in multiple countries and are a net recipient of currencies other than the United States dollar (USD). Accordingly, a strengthening of the USD will negatively impact revenues and gross margins expressed in consolidated USD terms. Prior to the spinoff from Cardinal Health on August 31, 2009, we used derivative instruments indirectly through our participation in the centralized hedging program of Cardinal Health, which was designed to mitigate foreign currency risk. Cardinal Health did not hold or issue derivative instruments for speculative purposes.
Currently, we have foreign exchange risk associated with currency exposure associated with existing assets and liabilities, committed transactions, forecasted future cash flows and net investments in foreign subsidiaries. We seek to manage our foreign exchange risk by using derivative contracts such as forwards, swaps and options with financial institutions to hedge our risks. In general, we will hedge material foreign exchange exposures up to twelve months in advance; however we may choose not to hedge some exposures for a variety of reasons including prohibitive economic costs.
The realized and unrealized gains and losses of foreign currency forward contracts and the re-measurement of foreign denominated receivables, payables and loans are recorded in the consolidated and combined statement of income. To the extent that cash flow hedges qualify for hedge accounting, the unrealized gain or loss on the forward will be recorded to other comprehensive income (“OCI”). As the forecasted exposures affect earnings, the realized gain or loss on the forward contract will be moved from OCI to the consolidated and combined statements of income.
55
Table of Contents
The following table provides information about our foreign currency derivative instruments outstanding as of June 30, 2010 and June 30, 2009:
| June 30, 2010 | June 30, 2009 | ||||||||||
| (in millions) | Notional Amount |
Average Contract Rate |
Notional Amount |
Average Contract Rate | |||||||
| Foreign Currency Forward Contracts: |
|||||||||||
| (Receive USD/pay foreign currency) |
|||||||||||
| Euro |
$ | 13 | 1.2 | $ | 167 | 1.4 | |||||
| Australian Dollar |
20 | 0.9 | 19 | 0.7 | |||||||
| New Zealand Dollar |
9 | 0.7 | 5 | 0.6 | |||||||
| South African Rand |
2 | 7.7 | 2 | 8.1 | |||||||
| Norwegian Krone |
2 | 6.3 | — | — | |||||||
| Swedish Krona |
2 | 7.6 | — | — | |||||||
| Mexico Peso |
2 | 13.0 | 8 | 13.4 | |||||||
| Canadian Dollar |
5 | 1.0 | 103 | 1.2 | |||||||
| Japanese Yen |
2 | 89.3 | — | — | |||||||
| Indian Rupee |
1 | 46.5 | — | — | |||||||
| British Pound |
— | — | 33 | 1.6 | |||||||
| Total |
$ | 58 | $ | 337 | |||||||
| Estimated Fair Value |
$ | 1 | $ | (4 | ) | ||||||
| Foreign Currency Forward Contracts: |
|||||||||||
| (Pay USD/receive foreign currency) |
|||||||||||
| Mexican Peso |
$ | 10 | 13.0 | $ | 27 | 13.4 | |||||
| Swiss Franc |
5 | 1.1 | — | — | |||||||
| Canadian Dollar |
1 | 1.0 | 4 | 1.2 | |||||||
| British Pound |
20 | 1.5 | 68 | 1.4 | |||||||
| Euro |
8 | 1.2 | 25 | 1.6 | |||||||
| Total |
$ | 44 | $ | 124 | |||||||
| Estimated Fair Value |
$ | — | $ | 1 | |||||||
| Foreign Currency Forward Contracts: |
|||||||||||
| (Pay foreign currency/receive euros) |
|||||||||||
| British Pound |
$ | 9 | 0.8 | $ | 13 | 0.9 | |||||
| Swiss Franc |
19 | 1.4 | — | — | |||||||
| Total |
$ | 28 | $ | 13 | |||||||
| Estimated Fair Value |
$ | — | $ | — | |||||||
Commodity Price Risk Management
We purchase commodities such as resins, printed circuit boards, latex, various fuel products and polystyrene, among others for use in our manufacturing processes. We typically purchase these commodities at market prices, and as a result are affected by market price fluctuations. We have historically, performed a sensitivity analysis on our forecasted commodity exposure for the following fiscal year, but have chosen to not hedge these exposures as they were deemed to be insignificant.
56
Table of Contents
| ITEM 8. | FINANCIAL STATEMENTS AND SUPPLEMENTARY DATA |
CAREFUSION CORPORATION
INDEX TO CONSOLIDATED AND COMBINED FINANCIAL STATEMENTS AND SCHEDULE
| Page No. | ||
| Consolidated and Combined Financial Statements: |
||
| 58 | ||
| 59 | ||
| Consolidated and Combined Balance Sheets at June 30, 2010 and 2009 |
60 | |
| 61 | ||
| 62 | ||
| 63 | ||
| Report of Independent Registered Public Accounting Firm on Internal Control over Financial Reporting |
106 | |
| Financial Statement Schedule: |
||
| 116 | ||
57
Table of Contents
REPORT OF INDEPENDENT REGISTERED PUBLIC ACCOUNTING FIRM
The Board of Directors and
Stockholders of CareFusion Corporation
We have audited the accompanying consolidated and combined balance sheets of CareFusion Corporation as of June 30, 2010 and 2009, and the related consolidated and combined statements of income, stockholders’ equity, and cash flows for each of the three years in the period ended June 30, 2010. Our audits also included the financial statement schedule listed in the Index at Item 15(a)(2). These financial statements and schedule are the responsibility of the company’s management. Our responsibility is to express an opinion on these financial statements and schedule based on our audits.
We conducted our audits in accordance with the standards of the Public Company Accounting Oversight Board (United States). Those standards require that we plan and perform the audit to obtain reasonable assurance about whether the financial statements are free of material misstatement. An audit includes examining, on a test basis, evidence supporting the amounts and disclosures in the financial statements. An audit also includes assessing the accounting principles used and significant estimates made by management, as well as evaluating the overall financial statement presentation. We believe that our audits provide a reasonable basis for our opinion.
In our opinion, the financial statements referred to above present fairly, in all material respects, the consolidated and combined financial position of CareFusion Corporation at June 30, 2010 and 2009, and the consolidated and combined results of its operations and its cash flows for each of the three years in the period ended June 30, 2010, in conformity with U.S. generally accepted accounting principles. Also, in our opinion, the related financial statement schedule, when considered in relation to the basic financial statements taken as a whole, presents fairly in all material respects the information set forth therein.
We also have audited, in accordance with the standards of the Public Company Accounting Oversight Board (United States), CareFusion Corporation’s internal control over financial reporting as of June 30, 2010, based on criteria established in Internal Control-Integrated Framework issued by the Committee of Sponsoring Organizations of the Treadway Commission and our report dated August 19, 2010 expressed an unqualified opinion thereon.
/s/ Ernst & Young LLP
San Diego, California
August 19, 2010
58
Table of Contents
CONSOLIDATED AND COMBINED STATEMENTS OF INCOME
| Fiscal Year Ended June 30, | ||||||||||
| (in millions, except per share amounts) | 2010 | 2009 | 2008 | |||||||
| Revenue |
$ | 3,929 | $ | 3,595 | $ | 3,663 | ||||
| Cost of Products Sold |
2,063 | 1,864 | 1,896 | |||||||
| Gross Margin |
1,866 | 1,731 | 1,767 | |||||||
| Selling, General and Administrative Expenses |
1,228 | 1,055 | 1,027 | |||||||
| Research and Development Expenses |
159 | 160 | 157 | |||||||
| Restructuring and Acquisition Integration Charges |
19 | 72 | 35 | |||||||
| Acquired In-Process Research and Development |
— | — | 18 | |||||||
| Gain on the Sale of Assets |
(12 | ) | — | — | ||||||
| Operating Income |
472 | 444 | 530 | |||||||
| Interest Expense and Other, Net (Including Net Interest Expense Allocated from Parent of $80 and $88 for Fiscal Year 2009 and 2008, respectively) |
115 | 101 | 87 | |||||||
| Income Before Income Tax |
357 | 343 | 443 | |||||||
| Provision for Income Tax |
186 | 53 | 110 | |||||||
| Income from Continuing Operations |
171 | 290 | 333 | |||||||
| Income from Discontinued Operations, Net of Tax |
23 | 278 | 330 | |||||||
| Net Income |
$ | 194 | $ | 568 | $ | 663 | ||||
| PER SHARE AMOUNTS: |
||||||||||
| Basic Earnings per Common Share: |
||||||||||
| Continuing Operations |
$ | 0.77 | $ | 1.32 | $ | 1.51 | ||||
| Discontinued Operations |
$ | 0.10 | $ | 1.26 | $ | 1.49 | ||||
| Basic Earnings per Common Share |
$ | 0.88 | $ | 2.58 | $ | 3.00 | ||||
| Diluted Earnings per Common Share: |
||||||||||
| Continuing Operations |
$ | 0.77 | $ | 1.32 | $ | 1.51 | ||||
| Discontinued Operations |
$ | 0.10 | $ | 1.26 | $ | 1.49 | ||||
| Diluted Earnings per Common Share |
$ | 0.87 | $ | 2.58 | $ | 3.00 | ||||
| Weighted-Average Number of Common Shares Outstanding: |
||||||||||
| Basic |
221.5 | 220.5 | 220.5 | |||||||
| Diluted |
223.0 | 220.5 | 220.5 | |||||||
See accompanying notes to consolidated and combined financial statements
59
Table of Contents
CONSOLIDATED AND COMBINED BALANCE SHEETS
| (in millions, except per share data) | June 30, 2010 |
June 30, 2009 |
||||||
| ASSETS | ||||||||
| Current Assets: |
||||||||
| Cash and Cash Equivalents |
$ | 1,019 | $ | 626 | ||||
| Trade Receivables, Net |
472 | 461 | ||||||
| Current Portion of Net Investment in Sales-Type Leases |
389 | 391 | ||||||
| Inventories, Net |
422 | 426 | ||||||
| Prepaid Expenses |
23 | 22 | ||||||
| Other Current Assets |
183 | 33 | ||||||
| Current Assets of Discontinued Operations and Assets Held for Sale |
— | 431 | ||||||
| Total Current Assets |
2,508 | 2,390 | ||||||
| Property and Equipment, Net |
449 | 395 | ||||||
| Net Investment in Sales-Type Leases, Less Current Portion |
946 | 919 | ||||||
| Goodwill |
2,995 | 2,879 | ||||||
| Intangible Assets, Net |
946 | 879 | ||||||
| Other Assets |
99 | 57 | ||||||
| Non-Current Assets of Discontinued Operations and Assets Held for Sale |
— | 830 | ||||||
| Total Assets |
$ | 7,943 | $ | 8,349 | ||||
| LIABILITIES AND EQUITY | ||||||||
| Current Liabilities: |
||||||||
| Current Portion of Long-Term Obligations and Other Short-Term Borrowings (Including Debt Allocated from Parent of $129 at June 30, 2009) |
$ | 4 | $ | 130 | ||||
| Accounts Payable |
199 | 100 | ||||||
| Deferred Revenue |
82 | 98 | ||||||
| Accrued Compensation and Benefits |
182 | 60 | ||||||
| Other Accrued Liabilities |
286 | 251 | ||||||
| Current Liabilities of Discontinued Operations and Assets Held for Sale |
— | 123 | ||||||
| Total Current Liabilities |
753 | 762 | ||||||
| Long-Term Obligations, Less Current Portion (Including Debt Allocated from Parent of $1,152 at June 30, 2009) |
1,386 | 1,159 | ||||||
| Deferred Income Taxes |
671 | 554 | ||||||
| Other Liabilities |
429 | 309 | ||||||
| Non-Current Liabilities of Discontinued Operations |
— | 114 | ||||||
| Total Liabilities |
3,239 | 2,898 | ||||||
| Commitments and Contingencies |
||||||||
| Stockholders’ Equity or Parent Company Investment: |
||||||||
| Preferred Stock (50.0 Authorized Shares; $.01 Par Value) Issued and Outstanding — None |
— | — | ||||||
| Common Stock (1,200.0 Authorized Shares; $.01 Par Value) Issued and Outstanding — 222.3 at June 30, 2010 |
2 | — | ||||||
| Additional Paid-In Capital |
4,666 | — | ||||||
| Retained Earnings |
121 | — | ||||||
| Parent Company Investment |
— | 5,506 | ||||||
| Accumulated Other Comprehensive Loss |
(85 | ) | (55 | ) | ||||
| Total Stockholders’ Equity or Parent Company Investment |
4,704 | 5,451 | ||||||
| Total Liabilities and Stockholders’ Equity or Parent Company Investment |
$ | 7,943 | $ | 8,349 | ||||
See accompanying notes to consolidated and combined financial statements
60
Table of Contents
CONSOLIDATED AND COMBINED STATEMENTS OF STOCKHOLDERS’ EQUITY
| (in millions)
|
Common Stock | Parent Company Investment |
Additional Paid-In Capital |
Retained Earnings |
Accumulated Other Compreh- ensive Loss |
Total Equity |
||||||||||||||||||
| Shares | Amount | |||||||||||||||||||||||
| Balances at June 30, 2007 |
— | $ | — | $ | 4,839 | $ | — | $ | — | $ | 48 | $ | 4,887 | |||||||||||
| Comprehensive Income: |
||||||||||||||||||||||||
| Net Income |
— | — | 663 | — | — | — | 663 | |||||||||||||||||
| Foreign Currency Translation Adjustment |
— | — | — | — | — | 24 | 24 | |||||||||||||||||
| Net Unrealized Loss on Derivatives |
— | — | — | — | — | (3 | ) | (3 | ) | |||||||||||||||
| Net Change in Minimum Pension Liability |
— | — | — | — | — | 2 | 2 | |||||||||||||||||
| Total Comprehensive Income |
686 | |||||||||||||||||||||||
| Impact of Adopting FASB Interpretation No. 48 |
— | — | (35 | ) | — | — | — | (35 | ) | |||||||||||||||
| Net Transfers to Parent |
— | — | (490 | ) | — | — | — | (490 | ) | |||||||||||||||
| Balances at June 30, 2008 |
— | — | 4,977 | — | — | 71 | 5,048 | |||||||||||||||||
| Comprehensive Income: |
||||||||||||||||||||||||
| Net Income |
— | — | 568 | — | — | — | 568 | |||||||||||||||||
| Foreign Currency Translation Adjustment |
— | — | — | — | — | (119 | ) | (119 | ) | |||||||||||||||
| Net Unrealized Loss on Derivatives |
— | — | — | — | — | (1 | ) | (1 | ) | |||||||||||||||
| Net Change in Minimum Pension Liability |
— | — | — | — | — | (6 | ) | (6 | ) | |||||||||||||||
| Total Comprehensive Income |
442 | |||||||||||||||||||||||
| Net Transfers to Parent |
— | — | (39 | ) | — | — | — | (39 | ) | |||||||||||||||
| Balances at June 30, 2009 |
— | — | 5,506 | — | — | (55 | ) | 5,451 | ||||||||||||||||
| Net Transfers from Parent |
— | — | 1,453 | — | — | — | 1,453 | |||||||||||||||||
| Businesses Retained by Cardinal Health |
— | — | (1,006 | ) | — | — | 26 | (980 | ) | |||||||||||||||
| Dividend to Cardinal Health |
— | — | (1,374 | ) | — | — | — | (1,374 | ) | |||||||||||||||
| Conversion of Net Investment in CareFusion into Capital |
221.2 | 2 | (4,652 | ) | 4,650 | — | — | — | ||||||||||||||||
| Comprehensive Income: |
||||||||||||||||||||||||
| Net Income from July 1, 2009 to August 31, 2009 |
— | — | 73 | — | — | — | 73 | |||||||||||||||||
| Net Income from September 1, 2009 to June 30, 2010 |
— | — | — | — | 121 | — | 121 | |||||||||||||||||
| Foreign Currency Translation Adjustments |
— | — | — | — | — | (64 | ) | (64 | ) | |||||||||||||||
| Net Unrealized Loss on Derivatives |
— | — | — | — | — | 5 | 5 | |||||||||||||||||
| Net Change in Minimum Pension Liability |
— | — | — | — | — | (1 | ) | (1 | ) | |||||||||||||||
| Other |
— | — | — | — | — | 4 | 4 | |||||||||||||||||
| Total Comprehensive Income: |
138 | |||||||||||||||||||||||
| Stock Option Exercises |
0.4 | — | — | 8 | — | — | 8 | |||||||||||||||||
| Share-Based Compensation |
0.2 | — | — | 63 | — | — | 63 | |||||||||||||||||
| Other |
0.5 | — | — | (55 | ) | — | — | (55 | ) | |||||||||||||||
| Balances at June 30, 2010 |
222.3 | $ | 2 | $ | — | $ | 4,666 | $ | 121 | $ | (85 | ) | $ | 4,704 | ||||||||||
See accompanying notes to consolidated and combined financial statements
61
Table of Contents
CONSOLIDATED AND COMBINED STATEMENTS OF CASH FLOWS
| Fiscal Year Ended June 30, |
||||||||||||
| (in millions) | 2010 | 2009 | 2008 | |||||||||
| Cash and Cash Equivalents at July 1, Attributable to Continuing Operations |
$ | 626 | $ | 480 | $ | 508 | ||||||
| Cash and Cash Equivalents at July 1, Attributable to Discontinued Operations |
$ | 157 | $ | 127 | $ | 169 | ||||||
| Cash Flows from Operating Activities: |
||||||||||||
| Net Income |
194 | 568 | 663 | |||||||||
| Income from Discontinued Operations |
23 | 278 | 330 | |||||||||
| Income from Continuing Operations |
171 | 290 | 333 | |||||||||
| Adjustments to Reconcile Income from Continuing Operations to Net Cash Provided by Operating Activities: |
||||||||||||
| Depreciation and Amortization |
173 | 170 | 146 | |||||||||
| Acquired In-Process Research and Development |
— | — | 18 | |||||||||
| Share-Based Compensation Expense |
67 | 56 | 54 | |||||||||
| Deferred Income Taxes |
(122 | ) | (71 | ) | 66 | |||||||
| Gain on the Sale of Assets |
(12 | ) | — | — | ||||||||
| Bridge Loan Facility Fees |
22 | — | — | |||||||||
| Other Non Cash Items |
25 | 27 | 18 | |||||||||
| Change in Operating Assets and Liabilities, Net of Effects from Acquisitions: |
||||||||||||
| (Increase)/Decrease in Trade Receivables |
17 | 77 | (19 | ) | ||||||||
| (Increase)/Decrease in Inventories |
44 | 14 | (14 | ) | ||||||||
| Increase in Net Investment in Sales-Type Leases |
(24 | ) | (38 | ) | (126 | ) | ||||||
| Increase/(Decrease) in Accounts Payable |
59 | (22 | ) | (13 | ) | |||||||
| Other Accrued Liabilities and Operating Items, Net |
286 | 12 | 98 | |||||||||
| Net Cash Provided by Operating Activities — Continuing Operations |
706 | 515 | 561 | |||||||||
| Net Cash (Used in) Provided by Operating Activities — Discontinued Operations |
(2 | ) | 288 | 325 | ||||||||
| Net Cash Provided by Operating Activities |
704 | 803 | 886 | |||||||||
| Cash Flows from Investing Activities: |
||||||||||||
| Cash Paid for Acquisition |
(224 | ) | (4 | ) | (584 | ) | ||||||
| Proceeds from Divestitures |
108 | — | — | |||||||||
| Proceeds from the Sale of Property Plant and Equipment |
1 | — | — | |||||||||
| Additions to Property and Equipment |
(127 | ) | (108 | ) | (179 | ) | ||||||
| Additions to Intangible Assets |
(14 | ) | (21 | ) | (25 | ) | ||||||
| Net Cash Used in Investing Activities — Continuing Operations |
(256 | ) | (133 | ) | (788 | ) | ||||||
| Net Cash (Used in)/Provided by Investing Activities — Discontinued Operations |
(1 | ) | (21 | ) | 15 | |||||||
| Net Cash Used in Investing Activities |
(257 | ) | (154 | ) | (773 | ) | ||||||
| Cash Flows from Financing Activities: |
||||||||||||
| Proceeds from Issuance of Debt |
1,378 | — | — | |||||||||
| Bridge Facility Fees and Debt Issuance Costs |
(29 | ) | — | — | ||||||||
| Dividend Payment to Cardinal Health |
(1,374 | ) | — | — | ||||||||
| Other Financing Activities |
— | (3 | ) | (16 | ) | |||||||
| Net Cash Transfer (to)/from Parent |
46 | (183 | ) | 149 | ||||||||
| Net Cash (Used in)/Provided by Financing Activities — Continuing Operations |
21 | (186 | ) | 133 | ||||||||
| Net Cash Used in Financing Activities — Discontinued Operations |
(154 | ) | (235 | ) | (383 | ) | ||||||
| Net Cash Used in Financing Activities |
(133 | ) | (421 | ) | (250 | ) | ||||||
| Effect of Exchange Rate Changes on Cash — Continuing Operations |
(78 | ) | (50 | ) | 66 | |||||||
| Effect of Exchange Rate Changes on Cash — Discontinued Operations |
— | (2 | ) | 1 | ||||||||
| Net Effect of Exchange Rate Changes on Cash |
(78 | ) | (52 | ) | 67 | |||||||
| Net Increase/(Decrease) in Cash and Equivalents — Continuing Operations |
393 | 146 | (28 | ) | ||||||||
| Net Increase/(Decrease) in Cash and Equivalents — Discontinued Operations |
(157 | ) | 30 | (42 | ) | |||||||
| Cash and Equivalents at June 30, attributable to Continuing Operations |
$ | 1,019 | $ | 626 | $ | 480 | ||||||
| Cash and Equivalents at June 30, attributable to Discontinued Operations |
$ | — | $ | 157 | $ | 127 | ||||||
| Supplemental Information: |
||||||||||||
| Cash Payments for: |
||||||||||||
| Interest |
$ | 42 | $ | 82 | $ | 89 | ||||||
| Income Taxes |
$ | 92 | $ | 27 | $ | 20 | ||||||
See accompanying notes to consolidated and combined financial statements
62
Table of Contents
NOTES TO CONSOLIDATED AND COMBINED FINANCIAL STATEMENTS
NOTE 1. DESCRIPTION OF BUSINESS AND SUMMARY OF SIGNIFICANT ACCOUNTING POLICIES
Separation from Cardinal Health, Inc. On September 29, 2008, Cardinal Health announced that it intended to separate its clinical and medical products businesses from the remainder of its businesses through a pro-rata distribution of common stock of an entity holding the assets and liabilities associated with the clinical and medical products businesses. CareFusion Corporation was incorporated in Delaware on January 14, 2009 for the purpose of holding such businesses. We completed the spinoff from Cardinal Health on August 31, 2009. In connection with the spinoff, Cardinal Health contributed the majority of the businesses comprising its clinical and medical products segment to us (“the contribution”), and distributed approximately 81% of our outstanding common stock, or approximately 179.8 million shares, to its shareholders (“the distribution”), based on a distribution ratio of 0.5 shares of our common stock for each common share of Cardinal Health held on the record date of August 25, 2009. Cardinal Health retained approximately 19% of our outstanding common stock, or approximately 41.4 million shares, in connection with the spinoff. As a condition to the separation, Cardinal Health is required to dispose of the remaining 19% of our common stock within five years of the distribution date.
In connection with the spinoff, Cardinal Health retained certain lines of business that manufacture and sell surgical and exam gloves, drapes and apparel and fluid management products in the United States markets that were historically managed by us prior to the spinoff, which were part of the clinical and medical products businesses of Cardinal Health. These businesses are presented within our financial statements as discontinued operations as of the spinoff date of August 31, 2009.
Unless the context otherwise requires, references in these notes to audited consolidated and combined financial statements to “CareFusion Corporation”, “CareFusion”, “we”, “us”, “our”, “the company” and “our company” refer to CareFusion Corporation and its consolidated and combined subsidiaries. References in notes to audited consolidated and combined financial statements to “Cardinal Health” or “parent” refers to Cardinal Health, Inc., an Ohio corporation, and its consolidated subsidiaries (other than CareFusion Corporation and its consolidated subsidiaries), unless the context otherwise requires.
Our Business. We are a global medical technology company with clinically proven products and services designed to measurably improve the safety and quality of healthcare. We offer comprehensive product lines in the areas of intravenous (“IV”) infusion, medication and supply dispensing, respiratory care, infection prevention and surgical instruments. Our primary product brands include: Alaris, Pyxis, AVEA, Pulmonetic Systems, Jaeger, SensorMedics, ChloraPrep and V. Mueller. Our primary customers in the United States include hospitals, ambulatory surgical centers, clinics, long-term care facilities and physician offices. Our business consists of two reporting segments: Critical Care Technologies (“CCT”) and Medical Technologies and Services (“MT&S”):
| • | Critical Care Technologies includes our infusion, dispensing and respiratory care businesses that develop, manufacture and sell capital equipment and related dedicated and non-dedicated disposables. |
| • | Medical Technologies and Services includes our infection prevention and medical specialties products and services businesses that develop, manufacture and sell primarily single-use, disposable products and reusable surgical instruments. |
Principles of Consolidation and Basis of Presentation. The consolidated and combined financial statements reflect the consolidated operations of CareFusion Corporation and its subsidiaries as a separate stand-alone entity subsequent to August 31, 2009. Periods presented prior to our August 31, 2009 spinoff from Cardinal Health have been prepared on a stand-alone basis and are derived from the combined financial statements and accounting records of Cardinal Health. Certain lines of business that manufacture and sell surgical and exam gloves, drapes and apparel and fluid management products in the United States markets that were historically
63
Table of Contents
CAREFUSION CORPORATION
NOTES TO CONSOLIDATED AND COMBINED FINANCIAL STATEMENTS
managed by us prior to the spinoff and were part of the clinical and medical products business of Cardinal Health, were retained by Cardinal Health and are presented in these financial statements as discontinued operations. Additionally, the results of companies acquired or disposed of during the year are included in the consolidated and combined financial statements from the effective date of acquisition, or up to the date of disposal. Our fiscal year ends on June 30. All significant intercompany transactions and accounts between our businesses have been eliminated.
Certain prior year amounts in the consolidated and combined financial statements and notes thereto have been reclassified to conform to the current year’s presentation.
All significant intercompany transactions between us and Cardinal Health have been included in these consolidated and combined financial statements and are considered to be effectively settled for cash in the consolidated and combined financial statements on August 31, 2009. The total net effect of the settlement of these intercompany transactions is reflected in the consolidated and combined statements of cash flows as a financing activity and in the consolidated and combined balance sheets as “Parent Company Investment”. All references to “notes” mean the notes to the audited consolidated and combined financial statements presented herein.
Prior to the spinoff, CareFusion had utilized the services of Cardinal Health for certain functions. These services include, but are not limited to, providing working capital, as well as certain legal, finance, information technology, internal audit, tax advisory, and human resources services, including various employee benefit programs. The cost of these services has been allocated to CareFusion and included in the consolidated and combined financial statements. We consider the basis on which the expenses have been allocated to be a reasonable reflection of the utilization of services provided to or the benefit received by us during the periods presented. Additionally, in the periods presented prior to the spinoff we had earned royalty income from Cardinal Health and received a push down of assets and liabilities, including debt and interest expense. A more detailed discussion of the relationship with Cardinal Health, including a description of the costs which have been allocated to us, as well as the method of allocation, is included in note 15.
Additionally, our consolidated and combined financial statements may not be indicative of our future performance and do not necessarily reflect what the results of operations, financial position and cash flows would have been had we operated as an independent, publicly-traded company during the periods presented prior to spinoff.
We have evaluated subsequent events for recognition or disclosure through the date these financial statements were issued.
Use of Estimates. The preparation of financial statements in conformity with GAAP requires management to make estimates and assumptions that affect amounts reported in the consolidated and combined financial statements and accompanying notes. Such estimates include, but are not limited to, allowance for doubtful accounts, rebate accruals, inventory valuation, goodwill and intangible asset impairment, preliminary and final purchase accounting valuations including acquired in-process research and development costs, or (“IPR&D”), share-based compensation, income taxes, loss contingencies and restructuring charge reserves. Actual amounts may differ from these estimated amounts.
Cash Equivalents. We consider all liquid investments purchased with an original maturity of three months or less to be cash equivalents. The carrying value of these cash equivalents approximates fair value.
Receivables. Trade receivables are primarily comprised of amounts owed to us through our operating activities and are presented net of an allowance for doubtful accounts and accrued rebates. Our allowance for doubtful
64
Table of Contents
CAREFUSION CORPORATION
NOTES TO CONSOLIDATED AND COMBINED FINANCIAL STATEMENTS
accounts totaled $13 million and $20 million at June 30, 2010 and 2009, respectively. An account is considered past due on the first day after its due date. We monitor past due accounts on an ongoing basis and establish appropriate reserves to cover probable losses. We write off any amounts deemed uncollectible against an established allowance for doubtful accounts.
Rebates are paid when third-party distributors are able to charge us back for the difference between the price charged to the customer and the price paid by the distributor when the end customer pricing is established by us. Upon revenue recognition, we estimate the difference between the price charged to the customer and the price paid by the distributor based on historical data and record these accrued rebates as a reduction to the related revenues and receivables.
Concentrations of Credit Risk and Major Customers. We maintain cash depository accounts with major banks throughout the world and invest in high quality short-term liquid instruments. Such investments are made only in instruments issued or enhanced by high quality institutions. These investments mature within three months, and we have not historically incurred any related losses.
Our trade receivables, lease receivables and accrued interest receivables are exposed to a concentration of credit risk with customers in the healthcare sector. Credit risk can be affected by changes in reimbursement and other economic pressures impacting the hospital and acute care sectors of the healthcare industry. Such credit risk is limited, however, due to supporting collateral and the diversity of the customer base, including its wide geographic dispersion. We perform ongoing credit evaluations of our customers’ financial conditions and maintain reserves for credit losses. Such losses historically have been within our expectations.
Certain of our businesses have entered into agreements with group purchasing organizations (“GPO”), which have established relationships with the users of our products and act as purchasing agents that negotiate vendor contracts on behalf of their members. We do not have exclusive arrangements with these organizations and either party can terminate the relationship at any time. However, our trade receivable balances are with individual members of the GPO, and therefore no significant concentration of credit risk exists with these types of arrangements specific to the GPO.
Inventories. We primarily determine inventory cost on a currently adjusted standard basis (which approximates actual cost on a first-in, first-out basis). We reduce the carrying value of inventories to a lower of cost or market basis for those items that are potentially excess, obsolete or slow-moving. We reserve for inventory obsolescence based upon historical experience, sales trends, and specific categories of inventory and age of on-hand inventory. Work-in-process and finished goods inventories include raw materials, direct labor and manufacturing overhead. See note 7 for additional information.
Property and Equipment. Property and equipment are stated at cost. Property and equipment held for sale are recorded at the lower of cost or fair value less costs to sell. Depreciation expense is computed using the straight-line method over the estimated useful lives of the assets, including capital lease assets which are depreciated over the shorter of the terms of their respective leases or their estimated useful lives. We use the following range of useful lives for our property and equipment categories: buildings and improvements: one to 39 years; machinery and equipment: three to 15 years; and furniture and fixtures: three to seven years. When certain events or changes in operating conditions occur, an impairment assessment may be performed on the recoverability of the carrying amounts. See note 8 for additional information.
Goodwill and Intangible Assets. Goodwill is the excess of the purchase price of an acquired business over the amounts assigned to assets and liabilities assumed in the business combination. Purchased goodwill and
65
Table of Contents
CAREFUSION CORPORATION
NOTES TO CONSOLIDATED AND COMBINED FINANCIAL STATEMENTS
intangible assets with indefinite lives are not amortized, but instead are tested for impairment at least annually on April 1 of each year, or more frequently if certain indicators are present or changes in circumstances suggest impairment exists. Intangible assets with finite lives are amortized over their useful lives.
We conduct our goodwill impairment testing one level below our reportable segments, referred to as operating segments, as the business units comprising the operating segments service a common group of customers, offer complementary products, and share a common strategy.
In conducting the annual impairment test of our goodwill, the fair value of our reporting units is compared to its carrying amount, including goodwill. If the fair value exceeds the carrying amount, then no impairment exists. If the carrying amount exceeds the fair value, further analysis is performed to assess impairment. We perform our impairment testing at the operating segment level. There are no fluid active or inactive markets for our operating segments to derive approximate fair values, and accordingly, the valuation process is similar to the valuation of a closely-held company and considers valuation methods that are income-based and market-based. Our income-based approach is a discounted cash flow method which utilized an estimated discount rate to the projected after-tax cash flows for the operating segment. Our market-based approach utilizes an estimated market-based multiple to the operating segments’ estimated earnings before interest, taxes, depreciation, and amortization (“EBITDA”). The results of the income-based and market-based approaches are equally weighted to arrive at the total estimated fair value for each operating segment. Based on our annual impairment test as of April 1, 2010, we did not record any goodwill impairments.
Estimating the fair value of operating segments involves significant estimates. Based on these estimates, it is at least reasonably possible that one of our operating segments could experience a goodwill impairment in the future.
Product Warranties. We offer warranties on certain products for various periods of time. We accrue the estimated cost of product warranties at the time revenue is recognized. Our product warranty liability reflects our best estimate of probable liability under our product warranties. We estimate the liability based on our stated warranty policies and practices, the historical frequency of claims and the cost to replace or repair our products under warranty. Factors that affect our warranty liability include the number of units sold, the length of the warranty, historical and anticipated rates of warranty claims and cost per claim. We regularly assess the adequacy of our recorded warranty liabilities and adjust the amounts as necessary. See note 17 for additional information.
Income Taxes. Prior to August 31, 2009, our income taxes as presented are calculated on a separate tax return basis, although our operations have historically been included in Cardinal Health’s United States federal and state tax returns or non-United States jurisdictions tax returns. Cardinal Health’s global tax model was developed based on its entire portfolio of businesses. Accordingly, our tax results for periods prior to August 31, 2009 are not necessarily reflective of the results that we would have generated on a stand-alone basis.
With the exception of certain dedicated foreign entities for periods prior to August 31, 2009, we did not maintain taxes payable to/from Cardinal Health and we instead were deemed to settle the annual current tax balances immediately with the legal tax paying entities in the respective jurisdictions. These settlements are reflected as changes in Parent Company Investment in the consolidated and combined balance sheets for such periods.
We account for income taxes using the asset and liability method, which requires recognition of deferred tax assets and liabilities for expected future tax consequences of temporary differences that currently exist between tax basis and financial reporting basis of our assets and liabilities. Deferred tax assets and liabilities are measured using enacted tax rates in the respective jurisdictions in which we operate. Deferred taxes are not provided on the unremitted earnings of subsidiaries outside of the United States when it is expected that these earnings are permanently reinvested.
66
Table of Contents
CAREFUSION CORPORATION
NOTES TO CONSOLIDATED AND COMBINED FINANCIAL STATEMENTS
On July 1, 2007, we adopted new accounting guidance for the accounting for uncertainty in income taxes recognized in the consolidated and combined financial statements. This standard provides that a tax benefit from an uncertain tax position may be recognized when it is more likely than not that the position will be sustained upon examination, including resolutions of any related appeals or litigation processes, based on the technical merits. The amount recognized is measured as the largest amount of tax benefit that is greater than 50% likely of being realized upon settlement. The cumulative effect of adoption of this interpretation was a $35 million reduction of Parent Company Investment. Of the $35 million reduction in Parent Company Investment, $18 million is related to discontinued operations.
Parent Company Investment. Parent Company Investment in the consolidated and combined balance sheets represents Cardinal Health’s historical investment in us in excess of debt allocated to us, our accumulated net income after taxes, and the net effect of the transactions with and allocations from Cardinal Health. See Principles of Combination and Basis of Presentation above and note 15 for additional information.
Restructuring and Acquisition Integration Charges. We account for restructuring activities using the liability approach, which requires a liability to be measured at its fair value and recognized as incurred. Acquisition integration charges are expensed as incurred. Additional disclosure related to our restructuring and acquisition integration charges is provided in note 5.
Share-Based Compensation. Share-based compensation, including grants of employee stock options, is recognized in the income statement based on the grant date fair values of the share-based awards.
The compensation expense recognized for all share-based awards is net of estimated forfeitures and is recognized ratably over the awards’ service period. We classify share-based compensation within Selling, General and Administrative Expenses (“SG&A”) expenses to correspond with the same line item as the majority of the cash compensation paid to employees. See note 18 for additional information.
Revenue Recognition. We generate revenue through the sale and lease of equipment, software, services, medical products, supplies and the income associated with the financing of our equipment leases. We recognize revenue when:
| • | persuasive evidence of an arrangement exists; |
| • | product delivery has occurred or the services have been rendered; |
| • | the price is fixed or determinable; and |
| • | collectability is reasonably assured. |
Revenue is recognized net of sales returns and allowances, administration fees, incentives and estimated rebates.
The majority of our revenue transactions are multiple element arrangements. Revenue in multiple element arrangements is allocated to each unit of accounting using the relative fair value method. Revenue is recognized for each unit of accounting individually. Fair value evidence used during the allocation process is limited to vendor specific objective evidence (“VSOE”) of fair value, or historical prices in which the products have been sold in stand-alone transactions. To the extent products have not yet been sold on a stand alone basis, VSOE of fair value is the price which management with the authority to do so has established for the product. In the event that VSOE of fair value does not exist, data points outside of the organization are utilized as objective evidence of fair value for non-software products. When fair value evidence exists for undelivered elements but does not exist for delivered elements, we apply the residual method of accounting.
Equipment sale revenue consists of dispensing, respiratory, and infusion equipment sold without safety software. We recognize equipment sale revenue upon the transfer of title and risk of loss to the customer and the
67
Table of Contents
CAREFUSION CORPORATION
NOTES TO CONSOLIDATED AND COMBINED FINANCIAL STATEMENTS
substantial completion of installation or training services. When related installation and training services are considered inconsequential, delivery is deemed to occur upon the transfer of title and risk of loss, at which time revenue and the costs associated with installation and training are recognized.
Equipment lease revenue consists primarily of dispensing equipment, and transactions are evaluated and classified as either operating leases or sales-type leases. We recognize sales-type leases as revenue upon the completion of installation activities in the amount of the present value of the minimum lease payments. We recognize operating lease revenue evenly over the lease term, commencing upon the completion of installation activities. We recognize equipment financing revenue over the term of the sales-type lease using the effective interest method.
Product revenue consists of medical products and supplies. We sell medical products and supplies to the medical distribution business of Cardinal Health and various unrelated third parties. We recognize product revenue on sales through the medical distribution business of Cardinal Health when title transfers to the end customer, which is typically upon shipment from Cardinal Health to the end customer. Unrelated third parties include end customers and also distributors who maintain inventories of our products and later sell the products to end customers. In many cases, we negotiate the prices of medical products and supplies directly with end customers under pricing agreements, including GPO contracts. These negotiated prices are typically lower than the prices charged to distributors. When an end customer purchases medical products and supplies from a distributor under a pricing agreement, the distributor is able to charge us back for the difference between the price charged to the customer and the price paid by the distributor. We recognize product revenue on sales to unrelated third parties when title transfers, typically upon shipment from us, net of estimated rebates.
Software and software-related elements are comprised primarily of infusion equipment sold with safety software, patient identification software applications and related hardware, certain diagnostic equipment, software installation services, and post-contract support. Software and software-related elements, with the exception of software maintenance, are recognized as revenue upon the later of delivery and the completion of associated service obligations. Software maintenance arrangements and other post-contract support offerings are recognized as revenue ratably over the service period.
We periodically review our product offerings with embedded software to determine whether the software is more than incidental to the product as a whole. When embedded software is more than incidental to a product as a whole, the product is classified as software for revenue recognition purposes. Any non-software product for which a software product is essential to its functionality is classified as a software related element. Software-related elements also include software installation services and post contract support.
Service revenue consists of separately priced extended warranty contracts, separately priced installation and training, and repair services. We recognize revenue for separately priced extended warranty contracts ratably over the service term. Separately priced installation and training and repair services are recognized as revenue based on the completed performance method, which results in the recognition of revenue upon the extinguishment of our obligation to the customer. Service revenue was immaterial for all periods presented.
Shipping and Handling. Shipping and handling costs are included in cost of products sold in the consolidated and combined statements of income. Shipping and handling costs include all delivery expenses as well as all costs to prepare the product for shipment to the end customer. Shipping and handling revenue received, which is included in the consolidated and combined statements of income in “Revenue”, was immaterial for all periods presented.
68
Table of Contents
CAREFUSION CORPORATION
NOTES TO CONSOLIDATED AND COMBINED FINANCIAL STATEMENTS
Research and Development Costs. Costs incurred in connection with development of new products and manufacturing methods are charged to expense as incurred, except certain software development costs which are capitalized after technological feasibility of the software is established.
Acquired In-Process Research and Development Costs. IPR&D costs include the cost of research and development projects in process at the time of acquisition, which had not yet reached technological feasibility. Determining the value of IPR&D requires significant estimates. The value of IPR&D is determined by estimating the future cash flows of each project and discounting the net cash flows back to their present values. The discount rate used is determined at the time of acquisition in accordance with accepted valuation methods. Management also assesses the current status of development, nature and timing of efforts to complete such development, uncertainties and other factors when estimating the fair value. Costs are not assigned to IPR&D unless future development is probable. Effective July 1, 2009, IPR&D is recorded as an intangible asset with an indefinite life and is subject to periodic impairment review, with impairments, if any, expensed to our consolidated statement of income. Prior to July 1, 2009, IPR&D costs associated with business combinations was expensed upon the acquisition date.
Translation of Foreign Currencies. The financial statements of our entities outside the United States generally are measured using their local currency as the functional currency. Adjustments to translate the assets and liabilities of these foreign entities into United States dollars are accumulated in other comprehensive income utilizing period-end exchange rates. Foreign currency transaction gains and losses, which are calculated by utilizing weighted average exchange rates for the period, are included in the consolidated and combined statements of income in “Interest Expense and Other, Net”. For the fiscal years 2010, 2009 and 2008, Interest Expense and Other, Net includes translation gains (losses) of $(1) million, $(23) million, and $9 million, respectively.
Foreign Currency Risk Management. Prior to the spinoff, we used derivative financial instruments indirectly through our participation in the centralized hedging functions of Cardinal Health, which were designed primarily to minimize exposure to foreign currency risk. Cardinal Health did not hold or issue derivative financial instruments for speculative purposes.
Currently, we use foreign currency forward contracts to manage exposures to the variability of cash flows related to the foreign exchange rate changes of future foreign currency transaction costs. These contracts are designated as cash flow hedges.
Foreign currency forward contracts are used to protect the value of existing foreign currency assets and liabilities. These contracts are treated as non-designated fair value hedges. The remeasurement adjustments for any foreign currency denominated assets or liabilities are included in “Interest Expense and Other, Net” in our consolidated and combined statements of income. The remeasurement adjustment is offset by the foreign currency forward contract settlements which are also classified in “Interest Expense and Other, Net” in our consolidated and combined statements of income.
Our cash flow derivative contracts are adjusted to current market values each period and qualify for hedge accounting. Periodic gains and losses of contracts designated as cash flow hedges are deferred in other comprehensive income until the underlying transactions are recognized. Upon recognition, such gains and losses are recorded in net income as an adjustment to the carrying amounts of underlying transactions in the period in which these transactions are recognized. For those contracts designated as fair value hedges, resulting gains or losses are recognized in earnings offsetting the exposure of underlying transactions. Carrying values of all contracts are included in other assets or liabilities.
69
Table of Contents
CAREFUSION CORPORATION
NOTES TO CONSOLIDATED AND COMBINED FINANCIAL STATEMENTS
CareFusion’s policy requires that contracts used as hedges must be effective at reducing the risk associated with the exposure being hedged and must be designated as a hedge at the inception of the contract. Hedge effectiveness is assessed periodically. Any contract not designated as a hedge, or so designated but ineffective, is adjusted to market value and recognized in net income immediately. If a cash flow hedge ceases to qualify for hedge accounting treatment or is terminated, the contract would continue to be carried on the balance sheet at fair value until settled and future adjustments to the contract’s fair value would be recognized in earnings immediately. If a forecasted transaction was no longer probable to occur, amounts previously deferred in other comprehensive income would be recognized immediately in earnings. Additional disclosure related to hedging contracts is provided in note 14.
We are exposed to counterparty credit risk on all of our derivative instruments. Accordingly, we have established and maintained strict counterparty credit guidelines and entered into hedges only with major financial institutions that are investment grade or better. We do not have significant exposure to any one counterparty and management believes the risk of loss is remote and in any event would not be material. Additionally, we do not require collateral under these agreements.
New Accounting Pronouncements (Adopted during fiscal year 2010)
SFAS No. 168. In June 2009, the Financial Accounting Standards Board (“FASB”) issued Statement of Financial Accounting Standard (“SFAS”) No. 168, The FASB Accounting Standards Codification and the Hierarchy of Generally Accepted Accounting Principles — a Replacement of FASB Statement No. 162 (“SFAS No. 168”). SFAS No. 168 establishes the FASB Accounting Standards Codification (“ASC”) as the source of authoritative accounting principles recognized by the FASB to be applied by nongovernmental entities in the preparation of financial statements in conformity with GAAP. Under the new ASC, SFAS No. 168 is referred to as ASC 105 — Generally Accepted Accounting Principles (“ASC 105”). ASC 105 is effective for financial statements issued for interim and annual periods ending after September 15, 2009. We adopted ASC 105 on July 1, 2009; this adoption did not have any impact on our financial condition, results of operations or cash flows.
SFAS No. 141(R). In December 2007, the FASB issued SFAS No. 141(R), Business Combinations, which is a revision of SFAS No. 141, and codified as ASC 805 — Business Combinations (“ASC 805”). In general, ASC 805 expands the definition of a business and transactions that are accounted for as business combinations. In addition, ASC 805 generally requires all assets and liabilities of acquired entities to be recorded at fair value, and changes the recognition and measurement of related aspects of business combinations. ASC 805 is effective for business combinations with an acquisition date within fiscal years beginning on or after December 15, 2008. The standard is required to be adopted prospectively and early adoption is not allowed. We adopted ASC 805 on July 1, 2009; this adoption did not have any impact on our financial condition, results of operations or cash flows. However, the adoption did have an impact on our treatment of IPR&D costs associated with our acquisition of Medegen, compared with historical acquisitions. See note 3.
SFAS No. 160. In December 2007, the FASB issued SFAS No. 160, Noncontrolling Interests in Consolidated Financial Statements, an Amendment of ARB No. 51, and codified as ASC 810 — Consolidations (“ASC 810”). In general, ASC 810 requires that a noncontrolling interest in a consolidated subsidiary be presented in the consolidated statements of financial position as a separate component of equity and also establishes a framework for recognition of changes in control for a consolidated subsidiary that is not 100% owned. ASC 810 is effective for fiscal years beginning on or after December 15, 2008 and interim periods within those fiscal years. We adopted ASC 810 on July 1, 2009; this adoption did not have any impact on our financial condition, results of operations or cash flows.
70
Table of Contents
CAREFUSION CORPORATION
NOTES TO CONSOLIDATED AND COMBINED FINANCIAL STATEMENTS
SFAS No. 157. In September 2006, the FASB issued SFAS No. 157, Fair Value Measurements, and codified as ASC 820 — Fair Value Measurement and Disclosures (“ASC 820”). ASC 820 defines fair value, establishes a framework for measuring fair value in GAAP, and expands disclosures about fair value measurements, but does not require any new fair value measurements.
ASC 820 is effective for fiscal years beginning after November 15, 2007, and interim periods within those fiscal years. In February 2008, the FASB issued FASB Staff Position 157-2, Effective Date of FASB Statement No. 157, which delayed the effective date of ASC 820 for certain nonfinancial assets and liabilities to fiscal years beginning after November 15, 2008, and interim periods within those fiscal years. We adopted ASC 820 on July 1, 2008, which did not result in recognition of a transaction adjustment to retained earnings or have a material impact on our financial condition, results of operations or cash flows. We adopted the provisions for nonfinancial assets and liabilities on July 1, 2009; this adoption did not have any impact on our financial condition, results of operations or cash flows.
New Accounting Pronouncements (Not yet adopted)
ASU 2009-13. In October 2009, the FASB issued Accounting Standard Update (“ASU”) 2009-13 — Multiple-Deliverable Revenue Arrangements (“ASU 2009-13”). ASU 2009-13 amends ASC 605-25 — Revenue Recognition — Multiple-Element Arrangements. The update replaces the concept of allocating revenue consideration amongst deliverables in a multiple-element revenue arrangement according to fair value with an allocation based on selling price. ASU 2009-13 also establishes a hierarchy for determining the selling price of revenue deliverables sold in multiple element revenue arrangements. The selling price used for each deliverable will be based on vendor-specific objective evidence (“VSOE”) if available, third-party evidence if VSOE is not available, or management’s estimate of an element’s stand-alone selling price if neither VSOE nor third-party evidence is available. The amendments in this update also require an allocation of selling price amongst deliverables be performed based upon each deliverable’s relative selling price to total revenue consideration, rather than on the residual method previously permitted. ASU 2009-13 is effective prospectively for revenue arrangements entered into or materially modified in fiscal years beginning on or after June 15, 2010. Early adoption is permitted, but then requires retrospective application of its provisions from the beginning of the fiscal year. We will adopt the amendment provisions of ASU 2009-13 on July 1, 2010; the adoption of this standard is not expected to have a material impact on our financial condition, results of operations or cash flows.
ASU 2009-14. In October 2009, the FASB issued ASU 2009-14 — Certain Revenue Arrangements That Include Software Elements (“ASU 2009-14”). ASU 2009-14 amends ASC 985-605 — Revenue Recognition — Software. ASU 2009-14 changes the accounting model in revenue arrangements for products which include both tangible and software elements. Tangible products containing software components and non-software components that function together to deliver the tangible product’s essential functionality are no longer within the scope of the software revenue guidance in ASC 985-605. ASU 2009-14 is effective prospectively for revenue arrangements entered into or materially modified in fiscal years beginning on or after June 15, 2010. Early adoption is permitted, but then requires retrospective application of its provisions from the beginning of the fiscal year. We will adopt the amendment provisions of ASU 2009-14 on July 1, 2010; the adoption of this standard is not expected to have a material impact on our financial condition, results of operations or cash flows.
ASU 2010-17. In April 2010, the FASB issued ASU 2010-17 — Revenue Recognition — Milestone Method (“ASU 2010-17”). ASU 2010-17 provides guidance on defining a milestone and determining when it may be appropriate to apply the milestone method of revenue recognition for research and development transactions. ASU 2010-17 is effective for fiscal years beginning on or after June 15, 2010, and is effective on a prospective basis for milestones achieved after the adoption date. Early adoption is permitted provided that the revised guidance is retroactively applied to the beginning of the year of adoption. We will adopt this provision on July 1, 2010; the adoption of this standard is not expected to have a material impact on our financial condition, results of operations or cash flows.
71
Table of Contents
CAREFUSION CORPORATION
NOTES TO CONSOLIDATED AND COMBINED FINANCIAL STATEMENTS
NOTE 2. DISCONTINUED OPERATIONS AND ASSETS HELD FOR SALE
Spinoff from Cardinal Health
On August 31, 2009, we completed the spinoff from Cardinal Health. In connection with the spinoff, CareFusion paid a cash dividend of $1.374 billion to Cardinal Health, and Cardinal Health contributed the majority of the businesses comprising its clinical and medical products segment to us, and retained certain lines of business that manufacture and sell surgical and exam gloves, drapes and apparel and fluid management products in the United States markets that were historically managed by us and, prior to the spinoff, were part of the clinical and medical products businesses of Cardinal Health. The businesses retained by Cardinal Health are presented within these financial statements as discontinued operations.
Audiology Business
During the quarter ended September 30, 2009, management committed to a plan to dispose of its Audiology business which produces and markets hearing diagnostic equipment, and therefore treated the business as discontinued operations. As a result of being held for sale, the assets of the Audiology business were written down to fair value less costs to sell, resulting in a pre-tax impairment charge of $7 million recorded in the fiscal year 2010. On October 1, 2009, we completed the sale of the Audiology business, resulting in a total loss from discontinued operations associated with the Audiology business of $7 million, which includes a $3 million loss recorded in the quarter ended December 31, 2009, related to the write-off of non-deductible goodwill associated with the closing. At the closing of the sale, we received approximately $27 million in cash, which is net of purchase price adjustments.
Summarized selected financial information for the businesses retained by Cardinal Health and the Audiology business for the years ended June 30, 2010, 2009 and 2008, presented as discontinued operations, is as follows:
| Fiscal Year Ended June 30, | |||||||||
| (in millions) | 2010 | 2009 | 2008 | ||||||
| Revenue |
$ | 165 | $ | 906 | $ | 855 | |||
| Operating Income |
37 | 145 | 195 | ||||||
| Impairment of the Audiology Business |
7 | — | — | ||||||
| Income Before Income Tax |
59 | 376 | 404 | ||||||
| Provision for Income Tax |
36 | 98 | 74 | ||||||
| Income from Discontinued Operations, Net of Tax Expense |
23 | 278 | 330 | ||||||
72
Table of Contents
CAREFUSION CORPORATION
NOTES TO CONSOLIDATED AND COMBINED FINANCIAL STATEMENTS
The assets and liabilities of discontinued operations are stated separately as of June 30, 2009, in the consolidated and combined balance sheet and are comprised of the following items:
| (in millions) | June 30, 2009 | ||
| ASSETS | |||
| Current Assets: |
|||
| Cash and Cash Equivalents |
$ | 157 | |
| Trade Receivables, Net |
79 | ||
| Inventories, Net |
134 | ||
| Prepaid Expenses and Other |
39 | ||
| Current Assets of Discontinued Operations |
409 | ||
| Property and Equipment, Net |
178 | ||
| Goodwill |
585 | ||
| Intangible Assets, Net |
20 | ||
| Other Assets |
5 | ||
| Total Assets of Discontinued Operations |
$ | 1,197 | |
| LIABILITIES | |||
| Current Liabilities: |
|||
| Accounts Payable |
$ | 54 | |
| Other Accrued Liabilities |
66 | ||
| Current Liabilities of Discontinued Operations |
120 | ||
| Deferred Income Taxes and Other Liabilities |
114 | ||
| Total Liabilities of Discontinued Operations |
$ | 234 | |
Research Services Business
In April 2010, we entered into a definitive agreement to sell our Research Services business, which was historically part of our MT&S segment for $81 million in cash. The transaction closed on May 28, 2010. Including estimated working capital adjustments as part of the definitive agreement, the pre-tax gain related to the disposition was approximately $12 million, or $1 million loss after tax. Income tax expense associated with the transaction was impacted by approximately $24 million of goodwill assigned to the disposition that was not deductible for tax purposes. This transaction is subject to certain post-closing conditions, including potential adjustments for the final working capital.
The assets and liabilities of this business are presented separately as held for sale in our consolidated and combined balance sheet at June 30, 2009. The results of this business are reported within earnings from continuing operations in the consolidated and combined statements of income for periods up to the closing date.
73
Table of Contents
CAREFUSION CORPORATION
NOTES TO CONSOLIDATED AND COMBINED FINANCIAL STATEMENTS
At June 30, 2009, the major components of this business’ assets and liabilities held for sale were as follows:
| (in millions) | June 30, 2009 | ||
| ASSETS | |||
| Trade Receivables, Net |
$ | 12 | |
| Inventories, Net |
3 | ||
| Other Current Assets |
7 | ||
| Total Current Assets Held for Sale |
$ | 22 | |
| Property and Equipment, Net |
$ | 1 | |
| Goodwill |
24 | ||
| Intangible Assets, Net |
17 | ||
| Total Assets Held for Sale |
$ | 64 | |
| LIABILITIES | |||
| Other Accrued Liabilities |
$ | 3 | |
| Current Liabilities |
$ | 3 | |
All discontinued operations businesses presented and assets held for sale were previously included in the Medical Technologies and Services segment.
NOTE 3. ACQUISITIONS
Fiscal Year 2010. On May 17, 2010, we completed the acquisition of Medegen, LLC (“Medegen”) a manufacturer of needleless access valves and administration sets that deliver IV medication. The purchase price of the acquisition, which was paid in cash, was approximately $224 million. The valuation of acquired assets and liabilities resulted in the recognition of goodwill of approximately $118 million; identifiable intangible assets of $126 million, including $45 million of IPR&D; $53 million of deferred tax liabilities; and the remaining amount associated with net assets acquired. Various factors contributed to the establishment of goodwill, including market penetration, manufacturing synergies and future products. None of the goodwill is tax deductible. The consolidated and combined financial statements include the results of operations from this business combination from the date of acquisition, which is included in our Critical Care Technologies reporting segment. Had the transaction occurred at the beginning of fiscal year 2010, consolidated results of operations would not have differed materially from reported results.
Fiscal Year 2009. During fiscal year 2009, we did not complete any significant acquisitions.
Fiscal Year 2008. On May 12, 2008, we completed the acquisition of the assets of privately held Enturia Inc., (“Enturia”) a manufacturer of products and services directed at the infection prevention markets. The purchase price of the acquisition, which was paid in cash, was approximately $490 million, including the assumption of approximately $14 million of liabilities, which included $5 million of debt.
The final valuation of the acquired assets and liabilities resulted in goodwill of approximately $328 million and identifiable intangible assets of $129 million. Various factors contributed to the establishment of goodwill, including the benefit of adding Enturia’s portfolio of products, highly trained workforce, increased market penetration and future products. None of the goodwill is tax deductible. We identified and valued intangible assets related to trade names and trademarks, developed technology and customer relationships.
74
Table of Contents
CAREFUSION CORPORATION
NOTES TO CONSOLIDATED AND COMBINED FINANCIAL STATEMENTS
During fiscal year 2008, we recorded a charge of $18 million related to the write-off of estimated IPR&D costs associated with the Enturia acquisition. Prior to fiscal year 2010, we expensed IPR&D costs at the time of acquisition (see note 1 for significant accounting polices). The portion of the purchase price allocated to IPR&D in fiscal year 2008 represented our preliminary estimate of the fair value of the research and development projects in-process at the time of the acquisition. These projects had not yet reached technological feasibility and were deemed to have no alternative use and, accordingly, were immediately expensed at the acquisition date. During fiscal year 2009, we completed the valuation of IPR&D and no adjustment was needed to the IPR&D charge recorded in fiscal year 2008.
In connection with restructuring and integration plans related to our acquisition of Enturia, we accrued, as part of our acquisition adjustments, a liability of $20 million related to closing of certain facilities and $4 million related to employee termination costs. During fiscal year 2009, we reclassified the $20 million liability to goodwill as it is no longer feasible to consolidate facilities due to the fact that the planned destination facilities were to remain with Cardinal Health post separation. As of June 30, 2010, we have paid all costs associated with employee-termination.
In addition, during fiscal year 2008 we completed other acquisitions that individually were not significant. The aggregate purchase price of these acquisitions, which was paid in cash, was approximately $31 million with potential maximum contingent payments of $85 million. Assumed liabilities of these acquired businesses were immaterial. In connection with these other acquisitions, we expensed $25 million of IPR&D costs.
The consolidated and combined financial statements include the results of operations from each of these business combinations from the date of acquisition. Had the transactions occurred at the beginning of fiscal year 2008, results of operations would not have differed materially from reported results.
NOTE 4. EARNINGS PER SHARE
For the fiscal year ended June 30, 2010, basic earnings per common share is computed by dividing net income by the weighted average number of common shares outstanding during the year. Diluted earnings per common share is calculated to give effect to all dilutive securities, using the treasury stock method.
The following table sets forth the reconciliation of basic and diluted earnings per share for the fiscal year ended June 30, 2010:
| (shares in millions) | Fiscal Year Ended June 30, 2010 | |
| Denominator for Basic Earnings per Share |
221.5 | |
| Effect of Dilutive Securities: |
||
| Stock Options |
0.5 | |
| Restricted Stock Awards, Restricted Stock Units and Performance Share Units |
1.0 | |
| Denominator for Diluted Earnings per Share — Adjusted for Dilutive Securities |
223.0 | |
The table below provides a summary of the securities that could potentially dilute basic earnings per share in the future that were not included in the computation of diluted earnings per share because to do so would have been antidilutive for the period presented. Antidilutive securities were as follows for the year ended June 30, 2010:
| (shares in millions) | Fiscal Year Ended June 30, 2010 | ||
| Number of Securities |
8.8 | ||
| Weighted Average Exercise Price |
$ | 32.60 | |
75
Table of Contents
CAREFUSION CORPORATION
NOTES TO CONSOLIDATED AND COMBINED FINANCIAL STATEMENTS
For the fiscal years ended June 30, 2009 and 2008, basic and diluted earnings per common share were computed using the number of shares of our common stock outstanding on August 31, 2009, the date which CareFusion common stock was distributed to shareholders of Cardinal Health. Unvested shares of restricted stock are excluded from the basic shares outstanding.
Basic and diluted per share amounts are computed independently in the consolidated and combined statements of income. Therefore, the sum of per share components may not equal the per share amounts presented.
NOTE 5. RESTRUCTURING AND ACQUISITION INTEGRATION CHARGES
Restructuring liabilities are measured at fair value and recognized as incurred. Acquisition integration charges are expensed as incurred.
The following is a summary of restructuring and acquisition integration charges for the fiscal years ended June 30, 2010, 2009 and 2008:
| Fiscal Year Ended June 30, | |||||||||
| (in millions) | 2010 | 2009 | 2008 | ||||||
| Restructuring Charges |
$ | 14 | $ | 60 | $ | 11 | |||
| Acquisition Integration Charges |
5 | 12 | 24 | ||||||
| Total Restructuring and Acquisition Integration Charges |
$ | 19 | $ | 72 | $ | 35 | |||
Restructuring Charges
In fiscal year 2009, we launched a series of restructuring programs with the goals to provide improved management focus through the re-alignment of the management structure and lowering the cost structure through a reduction in global workforce. The entire restructuring program resulted in $66 million in pre-tax charges, which is a reduction of our previously estimated amount of $73 million reported at June 30, 2009. This change is mainly a result of slight modifications to the programs and the effect of certain employees leaving before their jobs were eliminated. All major activities of the programs were complete as of March 31, 2010.
In addition to participating in the restructuring programs discussed above, we periodically incur costs to implement smaller restructuring efforts for specific operations. The restructuring plans focus on various aspects of operations, including closing and consolidating certain manufacturing operations, rationalizing headcount, and aligning operations in the most strategic and cost-efficient structure.
76
Table of Contents
CAREFUSION CORPORATION
NOTES TO CONSOLIDATED AND COMBINED FINANCIAL STATEMENTS
The following table segregates our restructuring charges into our reportable segments and, along with the following paragraphs, provides additional detail regarding the types of restructuring charges incurred by us for the fiscal years ended June 30, 2010, 2009 and 2008:
| Fiscal Year Ended June 30, | |||||||||
| (in millions) | 2010 | 2009 | 2008 | ||||||
| Medical Technologies and Services |
|||||||||
| Employee-Related Costs |
$ | 4 | $ | 14 | $ | 10 | |||
| Facility Exit and Other Costs |
— | 7 | — | ||||||
| Total Medical Technologies and Services |
4 | 21 | 10 | ||||||
| Critical Care Technologies |
|||||||||
| Employee-Related Costs |
7 | 26 | — | ||||||
| Facility Exit and Other Costs |
3 | 13 | 1 | ||||||
| Total Critical Care Technologies |
10 | 39 | 1 | ||||||
| Total Restructuring Charges |
$ | 14 | $ | 60 | $ | 11 | |||
Employee-Related Costs. These costs primarily consist of severance accrued upon either communication of terms to employees or over the required service period, outplacement services provided to employees who have been involuntarily terminated and associated payroll costs.
Facility Exit and Other Costs. These costs primarily consist of accelerated depreciation, equipment relocation costs, project consulting fees, and costs associated with restructuring our delivery of information technology infrastructure services.
Restructuring Accrual Rollforward. The following table summarizes activity related to liabilities associated with our restructuring charges as of June 30, 2010, 2009 and 2008, which are included within “Other Accrued Liabilities” in the consolidated and combined balance sheets:
| (in millions) | Restructuring | |||
| Balance at June 30, 2008 |
$ | 5 | ||
| Additions |
60 | |||
| Payments |
(48 | ) | ||
| Balance at June 30, 2009 |
17 | |||
| Additions |
14 | |||
| Payments |
(19 | ) | ||
| Balance at June 30, 2010 |
$ | 12 | ||
Certain restructuring costs are based upon estimates. Actual amounts paid may ultimately differ from these estimates. If additional costs are incurred or recognized amounts exceed costs, such changes in estimates will be recognized when incurred.
Acquisition Integration Charges
Costs of integrating operations of various acquired companies are recorded as acquisition integration charges when incurred. The acquisition integration charges incurred during fiscal year 2010 were primarily a result of the acquisition of Medegen and Viasys. The acquisition integration charges incurred during fiscal year 2009 and fiscal year 2008 were primarily a result of the acquisition of Viasys.
77
Table of Contents
CAREFUSION CORPORATION
NOTES TO CONSOLIDATED AND COMBINED FINANCIAL STATEMENTS
The following table and paragraphs provide additional detail regarding the types of acquisition integration charges incurred by us for the fiscal years ended June 30, 2010, 2009 and 2008:
| Fiscal Year Ended June 30, | |||||||||
| (in millions) | 2010 | 2009 | 2008 | ||||||
| Acquisition Integration Charges: |
|||||||||
| Employee-Related Costs |
$ | 2 | $ | 2 | $ | 3 | |||
| Other Integration Costs |
3 | 10 | 21 | ||||||
| Total Acquisition Integration Charges |
$ | 5 | $ | 12 | $ | 24 | |||
Employee-Related Costs. These costs primarily consist of severance, retention bonuses, non-compete agreements and other forms of compensatory payouts made to employees as a direct result of the acquisitions.
Other Integration Costs. Other integration costs generally relate to expenses incurred to integrate the acquired company’s operations and systems into our existing operations and systems. These costs include, but are not limited to, the integration of information systems, employee benefits and compensation, corporate accounting and finance, sales and marketing and other.
Certain acquisition costs are based upon estimates. Actual amounts paid may ultimately differ from these estimates. If additional costs are incurred or recognized amounts exceed costs, such changes in estimate will be recognized when incurred.
NOTE 6. LEASES
Sales Type Leases. Our sales-type leases are for terms generally ranging from three to five years. Lease receivables are generally collateralized by the underlying equipment. The components of our net investment in sales-type leases are as follows as of June 30, 2010 and 2009:
| As of June 30, | ||||||||
| (in millions) | 2010 | 2009 | ||||||
| Future Minimum Lease Payments Receivable |
$ | 1,495 | $ | 1,484 | ||||
| Unguaranteed Residual Values |
27 | 25 | ||||||
| Unearned Income |
(179 | ) | (192 | ) | ||||
| Allowance for Uncollectible Minimum Lease Payments Receivable |
(8 | ) | (7 | ) | ||||
| Net Investment in Sales-Type Leases |
1,335 | 1,310 | ||||||
| Less: Current Portion |
389 | 391 | ||||||
| Net Investment in Sales-Type Leases, Less Current Portion |
$ | 946 | $ | 919 | ||||
Future minimum lease payments to be received pursuant to sales-type leases during the next five fiscal years and thereafter are as follows:
| (in millions) | 2011 | 2012 | 2013 | 2014 | 2015 | Thereafter | Total | ||||||||||||||
| Minimum Lease Payments |
$ | 461 | $ | 431 | $ | 323 | $ | 195 | $ | 80 | $ | 5 | $ | 1,495 | |||||||
78
Table of Contents
CAREFUSION CORPORATION
NOTES TO CONSOLIDATED AND COMBINED FINANCIAL STATEMENTS
Operating Lease Revenue. Products under operating leases consist of the following at June 30, 2010 and 2009:
| As of June 30, | ||||||||
| (in millions) | 2010 | 2009 | ||||||
| Products |
$ | 67 | $ | 68 | ||||
| Allowance for Depreciation |
(33 | ) | (32 | ) | ||||
| $ | 34 | $ | 36 | |||||
Future minimum lease payments to be received pursuant to operating leases during the next five fiscal years and thereafter are as follows:
| (in millions) | 2011 | 2012 | 2013 | 2014 | 2015 | Thereafter | Total | ||||||||||||||
| Future Lease Payments |
$ | 24 | $ | 20 | $ | 17 | $ | 11 | $ | 3 | $ | 2 | $ | 77 | |||||||
NOTE 7. INVENTORIES
Inventories, accounted for at the lower of cost or market on the FIFO method, consisted of the following as of June 30, 2010 and 2009:
| As of June 30, | ||||||||
| (in millions) | 2010 | 2009 | ||||||
| Finished Goods |
$ | 306 | $ | 310 | ||||
| Work-in-Process |
36 | 31 | ||||||
| Raw Materials |
135 | 130 | ||||||
| 477 | 471 | |||||||
| Reserve for Excess and Obsolete Inventories |
(55 | ) | (45 | ) | ||||
| Inventories, Net |
$ | 422 | $ | 426 | ||||
NOTE 8. PROPERTY AND EQUIPMENT
Property and equipment was comprised of the following at June 30, 2010 and 2009, respectively:
| As of June 30, | ||||||||
| (in millions) | 2010 | 2009 | ||||||
| Land, Buildings and Improvements |
$ | 185 | $ | 177 | ||||
| Machinery and Equipment |
742 | 663 | ||||||
| Furniture and Fixtures |
26 | 26 | ||||||
| 953 | 866 | |||||||
| Accumulated Depreciation |
(504 | ) | (471 | ) | ||||
| Property and Equipment, Net |
$ | 449 | $ | 395 | ||||
Depreciation expense was $96 million, $97 million and $83 million for fiscal year 2010, 2009 and 2008, respectively. We expense repairs and maintenance expenditures as incurred.
79
Table of Contents
CAREFUSION CORPORATION
NOTES TO CONSOLIDATED AND COMBINED FINANCIAL STATEMENTS
NOTE 9. GOODWILL AND OTHER INTANGIBLE ASSETS
Goodwill
The following table summarizes the changes in the carrying amount of goodwill:
| (in millions) | Total | |||
| Balance at June 30, 2008 |
$ | 2,847 | ||
| Goodwill Acquired, Net of Purchase Price Adjustments, Foreign Currency Translation Adjustments and Other |
32 | |||
| Balance at June 30, 2009 |
2,879 | |||
| Goodwill Acquired, Net of Purchase Price Adjustments |
118 | |||
| Goodwill Related to the Divestiture or Closure of Businesses, Assets Held for Sale and Other Adjustments |
(2 | ) | ||
| Balance at June 30, 2010 |
$ | 2,995 | ||
As of June 30, 2010, goodwill for the Critical Care Technologies segment and the Medical Technologies and Services segment was $2,254 million and $741 million, respectively.
80
Table of Contents
CAREFUSION CORPORATION
NOTES TO CONSOLIDATED AND COMBINED FINANCIAL STATEMENTS
Intangible Assets
Intangible assets with definite lives are amortized over their useful lives which range from three to 20 years. The detail of intangible assets by class is as follows:
| (in millions) | Weighted Average |
Gross Intangible |
Accumulated Amortization |
Net Intangible | |||||||
| June 30, 2010 |
|||||||||||
| Unamortized Intangibles: |
|||||||||||
| In-Process Research and Development1 |
Indefinite | $ | 45 | $ | — | $ | 45 | ||||
| Trademarks and Patents |
Indefinite | 336 | — | 336 | |||||||
| Total Unamortized Intangibles |
381 | — | 381 | ||||||||
| Amortized Intangibles: |
|||||||||||
| Trademarks and Patents1 |
12 | 83 | 35 | 48 | |||||||
| Developed Technology1 |
9 | 275 | 91 | 184 | |||||||
| Customer Relationships1 |
14 | 504 | 181 | 323 | |||||||
| Other |
8 | 37 | 27 | 10 | |||||||
| Total Amortized Intangibles |
12 | 899 | 334 | 565 | |||||||
| Total Intangibles |
$ | 1,280 | $ | 334 | $ | 946 | |||||
| June 30, 2009 |
|||||||||||
| Unamortized Intangibles: |
|||||||||||
| Trademarks and Patents |
Indefinite | 337 | — | 337 | |||||||
| Total Unamortized Intangibles |
337 | — | 337 | ||||||||
| Amortized Intangibles: |
|||||||||||
| Trademarks and Patents |
11 | 68 | 22 | 46 | |||||||
| Developed Technology |
9 | 204 | 72 | 132 | |||||||
| Customer Relationships |
14 | 497 | 146 | 351 | |||||||
| Other |
8 | 37 | 24 | 13 | |||||||
| Total Amortized Intangibles |
13 | 806 | 264 | 542 | |||||||
| Total Intangibles |
$ | 1,143 | $ | 264 | $ | 879 | |||||
| 1 | During fiscal year 2010, we acquired Medegen which resulted in recognition of $45 million of IPR&D, $7 million of trademarks and patents, $63 million of developed technology and $11 million of customer relationships. |
Amortization expense for the three years ended June 30, 2010, 2009 and 2008 is as follows:
| Fiscal Year Ended June 30, | |||||||||
| (in millions) | 2010 | 2009 | 2008 | ||||||
| Amortization Expense |
$ | 77 | $ | 73 | $ | 63 | |||
Amortization expense for each of the next five fiscal years is estimated to be:
| (in millions) | 2011 | 2012 | 2013 | 2014 | 2015 | ||||||||||
| Amortization Expense |
$ | 80 | $ | 76 | $ | 55 | $ | 53 | $ | 41 | |||||
81
Table of Contents
CAREFUSION CORPORATION
NOTES TO CONSOLIDATED AND COMBINED FINANCIAL STATEMENTS
NOTE 10. ACCUMULATED OTHER COMPREHENSIVE LOSS
The components of accumulated other comprehensive loss consisted of the following as of June 30, 2010 and 2009:
| Fiscal Year Ended, June 30, |
||||||||
| (in millions) | 2010 | 2009 | ||||||
| Foreign Currency Translation Adjustments1 |
$ | (83 | ) | $ | (43 | ) | ||
| Net Unrealized Gain (Loss) on Derivative Instruments2 |
1 | (6 | ) | |||||
| Minimum Pension Liability |
(5 | ) | (4 | ) | ||||
| Other |
2 | (2 | ) | |||||
| Accumulated Other Comprehensive Loss |
$ | (85 | ) | $ | (55 | ) | ||
| 1 | Included within the $(43) million of foreign currency translation adjustments as of June 30, 2009 is $(23) million associated with discontinued operations. |
| 2 | Included within the $(6) million of the net unrealized loss on derivative instruments as of June 30, 2009 is $(2) million associated with discontinued operations. |
NOTE 11. BORROWINGS
Borrowings consisted of the following:
| (in millions) | June 30, 2010 |
June 30, 2009 | ||||
| Senior Notes due 2012, 4.125% Less Unamortized Discount of $1.2 million at June 30, 2010, Effective Rate 4.37% |
$ | 249 | $ | — | ||
| Senior Notes due 2014, 5.125% Less Unamortized Discount of $3.9 million at June 30, 2010, Effective Rate 5.36% |
446 | — | ||||
| Senior Notes due 2019, 6.375% Less Unamortized Discount of $10.7 million at June 30, 2010, Effective Rate 6.60% |
689 | — | ||||
| Other Obligations; Interest Averaging 2.82% at June 30, 2010 and 3.30% at June 30, 2009, Due in Varying Installments through 2014 |
6 | 8 | ||||
| Debt Allocated from Parent |
— | 1,281 | ||||
| Total Borrowings |
1,390 | 1,289 | ||||
| Less: Current Portion |
4 | 130 | ||||
| Long-Term Portion |
$ | 1,386 | $ | 1,159 | ||
Senior Unsecured Notes. On July 14, 2009, we offered and sold $1.4 billion aggregate principal amount of senior unsecured notes and received net proceeds of $1.374 billion. As part of the spinoff, the net proceeds were subsequently distributed as a dividend payment to Cardinal Health.
The indenture for the senior notes limits our ability to incur certain secured debt and enter into certain sale and leaseback transactions. In accordance with the indenture, we may redeem the senior notes prior to maturity at a price that would equal or exceed the outstanding principal balance, as defined. In addition, if we undergo a change of control and experience a below investment grade rating event, we may be required to repurchase all of the senior notes at a purchase price equal to 101% of the principal balance plus any accrued and unpaid interest.
82
Table of Contents
CAREFUSION CORPORATION
NOTES TO CONSOLIDATED AND COMBINED FINANCIAL STATEMENTS
In connection with the issuance of the senior notes, we entered into a registration rights agreement with the initial purchasers of the notes pursuant to which we agreed to file a registration statement with the SEC to conduct an exchange offer for the notes. In accordance with the registration rights agreement, we filed a Form S-4 with the SEC and conducted an exchange offer for the notes, which we completed on February 4, 2010. The purpose of the exchange offer was to allow the holders of the senior notes, which were issued in a private placement transaction and were subject to transfer restrictions, to exchange their notes for new notes that did not have these restrictions and are registered under the Securities Act. All of the outstanding senior notes were exchanged in the exchange offer. Following the exchange offer, we continue to have $1.4 billion aggregate principal amount of senior notes outstanding.
Revolving Credit Facilities. On July 1, 2009, we entered into two senior unsecured revolving credit facilities with an aggregate available principal amount of $720 million, allocated as follows:
| • | $240 million — 364-day revolving credit facility (maturing August 30, 2010); and |
| • | $480 million — three-year revolving credit facility (maturing August 31, 2012) |
Borrowings under the 364-day revolving credit facility bear interest at a floating rate per annum based upon the London Interbank Offered Rate (“LIBOR”) or alternate base rate (“ABR”), in each case, plus an applicable margin, which in the case of LIBOR varies from 2.2% to 3.5% based upon CareFusion’s debt ratings and in the case of ABR varies from 1.2% to 2.5% based upon CareFusion’s debt ratings. At June 30, 2010, we had no amounts outstanding under our 364-day revolving credit facility.
Borrowings under the three-year revolving credit facility bear interest at a floating rate per annum based upon the LIBOR or the alternate base rate ABR, in each case, plus an applicable margin, which in the case of LIBOR varies from 2.1% to 3.375% depending on CareFusion’s debt ratings and in the case of ABR varies from 1.1% to 2.375% depending on CareFusion’s debt ratings. The commitments under the three-year revolving credit facility are subject to increase, upon our request and consent by the lenders, by up to an aggregate of $30 million. Subject to customary covenants, the three-year revolving credit facility allows for the stated borrowing amount, including $25 million of standby letters of credit. At June 30, 2010, we had no amounts outstanding under our three-year revolving credit facility.
The revolving credit facilities contain several customary covenants including, but not limited to, limitations on liens, subsidiary indebtedness, investments, dispositions, restricted payments, transactions with affiliates, change in control and sale and lease-back transactions. The revolving credit facilities also require that we maintain certain interest coverage and maximum leverage ratios. We were in compliance with all of our revolving credit agreement covenants at June 30, 2010. All obligations under the revolving credit facilities are guaranteed by each of our existing and future direct and indirect material domestic subsidiaries.
Other Borrowings. We maintain other short-term credit facilities and letter of credit facilities that allow for borrowings up to $67 million and $49 million at June 30, 2010 and June 30, 2009, respectively. At June 30, 2010, we had $2 million of borrowings drawn and $18 million of standby letters of credit outstanding on these facilities. At June 30, 2009, we had $4 million of borrowings drawn and $12 million of standby letters of credit outstanding on these facilities. The remaining $4 million balance of other obligations at June 30, 2010 and June 30, 2009, consisted primarily of additional notes, loans and capital leases. Obligations related to capital leases are secured by the underlying assets.
Bridge Loan Facility. On July 1, 2009, we entered into a senior unsecured bridge loan facility (the “bridge loan facility”) to provide financing for an aggregate principal amount of $1.4 billion, with a term of 364 days from the date of any funding, for payment of the dividend to Cardinal Health as part of our spinoff. As the senior
83
Table of Contents
CAREFUSION CORPORATION
NOTES TO CONSOLIDATED AND COMBINED FINANCIAL STATEMENTS
unsecured note offering was successfully completed prior to the separation, those proceeds were used to finance the payment of the dividend to Cardinal Health in lieu of drawing the bridge loan facility. As a result, the bridge loan facility was terminated on August 31, 2009. In connection with this termination, we expensed approximately $22 million of capitalized fees to interest expense in the quarter ended September 30, 2009.
Debt Allocated from Parent. Cardinal Health historically used a centralized approach to United States domestic cash management and financing of its operations, excluding debt directly incurred by any of its businesses, such as debt assumed in an acquisition or certain capital lease obligations. Prior to the completion of the spinoff, the majority of our United States domestic cash was transferred to Cardinal Health daily and Cardinal Health funded our operating and investing activities as needed. A portion of Cardinal Health’s consolidated debt, which consists primarily of fixed rate public debt, was allocated to us based on the debt levels consistent with an investment grade credit rating, including amounts directly incurred. The allocated debt amounts, presented as “Debt Allocated from Parent” on the June 30, 2009 consolidated and combined balance sheet were classified based on the maturities of Cardinal Health’s underlying debt. Net interest expense was allocated in the same proportions as debt and includes the effect of interest rate swap agreements designated as fair value hedges.
We believe the allocation basis for debt and net interest expense is reasonable based on the debt levels consistent with an investment grade credit rating for us. However, these amounts may not be indicative of the actual amounts that we would have incurred had we been operating as an independent, publicly-traded company for the periods presented prior to the spinoff.
Future Payments. As of June 30, 2010, maturities of long-term obligations for the next five fiscal years and thereafter are as follows:
| (in millions) | 2011 | 2012 | 2013 | 2014 | 2015 | Thereafter | Total | ||||||||||||||
| Maturities of Long-Term Obligations |
$ | 4 | $ | 1 | $ | 250 | $ | — | $ | 446 | $ | 689 | $ | 1,390 | |||||||
Fair Value Disclosures
The estimated fair value of our long-term obligations and other short-term borrowings was $1,540 million and $1,217 million as compared to the carrying amounts of $1,390 million and $1,289 million at June 30, 2010 and June 30, 2009, respectively. The fair value of our senior notes at June 30, 2010 was based on quoted market prices. The fair value of the other obligations at June 30, 2010 and June 30, 2009, including debt allocated to us by Cardinal Health, was based on either the quoted market prices for the same or similar debt and the current interest rates offered for debt of the same remaining maturities or estimated discounted cash flows.
NOTE 12. INCOME TAXES
Income before income taxes is as follows for fiscal years ended June 30, 2010, 2009 and 2008:
| For Fiscal Year Ended June 30, | |||||||||
| (in millions) | 2010 | 2009 | 2008 | ||||||
| United States Operations |
$ | 82 | $ | 141 | $ | 159 | |||
| Non-United States Operations |
275 | 202 | 284 | ||||||
| Total |
$ | 357 | $ | 343 | $ | 443 | |||
84
Table of Contents
CAREFUSION CORPORATION
NOTES TO CONSOLIDATED AND COMBINED FINANCIAL STATEMENTS
Provision for Income Taxes. Prior to August 31, 2009, our income taxes as presented are calculated on a separate return basis although our operations have historically been included in Cardinal Health’s consolidated tax returns. The provision/(benefit) for taxes consists of the following for the fiscal years ended June 30, 2010, 2009 and 2008:
| For Fiscal Year Ended June 30, | ||||||||||||
| (in millions) | 2010 | 2009 | 2008 | |||||||||
| Current: |
||||||||||||
| Federal |
$ | 251 | $ | 96 | $ | 20 | ||||||
| State and Local |
17 | 19 | (1 | ) | ||||||||
| Non-United States |
40 | 9 | 25 | |||||||||
| Total |
308 | 124 | 44 | |||||||||
| Deferred: |
||||||||||||
| Federal |
(98 | ) | (23 | ) | 47 | |||||||
| State and Local |
(21 | ) | (47 | ) | 13 | |||||||
| Non-United States |
(3 | ) | (1 | ) | 6 | |||||||
| Total |
(122 | ) | (71 | ) | 66 | |||||||
| Total Provision |
$ | 186 | $ | 53 | $ | 110 | ||||||
A reconciliation of the provision for taxes based on the federal statutory income tax rate to our effective income tax rate is as follows for fiscal years ended June 30, 2010, 2009 and 2008:
| For Fiscal Year Ended June 30, | |||||||||
| 2010 | 2009 | 2008 | |||||||
| Provision at Federal Statutory Rate |
35.0 | % | 35.0 | % | 35.0 | % | |||
| State and Local Income Taxes, net of Federal Benefit |
1.5 | 0.8 | 1.0 | ||||||
| Effect of International Operations |
(4.0 | ) | (9.0 | ) | (9.7 | ) | |||
| Nondeductible/Nontaxable Items |
(0.8 | ) | (0.4 | ) | (0.1 | ) | |||
| Disposition of Research Services Business |
3.6 | — | — | ||||||
| Change in Estimate |
16.4 | — | — | ||||||
| Acquired IPR&D |
— | — | (2.1 | ) | |||||
| Refund Claim |
— | (7.0 | ) | — | |||||
| Deferred State Tax Rate Adjustment |
(2.2 | ) | (6.0 | ) | — | ||||
| Other |
2.6 | 2.1 | 0.7 | ||||||
| Effective Income Tax Rate |
52.1 | % | 15.5 | % | 24.8 | % | |||
85
Table of Contents
CAREFUSION CORPORATION
NOTES TO CONSOLIDATED AND COMBINED FINANCIAL STATEMENTS
As of June 30, 2010 we had an estimated $2.0 billion of undistributed earnings from non-United States subsidiaries that are intended to be indefinitely reinvested in non-United States operations. Due to the inherent limitations and complex nature of our separation from Cardinal Health, we are in the process of completing a detailed analysis of this estimate. However, because these earnings are considered indefinitely reinvested, no incremental United States tax has been provided for these earnings. It is not practicable to estimate the amount of United States tax that might be payable on the eventual remittance of such earnings.
Deferred Tax Assets and Liabilities. Deferred income taxes arise from temporary differences between financial reporting and tax reporting bases of assets and liabilities, and operating loss and tax credit carryforwards for tax purposes. The components of the deferred income tax assets and liabilities as of June 30, 2010 and 2009 are as follows:
| For Fiscal Year Ended June 30, |
||||||||
| (in millions) | 2010 | 2009 | ||||||
| Deferred Income Tax Assets: |
||||||||
| Receivable Basis Difference |
$ | 12 | $ | 6 | ||||
| Accrued Liabilities |
100 | 59 | ||||||
| Equity Compensation |
47 | 42 | ||||||
| Loss Carryforwards |
19 | 25 | ||||||
| Property-Related |
79 | 63 | ||||||
| Inventory Basis Differences |
23 | 29 | ||||||
| Interest |
33 | 25 | ||||||
| Other |
37 | 28 | ||||||
| Total Deferred Income Tax Assets |
350 | 277 | ||||||
| Valuation Allowance for Deferred Income Tax Assets |
(6 | ) | (6 | ) | ||||
| Net Deferred Income Tax Assets |
344 | 271 | ||||||
| Deferred Income Tax Liabilities: |
||||||||
| Goodwill and Other Intangibles |
(335 | ) | (300 | ) | ||||
| Revenue on Lease Contracts |
(518 | ) | (511 | ) | ||||
| Other |
(6 | ) | — | |||||
| Total Deferred Income Tax Liabilities |
(859 | ) | (811 | ) | ||||
| Net Deferred Income Tax Liabilities |
$ | (515 | ) | $ | (540 | ) | ||
86
Table of Contents
CAREFUSION CORPORATION
NOTES TO CONSOLIDATED AND COMBINED FINANCIAL STATEMENTS
Deferred tax assets and liabilities in the preceding table, after netting by taxing jurisdiction, are in the following captions in the consolidated and combined balance sheet at June 30, 2010 and 2009:
| For Fiscal Year Ended June 30, |
||||||||
| (in millions) | 2010 | 2009 | ||||||
| Current Deferred Tax Asset1 |
$ | 140 | $ | 11 | ||||
| Non Current Deferred Tax Asset2 |
16 | 9 | ||||||
| Current Deferred Tax Liability3 |
— | (6 | ) | |||||
| Non Current Deferred Tax Liability4 |
(671 | ) | (554 | ) | ||||
| Net Deferred Tax Liability |
$ | (515 | ) | $ | (540 | ) | ||
| 1 | Included in “Other Current Assets”. |
| 2 | Included in “Other Assets”. |
| 3 | Included in “Other Accrued Liabilities”. |
| 4 | Included in “Deferred Income Taxes”. |
At June 30, 2010, we had gross federal, state and international loss and credit carryforwards of $3 million, $141 million and $31 million, respectively, the tax effect of which is an aggregate deferred tax asset of $16 million. Substantially all of these carryforwards are available for at least three years or have an indefinite carryforward period. The valuation allowance of $6 million at June 30, 2010 applies to certain federal, international, and state and local carryforwards that, in the opinion of management, are more likely than not to expire unutilized. However, to the extent that tax benefits related to these carryforwards are realized in the future, the reduction in the valuation allowance would be applied against income tax expense.
Unrecognized Tax Benefits. We had $269 million and $222 million of unrecognized tax benefits at June 30, 2010 and June 30, 2009, respectively. Included in the June 30, 2010 and 2009 balances are $233 million and $195 million, respectively, of unrecognized tax benefits that, if recognized, would have an impact on the effective tax rate. The remaining unrecognized tax benefits relate to tax positions for which ultimate deductibility is highly certain but for which there is uncertainty as to the timing of such deductibility and to tax positions related to acquired companies in the amount of $36 million and $27 million at June 30, 2010 and 2009, respectively. Recognition of these tax benefits would not impact our effective tax rate.
A reconciliation of the unrecognized tax benefits from July 1, 2009 to June 30, 2010, is as follows:
| For Fiscal Year Ended June 30, |
||||||||
| (in millions) | 2010 | 2009 | ||||||
| Balance at July 1 |
$ | 222 | $ | 122 | ||||
| Additions for Tax Positions of the Current Year |
25 | 26 | ||||||
| Additions for Tax Positions of Prior Years |
45 | 94 | ||||||
| Reductions for Tax Positions of Prior Years |
(2 | ) | (10 | ) | ||||
| Settlements with Tax Authorities |
— | (9 | ) | |||||
| Expiration of the Statute of Limitations |
(3 | ) | (1 | ) | ||||
| Reduction Due to Tax Matters Agreement |
(18 | ) | — | |||||
| Balance at June 30 |
$ | 269 | $ | 222 | ||||
87
Table of Contents
CAREFUSION CORPORATION
NOTES TO CONSOLIDATED AND COMBINED FINANCIAL STATEMENTS
We recognize accrued interest and penalties related to unrecognized tax benefits in income tax expense. As of June 30, 2010 and 2009, we had $94 million and $44 million, respectively, accrued for the payment of interest and penalties. These balances are gross amounts before any tax benefits and are included in other liabilities in the consolidated and combined balance sheets. For the year ended June 30, 2010, we recognized $54 million of interest and penalties in the consolidated and combined statement of income. Of the $54 million, approximately $33 million is associated with the $58 million tax estimate change discussed below.
Our material tax jurisdictions include the United States, states, and various international jurisdictions including Switzerland, Netherlands, Germany, France, and Italy. With a few minor exceptions, CareFusion is no longer subject to income tax examinations by United States Federal and State income tax authorities for fiscal years prior to 2001. In our material foreign jurisdictions the earliest statute of limitations remaining open is fiscal year 2005.
During the quarter ended September 30, 2008, Cardinal Health received an IRS Revenue Agent’s Report for the tax years 2003 through 2005 that included Notices of Proposed Adjustment related to transfer pricing arrangements between foreign and domestic subsidiaries and the transfer of intellectual property among our subsidiaries. The amount of additional tax proposed by the IRS in these notices totals $462 million, excluding penalties and interest, which may be significant. We and Cardinal Health disagree with the IRS regarding its application of the United States Treasury regulations to the arrangements under review and the valuations underlying such adjustments and intend to vigorously contest them. We are still in the audit stage with respect to the fiscal tax years ending June 30, 2006 and 2007 and have received several proposed notices of adjustment to date. The IRS has not yet commenced any IRS audit for our fiscal tax years ending June 30, 2008, 2009 and 2010. We believe that we have provided adequate contingent tax reserves for these matters. The tax matters agreement generally provides that the control of audit proceedings and payment of any additional liability related to our business is our responsibility.
During fiscal year 2010, we completed a detailed analysis of our tax reserves prompted by new information related to our potential tax positions, tax liabilities, and tax planning strategies. For this analysis, we retained third-party advisors to assist in assessing whether, based on the new information, our tax risks had changed, and whether additional reserves in excess of those already recorded were necessary. This change in estimate of approximately $58 million was recorded as a charge to net income for the quarter ended March 31, 2010.
It is possible that within the next twelve months, ongoing tax examinations in the United States and several of our foreign jurisdictions may be resolved, that new tax exams may commence and that other issues may be effectively settled. However, we do not expect our unrecognized tax benefits to change significantly over that time.
NOTE 13. COMMITMENTS AND CONTINGENCIES
In addition to commitments and obligations in the ordinary course of business, we are subject to various claims, other pending and potential legal actions for damages, investigations relating to governmental laws and regulations and other matters arising out of the normal conduct of our business. We assess contingencies to determine the degree of probability and range of possible loss for potential accrual in our financial statements. An estimated loss contingency is accrued in our financial statements if it is probable that a liability has been incurred and the amount of the loss can be reasonably estimated. Because litigation is inherently unpredictable and unfavorable resolutions could occur, assessing contingencies is highly subjective and requires judgments about future events. We regularly review contingencies to determine the adequacy of our accruals and related disclosures. The amount of ultimate loss may differ from these estimates. It is possible that cash flows or results of operations could be materially affected in any particular period by the unfavorable resolution of one or more of these contingencies.
88
Table of Contents
CAREFUSION CORPORATION
NOTES TO CONSOLIDATED AND COMBINED FINANCIAL STATEMENTS
FDA Consent Decree. We are operating under an amended consent decree with the FDA related to our infusion pump business in the United States. We entered into a consent decree with the FDA in February 2007 related to our Alaris SE pumps, and in February 2009, we and the FDA amended the consent decree to include all infusion pumps manufactured by or for CareFusion 303, Inc., our subsidiary that manufactures and sells infusion pumps in the United States. The amended consent decree does not apply to intravenous administration sets and accessories.
While we remain subject to the amended consent decree, which includes the requirements of the consent decree, we have made substantial progress in our compliance efforts. In accordance with the consent decree, we reconditioned Alaris SE pumps that had been seized by the FDA, remediated Alaris SE pumps in use by customers, and had an independent expert inspect the Alaris SE pump facilities and provide a certification to the FDA as to compliance. As a result of these efforts, in January 2010, we announced that the FDA had given us permission to resume the manufacturing and marketing of our Alaris SE pumps. In accordance with the amended consent decree, and in addition to the requirements of the original consent decree, we also implemented a corrective action plan to bring the Alaris System and all other infusion pumps in use in the United States market into compliance, had our infusion pump facilities inspected by an independent expert, and had our recall procedures and all ongoing recalls involving our infusion pumps inspected by an independent recall expert. In July 2010, the FDA notified us that we can proceed to the audit inspection phase of the amended consent decree, which includes the requirement to retain an independent expert to conduct periodic audits of our infusion pump facilities. The amended consent decree authorizes the FDA, in the event of any violations in the future, to order us to cease manufacturing and distributing, recall products and take other actions. We may be required to pay damages of $15,000 per day per violation if we fail to comply with any provision of the amended consent decree, up to $15 million per year.
We cannot currently predict the outcome of this matter, whether additional amounts will be incurred to resolve this matter, if any, or the matter’s ultimate impact on our business. We may be obligated to pay more or less than the amount that we reserved in connection with the amended consent decree because, among other things, the FDA may determine that we are not fully compliant with the amended consent decree and therefore impose penalties under the amended consent decree, and/or we may be subject to future proceedings and litigation relating to the matters addressed in the amended consent decree.
Other Matters. In addition to the matter described above, we also become involved in other litigation and regulatory matters incidental to our business, including, but not limited to, product liability claims, employment matters, commercial disputes, intellectual property matters, inclusion as a potentially responsible party for environmental clean-up costs, and litigation in connection with acquisitions and divestitures. We intend to defend ourselves in any such matters and do not currently believe that the outcome of any such matters will have a material adverse effect on our financial condition, results of operations and cash flows.
We may also determine that products manufactured or marketed by us do not meet our specifications, published standards or regulatory requirements. When a quality issue is identified, we investigate the issue and take appropriate corrective action, such as withdrawal of the product from the market, correction of the product at the customer location, notice to the customer of revised labeling and other actions. We have recalled, and/or conducted field alerts relating to, certain of our products from time to time. These activities can lead to costs to repair or replace affected products, temporary interruptions in product sales and action by regulators, and can impact reported results of operations. We currently do not believe that these activities (other than those specifically disclosed herein) have had or will have a material adverse effect on our business or results of operations.
89
Table of Contents
CAREFUSION CORPORATION
NOTES TO CONSOLIDATED AND COMBINED FINANCIAL STATEMENTS
Commitments. The future minimum rental payments for operating leases having initial or remaining non-cancelable lease terms in excess of one year at June 30, 2010, are as follows:
| (in millions) | 2011 | 2012 | 2013 | 2014 | 2015 | Thereafter | Total | ||||||||||||||
| Minimum Rental Payments |
$ | 44 | $ | 38 | $ | 33 | $ | 27 | $ | 22 | $ | 33 | $ | 197 | |||||||
Rental expense relating to operating leases was approximately $59 million, $49 million and $46 million in fiscal years 2010, 2009 and 2008, respectively. Sublease rental income was not material for any period presented herein.
NOTE 14. FINANCIAL INSTRUMENTS AND FAIR VALUE MEASURES
We use derivative instruments to partially mitigate our business exposure to foreign currency exchange risk. We may enter into foreign currency forward contracts to offset some of the foreign exchange risk of expected future cash flows on certain forecasted revenue and expenses, and on certain assets and liabilities. The maximum period of time that we hedge exposure is twelve months.
Cash Flow Hedges. We enter into foreign currency forward contracts to protect the value of anticipated foreign currency revenues and expenses associated with certain forecasted transactions. These derivative instruments are designated and qualify as cash flow hedges. Accordingly, the effective portion of the gain or loss on the derivative instrument is reported as a component of other comprehensive income/(loss) (“OCI”) and reclassified into earnings in the same line item associated with the forecasted transaction and in the same period during which the hedged transaction affects earnings. The ineffective portion of the gain/(loss) on the derivative instrument is recognized in earnings immediately. The cash flow impact of fair value hedges is included in the consolidated and combined statements of cash flows in “Other Accrued Liabilities and Operating Items, Net”.
At June 30, 2010 and 2009, we held forward contracts to hedge probable, but not firmly committed, revenue, inventory purchases and expenses.
The following table shows the notional amount of the outstanding cash flow hedges as of June 30, 2010 and 2009:
| June 30, 2010 |
June 30, 2009 | |||||
| (in millions) | Notional Amount |
Notional Amount | ||||
| Foreign Currency Forward Contracts |
$ | 37 | $ | 160 | ||
As of June 30, 2010, the foreign currency forward contracts are expected to mature through December 2010. Credit risk of these contracts is immaterial as of June 30, 2010 and 2009. The unrealized gain/(loss) included in OCI and the consolidated and combined balance sheets at June 30, 2010 and 2009, as well as the amounts reclassified from OCI to the consolidated and combined statements of income for the fiscal years June 30, 2010, 2009 and 2008 was not material.
The amount of ineffectiveness associated with these derivative instruments was not material.
Fair Value (Non-Designated) Hedges. We enter into foreign currency forward contracts to manage foreign exchange exposure related to intercompany financing transactions and other balance sheet items subject to revaluation that do not meet the requirements for hedge accounting treatment. Accordingly, these derivative instruments are adjusted to current market value at the end of each period. The gain or loss recorded on these
90
Table of Contents
CAREFUSION CORPORATION
NOTES TO CONSOLIDATED AND COMBINED FINANCIAL STATEMENTS
instruments is substantially offset by the remeasurement adjustment on the foreign currency denominated asset or liability. The settlement of the derivative instrument and the remeasurement adjustment on the foreign currency denominated asset or liability are both recorded in the consolidated and combined income statements in “Interest Expense and Other, Net” at the end of each period. The cash flow impact of fair value hedges is included in the consolidated and combined statements of cash flows in “Other Accrued Liabilities and Operating Items, Net”. The maximum period of time that we hedge exposure for foreign currency fair value hedges is 31 days.
The following table summarizes the notional amount of the fair value hedges outstanding as of June 30, 2010 and 2009:
| June 30, 2010 | June 30, 2009 | |||||
| (in millions) | Notional Amount |
Notional Amount | ||||
| Foreign Currency Forward Contracts |
$ | 93 | $ | 314 | ||
The following table summarizes the loss recognized in earnings for fair value hedges for the fiscal years 2010, 2009 and 2008:
| (in millions) | For Fiscal Year Ended June 30, |
||||||||||||
| Fair Value Hedging Instruments | Statement of Income Location | 2010 | 2009 | 2008 | |||||||||
| Foreign Currency Forward Contracts |
Interest Expense and Other, Net | $ | — | $ | (8 | ) | $ | (42 | ) | ||||
The following is a summary of unsettled derivative instruments as of June 30, 2010 and 2009. The amount that we would pay/receive to settle these contracts at the respective dates was not material.
| June 30, 2010 | June 30, 2009 | |||||
| (in millions) | Notional Amount |
Notional Amount | ||||
| Foreign Currency Forward Contracts |
$ | 130 | $ | 474 | ||
Assets and Liabilities Measured at Fair Value on a Recurring Basis. The following table presents information about our financial assets and financial liabilities that are measured at fair value on a recurring basis, and indicates the fair value hierarchy of the valuation techniques we utilize to determine such fair value at June 30, 2010:
| (in millions) | Level 1 | ||
| Financial Assets: |
|||
| Cash Equivalents |
$ | 812 | |
| Other Investments |
9 | ||
| Total |
$ | 821 | |
The cash equivalents balance is comprised of highly liquid investments purchased with a maturity of three months or less from the original purchase date. The other investments balance includes investments in mutual funds classified as other long-term assets, all related to our deferred compensation plan. Both the cash equivalents and other investments were valued based on quoted market prices for identical instruments. We had no material level 2 or level 3 assets or liabilities measured on a recurring basis at June 30, 2010.
91
Table of Contents
CAREFUSION CORPORATION
NOTES TO CONSOLIDATED AND COMBINED FINANCIAL STATEMENTS
NOTE 15. RELATED PARTY TRANSACTIONS AND PARENT COMPANY EQUITY
The following paragraphs discuss related party transactions with Cardinal Health and how they were accounted for in our financial statements.
Allocation of General Corporate Expenses. The consolidated and combined financial statements include expense allocations for certain functions provided by Cardinal Health, including, but not limited to, general corporate expenses related to finance, legal, information technology, human resources, communications, ethics and compliance, shared services, employee benefits and incentives, and share-based compensation. These expenses were allocated to us on the basis of direct usage when identifiable, with the remainder allocated on the basis of revenue, headcount or other appropriate measure. Prior to July 1, 2009, we operated as a component of Cardinal Health, and therefore we were allocated expenses associated with the functions described above. As of July 1, 2009, we began operating as a wholly-owned subsidiary of Cardinal Health and therefore received significantly less expense allocations as the majority of these allocations were replaced with directly incurred expenditures at the CareFusion level. We were allocated $19 million, $406 million and $407 million, for the two months ended August 31, 2009 and the fiscal years ended June 30, 2009 and 2008, respectively, of general corporate expenses incurred by Cardinal Health which are included within SG&A expenses in the consolidated and combined statements of income. Included within the $406 million and $407 million of SG&A expenses allocated to us from Cardinal Health for the fiscal years ended June 30, 2009 and 2008, are $21 million and $23 million, respectively, allocable to discontinued operations. No amount of the $19 million was allocated to discontinued operations for the two months ended August 31, 2009.
On August 31, 2009, we completed the spinoff from Cardinal Health and our Transition Services Agreement (“TSA”), went into effect (see below). Charges incurred as a result of the TSA were $118 million for the fiscal year 2010.
Related Party Sales. Historically, we sold certain medical products and supplies through the medical distribution business of Cardinal Health. Title for these products transferred to Cardinal Health when we sold the products to their medical distribution channels; however, we recognized product revenue on these sales primarily when title transferred to the end customer, which was typically upon receipt by the end customer. Our product revenue related to these related party sales totaled $180 million, $958 million and $933 million for the two months ended August 31, 2009 and fiscal years ended June 30, 2009 and 2008, respectively. Included within these amounts are $72 million, $417 million and $407 million associated with discontinued operations for the two months ended August 31, 2009 and fiscal year ended June 30, 2009 and 2008, respectively.
Inventory held in Cardinal Health distribution centers associated with these sales prior to the spinoff was $93 million at June 30, 2009. Included within the $93 million was $38 million associated with discontinued operations.
Prior to the spinoff, the accounts receivable associated with these customer sales was maintained by Cardinal Health. The amount of accounts receivable allocated to us was $129 million at June 30, 2009. Included within the $129 million was $47 million associated with discontinued operations.
Upon the spinoff, we entered into a distribution agreement with Cardinal Health which states that Cardinal Health will continue to distribute certain of our products and supplies through its medical distribution business. In addition, we entered into an accounts receivable factoring agreement for which we sell certain of our accounts receivable associated with this distribution agreement to Cardinal Health. Title to these products and supplies no longer transfers to Cardinal Health and inventory related to these products is maintained by CareFusion. Service fees related to this agreement were $34 million for fiscal year 2010. Accounts receivable sold under the factoring agreement totaled $606 million for fiscal year 2010.
92
Table of Contents
CAREFUSION CORPORATION
NOTES TO CONSOLIDATED AND COMBINED FINANCIAL STATEMENTS
In addition to the distribution agreement noted above, upon the spinoff, we entered into other agreements with Cardinal Health in which we buy from Cardinal Health and sell to Cardinal Health certain products and services. The product sales and purchases associated with these agreements are utilized for resale by each respective company to their end customers. The service fees and revenues related to these agreements are for a variety of services including the use of the sales force, marketing, sterilization, and warehousing services.
Total product revenue related to these agreements was $240 million for fiscal year 2010. Total product purchases from Cardinal Health were $83 million for fiscal year 2010. Service fees paid to Cardinal Health was $30 million for fiscal year 2010. Service fee revenue from Cardinal Health was $2 million for fiscal year 2010.
At June 30, 2010, we had an outstanding payable balance to Cardinal Health of $27 million. In addition, at June 30, 2010, a receivable was due from Cardinal Health of $84 million.
In connection with the spinoff, we entered into the following agreements with Cardinal Health:
| • | Separation Agreement. The separation agreement sets forth, among other things, our agreements with Cardinal Health regarding the principal transactions that were necessary to separate us from Cardinal Health. It also sets forth other agreements that govern certain aspects of our ongoing relationship with Cardinal Health. These other agreements include: Transfer of Assets and Assumptions of Liabilities; Future Claims; Releases; Indemnifications; Legal Matters; Insurance; and the Distribution of cash and common shares. |
| • | Stockholder’s and Registration Rights Agreement. We and Cardinal Health entered into a stockholder’s and registration rights agreement pursuant to which we agreed that, upon the request of Cardinal Health, we will use our commercially reasonable efforts to effect the registration under applicable federal and state securities laws of any shares of our common stock retained by Cardinal Health. In addition, Cardinal Health agreed to vote any shares of our common stock that it retains immediately after the separation in proportion to the votes cast by our other stockholders. In connection with such agreement, Cardinal Health granted us a proxy to vote its shares of our common stock in such proportion. This proxy, however, will be automatically revoked as to a particular share upon any sale or transfer of such share from Cardinal Health to a person other than Cardinal Health, and neither the voting agreement nor proxy will limit or prohibit any such sale or transfer. |
| • | Transition Services Agreement. We and Cardinal Health entered into a transition services agreement in connection with the separation to provide each other, on a transitional basis, certain administrative, human resources and support services and other assistance consistent with the services provided by the parties to each other before the separation. The charges for the transition services generally are intended to allow the providing company to fully recover the costs directly associated with providing the services, plus all out-of-pocket costs and expenses, generally without profit. The charges of each of the transition services will generally be based on either a pre-determined flat fee or an allocation of the cost incurred by the company providing the service, including certain fees and expenses of third-party service providers. |
| • | Tax Matters Agreement. This agreement governs Cardinal Health’s and CareFusion’s respective rights, responsibilities and obligations with respect to taxes, tax attributes, the preparation and filing of tax returns, the control of audits and other tax proceedings and assistance and cooperation in respect of tax matters. The tax matters agreement also contains restrictions on our ability (and the ability of any member of our group) to take actions that could cause the contribution of the businesses to us by Cardinal Health and the distribution of our common stock to Cardinal Health shareholders in the spinoff to fail to qualify as a tax-free reorganization for United States federal income tax purposes, |
93
Table of Contents
CAREFUSION CORPORATION
NOTES TO CONSOLIDATED AND COMBINED FINANCIAL STATEMENTS
| including entering into, approving or allowing any transaction that results in a sale or other disposition of a substantial portion of our assets or stock and the liquidation or dissolution of us and certain of our subsidiaries. |
| • | Employee Matters Agreement. This agreement governs our compensation and employee benefit obligations with respect to our current and former employees. The employee matters agreement allocates liabilities and responsibilities relating to employee compensation and benefit plans and programs and related matters in connection with the separation, including, among other things, the treatment of outstanding Cardinal Health equity awards and share-based awards, annual and long-term incentive awards, deferred compensation obligations, severance arrangements, retirement plans and welfare benefit obligations. |
| • | Intellectual Property Agreements. We entered into a master intellectual property license agreement with Cardinal Health pursuant to which each party granted a royalty-free, worldwide, non-exclusive, perpetual, irrevocable license under the intellectual property and technology owned by it as a result of the separation (other than the intellectual property and technology licensed under various other agreements) to the other for use in the conduct of the other’s business as of the separation. We entered into a transitional trademark license agreement pursuant to which Cardinal Health and Cardinal Health Technologies granted us a royalty-free, worldwide, non-exclusive, non-transferable, fully paid-up license to use certain of their trademarks, trade names and service marks used in our business as of the separation, or licensed marks, or to allow us sufficient time to (a) rebrand and phase out of use of the licensed marks; and (b) transfer or change any product registrations or regulatory approvals (or applications for either of the foregoing) that are under the name of Cardinal Health or any of its affiliates to our new corporate name. |
| • | License Agreements. Cardinal Health also granted us a royalty-free, worldwide, non-exclusive, perpetual, irrevocable license to certain design specifications and to any patent issued to Cardinal Health under its current patent application for its remote pharmacy order processing system for use by us in our PyxisConnect product line. In addition, Cardinal Health granted us an exclusive license, under certain patents and trademarks, to make (worldwide) and sell (outside of North America and Puerto Rico or any country where Cardinal Health has a distribution relationship with a third-party with respect to certain of its medical products) certain medical products under specified brands for a period of two years. Cardinal Health also granted us a non-exclusive license, under such patents and trademarks and for a period of two years, to make and sell such medical products in other countries where Cardinal Health has a non-exclusive distribution relationship with a third-party with respect to such products. |
| • | Distribution/Supply Agreements. Cardinal Health agreed to provide or distribute products (and related services), on both an exclusive and non-exclusive basis, under various distribution/supply agreements with us and vice versa, pursuant to which one party will supply certain products to the other party for distribution by the other party in certain geographic locations (both domestic and international) or for use by the other party as a component of its own products. |
| • | Miscellaneous Agreements. We entered into various agreements with Cardinal Health for certain specified services relating to (a) the development by us of barcode scanning for pre-filled syringes being developed by Cardinal Health for use in connection with infusion pumps; (b) the provision of gamma sterilization services and warehouse and logistic services by Cardinal Health to us; (c) the manufacture, packaging and provision of related services by Cardinal Health with respect to various surgical procedure kits using our products; (d) referral by Cardinal Health of our products to its customers; and (e) service and ongoing service maintenance for the CardinalASSIST and Valuelink programs owned by Cardinal Health and used by us in our dispensing business. |
94
Table of Contents
CAREFUSION CORPORATION
NOTES TO CONSOLIDATED AND COMBINED FINANCIAL STATEMENTS
Parent Company Equity. Net transfers (to)/from parent are included within Parent Company Investment on the consolidated and combined statements of stockholders’ equity through the spinoff date of August 31, 2009. The components of the net transfers from parent are as follows:
| As of | |||||||||||
| (in millions) | August 31, 2009 |
June 30, 2009 |
June 30, 2008 |
||||||||
| Net Change in Debt Allocated from Parent1 |
$ | 1,281 | $ | 316 | $ | (338 | ) | ||||
| Net Change in Income Tax Accounts |
83 | (67 | ) | (122 | ) | ||||||
| Cash Transferred from Parent for Acquisitions |
— | 5 | 521 | ||||||||
| Cash Repatriation to Parent |
— | — | (174 | ) | |||||||
| Loans to Parent |
— | (608 | ) | (325 | ) | ||||||
| Corporate Push Down |
48 | (22 | ) | 28 | |||||||
| Other |
41 | 337 | (80 | ) | |||||||
| Total Net Transfers (to)/from Parent |
$ | 1,453 | $ | (39 | ) | $ | (490 | ) | |||
| 1 | The debt allocated to us from Cardinal Health at June 30, 2009 was retained by Cardinal Health and not settled for cash; however, as part of the spinoff we paid a $1.374 billion cash dividend to Cardinal Health as consideration for the contribution of the majority of the businesses comprising its clinical and medical products segment. |
All significant intercompany transactions between us and Cardinal Health were included in the consolidated and combined financial statements and are considered to be effectively settled for cash in the consolidated and combined financial statements at the time the transaction is recorded. The total net effect of the settlement of these intercompany transactions is reflected in the consolidated and combined statements of cash flows as a financing activity and in the consolidated and combined balance sheets as “Parent Company Investment” for the periods prior to our spinoff at August 31, 2009.
NOTE 16. SEGMENT INFORMATION
Our operations are principally managed on a products and services basis and are comprised of two reportable segments: Critical Care Technologies and Medical Technologies and Services.
We report segment information based on the management approach. The management approach designates the internal reporting used by the Chief Operating Decision Maker (“CODM”), for making decisions and assessing performance as the source of our reportable segments. The CODM is our Chief Executive Officer. The CODM allocates resources to and assesses the performance of each operating segment using information about its revenues and operating income/(loss) before interest and taxes. We have determined our operating segments as follows based on the information used by the CODM.
Critical Care Technologies. Our dispensing technologies, infusion and respiratory operating segments are aggregated into the Critical Care Technologies segment. This segment develops, manufactures and markets IV medication products, including IV infusion systems, primarily to hospitals, ambulatory surgical centers and transport services. It also provides point-of-care systems that automate the dispensing of medications and supplies in hospitals and other healthcare facilities. Finally, it develops, manufactures and markets products for diagnosis and treatment of pulmonary and sleep-related disorders primarily to hospitals, clinics, private physicians and research centers.
We determined the three operating segments within Critical Care Technologies qualify for aggregation based on the criteria that: (i) the operating segments have similar economic characteristics; and (ii) the segments have
95
Table of Contents
CAREFUSION CORPORATION
NOTES TO CONSOLIDATED AND COMBINED FINANCIAL STATEMENTS
similar basic characteristics in each of the following areas: the nature of the products or services, the nature of the production process, the type or class of customer for their products or services, the methods used to distribute their products or provide their services and the nature of the regulatory environment.
Medical Technologies and Services. This segment provides single-use medical products used in surgical and vascular access procedures to hospitals, ambulatory surgical centers and other healthcare settings. It also develops, manufactures and markets reusable stainless-steel surgical instruments and a variety of medical devices used primarily by interventional radiologists and surgeons in combination with certain image guidance technologies primarily to hospitals. Finally, it develops, manufactures and markets a line of neurological and vascular diagnostic and monitoring products to hospitals and other healthcare facilities such as private practice and outpatient clinics, ambulatory surgery centers and physician offices.
We evaluate the performance of the segments based upon, among other things, segment profit. Segment profit is segment revenue less segment cost of products sold, SG&A expenses, research and development expenses and restructuring and acquisition integration charges. With the exception of goodwill, we do not identify or allocate assets by operating segment; accordingly, segment related disclosures with respect to assets have been omitted.
The following table presents information about our reporting segments for the fiscal years ended June 30, 2010, 2009 and 2008:
| (in millions) | Critical Care Technologies |
Medical Technologies and Services1 |
Total | ||||||
| Fiscal Year 2010: |
|||||||||
| External Revenues |
$ | 2,644 | $ | 1,285 | $ | 3,929 | |||
| Depreciation and Amortization |
122 | 51 | 173 | ||||||
| Operating Income |
395 | 65 | 460 | ||||||
| Capital Expenditures |
104 | 37 | 141 | ||||||
| Fiscal Year 2009: |
|||||||||
| External Revenues |
$ | 2,429 | $ | 1,166 | $ | 3,595 | |||
| Depreciation and Amortization |
112 | 58 | 170 | ||||||
| Operating Income |
354 | 90 | 444 | ||||||
| Capital Expenditures |
85 | 44 | 129 | ||||||
| Fiscal Year 2008: |
|||||||||
| External Revenues |
$ | 2,603 | $ | 1,060 | $ | 3,663 | |||
| Depreciation and Amortization |
111 | 35 | 146 | ||||||
| Operating Income |
512 | 18 | 530 | ||||||
| Capital Expenditures |
152 | 52 | 204 | ||||||
| 1 | Segment results for the Medical Technologies and Services segment have been adjusted for discontinued operations. See Note 2. |
96
Table of Contents
CAREFUSION CORPORATION
NOTES TO CONSOLIDATED AND COMBINED FINANCIAL STATEMENTS
A reconciliation of total segment operating income to consolidated income before income tax is presented below for the years ended June 30:
| (in millions) | 2010 | 2009 | 2008 | ||||||
| Total Segment Operating Income |
$ | 460 | $ | 444 | $ | 530 | |||
| Gain on the Sale of Assets |
12 | — | — | ||||||
| Operating Income |
472 | 444 | 530 | ||||||
| Interest Expense and Other, Net (Including Net Interest Expense Allocated from Parent of $80 and $88 for Fiscal Year 2009 and 2008, respectively) |
115 | 101 | 87 | ||||||
| Income Before Income Tax |
$ | 357 | $ | 343 | $ | 443 | |||
The following table presents revenue and net property and equipment by geographic area:
| Revenue | Property and Equipment, Net | ||||||||||||||
| For Fiscal Year Ended June 30, |
As of June 30, | ||||||||||||||
| (in millions) | 2010 | 2009 | 2008 | 2010 | 2009 | ||||||||||
| United States |
$ | 2,710 | $ | 2,465 | $ | 2,592 | $ | 338 | $ | 271 | |||||
| International |
1,219 | 1,130 | 1,071 | 111 | 124 | ||||||||||
| Total |
$ | 3,929 | $ | 3,595 | $ | 3,663 | $ | 449 | $ | 395 | |||||
NOTE 17. PRODUCT WARRANTIES
We offer warranties on certain products for various periods of time. We accrue for the estimated cost of product warranties at the time revenue is recognized. Our product warranty liability reflects management’s best estimate of probable liability based on current and historical product sales data and warranty costs incurred.
The table below summarizes the changes in the carrying amount of the liability for product warranties for the fiscal years ended June 30, 2010, 2009 and 2008:
| (in millions) | Total | |||
| Balance at June 30, 2008 |
$ | 28 | ||
| Warranty Accrual |
29 | |||
| Warranty Claims Paid |
(26 | ) | ||
| Balance at June 30, 2009 |
31 | |||
| Warranty Accrual |
19 | |||
| Warranty Claims Paid |
(19 | ) | ||
| Adjustments to Preexisting Accruals |
(7 | ) | ||
| Balance at June 30, 2010 |
$ | 24 | ||
As of June 30, 2010, 2009 and 2008, approximately $10 million, $20 million and $18 million, respectively, of the ending liability balances related to accruals for product recalls.
NOTE 18. SHARE-BASED COMPENSATION
We maintain a stock incentive plan that provides for awards of non-qualified and incentive stock options, restricted stock and restricted stock units and performance stock units for the benefit of certain of our officers,
97
Table of Contents
CAREFUSION CORPORATION
NOTES TO CONSOLIDATED AND COMBINED FINANCIAL STATEMENTS
directors and employees. Under CareFusion’s 2009 Long-Term Incentive Plan (the “Plan”), there are 40.0 million shares of common stock reserved and authorized for issuance. At June 30, 2010, awards (net of prevesting forfeitures) have been granted with respect to 17.4 million shares of the 40.0 million reserved shares, with 22.6 million shares available for future awards. The number of shares to be issued in connection with performance stock units is not determined until the end of their respective performance period and are therefore included at the current estimate of payout shares (see below). New shares are issued for settlement of awards under the Plan.
Spinoff from Cardinal Health
At the time of the spinoff, Cardinal Health converted or adjusted outstanding stock options, restricted stock and restricted stock units (collectively, “share-based awards”) with respect to Cardinal Health common shares held by Cardinal Health and CareFusion employees. The manner of conversion for each employee was determined based on the date of the original share-based grant and the employment status of the employee at the spinoff date of August 31, 2009.
Each Cardinal Health stock option was converted or adjusted based on the following:
| • | Stock Options Granted on or Prior to September 26, 2007. Each option granted on or prior to September 26, 2007 was converted into an adjusted Cardinal Health stock option and a CareFusion stock option. The exercise prices of the CareFusion stock option and the adjusted Cardinal Health stock option and the number of shares subject to each such stock option reflected a mechanism that was intended to preserve the intrinsic value of the original Cardinal Health stock option. |
| • | Stock Options Granted After September 26, 2007. In general, each stock option granted after September 26, 2007 that was held by an employee of CareFusion at the spinoff date was converted into a CareFusion stock option, subject to an adjustment mechanism intended to preserve the intrinsic value of such stock options. |
Similarly, each Cardinal Health restricted stock or restricted stock unit was converted based on the following:
| • | Restricted Stock and Restricted Stock Units Granted on or Prior to September 26, 2007. Each restricted stock or restricted stock unit granted on or prior to September 26, 2007 received for the unvested portion thereof, CareFusion restricted stock or restricted stock units, as applicable, representing the right to receive 0.5 shares of CareFusion common stock for each Cardinal Health common share subject to the award. The underlying Cardinal Health restricted stock or restricted stock units remain in effect unadjusted. |
| • | Restricted Stock and Restricted Stock Units Granted After September 26, 2007. In general, each restricted stock or restricted stock unit granted after September 26, 2007 that was held by an employee of CareFusion at the spinoff date was converted into a CareFusion restricted stock or restricted stock unit, intended to preserve the fair market value of the awards. |
The fair value of the Cardinal Health stock awards and the converted CareFusion stock awards immediately following the spinoff was slightly higher than the fair value of such stock awards immediately prior to the spinoff. As a result, we incurred incremental compensation expense of less than $1 million that will be recognized over the remaining vesting period of the related unvested share-based awards.
We are responsible for fulfilling all share-based awards related to CareFusion common stock and Cardinal Health is responsible for fulfilling all share-based awards related to Cardinal Health common shares, regardless of
98
Table of Contents
CAREFUSION CORPORATION
NOTES TO CONSOLIDATED AND COMBINED FINANCIAL STATEMENTS
whether the employee holding the share-based award is an employee of CareFusion or Cardinal Health. We record share-based compensation expense for the share-based awards held by our employees, regardless of whether such share-based awards are based on common stock of CareFusion or common shares of Cardinal Health, with the offsetting impact recorded to “Additional Paid-In Capital” in our audited consolidated and combined balance sheets.
Cardinal Health Option Exchange Program
On June 19, 2009, Cardinal Health commenced a stock option exchange program whereby participants (including CareFusion employees) could elect to exchange certain Cardinal Health stock options with exercise prices substantially above the current grant price for a lesser number of Cardinal Health stock options with a lower exercise price. This stock option exchange program was completed on July 17, 2009. Certain of the awards exchanged in the stock option exchange program were converted or adjusted in connection with the spinoff. Taking into account the conversion and/or adjustment, stock options to purchase 1.1 million shares of CareFusion common stock were exchanged (cancelled) and replacement stock options for 0.2 million shares of CareFusion common stock were made; no additional compensation expense was recorded.
Share-Based Awards
Stock Options. Under the Plan, stock options generally vest in equal annual installments over three years and are exercisable for periods up to seven years from the date of grant at a price equal to the fair market value of CareFusion’s common stock at the date of grant.
A summary of CareFusion stock option activity related to CareFusion and Cardinal Health employees for the fiscal year ended June 30, 2010 is as follows. All awards granted between July 1, 2009 and August 31, 2009 have been adjusted to reflect the conversion ratio as of the date of the spinoff as all stock options prior to the spinoff were stock options of Cardinal Health. With respect to the Cardinal Health stock options granted prior to September 26, 2007, the converted CareFusion stock options retained the vesting schedule and expiration date of the original Cardinal Health stock options.
| (in millions, except per share amounts) | Shares Subject to Options |
Weighted- Average Exercise Price |
Weighted- Average Remaining Contractual Life (Years) |
Aggregate Intrinsic Value | |||||||
| Balance at July 1, 2009 |
9.5 | $ | 31.91 | ||||||||
|
Granted1 |
3.4 | $ | 20.61 | ||||||||
| Exercised |
(0.4 | ) | $ | 18.74 | |||||||
|
Canceled/Forfeited1 |
(1.6 | ) | $ | 21.16 | |||||||
| Conversion of Cardinal Health stock options to CareFusion stock options |
1.6 | $ | 19.65 | ||||||||
| Outstanding, June 30, 2010 |
12.5 | $ | 28.84 | 3.95 | $ | 10 | |||||
| Exercisable, June 30, 2010 |
7.9 | $ | 32.43 | 3.04 | $ | 1 | |||||
| 1 | Includes 0.2 million stock options granted and 1.1 million stock options cancelled as a result of the option exchange program. |
99
Table of Contents
CAREFUSION CORPORATION
NOTES TO CONSOLIDATED AND COMBINED FINANCIAL STATEMENTS
The following table summarizes activity related to CareFusion stock options exercised during the fiscal year ended June 30, 2010 and 2009:
| Fiscal Year Ended June 30, | ||||||
| (in millions) | 2010 | 2009 | ||||
| Proceeds From Stock Options Exercised |
$ | 8 | $ | n/a | ||
| Intrinsic Value of Stock Options Exercised |
2 | 1 | ||||
| Tax Benefit Related to Stock Options Exercised |
1 | — | ||||
Cardinal Health received the cash proceeds for stock options exercised prior to September 1, 2009, and therefore, no cash proceeds are presented for stock options exercised prior to that date.
The fair value of the stock options granted during the fiscal year ended June 30, 2009 were valued by Cardinal Health utilizing a Lattice valuation model. The fair value of stock options granted by CareFusion during the fiscal year ended June 30, 2010 and subsequent to the spinoff was valued by CareFusion utilizing a Black-Scholes-Merton valuation model. The Black-Scholes-Merton model was utilized subsequent to the spinoff based on a review of facts and circumstances associated with the anticipated exercise patterns of employees at a new publicly traded company. Had we used the Black-Scholes-Merton valuation model instead of the Lattice valuation model prior to the spinoff, it would not have resulted in a material impact on our financial condition, results of operations or cash flows.
The following assumptions were utilized in deriving the fair value for awards granted under the Black-Scholes-Merton model for the fiscal year ended June 30, 2010 and the Lattice model for the fiscal year ended June 30, 2009.
| Fiscal Year
Ended June 30, | ||||
| 2010 | 2009 | |||
| Risk Free Interest Rate |
2.28% — 2.44% |
0.03% — 3.48% | ||
| Expected Term (years) |
5.0 | 4.5 — 7.0 | ||
| Volatility |
32.1% | 27.0% —30.0% | ||
| Dividend Yield |
—% | 1.0% — 2.33% | ||
| Weighted-Average Grant Date Fair Value |
$6.70 | $7.77 | ||
Black-Scholes-Merton. The risk-free rate is based on an United States Treasury equivalent instrument with the same term as the expected term. The expected term of the stock option represents the estimated period of time until exercise and is based on the vesting period of the award and the estimated exercise patterns of employees. Volatility is based on a historical volatility of a peer group of five companies that have similar revenues, earnings and market capitalization, as well as operate in the same industry as CareFusion, and is based on a volatility measure over the approximate expected term of the stock options. We do not currently plan to pay dividends on our common stock and therefore the dividend yield percentage is set at zero.
The Black-Scholes-Merton option valuation model was developed for use in estimating the fair value of traded stock options which have no vesting restrictions and are fully transferable, and includes management’s estimates of the relative inputs. Though we believe this is the best valuation technique for our stock options, our estimate of fair value may differ from other valuation models.
Lattice Model. The expected term of the Cardinal Health stock options granted prior to the spinoff was calculated based on historical Cardinal Health employee exercise behavior. The risk-free rate was based on the
100
Table of Contents
CAREFUSION CORPORATION
NOTES TO CONSOLIDATED AND COMBINED FINANCIAL STATEMENTS
United States Treasury yield curve at the time of the grant. Volatility was based on implied volatility from traded options of Cardinal Health’s stock and historical volatility over a period of time commensurate with the contractual term of seven years. The dividend yield was based on the actual dividend yield at the time of grant with the assumption of a consistent rate of dividends over the life of the grant.
Restricted Stock and Restricted Stock Units. Under the Plan, restricted stock and restricted stock units (“restricted stock awards”) generally vest in equal installments over three years. The fair value of restricted stock awards is based on the closing price of our common stock on the date of grant. The weighted-average grant date fair values of restricted stock awards granted was $20.82 and $28.64 for the fiscal year ended June 30, 2010 and 2009, respectively.
All restricted stock awards granted between July 1, 2009 and August 31, 2009 have been adjusted to reflect the conversion ratio as of the date of the spinoff as all restricted stock awards prior to the spinoff were associated with Cardinal Health common shares. With respect to restricted stock awards granted prior to September 26, 2007, the converted CareFusion restricted stock awards retained the vesting schedule of the original Cardinal Health restricted stock awards. A summary of CareFusion restricted stock awards related to CareFusion and Cardinal Health employees for the fiscal year ended June 30, 2010 is as follows:
| (in millions, except per share amounts) |
Shares | Weighted- Average Grant Date Fair Value | ||||
| Balance at July 1, 2009 |
1.2 | $ | 30.85 | |||
| Granted |
2.7 | $ | 20.82 | |||
| Vested |
(0.5 | ) | $ | 23.22 | ||
| Forfeited |
(0.7 | ) | $ | 21.39 | ||
| Conversion of Cardinal Health Restricted Share Awards to CareFusion Restricted Stock Awards |
0.7 | $ | 19.65 | |||
| Outstanding, June 30, 2010 |
3.4 | $ | 23.51 | |||
Performance Stock Units. Performance stock units provide share-based compensation to participants for which vesting is contingent upon company performance relative to a specific financial target, as defined in the award agreement. Performance stock units granted during the fiscal year ended June 30, 2010 vest between two and four years after the grant date on a sliding scale of units, depending on the timing of achievement of a two-year average cash flow target, as defined in the award agreement. The amount of compensation expense recognized, as well as the period over which the awards are expected to vest, is based on management’s estimate of the most likely outcome. Management’s estimate of the likelihood of achieving these performance targets and the timing of achievement of such targets may materially change over time based on facts and circumstances. The fair value of performance stock units is based on the closing price of the company’s common stock on the date of grant.
The following table depicts the amount of units that will be paid out depending on the timing of achieving the performance target after the grant date (measured at the fiscal year end):
| Year |
Percent Payout of Awarded Units |
||||||
| 2 | 150 | % | |||||
| 3 | 100 | % | |||||
| 4 | 50 | % |
101
Table of Contents
CAREFUSION CORPORATION
NOTES TO CONSOLIDATED AND COMBINED FINANCIAL STATEMENTS
No payout is earned if the performance target is not achieved by year four. Compensation expense for the fiscal year ended June 30, 2010 was based on an estimate of achieving the performance target in year two and therefore a 150% payout of awarded units.
We granted 0.4 million performance stock units during fiscal year ended June 30, 2010, with weighted-average grant date fair values of $20.79. No performance stock units were forfeited or vested in the fiscal year ended June 30, 2010.
Accounting for Share-Based Compensation. Expense for share-based payment transactions with employees is recognized in the income statement over the period during which an employee provides the requisite service in exchange for the award, based on their award’s fair value. Most stock options and restricted stock and restricted stock units vest ratably over a three-year vesting period. Share-based compensation expense associated with these graded-vesting awards is recognized using the straight-line method over the vesting period. Stock options generally have a seven-year contractual term. Total pre-tax share-based compensation expense was approximately $67 million and $56 million for the fiscal year ending June 30, 2010 and 2009, respectively. Share-based compensation expense was based on an allocation from Cardinal Health of $4 million during the two month period from July 1, 2009 through August 31, 2009 and for the entire fiscal years ended June 30, 2009 and 2008. The income tax benefit related to the share-based compensation expense was $18 million and $22 million for the fiscal year ended June 30, 2010 and 2009, respectively. We classify share-based compensation within SG&A expense to correspond with the same line item as the majority of the cash compensation paid to employees.
As of June 30, 2010, our total unrecognized share-based compensation expense related to nonvested share-based compensation awards, adjusted for estimated forfeitures, was $61 million. This compensation expense is expected to be recognized over a weighted-average period of approximately 2.0 years.
NOTE 19. EMPLOYEE SAVINGS PLAN
Substantially all of our domestic non-union employees are eligible to be enrolled in the company-sponsored retirement savings plans, which include features under Section 401(k) of the Code and provide for company matching. Contributions to the plans are determined by our board of directors and are subject to certain minimum requirements as specified in the plans. The total expense for our employee retirement benefit plans was $37 million, $32 million and $29 million for fiscal years 2010, 2009 and 2008, respectively.
102
Table of Contents
CAREFUSION CORPORATION
NOTES TO CONSOLIDATED AND COMBINED FINANCIAL STATEMENTS
NOTE 20. SELECTED QUARTERLY FINANCIAL DATA (UNAUDITED)
The following is selected quarterly financial data for fiscal years 2010 and 2009.
| (in millions) | First Quarter |
Second Quarter |
Third Quarter |
Fourth Quarter | ||||||||||
| Fiscal Year 2010 |
||||||||||||||
| Revenue |
$ | 923 | $ | 1,019 | $ | 952 | $ | 1,035 | ||||||
| Gross Margin |
451 | 478 | 452 | 485 | ||||||||||
| Selling, General and Administrative Expenses |
297 | 305 | 316 | 310 | ||||||||||
| Income (Loss) from Continuing Operations |
55 | 73 | (9 | ) | 52 | |||||||||
| Income (Loss) from Discontinued Operations, Net of Tax1 |
26 | (3 | ) | — | — | |||||||||
| Net Income (Loss)2 |
81 | 70 | (9 | ) | 52 | |||||||||
| Per Share Amounts:3 |
||||||||||||||
| Basic Earnings (Loss) per Common Share: |
||||||||||||||
| Continuing Operations |
0.25 | 0.33 | (0.04 | ) | 0.24 | |||||||||
| Discontinued Operations |
0.12 | (0.01 | ) | — | — | |||||||||
| Basic Earnings (Loss) per Common Share |
0.37 | 0.32 | (0.04 | ) | 0.24 | |||||||||
| Diluted Earnings (Loss) per Common Share: |
||||||||||||||
| Continuing Operations |
0.25 | 0.33 | (0.04 | ) | 0.23 | |||||||||
| Discontinued Operations |
0.12 | (0.01 | ) | — | — | |||||||||
| Diluted Earnings (Loss) per Common Share |
0.37 | 0.32 | (0.04 | ) | 0.23 | |||||||||
| Weighted-Average Number of Common Shares Outstanding: |
||||||||||||||
| Basic |
220.6 | 220.8 | 221.6 | 221.8 | ||||||||||
|
Diluted4 |
221.2 | 222.2 | 221.6 | 224.0 | ||||||||||
| 1 | Reflects impact of (a) removing certain businesses that manufacture and sell surgical and exam gloves, drapes and apparel and fluid management products in the United States markets that were previously part of the Clinical and Medical Products segment of Cardinal Health and were retained by Cardinal Health upon the spinoff, and (b) the divestiture of the company’s Audiology business. |
| 2 | Financial results for the fourth quarter includes a $12 million pre-tax gain ($1 million loss after-tax) on sale of our Research Services business. |
| 3 | Basic and diluted earnings per share are computed independently for each of the components and quarters presented. Therefore, the sum of quarterly basic and diluted per share information may not equal annual basic and diluted earnings per share. Additionally, the sum of the per share components within the quarters may not equal the per share amounts presented. |
| 4 | Dilutive shares outstanding equal basic shares outstanding for the third quarter as the impact would be anti-dilutive. |
103
Table of Contents
CAREFUSION CORPORATION
NOTES TO CONSOLIDATED AND COMBINED FINANCIAL STATEMENTS
| (in millions) | First Quarter |
Second Quarter |
Third Quarter |
Fourth Quarter | ||||||||
| Fiscal Year 2009 |
||||||||||||
| Revenue |
$ | 915 | $ | 969 | $ | 844 | $ | 867 | ||||
| Gross Margin1 |
437 | 474 | 418 | 402 | ||||||||
| Selling, General and Administrative Expenses |
280 | 256 | 262 | 257 | ||||||||
| Income from Continuing Operations |
30 | 107 | 88 | 65 | ||||||||
| Income from Discontinued Operations, Net of Tax2 |
83 | 81 | 83 | 31 | ||||||||
| Net Income1 |
113 | 188 | 171 | 96 | ||||||||
| Per Share Amounts:3 |
||||||||||||
| Basic Earnings per Common Share: |
||||||||||||
| Continuing Operations |
0.14 | 0.48 | 0.40 | 0.30 | ||||||||
| Discontinued Operations |
0.38 | 0.37 | 0.38 | 0.14 | ||||||||
| Basic Earnings per Common Share |
0.51 | 0.85 | 0.78 | 0.44 | ||||||||
| Diluted Earnings per Common Share: |
||||||||||||
| Continuing Operations |
0.14 | 0.48 | 0.40 | 0.30 | ||||||||
| Discontinued Operations |
0.38 | 0.37 | 0.38 | 0.14 | ||||||||
| Diluted Earnings per Common Share |
0.51 | 0.85 | 0.78 | 0.44 | ||||||||
| Weighted-Average Number of Common Shares Outstanding:4 |
||||||||||||
| Basic |
220.5 | 220.5 | 220.5 | 220.5 | ||||||||
| Diluted |
220.5 | 220.5 | 220.5 | 220.5 | ||||||||
| 1 | Includes charges of approximately $1 million and $18 million related to product recalls during the second and third quarters, respectively. |
| 2 | Reflects impact of (a) removing certain businesses that manufacture and sell surgical and exam gloves, drapes and apparel and fluid management products in the United States markets that were previously part of the Clinical and Medical Products segment of Cardinal Health and were retained by Cardinal Health upon the spinoff, and (b) the divestiture of the company’s Audiology business. |
| 3 | Basic and diluted earnings per share are computed independently for each of the components and quarters presented. Therefore, the sum of quarterly basic and diluted per share information may not equal annual basic and diluted earnings per share. Additionally, the sum of the per share components within the quarters may not equal the per share amounts presented. |
| 4 | For fiscal year 2009, basic and diluted earnings per common share are computed using the number of common stock outstanding on August 31, 2009, the date which CareFusion common stock was distributed to shareholders of Cardinal Health. |
NOTE 21. SUBSEQUENT EVENTS
On August 10, 2010, we announced a global restructuring program pursuant to which we expect to reduce our cost structure and streamline operations. As part of this restructuring, we anticipate reducing our global workforce by approximately 700 positions and expect the restructuring activities to be substantially complete by the end of fiscal year 2011. The pre-tax expense and cash outlay for the program is estimated to be approximately $40 million to $50 million in fiscal year 2011, primarily related to one-time employee separation benefits and other costs.
104
Table of Contents
| ITEM 9. | CHANGES IN AND DISAGREEMENTS WITH ACCOUNTANTS ON ACCOUNTING AND FINANCIAL DISCLOSURE |
None.
| ITEM 9A. | CONTROLS AND PROCEDURES |
Disclosure Controls and Procedures
Our management, with the participation of our Chief Executive Officer and our Chief Financial Officer, has evaluated the effectiveness of our disclosure controls and procedures (as such term is defined in Rules 13a-15(e) and 15d-15(e) under the Securities Exchange Act of 1934, as amended) as of the end of the period covered by this report. Based on that evaluation, the company’s management, including the Chief Executive Officer and Chief Financial Officer, has concluded that the company’s disclosure controls and procedures were effective as of the end of such period.
Internal Control over Financial Reporting
Our management is responsible for establishing and maintaining adequate internal control over financial reporting, as defined in Exchange Act Rule 13a-15(f). Management’s annual report on internal control over financial reporting and the report of independent registered public accounting firm are incorporated by reference to pages 105 and 106 of this Annual Report on Form 10-K.
Changes in Internal Control over Financial Reporting
In connection with the evaluation required by Exchange Act Rule 13a-15(d), our management, including the Chief Executive Officer and Chief Financial Officer, concluded that no changes in our internal control over financial reporting occurred during the period covered by this report that have materially affected, or are reasonably likely to materially affect, our internal control over financial reporting.
Management’s Report on Internal Control over Financial Reporting
Our management is responsible for establishing and maintaining adequate internal control over financial reporting (as defined in Rule 13a-15(f) and 15d-15(f) under the Securities Exchange Act of 1934, as amended). Our system of internal control over financial reporting is designed to provide reasonable assurance to our management and Board of Directors regarding the preparation and fair presentation of the consolidated financial statements for external purposes in accordance with generally accepted accounting principles.
Our management, under the supervision of the Chief Executive Officer and the Chief Financial Officer, assessed the effectiveness of our internal control over financial reporting as of June 30, 2010. In making this assessment, we used the framework included in Internal Control — Integrated Framework issued by the Committee of Sponsoring Organizations of the Treadway Commission. Based on our evaluation under the criteria set forth in Internal Control — Integrated Framework, management concluded that our internal control over financial reporting was effective as of June 30, 2010.
Because of the inherent limitations, internal control over financial reporting may not prevent or detect misstatements. Projections of any evaluation of effectiveness to future periods are subject to the risks that controls may become inadequate because of changes in conditions or that the degree of compliance with the policies or procedures may deteriorate.
The effectiveness of our internal control over financial reporting as of June 30, 2010, has been audited by Ernst & Young LLP, an independent registered public accounting firm, as stated in their report, which is included within this Annual Report on Form 10-K.
105
Table of Contents
REPORT OF INDEPENDENT REGISTERED PUBLIC ACCOUNTING FIRM
The Board of Directors and
Stockholders of CareFusion Corporation
We have audited CareFusion Corporation’s internal control over financial reporting as of June 30, 2010, based on criteria established in Internal Control — Integrated Framework issued by the Committee of Sponsoring Organizations of the Treadway Commission (the COSO criteria). CareFusion Corporation’s management is responsible for maintaining effective internal control over financial reporting, and for its assessment of the effectiveness of internal control over financial reporting included in the accompanying Management’s Report on Internal Control over Financial Reporting. Our responsibility is to express an opinion on the company’s internal control over financial reporting based on our audit.
We conducted our audit in accordance with the standards of the Public Company Accounting Oversight Board (United States). Those standards require that we plan and perform the audit to obtain reasonable assurance about whether effective internal control over financial reporting was maintained in all material respects. Our audit included obtaining an understanding of internal control over financial reporting, assessing the risk that a material weakness exists, testing and evaluating the design and operating effectiveness of internal control based on the assessed risk, and performing such other procedures as we considered necessary in the circumstances. We believe that our audit provides a reasonable basis for our opinion.
A company’s internal control over financial reporting is a process designed to provide reasonable assurance regarding the reliability of financial reporting and the preparation of financial statements for external purposes in accordance with generally accepted accounting principles. A company’s internal control over financial reporting includes those policies and procedures that (1) pertain to the maintenance of records that, in reasonable detail, accurately and fairly reflect the transactions and dispositions of the assets of the company; (2) provide reasonable assurance that transactions are recorded as necessary to permit preparation of financial statements in accordance with generally accepted accounting principles, and that receipts and expenditures of the company are being made only in accordance with authorizations of management and directors of the company; and (3) provide reasonable assurance regarding prevention or timely detection of unauthorized acquisition, use or disposition of the company’s assets that could have a material effect on the financial statements.
Because of its inherent limitations, internal control over financial reporting may not prevent or detect misstatements. Also, projections of any evaluation of effectiveness to future periods are subject to the risk that controls may become inadequate because of changes in conditions, or that the degree of compliance with the policies or procedures may deteriorate.
In our opinion, CareFusion Corporation maintained, in all material respects, effective internal control over financial reporting as of June 30, 2010, based on the COSO criteria.
We also have audited, in accordance with the standards of the Public Company Accounting Oversight Board (United States), the consolidated and combined balance sheets of CareFusion Corporation as of June 30, 2010 and 2009, and the related consolidated and combined statements of income, stockholders’ equity, and cash flows for each of the three years in the period ended June 30, 2010 and our report dated August 19, 2010 expressed an unqualified opinion thereon.
/s/ Ernst & Young LLP
San Diego, California
August 19, 2010
106
Table of Contents
| ITEM 9B. | OTHER INFORMATION |
None.
107
Table of Contents
| ITEM 10. | DIRECTORS, EXECUTIVE OFFICERS AND CORPORATE GOVERNANCE |
Information concerning Directors, including committees of our Board of Directors, will appear under the captions “Item 1 — Election of Directors,” “Board of Directors Information,” “Board of Directors and Committees of the Board,” and “Governance of Our Company,” in our definitive proxy statement for our 2010 Annual Meeting of Stockholders (the “2010 Proxy Statement”). Such information is incorporated herein by reference. The information in the 2010 Proxy Statement set forth under the caption “Section 16(a) Beneficial Ownership Reporting Compliance” is incorporated herein by reference. Information regarding stockholder communications with our Board of Directors may be found under the caption “Governance of Our Company” in our 2010 Proxy Statement and is incorporated herein by reference.
Executive Officers of the Registrant
The following table sets forth information, as of August 10, 2010, with respect to the individuals serving as our executive officers:
| Name | Age | Position | ||
| David L. Schlotterbeck |
63 | Chairman and Chief Executive Officer | ||
| Edward J. Borkowski |
51 | Chief Financial Officer | ||
| Dwight Winstead |
61 | Chief Operating Officer | ||
| Vivek Jain |
38 | President, Medical Technologies and Services | ||
| Thomas Leonard |
42 | President, Dispensing Technologies | ||
| Cathy Cooney |
59 | Executive Vice President, Human Resources | ||
| Joan Stafslien |
46 | Executive Vice President, General Counsel, Chief Compliance Officer and Secretary | ||
| Jean Maschal |
59 | Senior Vice President, Controller and Chief Accounting Officer |
Mr. Schlotterbeck is the Chairman of our board of directors and our Chief Executive Officer. Prior to the spinoff, he served as Vice Chairman of Cardinal Health since January 2008 and Chief Executive Officer, Clinical and Medical Products of Cardinal Health since August 2006. He served as Chairman and Chief Executive Officer — Clinical Technologies and Services of Cardinal Health from September 2004 to August 2006. He was President of ALARIS Medical Systems, Inc., or Alaris, from July 2004, when Cardinal Health acquired Alaris, until August 2006. He was President and Chief Executive Officer and a director of Alaris from April 1999 to June 2004.
Mr. Borkowski is our Chief Financial Officer. Prior to joining us in May 2009, he was the Chief Financial Officer of Mylan Inc. from March 2002 to May 2009 and Executive Vice President of Mylan from October 2007 to March 2009. Prior to joining Mylan, beginning in 1999, he was employed by the Consumer Healthcare Group of Pharmacia Corporation, a pharmaceutical company that merged with Pfizer in 2003, where he served as Assistant Vice President, North American Finance and Administration and later as Vice President, Global Finance and Information Technology. He served in various finance positions for Wyeth, a company specializing in pharmaceuticals, consumer health care products, and animal health care products (then known as American Home Products Corporation), from 1992 to 1999.
Mr. Winstead is our Chief Operating Officer. Prior to the spinoff, he served as Group President, Clinical and Medical Products of Cardinal Health since July 2008. He served as Group President, Clinical Technologies and Services from July 2006 to July 2008, and President and Chief Operating Officer of Clinical Technologies and Services of Cardinal Health from September 2004 to July 2006. From May 2004 to January 2006, he also served as Group President and President, Pyxis Products. He was Cardinal Health’s Group President and President, Clinical Services and Consulting from September 2002 to May 2004 and President, Cardinal Health Provider Pharmacy Services from July 2000 to September 2002. He served as President of Owen Healthcare, Inc. (a subsidiary of Cardinal Health) from May 1997 to July 2000.
108
Table of Contents
Mr. Jain is our President, Medical Technologies and Services. Prior to the spinoff, he served as Executive Vice President — Strategy and Corporate Development of Cardinal Health since August 2007. Prior to joining Cardinal Health, from May 2006 to August 2007 he served as Senior Vice President/Head of Healthcare Strategy, Business Development and M&A for the Philips Medical Systems business of Koninklijke Philips Electronics N.V., an electronics company. He was an investment banker at J.P. Morgan Securities, Inc., an investment banking firm, from July 1994 to April 2006. His last position with J.P. Morgan was as Managing Director/Co-Head of Global Healthcare Investment Banking from April 2002 to April 2006.
Mr. Leonard is our President, Dispensing Technologies. Prior to the spinoff, he served as Senior Vice President and General Manager, Clinical Services of Cardinal Health since June 2008. Prior to joining Cardinal Health, from June 2005 to June 2008, he was Senior Vice President and General Manager, Ambulatory Solutions of McKesson Corporation, a healthcare services company. From July 2000 to June 2005 he was Executive Vice President of Operations at Picis, Inc., a provider of acute care products and services.
Ms. Cooney is our Executive Vice President, Human Resources. Prior to the spinoff, she served as Senior Vice President, Human Resources — Clinical and Medical Products of Cardinal Health since July 2008. She was Senior Vice President, Human Resources — Clinical Technologies and Services of Cardinal Health from September 2004 to July 2008 and Senior Vice President, Human Resources — Leadership Development of Cardinal Health from January 2003 to September 2004. From March 2002 to January 2003 she was Vice President, Strategic Staffing and Diversity of Cardinal Health. She served as Vice President, Diversity from July 2001 to March 2002 and Vice President and General Manager, Cardinal Health Staffing Network, from May 2000 to July 2001.
Ms. Stafslien is our Executive Vice President, General Counsel, Chief Compliance Officer and Secretary. Ms. Stafslien was previously our Executive Vice President, General Counsel and Secretary, and effective June 2010, assumed the additional role of Chief Compliance Officer. Prior to the spinoff, she served as Senior Vice President and General Counsel, Clinical and Medical Products of Cardinal Health since July 2008. She was Senior Vice President and General Counsel, Clinical Technologies and Services of Cardinal Health, from August 2004 to July 2008. From March 1999 to August 2004, she served as Deputy General Counsel and Assistant General Counsel of Alaris. From May 1998 to February 1999, she served as Senior Corporate Counsel to Alaris. Prior to joining Alaris, she was an associate with the law firms of Brobeck, Phleger & Harrison LLP and Luce, Forward, Hamilton & Scripps LLP.
Ms. Maschal is our Senior Vice President, Chief Accounting Officer and Controller. Ms. Maschal was previously our Vice President and Chief Accounting Officer, and effective December 2009, was promoted to her current position. Prior to the spinoff, she served as Vice President, Finance and Controller – Clinical and Medical Products of Cardinal Health from August 2008 to June 2009. She was Vice President, Finance and Controller – Clinical Technologies and Services of Cardinal Health from April 2007 to August 2008. From July 2006 to March 2007, she served as Vice President, Clinical Technologies and Services Controller of Cardinal Health. She was Vice President, Finance for Alaris from July 2004, when Cardinal Health acquired Alaris, until July 2006. Prior to the acquisition of Alaris by Cardinal Health, she served as Vice President, Finance and Corporate Controller of Alaris, since March 2002, and as Assistant Controller of Alaris from January 1999 to February 2002. Prior to joining Alaris, she was a senior auditor with the accounting firm of Pricewaterhouse.
Code of Ethics
We have adopted a code of ethics, which we call our Code of Conduct, which applies to all our employees, including our executive officers and directors. The full text of our Code of Conduct can be found in the “Investor Relations” section of our website accessible to the public at www.carefusion.com, by clicking the “Corporate Governance” link.
| ITEM 11. | EXECUTIVE COMPENSATION |
Information required by this Item relating to director and officer compensation will appear under the headings “Executive Compensation”, “Compensation Committee Interlocks and Insider Participation” and “Compensation Committee Report” in our 2010 Proxy Statement, which sections are incorporated herein by reference.
109
Table of Contents
| ITEM 12. | SECURITY OWNERSHIP OF CERTAIN BENEFICIAL OWNERS AND MANAGEMENT AND RELATED STOCKHOLDER MATTERS |
Information required by this Item will appear under the heading “Security Ownership of Certain Beneficial Owners and Management” in our 2010 Proxy Statement, which section is incorporated herein by reference.
Equity Compensation Plan Information
The following table summarizes options and other rights outstanding under CareFusion’s share-based compensation plans as of June 30, 2010:
| Plan Category | Securities to (a)1 |
Weighted - (b)2 |
Securities (c)3 | ||||
| Equity Compensation Plan Approved by Security Holders |
16,467,462 | $ | 28.84 | 22,567,507 | |||
| Equity Compensation Plan Not Approved by Security Holders |
— | — | — | ||||
| 1 | Reflects the number of shares of common stock to be issued upon exercise of outstanding stock options, as well as shares subject to the vesting of 3,372,677 outstanding restricted stock awards and units and 593,451 outstanding performance stock units at June 30, 2010. Performance stock units are based on the estimated payout of 150% of awarded units. |
| 2 | Reflects weighted-average exercise price of outstanding stock options and does not include unvested restricted stock awards and units or performance share units at June 30, 2010, which have weighted average grant date fair values of $23.51 and $20.79, respectively. |
| 3 | Reflects the number of shares of common stock remaining available for future issuance under the 2009 Long-Term Incentive Plan (“LTIP”), excluding securities reflected in column (a). See note 18 to the audited consolidated and combined financial statements for a description of the various share-based grants that may be issued under the LTIP. At June 30, 2010, 17.4 million shares out of the 40.0 million shares authorized for issuance under the LTIP have been used for the grant of incentive and non-qualified stock options, the grant of restricted stock and restricted stock units and the grant of performance stock units. The number of shares to be issued in connection with the performance share units is not determined until the end of their respective performance period and are therefore included at the current estimate of payout shares. |
| ITEM 13. | CERTAIN RELATIONSHIPS AND RELATED TRANSACTIONS, AND DIRECTOR INDEPENDENCE |
The information required by this Item will appear under the heading “Certain Relationships and Related Transactions” and information required by this Item relating to the independence of our directors will appear under the heading “Governance of Our Company” in our 2010 Proxy Statement, which sections are incorporated herein by reference.
| ITEM 14. | PRINCIPAL ACCOUNTING FEES AND SERVICES |
Information required by this Item will appear under the heading “Audit Related Matters” in our 2010 Proxy Statement, which sections are incorporated herein by reference.
110
Table of Contents
| ITEM 15. | EXHIBITS, FINANCIAL STATEMENT SCHEDULES |
| (a) | The following documents are filed as part of this Annual Report on Form 10-K: |
| (a)(1) | Page No. | |
| Consolidated and Combined Financial Statements: | ||
| 58 | ||
| 59 | ||
| Consolidated and Combined Balance Sheets at June 30, 2010 and 2009 |
60 | |
| 61 | ||
| 62 | ||
| 63 | ||
| Report of Independent Registered Public Accounting Firm on Internal Control over Financial Reporting |
106 |
(a)(2) The following Supplemental Schedule is included in this report:
| Financial Statement Schedule: |
Page No. | |
| 116 |
All other schedules not listed above have been omitted as not applicable or because the required information is included in the Consolidated and Combined Financial Statements or in notes thereto.
(a)(3) See Subsection (b) below.
| (b) | Exhibits |
| Exhibit Number |
Description of Exhibits | |
| 2.1 |
Separation Agreement, dated July 22, 2009, by and between Cardinal Health, Inc. and CareFusion Corporation (incorporated by reference to Exhibit 2.1 to Cardinal Health’s Current Report on Form 8-K filed on July 22, 2009, File No. 1-11373).† | |
| 3.1 |
Amended and Restated Certificate of Incorporation of CareFusion Corporation (incorporated by reference to Exhibit 4.1 to the Company’s Registration Statement on Form S-8 filed on August 28, 2009, File No. 333-161611). | |
| 3.2 |
Amended and Restated By-Laws of CareFusion Corporation (incorporated by reference to Exhibit 4.2 to the Company’s Registration Statement on Form S-8 filed on August 28, 2009, File No. 333-161611). | |
| 4.1 |
Stockholder’s and Registration Rights Agreement, dated August 31, 2009, by and between Cardinal Health, Inc. and CareFusion Corporation (incorporated by reference to Exhibit 10.4 to Cardinal Health’s Current Report on Form 8-K filed on September 4, 2009, File No. 1-11373). | |
| 4.2 |
Registration Rights Agreement, dated July 21, 2009, among CareFusion Corporation, Deutsche Bank Securities Inc., Goldman, Sachs & Co. and UBS Securities LLC (incorporated by reference to Exhibit 4.1 to Cardinal Health’s Current Report on Form 8-K filed on July 22, 2009, File No. 1-11373). | |
111
Table of Contents
| Exhibit Number |
Description of Exhibits | |
| 4.3 |
Indenture, dated July 21, 2009, between CareFusion Corporation and Deutsche Bank Trust Company Americas, as trustee (incorporated by reference to Exhibit 4.2 to Cardinal Health’s Current Report on Form 8-K filed on July 22, 2009, File No. 1-11373). | |
| 4.4 |
Supplemental Indenture, dated July 21, 2009, between CareFusion Corporation and Deutsche Bank Trust Company Americas, as trustee (incorporated by reference to Exhibit 4.3 to Cardinal Health’s Current Report on Form 8-K filed on July 22, 2009, File No. 1-11373). | |
| 10.1 |
Transition Services Agreement, dated August 31, 2009, by and between Cardinal Health, Inc. and CareFusion Corporation (incorporated by reference to Exhibit 10.2 to Cardinal Health’s Current Report on Form 8-K filed on September 4, 2009, File No. 1-11373). | |
| 10.2 |
Tax Matters Agreement, dated August 31, 2009, by and between Cardinal Health, Inc. and CareFusion Corporation (incorporated by reference to Exhibit 10.3 to Cardinal Health’s Current Report on Form 8-K filed on September 4, 2009, File No. 1-11373). | |
| 10.3 |
Employee Matters Agreement, dated August 31, 2009, by and between Cardinal Health, Inc. and CareFusion Corporation (incorporated by reference to Exhibit 10.1 to Cardinal Health’s Current Report on Form 8-K filed on September 4, 2009, File No. 1-11373). | |
| 10.4 |
Form of Indemnification Agreement between CareFusion Corporation and individual directors (incorporated by reference to Exhibit 10.5 of Amendment No. 3 to the Company’s Registration Statement on Form 10 filed on June 26, 2009, File No. 1-34273). | |
| 10.5 |
Form of Indemnification Agreement between CareFusion Corporation and individual officers (incorporated by reference to Exhibit 10.6 of Amendment No. 3 to the Company’s Registration Statement on Form 10 filed on June 26, 2009, File No. 1-34273). | |
| 10.6 |
Retention Agreement, dated as of August 31, 2004, between ALARIS Medical Systems, Inc. and David L. Schlotterbeck (incorporated by reference to Exhibit 10.36 to Cardinal Health’s Annual Report on Form 10-K for the fiscal year ended June 30, 2005, File No. 1-11373). # | |
| 10.7 |
First Amendment to the Retention Agreement between ALARIS Medical Systems, Inc. and David L. Schlotterbeck, dated and effective as of November 2, 2005 (incorporated by reference to Exhibit 10.06 to Cardinal Health’s Current Report on Form 8-K filed on November 7, 2005, File No. 1-11373). # | |
| 10.8 |
Second Amendment to Retention Agreement between CareFusion 303, Inc (f/k/a ALARIS Medical Systems, Inc. or Cardinal Health 303, Inc.) and David L. Schlotterbeck, effective November 26, 2007 (incorporated by reference to Exhibit 10.8 to the Cardinal Health December 2007 10-Q). # | |
| 10.9 |
Employment Agreement, dated August 31, 2009, between CareFusion Corporation and David L. Schlotterbeck, including forms of Retention Award Agreements for Nonqualified Stock Options and Restricted Stock Units (incorporated by reference to Exhibit 10.1 to the Company’s Current Report on Form 8-K filed on September 2, 2009, File No. 1-34273). # | |
| 10.10 |
Form of Executive Officer Offer Letter (incorporated by reference to Exhibit 10.52 to the Company’s Annual Report on Form 10-K for the year ended June 30, 2009 filed on September 15, 2009, File No. 1-34273). # | |
| 10.11 |
Form of Director Offer Letter (incorporated by reference to Exhibit 10.53 to the Company’s Annual Report on Form 10-K for the year ended June 30, 2009 filed on September 15, 2009, File No. 1-34273). # | |
| 10.12 |
Three Year Credit Agreement, dated as of July 1, 2009, among CareFusion Corporation, the guarantors named therein, Bank of America, N.A., as administrative agent, swing line lender and L/C Issuer, JPMorgan Chase Bank, N.A. and Morgan Stanley Senior Funding, Inc., as syndication agents, and the other lenders party thereto (incorporated by reference to Exhibit 10.1 to Cardinal Health’s Current Report on Form 8-K dated July 6, 2009, File No. 1-34273). | |
112
Table of Contents
| Exhibit Number |
Description of Exhibits | |
| 10.13 |
364-Day Credit Agreement, dated as of July 1, 2009, among CareFusion Corporation, the guarantors named therein, Bank of America, N.A., as administrative agent, swing line lender and L/C Issuer, JPMorgan Chase Bank, N.A. and Morgan Stanley Senior Funding, Inc., as syndication agents, and the other lenders party thereto (incorporated by reference to Exhibit 10.2 to Cardinal Health’s Current Report on Form 8-K dated July 6, 2009, File No. 1-34273). | |
| 10.14 |
Purchase Agreement, dated July 14, 2009, among CareFusion Corporation, Deutsche Bank Securities Inc., Goldman, Sachs & Co. and UBS Securities LLC (incorporated by reference to Exhibit 10.1 to Cardinal Health’s Current Report on Form 8-K filed on July 22, 2009, File No. 1-11373). | |
| 10.15 |
CareFusion Corporation 2009 Long-Term Incentive Plan (incorporated by reference to Exhibit 99.1 to the Company’s Registration Statement on Form S-8 filed on August 28, 2009, File No. 333-161615). # | |
| 10.16 |
Form of Nonqualified Stock Option Agreement under the CareFusion Corporation 2009 Long-Term Incentive Plan for employees of the Company (incorporated by reference to Exhibit 10.59 to the Company’s Annual Report on Form 10-K for the year ended June 30, 2009 filed on September 15, 2009, File No. 1-34273). # | |
| 10.17 |
Form of Performance Stock Units Agreement under the CareFusion Corporation 2009 Long-Term Incentive Plan for employees of the Company (incorporated by reference to Exhibit 10.60 to the Company’s Annual Report on Form 10-K for the year ended June 30, 2009 filed on September 15, 2009, File No. 1-34273). # | |
| 10.18 |
Form of Restricted Stock Units Agreement under the CareFusion Corporation 2009 Long-Term Incentive Plan for employees of the Company (incorporated by reference to Exhibit 10.61 to the Company’s Annual Report on Form 10-K for the year ended June 30, 2009 filed on September 15, 2009, File No. 1-34273). # | |
| 10.19 |
Form of Restricted Stock Units Agreement for Directors under the CareFusion Corporation 2009 Long-Term Incentive Plan (incorporated by reference to Exhibit 10.62 to the Company’s Annual Report on Form 10-K for the year ended June 30, 2009 filed on September 15, 2009, File No. 1-34273). # | |
| 10.20 |
Form of terms and conditions applicable to nonqualified stock options under the CareFusion Corporation 2009 Long-Term Incentive Plan for employees of the Company (adjusted in connection with the separation) (incorporated by reference to Exhibit 10.63 to the Company’s Annual Report on Form 10-K for the year ended June 30, 2009 filed on September 15, 2009, File No. 1-34273). # | |
| 10.21 |
Form of terms and conditions applicable to restricted share units under the CareFusion Corporation 2009 Long-Term Incentive Plan for employees of the Company (adjusted in connection with the separation) (incorporated by reference to Exhibit 10.64 to the Company’s Annual Report on Form 10-K for the year ended June 30, 2009 filed on September 15, 2009, File No. 1-34273). # | |
| 10.22 |
Form of terms and conditions applicable to restricted shares under the CareFusion Corporation 2009 Long-Term Incentive Plan for employees of the Company (adjusted in connection with the separation) (incorporated by reference to Exhibit 10.65 to the Company’s Annual Report on Form 10-K for the year ended June 30, 2009 filed on September 15, 2009, File No. 1-34273). # | |
| 10.23 |
Form of terms and conditions applicable to nonqualified stock options under the CareFusion Corporation 2009 Long-Term Incentive Plan for employees of Cardinal Health, Inc. (adjusted in connection with the separation) (incorporated by reference to Exhibit 10.66 to the Company’s Annual Report on Form 10-K for the year ended June 30, 2009 filed on September 15, 2009, File No. 1-34273). # | |
| 10.24 |
Form of terms and conditions applicable to restricted share units under the CareFusion Corporation 2009 Long-Term Incentive Plan for employees of Cardinal Health, Inc. (adjusted in connection with the separation) (incorporated by reference to Exhibit 10.67 to the Company’s Annual Report on Form 10-K for the year ended June 30, 2009 filed on September 15, 2009, File No. 1-34273). # | |
113
Table of Contents
| Exhibit Number |
Description of Exhibits | |
| 10.25 | Form of terms and conditions applicable to restricted shares under the CareFusion Corporation 2009 Long-Term Incentive Plan for employees of Cardinal Health, Inc. (adjusted in connection with the separation) (incorporated by reference to Exhibit 10.68 to the Company’s Annual Report on Form 10-K for the year ended June 30, 2009 filed on September 15, 2009, File No. 1-34273). # | |
| 10.26 | Form of terms and conditions applicable to restricted share units under the CareFusion Corporation 2009 Long-Term Incentive Plan for directors of Cardinal Health, Inc. (adjusted in connection with the separation) (incorporated by reference to Exhibit 10.69 to the Company’s Annual Report on Form 10-K for the year ended June 30, 2009 filed on September 15, 2009, File No. 1-34273). # | |
| 10.27 | Form of terms and conditions applicable to nonqualified stock options under the CareFusion Corporation 2009 Long-Term Incentive Plan for directors of Cardinal Health, Inc. (adjusted in connection with the separation) (incorporated by reference to Exhibit 10.70 to the Company’s Annual Report on Form 10-K for the year ended June 30, 2009 filed on September 15, 2009, File No. 1-34273). # | |
| 10.28 | CareFusion Corporation Deferred Compensation Plan (incorporated by reference to Exhibit 99.1 to the Company’s Registration Statement on Form S-8 filed on August 28, 2009, File No. 333-161611). # | |
| 10.29 | CareFusion Corporation Management Incentive Plan (incorporated by reference to Exhibit 10.72 to the Company’s Annual Report on Form 10-K for the year ended June 30, 2009 filed on September 15, 2009, File No. 1-34273). # | |
| 10.30 | CareFusion Corporation Executive Change in Control Severance Plan (incorporated by reference to Exhibit 10.73 to the Company’s Annual Report on Form 10-K for the year ended June 30, 2009 filed on September 15, 2009, File No. 1-34273). # | |
| 10.31 | Retention Agreement, dated October 15, 2009, between CareFusion Corporation and Dwight Winstead, including a Retention Award and Restricted Stock Units Agreement (incorporated by reference to Exhibit 10.1 to the Company’s Current Report on Form 8-K filed on October 19, 2009, File No. 1-34273). # | |
| 10.32 | Separation Agreement dated June 22, 2010, between CareFusion Corporation and Carol Zilm. # * | |
| 12.1 | Computation of Ratio of Earnings to Fixed Charges.* | |
| 21.1 | Subsidiaries of CareFusion Corporation.* | |
| 23.1 | Consent of Independent Registered Public Accounting Firm.* | |
| 24.1 | Powers of Attorney (included on the signature page).* | |
| 31.1 | Certification of Chief Executive Officer pursuant to Section 302 of the Sarbanes-Oxley Act of 2002.* | |
| 31.2 | Certification of Chief Financial Officer pursuant to Section 302 of the Sarbanes-Oxley Act of 2002.* | |
| 32.1 | Certifications pursuant to 18 U.S.C. Section 1350.* | |
| 99.1 | Amended Consent Decree for Condemnation and Permanent Injunction (incorporated by reference to Exhibit 99.2 of the Company’s Registration Statement on Form 10 filed on March 31, 2009, File No. 1-34273). | |
| * | Filed herewith. |
| # | Indicates management contract or compensatory plan. |
| † | The schedules and exhibits to the Separation Agreement have been omitted. A copy of any omitted schedule or exhibit will be furnished to the Securities and Exchange Commission supplementally upon request. |
114
Table of Contents
(c) Financial Statement Schedules
The following financial statement schedule is filed as part of this Annual Report on Form 10-K:
| Description | ||
| II | Valuation and Qualifying Accounts |
115
Table of Contents
SCHEDULE II — VALUATION AND QUALIFYING ACCOUNTS
| (in millions) | Balance at Beginning of Period |
Charged to Costs and Expenses |
Charged to Other Accounts |
Deductions | Balance at End of Period | ||||||||||||
| Fiscal Year 2010: |
|||||||||||||||||
| Accounts Receivable |
$ | 20 | $ | 1 | $ | (1 | ) | $ | (7 | ) | $ | 13 | |||||
| Inventory Reserve |
45 | 20 | — | (10 | ) | 55 | |||||||||||
| Net Investment in Sales-Type Leases |
7 | — | 1 | — | 8 | ||||||||||||
| $ | 72 | $ | 21 | $ | — | $ | (17 | ) | $ | 76 | |||||||
| Fiscal Year 2009: |
|||||||||||||||||
| Accounts Receivable |
$ | 20 | $ | 10 | $ | (2 | ) | $ | (8 | ) | $ | 20 | |||||
| Inventory Reserve |
46 | 16 | (1 | ) | (16 | ) | 45 | ||||||||||
| Net Investment in Sales-Type Leases |
6 | 1 | — | — | 7 | ||||||||||||
| $ | 72 | $ | 27 | $ | (3 | ) | $ | (24 | ) | $ | 72 | ||||||
| Fiscal Year 2008: |
|||||||||||||||||
| Accounts Receivable |
$ | 17 | $ | 7 | $ | 2 | $ | (6 | ) | $ | 20 | ||||||
| Inventory Reserve |
57 | 18 | 1 | (30 | ) | 46 | |||||||||||
| Net Investment in Sales-Type Leases |
5 | — | — | 1 | 6 | ||||||||||||
| $ | 79 | $ | 25 | $ | 3 | $ | (35 | ) | $ | 72 | |||||||
116
Table of Contents
SIGNATURES
Pursuant to the requirements of Section 13 or 15(d) of the Securities Exchange Act of 1934, the Registrant has duly caused this report to be signed on its behalf by the undersigned, thereunto duly authorized, on August 19, 2010.
| CAREFUSION CORPORATION | ||
| By: | /s/ David L. Schlotterbeck | |
| David L. Schlotterbeck, Chairman and Chief Executive Officer | ||
KNOW ALL PERSONS BY THESE PRESENTS, that each person whose signature appears below constitutes and appoints Edward J. Borkowski and Joan B. Stafslien, jointly and severally, his or her attorneys-in-fact, each with the power of substitution, for him or her in any and all capacities, to sign any amendments to this report, and to file the same, with exhibits thereto and other documents in connection therewith with the Securities and Exchange Commission, hereby ratifying and confirming all that each of said attorneys-in-fact, or his or her substitute or substitutes may do or cause to be done by virtue hereof.
Pursuant to the requirements of the Securities Exchange Act of 1934, this report has been signed by the following persons on behalf of the Registrant and in the capacities and on the dates indicated.
| Signature |
Title |
Date | ||
| /s/ David L. Schlotterbeck David L. Schlotterbeck |
Chairman and Chief Executive Officer and Director (principal executive officer) |
August 19, 2010 | ||
| /s/ Edward J. Borkowski Edward J. Borkowski |
Chief Financial Officer (principal financial officer) |
August 19, 2010 | ||
| /s/ Jean Maschal Jean Maschal |
Senior Vice President, Controller and Chief Accounting Officer (principal accounting officer) |
August 19, 2010 | ||
| /s/ Philip L. Francis Philip L. Francis |
Director |
August 19, 2010 | ||
| /s/ Robert F. Friel Robert F. Friel |
Director |
August 19, 2010 | ||
| /s/ Jacqueline B. Kosecoff, Ph.D Jacqueline B. Kosecoff, Ph.D |
Director |
August 19, 2010 | ||
| /s/ J. Michael Losh J. Michael Losh |
Presiding Director |
August 19, 2010 | ||
| /s/ Gregory T. Lucier Gregory T. Lucier |
Director |
August 19, 2010 | ||
| /s/ Edward D. Miller, M.D. Edward D. Miller, M.D. |
Director |
August 19, 2010 | ||
| /s/ Michael D. O’Halleran Michael D. O’Halleran |
Director |
August 19, 2010 | ||
| /s/ Robert P. Wayman Robert P. Wayman |
Director |
August 19, 2010 | ||