Attached files
| file | filename |
|---|---|
| 8-K - FORM 8-K - UNITED FIRE GROUP INC | c05106e8vk.htm |
Exhibit 99.1

| A STRONG PRESENCE United Fire Group® 20 1 0 I N V E S T O R P R E S E N T A T I O N |
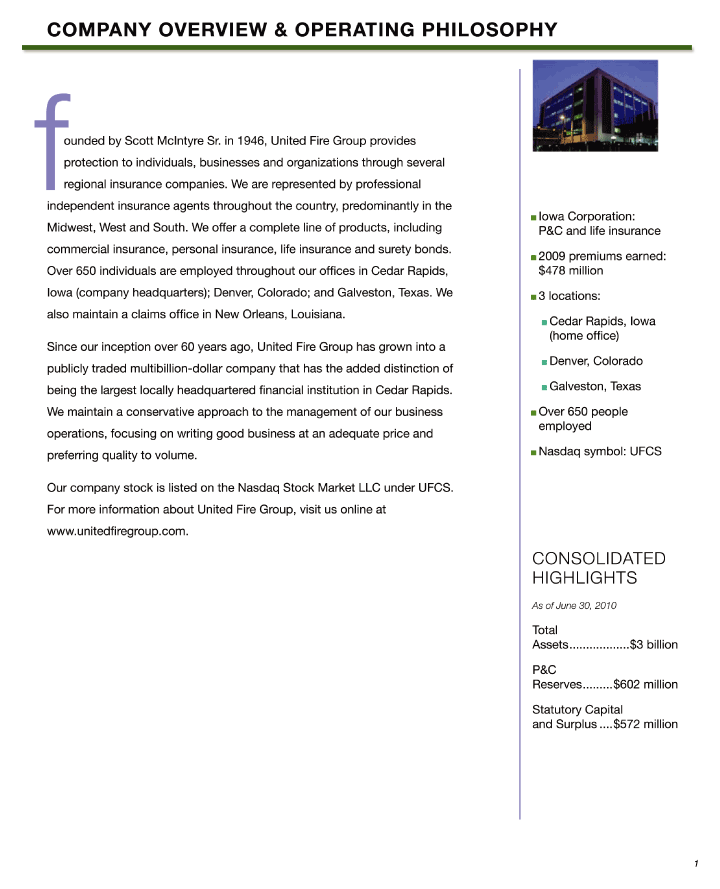
| f ounded by Scott McIntyre Sr. in 1946, United Fire Group provides protection to individuals, businesses and organizations through several regional insurance companies. We are represented by professional independent insurance agents throughout the country, predominantly in the Midwest, West and South. We offer a complete line of products, including commercial insurance, personal insurance, life insurance and surety bonds. Over 650 individuals are employed throughout our offi ces in Cedar Rapids, Iowa (company headquarters); Denver, Colorado; and Galveston, Texas. We also maintain a claims offi ce in New Orleans, Louisiana. Since our inception over 60 years ago, United Fire Group has grown into a publicly traded multibillion-dollar company that has the added distinction of being the largest locally headquartered fi nancial institution in Cedar Rapids. We maintain a conservative approach to the management of our business operations, focusing on writing good business at an adequate price and preferring quality to volume. Our company stock is listed on the Nasdaq Stock Market LLC under UFCS. For more information about United Fire Group, visit us online at www.unitedfi regroup.com. 3 Iowa Corporation: P&C and life insurance 3 2009 premiums earned: $478 million 3 3 locations: 3 Cedar Rapids, Iowa (home offi ce) 3 Denver, Colorado 3 Galveston, Texas 3 Over 650 people employed 3 Nasdaq symbol: UFCS CONSOLIDATED HIGHLIGHTS As of June 30, 2010 Total Assets $3 billion P&C Reserves $602 million Statutory Capital and Surplus $572 million |
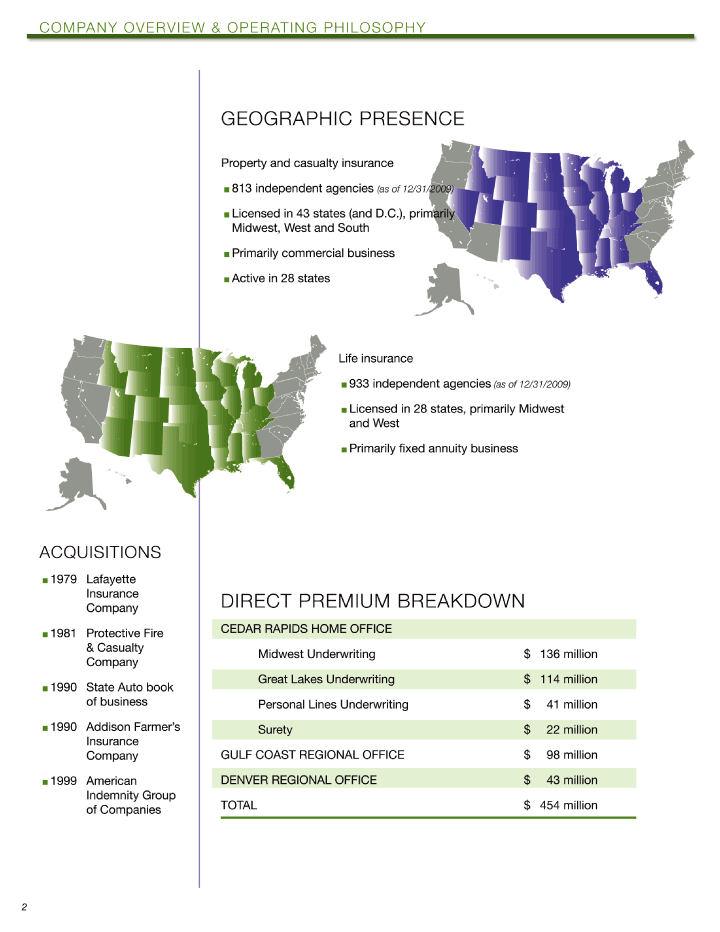
| ACQUISITIONS 3 1979 Lafayette Insurance Company 3 1981 Protective Fire & Casualty Company 3 1990 State Auto book of business 3 1990 Addison Farmer’s Insurance Company 3 1999 American Indemnity Group of Companies GEOGRAPHIC PRESENCE Property and casualty insurance 3 813 independent agencies (as of 12/31/2009) 3 Licensed in 43 states (and D.C.), primarily Midwest, West and South 3 Primarily commercial business 3 Active in 28 states Life insurance 3 933 independent agencies (as of 12/31/2009) 3 Licensed in 28 states, primarily Midwest and West 3 Primarily fi xed annuity business DIRECT PREMIUM BREAKDOWN CEDAR RAPIDS HOME OFFICE Midwest Underwriting $136 million Great Lakes Underwriting $114 million Personal Lines Underwriting $41 million Surety $22 million GULF COAST REGIONAL OFFICE $98 million DENVER REGIONAL OFFICE $43 million TOTAL $ 454 million |
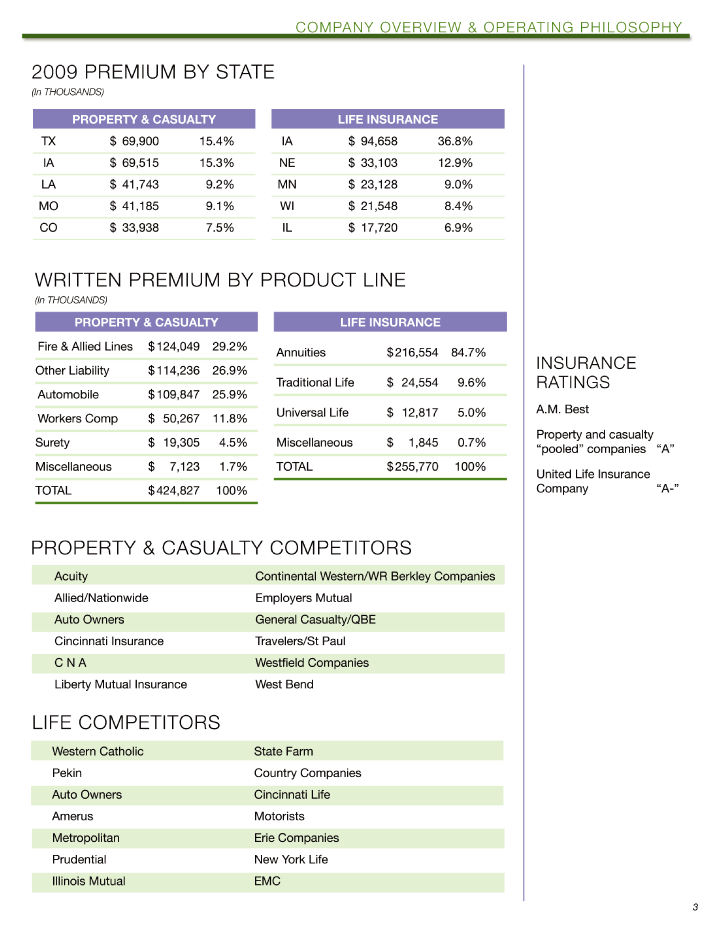
| 2009 PREMIUM BY STATE (In THOUSANDS) PROPERTY & CASUALTY _____ LIFE INSURANCE TX $69,900 15.4% IA $94,658 36.8% IA $69,515 15.3% NE $33,103 12.9% LA $41,743 9.2% MN $23,128 9.0% MO $41,185 9.1% WI $21,548 8.4% CO $33,938 7.5% IL $17,720 6.9% WRITTEN PREMIUM BY PRODUCT LINE (In THOUSANDS) PROPERTY & CASUALTY _____ LIFE INSURANCE Fire & Allied Lines $124,049 29.2% Annuities $216,55484.7% Other Liability $114,236 26.9% Traditional Life $ 24,5549.6% Automobile $109,847 25.9% Universal Life $ 12,8175.0% Workers Comp $50,26711.8% Surety $19,3054.5% Miscellaneous $ 1,8450.7% Miscellaneous $7,1231.7% TOTAL $ 255,770 100% TOTAL $424,827 100% PROPERTY & CASUALTY COMPETITORS AcuityContinental Western/WR Berkley Companies Allied/Nationwide Employers Mutual Auto Owners General Casualty/QBE Cincinnati Insurance Travelers/St Paul C N A Westfi eld Companies Liberty Mutual Insurance West Bend _____ LIFE COMPETITORS Western Catholic State Farm Pekin Country Companies Auto Owners Cincinnati Life Amerus Motorists Metropolitan Erie Companies Prudential New York Life Illinois Mutual EMC INSURANCE RATINGS A.M. Best Property and casualty “pooled” companies “A” United Life Insurance Company “A-” |
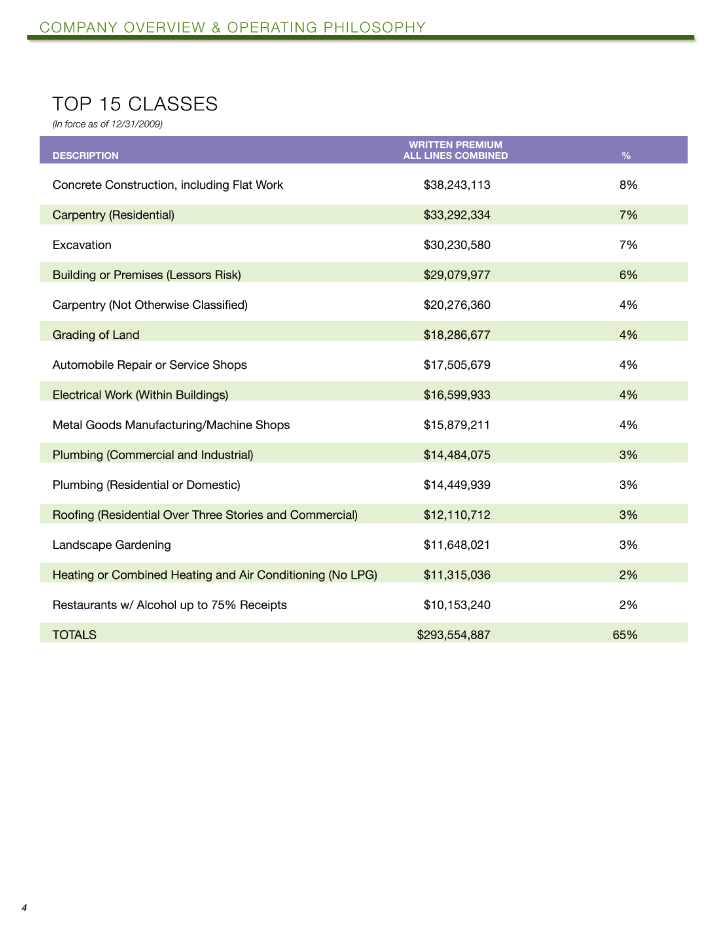
| TOP 15 CLASSES (In force as of 12/31/2009) WRITTEN PREMIUM DESCRIPTION _____ ALL LINES COMBINED _____ % Concrete Construction, including Flat Work $ 38,243,113 8% Carpentry (Residential) $ 33,292,334 7% Excavation $ 30,230,580 7% Building or Premises (Lessors Risk) $ 29,079,977 6% Carpentry (Not Otherwise Classifi ed) $ 20,276,360 4% Grading of Land $ 18,286,677 4% Automobile Repair or Service Shops $ 17,505,679 4% Electrical Work (Within Buildings) $ 16,599,933 4% Metal Goods Manufacturing/Machine Shops $ 15,879,211 4% Plumbing (Commercial and Industrial) $ 14,484,075 3% Plumbing (Residential or Domestic) $ 14,449,939 3% Roofi ng (Residential Over Three Stories and Commercial) $ 12,110,712 3% Landscape Gardening $ 11,648,021 3% Heating or Combined Heating and Air Conditioning (No LPG) $ 11,315,036 2% Restaurants w/ Alcohol up to 75% Receipts $ 10,153,240 2% TOTALS $ 293,554,887 65% |
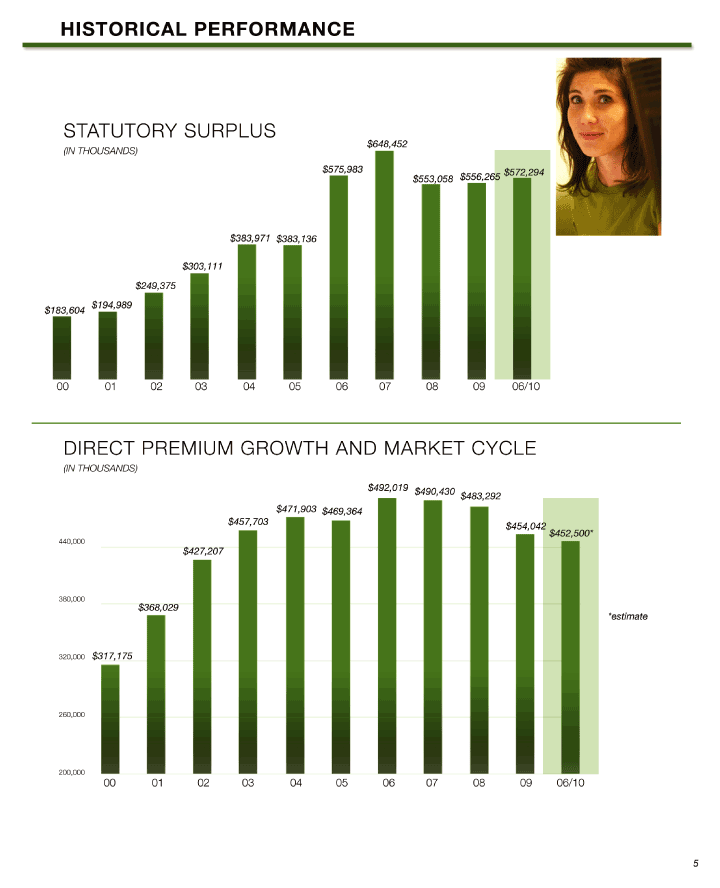
| STATUTORY SURPLUS (IN THOUSANDS) DIRECT PREMIUM GROWTH AND MARKET CYCLE (IN THOUSANDS) |
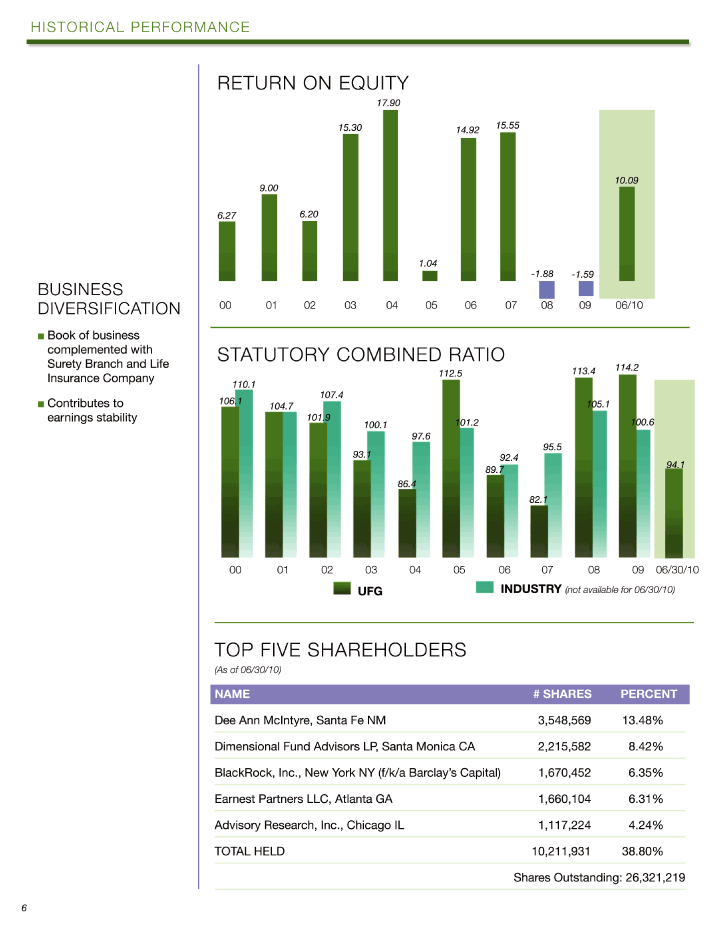
| BUSINESS DIVERSIFICATION 3 Book of business complemented with Surety Branch and Life Insurance Company 3 Contributes to earnings stability RETURN ON EQUITY STATUTORY COMBINED RATIO TOP FIVE SHAREHOLDERS (As of 06/30/10) NAME # SHARES _____ PERCENT Dee Ann McIntyre, Santa Fe NM 3,548,569 13.48% Dimensional Fund Advisors LP, Santa Monica CA 2,215,582 8.42% BlackRock, Inc., New York NY (f/k/a Barclay’s Capital) 1,670,452 6.35% Earnest Partners LLC, Atlanta GA 1,660,104 6.31% Advisory Research, Inc., Chicago IL 1,117,224 4.24% TOTAL HELD 10,211,931 38.80% Shares Outstanding: 26,321,219 |
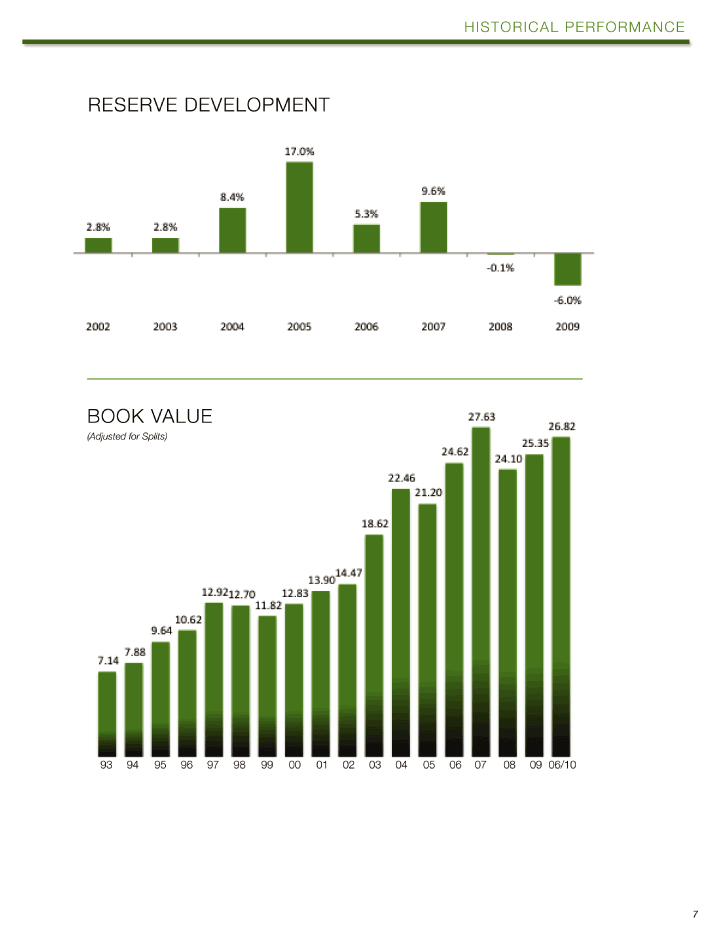
| RESERVE DEVELOPMENT BOOK VALUE (Adjusted for Splits) |
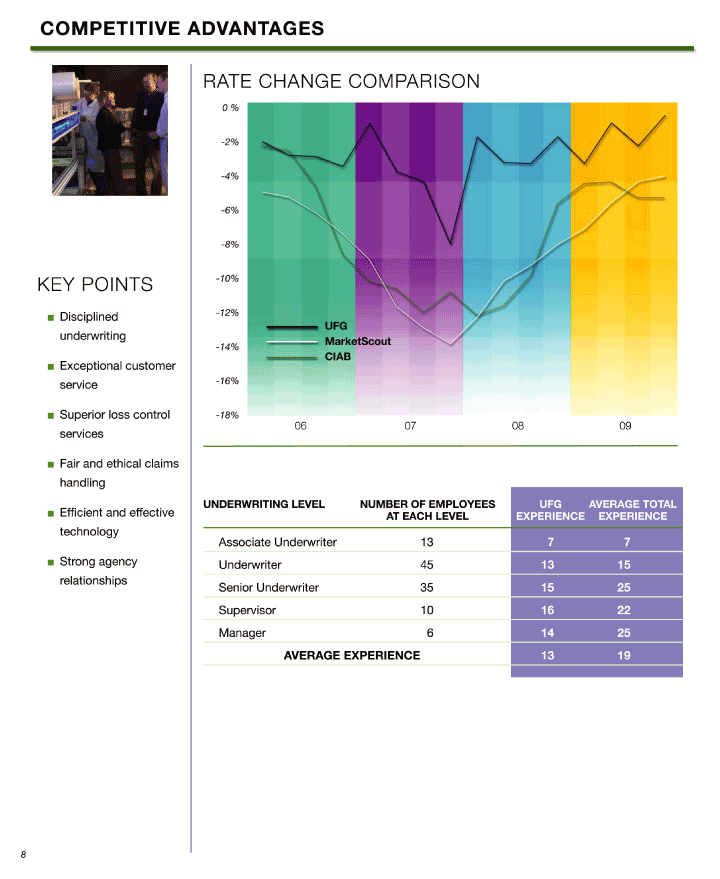
| KEY POINTS 3 Disciplined underwriting 3 Exceptional customer service 3 Superior loss control services 3 Fair and ethical claims handling 3 Effi cient and effective technology 3 Strong agency relationships RATE CHANGE COMPARISON UNDERWRITING LEVEL NUMBER OF EMPLOYEES UFG AVERAGE TOTAL AT EACH LEVEL EXPERIENCE EXPERIENCE Associate Underwriter 13 7 7 Underwriter 45 13 15 Senior Underwriter 35 15 25 Supervisor 10 16 22 Manager 6 14 25 AVERAGE EXPERIENCE13 13 19 |
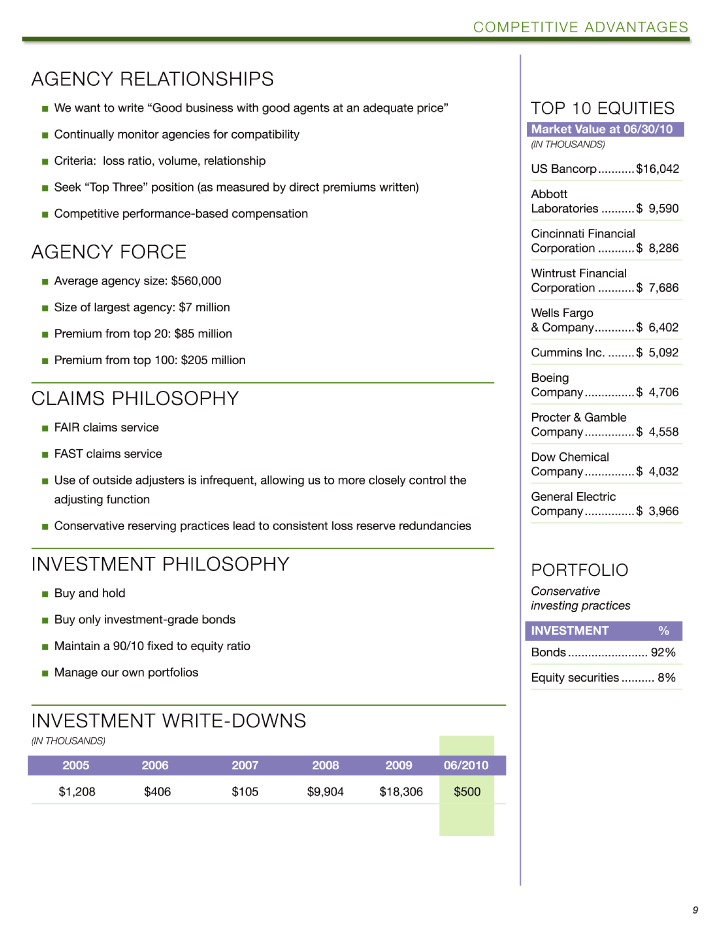
| AGENCY RELATIONSHIPS 3 We want to write “Good business with good agents at an adequate price” 3 Continually monitor agencies for compatibility 3 Criteria: loss ratio, volume, relationship 3 Seek “Top Three” position (as measured by direct premiums written) 3 Competitive performance-based compensation AGENCY FORCE 3 Average agency size: $560,000 3 Size of largest agency: $7 million 3 Premium from top 20: $85 million 3 Premium from top 100: $205 million CLAIMS PHILOSOPHY 3 FAIR claims service 3 FAST claims service 3 Use of outside adjusters is infrequent, allowing us to more closely control the adjusting function 3 Conservative reserving practices lead to consistent loss reserve redundancies INVESTMENT PHILOSOPHY 3 Buy and hold 3 Buy only investment-grade bonds 3 Maintain a 90/10 fi xed to equity ratio 3 Manage our own portfolios INVESTMENT WRITE-DOWNS (IN THOUSANDS) 2005 2006 2007 2008 2009 06/2010 $1,208 $406 $105 $9,904 $18,306 $500 TOP 10 EQUITIES Market Value at 06/30/10 (IN THOUSANDS) US Bancorp $16,042 Abbott Laboratories $ 9,590 Cincinnati Financial Corporation $ 8,286 Wintrust Financial Corporation $ 7,686 Wells Fargo & Company $ 6,402 Cummins Inc. $ 5,092 Boeing Company $ 4,706 Procter & Gamble Company $ 4,558 Dow Chemical Company $ 4,032 General Electric Company $ 3,966 PORTFOLIO Conservative investing practices INVESTMENT % Bonds 92% Equity securities 8% |
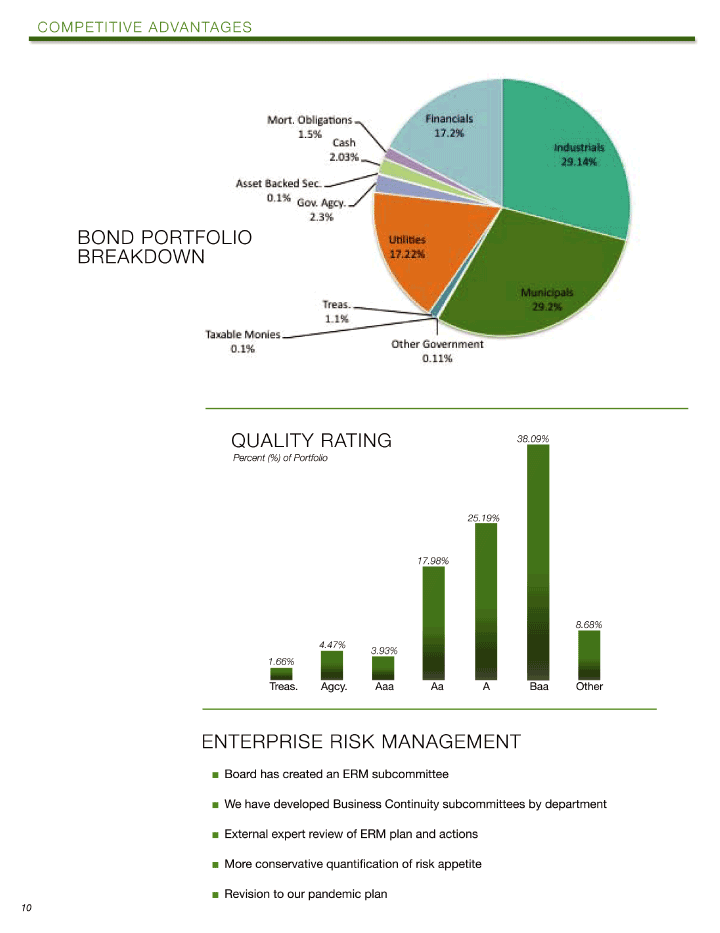
| BOND PORTFOLIO BREAKDOWN QUALITY RATING Percent (%) of Portfolio ENTERPRISE RISK MANAGEMENT 3 Board has created an ERM subcommittee 3 We have developed Business Continuity subcommittees by department 3 External expert review of ERM plan and actions 3 More conservative quantifi cation of risk appetite 3 Revision to our pandemic plan |
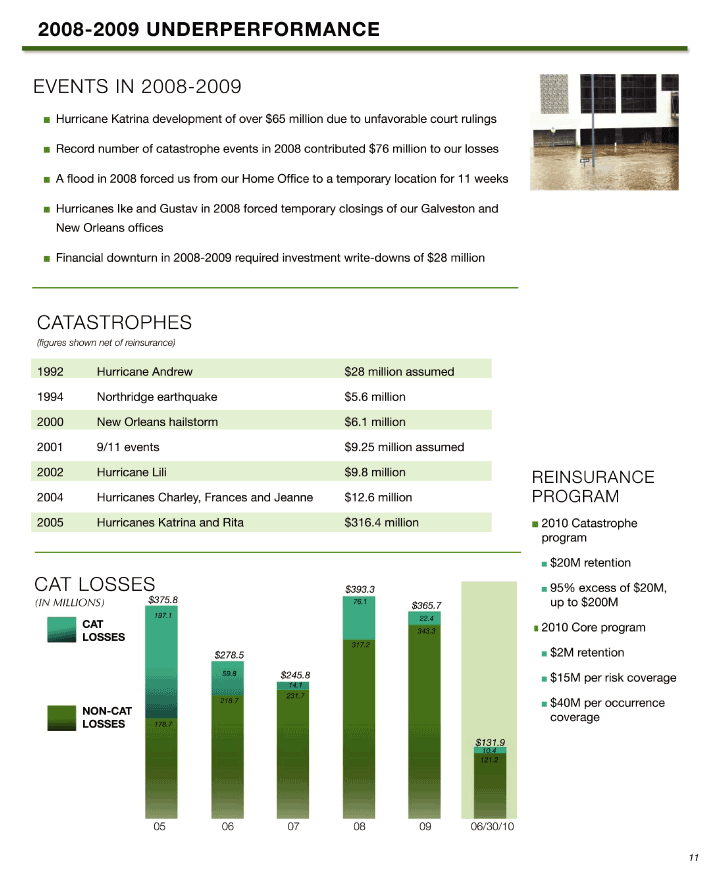
| EVENTS IN 2008-2009 3 Hurricane Katrina development of over $65 million due to unfavorable court rulings 3 Record number of catastrophe events in 2008 contributed $76 million to our losses 3 A fl ood in 2008 forced us from our Home Offi ce to a temporary location for 11 weeks 3 Hurricanes Ike and Gustav in 2008 forced temporary closings of our Galveston and New Orleans offi ces 3 Financial downturn in 2008-2009 required investment write-downs of $28 million CATASTROPHES (fi _____ gures shown net of reinsurance) 1992 Hurricane Andrew $28 million assumed 1994 Northridge earthquake $5.6 million 2000 New Orleans hailstorm $6.1 million 2001 9/11 events $9.25 million assumed 2002 Hurricane Lili $9.8 million 2004 Hurricanes Charley, Frances and Jeanne $12.6 million 2005 Hurricanes Katrina and Rita $316.4 million CAT LOSSES (IN MILLIONS) $ REINSURANCE PROGRAM 3 2010 Catastrophe program 3 $ 20M retention 3 95% excess of $20M, up to $200M 3 2010 Core program 3 $ 2M retention 3 $ 15M per risk coverage 3$ 40M per occurrence coverage |
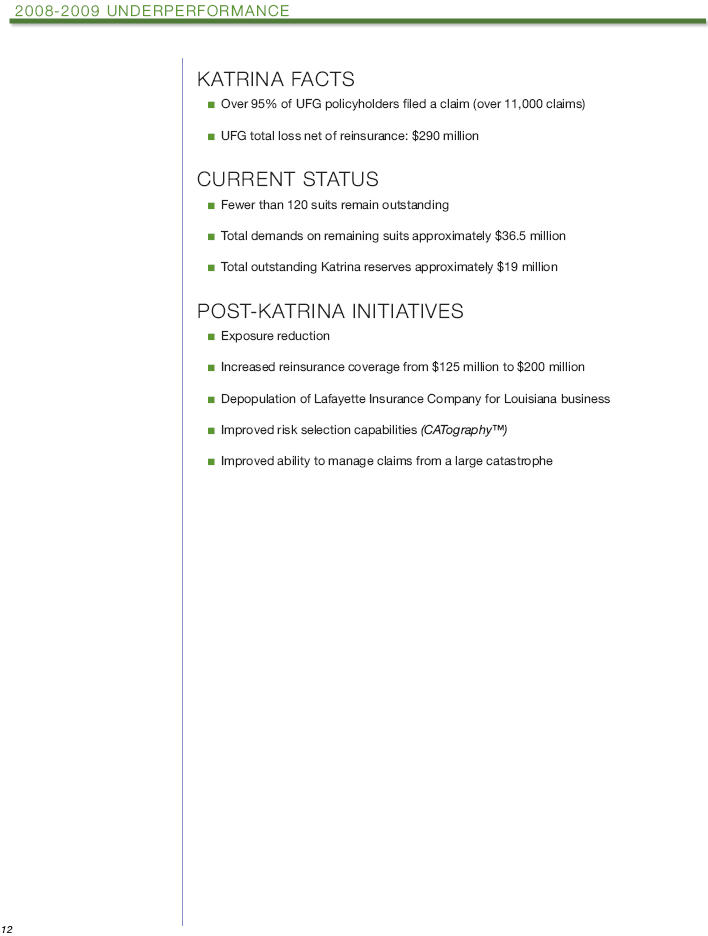
| KATRINA FACTS 3 Over 95% of UFG policyholders fi led a claim (over 11,000 claims) 3 UFG total loss net of reinsurance: $316 million CURRENT STATUS 3 Fewer than 120 suits remain outstanding 3 Total demands on remaining suits approximately $36.5 million 3 Total outstanding Katrina reserves approximately $19 million POST-KATRINA INITIATIVES 3 Exposure reduction 3 Increased reinsurance coverage from $125 million to $200 million 3 Depopulation of Lafayette Insurance Company for Louisiana business 3 Improved risk selection capabilities (CATography™) 3 Improved ability to manage claims from a large catastrophe |
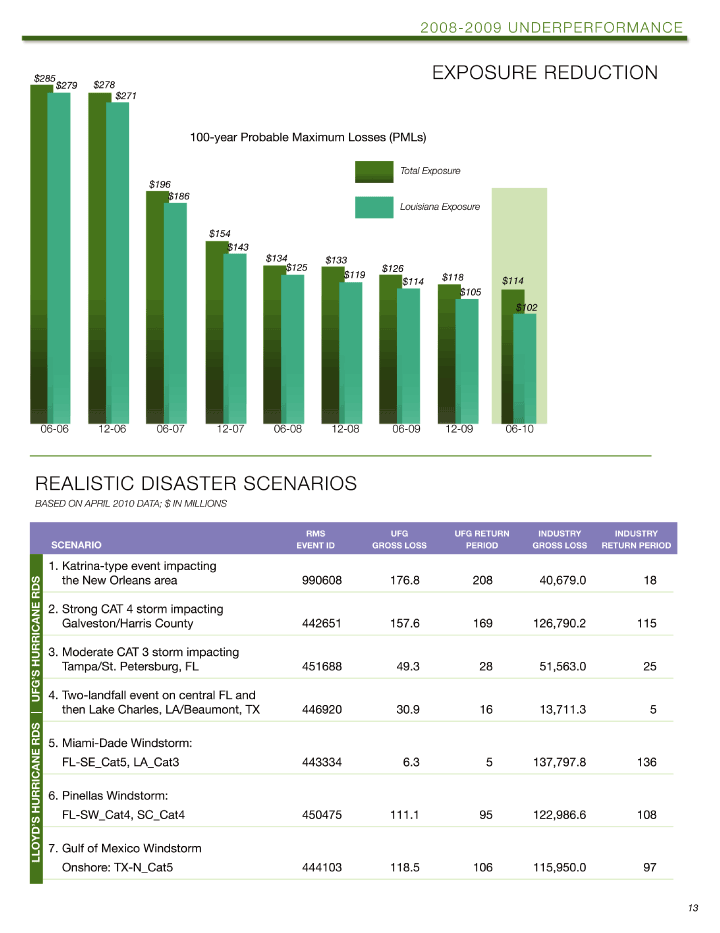
| EXPOSURE REDUCTION REALISTIC DISASTER SCENARIOS BASED ON APRIL 2010 DATA; $IN MILLIONS RMS _____ UFG _____ UFG RETURN _____ INDUSTRY _____ INDUSTRY SCENARIO _____ EVENT ID _____ GROSS LOSS _____ PERIOD _____ GROSS LOSS RETURN PERIOD 1. Katrina-type event impacting RDS the New Orleans area 990608 176.8 208 40,679.0 18 HURRICANE 2. Strong CAT 4 storm impacting Galveston/Harris County 442651 157.6 169 126,790.2 115 3. Moderate CAT 3 storm impacting Tampa/St. Petersburg, FL 451688 49.3 28 51,563.0 25 UFG’S 4. Two-landfall event on central FL and then Lake Charles, LA/Beaumont, TX 446920 30.9 16 13,711.3 5 RDS 5. Miami-Dade Windstorm: HURRICANE FL-SE_Cat5, LA_Cat3 443334 6.3 5 137,797.8 136 6. Pinellas Windstorm: FL-SW_Cat4, SC_Cat4 450475 111.1 95 122,986.6 108 LLOYD’S 7. Gulf of Mexico Windstorm Onshore: TX-N_Cat5 444103 118.5 106 115,950.0 97 |
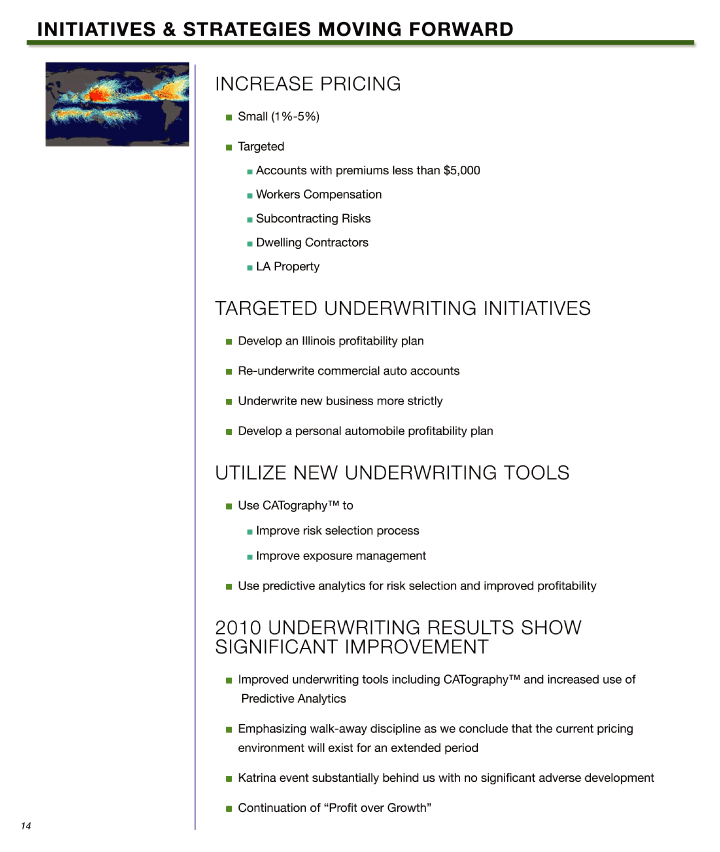
| INCREASE PRICING 3 Small (1%-5%) 3 Targeted 3 Accounts with premiums less than $5,000 3 Workers Compensation 3 Subcontracting Risks 3 Dwelling Contractors 3 LA Property TARGETED UNDERWRITING INITIATIVES 3 Develop an Illinois profi tability plan 3 Re-underwrite commercial auto accounts 3 Underwrite new business more strictly 3 Develop a personal automobile profi tability plan UTILIZE NEW UNDERWRITING TOOLS 3 Use CATography™ to 3 Improve risk selection process 3 Improve exposure management 3 Use predictive analytics for risk selection and improved profi tability 2010 UNDERWRITING RESULTS SHOW SIGNIFICANT IMPROVEMENT 3 Improved underwriting tools including CATography™ and increased use of Predictive Analytics 3 Emphasizing walk-away discipline as we conclude that the current pricing environment will exist for an extended period 3 Katrina event substantially behind us with no signifi cant adverse development 3 Continuation of “Profi t over Growth” |
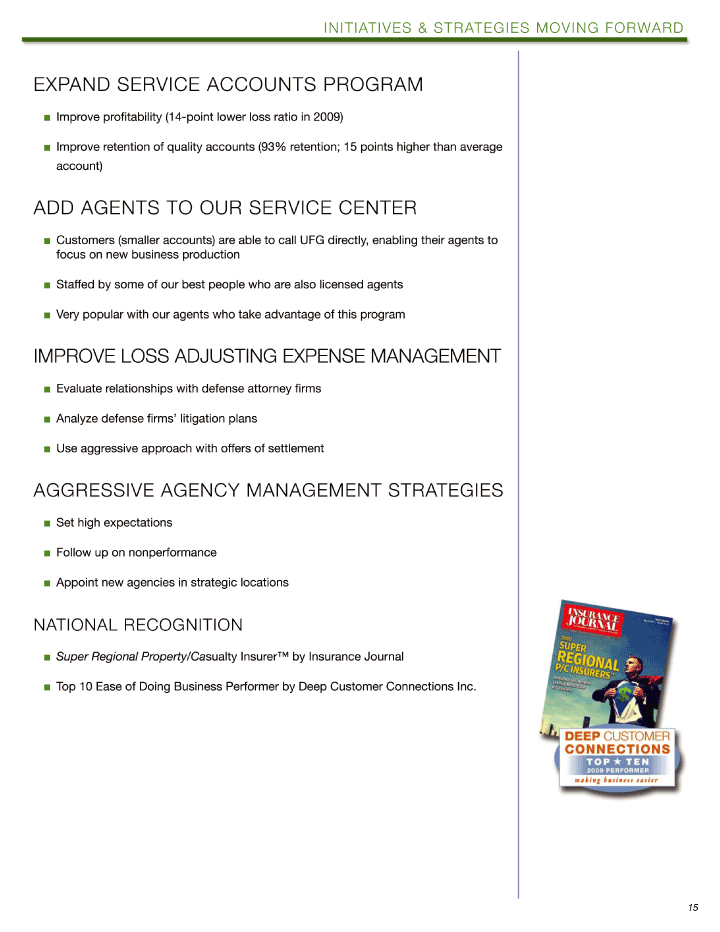
| EXPAND SERVICE ACCOUNTS PROGRAM
3 Improve profi tability (14-point lower loss ratio in 2009)
3 Improve retention of quality accounts (93% retention; 15 points higher than average
account)
ADD AGENTS TO OUR SERVICE CENTER
3 Customers (smaller accounts) are able to call UFG directly, enabling their agents
to focus on new business production
3 Staffed by some of our best people who are also licensed agents 3 Very popular with our agents who take advantage of this program IMPROVE LOSS ADJUSTING EXPENSE MANAGEMENT 3 Evaluate relationships with defense attorney fi rms 3 Analyze defense fi rms’ litigation plans 3 Use aggressive approach with offers of settlement AGGRESSIVE AGENCY MANAGEMENT STRATEGIES 3 Set high expectations 3 Follow up on nonperformance 3 Appoint new agencies in strategic locations NATIONAL RECOGNITION 3 Super Regional Property/Casualty Insurer™ by Insurance Journal 3 Top 10 Ease of Doing Business Performer by Deep Customer Connections Inc. |
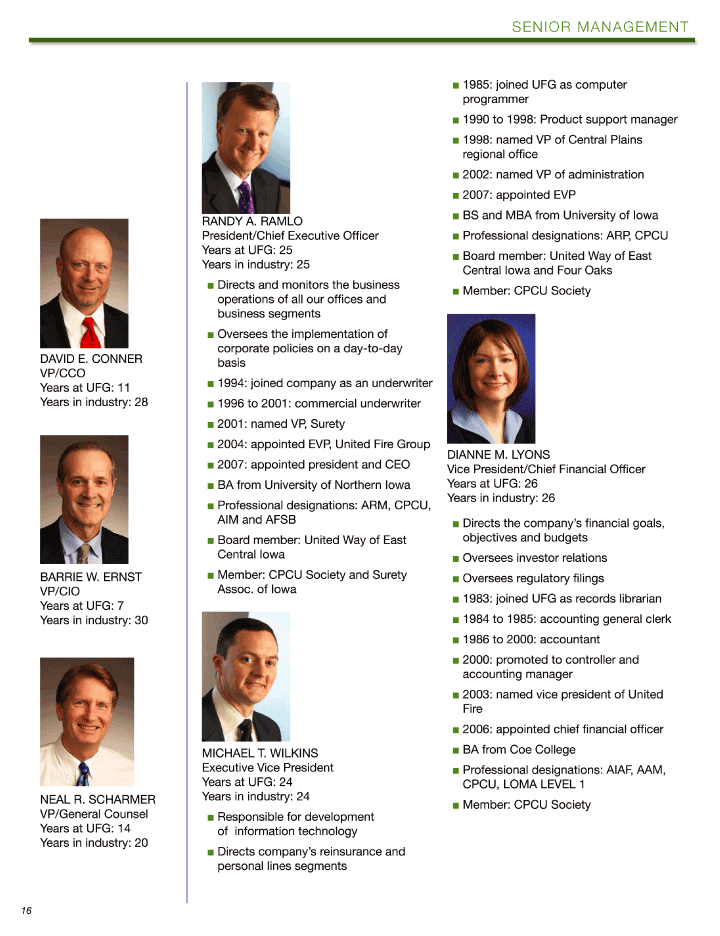
| DAVID E. CONNER VP/CCO Years at UFG: 11 Years in industry: 28 BARRIE W. ERNST VP/CIO Years at UFG: 7 Years in industry: 30 NEAL R. SCHARMER VP/General Counsel Years at UFG: 14 Years in industry: 20 RANDY A. RAMLO President/Chief Executive Offi cer Years at UFG: 25 Years in industry: 25 3 Directs and monitors the business operations of all our offi ces and business segments 3 Oversees the implementation of corporate policies on a day-to-day basis 3 1994: joined company as an underwriter 3 1996 to 2001: commercial underwriter 3 2001: named VP, Surety 3 2004: appointed EVP, United Fire Group 3 2007: appointed president and CEO 3 BA from University of Northern Iowa 3 Professional designations: ARM, CPCU, AIM and AFSB 3 Board member: United Way of East Central Iowa 3 Member: CPCU Society and Surety Assoc. of Iowa MICHAEL T. WILKINS Executive Vice President Years at UFG: 24 Years in industry: 24 3 Responsible for development of information technology 3 Directs company’s reinsurance and personal lines segments 3 1985: joined UFG as computer programmer 3 1990 to 1998: Product support manager 3 1998: named VP of Central Plains regional offi ce 3 2002: named VP of administration 3 2007: appointed EVP 3 BS and MBA from University of Iowa 3 Professional designations: ARP, CPCU 3 Board member: United Way of East Central Iowa and Four Oaks 3 Member: CPCU Society DIANNE M. LYONS Vice President/Chief Financial Offi cer Years at UFG: 26 Years in industry: 26 3 Directs the company’s fi nancial goals, objectives and budgets 3 Oversees investor relations 3 Oversees regulatory fi lings 3 1983: joined UFG as records librarian 3 1984 to 1985: accounting general clerk 3 1986 to 2000: accountant 3 2000: promoted to controller and accounting manager 3 2003: named vice president of United Fire 3 2006: appointed chief fi nancial offi cer 3 BA from Coe College 3 Professional designations: AIAF, AAM, CPCU, LOMA LEVEL 1 3 Member: CPCU Society |
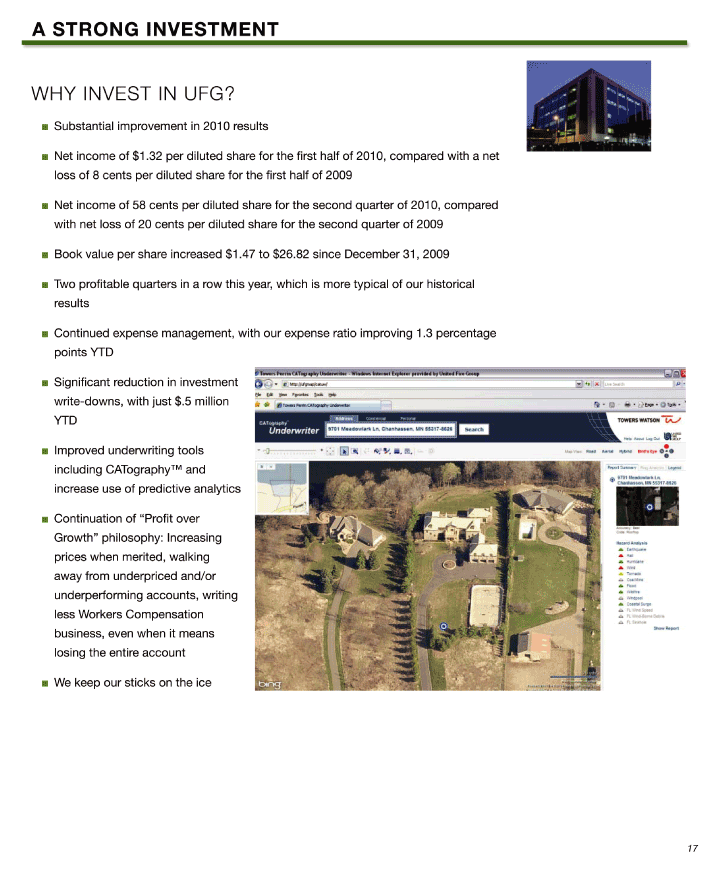
| WHY INVEST IN UFG? 3 Substantial improvement in 2010 results 3 Net income of $1.32 per diluted share for the fi rst half of 2010, compared with a net loss of 8 cents per diluted share for the fi rst half of 2009 3 Net income of 58 cents per diluted share for the second quarter of 2010, compared with net loss of 20 cents per diluted share for the second quarter of 2009 3 Book value per share increased $1.47 to $26.82 since December 31, 2009 3 Two profi table quarters in a row this year, which is more typical of our historical results 3 Continued expense management, with our expense ratio improving 1.3 percentage points YTD 3 Signifi cant reduction in investment write-downs, with just $.5 million YTD 3 Improved underwriting tools including CATography™ and increase use of predictive analytics 3 Continuation of “Profi t over Growth” philosophy: Increasing prices when merited, walking away from underpriced and/or underperforming accounts, writing less Workers Compensation business, even when it means losing the entire account 3 We keep our sticks on the ice |

UNITED FIRE GROUP®
118 Second Avenue SE
Cedar Rapids, Iowa 52401
www.ufgAgent.com
1-800-332-7977
This presentation may contain forward-looking statements about our operations, anticipated
performance and other similar matters. The forward-looking statements are not historical facts and
involve risks and uncertainties that could cause actual results to differ materially from those
expected and/or projected. Such forward-looking statements are based on current expectations,
estimates, forecasts and projections about our company, the industry in which we operate, and
beliefs and assumptions made by management. Words such as “expects,” “anticipates,” “intends,”
“plans,” “believes,” “continues,” “seeks,” “estimates,” “predicts,” “should,” “could,” “may,”
“continue,” “might,” “hope,” “once” and variations of such words and similar expressions are
intended to identify such forward-looking statements. These statements are not guarantees of future
performance and involve risks, uncertainties and assumptions that are difficult to predict.
Therefore, actual outcomes and results may differ materially from what is expressed in such
forward-looking statements. Readers are cautioned not to place undue reliance on these
forward-looking statements, which speak only as of the date of this presentation or as of the date
they are made.
ADM-2009
(updated 08162010)
