Attached files
Table of Contents
UNITED STATES
SECURITIES AND EXCHANGE COMMISSION
Washington, D.C. 20549
FORM 10-K
| x | ANNUAL REPORT PURSUANT TO SECTION 13 OR 15(d) OF THE |
SECURITIES EXCHANGE ACT OF 1934
For the fiscal year ended June 30, 2010
OR
| ¨ | TRANSITION REPORT PURSUANT TO SECTION 13 OR 15(d) OF THE |
SECURITIES EXCHANGE ACT OF 1934
For the transition period from to
Commission file number 1-6370
Elizabeth Arden, Inc.
(Exact name of registrant as specified in its charter)
| Florida | 59-0914138 | |
| (State or other jurisdiction of incorporation or organization) |
(I.R.S. Employer Identification No.) | |
| 2400 SW
145th Avenue, Miramar, Florida |
33027 | |
| (Address of principal executive offices) | (Zip Code) | |
(954) 364-6900
(Registrant’s telephone number, including area code)
Securities registered pursuant to Section 12(b) of the Act:
| Title of Security |
Name of Exchange on Which Registered | |
| Elizabeth Arden Common Stock, $.01 par value per share | Nasdaq Global Select Market |
Indicate by check mark if the registrant is a well-known seasoned issuer, as defined in Rule 405 of the Securities Act. Yes ¨ No þ
Indicate by check mark if the registrant is not required to file reports pursuant to Section 13 or Section 15(d) of the Act. Yes ¨ No þ
Indicate by check mark whether the registrant (1) has filed all reports required to be filed by Section 13 or 15(d) of the Securities Exchange Act of 1934 during the preceding 12 months (or for such shorter period that the registrant was required to file such reports), and (2) has been subject to such filing requirements for the past 90 days. Yes þ No ¨
Indicate by check mark whether the registrant has submitted electronically and posted on its corporate Web site, if any, every Interactive Data File required to be submitted and posted pursuant to Rule 405 of Regulation S-T (§232.405 of this chapter) during the preceding 12 months (or for such shorter period that the registrant was required to submit and post such files). Yes ¨ No ¨
Indicate by check mark if disclosure of delinquent filers pursuant to Item 405 of Regulation S-K (§229.405 of this chapter) is not contained herein, and will not be contained, to the best of registrant’s knowledge, in definitive proxy or information statements incorporated by reference in Part III of this Form 10-K or any amendment to this Form 10-K. ¨
Indicate by check mark whether the registrant is a large accelerated filer, an accelerated filer, a non-accelerated filer, or a smaller reporting company. See definition of “accelerated filer and large accelerated filer” in Rule 12b-2 of the Exchange Act. (Check one):
Large accelerated filer ¨ Accelerated filer þ Non-accelerated filer ¨ Smaller reporting company ¨
Indicate by check mark whether the registrant is a shell company (as defined in rule 12b-2 of the Act). Yes ¨ No þ
The aggregate market value of voting Common Stock held by non-affiliates of the registrant was approximately $234 million based on the closing price of the Common Stock on the NASDAQ Global Select Market of $14.43 per share on December 31, 2009, the last business day of the registrant’s most recently completed second fiscal quarter, based on the number of shares outstanding on that date less the number of shares held by the registrant’s directors, executive officers and holders of at least 10% of the outstanding shares of Common Stock.
As of August 16, 2010, the registrant had 27,752,611 shares of Common Stock outstanding.
Documents Incorporated by Reference
Portions of the Registrant’s definitive proxy statement relating to its 2010 Annual Meeting of Shareholders, to be filed no later than 120 days after the end of the Registrant’s fiscal year ended June 30, 2010, are hereby incorporated by reference in Part III of this Annual Report on Form 10-K.

1
Table of Contents
ELIZABETH ARDEN, INC.
| Page | ||||
| Part I |
||||
| Item 1. |
3 | |||
| Item 1A. |
14 | |||
| Item 1B. |
21 | |||
| Item 2. |
21 | |||
| Item 3. |
22 | |||
| Part II |
||||
| Item 5. |
23 | |||
| Item 6. |
26 | |||
| Item 7. |
Management’s Discussion and Analysis of Financial Condition and Results of Operation |
28 | ||
| Item 7A. |
48 | |||
| Item 8. |
50 | |||
| Item 9. |
Changes in and Disagreements with Accountants on Accounting and Financial Disclosure |
97 | ||
| Item 9A. |
97 | |||
| Item 9B. |
97 | |||
| Part III |
||||
| Item 10. |
97 | |||
| Item 11. |
98 | |||
| Item 12. |
Security Ownership of Certain Beneficial Owners and Management and Related Stockholder Matters |
98 | ||
| Item 13. |
Certain Relationships and Related Transactions, and Director Independence |
98 | ||
| Item 14. |
98 | |||
| Part IV |
||||
| Item 15. |
98 | |||
| 103 | ||||
2
Table of Contents
PART I
General
Elizabeth Arden, Inc. is a global prestige beauty products company with an extensive portfolio of prestige fragrance, skin care and cosmetics brands. Elizabeth Arden branded products include the Elizabeth Arden fragrances: Red Door, Elizabeth Arden 5th Avenue, Elizabeth Arden green tea, and Pretty Elizabeth Arden; the Elizabeth Arden skin care brands: Ceramide, Eight Hour Cream, Intervene and PREVAGE®; and the Elizabeth Arden branded lipstick, foundation and other color cosmetics products. Our prestige fragrance portfolio includes the following celebrity, lifestyle and designer fragrances:
| Celebrity Fragrances | The fragrance brands of Britney Spears, Elizabeth Taylor, Mariah Carey and Usher | |
| Lifestyle Fragrances | Curve, Giorgio Beverly Hills, PS Fine Cologne and White Shoulders | |
| Designer Fragrances | Juicy Couture, Kate Spade New York, John Varvatos, Rocawear, Alberta Ferretti, Halston, Geoffrey Beene, Badgley Mischka, Alfred Sung, Bob Mackie, and Lucky | |
In addition to our owned and licensed fragrance brands, we distribute approximately 300 additional prestige fragrance brands, primarily in the United States, through distribution agreements and other purchasing arrangements.
We sell our prestige beauty products to retailers and other outlets in the United States and internationally, including;
| • | U.S. department stores such as Macy’s, Dillard’s, Belk, Saks, Bloomingdales and Nordstrom; |
| • | U.S. mass retailers such as Wal-Mart, Target, Kohl’s, Sears, Walgreens, CVS, and Marmaxx; and |
| • | International retailers such as Boots, Debenhams, Ulta, Sephora, Marionnaud, Hudson’s Bay, Shoppers Drug Mart, Myer, Douglas and various travel retail outlets such as Nuance, Heinemann and World Duty Free. |
In the United States, we sell our Elizabeth Arden skin care and cosmetics products primarily in prestige department stores and our fragrances in department stores and mass retailers. We also sell our Elizabeth Arden fragrances, skin care and cosmetics products and other fragrance lines in approximately 100 countries worldwide through perfumeries, boutiques, department stores and travel retail outlets, such as duty free shops and airport boutiques, and on the internet.
At June 30, 2010, our operations were organized into the following reportable segments:
| • | North America Fragrance — Our North America Fragrance segment sells our portfolio of owned, licensed and distributed fragrances to department stores, mass retailers and distributors in the United States, Canada and Puerto Rico. This segment also sells our Elizabeth Arden products in prestige department stores in Canada and Puerto Rico, and to other selected retailers. This segment also includes our direct to consumer business, which is comprised of our Elizabeth Arden branded retail stores and global e-commerce business. |
| • | International — Our International segment sells our portfolio of owned and licensed brands, including our Elizabeth Arden branded products, in approximately 100 countries outside of North America through perfumeries, boutiques, department stores and travel retail outlets worldwide. |
3
Table of Contents
| • | Other — Our Other reportable segment sells our Elizabeth Arden products in prestige department stores in the United States and through the Red Door beauty salons, which are owned and operated by an unrelated third party that licenses the Elizabeth Arden and Red Door trademarks from us for use in its salons. |
Commencing July 1, 2010, our operations were reorganized into two reportable segments, North America and International. The portion of our business operations that sells our Elizabeth Arden products in prestige department stores in the United States and through the Red Door beauty salons has been consolidated with our North America Fragrance segment to create the North America segment.
Financial information relating to our reportable segments is included in Note 19 to the Notes to Consolidated Financial Statements.
Our net sales to customers in the United States and in foreign countries (in U.S. dollars) and net sales as a percentage of consolidated net sales for the years ended June 30, 2010, 2009 and 2008, are listed in the following chart:
| Year Ended June 30, | ||||||||||||||||||
| 2010 | 2009 | 2008 | ||||||||||||||||
| (Amounts in millions) | Sales | % | Sales | % | Sales | % | ||||||||||||
| United States |
$ | 670.3 | 61 | % | $ | 652.7 | 61 | % | $ | 685.4 | 60 | % | ||||||
| Foreign |
433.5 | 39 | % | 417.5 | 39 | % | 455.7 | 40 | % | |||||||||
| Total |
$ | 1,103.8 | 100 | % | $ | 1,070.2 | 100 | % | $ | 1,141.1 | 100 | % | ||||||
Our largest foreign countries in terms of net sales for the years ended June 30, 2010, 2009 and 2008, are listed in the following chart:
| Year Ended June 30, | |||||||||
| (Amounts in millions) | 2010 | 2009 | 2008 | ||||||
| United Kingdom |
$ | 70.3 | $ | 73.6 | $ | 85.7 | |||
| Australia |
38.2 | 32.2 | 40.1 | ||||||
| Canada |
33.9 | 35.2 | 40.0 | ||||||
| South Africa |
21.1 | 17.0 | 17.7 | ||||||
| China |
20.4 | 21.4 | 16.6 | ||||||
| Spain |
19.3 | 21.9 | 28.1 | ||||||
The financial results of our international operations are subject to volatility due to fluctuations in foreign currency exchange rates, inflation, disruptions in travel and changes in political and economic conditions in the countries in which we operate. The value of our international assets is also affected by fluctuations in foreign currency exchange rates. For information on the breakdown of our long-lived assets in the United States and internationally, and risks associated with our international operations, see Note 19 to the Notes to Consolidated Financial Statements.
Our principal executive offices are located at 2400 S.W. 145th Avenue, Miramar, Florida 33027, and our telephone number is (954) 364-6900. We maintain a website with the address www.elizabetharden.com. We are not including information contained on our website as part of, nor incorporating it by reference into, this Annual Report on Form 10-K. We make available free of charge through our website our Annual Reports on Form 10-K, Quarterly Reports on Form 10-Q and Current Reports on Form 8-K, and amendments to these reports, as soon as reasonably practicable after we electronically file such material with or furnish such material to the Securities and Exchange Commission.
4
Table of Contents
Information relating to corporate governance at Elizabeth Arden, Inc., including our Corporate Governance Guidelines and Principles, Code of Ethics for Directors and Executive and Finance Officers, Code of Business Conduct and charters for our Lead Independent Director, the Audit Committee, the Compensation Committee and the Nominating and Corporate Governance Committee, is available on our website under the section “Corporate Info — Investor Relations — Corporate Governance.” We will provide the foregoing information without charge upon written request to Secretary, Elizabeth Arden, Inc., 2400 S.W. 145th Avenue, Miramar, FL 33027.
Business Strategy
Our business strategy is to increase net sales, operating margins and earnings by (a) increasing the sales of the Elizabeth Arden brand through leveraging the global awareness of the Elizabeth Arden brand name, targeting fast-growing geographical markets, and focusing on our skin care expertise and classic products, such as our Eight Hour Cream, Ceramide skin care products and Red Door fragrance, (b) increasing the sales of our prestige fragrance portfolio internationally, particularly in the large European fragrance market, and through licensing opportunities and acquisitions, (c) expanding the prestige fragrance category at mass retail customers in North America, (d) continuing to expand operating margins, working capital efficiency and return on invested capital, and (e) capitalizing on the growth potential of our global brands by focusing on both organic growth opportunities as well as those achieved through new product innovation.
We believe the Elizabeth Arden brand is one of the most widely recognized beauty brands in the world and is associated with high quality products, and we intend to continue to invest behind and grow this brand on a global basis through (i) continued expansion in high-growth markets, such as Asia and developing markets, (ii) innovation in skin care and color products based on new technologies, (iii) focusing on our classic products such as our Eight Hour Cream, Ceramide skin care products and Red Door fragrance, (iv) leveraging the 100th anniversary of the Elizabeth Arden brand during 2010 and 2011, as well as the marketing opportunities provided by the Red Door Spa heritage, which we believe affords us a competitive advantage, and (v) continuing to cultivate strong partnerships with key global retailers.
In fiscal 2010, we launched a key initiative to expand our market share for fragrances in Western Europe. The Western European fragrance market is significantly larger than the North American fragrance market, and we believe this offers opportunities for us to expand the sales of our fragrance portfolio. We recently added resources to implement this strategy. We believe many of our fragrance brands, including our Elizabeth Arden fragrances and the Juicy Couture, Britney Spears and John Varvatos fragrance brands, resonate well with retailers and consumers in those markets.
During fiscal 2010, we increased our market share in the prestige fragrance category with mass retailers in North America. We have worked closely with our mass retail customers and nationally recognized merchandising and advertising companies to develop and implement a variety of marketing and product merchandising initiatives intended to improve the shopping experience for mass retail fragrance shoppers and expand this category at these retailers.
Since fiscal 2007, we have been engaged in a series of activities intended to increase business efficiencies throughout our company, particularly in the supply chain, distribution, logistics, information technology and finance areas, to improve our cash flow, operating margins and profitability and to accommodate the anticipated growth of our business. We call this effort our Global Efficiency Re-engineering initiative, and it consists of (i) improvements in the efficiency of our supply chain, distribution, logistics and business processes, (ii) a migration to a shared services model to simplify transaction processing by consolidating our primary global transaction processing functions, and (iii) the implementation of an Oracle financial accounting and order processing system.
5
Table of Contents
In July 2009, we completed the first phase of the implementation of an Oracle financial accounting system (general ledger and accounts payable), and in April 2010, we completed the second phase of the implementation (order to cash). Both phases of this financial accounting system implementation were completed on time and on budget. As part of this financial accounting system implementation we also migrated to a shared services model for our primary global transaction processing functions that is expected to improve our transactional processes and management reporting.
During fiscal 2010, we continued to focus on improving our sales and operations planning processes and our supply chain and logistics efficiency. We have implemented a “turnkey” model for substantially all our fragrance and color cosmetic products in which our contract manufacturers have assumed the administrative responsibility for planning and purchasing raw materials and components, while we continue to govern strategic sourcing and pricing with all raw materials and components vendors. We expect to implement this “turnkey” manufacturing model with respect to most of our skin care products during fiscal 2011.
During fiscal 2010, we realigned our global marketing organization to further capitalize on the growth potential of our global brands. We recently hired a Chief Marketing Officer and have established regional marketing teams located closer to our affiliate markets. These efforts are intended to improve the ability of our marketing organization to respond to local market needs, while establishing a more strategic focus across our brands and various geographic markets.
Recent License Agreements
Effective June 9, 2008, we became the exclusive, global licensee for the manufacture, distribution, marketing and sale of the Liz Claiborne fragrance brands under a long-term agreement with Liz Claiborne, Inc. and certain of its affiliates. The Liz Claiborne fragrance portfolio includes the Juicy Couture, Curve and Lucky fragrances. In connection with the Liz Claiborne license agreement we also assumed a license for the Usher celebrity fragrances. The Liz Claiborne licensing arrangement has enabled us to (i) grow our market share in our North America Fragrance segment, (ii) increase our gross margins in our North America Fragrance segment by converting existing mass customer sales from distribution margins to owned/licensed margins, and (iii) add sales volume to our International segment, particularly with the Juicy Couture fragrance brand.
During fiscal 2010, we also entered into exclusive global licensing agreements with Liz Claiborne Inc. for the manufacture, distribution and marketing of Kate Spade fragrances and with John Varvatos Apparel Corp. for the development, marketing and distribution of John Varvatos fragrances.
Products
Our net sales of products and net sales of products as a percentage of consolidated net sales for the years ended June 30, 2010, 2009 and 2008, are listed in the following chart:
| Year Ended June 30, | ||||||||||||||||||
| 2010 | 2009 | 2008 | ||||||||||||||||
| (Amounts in millions) | Sales | % | Sales | % | Sales | % | ||||||||||||
| Fragrance |
$ | 854.0 | 77 | % | $ | 835.3 | 78 | % | $ | 845.4 | 74 | % | ||||||
| Skin Care |
183.0 | 17 | % | 175.2 | 16 | % | 217.6 | 19 | % | |||||||||
| Cosmetics |
66.8 | 6 | % | 59.7 | 6 | % | 78.1 | 7 | % | |||||||||
| Total |
$ | 1,103.8 | 100 | % | $ | 1,070.2 | 100 | % | $ | 1,141.1 | 100 | % | ||||||
6
Table of Contents
Fragrance. We offer a wide variety of fragrance products for both men and women, including perfume, colognes, eau de toilettes, eau de parfums, body sprays and gift sets. Our fragrances are classified into the Elizabeth Arden branded fragrances, celebrity branded fragrances, designer branded fragrances, and lifestyle fragrances. Each fragrance is sold in a variety of sizes and packaging assortments. In addition, we sell bath and body products that are based on the particular fragrance to complement the fragrance lines, such as soaps, deodorants, body lotions, gels, creams and dusting powders. We sell fragrance products worldwide, primarily to department stores, mass retailers, perfumeries, boutiques, distributors and travel retail outlets. We tailor the size and packaging of the fragrance to suit the particular target customer.
Skin Care. Our skin care lines are sold under the Elizabeth Arden name and include products such as moisturizers, creams, lotions and cleansers. Our core Elizabeth Arden branded products include Ceramide, PREVAGE®, Eight Hour Cream, and Intervene. Our Ceramide skin care line targets women who are 40 and over. PREVAGE® is our premium cosmeceutical skin care line. Our Eight Hour Cream franchise has a strong international following. We sell skin care products worldwide, primarily in prestige department and specialty stores, perfumeries and travel retail outlets.
Cosmetics. We offer a variety of cosmetics under the Elizabeth Arden name, including foundations, lipsticks, mascaras, eye shadows and powders. We offer these products in a wide array of shades and colors. The largest component of our cosmetics business is foundations, which we market in conjunction with our Ceramide and Intervene skin care products. We sell our cosmetics internationally and in the United States, primarily in prestige department and specialty stores, perfumeries and travel retail outlets.
Trademarks, Licenses and Patents
We own or have rights to use the trademarks necessary for the manufacturing, marketing, distribution and sale of numerous fragrance, cosmetic and skin care brands, including Elizabeth Arden’s Red Door, Red Door Revealed, Elizabeth Arden 5th Avenue, Elizabeth Arden Provocative Woman, Pretty Elizabeth Arden, Plump Perfect, Intervene, White Shoulders, Halston, Z-14, PS Fine Cologne for Men, Design and Wings. These trademarks are registered or have pending applications in the United States and in certain of the countries in which we sell these product lines. We consider the protection of our trademarks to be important to our business.
We are the exclusive worldwide trademark licensee for a number of fragrance brands including:
| • | the Britney Spears fragrances curious Britney Spears, fantasy Britney Spears, Britney Spears believe and radiance Britney Spears; |
| • | the Elizabeth Taylor fragrances White Diamonds and Elizabeth Taylor’s Passion; |
| • | the Mariah Carey fragrances M by Mariah Carey and Luscious Pink; |
| • | the Usher fragrances He, She, UR for Men, and UR for Women; |
| • | the Liz Claiborne fragrances Curve, Realities, Lucky, Mambo and Bora Bora; |
| • | the Juicy Couture fragrances Juicy Couture, Viva la Juicy and Couture Couture; |
| • | the Giorgio fragrances Giorgio Beverly Hills and Giorgio Red; |
| • | the Alfred Sung fragrances SUNG Alfred Sung, SHI Alfred Sung and JEWEL Alfred Sung; and |
| • | the designer fragrance brands of Badgley Mischka, Alberta Ferretti, John Varvatos, Rocawear, Bob Mackie, Geoffrey Beene and Halston. |
7
Table of Contents
We are the exclusive worldwide licensee for the PREVAGE® skin care line for department stores. The Elizabeth Taylor license agreement terminates in October 2022 and is renewable by us, at our sole option, for unlimited 20-year periods. The Britney Spears license was renewed for an additional five-year term until December 2014. The PREVAGE® license has been renewed through December 2015 and is renewable by us for unlimited five-year terms if certain sales targets are achieved. The license agreement with Liz Claiborne Inc. and its affiliates relating to the Liz Claiborne and Juicy Couture fragrances terminates in December 2017, and is renewable by us for two additional five-year terms, provided specified conditions, including certain sales targets, are met. The other license agreements have terms with expirations ranging from 2010 to 2045 and beyond, and, typically, have renewal terms dependent on sales targets being achieved. Many of our license agreements are subject to our obligation to make required minimum royalty payments, minimum advertising and promotional expenditures and/or, in some cases, minimum sales requirements.
We also have the right under various exclusive distributor and license agreements and other arrangements to distribute other fragrances in various territories and to use the registered trademarks of third parties in connection with the sale of these products.
Certain of our skin care and cosmetic products and the PREVAGE® skin care line incorporate patented or patent-pending formulations. In addition, several of our packaging methods, packages, components and products are covered by design patents, patent applications and copyrights. Substantially all of our trademarks and all of our patents are held by us or by one of our wholly-owned United States subsidiaries.
Sales and Distribution
We sell our prestige beauty products to retailers in the United States, including department stores such as Macy’s, Dillard’s, Saks, Belk, Bloomingdales and Nordstrom; specialty stores such as Ulta and Sephora; and mass retailers such as Wal-Mart, Target, Kohl’s, Sears, Walgreens, CVS and Marmaxx; and to international retailers such as Boots, Debenhams, Sephora, Marionnaud, Hudson’s Bay, Shoppers Drug Mart, Myer, Douglas and various travel retail outlets such as Nuance, Heinemann and World Duty Free. We also sell products to independent fragrance, cosmetic, gift and other stores. We currently sell our skin care and cosmetics products in North America primarily in prestige department and specialty stores. We also sell our fragrances, skin care and cosmetic products in approximately 100 other countries worldwide primarily through department stores, perfumeries, pharmacies, specialty retailers, and other retail shops and “duty free” and travel retail locations. In certain countries, we maintain a dedicated sales force that solicits orders and provides customer service. In other countries and jurisdictions, we sell our products through local distributors or sales representatives under contractual arrangements. We manage our operations outside of North America from our offices in Geneva, Switzerland.
We sell our Elizabeth Arden products in the Elizabeth Arden 5th Avenue store in New York, which we operate, and have recently begun opening a limited number of outlet stores in Florida and New York in which we sell several of our Elizabeth Arden and other products. Our owned and licensed products are also marketed and sold through our e-commerce site at www.elizabetharden.com. In addition, our Elizabeth Arden products are sold in Red Door beauty salons, which are owned and operated by an unrelated third party. In addition to the sales price of our products sold to the operator of these salons, we receive a licensing fee based on the net sales from each of the salons for the use of the “Elizabeth Arden” or “Red Door” trademarks.
8
Table of Contents
Our sales personnel are organized by customer account. Our sales force routinely visits retailers to assist in the merchandising, layout and stocking of selling areas. In the U.S., we have a sales force for Elizabeth Arden branded products that are sold in prestige distribution. For many of our mass retailers in the United States and Canada, we sell basic products in special packaging that deter theft and permit the products to be sold in open displays. Our fulfillment capabilities enable us to reliably process, assemble and ship small orders on a timely basis. We use this ability to assist our customers in their retail distribution through “drop shipping” directly to their stores and by fulfilling their sales of beauty products over the internet.
As is customary in the beauty industry, we do not generally have long-term or exclusive contracts with any of our retail customers. Sales to customers are generally made pursuant to purchase orders. We believe that our continuing relationships with our customers are based upon our ability to provide a wide selection and reliable source of prestige beauty products, our expertise in marketing and new product introduction, and our ability to provide value-added services, including our category management services, to U.S. mass retailers.
Our ten largest customers accounted for approximately 39% of net sales for the year ended June 30, 2010. The only customer that accounted for more than 10% of our net sales during that period was Wal-Mart (including Sam’s Club), which accounted for approximately 15% of our consolidated net sales and approximately 24% of our North America Fragrance segment net sales. The loss of, or a significant adverse change in our relationship with, any of our largest customers could have a material adverse effect on our business, prospects, results of operations, financial condition or cash flows.
The industry practice for businesses that market beauty products has been to grant certain retailers (primarily North American prestige department stores and specialty beauty stores), subject to our authorization and approval, the right to either return merchandise or to receive a markdown allowance for certain products. We establish estimated return reserves and markdown allowances at the time of sale based upon our level of sales, historical and projected experience with product returns and markdowns in each of our business segments and with respect to each of our product types, current economic trends and changes in customer demand and customer mix. Our return reserves and markdown allowances are reviewed and updated as needed during the year, and additions to these reserves and allowances may be required. Additions to these reserves and allowances may have a negative impact on our financial results.
Marketing
Our marketing approach emphasizes strong positioning for each brand, which is consistently reflected in all consumer touch points, including advertising, packaging, product experience and at point of sale. Our advertising and marketing activities are designed to optimize the engagement of our target consumer and utilize traditional print, television and radio advertising, and point-of-sale merchandising, including displays and sampling. For Elizabeth Arden brand products, we utilize our iconic Red Door symbol to reinforce the Elizabeth Arden brand heritage globally. We increasingly rely on new and innovative marketing methods, such as digital technologies, including our Elizabeth Arden website, the internet, social media sites, and mobile devices and downloads. During 2010 and 2011, we are using the landmark 100th anniversary of the Elizabeth Arden brand as a platform to launch a multi media advertising and public relations campaign to increase brand awareness and leverage retail opportunity on a global level.
During fiscal 2010, we created and filled the new position of Chief Marketing Officer and announced a re-organization of our global marketing department to better capitalize on our global growth opportunities. This new structure, which became effective July 1, 2010, includes the creation of global brand management teams, which are responsible for the overall brand strategy, and regional marketing teams, which are responsible for leading the local marketing efforts in their respective regions. We believe this organizational structure is consistent with the best practices of other successful global consumer products companies.
9
Table of Contents
Our marketing programs are also integrated with significant cooperative advertising programs that we plan and execute with our retailers, often linked with new product innovation and promotions. In our department store and perfumery accounts, we periodically promote our brands with “gift with purchase” and “purchase with purchase” programs. At in-store counters, sales representatives offer personal demonstrations to market individual products. We also engage in extensive sampling programs.
New product introductions are important in attracting consumers to our brands and in creating brand excitement with our retail customers. Our efforts are primarily focused on the identification of consumer needs and shifts in consumer preferences in order to develop new fragrance, skin care and cosmetic products, develop line extensions and promotions, and redesign or reformulate existing products.
In fiscal 2010, we introduced a number of new Elizabeth Arden branded products, including PREVAGE® Day SPF 30, a new Ceramide Ultra Moisture Cream and Lotion, and flanker fragrances for our classic Elizabeth Arden 5th Avenue and Elizabeth Arden green tea fragrances. We will continue to focus on our core Elizabeth Arden branded skin care and color cosmetics products by investing in new product innovation and technologies and increased advertising. In addition, during fiscal 2010 we launched a number of fragrances, including a new Juicy Couture fragrance, Couture Couture, as well as new fragrances under our Britney Spears, Mariah Carey, Elizabeth Taylor, Alberta Ferretti, and Halston licenses, and we plan fragrance launches for fiscal 2011 under our Elizabeth Arden, Britney Spears, Mariah Carey, Kate Spade and John Varvatos fragrance brands.
With many of our retail customers, our marketing personnel often design model schematic planograms for the customer’s fragrance department, identify trends in consumer preferences and adapt the product assortment to these trends, conduct training programs for the customer’s sales personnel and manage in-store “special events.” Our marketing personnel also work to design gift sets tailored to the customer’s needs. For certain customers, we provide comprehensive sales analysis and active management of the prestige fragrance category. We believe these services distinguish us from our competitors and contribute to customer loyalty.
Seasonality
Our operations have historically been seasonal, with higher sales generally occurring in the first half of our fiscal year as a result of increased demand by retailers in anticipation of and during the holiday season. For the year ended June 30, 2010, approximately 60% of our net sales were made during the first half of our fiscal year. Due to product innovations and new product launches, the size and timing of certain orders from our customers, and additions or losses of brand distribution rights, sales, results of operations, working capital requirements and cash flows can vary significantly between quarters of the same and different years. As a result, we expect to experience variability in net sales, operating margin, net income, working capital requirements and cash flows on a quarterly basis. Increased sales of skin care and cosmetic products relative to fragrances may reduce the seasonality of our business.
We experience seasonality in our working capital, with peak inventory levels normally from July to October and peak receivable balances normally from September to December. Our working capital borrowings are also seasonal and are normally highest in the months of September, October and November. During the months of December, January and February of each year, cash is normally generated as customer payments on holiday season orders are received.
Manufacturing, Supply Chain and Logistics
We use third-party suppliers and contract manufacturers in the United States and Europe to obtain substantially all of our raw materials, components and packaging products and to manufacture finished products relating to our owned and licensed brands. Our fragrance and skin care products have primarily been manufactured by Cosmetic Essence LLC (CEI), an unrelated
10
Table of Contents
third party, in plants located in New Jersey and Roanoke, Virginia. Third parties in Europe also manufacture certain of our fragrance and cosmetic products. We also have a small manufacturing facility in South Africa primarily to manufacture local requirements of our products.
As part of our Global Efficiency Re-engineering project, we have reduced the number of contract manufacturers and raw material suppliers that we use. We also have substantially completed the transition to a “turnkey” manufacturing model with the majority of our contract manufacturers in the United States and Europe, including CEI. Under the “turnkey” manufacturing model, our contract manufacturers assume administrative responsibility for planning and purchasing raw materials and components, while we continue to govern strategic sourcing and pricing with all raw materials and components vendors. Any supply chain disruptions caused by our supply chain re-engineering efforts may adversely affect our business, prospects, results of operations, financial condition or cash flows.
As is customary in our industry, historically we have not had long-term or exclusive agreements with contract manufacturers of our owned and licensed brands or with fragrance manufacturers or suppliers of our distributed brands, and generally made purchases through purchase orders. As we implement our “turnkey” manufacturing model we anticipate that we will enter into supply agreements for finished goods with our most significant manufacturers. We believe that we have good relationships with manufacturers of our owned and licensed brands and that there are alternative sources should one or more of these manufacturers become unavailable. We receive our distributed brands in finished goods form directly from fragrance manufacturers, as well as from other sources. The ten largest fragrance brands that are distributed by us on a non-exclusive basis accounted for approximately 13% of our net sales for the year ended June 30, 2010. The loss of, or a significant adverse change in our relationship with, any of our key fragrance manufacturers for our owned and licensed brands, such as CEI, or suppliers of our distributed fragrance brands could have a material adverse effect on our business, prospects, results of operations, financial condition or cash flows.
Our fulfillment operations for the United States and certain other areas of the world are conducted out of a leased distribution facility in Roanoke, Virginia. The 400,000 square-foot Roanoke facility accommodates our distribution activities and houses a large portion of our inventory. Our fulfillment operations for Europe are conducted under a logistics services agreement by CEPL, an unrelated third party, at CEPL’s facility in Beville, France. The CEPL agreement expires in June 2013. While we insure our inventory and the Roanoke facility, the loss of either of these distribution facilities, or the inventory stored in those facilities, would require us to find replacement facilities or inventory and could have a material adverse effect on our business, prospects, results of operations, financial condition or cash flows.
Government Regulation
We and our products are subject to regulation by the Food and Drug Administration and the Federal Trade Commission in the United States, as well as by various other federal, state, local and international regulatory authorities in the countries in which our products are produced or sold. Such regulations principally relate to the ingredients, manufacturing, labeling, packaging and marketing of our products. We believe that we are in substantial compliance with such regulations, as well as with applicable federal, state, local and international and other countries’ rules and regulations governing the discharge of materials hazardous to the environment. Changes in such regulations, or in the manner in which such regulations are interpreted or applied, could have a material adverse effect on our business, prospects, results of operations, financial condition or cash flows.
11
Table of Contents
Management Information Systems
Our primary information technology systems discussed below provide a complete portfolio of business systems, business intelligence systems, and information technology infrastructure services to support our global operations:
| • | Logistics and supply chain systems, including purchasing, materials management, manufacturing, inventory management, order management, customer service, pricing, demand planning, warehouse management and shipping; |
| • | Financial and administrative systems, including general ledger, payables, receivables, personnel, payroll, tax, treasury and asset management; |
| • | Electronic data interchange systems to enable electronic exchange of order, status, invoice, and financial information with our customers, financial service providers and our partners within the extended supply chain; |
| • | Business intelligence and business analysis systems to enable management’s informational needs as they conduct business operations and perform business decision making; and |
| • | Information technology infrastructure services to enable seamless integration of our global business operations through Wide Area Networks (WAN), personal computing technologies, electronic mail, and service agreements with outsourced computing operations. |
These management information systems and infrastructure provide on-line business process support for our global business operations. Further, many of these capabilities have been extended into the operations of certain of our U.S. customers and third party service providers to enhance these arrangements, with examples such as vendor managed inventory, third party distribution, third party manufacturing, inventory replenishment, customer billing, retail sales analysis, product availability, pricing information and transportation management.
In connection with our Global Efficiency Re-engineering initiative, during fiscal 2010 we completed the implementation of an Oracle financial accounting system (general ledger, accounts payable and order to cash), in accordance with our projected timeline and on budget. This implementation was intended to improve key transaction processes and accommodate the anticipated growth of our business. We expect this infrastructure investment to simplify our transaction processing by utilizing a common platform to centralize our primary global transaction processing functions.
We outsource certain areas of our information technology infrastructure to IBM, a leading global information services and technology provider. IBM also provides us with backup facilities and disaster recovery capabilities to enhance the reliability of our management information systems, and which are designed to continue to operate if our main facilities should fail. We also have a disaster recovery plan, which is tested periodically, to protect our business operations and customer information. We also have business interruption insurance to cover a portion of any disruption in our management information systems resulting from certain hazards.
Competition
The beauty industry is highly competitive and can change rapidly due to consumer preferences and industry trends. Competition in the beauty industry is based on brand strength, pricing, and assortment of products, innovation, perceived value, product availability and order fulfillment, service to the customer, promotional activities, advertising, special events, new product introductions and other activities.
We believe that we compete primarily on the basis of brand recognition, quality, product efficacy, price, and our emphasis on providing value-added customer services, including category management services, to certain retailers. There are products that are better-known and more popular than the products manufactured or supplied by us. Many of our competitors are
12
Table of Contents
substantially larger and more diversified, and have substantially greater financial and marketing resources than we do, as well as greater name recognition and the ability to develop and market products similar to and competitive with those manufactured by us.
Employees
As of August 16, 2010, we had approximately 2,240 full-time employees and approximately 382 part-time employees in the United States and 17 foreign countries. None of our employees are covered by a collective bargaining agreement. We believe that our relationship with our employees is satisfactory.
Executive Officers of the Company
The following sets forth the names and ages of each of our executive officers as of August 12, 2010 and the positions they hold:
| Name |
Age | Position with the Company | ||
| E. Scott Beattie |
51 | Chairman, President and Chief Executive Officer | ||
| Stephen J. Smith |
50 | Executive Vice President and Chief Financial Officer | ||
| Joel B. Ronkin |
42 | Executive Vice President, General Manager — North America | ||
| Pierre Pirard |
42 | Executive Vice President — Product Innovation and Global Supply Chain | ||
| Kathy Widmer |
48 | Executive Vice President and Chief Marketing Officer | ||
| Oscar E. Marina |
51 | Executive Vice President, General Counsel and Secretary | ||
| L. Hoy Heise |
64 | Executive Vice President and Chief Information Officer |
Each of our executive officers holds office for such term as may be determined by our board of directors. Set forth below is a brief description of the business experience of each of our executive officers.
E. Scott Beattie has served as Chairman of our Board of Directors since April 2000, as our Chief Executive Officer since March 1998, and as one of our directors since January 1995. Mr. Beattie also has served as our President since August 2006, a position he also held from April 1997 to March 2003. In addition, Mr. Beattie served as our Chief Operating Officer from April 1997 to March 1998, and as Vice Chairman of the Board of Directors and Assistant Secretary from November 1995 to April 1997. He is a director of ObjectVideo, Inc., an information technology company. Mr. Beattie is also a director and a member of the executive committee of the Personal Care Products Council, the national trade association for the cosmetic and personal care products industry, a member of the advisory board of the Ivey Business School, and a member of the board of directors of PENCIL, a not-for-profit organization that benefits New York City public schools.
Stephen J. Smith has served as our Executive Vice President and Chief Financial Officer since May 2001. Previously, Mr. Smith was with PricewaterhouseCoopers LLP, an international professional services firm, as partner from October 1993 until May 2001, and as manager from July 1987 until October 1993.
Joel B. Ronkin has served as our Executive Vice President, North America since July 2010, as our General Manager — North America Fragrances from July 2006 to July 2010, as our Executive Vice President and Chief Administrative Officer from April 2004 to June 2006, as our Senior Vice President and Chief Administrative Officer from February 2001 through March 2004, and as our Vice President, Associate General Counsel and Assistant Secretary from March 1999 through January 2001. From June 1997 through March 1999, Mr. Ronkin served as the Vice President, Secretary and General Counsel of National Auto Finance Company, Inc., an automobile finance company. From May 1992 to June 1997, Mr. Ronkin was an attorney with the law firm of Steel Hector & Davis L.L.P. in Miami, Florida.
13
Table of Contents
Kathy Widmer has served as our Executive Vice President and Chief Marketing Officer since November 2009. Prior to joining us, Ms. Widmer was with Johnson & Johnson for 21 years where she held numerous positions, including, most recently, serving as Vice President, Marketing, McNeil Consumer Healthcare from May 2008 until November 2009. Prior to May 2008, Ms. Widmer served as Franchise Director and Product Director for various Johnson and Johnson consumer products, including Tylenol, Motrin, Reach Oral Care, and Pepcid from August 1996 until April 2008.
Pierre Pirard has served as our Executive Vice President, Product Innovation and Global Supply Chain since February 2010. From November 2007 until February 2010, he served as our Senior Vice President, Global Supply Chain. Prior to joining us, Mr. Pirard spent 15 years at Johnson & Johnson where he held numerous positions, including, serving as Regional Director, External Manufacturing North America — Consumer Sector, from 2005 unit 2007; as Regional Director — Supply Chain Planning North America — Consumer Sector from 2001 to 2005; and in various positions in the finance, project management, supply and logistics groups for Johnson & Johnson Canada from 1992 to 2000.
Oscar E. Marina has served as our Executive Vice President, General Counsel and Secretary since April 2004, as our Senior Vice President, General Counsel and Secretary from March 2000 to March 2004, and as our Vice President, General Counsel and Secretary from March 1996 to March 2000. From October 1988 to March 1996, Mr. Marina was an attorney with the law firm of Steel Hector & Davis L.L.P. in Miami, becoming a partner of the firm in January 1995.
L. Hoy Heise has served as our Executive Vice President and Chief Information Officer since November 2007, as our Executive Vice President, Chief Information Officer and Operations Planning from March 2006 to November 2007, and as our Senior Vice President and Chief Information Officer from May 2004 to February 2006. From February 2003 to April 2004, Mr. Heise was the founder and principal of his own technology consulting firm. From June 1999 until May 2001, Mr. Heise was Senior Vice President of Gartner, an information technology research firm. Prior to that time, Mr. Heise worked in various management and consulting capacities for Renaissance Worldwide, a global provider of business process improvement and information technology consulting services.
The risk factors in this section describe the major risks to our business, prospects, results of operations, financial condition and cash flows, and should be considered carefully. In addition, these factors constitute our cautionary statements under the Private Securities Litigation Reform Act of 1995 and could cause our actual results to differ materially from those projected in any forward-looking statements (as defined in such act) made in this Annual Report on Form 10-K. Investors should not place undue reliance on any such forward-looking statements. Any statements that are not historical facts and that express, or involve discussions as to, expectations, beliefs, plans, objectives, assumptions or future events or performance (often, but not always, through the use of words or phrases such as “will likely result,” “are expected to,” “will continue,” “is anticipated,” “estimated,” “intends,” “plans,” “believes” and “projects”) may be forward-looking and may involve estimates and uncertainties which could cause actual results to differ materially from those expressed in the forward-looking statements.
Further, any forward-looking statement speaks only as of the date on which such statement is made, and we undertake no obligation to update any forward-looking statement to reflect events or circumstances after the date on which such statement is made or to reflect the occurrence of anticipated or unanticipated events or circumstances. New factors emerge from time to time, and it is not possible for us to predict all of such factors. Further, we cannot assess the impact of each such factor on our results of operations or the extent to which any factor, or combination of factors, may cause actual results to differ materially from those contained in any forward-looking statements.
14
Table of Contents
Adverse U.S. and global economic conditions could negatively impact our business, prospects, results of operations, financial condition or cash flows.
Adverse U.S. and global economic conditions, such as the economic conditions in place since late 2008 can contribute to higher unemployment levels, decreased consumer spending, reduced credit availability and declining consumer confidence and demand, each of which poses risks to our business. A decrease in consumer spending and/or in retailer and consumer confidence and demand for our products could significantly negatively impact our net sales and profitability, including our operating margins and return on invested capital. Such economic conditions could cause some of our customers to experience cash flow problems, which could adversely affect product orders, payment patterns and default rates and increase our bad debt expense. Adverse economic conditions could also adversely affect our access to the capital necessary for our business and our ability to remain in compliance with the financial covenant in our revolving credit facility that applies only in the event that we do not have the requisite average borrowing base capacity as set forth in our credit facility. These difficult economic conditions could also impair the financial condition of one or more of our customers or suppliers, causing them to shut down their operations or file for bankruptcy protection, which could disrupt and have an adverse effect on our business. If the recent adverse U.S. and global economic conditions persist or deteriorate further, our business, prospects, results of operations, financial condition or cash flows could be negatively impacted.
We may be adversely affected by factors affecting our customers’ businesses.
Factors that adversely impact our customers’ businesses may also have an adverse effect on our business, prospects, results of operations, financial condition or cash flows. These factors may include:
| • | any reduction in consumer traffic and demand as a result of economic downturns like the recent domestic and global recessions; |
| • | any credit risks associated with the financial condition of our customers; |
| • | the effect of consolidation or weakness in the retail industry, including the closure of customer doors and the uncertainty resulting therefrom; and |
| • | inventory reduction initiatives and other factors affecting customer buying patterns, including any reduction in retail space commitment to fragrances and cosmetics and practices used to control inventory shrinkage. |
Fluctuations in foreign exchange rates could adversely affect our results of operations and cash flows.
We sell our products in approximately 100 countries around the world. During each of the years ended June 30, 2010 and 2009, we derived approximately 39% of our net sales from our international operations. We conduct our international operations in a variety of different countries and derive our sales in various currencies including the Euro, British pound, Swiss franc, Canadian dollar and Australian dollar, as well as the U.S. dollar. Most of our skin care and cosmetic products are produced in third-party manufacturing facilities located in the U.S. Our operations may be subject to volatility because of currency changes, inflation changes and changes in political and economic conditions in the countries in which we operate. With respect to international operations, our sales, cost of goods sold and expenses are typically denominated in a combination of local currency and the U.S. dollar. Our results of operations are reported in U.S. dollars. Fluctuations in currency rates can affect our reported sales, margins, operating costs and the anticipated settlement of our foreign denominated receivables and payables. A weakening of the foreign currencies in which we generate sales relative to the currencies in which our costs are denominated, which is primarily the U.S. dollar, may adversely affect our ability to meet our obligations and could adversely affect our business, prospects, results of operations, financial condition or cash flows. Our competitors may or may not be subject to the same fluctuations in currency rates, and our competitive position could be affected by these changes.
15
Table of Contents
We do not have contracts with customers or with suppliers of our distributed brands, so if we cannot maintain and develop relationships with such customers and suppliers our business, prospects, results of operations, financial condition or cash flows may be materially adversely affected.
We do not have long-term or exclusive contracts with any of our customers and generally do not have long-term or exclusive contracts with our suppliers of distributed brands. Our ten largest customers accounted for approximately 39% of our net sales in the year ended June 30, 2010. Our only customer who accounted for more than 10% of our net sales in the year ended June 30, 2010 was Wal-Mart (including Sam’s Club), who accounted for approximately 15% of our consolidated net sales and approximately 24% of our North America Fragrance segment net sales. In addition, our suppliers of distributed brands, which represented approximately 13% of our net sales for fiscal 2010, generally can, at any time, elect to supply products to our customers directly or through another distributor. Our suppliers of distributed brands may also choose to reduce or eliminate the volume of their products distributed by us. The loss of any of our key suppliers or customers, or a change in our relationship with any one of them, could have a material adverse effect on our business, prospects, results of operations, financial condition or cash flows.
We rely on third-party manufacturers and component suppliers for substantially all of our owned and licensed products.
We do not own or operate any significant manufacturing facilities. We use third-party manufacturers and component suppliers to manufacture substantially all of our owned and licensed products. As part of our Global Efficiency Re-engineering initiative, we have reduced the number of third-party manufacturers and component and materials suppliers that we use, and have implemented a “turnkey” manufacturing process for substantially all of our fragrance products in which we now rely on our third-party manufacturers for certain supply chain functions that we previously handled ourselves, such as component and materials planning, purchasing and warehousing. Implementing this “turnkey” manufacturing process has and will continue to require a substantial dedication of management resources. Our business, prospects, results of operations, financial condition or cash flows could be materially adversely affected if we experience any supply chain disruptions caused by our implementation of this “turnkey” manufacturing process or other supply chain projects, or if our manufacturers or component suppliers were to experience problems with product quality, credit or liquidity issues, or disruptions or delays in the manufacturing process or delivery of the finished products or the raw materials or components used to make such products.
The loss of or disruption in our distribution facilities may have a material adverse effect on our business.
We currently have one distribution facility in the United States and use a third-party fulfillment center in France primarily for European distribution. These facilities house a large portion of our inventory. Any loss of or damage to these facilities or the inventory stored in these facilities, could adversely affect our business, prospects, results of operations, financial condition or cash flows.
Our business is subject to regulation in the United States and internationally.
The manufacturing, distribution, formulation, packaging and advertising of our products and those we distribute are subject to numerous federal, state and foreign governmental regulations. The number of laws and regulations that are being enacted or proposed by state, federal and international governments and authorities are increasing. Compliance with these regulations is difficult and expensive and may require reformulation or discontinuation of certain of our products. If we fail to adhere, or are alleged to have failed to adhere, to any applicable federal, state or foreign laws or regulations, or if such laws or regulations negatively affect sales of our products, our business, prospects, results of operation, financial condition or cash flows may be adversely affected. In addition, our future results could be adversely affected by changes in applicable federal, state and
16
Table of Contents
foreign laws and regulations, or the interpretation or enforcement thereof, including those relating to product or ingredient registrations, product liability, trade rules and customs regulations, intellectual property, consumer laws, privacy laws and product ingredients, as well as accounting standards and taxation requirements (including tax-rate changes, new tax laws and revised tax law interpretations).
We may be adversely affected by domestic and international economic conditions and other events that impact consumer confidence and demand.
We believe that consumer spending on beauty products is influenced by general economic conditions and the availability of discretionary income. U.S. or international general economic downturns, including periods of inflation or high gasoline prices or declining consumer confidence, may affect consumer purchasing patterns and result in reduced net sales to our customers. Sudden disruptions in business conditions due to events such as terrorist attacks, diseases or natural disasters may have a short-term, or sometimes long-term, adverse impact on consumer spending. In addition, any reductions in travel or increases in restrictions on travelers’ ability to transport our products on airplanes due to general economic downturns, diseases, increased security levels, acts of war or terrorism could result in a material decline in the net sales and profitability of our travel retail business.
The beauty industry is highly competitive and if we cannot effectively compete our business and results of operations will suffer.
The beauty industry is highly competitive and can change rapidly due to consumer preferences and industry trends. Competition in the beauty industry is based on brand strength, pricing and assortment of products, innovation, perceived value, product availability and order fulfillment, service to the consumer, promotional activities, advertising, special events, new product introductions and other activities. Also, the trend toward consolidation in the retail trade, particularly in developed, markets such as the United States and Western Europe, has resulted in us becoming increasingly dependent on key retailers, including large-format retailers, who have increased their bargaining strength. We compete primarily with global prestige beauty companies, some of whom have greater resources than we have and brands with greater name recognition and consumer loyalty than our brands. Our success depends on our products’ appeal to a broad range of consumers whose preferences cannot be predicted with certainty and are subject to change, and on our ability to anticipate and respond in a timely and cost-effective manner to market trends through product innovations and product line extensions. We may incur expenses in connection with product development, marketing and advertising that are not subsequently supported by a sufficient level of sales, which could negatively affect our results of operations. These competitive factors, as well as new product risks, could have an adverse effect on our business, prospects, results of operations, financial condition or cash flows.
Our business strategy depends upon our ability to acquire or license additional brands or secure additional distribution arrangements and obtain the required financing for these agreements and arrangements.
Our business strategy contemplates the continued growth of our portfolio of owned, licensed and distributed brands. Our future expansion through acquisitions, new product licenses or new product distribution arrangements, if any, will depend upon our ability to identify suitable brands to acquire, license or distribute and our ability to obtain the required financing for these acquisitions, licenses or distribution arrangements, and thus depends on the capital resources and working capital available to us. We may not be able to identify, negotiate, finance or consummate such acquisitions, licenses or arrangements, or the associated working capital requirements, on terms acceptable to us, or at all, which could hinder our ability to increase revenues and build our business.
17
Table of Contents
The success of our business depends, in part, on the demand for celebrity beauty products.
We have license agreements to manufacture, market and distribute a number of celebrity beauty products, including those of Elizabeth Taylor, Britney Spears, Mariah Carey and Usher. In fiscal 2010, we derived approximately 22% of our net sales from these celebrity beauty products. The demand for these products is, to some extent, dependent on the appeal to consumers of the particular celebrity and the celebrity’s reputation. To the extent that the celebrity fragrance category or a particular celebrity ceases to be appealing to consumers or a celebrity’s reputation is adversely affected, sales of the related products and the value of the brands can decrease materially. In addition, under certain circumstances, lower net sales may shorten the duration of the applicable license agreement.
We may not be able to successfully and cost-effectively integrate acquired businesses or new brands.
Acquisitions entail numerous integration risks and impose costs on us that could materially and adversely affect our business, prospects, results of operations, financial condition or cash flows, including:
| • | difficulties in assimilating acquired operations, products or brands, including disruptions to our operations or the unavailability of key employees from acquired businesses; |
| • | diversion of management’s attention from our core business; |
| • | adverse effects on existing business relationships with suppliers and customers; |
| • | incurrence or assumption of additional debt and liabilities; and |
| • | incurrence of significant amortization expenses related to intangible assets and the potential impairment of acquired assets. |
Our business could be adversely affected if we are unable to successfully protect our intellectual property rights.
The market for our products depends to a significant extent upon the value associated with the trademarks and trade names that we own or license. We own, or have licenses or other rights to use, the material trademark and trade name rights used in connection with the packaging, marketing and distribution of our major owned and licensed products both in the U.S. and in other countries where such products are principally sold.
Although most of our brand names are registered in the U.S. and in certain foreign countries in which we operate, we may not be successful in asserting trademark or trade name protection. In addition, the laws of certain foreign countries may not protect our intellectual property rights to the same extent as the laws of the U.S. The costs required to protect our trademarks and trade names may be substantial. We also cannot assure that the owners of the trademarks that we license can or will successfully maintain their intellectual property rights or that we will be able to comply with the terms set forth in the applicable license agreements, including, among other things, payment of minimum royalties, minimum marketing expenses and maintenance of certain levels of sales.
If other parties infringe on our intellectual property rights or the intellectual property rights that we license, the value of our brands in the marketplace may be diluted. In addition, any infringement of our intellectual property rights would also likely result in a commitment of our time and resources to protect these rights through litigation or otherwise. We may infringe on others’ intellectual property rights, which may result in a reduction in sales or profitability and a commitment of our time and resources to defend through litigation or otherwise. One or more adverse judgments with respect to these intellectual property rights could negatively impact our ability to compete and could materially adversely affect our business, prospects, results of operations, financial condition or cash flows.
18
Table of Contents
If our intangible assets, such as trademarks and goodwill, become impaired, we may be required to record a significant non-cash charge to earnings which would negatively impact our results of operations.
Under accounting principles generally accepted in the United States, we review our intangible assets, including our trademarks, licenses and goodwill, for impairment annually in the fourth quarter of each fiscal year, or more frequently if events or changes in circumstances indicate the carrying value of our intangible assets may not be fully recoverable. The carrying value of our intangible assets may not be recoverable due to factors such as a decline in our stock price and market capitalization, reduced estimates of future cash flows, including those associated with the specific brands to which intangibles relate, or slower growth rates in our industry. Estimates of future cash flows are based on a long-term financial outlook of our operations and the specific brands to which the intangible assets relate. However, actual performance in the near-term or long-term could be materially different from these forecasts, which could impact future estimates and the recorded value of the intangibles. For example, a significant sustained decline in our stock price and market capitalization may result in impairment of certain of our intangible assets, including goodwill, and a significant charge to earnings in our financial statements during the period in which an impairment is determined to exist. Any such impairment charge could materially reduce our results of operations.
We are subject to risks related to our international operations.
We operate on a global basis, with sales in approximately 100 countries. Approximately 39% of our fiscal 2010 net sales were generated outside of the United States. Our international operations could be adversely affected by:
| • | import and export license requirements; |
| • | trade restrictions; |
| • | changes in tariffs and taxes; |
| • | restrictions on repatriating foreign profits back to the United States; |
| • | changes in, or our unfamiliarity with, foreign laws and regulations, including those related to product registration, ingredients and labeling; |
| • | difficulties in staffing and managing international operations; and |
| • | changes in social, political, legal and other conditions. |
Our quarterly results of operations fluctuate due to seasonality and other factors, and we may not have sufficient liquidity to meet our seasonal working capital requirements.
We generate a significant portion of our net income in the first half of our fiscal year as a result of higher sales in anticipation of the holiday season. Similarly, our working capital needs are greater during the first half of the fiscal year. We may experience variability in net sales and net income on a quarterly basis as a result of a variety of factors, including new product innovations and launches, the size and timing of customer orders and additions or losses of brand distribution rights. If we were to experience a significant shortfall in sales or internally generated funds, we may not have sufficient liquidity to fund our business.
Our level of debt and debt service obligations, and the restrictive covenants in our revolving credit facility and our indenture for our 7 3/4% senior subordinated notes, may reduce our operating and financial flexibility and could adversely affect our business and growth prospects.
At June 30, 2010, we had total debt of approximately $278 million, which primarily includes $220 million in aggregate principal amount outstanding of our 7 3/4% senior subordinated notes
19
Table of Contents
and $59 million outstanding under our revolving bank credit facility, both of which have requirements that may limit our operating and financial flexibility. Our indebtedness could adversely impact our business, prospects, results of operations, financial condition or cash flows by increasing our vulnerability to general adverse economic and industry conditions and restricting our ability to consummate acquisitions or fund working capital, capital expenditures and other general corporate requirements.
Specifically, our revolving credit facility and our indenture for our 7 3/4% senior subordinated notes limit or otherwise affect our ability to, among other things:
| • | incur additional debt; |
| • | pay dividends or make other restricted payments; |
| • | create or permit certain liens, other than customary and ordinary liens; |
| • | sell assets other than in the ordinary course of our business; |
| • | invest in other entities or businesses; and |
| • | consolidate or merge with or into other companies or sell all or substantially all of our assets. |
These restrictions could limit our ability to finance our future operations or capital needs, make acquisitions or pursue available business opportunities. Our revolving credit facility also requires us to maintain specified amounts of borrowing capacity or maintain a debt service coverage ratio. Our ability to meet these conditions and our ability to service our debt obligations will depend upon our future operating performance, which can be affected by general economic, financial, competitive, legislative, regulatory, business and other factors beyond our control. If our actual results deviate significantly from our projections, we may not be able to service our debt or remain in compliance with the conditions contained in our revolving credit facility, and we would not be allowed to borrow under the revolving credit facility. If we were not able to borrow under our revolving credit facility, we would be required to develop an alternative source of liquidity. We cannot assure you that we could obtain replacement financing on favorable terms or at all.
A default under our revolving credit facility could also result in a default under our indenture for our 7 3/4 % senior subordinated notes. Upon the occurrence of an event of default under our indenture, all amounts outstanding under our other indebtedness may be declared to be immediately due and payable. If we were unable to repay amounts due on our revolving credit facility, the lenders would have the right to proceed against the collateral granted to them to secure that debt.
Our success depends, in part, on the quality, efficacy and safety of our products.
Our success depends, in part, on the quality, efficacy and safety of our products. If our products are found to be defective or unsafe, or if they otherwise fail to meet our customers’ standards, our relationships with customers or consumers could suffer, the appeal of one or more of our brands could be diminished, and we could lose sales and/or become subject to liability claims, any of which could have a material adverse effect on our business, prospects, results of operations, financial condition or cash flows.
Our success depends upon the retention and availability of key personnel and the succession of senior management.
Our success largely depends on the performance of our management team and other key personnel. Our future operations could be harmed if we are unable to attract and retain talented, highly qualified senior executives and other key personnel. In addition, if we are unable to effectively provide for the succession of senior management, including our chief executive officer, our business, prospects, results of operations, financial condition or cash flows may be materially adversely affected.
20
Table of Contents
The market price of our common stock may fluctuate as a result of a variety of factors.
The market price of our common stock could fluctuate significantly in response to various factors, many of which are beyond our control, including:
| • | volatility in the financial markets; |
| • | actual or anticipated variations in our quarterly or annual financial results; |
| • | announcements or significant developments with respect to beauty products or the beauty industry in general; |
| • | general economic and political conditions; |
| • | governmental policies and regulations; and |
| • | financial analyst and rating agency actions. |
We are subject to risks associated with implementing, managing and maintaining global information systems.
We have information systems that support our business processes, including marketing, sales, order processing, distribution, finance and intracompany communications throughout the world. We have recently completed the implementation of an Oracle financial accounting, order processing and order-to-cash systems. This implementation required a substantial investment and dedication of management resources. All of our global information systems are susceptible to outages due to fire, floods, tornadoes, hurricanes, power loss, telecommunications failures, and similar events. Despite the implementation of network security measures, our systems may also be vulnerable to computer viruses and similar disruptions from unauthorized tampering. Our business, prospects, results of operations, financial condition or cash flows may be adversely affected by the occurrence of these or other events that could disrupt or damage our information systems, any failure to properly maintain or upgrade our information systems, or any defect or error in the implementation of the Oracle financial accounting and order processing system.
ITEM 1B. UNRESOLVED STAFF COMMENTS
Not applicable.
United States. Our corporate headquarters are located in Miramar, Florida, where we lease approximately 35,000 square feet of general office space. The lease expires in May 2011. Our U.S. fulfillment operations are conducted in our Roanoke, Virginia distribution facility that consists of approximately 400,000 square feet and is leased through September 2013. We also lease (i) a 76,000-square foot warehouse in Roanoke to coordinate returns processing that is leased through December 2011, and (ii) a 180,000-square foot warehouse in Roanoke that is leased through February 2012. From time to time, we also lease additional temporary warehouse facilities to handle inventory overflow. We lease 62,000 square feet of general office space for our supply chain, information systems and finance operations in Stamford, Connecticut, which will be reduced to approximately 50,000 square feet in the spring of 2011, under a lease that expires October 2021. We lease approximately 49,500 square feet of general offices primarily for our marketing operations in New York City under a lease that expires in October 2017. We also lease small offices in Bentonville, Arkansas and Minneapolis, Minnesota.
International. Our international operations are headquartered in offices in Geneva, Switzerland that are leased through 2017. We also lease sales offices in Australia, Canada, China, Denmark, France, Italy, Korea, New Zealand, Puerto Rico, Singapore, South Africa, Spain, Taiwan, and the United Kingdom, and a small distribution facility in Puerto Rico. We own a small
21
Table of Contents
manufacturing and distribution facility in South Africa primarily to manufacture and distribute local requirements of our products.
We are a party to a number of legal actions, proceedings and claims. While any action, proceeding or claim contains an element of uncertainty and it is possible that our cash flows and results of operations in a particular quarter or year could be materially affected by the impact of such actions, proceedings and claims, our management believes that the outcome of such actions, proceedings or claims will not have a material adverse effect on our business, prospects, results of operations, financial condition or cash flows.
22
Table of Contents
PART II
| ITEM 5. | MARKET FOR REGISTRANT’S COMMON EQUITY, RELATED STOCKHOLDER MATTERS AND ISSUER PURCHASES OF EQUITY SECURITIES |
Market Information. Our common stock, $.01 par value per share, has been traded on the NASDAQ Global Select Market under the symbol “RDEN” since January 25, 2001. The following table sets forth the high and low sales prices for our common stock, as reported by NASDAQ for each of our fiscal quarters from July 1, 2008 through June 30, 2010.
| Quarter Ended |
High | Low | ||||
| 6/30/10 |
$ | 19.50 | $ | 14.35 | ||
| 3/31/10 |
$ | 19.50 | $ | 13.90 | ||
| 12/31/09 |
$ | 15.90 | $ | 10.29 | ||
| 9/30/09 |
$ | 12.48 | $ | 7.28 | ||
| 6/30/09 |
$ | 9.54 | $ | 5.63 | ||
| 3/31/09 |
$ | 13.60 | $ | 3.93 | ||
| 12/31/08 |
$ | 19.80 | $ | 10.55 | ||
| 9/30/08 |
$ | 21.79 | $ | 14.34 | ||
Holders. As of August 16, 2010, there were 372 record holders of our common stock. The number of record holders does not include beneficial owners of common stock whose shares are held in the names of banks, brokers, nominees or other fiduciaries.
Dividends. We have not declared any cash dividends on our common stock since we became a beauty products company in 1995, and we currently have no plans to declare dividends on our common stock in the foreseeable future. Any future determination by our board of directors to pay dividends on our common stock will be made only after considering our financial condition, results of operations, capital requirements and other relevant factors. Additionally, our revolving credit facility and the indenture relating to our 7 3/4% senior subordinated notes due 2014 restrict our ability to pay cash dividends based upon our ability to satisfy certain financial covenants, including having a certain amount of borrowing capacity and satisfying a fixed charge coverage ratio after the payment of the dividends. See Notes 9 and 10 to the Notes to Consolidated Financial Statements
Performance Graph. The following performance graph data and table compare the cumulative total shareholder returns, including the reinvestment of dividends, on our common stock with the companies in the Russell 2000 Index and a market-weighted index of publicly traded peer companies for the five fiscal years from July 1, 2005 through June 30, 2010.
The publicly traded companies in our peer group are The Estee Lauder Companies Inc., International Flavors and Fragrances, Inc., Inter Parfums, Inc., Physicians Formula Holdings, Inc., and Revlon, Inc. Bare Escentuals, Inc. has been removed from the peer group because it is no longer a publicly-traded company. We believe that our peer group is a good representation of beauty companies with similar market capitalizations, channels of distribution and/or products as our company. The graph and table assume that $100 was invested on June 30, 2005 in each of the Russell 2000 Index, the peer group, and our common stock, and that all dividends were reinvested.
[Remainder of page intentionally left blank.]
23
Table of Contents
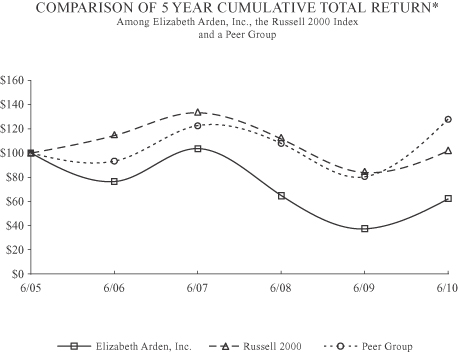
| Fiscal Year Ended | |||||||||||||||
| June 30, | |||||||||||||||
| 2006 | 2007 | 2008 | 2009 | 2010 | |||||||||||
| Elizabeth Arden, Inc. |
$ | 76.44 | $ | 103.72 | $ | 64.90 | $ | 37.32 | $ | 62.08 | |||||
| Russell 2000 Index |
$ | 114.58 | $ | 133.41 | $ | 111.80 | $ | 83.84 | $ | 101.85 | |||||
| Peer Group |
$ | 93.40 | $ | 122.76 | $ | 107.98 | $ | 80.41 | $ | 128.50 | |||||
24
Table of Contents
Issuer Purchases of Equity Securities. This table provides information with respect to our purchases of shares of our common stock, $.01 par value per share, during the three months ended June 30, 2010.
Issuer Purchases of Equity Securities
| (a) | (b) | (c) | (d) | |||||||
| Period |
Total Number of Shares Purchased |
Average Price Paid Per Share |
Total Number of Shares Purchased as Part of Publicly Announced Plans or Programs(1) |
Approximate Dollar Value that May Yet Be Purchased Under the Plans or Programs(2) | ||||||
| April 1, 2010 through April 30, 2010 |
16,395 | $ | 17.81 | 16,395 | $ | 32,449,517 | ||||
| May 1, 2010 through May 31, 2010 |
336,405 | $ | 17.28 | 336,405 | $ | 26,634,846 | ||||
| June 1, 2010 through June 30, 2010 |
283,760 | $ | 15.81 | 283,760 | $ | 22,147,393 | ||||
| Totals |
636,560 | $ | 16.64 | 636,560 | $ | 22,147,393 | ||||
| (1) | On November 5, 2008, our board of directors authorized us to extend our existing $80 million stock repurchase program through November 30, 2010. The stock repurchase program was set to expire on November 30, 2008. The extension of the stock repurchase program was announced on November 6, 2008. All shares purchased during the quarter ended June 30, 2010 were purchased on the open market. |
| (2) | Amounts reflect the remaining dollar value of shares that may be purchased under the stock repurchase program described above. |
[Remainder of page intentionally left blank.]
25
Table of Contents
| ITEM 6. | SELECTED FINANCIAL DATA |
We derived the following selected financial data from our audited consolidated financial statements. The following data should be read in conjunction with “Management’s Discussion and Analysis of Financial Condition and Results of Operations” and our consolidated financial statements and the related notes included elsewhere in this annual report.
| Year Ended June 30, | ||||||||||||||||||||
| (Amounts in thousands, except per share data) |
2010 | 2009 | 2008 | 2007 | 2006 | |||||||||||||||
| Selected Statement of Operations Data |
||||||||||||||||||||
| Net sales |
$ | 1,103,777 | $ | 1,070,225 | $ | 1,141,075 | $ | 1,127,476 | $ | 954,550 | ||||||||||
| Gross profit |
495,974 | 433,155 | (3) | 461,873 | (5) | 457,679 | 401,594 | |||||||||||||
| Income from operations |
44,793 | (1) | 10,335 | (3) | 49,030 | (5) | 74,006 | 68,257 | ||||||||||||
| Debt extinguishment charges |
82 | — | — | — | 758 | |||||||||||||||
| Net income (loss) |
19,533 | (6,163 | ) | 19,901 | 37,334 | 32,794 | ||||||||||||||
| Selected Per Share Data |
||||||||||||||||||||
| Earnings (loss) per common share |
||||||||||||||||||||
| Basic |
$ | 0.70 | (2) | $ | (0.22 | )(4) | $ | 0.71 | (6) | $ | 1.35 | (7) | $ | 1.15 | (8) | |||||
| Diluted |
$ | 0.68 | (2) | $ | (0.22 | )(4) | $ | 0.68 | (6) | $ | 1.30 | (7) | $ | 1.10 | (8) | |||||
| Weighted average number of common shares |
||||||||||||||||||||
| Basic |
28,017 | 27,971 | 27,981 | 27,607 | 28,628 | |||||||||||||||
| Diluted |
28,789 | 27,971 | 29,303 | 28,826 | 29,818 | |||||||||||||||
| Other Data |
||||||||||||||||||||
| EBITDA(9) |
$ | 73,170 | $ | 36,493 | $ | 73,798 | $ | 98,524 | $ | 89,608 | ||||||||||
| Net cash provided by operating activities |
113,959 | 36,986 | 8,037 | 58,816 | 65,276 | |||||||||||||||
| Net cash used in investing activities |
(35,721 | ) | (31,663 | ) | (28,588 | ) | (110,518 | ) | (24,335 | ) | ||||||||||
| Net cash (used in) provided by financing activities |
(74,337 | ) | (7,529 | ) | 16,791 | 53,120 | (37,584 | ) | ||||||||||||
| Year Ended June 30, | ||||||||||||||||||||
| 2010 | 2009 | 2008 | 2007 | 2006 | ||||||||||||||||
| Selected Balance Sheet Data |
||||||||||||||||||||
| Cash |
$ | 26,881 | $ | 23,102 | $ | 26,396 | $ | 30,287 | $ | 28,466 | ||||||||||
| Inventories |
271,058 | 318,535 | 408,563 | 380,232 | 269,270 | |||||||||||||||
| Working capital |
306,524 | 286,611 | 306,735 | 298,165 | 280,942 | |||||||||||||||
| Total assets |
843,471 | 884,075 | 970,734 | 939,175 | 759,903 | |||||||||||||||
| Short-term debt |
59,000 | 115,000 | 119,000 | 97,640 | 40,000 | |||||||||||||||
| Long-term debt, including current period |
218,699 | 223,911 | 224,957 | 225,655 | 225,951 | |||||||||||||||
| Shareholders’ equity |
352,617 | 336,778 | 336,601 | 320,927 | 277,847 | |||||||||||||||
| (1) | For the year ended June 30, 2010, income from operations include (i) $3.9 million of expenses related to implementation of our Oracle accounting and order processing systems, (ii) $1.9 million of restructuring expenses related to our Global Efficiency Re-engineering initiative, and (iii) $1.5 million of restructuring expenses that are not related to our Global Efficiency Re-engineering initiative. |
| (2) | For the year ended June 30, 2010, Oracle accounting and order processing systems implementation costs, restructuring expenses and debt extinguishment costs reduced both basic and fully diluted earnings per share by $0.20 and $0.19, respectively. |
| (3) | For the year ended June 30, 2009, gross profit and income from operations include costs related to the global licensing agreement with Liz Claiborne of $18.9 million (which did not require the use of cash in the current period) for the Liz Claiborne inventory purchased by us at a higher cost prior to the effective date of the license agreement and $4.4 million ($1.0 million in gross profit) of Liz Claiborne transition expenses. In addition, income from operations includes (i) $3.4 million of expenses related to implementation of our Oracle accounting and order processing systems, (ii) $3.5 million of restructuring expenses related to our Global Efficiency Re-engineering initiative, and (iii) $1.1 million of restructuring expenses that are not related to our Global Efficiency Re-engineering initiative. |
| (4) | For the year ended June 30, 2009, Liz Claiborne related expenses, Oracle accounting and order processing systems implementation costs and restructuring expenses reduced basic and fully diluted earnings per share by $0.70 and $0.69, respectively. |
| (5) | For the year ended June 30, 2008, gross profit and income from operations include approximately $15.0 million in costs related to the global licensing agreement with Liz Claiborne including product discontinuation charges. In addition, income from operations includes an additional $12.0 million in Liz Claiborne related costs, and $3.0 million of restructuring expenses including $0.7 million related to our Global Efficiency Re-engineering initiative. |
26
Table of Contents
| (6) | For the year ended June 30, 2008, Liz Claiborne related costs, including product discontinuation charges, and restructuring expenses reduced basic and fully diluted earnings per share by $0.65 and $0.63, respectively. |
| (7) | For the year ended June 30, 2007, restructuring charges reduced basic and fully diluted earnings per share by $0.07 and $0.06, respectively. |
| (8) | For the year ended June 30, 2006, restructuring and debt extinguishment charges reduced basic and fully diluted earnings per share by $0.05. |
| (9) | EBITDA is defined as net income plus the provision for income taxes (or net loss less the benefit from income taxes), plus interest expense, plus depreciation and amortization expense. EBITDA should not be considered as an alternative to operating income (loss) or net income (loss) (as determined in accordance with generally accepted accounting principles) as a measure of our operating performance or to net cash provided by operating, investing and financing activities (as determined in accordance with generally accepted accounting principles) or as a measure of our ability to meet cash needs. We believe that EBITDA is a measure commonly reported and widely used by investors and other interested parties as a measure of a company’s operating performance and debt servicing ability because it assists in comparing performance on a consistent basis without regard to capital structure (particularly when acquisitions are involved), depreciation and amortization, or non-operating factors such as historical cost. Accordingly, as a result of our capital structure, we believe EBITDA is a relevant measure. This information has been disclosed here to permit a more complete comparative analysis of our operating performance relative to other companies and of our debt servicing ability. EBITDA may not, however, be comparable in all instances to other similar types of measures. |
In addition, EBITDA has limitations as an analytical tool, including the fact that:
| • | it does not reflect our cash expenditures, future requirements for capital expenditures or contractual commitments; |
| • | it does not reflect the significant interest expense or the cash requirements necessary to service interest or principal payments on our debt; |
| • | it does not reflect any cash income taxes that we may be required to pay; and |
| • | although depreciation and amortization are non-cash charges, the assets being depreciated and amortized will often have to be replaced in the future and these measures do not reflect any cash requirements for such replacements. |
The following is a reconciliation of net income (loss) as determined in accordance with generally accepted accounting principles, to EBITDA:
| Year Ended June 30, | ||||||||||||||||||||
| (Amounts in thousands) | 2010 | 2009 | 2008 | 2007 | 2006 | |||||||||||||||
| Net income (loss) |
$ | 19,533 | $ | (6,163 | ) | $ | 19,901 | $ | 37,334 | $ | 32,794 | |||||||||
| Provision for (benefit from) income taxes |
3,293 | (8,316 | ) | 1,534 | 7,474 | 11,281 | ||||||||||||||
| Interest expense |
21,885 | 24,814 | 27,595 | 29,198 | 23,424 | |||||||||||||||
| Depreciation related to cost of goods sold |
5,040 | 4,416 | 4,245 | 3,640 | 2,478 | |||||||||||||||
| Depreciation and amortization |
23,419 | 21,742 | 20,523 | 20,878 | 19,631 | |||||||||||||||
| EBITDA |
$ | 73,170 | (a) | $ | 36,493 | (b) | 73,798 | (c) | $ | 98,524 | (d) | $ | 89,608 | (e) | ||||||
| (a) | Includes $3.9 million related to the implementation of our Oracle accounting and order processing systems, $3.4 million of restructuring charges and $0.1 million of debt extinguishment costs. |
| (b) | Includes $23.3 million of costs related to the global licensing agreement with Liz Claiborne ($18.9 million of which did not require the use of cash in the current period), $4.6 million of restructuring charges and $3.4 million related to the implementation of our Oracle accounting and order processing systems. |
| (c) | Includes $27.0 million of costs related to the global licensing agreement with Liz Claiborne and $3.0 million of restructuring charges. |
| (d) | Includes $2.1 million of restructuring charges. |
| (e) | Includes $1.2 million of restructuring charges and $0.8 million of debt extinguishment charges. |
27
Table of Contents
| ITEM 7. | MANAGEMENT’S DISCUSSION AND ANALYSIS OF FINANCIAL CONDITION AND RESULTS OF OPERATIONS |
The following discussion and analysis should be read in conjunction with the consolidated financial statements and the accompanying notes which appear elsewhere in this document.
Overview
We are a global prestige beauty products company with an extensive portfolio of prestige fragrance, skin care and cosmetics brands. Our branded products include the Elizabeth Arden fragrances: Red Door, Elizabeth Arden 5th Avenue, Elizabeth Arden green tea and Pretty Elizabeth Arden; the Elizabeth Arden skin care brands: Ceramide, Eight Hour Cream, Intervene, and PREVAGE®; and the Elizabeth Arden branded lipstick, foundation and other color cosmetics products. Our prestige fragrance portfolio also includes the following celebrity, lifestyle and designer fragrances:
| Celebrity Fragrances | The fragrance brands of Britney Spears, Elizabeth Taylor, Mariah Carey, and Usher | |
| Lifestyle Fragrances | Curve, Giorgio Beverly Hills, PS Fine Cologne and White Shoulders | |
| Designer Fragrances | Juicy Couture, Kate Spade New York, John Varvatos, Rocawear, Alberta Ferretti, Halston, Geoffrey Beene, Badgley Mischka, Alfred Sung, Bob Mackie and Lucky | |
In addition to our owned and licensed fragrance brands, we distribute approximately 300 additional prestige fragrance brands, primarily in the United States, through distribution agreements and other purchasing arrangements.
In fiscal 2010, we introduced a number of new Elizabeth Arden branded products, including PREVAGE® Day SPF 30, a new Ceramide Ultra Moisture Cream and Lotion, and flanker fragrances for our classic Elizabeth Arden 5th Avenue and Elizabeth Arden green tea fragrances. We will continue to focus on our core Elizabeth Arden branded skin care and color cosmetics products by investing in new product innovation and technologies and increased advertising. In addition, during fiscal 2010 we launched a number of fragrances, including a new Juicy Couture fragrance, Couture Couture, as well as new fragrances under our Britney Spears, Mariah Carey, Elizabeth Taylor, Alberta Ferretti, Halston and Usher licenses.
Our business strategy is to increase net sales, operating margins and earnings by (a) increasing the sales of the Elizabeth Arden brand through leveraging the global awareness of the Elizabeth Arden brand name, targeting fast-growing geographical markets, and focusing on our skin care expertise and classic products, such as our Eight Hour Cream, Ceramide skin care products and Red Door fragrance, (b) increasing the sales of our prestige fragrance portfolio internationally, particularly in the large European fragrance market, and through licensing opportunities and acquisitions, (c) expanding the prestige fragrance category at mass retail customers in North America, (d) continuing to expand operating margins, working capital efficiency and return on invested capital, and (e) capitalizing on the growth potential of our global brands by focusing on both organic growth opportunities as well as those achieved through new product innovation.
We manage our business by evaluating net sales, gross margins, EBITDA (as defined in Note 9 under Item 6 “Selected Financial Data”), EBITDA margin, segment profit and working capital utilization (including monitoring our levels of inventory, accounts receivable, operating cash flow and return on invested capital). We encounter a variety of challenges that may affect our business and should be considered as described in Item 1A “Risk Factors” and in the section “Management’s Discussion and Analysis of Financial Condition and Results of Operations — Forward-Looking Information and Factors That May Affect Future Results.”
28
Table of Contents
Effective June 9, 2008, we became the exclusive, global licensee for the manufacture, distribution, marketing and sale of the Liz Claiborne fragrance brands under a long-term license agreement with Liz Claiborne, Inc. and certain of its affiliates. The Liz Claiborne fragrance portfolio includes the Juicy Couture, Curve and, Lucky fragrances. In connection with the Liz Claiborne license agreement we also assumed a license for the Usher celebrity fragrances. The Liz Claiborne licensing arrangement enabled us to (i) grow our market share in our North America Fragrance segment, (ii) increase our gross margins in our North America Fragrance segment by converting existing mass customer sales from distribution margins to owned/licensed margins, and (iii) add sales volume to our International segment, particularly with the Juicy Couture fragrance brand.
In fiscal 2009, we incurred transition expenses relating to the Liz Claiborne license agreement of approximately $4.4 million, before taxes. In addition, our gross margins for the first half of fiscal 2009 were impacted by expenses of approximately $18.9 million (which did not require the use of cash in the current period), before taxes, relating to Liz Claiborne inventory that we purchased at a higher cost prior to the effective date of the license agreement. In fiscal 2008, we incurred expenses related to the Liz Claiborne transaction of $19.6 million, before taxes. In addition, in connection with this license we discontinued certain brands and products resulting in a product discontinuation charge in fiscal 2008 of $7.4 million, before taxes.
In fiscal 2007, we commenced a comprehensive review of our global business processes to re-engineer our extended supply chain, distribution, logistics and transaction processing systems. We call this initiative our Global Efficiency Re-engineering initiative or often just the Initiative. In May 2008, we announced an acceleration of the re-engineering of our extended supply chain functions as well as the realignment of other parts of our organization to better support our new business processes.
In connection with this initiative, we completed the first phase of the implementation of an Oracle financial accounting system (general ledger and accounts payable) in July 2009, and we completed the remaining portion of the financial accounting system as well as an order processing system in April 2010. Both phases of this significant project were completed in accordance with our projected timeline and budget. The system is intended to improve key transaction processes and accommodate the anticipated growth of our business. We expect this infrastructure investment to simplify our transaction processing by utilizing a common platform to centralize our primary global transaction processing functions.
As a result of the acceleration of the re-engineering of our extended supply chain functions and the implementation of the Oracle financial accounting and order processing system, and the migration to a shared services transaction processing model we implemented a restructuring plan that resulted in restructuring and one-time expenses, including severance, relocation, recruiting and temporary staffing expenditures. Substantially all of these expenses were incurred in fiscal years 2009 and 2010. From inception through June 30, 2010, we have incurred a total of $13.4 million before taxes, which includes $7.3 million related to our Oracle system implementation, and $6.1 million for initiative-related restructuring. We are anticipating that an additional $0.6 million will be incurred in the first half of fiscal year 2011. As a result, expenses associated with the Initiative will total approximately $14.0 million, before taxes, consistent with our original projection of $12 million to $14 million.
In fiscal 2010, gross margins improved as compared to the prior fiscal year by approximately 440 basis points. Approximately 190 basis points of this improvement was due to the absence of $19.9 million in costs that reduced our gross margin in fiscal 2009 related to Liz Claiborne inventory purchased at a higher cost prior to the June 2008 effective date of the license agreement and transition expenses. As a result of the Initiative and other activities, gross margin also improved by an additional 250 basis points at the end of fiscal 2010 as compared to the prior fiscal year. We expect our fiscal 2011 gross margins to improve an additional 225 to 250 basis points over our fiscal 2010 gross margin. We expect to use a portion of this anticipated margin improvement to support organic growth of our key brands and drive improved profitability.
29
Table of Contents
Critical Accounting Policies and Estimates
The preparation of our consolidated financial statements in conformity with U.S. generally accepted accounting principles requires us to make estimates and assumptions that affect the amounts of assets, liabilities, revenues and expenses reported in those consolidated financial statements. We base our estimates on historical experience and other factors that we believe are most likely to occur. Changes in facts and circumstances may result in revised estimates, which are recorded in the period in which they become known. Actual results could differ from those estimates. If these changes result in a material impact to the consolidated financial statements, their impact is disclosed in “Management’s Discussion and Analysis of Financial Condition and Results of Operations” and/or in the “Notes to the Consolidated Financial Statements.” The disclosures below also note situations in which it is reasonably likely that future financial results could be affected by changes in these estimates and assumptions. The term “reasonably likely” refers to an occurrence that is more than remote but less than probable in the judgment of management.
Our most critical accounting policies and estimates are described in detail below. See Note 1 to the Notes to Consolidated Financial Statements — “General Information and Summary of Significant Accounting Policies,” for a discussion of these and other accounting polices.
Accounting for Acquisitions and Intangible Assets. Under the accounting for business combinations, consideration paid in an acquisition is allocated to the underlying net assets, based on their respective estimated fair values. The excess of the consideration paid at the acquisition date over the fair values of the identifiable net assets acquired is recorded as goodwill.
The judgments made in determining the estimated fair value and expected useful lives assigned to each class of assets and liabilities acquired can significantly affect net income. For example, different classes of assets will have useful lives that differ, and the useful life of property, plant, and equipment acquired will differ substantially from the useful life of brand licenses and trademarks. Consequently, to the extent a longer-lived asset is ascribed greater value under the purchase method than a shorter-lived asset, net income in a given period may be higher.
Determining the fair value of certain assets and liabilities acquired is judgmental in nature and often involves the use of significant estimates and assumptions. One of the areas that requires more judgment is determining the fair value and useful life of intangible assets. In this process, we often obtain the assistance of third party valuation firms for certain intangible assets. Because the fair value and the estimated useful life of an intangible asset is a subjective estimate, it is reasonably likely that circumstances may cause the estimate to change. For example, if we discontinue or experience a decline in the profitability of one or more of our brands, the value of the intangible assets associated with those brands or their useful lives may decline, or, certain intangible assets such as the Elizabeth Arden brand trademarks, may no longer be classified as an indefinite-lived asset, which could result in additional charges to net income.
Our intangible assets consist of exclusive brand licenses, trademarks and other intellectual property, customer relationships and lists, non-compete agreements and goodwill. The value of these assets is exposed to future adverse changes if we experience declines in operating results or experience significant negative industry or economic trends. We have determined that the Elizabeth Arden trademarks have indefinite useful lives as cash flows from the use of the trademarks are expected to be generated indefinitely. Goodwill and intangible assets with indefinite lives such as our Elizabeth Arden trademarks, are not amortized, but rather tested for impairment at least annually. We typically perform our annual impairment test during the fourth quarter of our fiscal year or more frequently if events or changes in circumstances indicate the carrying value of goodwill may not fully be recoverable. There is a two step process for impairment testing of goodwill. The first step, used to identify potential impairment, compares the fair value of a reporting unit with its carrying amount, including goodwill. The second step, if necessary, measures the amount of the impairment by comparing the estimated fair value of the goodwill and intangible assets to their
30
Table of Contents
respective carrying values. If an impairment is identified, the carrying value of the asset is adjusted to estimated fair value.
During the quarter ended June 30, 2010, we completed our annual impairment testing of the Elizabeth Arden trademarks, with the assistance of a third party valuation firm. During the quarter ended June 30, 2010, we also completed our annual impairment testing of goodwill. In assessing the fair value of these assets, we considered the income approach and market approach. Under the income approach, the fair value is based on the present value of estimated future cash flows. Under the market approach, the fair value is based on quoted market prices and the number of shares outstanding of our common stock. The analysis and assessments of these assets and goodwill indicated that no impairment adjustment was required as the estimated fair value exceeded the recorded carrying value. A hypothetical 10% decrease to the fair value of our Elizabeth Arden trademarks or a hypothetical 1% increase in the discount rate used to estimate fair value would not result in an impairment of our Elizabeth Arden trademarks. A hypothetical 10% decrease in the fair value of our North America Fragrance reporting unit would not result in an impairment of our goodwill.
Due to the ongoing uncertainty in capital market conditions, we will continue to monitor and evaluate the expected future cash flows of our reporting units and the long-term trends of our market capitalization for the purposes of assessing the carrying value of our goodwill and indefinite-lived Elizabeth Arden trademarks, other trademarks and intangible assets. If market and economic conditions deteriorate, this could increase the likelihood of future material non-cash impairment charges to our results of operations related to our goodwill, indefinite-lived Elizabeth Arden trademarks, or other trademarks and intangible assets.
Depreciation and Amortization. Depreciation and amortization is provided over the estimated useful lives of the assets using the straight line method. Periodically, we review the lives assigned to our long-lived assets and adjust the lives, as circumstances dictate. Because estimated useful life is a subjective estimate, it is reasonably likely that circumstances may cause the estimate to change. For example, if we experience significant declines in net sales in certain channels of distribution, it could affect the estimated useful life of certain of our long-lived assets, such as counters or trade fixtures, which could result in additional charges to net income.
Long-Lived Assets. We review for the impairment of long-lived assets to be held and used whenever events or changes in circumstances indicate that the carrying amount of such assets may not be fully recoverable. Measurement of an impairment loss is based on the fair value of the asset compared to its carrying value. An impairment loss is recognized to the extent the carrying amount of the asset exceeds its estimated fair value. Because the fair value is a subjective estimate, it is reasonably likely that circumstances may cause the estimate to change. The same circumstances that could affect the estimated useful life of a long-lived asset, as discussed above, could cause us to change our estimate of the fair value of that asset, which could result in additional charges to net income. We did not record any adjustments in fiscal 2010, 2009 and 2008. Long-lived assets to be disposed of are reported at the lower of carrying amount or fair value less costs to sell.
Revenue Recognition. Sales are recognized when title and risk of loss transfers to the customer, the sales price is fixed or determinable and collectibility of the resulting receivable is probable. Sales are recorded net of estimated returns, markdowns and other allowances. The provision for sales returns and markdowns represents management’s estimate of future returns and markdowns based on historical experience and considering current external factors and market conditions.
Allowances for Sales Returns and Markdowns. As is customary in the prestige beauty business, we grant certain of our customers (primarily North American prestige department stores and specialty beauty stores) subject to our authorization and approval, the right to either return product for credit against amounts previously billed or to receive a markdown allowance. Upon sale to such customers, we record a provision for product returns and markdowns estimated based on our level of sales, historical and projected experience with product returns and markdowns in each of our
31
Table of Contents
business segments and with respect to each of our product types, current economic trends and changes in customer demand and customer mix. We make detailed estimates at the segment, product and customer level, which are then aggregated to arrive at a consolidated provision for product returns and markdowns and are reviewed periodically as facts and circumstances warrant. Such provisions and markdown allowances are recorded as a reduction of net sales. Because there is considerable judgment used in evaluating the allowance for returns and markdowns, it is reasonably likely that actual experience will differ from our estimates. If, for example, customer demand for our products is lower than estimated or a proportionately greater amount of sales is made to prestige department stores and/or specialty beauty stores, additional provisions for returns or markdowns may be required resulting in a charge to income in the period in which the determination was made. Similarly, if customer demand for our products is higher than estimated, a reduction of our provision for returns or markdowns may be required resulting in an increase to income in the period in which the determination was made. As a percentage of gross sales, our expense for returns and markdowns was 9.2%, 8.1% and 7.0% for the fiscal years ending June 30, 2010, 2009 and 2008, respectively. A hypothetical 5% change in the value of our allowance for sales returns and markdowns as of June 30, 2010 would result in a $1.1 million change to net income.
Allowances for Doubtful Accounts Receivable. We maintain allowances for doubtful accounts to cover uncollectible accounts receivable, and we evaluate our accounts receivable to determine if they will ultimately be collected. This evaluation includes significant judgments and estimates, including an analysis of receivables aging and a customer-by-customer review for large accounts. It is reasonably likely that actual experience will differ from our estimates, which may result in an increase or decrease in the allowance for doubtful accounts. If, for example, the financial condition of our customers deteriorates resulting in an impairment of their ability to pay, additional allowances may be required, resulting in a charge to income in the period in which the determination was made. A hypothetical 5% change in the value of our allowance for doubtful accounts receivable as of June 30, 2010 would result in a $0.3 million change to net income.
Provisions for Inventory Obsolescence. We record a provision for estimated obsolescence and shrinkage of inventory. Our estimates consider the cost of inventory, forecasted demand, the estimated market value, the shelf life of the inventory and our historical experience. Because of the subjective nature of this estimate, it is reasonably likely that circumstances may cause the estimate to change. If, for example, demand for our products declines or if we decide to discontinue certain products; we may need to increase our provision for inventory obsolescence which would result in additional charges to net income. A hypothetical 5% change in the value of our provision for inventory obsolescence as of June 30, 2010 would result in a $1.1 million change to net income.
Hedge Contracts. We have designated each qualifying foreign currency contract we have entered into as a cash flow hedge. Unrealized gains or losses, net of taxes, associated with these contracts are included in accumulated other comprehensive income on the balance sheet. Gains and losses will only be recognized in earnings in the period in which the forecasted transaction affects earnings.
Share-Based Compensation. All share-based payments to employees, including the grants of employee stock options, are recognized in the consolidated financial statements based on their fair values, but only to the extent that vesting is considered probable. Compensation cost for awards that vest will not be reversed if the awards expire without being exercised. The fair value of stock options is determined using the Black-Scholes option-pricing model. The fair value of the market-based restricted stock award is determined using a Monte Carlo simulation model, and the fair value of all other restricted stock awards is based on the closing price of our common stock on the date of grant. Compensation costs for awards are amortized using the straight-line method. Option pricing model input assumptions such as expected term, expected volatility and risk-free interest rate impact the fair value estimate. Further, the forfeiture rate impacts the amount of aggregate compensation. These assumptions are subjective and generally require significant analysis and judgment to develop. When estimating fair value, some of the assumptions are based on or determined from external data
32
Table of Contents
and other assumptions may be derived from our historical experience with share-based arrangements. The appropriate weight to place on historical experience is a matter of judgment, based on relevant facts and circumstances.
We rely on our historical experience and post-vested termination activity to provide data for estimating our expected term for use in determining the fair value of our stock options. We currently estimate our stock volatility by considering our historical stock volatility experience and other key factors. The risk-free interest rate is the implied yield currently available on U.S. Treasury zero-coupon issues with a remaining term equal to the expected term used as the input to the Black-Scholes model. We estimate forfeitures using our historical experience. Our estimates of forfeitures will be adjusted over the requisite service period based on the extent to which actual forfeitures differ, or are expected to differ, from their estimates. Because of the significant amount of judgment used in these calculations, it is reasonably likely that circumstances may cause the estimate to change. If, for example, actual forfeitures are lower than our estimate, additional charges to net income may be required.
Income Taxes and Valuation Reserves. A valuation allowance may be required to reduce deferred tax assets to the amount that is more likely than not to be realized. We consider projected future taxable income and ongoing tax planning strategies in assessing a potential valuation allowance. In the event we determine that we may not be able to realize all or part of our deferred tax asset in the future, or that new estimates indicate that a previously recorded valuation allowance is no longer required, an adjustment to the deferred tax asset would likely be charged or credited to net income in the period in which such determination was made.
We recognize in our consolidated financial statements the impact of a tax position if it is more likely than not that such position will be sustained on audit based on its technical merits. While we believe that our assessments of whether our tax positions are more likely than not to be sustained are reasonable, each assessment is subjective and requires the use of significant judgments. As a result, one or more of such assessments may prove ultimately to be incorrect, which could result in a change to net income. See Note 12 to the Notes to Consolidated Financial Statements.
Foreign Currency Contracts
We operate in several foreign countries, which exposes us to market risk associated with foreign currency exchange rate fluctuations. Our risk management policy is to enter into cash flow hedges to reduce a portion of the exposure of our foreign subsidiaries’ revenues to fluctuations in currency rates using foreign currency forward contracts. We also enter into cash flow hedges for a portion of our forecasted inventory purchases to reduce the exposure of our Canadian and Australian subsidiaries’ cost of sales to such fluctuations. Additionally, when appropriate, we enter into and settle foreign currency contracts to reduce the exposure of our foreign subsidiaries’ balance sheets to fluctuations in currency rates. The principal currencies hedged are British pounds, Euros, Canadian dollars and Australian dollars. We do not enter into derivative financial contracts for speculative or trading purposes.
Changes to fair value of the foreign currency contracts are recorded as a component of accumulated other comprehensive income (loss) within stockholders’ equity, to the extent such contracts are effective, and are recognized in net sales or cost of sales in the period in which the forecasted transaction affects earnings. Changes to fair value of any contracts deemed to be ineffective would be recognized in earnings immediately. There were no amounts recorded in fiscal years 2010, 2009 or 2008 relating to foreign currency contracts used to hedge forecasted revenues or forecasted cost of sales resulting from hedge ineffectiveness.
When appropriate, we also enter into and settle foreign currency contracts for Euros, British pounds and Canadian dollars to reduce exposure of our foreign subsidiaries’ balance sheets to fluctuations in foreign currency rates. These contracts are used to hedge balance sheet exposure
33
Table of Contents
generally over one month and are settled before the end of the month in which they are entered into. Changes to fair value of the forward contracts are recognized in selling, general and administrative expense in the period in which the contracts expire.
The table below summarizes the effect of the pre-tax gain (loss) from our settled foreign currency contracts on the specified line items in our consolidated statements of operations for the years ended June 30, 2010, 2009 and 2008.
| Year Ended June 30, | |||||||||||
| (Amounts in thousands) | 2010 | 2009 | 2008 | ||||||||
| Net Sales |
$ | 766 | $ | 14,124 | $ | (8,854 | ) | ||||
| Cost of Sales |
(662 | ) | 852 | (620 | ) | ||||||
| Selling, general and administrative |
1,336 | 3,252 | (2,614 | ) | |||||||
| Total pre-tax gain (loss) |
$ | 1,440 | $ | 18,228 | $ | (12,088 | ) | ||||
34
Table of Contents
RESULTS OF OPERATIONS
The following table compares our historical results of operations, including as a percentage of net sales, on a consolidated basis, for the years ended June 30, 2010, 2009 and 2008. (Amounts in thousands, other than percentages. Percentages may not add due to rounding):
| Year Ended June 30, | ||||||||||||||||||||
| 2010 | 2009 | 2008 | ||||||||||||||||||
| Net sales |
$ | 1,103,777 | 100.0 | % | $ | 1,070,225 | 100.0 | % | $ | 1,141,075 | 100.0 | % | ||||||||
| Cost of sales |
602,763 | 54.6 | 632,654 | 59.1 | 674,957 | 59.1 | ||||||||||||||
| Depreciation related to cost of goods sold |
5,040 | 0.5 | 4,416 | 0.4 | 4,245 | 0.4 | ||||||||||||||
| Gross profit |
495,974 | 44.9 | 433,155 | 40.5 | 461,873 | 40.5 | ||||||||||||||
| Selling, general and administrative expenses |
427,762 | 38.7 | 401,078 | 37.5 | 392,320 | 34.4 | ||||||||||||||
| Depreciation and amortization |
23,419 | 2.1 | 21,742 | 2.0 | 20,523 | 1.8 | ||||||||||||||
| Income from operations |
44,793 | 4.1 | 10,335 | 1.0 | 49,030 | 4.3 | ||||||||||||||
| Interest expense |
21,885 | 2.0 | 24,814 | 2.3 | 27,595 | 2.4 | ||||||||||||||
| Debt extinguishment charges |
82 | — | — | — | — | — | ||||||||||||||
| Income (loss) income before income taxes |
22,826 | 2.1 | (14,479 | ) | (1.4 | ) | 21,435 | 1.9 | ||||||||||||
| Provision for (benefit from) income taxes |
3,293 | 0.3 | (8,316 | ) | (0.8 | ) | 1,534 | 0.1 | ||||||||||||
| Net income (loss) |
19,533 | 1.8 | (6,163 | ) | (0.6 | ) | 19,901 | 1.7 | ||||||||||||
| Year Ended June 30, | ||||||||||||||||||||
| 2010 | 2009 | 2008 | ||||||||||||||||||
| Other data: |
||||||||||||||||||||
| EBITDA and EBITDA margin(1) |
$ | 73,170 | 6.6 | % | $ | 36,493 | (2) | 3.4 | % | $ | 73,798 | (3) | 6.5 | % | ||||||
| (1) | For a definition of EBITDA and a reconciliation of net income to EBITDA, see Note 9 under Item 6 “Selected Financial Data.” EBITDA margin represents EBITDA divided by net sales. |
| (2) | Includes $23.3 million of expenses ($18.9 million of which did not require the use of cash), related to the Liz Claiborne license agreement due to Liz Claiborne inventory that was purchased at a higher cost prior to the June 2008 effective date of the license agreement, and transition expenses. |
| (3) | Includes $27.0 million of expenses related to the Liz Claiborne license agreement, including product discontinuation charges. |
At June 30, 2010, our operations were organized into the following reportable segments:
| • | North America Fragrance — The North America Fragrance segment sells our portfolio of owned, licensed and distributed fragrances to department stores, mass retailers and distributors in the United States, Canada and Puerto Rico. This segment also sells our Elizabeth Arden products in prestige department stores in Canada and Puerto Rico and to other selected retailers. This segment also includes our direct to consumer business which is comprised of our Elizabeth Arden branded retail stores and global e-commerce business. |
| • | International — The International segment sells our portfolio of owned and licensed brands, including the Elizabeth Arden products, in approximately 100 countries outside of North America through perfumeries, boutiques, department stores and travel retail outlets worldwide. |
| • | Other — The Other reportable segment sells our Elizabeth Arden products in prestige department stores in the United States and through the Red Door beauty salons, which are owned and operated by an unrelated third party that licenses the Elizabeth Arden and Red Door trademarks from us for use in its salons. |
35
Table of Contents
Commencing July 1, 2010, our operations will be organized into two reportable segments, North America and International. The portion of our business operations that sells our Elizabeth Arden products in prestige department stores in the United States and through the Red Door beauty salons has been consolidated with our North America Fragrance segment to create the North America segment.
Segment profit (loss) excludes depreciation and amortization, interest expense, debt extinguishment charges, consolidation and elimination adjustments and unallocated corporate expenses, which are shown in the table below reconciling segment profit (loss) to consolidated net income (loss) before income taxes. Included in unallocated corporate expenses are (i) employee incentive costs, (ii) restructuring charges, (iii) costs related to the Initiative, and (iv) costs related to the Liz Claiborne license agreement. These expenses are recorded in unallocated corporate expenses as these items are centrally directed and controlled and are not included in internal measures of segment operating performance. We do not have any intersegment sales.
The following table is a comparative summary of our net sales and segment profit by reportable segment for the years ended June 30, 2010, 2009 and 2008, and reflects the basis of presentation described in Note 1 — “General Information & Summary of Significant Accounting Policies” and Note 19 — “Segment Data and Related Information” to the Notes to Consolidated Financial Statements for all periods presented.
| Year Ended June 30, | ||||||||||||
| (Amounts in thousands) | 2010 | 2009 | 2008 | |||||||||
| Segment Net Sales: |
||||||||||||
| North America Fragrance |
$ | 672,990 | $ | 662,235 | $ | 688,807 | ||||||
| International |
384,447 | 366,361 | 400,689 | |||||||||
| Other |
46,340 | 41,629 | 54,799 | |||||||||
| Total |
$ | 1,103,777 | $ | 1,070,225 | $ | 1,144,295 | ||||||
| Reconciliation: |
||||||||||||
| Segment Net Sales |
$ | 1,103,777 | $ | 1,070,225 | $ | 1,144,295 | ||||||
| Less: |
||||||||||||
| Unallocated Sales Allowances |
— | — | 3,220 | (5) | ||||||||
| Net Sales |
$ | 1,103,777 | $ | 1,070,225 | $ | 1,141,075 | ||||||
| Segment Profit (Loss): |
||||||||||||
| North America Fragrance |
$ | 114,474 | $ | 107,289 | $ | 116,855 | ||||||
| International |
17,250 | (2,232 | ) | 16,997 | ||||||||
| Other |
(2,802 | ) | (10,688 | ) | (3,450 | ) | ||||||
| Less: |
||||||||||||
| Depreciation and Amortization |
28,459 | 26,158 | 24,768 | |||||||||
| Interest expense, net |
21,885 | 24,814 | 27,595 | |||||||||
| Consolidation and Elimination Adjustments |
23,103 | (1) | 16,469 | 15,141 | ||||||||
| Unallocated Corporate Expenses(2) |
32,649 | (3) | 41,407 | (4) | 41,463 | (5) | ||||||
| Income (Loss) Before Income Taxes |
$ | 22,826 | $ | (14,479 | ) | $ | 21,435 | |||||
| (1) | Amounts shown for the year ended June 30, 2010 include $5.5 million related to lower than normal pricing charged to the North America Fragrance segment for certain sales of inventory by that segment that were undertaken at the direction of corporate, rather than segment, management. |
| (2) | Unallocated corporate expenses include (i) employee incentive costs, (ii) restructuring charges, (iii) costs related to the Initiative, and (iv) costs related to the Liz Claiborne license agreement. Excluding items addressed in footnotes (3) through (5) below, unallocated corporate expenses for the year ended June 30, 2010 increased as compared to June 30, 2009 and 2008 primarily due to higher incentive compensation costs. |
36
Table of Contents
| (3) | Amounts for the year ended June 30, 2010, include (i) $1.9 million of restructuring expenses related to the Initiative, (ii) $1.5 million of restructuring expenses not related to the Initiative, (iii) $3.9 million of expenses related to the implementation of an Oracle accounting and order processing system, and (iv) $0.1 million of debt extinguishment costs. |
| (4) | In May 2008, we entered into an exclusive long-term global licensing agreement for the Liz Claiborne fragrance brands, which became effective on June 9, 2008. Amounts shown for the year ended June 30, 2009 include (i) $23.3 million of expenses ($18.9 million of which did not require the use of cash) related to our Liz Claiborne license agreement due to Liz Claiborne inventory that was purchased at a higher cost prior to the June 2008 effective date of the license agreement and transition expenses, (ii) $3.5 million of restructuring expenses related to the Initiative, (iii) $1.1 million of restructuring expenses not related to the Initiative, and (iv) $3.4 million of expenses related to the implementation of our Oracle accounting and order processing systems. |
| (5) | Amounts shown for the year ended June 30, 2008, include (i) $27.0 million of expenses, including unallocated sales allowances and product discontinuation charges, related to the Liz Claiborne license agreement, (ii) $0.7 million of restructuring expenses related to the Initiative, and (iii) $2.3 million of restructuring expenses not related to the Initiative. |
Year Ended June 30, 2010 Compared to Year Ended June 30, 2009
Net Sales. Net sales increased by 3.1% or $33.6 million for the year ended June 30, 2010 compared to the year ended June 30, 2009. Excluding the favorable impact of foreign currency translation, net sales increased by 1.6% or $16.9 million. Net sales of the Juicy Couture fragrances increased by $27.1 million due to the current year launch of the latest Juicy Couture fragrance, Couture Couture, and the continued roll out of the prior year launch of Viva La Juicy. Sales of Britney Spears fragrances and Elizabeth Arden branded products increased by $22.1 million and $19.8 million, respectively. These increases were partially offset by $20.0 million in reduced sales of distributed brands and $13.5 million of lower sales of other fragrances, primarily Usher. Pricing changes had an immaterial effect on net sales.
North America Fragrance
Net sales increased by 1.6% or $10.8 million. Excluding the favorable impact of foreign currency translation, net sales increased by 1.2% or $8.0 million. The increase in net sales was primarily due to higher sales of the Juicy Couture fragrance brands, due to the current year launch of Couture Couture and the continued roll out of the prior year launch of Viva La Juicy. Also contributing to the increase were higher sales of Britney Spears and Mariah Carey fragrance brands. These increases were partially offset by a decline in sales of distributed brands and Usher fragrances. While net sales to U.S. department store customers decreased by $17.4 million, sales to other customers, primarily mass customers, increased by $28.2 million.
International
Net sales increased by 4.9% or $18.1 million. Excluding the favorable impact of foreign currency translation, net sales increased by 1.1% or $4.1 million. Net sales in our travel retail and distributor markets were $13.8 million higher than in the prior year period. The current year period also benefited from incremental sales due to the international roll-out of Viva La Juicy and launches of Couture Couture and the Alberta Ferretti fragrance. Net sales in the prior year period included gains of $14.1 million from our settled foreign currency contracts.
37
Table of Contents
Other
Net sales increased by 11.3% or $4.7 million primarily due to higher sales of Elizabeth Arden skin care and color cosmetic products.
Gross Margin. For the year ended June 30, 2010 and 2009, gross margins were 44.9% and 40.5%, respectively. Gross margin for the year ended June 30, 2009 included $19.9 million of charges ($18.9 million of which did not require the use of cash) related to the higher cost Liz Claiborne inventory purchased prior to the June 2008 effective date of the Liz Claiborne license agreement, which reduced gross margin for fiscal 2009 by approximately 190 basis points. In addition, gross margin in the current year period benefited from a higher proportion of sales of basic stock items of owned and licensed brands, which reflect higher gross margins as compared to distributed brands and promotional product sales, the favorable impact of foreign currency translation, and lower distribution and freight costs.
SG&A. Selling, general and administrative expenses increased 6.7%, or $26.7 million, for the year ended June 30, 2010, compared to the year ended June 30, 2009. The increase was principally due to (i) higher general and administrative expenses of $17.0 million, and (ii) higher royalty and advertising and sales promotion expenses of $7.1 million primarily due to higher sales of licensed brands. The increase in general and administrative expenses was principally due to higher incentive compensation and payroll costs of $20.1 million and higher losses in the current year period of $2.2 million related to the impact of foreign currency translation of our affiliates’ balance sheets. Partially offsetting these increases in general and administrative expenses were transition expenses of $3.4 million in the prior year period related to the June 2008 license of the Liz Claiborne fragrance brands. For the year ended June 30, 2010, total restructuring and Initiative related one-time costs were $7.3 million as compared to $8.0 million for the year ended June 30, 2009.
Segment Profit (Loss)
North America Fragrance
Segment profit increased 6.7% or $7.2 million. The increase in segment profit was mostly due to higher sales and improved gross margins due to a higher proportion of basic stock sales of owned and licensed brands, which reflect higher gross margins as compared to distributed brands and promotional product sales and lower freight and distribution costs, partially offset by higher selling, general and administrative expenses.
International
Segment profit was $17.3 million as compared to a loss of $2.2 million in the prior year period. The improvement in segment results was primarily due to the impact of favorable foreign currency translation and improved gross margins due to a higher proportion of basic stock sales, which have higher gross margins as compared to promotional product sales, and lower freight and distribution costs, partially offset by higher selling, general and administrative expenses.
Other
Segment loss decreased by $7.9 million from the prior year period primarily due to higher sales and improved gross margins.
Interest Expense. Interest expense, net of interest income, decreased 11.8%, or $2.9 million, for the year ended June 30, 2010, compared to the year ended June 30, 2009. The decrease was due to lower average borrowings under our revolving bank credit facility during the current year period and lower average interest rates under such credit facility.
38
Table of Contents
Provision for/ Benefit from Income Taxes. A provision for income taxes of $3.3 million was recorded for the year ended June 30, 2010, compared to benefit from income taxes of $8.3 million for the year ended June 30, 2009. The pre-tax income (loss) from our domestic and international operations consisted of the following for the year ended June 30, 2010 and 2009:
| Year Ended | ||||||||
| (Amounts in thousands) | June 30, 2010 |
June 30, 2009 |
||||||
| Domestic pre-tax income (loss) |
$ | 222 | $ | (26,621 | ) | |||
| Foreign pre-tax income |
22,604 | 12,142 | ||||||
| Total income (loss) before income taxes |
$ | 22,826 | $ | (14,479 | ) | |||
| Effective tax rate |
14.4 | % | 57.4 | % | ||||
The decrease in the effective tax rate in the current year as compared to the prior year was mainly due to (i) higher earnings contributions from our international operations in the current period as compared to the prior year, and (ii) a shift in the ratio of earnings contributions between jurisdictions which have different tax rates. Our domestic operations are tax-effected at a higher rate than our international operations. The tax provision was partially offset by a net tax benefit of $1.7 million of which (i) $0.8 million related to the expiration of the statute of limitations for certain unrecognized tax benefits, (ii) $0.6 million related to research and development and foreign tax credits, (iii) $0.4 million related to tax benefits due to changes in estimates for certain entities and (iv) $0.5 million related to the reversal of valuation allowances associated with the net operating losses previously recorded by certain international subsidiaries which have become realizable. These amounts were partially offset by $0.6 million resulting from changes in statutory tax rates. The prior year effective tax rate included tax adjustments to record a tax benefit of $0.7 million from research and development and foreign tax credits attributable to prior years through the year ended June 30, 2009, partially offset by $0.5 million of valuation allowances associated with net operating losses generated by certain international subsidiaries, as well as by changes to statutory tax rates. See Note 12 to the Notes to Consolidated Financial Statements.
Net Income (Loss). Net income for the year ended June 30, 2010, was $19.5 million compared to a net loss of $6.2 million for the year ended June 30, 2009. The increase in net income was primarily the result of higher sales, improved gross margins, and lower interest expense in the current year period, partially offset by higher selling, general and administrative expenses.
EBITDA. EBITDA (net income plus the provision for income taxes (or net loss less the benefit from income taxes), plus interest expense, plus depreciation and amortization expense) increased by approximately $36.7 million to $73.2 million for the year ended June 30, 2010, compared to $36.5 million for the year ended June 30, 2009. The increase in EBITDA was primarily the result of higher sales, improved gross margins and lower interest expense, partially offset by higher selling, general and administrative expenses in the current year period. For a reconciliation of net income to EBITDA for the years ended June 30, 2010 and 2009, see Note 9 under Item 6, “Selected Financial Data.”
Year Ended June 30, 2009 Compared to Year Ended June 30, 2008
Net Sales. Net sales decreased 6.2% or $70.9 million, for the year ended June 30, 2009, compared to the year ended June 30, 2008. Excluding the unfavorable impact of foreign currency translation, net sales decreased 3.0%, or $34.5 million. In addition to the unfavorable impact of the foreign currency translation, the lower net sales were primarily due to certain North American customers reducing basic stock replenishment orders to reduce inventory levels in light of weak economic conditions. Also contributing to the net sales decline were the credit constraints of various distributors and customers globally. The sales declines affected most distributed and owned or licensed fragrance brands and our skin care and color products. Fragrances launched since the prior
39
Table of Contents
year period, including the Juicy Couture fragrances Viva La Juicy and Dirty English, the 9IX Rocawear fragrance, and the Elizabeth Arden fragrance, Pretty Elizabeth Arden, generated a total of $62.6 million of net sales. Net sales of other Liz Claiborne fragrance brands and the Usher fragrance brands that we distributed in the prior year period but now manufacture increased $70.3 million as a result of the June 2008 Liz Claiborne license agreement. Pricing changes had an immaterial effect on net sales.
North America Fragrance
Net sales decreased by 3.9%, or $26.6 million. Excluding the unfavorable impact of foreign currency translation, net sales decreased 3.1%, or $21.1 million. The lower net sales were primarily due to certain customers reducing basic stock replenishment orders to reduce inventory levels in light of weak economic conditions. Also contributing to the net sales decline were credit constraints of certain customers. The sales declines affected most of our distributed and owned or licensed fragrance brands. These declines were partially offset by net sales of fragrances launched since the prior year, including the Juicy Couture fragrances Viva La Juicy and Dirty English, the 9IX Rocawear fragrance, and the Elizabeth Arden fragrance, Pretty Elizabeth Arden, which collectively generated a total of $46.1 million of net sales for this segment. Net sales of other Liz Claiborne fragrance brands and the Usher fragrance brands that we distributed in the prior year period but now manufacture, increased $58.8 million as a result of the June 2008 Liz Claiborne license agreement.
International
Net sales decreased by 8.6%, or $34.3 million. Excluding the unfavorable impact of foreign currency translation, International net sales decreased 0.9%, or $3.5 million. The sales declines included $29.1 million of lower net sales to travel retail outlets due to a sharp reduction in passenger traffic at airports as a result of the global recession, and lower sales associated with the credit constraints of various distributors globally. Partially offsetting the decrease were approximately $17.2 million of increased Liz Claiborne fragrance sales, including sales from the launches of Viva La Juicy and Dirty English.
Other
Net sales decreased by 24.0%, or $13.2 million. The sales decline was primarily due to lower sales of Elizabeth Arden branded products as a result of certain customers reducing basic stock replenishment orders to reduce inventory levels in light of weak economic conditions and door closings at several department stores.
Gross Margin. For both the years ended June 30, 2009 and 2008, gross margins were 40.5%. Gross margin was impacted by higher sales of Liz Claiborne brands which, as licensed brands, reflect higher gross margins than when they were distributed brands, net of the $18.9 million charge (which did not require the use of cash in fiscal 2009) related to the Liz Claiborne inventory purchased prior to the June 2008 effective date of the Liz Claiborne licensing agreement. This positive factor was mostly offset by the unfavorable impact of foreign currency translation, lower sales volumes in our higher margin European and travel retail markets, and a higher proportion of lower margin promotional product sales as compared to basic stock products.
SG&A. Selling, general and administrative expenses increased 2.2%, or $8.8 million, for the year ended June 30, 2009, compared to the year ended June 30, 2008. The increase was principally due to (i) higher advertising, promotional and royalty costs of $13.0 million, most of which related to the Liz Claiborne fragrance brands and new fragrance launches, and (ii) transition expenses of $3.4 million related to the June 2008 license of the Liz Claiborne fragrance brands. These increases were partially offset by $9.3 million of lower general and administrative expenses in fiscal 2009 primarily travel-related, professional service, and payroll costs (including incentive compensation
40
Table of Contents
related). For the year ended June 30, 2009, total restructuring and Initiative related one-time costs were $8.0 million as compared to $3.0 million for the year ended June 30, 2008.
Segment Profit (Loss)
North America Fragrance
Segment profit decreased 8.2%, or $9.6 million. The decrease in segment profit was mostly due to lower sales. Segment profit was also impacted by higher advertising and promotional costs to support the Liz Claiborne fragrance brands and new product launches, and higher royalty costs associated with the Liz Claiborne and Usher licenses. Partially offsetting these negative impacts were higher sales of the recently licensed Liz Claiborne fragrance brands, which carry higher gross margins as licensed brands than our distributed fragrance brands.
International
Segment loss was $2.2 million, which is a decrease of $19.2 million from the prior year profit of $17.0 million. The decrease was due to the unfavorable impact of foreign currency translation, lower sales primarily in our higher gross margin European and travel retail markets, and lower gross margins due to a higher proportion of promotional product sales as compared to basic stock products.
Other
Segment loss increased by $7.2 million primarily due to lower sales.
Interest Expense. Interest expense, net of interest income, decreased 10.1%, or $2.8 million, for the year ended June 30, 2009, compared to the year ended June 30, 2008. The decrease was due to lower interest rates under our revolving bank credit facility.
Benefit from/Provision for Income Taxes. A benefit from income taxes of $8.3 million was recorded for the year ended June 30, 2009, compared to a provision for income taxes of $1.5 million for the year ended June 30, 2008. The pre-tax (loss) income from our domestic and international operations consisted of the following for the year ended June 30, 2009 and 2008:
| Year Ended | ||||||||
| (Amounts in thousands) | June 30, 2009 |
June 30, 2008 |
||||||
| Domestic pre-tax income (loss) |
$ | (26,621 | ) | $ | (12,927 | ) | ||
| Foreign pre-tax income |
12,142 | 34,362 | ||||||
| Total (loss) income before income taxes |
$ | (14,479 | ) | $ | 21,435 | |||
| Effective tax rate |
57.4 | % | 7.2 | % | ||||
The increase in the effective tax rate was mainly due to increased losses being incurred in the U.S. which are tax-effected at a higher rate than the international operations, as well as adjustments to record a net tax benefit of $0.7 million from research and development and foreign tax credits attributable to prior years through the year ended June 30, 2009. The tax benefit was partially offset by $0.5 million of valuation allowances associated with net operating losses generated by certain international subsidiaries, as well as by changes to statutory tax rates. The prior year effective tax rate included net tax benefits of $0.2 million from research and development and foreign tax credits attributable to prior years partially offset by $0.1 million of valuation allowances associated with net operating losses generated by certain international subsidiaries, as well as by changes to statutory tax rates. See Note 12 to the Notes to Consolidated Financial Statements.
41
Table of Contents
Net (Loss) Income. Net loss for the year ended June 30, 2009 was $6.2 million compared to net income of $19.9 million for the year ended June 30, 2008. The decrease in net income was mainly driven by overall sales declines, and the unfavorable impact of foreign currency translation, partially offset by increased sales of the Liz Claiborne and Usher brands and our newly launched fragrances.
EBITDA. EBITDA (net income plus the provision for income taxes (or net loss less the benefit from income taxes), plus interest expense, plus depreciation and amortization expense) decreased by $37.3 million to $36.5 million for the year ended June 30, 2009, compared to $73.8 million for the year ended June 30, 2008. The decrease in EBITDA was primarily the result of overall net sales declines, and the unfavorable impact of foreign currency translation as discussed above. For a reconciliation of net income to EBITDA for the years ended June 30, 2009 and 2008, see Note 9 under Item 6, “Selected Financial Data.”
Seasonality
Our operations have historically been seasonal, with higher sales generally occurring in the first half of our fiscal year as a result of increased demand by retailers in anticipation of and during the holiday season. For the year ended June 30, 2010, approximately 60% of our net sales were made during the first half of our fiscal year. Due to product innovation and new product launches, the size and timing of certain orders from our customers, and additions or losses of brand distribution rights, sales, results of operations, working capital requirements and cash flows can vary significantly between quarters of the same and different years. As a result, we expect to experience variability in net sales, operating margin, net income, working capital requirements and cash flows on a quarterly basis. Increased sales of skin care and cosmetic products relative to fragrances may reduce the seasonality of our business.
We experience seasonality in our working capital, with peak inventory levels normally from July to October and peak receivable balances normally from September to December. Our working capital borrowings are also seasonal and are normally highest in the months of September, October and November. During the months of December, January and February of each year, cash is normally generated as customer payments on holiday season orders are received.
Liquidity and Capital Resources
| Year Ended June 30, | ||||||||||||
| (Amounts in thousands) | 2010 | 2009 | 2008 | |||||||||
| Net cash provided by operating activities |
$ | 113,959 | $ | 36,986 | $ | 8,037 | ||||||
| Net cash used in investing activities |
(35,721 | ) | (31,663 | ) | (28,588 | ) | ||||||
| Net cash (used in) provided by financing activities |
(74,337 | ) | (7,529 | ) | 16,791 | |||||||
| Net increase (decrease) in cash and cash equivalents |
3,779 | (3,294 | ) | (3,891 | ) | |||||||
Cash Flows. For the year ended June 30, 2010, net cash provided by operating activities was $114.0 million, as compared to $37.0 million for the year ended June 30, 2009. This increase in cash provided by operating activities was principally due to higher net income, improved account receivable collections and continued reductions in inventory levels, which has resulted in lower accounts payable.
For the year ended June 30, 2009, net cash provided by operating activities was $37.0 million, as compared to $8.0 million for the year ended June 30, 2008. This increase in cash provided by operating activities was due to less cash used for working capital requirements partially offset by lower net income. The reduction in working capital requirements during the year ended June 30, 2009, resulted from (i) reductions in inventory purchases due in part to our Global Efficiency Re-Engineering initiative as well as inventory purchases made in June 2008 in connection with the
42
Table of Contents
Liz Claiborne license agreement, and (ii) reductions of accounts receivable associated with the lower net sales, partially offset by (iii) a decrease in accounts payable of $50.8 million due to the timing of payments and reductions in inventory purchases.
The following chart illustrates our net cash used in investing activities during the years ended June 30, 2010, 2009 and 2008:
| Year Ended June 30, | ||||||||||||
| (Amounts in thousands) | 2010 | 2009 | 2008 | |||||||||
| Additions to property and equipment |
$ | (35,388 | ) | $ | (26,330 | ) | $ | (22,155 | ) | |||
| Acquisition of licenses and distributor assets |
(333 | ) | (5,333 | ) | (6,433 | ) | ||||||
| Total |
$ | (35,721 | ) | $ | (31,663 | ) | $ | (28,588 | ) | |||
For the year ended June 30, 2010, net cash used in investing activities of $35.7 million was composed of approximately $35.4 million of capital expenditures primarily for the implementation of the Oracle financial accounting and order processing system, in-store counters and displays, tools and molds, and computer hardware and software. In addition, net cash used in investing activities included the remaining Sovereign Sales contingent consideration of $0.3 million that was paid in September 2009.
For the year ended June 30, 2009, net cash used in investing activities of $31.7 million was composed of approximately $26.3 million of capital expenditures primarily for the implementation of the Oracle financial accounting and order processing system, in-store counters and displays, tools and molds, and computer hardware and software. In addition, net cash used in investing activities included the $5.3 million payment of the second installment of contingent consideration associated with our acquisition of the fragrance business of Sovereign Sales, LLC.
We currently expect to incur between $25 million and $30 million in capital expenditures in the year ending June 30, 2011, primarily for (i) in-store counters and displays, (ii) computer hardware and software, and (iii) leasehold improvements.
For the year ended June 30, 2010, net cash used in financing activities was $74.3 million, as compared to net cash used in financing activities of $7.5 million for the year ended June 30, 2009. During the year ended June 30, 2010, borrowings under our credit facility decreased by $56.0 million to $59.0 million at June 30, 2010, and we also made payments under capital lease obligations of $1.9 million. In addition, in May 2010, we repurchased $5.0 million of our 7 3/4% senior subordinated notes. For the year ended June 30, 2010, repurchases of common stock totaled $13.8 million compared to $1.6 million for the year ended June 30, 2009.
For the year ended June 30, 2009, net cash used in financing activities was $7.5 million, as compared to net cash provided by financing activities of $16.8 million for the year ended June 30, 2008. During the year ended June 30, 2009, borrowings under our credit facility decreased by $4.0 million to $115.0 million at June 30, 2009, and we also made payments under capital lease obligations of $2.0 million. During the year ended June 30, 2008, borrowings under our credit facility increased by $21.0 million to $119.0 million at June 30, 2008, primarily due to our purchase of inventory from Liz Claiborne in connection with our license agreement. For the year ended June 30, 2009, repurchases of common stock totaled $1.6 million compared to $7.4 million for the year ended June 30, 2008.
Interest paid during the year ended June 30, 2010, included $17.5 million of interest payments on the 7 3/4% senior subordinated notes due 2014 and $2.9 million of interest paid on the borrowings under our credit facility. Interest paid during the year ended June 30, 2009, included $17.4 million of interest payments on the 7 3/4% senior subordinated notes due 2014 and $7.0 million of interest paid on the borrowings under our credit facility. Interest paid during the year
43
Table of Contents
ended June 30, 2008, included $17.4 million of interest payments on the 7 3/4% senior subordinated notes due 2014 and $9.5 million of interest paid on the borrowings under our credit facility.
At June 30, 2010, we had approximately $26.9 million of cash, of which $20.5 million was held outside of the United States. Of the cash held outside of the U.S., $7.4 million was considered cash in excess of local operating requirements and could have been repatriated to the U.S. without restriction or tax effect. The balance of such cash held outside the U.S., approximately $13.1 million, was needed to meet local working capital requirements and therefore considered permanently reinvested in the applicable local subsidiary.
Debt and Contractual Financial Obligations and Commitments. At June 30, 2010, our long-term debt and financial obligations and commitments by due dates were as follows:
| Payments Due by Period | |||||||||||||||
| (Amounts in thousands) | Total | Less Than 1 Year |
1 - 3 Years |
3 - 5 Years |
More Than 5 Years | ||||||||||
| Long-term debt, including current portion(1) |
$ | 220,000 | $ | — | $ | — | $ | 220,000 | $ | — | |||||
| Interest payments on long-term debt(2) |
58,256 | 17,050 | 34,101 | 7,105 | — | ||||||||||
| Operating lease obligations |
75,954 | 18,153 | 23,601 | 15,009 | 19,191 | ||||||||||
| Capital lease obligations |
32 | 32 | — | — | — | ||||||||||
| Purchase obligations(3) |
441,480 | 310,841 | 55,639 | 37,250 | 37,750 | ||||||||||
| Other long-term obligations(4) |
5,422 | — | 5,422 | — | — | ||||||||||
| Total |
$ | 801,144 | $ | 346,076 | $ | 118,763 | $ | 279,364 | $ | 56,941 | |||||
| (1) | Total scheduled maturities do not include $1.3 million of swap termination costs that were recorded as a reduction to long-term debt are amortized to interest expense over the remaining life of the 7 3/4% senior subordinated notes due 2014. |
| (2) | Consists of interest at the rate of 7 3/4% per annum on the $220 million aggregate principal amount of 7 3/4% senior subordinated notes. See Note 10 to the Notes to Consolidated Financial Statements. |
| (3) | Consists of obligations incurred in the ordinary course of business related to purchase commitments for finished goods, raw materials, components, advertising, promotional items, minimum royalty guarantees, insurance, services pursuant to legally binding obligations, including fixed or minimum obligations, and estimates of such obligations subject to variable price provisions. |
| (4) | Excludes $4.5 million of gross unrecognized tax benefits that, if not realized, would result in cash payments. We cannot currently estimate when, or if, the payments will be due. See Note 12 to the Notes to Consolidated Financial Statements. |
Future Liquidity and Capital Needs. Our principal future uses of funds are for working capital requirements, including brand development and marketing expenses, new product launches, additional brand acquisitions or product licensing and distribution arrangements, capital expenditures and debt service. In addition, we may use funds to repurchase material amounts of our common stock and senior subordinated notes through open market purchases, privately negotiated transactions or otherwise, depending upon prevailing market conditions, our liquidity requirements, contractual restrictions and other factors. We have historically financed our working capital needs primarily through internally generated funds, our credit facility and external financing. We collect cash from our customers based on our sales to them and their respective payment terms.
We have a $325 million revolving credit facility with a syndicate of banks, for which JPMorgan Chase Bank is the administrative agent, which generally provides for borrowings on a revolving basis with a $25 million sub-limit for letters of credit. See Note 9 to the Notes to Consolidated Financial Statements. Under the terms of the credit facility we may, at any time, increase the size of the credit
44
Table of Contents
facility up to $375 million without entering into a formal amendment requiring the consent of all of the banks, subject to our satisfaction of certain conditions. The credit facility expires in December 2012.
The credit facility is guaranteed by all of our U.S. subsidiaries and is collateralized by a first priority lien on all of our U.S., Canada and Puerto Rico accounts receivable and U.S. inventory. Borrowings under the credit facility are limited to 85.0% of eligible accounts receivable and 85.0% of the appraised net liquidation value of our inventory, as determined pursuant to the terms of the credit facility; provided, however, that from August 15 to October 31 of each year our borrowing base may be temporarily increased by up to $25 million. Our obligations under the credit facility rank senior to our 7 3/4% senior subordinated notes due 2014.
The credit facility has only one financial maintenance covenant, which is a debt service coverage ratio that must be maintained at not less than 1.1 to 1 if average borrowing base capacity declines to less than $25 million ($35 million from December 1 through May 31). Our average borrowing base capacity for each of the quarters during fiscal 2010 did not fall below the applicable thresholds noted above. Accordingly, the debt service coverage ratio did not apply to the quarter ended June 30, 2010. We were in compliance with all applicable covenants under the credit facility for the quarter and year ended June 30, 2010.
Under the terms of the credit facility, we may pay dividends or repurchase common stock if we maintain borrowing base capacity of at least $25 million from June 1 to November 30, and at least $35 million from December 1 to May 31, after making the applicable payment. The credit facility restricts us from incurring additional non-trade indebtedness (other than refinancings and certain small amounts of indebtedness).
Borrowings under the credit portion of the credit facility bear interest at a floating rate based on the “Applicable Margin,” which is determined by reference to a specific financial ratio. At our option, the Applicable Margin may be applied to either the London InterBank Offered Rate (LIBOR) or the prime rate. The reference ratio for determining the Applicable Margin is a debt service coverage ratio. The Applicable Margin charged on LIBOR loans ranges from 1.00% to 1.75% and is 0% for prime rate loans, except that the Applicable Margin on the first $25 million of borrowings from August 15 to October 31 of each year, while the temporary increase in our borrowing base is in effect, is 1.00% higher. At June 30, 2010, the Applicable Margin was 1.50% for LIBOR loans and 0% for prime rate loans. The commitment fee on the unused portion of the credit facility is 0.25%. For the years ended June 30, 2010 and 2009, the weighted average annual interest rate on borrowings under our credit facility was 2.7% and 3.3%, respectively. The interest rates payable by us on our 7 3/4% senior subordinated notes and on borrowings under our revolving credit facility are not impacted by credit rating agency actions.
At June 30, 2010, we had (i) $59.0 million in borrowings and $4.4 million in letters of credit outstanding under the credit facility, (ii) $158.6 million of eligible accounts receivable and inventories available as collateral under the credit facility, and (iii) remaining borrowing availability of $99.5 million. The borrowing availability under the credit facility typically declines in the second half of our fiscal year as our higher accounts receivable balances resulting from holiday season sales are likely to decline due to cash collections.
At June 30, 2010, we had outstanding $220.0 million aggregate principal amount of 7 3/4% senior subordinated notes. The 7 3/4% senior subordinated notes are guaranteed by our U.S. subsidiaries. See Note 10 to the Notes to Consolidated Financial Statements. The indenture pursuant to which the 7 3/4% senior subordinated notes were issued provides that such notes will be our senior subordinated obligations. The 7 3/4% senior subordinated notes rank junior to all of our existing and future senior indebtedness, including indebtedness under the credit facility, and pari passu in right of payment to all of our senior subordinated indebtedness. Interest on the 7 3/4% senior subordinated notes is payable semi-annually on February 15 and August 15 of each year. The indenture generally
45
Table of Contents
permits us (subject to the satisfaction of a fixed charge coverage ratio and, in certain cases, also a net income test) to incur additional indebtedness, pay dividends, purchase or redeem our common stock or redeem subordinated indebtedness. The indenture generally limits our ability to create liens, merge or transfer or sell assets. The indenture also provides that the holders of the 7 3/4% senior subordinated notes have the option to require us to repurchase their notes in the event of a change of control involving us (as defined in the indenture).
Based upon our internal projections, we believe that existing cash and cash equivalents, internally generated funds and borrowings under our credit facility will be sufficient to cover debt service, working capital requirements and capital expenditures for the next twelve months, other than additional working capital requirements that may result from further expansion of our operations through acquisitions of additional brands, or licensing or distribution arrangements. A deterioration in the economic and retail environment, however, could cause us to fail to satisfy the financial maintenance covenant under our bank credit facility that applies only in the event we do not have the requisite average borrowing base capacity as set forth under the credit facility. In such an event, we would not be allowed to borrow under the revolving credit facility and may not have access to the capital necessary for our business. In addition, a default under our credit facility that causes acceleration of the debt under this facility could trigger a default under our outstanding 7 3/4% senior subordinated notes. In the event we are not able to borrow under our credit facility, we would be required to develop an alternative source of liquidity. There is no assurance that we could obtain replacement financing or what the terms of such financing, if available, would be.
Repurchases of Common Stock. On November 5, 2008, our board of directors authorized us to extend our existing $80 million common stock repurchase program through November 30, 2010. As of June 30, 2010, we had repurchased 3,430,498 shares of common stock on the open market under the stock repurchase program, at an average price of $16.86 per share, at a cost of $57.9 million, including sales commissions, leaving $22.1 million available for additional common stock repurchases under the program. For the year ended June 30, 2010, we purchased 904,260 shares of Common Stock on the open market under the stock repurchase program at an average price of $16.55 per share and at a cost of $15.0 million, including sales commissions. The acquisition of these shares by us was accounted for under the treasury method.
We have discussions from time to time with manufacturers and owners of prestige fragrance brands regarding our possible acquisition of additional exclusive licensing and/or distribution rights. We currently have no material agreements or commitments with respect to any such acquisition, although we periodically execute routine agreements to maintain the confidentiality of information obtained during the course of discussions with such manufacturers and brand owners. There is no assurance that we will be able to negotiate successfully for any such future acquisitions or that we will be able to obtain acquisition financing or additional working capital financing on satisfactory terms for further expansion of our operations.
Forward-Looking Information and Factors That May Affect Future Results
The Securities and Exchange Commission encourages companies to disclose forward-looking information so that investors can better understand a company’s future prospects and make informed investment decisions. This Annual Report on Form 10-K and other written and oral statements that we make from time to time contain such forward-looking statements that set out anticipated results based on management’s plans and assumptions regarding future events or performance. We have tried, wherever possible, to identify such statements by using words such as “anticipate,” “estimate,” “expect,” “project,” “intend,” “plan,” “believe,” “will” and similar expressions in connection with any discussion of future operating or financial performance. In particular, these include statements relating to future actions, prospective products, future performance or results of current and anticipated products, sales efforts, expenses and/or cost savings, interest rates, foreign exchange rates, the outcome of contingencies, such as legal proceedings, and financial results. A list of factors that could cause our actual results of operations
46
Table of Contents
and financial condition to differ materially from our forward-looking statements is set forth below, and these factors are discussed in greater detail under Item 1A — “Risk Factors” of this Annual Report on Form 10-K.
| • | factors affecting our relationships with our customers or our customers’ businesses, including the absence of contracts with customers, our customers’ financial condition, and changes in the retail, fragrance and cosmetic industries, such as the consolidation of retailers and the associated closing of retail doors as well as retailer inventory control practices, including, but not limited to, levels of inventory carried at point of sale and practices used to control inventory shrinkage; |
| • | risks of international operations, including foreign currency fluctuations, hedging activities, economic and political consequences of terrorist attacks, disruptions in travel, unfavorable changes in U.S. or international laws or regulations, diseases and pandemics, and political instability in certain regions of the world; |
| • | our reliance on third-party manufacturers for substantially all of our owned and licensed products and our absence of contracts with suppliers of distributed brands and components for manufacturing of owned and licensed brands; |
| • | delays in shipments, inventory shortages and higher costs of production due to the loss of or disruption in our distribution facilities or at key third party manufacturing or fulfillment facilities that manufacture or provide logistic services for our products; |
| • | our ability to respond in a timely manner to changing consumer preferences and purchasing patterns and other international and domestic conditions and events that impact retailer and/or consumer confidence and demand, such as domestic or global recessions; |
| • | our ability to protect our intellectual property rights; |
| • | the success, or changes in the timing or scope, of our new product launches, advertising and merchandising programs; |
| • | the quality, safety and efficacy of our products; |
| • | the impact of competitive products and pricing; |
| • | our ability to (i) implement our growth strategy and acquire or license additional brands or secure additional distribution arrangements, (ii) successfully and cost-effectively integrate acquired businesses or new brands, and (iii) finance our growth strategy and our working capital requirements; |
| • | our level of indebtedness, our ability to realize sufficient cash flows from operations to meet our debt service obligations and working capital requirements, and restrictive covenants in our revolving credit facility and the indenture for our 7 3/4% senior subordinated notes; |
| • | changes in product mix to less profitable products; |
| • | the retention and availability of key personnel; |
| • | changes in the legal, regulatory and political environment that impact, or will impact, our business, including changes to customs or trade regulations, laws or regulations relating to product ingredients or other chemicals, or accounting standards or critical accounting estimates; |
| • | the success of, and costs associated with, our Global Efficiency Re-engineering initiative and related restructuring plan, including our transition to a turnkey manufacturing process and our implementation of a new Oracle financial accounting and order processing system; |
47
Table of Contents
| • | the potential for significant impairment charges relating to our trademarks, goodwill or other intangible assets that could result from a number of factors, including downward pressure on our stock price; and |
| • | other unanticipated risks and uncertainties. |
We caution that the factors described herein and other factors could cause our actual results of operations and financial condition to differ materially from those expressed in any forward-looking statements we make and that investors should not place undue reliance on any such forward-looking statements. Further, any forward-looking statement speaks only as of the date on which such statement is made, and we undertake no obligation to update any forward-looking statement to reflect events or circumstances after the date on which such statement is made or to reflect the occurrence of anticipated or unanticipated events or circumstances. New factors emerge from time to time, and it is not possible for us to predict all of such factors. Further, we cannot assess the impact of each such factor on our results of operations or the extent to which any factor, or combination of factors, may cause actual results to differ materially from those contained in any forward-looking statements.
ITEM 7A. QUANTITATIVE AND QUALITATIVE DISCLOSURES ABOUT MARKET RISK
Interest Rate Risk
As of June 30, 2010, we had $59.0 million in borrowings outstanding under our revolving credit facility. Borrowings under our revolving credit facility are seasonal, with peak borrowings typically in the months of September, October and November. Borrowings under the credit facility are subject to variable rates and, accordingly, our earnings and cash flow will be affected by changes in interest rates. Based upon our average borrowings under our revolving credit facility during the year ended June 30, 2010, and assuming there had been a two percentage point (200 basis points) change in the average interest rate for these borrowings, it is estimated that our interest expense for the year ended June 30, 2010 would have increased or decreased by $2.2 million. See Note 9 to the Notes to Consolidated Financial Statements.
Foreign Currency Risk
We sell our products in approximately 100 countries around the world. During each of the years ended June 30, 2010 and 2009, we derived approximately 39% of our net sales from our international operations. We conduct our international operations in a variety of different countries and derive our sales in various currencies including the Euro, British pound, Swiss franc, Canadian dollar and Australian dollar, as well as the U.S. dollar. Most of our skin care and cosmetic products are produced in third-party manufacturing facilities located in the U.S. Our operations may be subject to volatility because of currency changes, inflation and changes in political and economic conditions in the countries in which we operate. With respect to international operations, our sales, cost of goods sold and expenses are typically denominated in a combination of local currency and the U.S. dollar. Our results of operations are reported in U.S. dollars. Fluctuations in currency rates can affect our reported sales, margins, operating costs and the anticipated settlement of our foreign denominated receivables and payables. A weakening of the foreign currencies in which we generate sales relative to the currencies in which our costs are denominated, which is primarily the U.S. dollar, may adversely affect our ability to meet our obligations and could adversely affect our business, prospects, results of operations, financial condition or cash flows. Our competitors may or may not be subject to the same fluctuations in currency rates, and our competitive position could be affected by these changes.
As of June 30, 2010, our subsidiaries outside the United States held 27.3% of our total assets. The cumulative effect of translating balance sheet accounts from the functional currency into the U.S. dollar at current exchange rates is included in accumulated other comprehensive loss in our consolidated balance sheets.
48
Table of Contents
As of June 30, 2010, we had notional amounts of 15.1 million British pounds under open foreign currency contracts that expire between July 31, 2010 and May 30, 2011 to reduce the exposure of our foreign subsidiary revenues to fluctuations in currency rates. As of June 30, 2010, we had notional amounts of 6.8 million Canadian dollars and 7.9 million Australian dollars under open foreign currency contracts that expire between July 31, 2010 and May 30, 2011 to hedge a portion of our forecasted inventory purchases to reduce the exposure of our Canadian and Australian subsidiaries’ cost of sales to fluctuations in currency rates. We have designated each qualifying foreign currency contract as a cash flow hedge. The gains and losses of these contracts will only be recognized in earnings in the period in which the forecasted transaction affects earnings or the transactions are no longer probable of occurring. The realized gain, net of taxes, recognized during the year ended June 30, 2010 from the settlements of these contracts, was approximately $0.3 million. At June 30, 2010, the unrealized gain, net of taxes, associated with open foreign currency contracts of approximately $0.4 million is included in other comprehensive income (loss) in our consolidated balance sheet. See Note 15 to the Notes to Consolidated Financial Statements.
When appropriate, we also enter into and settle foreign currency contracts for Euros, British pounds and Canadian dollars to reduce the exposure of our foreign subsidiaries’ balance sheets to fluctuations in foreign currency rates. As of June 30, 2010, there were no such foreign currency contracts outstanding. The realized gain, net of taxes, recognized during the year ended June 30, 2010, was $1.3 million.
We do not utilize foreign exchange contracts for trading or speculative purposes. There can be no assurance that our hedging operations or other exchange rate practices, if any, will eliminate or substantially reduce risks associated with fluctuating exchange rates.
49
Table of Contents
| ITEM 8. | FINANCIAL STATEMENTS AND SUPPLEMENTARY DATA |
50
Table of Contents
Elizabeth Arden, Inc. and Subsidiaries
Report on Consolidated Financial Statements
We prepared and are responsible for the consolidated financial statements that appear in the Annual Report on Form 10-K for the year ended June 30, 2010 of Elizabeth Arden, Inc. (the “Company”). These consolidated financial statements are in conformity with accounting principles generally accepted in the United States of America, and therefore, include amounts based on informed judgments and estimates. We also accept responsibility for the preparation of the other financial information that is included in the Company’s Annual Report on Form 10-K.
Report on Internal Control Over Financial Reporting
The management of the Company is responsible for establishing and maintaining adequate internal control over financial reporting as defined in Rules 13a-15(f) and 15d-15(f) under the Securities Exchange Act of 1934. The Company’s internal control over financial reporting is designed to provide reasonable assurance regarding the reliability of financial reporting and the preparation of financial statements for external purposes in accordance with generally accepted accounting principles in the United States of America. The Company’s internal control over financial reporting includes those policies and procedures that: (i) pertain to the maintenance of records that, in reasonable detail, accurately and fairly reflect the transactions and dispositions of the assets of the Company; (ii) provide reasonable assurance that transactions are recorded as necessary to permit preparation of financial statements in accordance with generally accepted accounting principles, and that receipts and expenditures of the Company are being made only in accordance with authorizations of management and directors of the Company; and (iii) provide reasonable assurance regarding prevention or timely detection of unauthorized acquisition, use or disposition of the Company’s assets that could have a material effect on the consolidated financial statements.
Because of its inherent limitations, internal control over financial reporting may not prevent or detect misstatements. Also, projections of any evaluation of effectiveness to future periods are subject to the risk that controls may become inadequate because of changes in conditions, or that the degree of compliance with the policies or procedures may deteriorate. Management of the Company assessed the effectiveness of the Company’s internal control over financial reporting as of June 30, 2010. In making this assessment, management used the criteria set forth by the Committee of Sponsoring Organizations of the Treadway Commission (COSO) in Internal Control-Integrated Framework. Based on our assessment using those criteria, management concluded that the Company maintained effective internal control over financial reporting as of June 30, 2010.
PricewaterhouseCoopers LLP, the independent registered public accounting firm that audited the consolidated financial statements that appear in the Company’s Annual Report on Form 10-K for the year ended June 30, 2010, has issued an unqualified attestation on the Company’s internal control over financial reporting as of June 30, 2010, as stated in their report which is included herein.
| /s/ E. Scott Beattie |
/s/ Stephen J. Smith | |
| Chairman, President and Chief Executive Officer |
Executive Vice President and Chief Financial Officer |
August 17, 2010
51
Table of Contents
Report of Independent Registered Public Accounting Firm
To the Board of Directors and Shareholders of
Elizabeth Arden, Inc.
In our opinion, the consolidated financial statements listed in the accompanying index present fairly, in all material respects, the financial position of Elizabeth Arden, Inc. and its subsidiaries at June 30, 2010 and June 30, 2009, and the results of their operations and their cash flows for each of the three years in the period ended June 30, 2010 in conformity with accounting principles generally accepted in the United States of America. Also in our opinion, the Company maintained, in all material respects, effective internal control over financial reporting as of June 30, 2010, based on criteria established in Internal Control — Integrated Framework issued by the Committee of Sponsoring Organizations of the Treadway Commission (COSO). The Company’s management is responsible for these financial statements, for maintaining effective internal control over financial reporting and for its assessment of the effectiveness of internal control over financial reporting, included in the accompanying Report of Management appearing under Item 8. Our responsibility is to express opinions on these financial statements and on the Company’s internal control over financial reporting based on our integrated audits. We conducted our audits in accordance with the standards of the Public Company Accounting Oversight Board (United States). Those standards require that we plan and perform the audits to obtain reasonable assurance about whether the financial statements are free of material misstatement and whether effective internal control over financial reporting was maintained in all material respects. Our audits of the financial statements included examining, on a test basis, evidence supporting the amounts and disclosures in the financial statements, assessing the accounting principles used and significant estimates made by management, and evaluating the overall financial statement presentation. Our audit of internal control over financial reporting included obtaining an understanding of internal control over financial reporting, assessing the risk that a material weakness exists, and testing and evaluating the design and operating effectiveness of internal control based on the assessed risk. Our audits also included performing such other procedures as we considered necessary in the circumstances. We believe that our audits provide a reasonable basis for our opinions.
A company’s internal control over financial reporting is a process designed to provide reasonable assurance regarding the reliability of financial reporting and the preparation of financial statements for external purposes in accordance with generally accepted accounting principles. A company’s internal control over financial reporting includes those policies and procedures that (i) pertain to the maintenance of records that, in reasonable detail, accurately and fairly reflect the transactions and dispositions of the assets of the company; (ii) provide reasonable assurance that transactions are recorded as necessary to permit preparation of financial statements in accordance with generally accepted accounting principles, and that receipts and expenditures of the company are being made only in accordance with authorizations of management and directors of the company; and (iii) provide reasonable assurance regarding prevention or timely detection of unauthorized acquisition, use, or disposition of the company’s assets that could have a material effect on the financial statements.
Because of its inherent limitations, internal control over financial reporting may not prevent or detect misstatements. Also, projections of any evaluation of effectiveness to future periods are subject to the risk that controls may become inadequate because of changes in conditions, or that the degree of compliance with the policies or procedures may deteriorate.
| /s/ PricewaterhouseCoopers LLP |
| New York, New York |
| August 17, 2010 |
52
Table of Contents
ELIZABETH ARDEN, INC. AND SUBSIDIARIES
CONSOLIDATED BALANCE SHEETS
(Amounts in thousands, except shares and par value)
| As of | ||||||||
| June 30, 2010 | June 30, 2009 | |||||||
| ASSETS | ||||||||
| Current Assets |
||||||||
| Cash and cash equivalents |
$ | 26,881 | $ | 23,102 | ||||
| Accounts receivable, net |
170,067 | 190,273 | ||||||
| Inventories |
271,058 | 318,535 | ||||||
| Deferred income taxes |
33,496 | 14,827 | ||||||
| Prepaid expenses and other assets |
58,892 | 50,024 | ||||||
| Total current assets |
560,394 | 596,761 | ||||||
| Property and equipment, net |
76,583 | 64,110 | ||||||
| Exclusive brand licenses, trademarks and intangibles, net |
179,444 | 186,321 | ||||||
| Goodwill |
21,054 | 21,054 | ||||||
| Debt financing costs, net |
3,509 | 4,705 | ||||||
| Deferred income taxes |
1,301 | 10,530 | ||||||
| Other |
1,186 | 594 | ||||||
| Total assets |
$ | 843,471 | $ | 884,075 | ||||
| LIABILITIES AND SHAREHOLDERS’ EQUITY | ||||||||
| Current Liabilities |
||||||||
| Short-term debt |
$ | 59,000 | $ | 115,000 | ||||
| Accounts payable — trade |
98,441 | 121,413 | ||||||
| Other payables and accrued expenses |
96,429 | 73,192 | ||||||
| Current portion of long-term debt |
— | 545 | ||||||
| Total current liabilities |
253,870 | 310,150 | ||||||
| Long-term Liabilities |
||||||||
| Long-term debt |
218,699 | 223,366 | ||||||
| Deferred income taxes and other liabilities |
18,285 | 13,781 | ||||||
| Total long-term liabilities |
236,984 | 237,147 | ||||||
| Total liabilities |
490,854 | 547,297 | ||||||
| Commitments and contingencies (see Note 11) |
||||||||
| Shareholders’ Equity |
||||||||
| Common stock, $.01 par value, 50,000,000 shares authorized; 31,897,303 and 31,444,935 shares issued, respectively |
319 | 316 | ||||||
| Additional paid-in capital |
297,137 | 285,847 | ||||||
| Retained earnings |
118,946 | 99,413 | ||||||
| Treasury stock (3,632,589 and 2,728,329 shares at cost, respectively) |
(62,303 | ) | (47,334 | ) | ||||
| Accumulated other comprehensive loss |
(1,482 | ) | (1,464 | ) | ||||
| Total shareholders’ equity |
352,617 | 336,778 | ||||||
| Total liabilities and shareholders’ equity |
$ | 843,471 | $ | 884,075 | ||||
The accompanying Notes are an integral part of the Consolidated Financial Statements.
53
Table of Contents
ELIZABETH ARDEN, INC. AND SUBSIDIARIES
CONSOLIDATED STATEMENTS OF OPERATIONS
(Amounts in thousands, except per share data)
| Year Ended June 30, | ||||||||||
| 2010 | 2009 | 2008 | ||||||||
| Net sales |
$ | 1,103,777 | $ | 1,070,225 | $ | 1,141,075 | ||||
| Cost of goods sold: |
||||||||||
| Cost of sales |
602,763 | 632,654 | 674,957 | |||||||
| Depreciation related to cost of goods sold |
5,040 | 4,416 | 4,245 | |||||||
| Total cost of goods sold |
607,803 | 637,070 | 679,202 | |||||||
| Gross profit |
495,974 | 433,155 | 461,873 | |||||||
| Operating expenses |
||||||||||
| Selling, general and administrative |
427,762 | 401,078 | 392,320 | |||||||
| Depreciation and amortization |
23,419 | 21,742 | 20,523 | |||||||
| Total operating expenses |
451,181 | 422,820 | 412,843 | |||||||
| Income from operations |
44,793 | 10,335 | 49,030 | |||||||
| Other expense |
||||||||||
| Interest expense |
21,885 | 24,814 | 27,595 | |||||||
| Debt extinguishment charges |
82 | — | — | |||||||
| Other expense, net |
21,967 | 24,814 | 27,595 | |||||||
| Income (loss) before income taxes |
22,826 | (14,479 | ) | 21,435 | ||||||
| Provision for (benefit from) income taxes |
3,293 | (8,316 | ) | 1,534 | ||||||
| Net income (loss) |
$ | 19,533 | $ | (6,163 | ) | $ | 19,901 | |||
| Net income (loss) per common share: |
||||||||||
| Basic |
$ | 0.70 | $ | (0.22 | ) | $ | 0.71 | |||
| Diluted |
$ | 0.68 | $ | (0.22 | ) | $ | 0.68 | |||
| Weighted average number of common shares: |
||||||||||
| Basic |
28,017 | 27,971 | 27,981 | |||||||
| Diluted |
28,789 | 27,971 | 29,303 | |||||||
The accompanying Notes are an integral part of the Consolidated Financial Statements.
54
Table of Contents
ELIZABETH ARDEN, INC. AND SUBSIDIARIES
CONSOLIDATED STATEMENTS OF SHAREHOLDERS’ EQUITY
(Amounts in thousands)
| Common Stock | Additional Paid-in Capital |
Retained Earnings |
Treasury Stock | Accumulated Other Comprehensive Income (loss) |
Total Shareholders’ Equity |
||||||||||||||||||||||
| Shares | Amount | Shares | Amount | ||||||||||||||||||||||||
| Balance at July 1, 2007 |
30,473 | $ | 305 | $ | 265,245 | $ | 85,675 | (1,862 | ) | $ | (33,879 | ) | $ | 3,581 | $ | 320,927 | |||||||||||
| Issuance of common stock upon exercise of stock options |
524 | 5 | 6,823 | — | (202 | ) | (4,450 | ) | — | 2,378 | |||||||||||||||||
| Issuance of common stock for employee stock purchase plan |
110 | 1 | 1,718 | — | — | — | — | 1,719 | |||||||||||||||||||
| Issuance of restricted stock, net of forfeitures |
50 | 1 | (1 | ) | — | — | — | — | — | ||||||||||||||||||
| Amortization of share-based awards |
— | — | 7,188 | — | — | — | — | 7,188 | |||||||||||||||||||
| Repurchase of common stock |
— | — | — | — | (411 | ) | (7,439 | ) | — | (7,439 | ) | ||||||||||||||||
| Comprehensive income: |
— | — | — | — | — | — | — | — | |||||||||||||||||||
| Net income |
— | — | — | 19,901 | — | — | — | 19,901 | |||||||||||||||||||
| Foreign currency translation adjustments |
— | — | — | — | — | — | 95 | 95 | |||||||||||||||||||
| Disclosure of reclassification amounts, net of taxes |
|||||||||||||||||||||||||||
| Unrealized hedging loss arising during the period |
— | — | — | — | — | — | (16,659 | ) | (16,659 | ) | |||||||||||||||||
| Less: reclassification adjustment for hedging losses included in net income |
— | — | — | — | — | — | 8,491 | 8,491 | |||||||||||||||||||
| Net unrealized cash flow hedging loss |
— | — | — | — | — | — | (8,168 | ) | (8,168 | ) | |||||||||||||||||
| Total comprehensive income (loss) |
— | — | — | 19,901 | — | (8,073 | ) | 11,828 | |||||||||||||||||||
| Balance at June 30, 2008 |
31,157 | $ | 312 | $ | 280,973 | $ | 105,576 | (2,475 | ) | $ | (45,768 | ) | $ | (4,492 | ) | $ | 336,601 | ||||||||||
The accompanying Notes are an integral part of the Consolidated Financial Statements
55
Table of Contents
ELIZABETH ARDEN, INC. AND SUBSIDIARIES
CONSOLIDATED STATEMENTS OF SHAREHOLDERS’ EQUITY—(Continued)
(Amounts in thousands)
| Common Stock | Additional Paid-in Capital |
Retained Earnings |
Treasury Stock | Accumulated Other Comprehensive Income (loss) |
Total Shareholders’ Equity |
|||||||||||||||||||||||
| Shares | Amount | Shares | Amount | |||||||||||||||||||||||||
| Balance at July 1, 2008 |
31,157 | $ | 312 | $ | 280,973 | $ | 105,576 | (2,475 | ) | $ | (45,768 | ) | $ | (4,492 | ) | $ | 336,601 | |||||||||||
| Issuance of common stock upon exercise of stock options |
62 | 1 | 667 | — | — | — | — | 668 | ||||||||||||||||||||
| Issuance of common stock for employee stock purchase plan |
176 | 2 | 1,388 | — | — | — | — | 1,390 | ||||||||||||||||||||
| Issuance of restricted stock, net of forfeitures |
50 | 1 | (1 | ) | — | — | — | — | — | |||||||||||||||||||
| Amortization of share-based awards |
— | — | 2,820 | — | — | — | — | 2,820 | ||||||||||||||||||||
| Repurchase of common stock |
— | — | — | — | (253 | ) | (1,566 | ) | — | (1,566 | ) | |||||||||||||||||
| Comprehensive income: |
— | — | — | — | — | — | — | — | ||||||||||||||||||||
| Net loss |
— | — | — | (6,163 | ) | — | — | — | (6,163 | ) | ||||||||||||||||||
| Foreign currency translation adjustments |
— | — | — | — | — | — | (6,483 | ) | (6,483 | ) | ||||||||||||||||||
| Disclosure of reclassification amounts, net of taxes |
||||||||||||||||||||||||||||
| Unrealized hedging gain arising during the period |
— | — | — | — | — | — | 22,974 | 22,974 | ||||||||||||||||||||
| Less: reclassification adjustment for hedging gains included in net income |
— | — | — | — | — | — | (13,463 | ) | (13,463 | ) | ||||||||||||||||||
| Net unrealized cash flow hedging gain |
— | — | — | — | — | — | 9,511 | 9,511 | ||||||||||||||||||||
| Total comprehensive (loss) income |
— | — | — | (6,163 | ) | — | 3,028 | (3,135 | ) | |||||||||||||||||||
| Balance at June 30, 2009 |
31,445 | $ | 316 | $ | 285,847 | $ | 99,413 | (2,728 | ) | $ | (47,334 | ) | $ | (1,464 | ) | $ | 336,778 | |||||||||||
The accompanying Notes are an integral part of the Consolidated Financial Statements
56
Table of Contents
ELIZABETH ARDEN, INC. AND SUBSIDIARIES
CONSOLIDATED STATEMENTS OF SHAREHOLDERS’ EQUITY—(Continued)
(Amounts in thousands)
| Common Stock | Additional Paid-in Capital |
Retained Earnings |
Treasury Stock | Accumulated Other Comprehensive Income (loss) |
Total Shareholders’ Equity |
|||||||||||||||||||||
| Shares | Amount | Shares | Amount | |||||||||||||||||||||||
| Balance at July 1, 2009 |
31,445 | $ | 316 | $ | 285,847 | $ | 99,413 | (2,728 | ) | $ | (47,334 | ) | $ | (1,464 | ) | $ | 336,778 | |||||||||
| Issuance of common stock upon exercise of stock options |
155 | 2 | 1,589 | — | — | — | — | 1,591 | ||||||||||||||||||
| Issuance of common stock for employee stock purchase plan |
149 | 1 | 1,322 | — | — | — | — | 1,323 | ||||||||||||||||||
| Issuance of restricted stock, net of forfeitures |
148 | — | — | — | — | — | — | |||||||||||||||||||
| Amortization of share-based awards |
— | — | 4,771 | — | — | — | — | 4,771 | ||||||||||||||||||
| Repurchase of common stock |
— | — | — | — | (905 | ) | (14,969 | ) | — | (14,969 | ) | |||||||||||||||
| Excess tax benefit from share-based awards |
3,608 | 3,608 | ||||||||||||||||||||||||
| Comprehensive income: |
— | — | — | — | — | — | — | — | ||||||||||||||||||
| Net income |
— | — | — | 19,533 | — | — | — | 19,533 | ||||||||||||||||||
| Foreign currency translation adjustments |
— | — | — | — | — | — | (397 | ) | (397 | ) | ||||||||||||||||
| Disclosure of reclassification amounts, net of taxes |
||||||||||||||||||||||||||
| Unrealized hedging gain arising during the period |
— | — | — | — | — | — | 650 | 650 | ||||||||||||||||||
| Less: reclassification adjustment for hedging gains included in net income |
— | — | — | — | — | — | (271 | ) | (271 | ) | ||||||||||||||||
| Net unrealized cash flow hedging gain |
— | — | — | — | — | — | 379 | 379 | ||||||||||||||||||
| Total comprehensive income (loss) |
— | — | — | 19,533 | — | — | (18 | ) | 19,515 | |||||||||||||||||
| Balance at June 30, 2010 |
31,897 | $ | 319 | $ | 297,137 | $ | 118,946 | (3,633 | ) | $ | (62,303 | ) | $ | (1,482 | ) | $ | 352,617 | |||||||||
The accompanying Notes are an integral part of the Consolidated Financial Statements.
57
Table of Contents
ELIZABETH ARDEN, INC. AND SUBSIDIARIES
CONSOLIDATED STATEMENTS OF CASH FLOWS
(Dollars in thousands)
| Year Ended June 30, | ||||||||||||
| 2010 | 2009 | 2008 | ||||||||||
| Operating activities: |
||||||||||||
| Net income (loss) |
$ | 19,533 | $ | (6,163 | ) | $ | 19,901 | |||||
| Adjustments to reconcile net income (loss) to net cash provided by operating activities: |
||||||||||||
| Depreciation and amortization |
28,459 | 26,158 | 24,768 | |||||||||
| Amortization of senior note offering, credit facility and swap termination costs |
1,459 | 1,437 | 1,225 | |||||||||
| Amortization of share-based awards |
4,771 | 2,820 | 7,188 | |||||||||
| Debt extinguishment charges |
82 | — | — | |||||||||
| Deferred income taxes |
(1,996 | ) | (11,515 | ) | (5,033 | ) | ||||||
| Change in assets and liabilities, net of acquisitions: |
||||||||||||
| Decrease (increase) in accounts receivable |
20,339 | 22,479 | (2,474 | ) | ||||||||
| Decrease (increase) in inventories |
48,276 | 88,143 | (28,331 | ) | ||||||||
| Increase in prepaid expenses and other assets |
(12,373 | ) | (32,054 | ) | (2,597 | ) | ||||||
| Decrease in accounts payable |
(18,931 | ) | (50,811 | ) | (7,927 | ) | ||||||
| Increase (decrease) in other payables and accrued expenses |
25,919 | (3,394 | ) | 826 | ||||||||
| Other |
(1,579 | ) | (114 | ) | 491 | |||||||
| Net cash provided by operating activities |
113,959 | 36,986 | 8,037 | |||||||||
| Investing activities: |
||||||||||||
| Additions to property and equipment |
(35,388 | ) | (26,330 | ) | (22,155 | ) | ||||||
| Acquisition of licenses and other assets |
(333 | ) | (5,333 | ) | (6,433 | ) | ||||||
| Net cash used in investing activities |
(35,721 | ) | (31,663 | ) | (28,588 | ) | ||||||
| Financing activities: |
||||||||||||
| (Payments on) proceeds from short-term debt |
(56,000 | ) | (4,000 | ) | 21,360 | |||||||
| Payments on long-term debt |
(545 | ) | (1,149 | ) | (1,227 | ) | ||||||
| Repurchase of senior subordinated notes |
(5,000 | ) | — | — | ||||||||
| Payments under capital lease obligations |
(1,927 | ) | (2,009 | ) | — | |||||||
| Repurchase of common stock |
(13,779 | ) | (1,566 | ) | (7,439 | ) | ||||||
| Proceeds from the exercise of stock options |
1,591 | 668 | 2,378 | |||||||||
| Proceeds from employee stock purchase plan |
1,323 | 1,390 | 1,719 | |||||||||
| Financing fees paid |
— | (863 | ) | — | ||||||||
| Net cash (used in) provided by financing activities |
(74,337 | ) | (7,529 | ) | 16,791 | |||||||
| Effects of exchange rate changes on cash and cash equivalents |
(122 | ) | (1,088 | ) | (131 | ) | ||||||
| Net increase (decrease) in cash and cash equivalents |
3,779 | (3,294 | ) | (3,891 | ) | |||||||
| Cash and cash equivalents at beginning of year |
23,102 | 26,396 | 30,287 | |||||||||
| Cash and cash equivalents at end of year |
$ | 26,881 | $ | 23,102 | $ | 26,396 | ||||||
| Supplemental Disclosure of Cash Flow Information: |
||||||||||||
| Interest paid during the year |
$ | 20,499 | $ | 24,584 | $ | 27,082 | ||||||
| Income taxes paid during the year |
$ | 2,417 | $ | 1,747 | $ | 10,182 | ||||||
| Supplemental Disclosure of Non-Cash Flow Information: |
||||||||||||
| Additions to property and equipment (not included above) |
$ | 2,632 | $ | 6,991 | $ | — | ||||||
| Repurchase of common stock (not included above) |
$ | 1,190 | $ | — | $ | — | ||||||
The accompanying Notes are an integral part of the Consolidated Financial Statements.
58
Table of Contents
ELIZABETH ARDEN, INC. AND SUBSIDIARIES
NOTES TO CONSOLIDATED FINANCIAL STATEMENTS
NOTE 1. General Information and Summary of Significant Accounting Policies
Organization and Business Activity. Elizabeth Arden, Inc. (the “Company” or “our”) is a global prestige beauty products company that sells fragrances, skin care and cosmetic products to retailers in the United States and approximately 100 countries internationally.
Basis of Consolidation. The consolidated financial statements include the accounts of the Company’s wholly-owned domestic and international subsidiaries. All significant intercompany accounts and transactions have been eliminated in consolidation.
Use of Estimates. The preparation of the consolidated financial statements in conformity with generally accepted accounting principles requires management to make estimates and assumptions that affect the reported amounts of assets and liabilities and disclosure of contingent assets and liabilities at the date of the financial statements and the reported amounts of revenues and expenses during the reporting period. Actual results could differ from those estimates. Significant estimates include expected useful lives of brand licenses, trademarks, other intangible assets and property, plant and equipment, allowances for sales returns and markdowns, share-based compensation, fair value of long-lived assets, allowances for doubtful accounts receivable, provisions for inventory obsolescence, and income taxes and valuation reserves. Changes in facts and circumstances may result in revised estimates, which are recorded in the period in which they become known.
Revenue Recognition. Sales are recognized when title and the risk of loss transfers to the customer, the sale price is fixed or determinable and collectibility of the resulting receivable is probable. Sales are recorded net of estimated returns, markdowns and other allowances, which are granted to certain of the Company’s customers and subject to the Company’s authorization and approval. The provision for sales returns and markdowns represents management’s estimate of future returns and markdowns based on historical and projected experience and considering current external factors and market conditions. During the years ended June 30, 2010, 2009 and 2008, one customer accounted for an aggregate of 15%, 16% and 15%, respectively, of the Company’s net sales.
Foreign Currency Translation. All assets and liabilities of foreign subsidiaries and affiliates that do not utilize the U.S. dollar as its functional currency are translated at year-end rates of exchange, while sales and expenses are translated at weighted average rates of exchange. Unrealized translation gains or losses are reported as foreign currency translation adjustments through other accumulated comprehensive loss or income included in shareholders’ equity. Such adjustments resulted in net unrealized losses of $0.4 million and $6.5 million for the year ended June 30, 2010 and 2009, respectively, and net unrealized gains of $0.1 million during the year ended June 30, 2008. Gains or losses resulting from foreign currency transactions are recorded in the foreign subsidiaries’ statements of operations. Such net losses totaled $4.0 million, $1.8 million, $2.2 million, in the years ended June 30, 2010, 2009 and 2008, respectively.
Cash and Cash Equivalents. Cash and cash equivalents include cash and interest-bearing deposits at banks with an original maturity date of three months or less.
Allowances for Doubtful Accounts Receivable. The Company maintains allowances for doubtful accounts to cover uncollectible accounts receivable and evaluates its accounts receivable to determine if they will ultimately be collected. This evaluation includes significant judgments and estimates, including an analysis of receivables aging and a customer-by-customer review for large accounts. If, for example, the financial condition of the Company’s customers deteriorates resulting in an impairment of their ability to pay, additional allowances may be required, resulting in a charge to income in the period in which the determination was made.
59
Table of Contents
ELIZABETH ARDEN, INC. AND SUBSIDIARIES
NOTES TO CONSOLIDATED FINANCIAL STATEMENTS—(Continued)
Inventories. Inventories are stated at the lower of cost or market. Cost is determined using the weighted average method. See Note 6.
Property and Equipment, and Depreciation. Property and equipment are stated at cost. Expenditures for major improvements and additions are recorded to the asset accounts, while replacements, maintenance and repairs, which do not improve or extend the lives of the respective assets, are charged to expense. Depreciation is provided over the estimated useful lives of the assets using the straight-line method. When fixed assets are sold or otherwise disposed of, the accounts are relieved of the original cost of the assets and the related accumulated depreciation and any resulting profit or loss is credited or charged to income. See Note 7.
Exclusive Brand Licenses, Trademarks, and Intangibles. Exclusive of intangible assets that have indefinite useful lives and are not being amortized, the Company’s intangible assets are being amortized using the straight-line method over their estimated useful lives. See Note 8.
Indefinite-Lived and Long-Lived Assets. Goodwill and intangible assets with indefinite lives are not amortized, but rather tested for impairment at least annually. An annual impairment test is performed during the Company’s fourth fiscal quarter or more frequently if events or changes in circumstances indicate the carrying value of goodwill and indefinite-lived intangible assets may not fully be recoverable. There is a two step process for impairment testing of goodwill. The first step, used to identify potential impairment, compares the fair value of a reporting unit with its carrying amount, including goodwill. The second step, if necessary, measures the amount of the impairment by comparing the estimated fair value of the goodwill and intangible assets to their respective carrying values. If an impairment is identified, the carrying value of the asset is adjusted to estimated fair value. See Note 8.
Long-lived assets are reviewed on an ongoing basis for impairment based on a comparison of the carrying value of such assets against the undiscounted future cash flows. If an impairment is identified, the carrying value of the asset is adjusted to estimated fair value. No such adjustments were recorded for the years ended June 30, 2010, 2009 and 2008.
Senior Note Offering Costs and Credit Facility Costs. Debt issuance costs and transaction fees, which are associated with the issuance of senior notes and the revolving credit facility, are being amortized (and charged to interest expense) over the term of the related notes or the term of the credit facility. In any period in which the senior notes are redeemed, the unamortized debt issuance costs and transaction fees relating to the notes being redeemed are expensed. In addition, termination costs related to interest rate swaps are amortized to interest expense over the remaining life of the related notes. See Note 10.
Cost of Sales. Included in cost of sales are the cost of products sold, the cost of gift with purchase items provided to customers, royalty costs related to patented technology or formulations, warehousing, distribution and supply chain costs. The major components of warehousing, distribution and supply chain costs include salary and related benefit costs for employees in the warehousing, distribution and supply chain areas and facility related costs in these areas.
Selling, General and Administrative Costs. Included in selling, general and administrative expenses are advertising, creative development and promotion costs not paid directly to the Company’s customers, royalty costs related to trademarks, salary and related benefit costs of the Company’s employees in the finance, human resources, information technology, legal, sales and marketing areas, facility related costs of the Company’s administrative functions, and costs paid to consultants and third party providers for related services.
60
Table of Contents
ELIZABETH ARDEN, INC. AND SUBSIDIARIES
NOTES TO CONSOLIDATED FINANCIAL STATEMENTS—(Continued)
Advertising and Promotional Costs. Advertising and promotional costs paid directly to customers for goods and services provided (primarily co-op advertising and certain direct selling costs) are expensed as incurred and are recorded as a reduction of sales. Advertising and promotional costs not paid directly to the Company’s customers are expensed as incurred and recorded as a component of cost of goods sold (in the case of free goods given to customers) or selling, general and administrative expenses. Advertising and promotional costs totaled approximately $324.1 million, $319.5 million and $297.8 million, during the years ended June 30, 2010, 2009 and 2008, respectively. Advertising and promotional costs includes promotions, direct selling, co-op advertising and media placement.
Income Taxes. The provision for income taxes is the tax payable or refundable for the period plus or minus the change during the period in deferred tax assets and liabilities and certain other adjustments. The Company provides for deferred taxes under the liability method. Under such method, deferred taxes are adjusted for tax rate changes as they occur. Deferred income tax assets and liabilities are computed annually for differences between the financial statement and tax bases of assets and liabilities that will result in taxable or deductible amounts in the future based on enacted tax laws and rates applicable to the periods in which the differences are expected to affect taxable income. A valuation allowance is provided for deferred tax assets if it is more likely than not that these items will either expire before the Company is able to realize their benefit, or, that future deductibility is uncertain.
The Company recognizes in its consolidated financial statements the impact of a tax position if it is more likely than not that such position will be sustained on audit based on its technical merits. While the Company believes that its assessments of whether its tax positions are more likely than not to be sustained are reasonable, each assessment is subjective and requires the use of significant judgments. As a result, one or more of such assessments may prove ultimately to be incorrect, which could result in a change to net income.
Hedge Contracts. The Company has designated each foreign currency contract entered into as of June 30, 2010, as a cash flow hedge. Unrealized gains or losses, net of taxes, associated with these contracts are included in accumulated other comprehensive (loss) income on the balance sheet. Gains and losses will only be recognized in earnings in the period in which the forecasted transaction affects earnings.
Accumulated Other Comprehensive (Loss) Income/Comprehensive Income (Loss). Accumulated other comprehensive (loss) income includes, in addition to net income or net loss, unrealized gains and losses excluded from the consolidated statements of operations and recorded directly into a separate section of shareholders’ equity on the consolidated balance sheet. These unrealized gains and losses are referred to as other comprehensive (loss) income items. The Company’s accumulated other comprehensive loss shown on the Consolidated Balance Sheet at June 30, 2010 and June 30, 2009, consists of foreign currency translation adjustments, which are not adjusted for income taxes since they relate to indefinite investments in non-U.S. subsidiaries, and the unrealized gains (losses), net of taxes, related to the Company’s foreign currency contracts, respectively.
The components of accumulated other comprehensive (loss) income as of June 30, 2010, 2009 and 2008, were as follows:
| Year Ended June 30, | ||||||||||||
| (Amounts in thousands) | 2010 | 2009 | 2008 | |||||||||
| Cumulative foreign currency translation adjustments |
$ | (1,839 | ) | $ | (1,442 | ) | $ | 5,041 | ||||
| Unrealized hedging gain (loss), net of taxes |
357 | (22 | ) | (9,533 | ) | |||||||
| Accumulated other comprehensive loss |
$ | (1,482 | ) | $ | (1,464 | ) | $ | (4,492 | ) | |||
61
Table of Contents
ELIZABETH ARDEN, INC. AND SUBSIDIARIES
NOTES TO CONSOLIDATED FINANCIAL STATEMENTS—(Continued)
The Company’s comprehensive income (loss) consists of net income (loss), foreign currency translation adjustments, which are not adjusted for income taxes since they relate to indefinite investments in non-U.S. subsidiaries, and the unrealized gains (losses), net of taxes, related to the Company’s foreign currency contracts.
The components of comprehensive income (loss) for the years ended June 30, 2010, 2009 and 2008, were as follows:
| Year Ended June 30, | ||||||||||||
| (Amounts in thousands) | 2010 | 2009 | 2008 | |||||||||
| Net income (loss) |
$ | 19,533 | $ | (6,163 | ) | $ | 19,901 | |||||
| Foreign currency translation adjustments |
(397 | ) | (6,483 | ) | 95 | |||||||
| Unrealized hedging gain (loss), net of taxes |
379 | 9,511 | (8,168 | ) | ||||||||
| Total comprehensive income (loss) |
$ | 19,515 | $ | (3,135 | ) | $ | 11,828 | |||||
Fair Value of Financial Instruments. The Company’s financial instruments include accounts receivable, accounts payable, currency forward contracts, short-term debt and long-term debt. See Note 10 for the fair value of the Company’s senior subordinated notes. The fair value of all other financial instruments was not materially different than their carrying value as of June 30, 2010, and June 30, 2009. See Note 15.
Share-Based Compensation. All share-based payments to employees, including the grants of employee stock options, are recognized in the consolidated financial statements based on their fair values, but only to the extent that vesting is considered probable. Compensation cost for awards that vest will not be reversed if the awards expire without being exercised. The fair value of stock options is determined using the Black-Scholes option-pricing model. The fair value of the market-based restricted stock award is determined using a Monte Carlo simulation model, and the fair value of all other restricted stock awards is based on the closing price of the Company’s common stock, $.01 par value (“Common Stock”) on the date of grant. Compensation costs for awards are amortized using the straight-line method. Option pricing model input assumptions such as expected term, expected volatility and risk-free interest rate impact the fair value estimate. Further, the forfeiture rate impacts the amount of aggregate compensation. These assumptions are subjective and generally require significant analysis and judgment to develop. When estimating fair value, some of the assumptions are based on or determined from external data and other assumptions may be derived from the Company’s historical experience with share-based arrangements. The appropriate weight to place on historical experience is a matter of judgment, based on relevant facts and circumstances.
The Company relies on its historical experience and post-vested termination activity to provide data for estimating expected term for use in determining the fair value of its stock options. The Company currently estimates its stock volatility by considering historical stock volatility experience and other key factors. The risk-free interest rate is the implied yield currently available on U.S. Treasury zero-coupon issues with a remaining term equal to the expected term used as the input to the Black-Scholes model. The Company estimates forfeitures using its historical experience, which will be adjusted over the requisite service period based on the extent to which actual forfeitures differ, or are expected to differ, from such estimates. Because of the significant amount of judgment used in these calculations, it is reasonably likely that circumstances may cause the estimate to change. If, for example, actual forfeitures are lower than the Company’s estimate, additional charges to net income may be required.
Reclassifications. To conform to the presentation for the year ended June 30, 2010, certain reclassifications were made to the prior years’ Consolidated Financial Statements and the
62
Table of Contents
ELIZABETH ARDEN, INC. AND SUBSIDIARIES
NOTES TO CONSOLIDATED FINANCIAL STATEMENTS—(Continued)
accompanying footnotes. During the year ended June 30, 2010, the Company recorded out-of-period adjustments which relate to fiscal years 2001 to 2009. Net sales and gross profit for fiscal year 2010 decreased by $2.7 million and $0.9 million, respectively. The Company did not adjust the prior periods as it concluded that such adjustments were not material to the current or prior periods’ consolidated financial statements.
NOTE 2. Net Income (Loss) Per Share
Basic net income (loss) per share is computed by dividing the net income (loss) by the weighted average shares of the Company’s outstanding Common Stock. The calculation of net income (loss) per diluted share is similar to basic income (loss) per share except that the denominator includes potentially dilutive Common Stock, such as stock options and non-vested restricted stock. For the year ended June 30, 2009, diluted loss per share equals basic loss per share, as the assumed exercise of outstanding options, non-vested restricted stock, and the assumed purchases under the employee stock purchase plan would have an anti-dilutive effect. The following table represents the computation of income (loss) per share:
| Year Ended June 30, | ||||||||||
| (Amounts in thousands, except per share data) | 2010 | 2009 | 2008 | |||||||
| Basic |
||||||||||
| Net income (loss) |
$ | 19,533 | $ | (6,163 | ) | $ | 19,901 | |||
| Weighted average shares outstanding |
28,017 | 27,971 | 27,981 | |||||||
| Net income (loss) per basic share |
$ | 0.70 | $ | (0.22 | ) | $ | 0.71 | |||
| Diluted |
||||||||||
| Net income (loss) |
$ | 19,533 | $ | (6,163 | ) | $ | 19,901 | |||
| Weighted average basic shares outstanding |
28,017 | 27,971 | 27,981 | |||||||
| Potential common shares — treasury method |
772 | — | 1,322 | |||||||
| Weighted average shares and potential diluted shares |
28,789 | 27,971 | 29,303 | |||||||
| Net income (loss) per diluted share |
$ | 0.68 | $ | (0.22 | ) | $ | 0.68 | |||
The following table shows the number of shares of Common Stock subject to options and restricted stock awards that were outstanding for the years ended June 30, 2010, 2009 and 2008, which were not included in the net income per diluted share calculation because to do so would have been anti-dilutive:
| Year Ended June 30, | |||||||
| 2010 | 2009 | 2008 | |||||
| Number of shares |
1,821,594 | 3,310,627 | (a) | 1,117,193 | |||
| (a) | Includes 486,265 options to purchase shares that were excluded as the Company was in a loss position and including them would have been anti-dilutive. |
NOTE 3. Restructuring Charges
In fiscal 2007, the Company commenced a comprehensive review of its global business processes to re-engineer its extended supply chain, distribution, logistics and transaction processing systems. In May 2008, the Company announced a decision to accelerate the re-engineering of its extended supply chain, distribution and logistics functions, as well as the realignment of other parts
63
Table of Contents
ELIZABETH ARDEN, INC. AND SUBSIDIARIES
NOTES TO CONSOLIDATED FINANCIAL STATEMENTS—(Continued)
of its organization to better support its new business processes. This initiative also included a migration to a shared services model to simplify transaction processing by consolidating the Company’s primary global transaction processing functions and the implementation of a new financial accounting and order processing system. The Company refers to this initiative as the Global Efficiency Re-engineering initiative, or sometimes simply as the Initiative.
As a result of the acceleration of the Initiative, the implementation of the Oracle financial accounting and order processing system and the migration to a shared services transaction processing model, the Company implemented a restructuring plan that resulted in restructuring and one-time expenses, including severance, relocation, recruiting and temporary staffing expenditures. From inception through June 30, 2010 the Company has incurred restructuring and one-time expenses relating to the Initiative totaling $13.4 million before taxes, which includes $7.3 million related to the Oracle system implementation and $6.1 million for Initiative–related restructuring. The Company currently estimates that Initiative-related expenses will total approximately $14.0 million, before taxes, consistent with its original projection of $12 million to $14 million. The following table summarizes the restructuring costs by year incurred related to the Initiative:
| Year Ended June 30, | |||||||||
| (Amounts in thousands) | 2010 | 2009 | 2008 | ||||||
| Restructuring expenses under the Initiative |
$ | 1,878 | $ | 3,544 | $ | 673 | |||
Unrelated to the Initiative, for the years ended June 30, 2010, 2009 and 2008, the Company incurred approximately $1.5 million, $1.1 million and $2.3 million, respectively, of other restructuring expenses.
Aggregate amounts paid during the year ended June 30, 2010 for restructuring were $3.8 million. All of the restructuring expenses discussed above are included in selling, general and administrative expenses in the Company’s consolidated statement of operations and, as described in Note 19, have not been attributed to any of the Company’s reportable segments and are included in unallocated corporate expenses. At June 30, 2010 and 2009, the Company had a restructuring liability of $0.6 million and $1.0 million, respectively.
NOTE 4. New Accounting Standards
Subsequent Events
In February 2010, new accounting guidance was issued related to subsequent events. This guidance amended guidance previously issued in May 2009 regarding subsequent events and states that an entity that is a Securities and Exchange Commission filer is no longer required to disclose the date through which subsequent events have been evaluated. The adoption of this guidance did not have an impact on the Company’s consolidated financial statements.
Fair Value Measurements and Disclosures
In January 2010, the FASB issued an update to Codification Topic 820, Fair Value Measurements and Disclosures, amending the disclosure requirements under Topic 820. The update requires additional disclosures for transfers in and out of Levels 1 and 2 fair value measurements, as well as enhanced disclosures for activity in Level 3 fair value measurements. In addition, the update also clarifies existing requirements regarding the level of disaggregation for assets and liabilities and disclosure of inputs and valuation techniques used to measure fair value. The additional disclosure requirements under Codification Topic 820 were effective for the Company beginning January 1, 2010 and did not have an impact on the Company’s consolidated financial statements.
64
Table of Contents
ELIZABETH ARDEN, INC. AND SUBSIDIARIES
NOTES TO CONSOLIDATED FINANCIAL STATEMENTS—(Continued)
Effective July 1, 2009, the Company adopted the requirements of Codification Topic 820 for non-financial assets and liabilities. Adoption did not have an impact on the Company’s consolidated financial statements.
In August 2009, the FASB issued an update to Codification Topic 820 that provides additional guidance on the fair value measurement of liabilities. Specifically, this update provides clarification in circumstances in which a quoted price in an active market is not available. The update to Codification Topic 820 was effective for the Company beginning July 1, 2009 and did not have an impact on the Company’s consolidated financial statements.
Determining Whether Instruments Granted in Share-Based Payment Transactions Are Participating Securities
In June 2008, the FASB issued an update to Codification Topic 260, Earnings Per Share, that addresses whether instruments granted in share-based payment transactions are participating securities prior to vesting and, therefore, need to be included in the earnings allocation in computing earnings per share under the two-class method. The update to Codification Topic 260 requires unvested share-based payment awards that contain non-forfeitable rights to dividends or dividend equivalents (whether paid or unpaid) to be treated as participating securities and to be included in the computation of earnings per share pursuant to the two-class method. The revisions to Codification Topic 260 were effective for the Company beginning July 1, 2009 and did not have an impact on the Company’s consolidated financial statements.
Business Combinations
In December 2007, the FASB issued an update to Codification Topic 805, Business Combinations, which significantly changed the accounting for business combinations in a number of areas, including the treatment of contingent consideration, pre-acquisition contingencies, transaction costs, restructuring costs and income taxes. The revisions to Codification Topic 805 were effective for acquisitions that occur after July 1, 2009 and did not have an impact on the Company’s consolidated financial statements.
Useful Life of Intangible Assets
In April 2008, the FASB issued an update to Codification Topic 350, Intangibles — Goodwill and Other, which amends the factors that should be considered in developing renewal or extension assumptions used to determine the useful life of a recognized intangible asset. This amendment is effective on a prospective basis to all intangible assets acquired and for disclosures on all intangible assets recognized on or after the beginning of the first annual period subsequent to December 15, 2008. The amendment to Codification Topic 350 was effective for the Company beginning July 1, 2009 and did not have a material impact on the Company’s consolidated financial statements.
65
Table of Contents
ELIZABETH ARDEN, INC. AND SUBSIDIARIES
NOTES TO CONSOLIDATED FINANCIAL STATEMENTS—(Continued)
NOTE 5. Accounts Receivable, Net
The following table details the provisions and allowances established for potential losses from uncollectible accounts receivable and estimated sales returns in the ordinary course of business:
| Year Ended June 30, | ||||||||||||
| (Amounts in thousands) | 2010 | 2009 | 2008 | |||||||||
| Allowance for Bad Debt: |
||||||||||||
| Beginning balance |
$ | 5,340 | $ | 4,502 | $ | 4,023 | ||||||
| Provision |
3,258 | 2,936 | 1,402 | |||||||||
| Write-offs, net of recoveries |
(2,471 | ) | (2,098 | ) | (923 | ) | ||||||
| Ending balance |
$ | 6,127 | $ | 5,340 | $ | 4,502 | ||||||
| Allowance for Sales Returns: |
||||||||||||
| Beginning balance |
$ | 12,246 | $ | 11,574 | $ | 12,126 | ||||||
|
Provision(1) |
65,582 | 59,774 | 51,191 | |||||||||
| Actual returns |
(58,260 | ) | (59,102 | ) | (51,743 | ) | ||||||
| Ending balance |
$ | 19,568 | $ | 12,246 | $ | 11,574 | ||||||
| (1) | Increase in fiscal 2010 compared to fiscal 2009, primarily due to certain product discontinuations in North America Fragrance prestige department store and specialty beauty store customers which have return rights. Increases in fiscal 2009 compared to fiscal 2008, primarily related to increase in net sales to North America Fragrance prestige department store and specialty beauty store customers, that have return rights as a result of the Liz Claiborne license agreement. |
NOTE 6. Inventories
The components of inventory were as follows:
| June 30, | ||||||
| (Amounts in thousands) | 2010 | 2009 | ||||
| Raw and packaging materials |
$ | 58,144 | $ | 64,147 | ||
| Work in progress |
30,004 | 30,777 | ||||
| Finished goods |
182,910 | 223,611 | ||||
| Totals |
$ | 271,058 | $ | 318,535 | ||
66
Table of Contents
ELIZABETH ARDEN, INC. AND SUBSIDIARIES
NOTES TO CONSOLIDATED FINANCIAL STATEMENTS—(Continued)
NOTE 7. Property and Equipment
Property and equipment is comprised of the following:
| June 30, | Estimated Life | |||||||||
| (Amounts in thousands) | 2010 | 2009 | ||||||||
| Land |
$ | 64 | $ | 64 | — | |||||
| Building and building improvements |
953 | 924 | 40 | |||||||
| Leasehold improvements |
11,835 | 10,220 | 2 — 15 | |||||||
| Machinery, equipment, furniture and fixtures and vehicles |
13,922 | 12,067 | 5 — 14 | |||||||
| Computer equipment and software |
53,770 | 23,061 | 3 — 10 | |||||||
| Counters and trade fixtures |
62,720 | 55,015 | 3 — 5 | |||||||
| Tools and molds |
20,315 | 17,786 | 1 — 3 | |||||||
| 163,579 | 119,137 | |||||||||
| Less accumulated depreciation |
(94,979 | ) | (78,107 | ) | ||||||
| 68,600 | 41,030 | |||||||||
| Projects in progress(1) |
7,983 | 23,080 | ||||||||
| Property and equipment, net |
$ | 76,583 | $ | 64,110 | ||||||
| (1) | Balance at June 30, 2009 includes $17.8 million related to the implementation of the Oracle accounting and order processing systems. |
Total depreciation expense, including depreciation recorded in cost of goods sold, for the years ended June 30, 2010, 2009 and 2008, was $18.9 million, $16.4 million, and $15.3 million, respectively. At June 30, 2010, the Company had approximately $32,000 of property and equipment under capital leases.
NOTE 8. Exclusive Brand Licenses, Trademarks and Intangibles, Net
The following summarizes the cost basis amortization and weighted average estimated life associated with the Company’s intangible assets:
| (Amounts in thousands) | June 30, 2010 |
Weighted Average Estimated Life |
June 30, 2009 |
Weighted Average Estimated Life | ||||||||
| Elizabeth Arden brand trademarks |
$ | 122,415 | Indefinite | $ | 122,415 | Indefinite | ||||||
| Exclusive brand licenses and related trademarks |
84,793 | 18 | 82,417 | 18 | ||||||||
| Exclusive brand trademarks |
43,535 | 11 | 43,202 | 11 | ||||||||
| Other intangibles(1) |
20,330 | 17 | 20,330 | 17 | ||||||||
| Exclusive brand licenses, trademarks and intangibles, gross |
271,073 | 268,364 | ||||||||||
| Accumulated amortization: |
||||||||||||
| Exclusive brand licenses and related trademarks |
(45,595 | ) | (39,913 | ) | ||||||||
| Exclusive brand trademarks |
(38,768 | ) | (36,588 | ) | ||||||||
| Other intangibles |
(7,266 | ) | (5,542 | ) | ||||||||
| Exclusive brand licenses, trademarks and intangibles, net |
$ | 179,444 | $ | 186,321 | ||||||||
| (1) | Primarily consists of customer relationships, customer lists and non-compete agreements. |
67
Table of Contents
ELIZABETH ARDEN, INC. AND SUBSIDIARIES
NOTES TO CONSOLIDATED FINANCIAL STATEMENTS—(Continued)
At June 30, 2010, the Company had goodwill of $21.1 million recorded on its consolidated balance sheet. The entire amount of the goodwill in all periods presented relates to the North America Fragrance segment. The amount of goodwill recorded on the consolidated balance sheet at June 30, 2010 did not change from the prior year end balance as the Company did not record any additions or impairments during fiscal 2010.
The Company has determined that the Elizabeth Arden trademarks have indefinite useful lives, as cash flows from the use of the trademarks are expected to be generated indefinitely. Goodwill and intangible assets such as the Company’s Elizabeth Arden trademarks, with indefinite lives are not amortized, but rather tested for impairment at least annually. An annual impairment test is performed during the fourth quarter of the Company’s fiscal year or more frequently if events or changes in circumstances indicate the carrying value of goodwill and indefinite-lived intangibles may not fully be recoverable. There is a two step process for impairment testing of goodwill. The first step of this test, used to identify potential impairment, compares the fair value of a reporting unit with its carrying amount, including goodwill. The second step, if necessary, measures the amount of the impairment by comparing the estimated fair value of the goodwill and intangible assets to their respective carrying values. If an impairment is identified, the carrying value of the asset is adjusted to estimated fair value.
During the quarter ended June 30, 2010, the Company completed its annual impairment testing of the Elizabeth Arden trademarks, with the assistance of a third party valuation firm. During the quarter ended June 30, 2010, the Company also completed its annual impairment testing of goodwill. In assessing the fair value of these assets, the Company considered the income approach for the Elizabeth Arden trademarks and market approach. Under the income approach, the fair value is based on the present value of estimated future cash flows. Under the market approach, the fair value is based on quoted market prices and the number of shares outstanding of Common Stock. The analysis and assessments of these assets and goodwill indicated that no impairment adjustment was required as the estimated fair value exceeded the recorded carrying value. Similarly, no such adjustments for impairment of intangible assets and goodwill were recorded for the fiscal years ended June 30, 2009 and 2008.
Due to the ongoing uncertainty in capital market conditions, the Company will continue to monitor and evaluate the expected future cash flows of its reporting units and the long term trends of its market capitalization for the purposes of assessing the carrying value of its goodwill and indefinite-lived Elizabeth Arden trademarks, other trademarks and intangible assets.
Amortization expense for the years ended June 30, 2010, 2009 and 2008, was $9.6 million, $9.8 million, and $9.5 million, respectively. Amortization expense, based on current facts and circumstances, for fiscal years ending June 30, 2011, 2012, 2013, 2014, and 2015 is expected to be $8.5 million, $6.4 million, $5.5 million, $4.5 million, and $4.2 million, respectively.
NOTE 9. Short-Term Debt
The Company has a $325 million revolving bank credit facility (the “Credit Facility”) with a syndicate of banks, for which JPMorgan Chase Bank is the administrative agent, which generally provides for borrowings on a revolving basis, with a $25 million sub-limit for letters of credit. Under the terms of the Credit Facility, the Company may, at any time, increase the size of the Credit Facility up to $375 million without entering into a formal amendment requiring the consent of all of the banks, subject to the Company’s satisfaction of certain conditions. The Credit Facility expires in December 2012.
68
Table of Contents
ELIZABETH ARDEN, INC. AND SUBSIDIARIES
NOTES TO CONSOLIDATED FINANCIAL STATEMENTS—(Continued)
The Credit Facility is guaranteed by all of the Company’s U.S. subsidiaries and is collateralized by a first priority lien on all of the Company’s U.S., Canada and Puerto Rico accounts receivable and U.S. inventory. Borrowings under the Credit Facility are limited to 85% of eligible accounts receivable and 85% of the appraised net liquidation value of the Company’s inventory, as determined pursuant to the terms of the Credit Facility; provided, however, that from August 15 to October 31 of each year the borrowing base may be temporarily increased by up to $25 million. The Company’s obligations under the Credit Facility rank senior to the Company’s 7 3/4% Senior Subordinated Notes due 2014 (the “7 3/4% Senior Subordinated Notes”).
The Credit Facility has only one financial maintenance covenant, which is a debt service coverage ratio that must be maintained at not less than 1.1 to 1 if average borrowing base capacity declines to less than $25 million ($35 million from December 1 through May 31). The Company’s average borrowing base capacity for each of the quarters during fiscal 2010 did not fall below the applicable thresholds noted above. Accordingly, the debt service coverage ratio did not apply for the quarter ended June 30, 2010.
Under the terms of the Credit Facility, the Company may pay dividends or repurchase Common Stock if the Company maintains borrowing base capacity of at least $25 million from June 1 to November 30, and at least $35 million from December 1 to May 31, after making the applicable payment. The Credit Facility restricts the Company from incurring additional non-trade indebtedness (other than refinancings and certain small amounts of indebtedness).
Borrowings under the credit portion of the Credit Facility bear interest at a floating rate based on the “Applicable Margin,” which is determined by reference to a specific financial ratio. At the Company’s option, the Applicable Margin may be applied to either the London Interbank Offered Rate (“LIBOR”) or the prime rate. The reference ratio for determining the Applicable Margin is a debt service coverage ratio. The Applicable Margin charged on LIBOR loans ranges from 1.00% to 1.75% and is 0% for prime rate loans, except that the Applicable Margin on the first $25.0 million of borrowings from August 15 to October 15 of each year, while the temporary increase in the Company’s borrowing base is in effect, is 1.00% higher. At June 30, 2010, the Applicable Margin was 1.50% for LIBOR loans and 0% for prime rate loans. The commitment fee on the unused portion of the Credit Facility is 0.25%. For the fiscal years ended June 30, 2010 and 2009, the weighted average annual interest rate on borrowings under the Credit Facility was 2.7% and 3.3%, respectively.
At June 30, 2010, the Company had $59.0 million in outstanding borrowings and approximately $4.4 million in letters of credit outstanding under the Credit Facility, compared with $115.0 million in outstanding borrowings under the Credit Facility at June 30, 2009. As of June 30, 2010, the Company had approximately $158.6 million of eligible accounts receivable and inventories available as collateral under the Credit Facility and remaining borrowing availability of $99.5 million. The Company classifies the Credit Facility as short-term debt on its balance sheet because it expects to reduce outstanding borrowings over the next twelve months.
69
Table of Contents
ELIZABETH ARDEN, INC. AND SUBSIDIARIES
NOTES TO CONSOLIDATED FINANCIAL STATEMENTS—(Continued)
NOTE 10. Long-Term Debt
The Company’s long-term debt consisted of the following:
| June 30, | ||||||||
| (Amounts in thousands) | 2010 | 2009 | ||||||
|
7 3/4 % Senior Subordinated Notes due January 2014 |
$ | 220,000 | $ | 225,000 | ||||
| Termination costs on interest rate swap, net |
(1,301 | ) | (1,634 | ) | ||||
| Riviera Term Note |
— | 545 | ||||||
| Total debt |
218,699 | 223,911 | ||||||
| Less: Current portion of long-term debt |
— | 545 | ||||||
| Total long-term debt |
$ | 218,699 | $ | 223,366 | ||||
Senior Subordinated Notes. In January 2004, the Company issued $225.0 million aggregate principal amount of 7 3/ 4% Senior Subordinated Notes due January 2014. In February 2004, the Company entered into an interest rate swap agreement to swap $50.0 million of the outstanding 7 3/4% Senior Subordinated Notes to a floating interest rate based on LIBOR. The swap agreement was scheduled to mature in February 2014 and was terminated March 16, 2006. As a result of this action, the Company incurred termination costs of $2.5 million. The swap termination costs were recorded as a reduction to long-term debt and will be amortized to interest expense over the remaining life of the 7 3/4% Senior Subordinated Notes. The Company had designated the swap agreement as a fair value hedge.
In May 2010, the Company repurchased $5.0 million of its 7 3/4% Senior Subordinated Notes at par value. In connection with this repurchase, the Company incurred approximately $82,000 in debt extinguishment costs.
The indenture pursuant to which the 7 3/4% Senior Subordinated Notes were issued (the “Indenture”) provides that such notes will be senior subordinated obligations of the Company. The 7 3/4% Senior Subordinated Notes rank junior to all existing and future senior indebtedness of the Company, including indebtedness under the Credit Facility and pari passu in right of payment to all senior subordinated indebtedness of the Company. The Indenture generally permits the Company (subject to the satisfaction of a fixed charge coverage ratio and, in certain cases, also a net income test) to incur additional indebtedness, pay dividends, purchase or redeem capital stock of the Company, or redeem subordinated indebtedness. The Indenture generally limits the ability of the Company to create liens, merge or transfer or sell assets. The Indenture also provides that the holders of the 7 3 /4% Senior Subordinated Notes have the option to require the Company to repurchase their notes in the event of a change of control in the Company (as defined in the Indenture).
In connection with the 2006 acquisition of certain assets of Riviera Concepts Inc. (“Riviera”), the Company assumed a promissory note held by Riviera in the principal amount of approximately $3.4 million. The final installment of $545,000 was paid on July 15, 2009.
At June 30, 2010 and June 30, 2009, the estimated fair value of the Company’s 7 3/4% Senior Subordinated Notes and, at June 30, 2009, the estimated value of the Riviera Term Note, using available market information and interest rates was as follows:
| June 30, | ||||||
| (Amounts in thousands) | 2010 | 2009 | ||||
|
7 3/4 % Senior Subordinated Notes |
$ | 216,150 | $ | 193,500 | ||
| Riviera Term Note |
$ | — | $ | 545 | ||
70
Table of Contents
ELIZABETH ARDEN, INC. AND SUBSIDIARIES
NOTES TO CONSOLIDATED FINANCIAL STATEMENTS—(Continued)
The scheduled maturities and redemptions of long-term debt at June 30, 2010 were as follows:
| (Amounts in thousands) | |||
| Year Ended June 30, |
Amount | ||
| 2011 through 2013 |
$ | — | |
| 2014 |
220,000 | ||
| After 2014 |
— | ||
|
Total(1) |
$ | 220,000 | |
| (1) | Total scheduled maturities do not include approximately $1.3 million of swap termination costs that were recorded as a reduction to long-term debt and are being amortized to interest expense over the remaining life of the 7 3/4% Senior Subordinated Notes. |
NOTE 11. Commitments and Contingencies
The Company has lease agreements for all of the real property it uses, and owns a small manufacturing facility in South Africa. The Company’s leased office facilities are located in Miramar, Florida; Stamford, Connecticut; Bentonville, Arkansas; Minneapolis, Minnesota and New York, New York in the United States, and in Australia, Canada, China, Denmark, France, Italy, New Zealand, Puerto Rico, Singapore, South Africa, South Korea, Spain, Switzerland, Taiwan and the United Kingdom. The Company also has leased distribution facilities in Roanoke, Virginia and Puerto Rico. The Company’s rent expense for operating leases for the years ended June 30, 2010, 2009 and 2008, was $20.2 million, $20.7 million and $20.7 million, respectively. The Company also leases distribution equipment, office and computer equipment, and vehicles. The Company reviews all of its leases to determine whether they qualify as operating or capital leases. As of June 30, 2010, the Company has both operating and capital leases. Leasehold improvements are capitalized and amortized over the lesser of the useful life of the asset or current lease term. The Company accounts for free rent periods and scheduled rent increases on a straight-line basis over the lease term. Landlord allowances and incentives are recorded as deferred rent and are amortized as a reduction to rent expense over the lease term.
The Company’s aggregate minimum lease payments under its operating and capital leases, and commitments under other long-term contractual obligations (other than long-term debt) at June 30, 2010, were as follows:
| (Amounts in thousands) | Operating Leases |
Capital Leases |
Other
Long-term Obligations(1) |
Total | ||||||||
| 2011 |
$ | 18,153 | $ | 32 | $ | — | $ | 18,185 | ||||
| 2012 |
13,625 | — | 2,711 | 16,336 | ||||||||
| 2013 |
9,976 | — | 2,711 | 12,687 | ||||||||
| 2014 |
7,990 | — | — | 7,990 | ||||||||
| 2015 |
7,019 | — | — | 7,019 | ||||||||
| and thereafter |
19,191 | — | — | 19,191 | ||||||||
| Total |
$ | 75,954 | $ | 32 | $ | 5,422 | $ | 81,408 | ||||
| (1) | Excludes approximately $4.5 million of gross unrecognized tax benefits that, if not realized, would result in cash payments. The Company cannot currently estimate when, or if, the payments will be due. See Note 12. |
71
Table of Contents
ELIZABETH ARDEN, INC. AND SUBSIDIARIES
NOTES TO CONSOLIDATED FINANCIAL STATEMENTS—(Continued)
In connection with the August 2006 acquisition of certain assets comprising the fragrance business of Sovereign Sales, LLC, $12 million of the purchase price was in the form of contingent consideration, the majority of which was to be paid in two installments over two years from the date of closing if certain financial targets and other conditions were satisfied. The conditions for all installments were satisfied, and the Company recognized a liability of $6.3 million, $5.3 million and $0.3 million in the consolidated balance sheets at June 30, 2007, June 30, 2008 and June 30, 2009, respectively. The first installment was paid in September 2007, and the second installment was paid in July 2008. The final installment of contingent consideration of $0.3 million was paid in September 2009.
The Company is a party to a number of legal actions, proceedings and claims. While any action, proceeding or claim contains an element of uncertainty and it is possible that the Company’s cash flows and results of operations in a particular quarter or year could be materially affected by the impact of such actions, proceedings and claims, management of the Company believes that the outcome of such actions, proceedings or claims will not have a material adverse effect on the Company’s business, prospects, results of operations, financial condition or cash flows.
NOTE 12. Income Taxes
Income (loss) before income taxes consisted of the following for the fiscal years ended June 30, 2010, 2009 and 2008:
| Year Ended June 30, | |||||||||||
| (Amounts in thousands) | 2010 | 2009 | 2008 | ||||||||
| Domestic |
$ | 222 | $ | (26,621 | ) | $ | (12,927 | ) | |||
| Foreign |
22,604 | 12,142 | 34,362 | ||||||||
| Total income (loss) before income taxes |
$ | 22,826 | $ | (14,479 | ) | $ | 21,435 | ||||
The components of the provision for (benefit from) income taxes for the fiscal years ended June 30, 2010, 2009 and 2008, are as follows:
| Year Ended June 30, | ||||||||||||
| (Amounts in thousands) | 2010 | 2009 | 2008 | |||||||||
| Current income taxes |
||||||||||||
| Federal |
$ | 302 | $ | (783 | ) | $ | 133 | |||||
| State |
371 | 205 | 160 | |||||||||
| Foreign |
4,616 | 3,777 | 6,274 | |||||||||
| Total current |
$ | 5,289 | $ | 3,199 | $ | 6,567 | ||||||
| Deferred income taxes |
||||||||||||
| Federal |
$ | (797 | ) | $ | (9,121 | ) | $ | (4,065 | ) | |||
| State |
572 | (1,498 | ) | (1,494 | ) | |||||||
| Foreign |
(1,771 | ) | (896 | ) | 526 | |||||||
| Total deferred |
(1,996 | ) | (11,515 | ) | (5,033 | ) | ||||||
| Total |
$ | 3,293 | $ | (8,316 | ) | $ | 1,534 | |||||
72
Table of Contents
ELIZABETH ARDEN, INC. AND SUBSIDIARIES
NOTES TO CONSOLIDATED FINANCIAL STATEMENTS—(Continued)
The total income tax provision (benefit) differs from the amount obtained by applying the statutory federal income tax rate to income before income taxes as follows:
| Year Ended June 30, | |||||||||||||||||||||
| 2010 | 2009 | 2008 | |||||||||||||||||||
| (Amounts in thousands, except percentages) | Amount | Rate | Amount | Rate | Amount | Rate | |||||||||||||||
| Income tax provision (benefit) at statutory rates |
$ | 7,989 | 35.0 | % | $ | (5,068 | ) | 35.0 | % | $ | 7,503 | 35.0 | % | ||||||||
| State taxes, net of federal benefits |
404 | 1.8 | (1,124 | ) | 7.8 | (883 | ) | (4.1 | ) | ||||||||||||
| Tax on foreign earnings at different rates from statutory rates |
(4,540 | ) | (19.9 | ) | (1,913 | ) | 13.2 | (5,367 | ) | (25.0 | ) | ||||||||||
| Research and development and foreign tax credits |
(616 | ) | (2.7 | ) | (698 | ) | 4.8 | (208 | ) | (1.0 | ) | ||||||||||
| Change in U.S. and foreign valuation allowance |
(525 | ) | (2.3 | ) | 544 | (3.8 | ) | 139 | 0.7 | ||||||||||||
| Other |
581 | 2.5 | (57 | ) | 0.4 | 350 | 1.6 | ||||||||||||||
| Total |
$ | 3,293 | 14.4 | % | $ | (8,316 | ) | 57.4 | % | $ | 1,534 | 7.2 | % | ||||||||
Deferred income taxes reflect the net tax effects of temporary differences between the carrying amounts of assets and liabilities for financial reporting purposes and the amounts used for tax purposes plus operating loss carryforwards. The tax effects of significant items comprising the Company’s net deferred tax assets and liabilities are as follows:
| As of June 30, | ||||||||
| (Amounts in thousands) | 2010 | 2009 | ||||||
| Deferred tax assets |
||||||||
| Accrued expenses |
$ | 14,363 | $ | 8,570 | ||||
| Stock-based compensation |
7,857 | 7,095 | ||||||
| Net operating loss carryforwards |
20,297 | 24,541 | ||||||
| Inventory |
7,742 | 5,509 | ||||||
| Research and development tax incentives, foreign tax credits, alternative minimum tax and other tax credits |
8,437 | 7,407 | ||||||
| Other |
3,718 | 2,055 | ||||||
| Gross deferred tax assets |
$ | 62,414 | $ | 55,177 | ||||
| Accounts receivable |
$ | (673 | ) | $ | (2,161 | ) | ||
| Intangible assets |
(30,976 | ) | (27,654 | ) | ||||
| Other |
(4,482 | ) | (3,948 | ) | ||||
| Gross deferred tax liabilities |
(36,131 | ) | (33,763 | ) | ||||
| Valuation allowances |
(766 | ) | (1,201 | ) | ||||
| Total net deferred tax assets |
$ | 25,517 | $ | 20,213 | ||||
73
Table of Contents
ELIZABETH ARDEN, INC. AND SUBSIDIARIES
NOTES TO CONSOLIDATED FINANCIAL STATEMENTS—(Continued)
The following table represents the classification of the Company’s net deferred tax assets and liabilities:
| As of June 30, | |||||||
| (Amounts in thousands) | 2010 | 2009 | |||||
| Current net deferred tax assets |
$ | 30,296 | $ | 11,804 | |||
| Non-current net deferred tax (liabilities) assets |
(4,779 | ) | 8,409 | ||||
| Total net deferred tax assets |
$ | 25,517 | $ | 20,213 | |||
At June 30, 2010, the Company’s consolidated balance sheet includes gross deferred tax assets of $20.3 million from net operating losses, comprised of $15.3 million and $4.2 million of U.S. federal and state net operating losses, respectively, and $0.8 million of foreign net operating losses. The need for a valuation allowance against domestic deferred tax assets was considered. The Company is in a domestic cumulative taxable loss position of $22 million for the three-year period ended June 30, 2010, which is considered significant evidence indicating that the Company may not be able to realize some portion or all of these deferred taxes in the future. However, the Company believes, based on the weight of all available evidence, that it is more likely than not that it will generate sufficient domestic taxable income to realize the domestic net operating loss carryforwards before they expire. This conclusion considers available evidence, both positive and negative, including the Company’s past operating results and forecast of future taxable income. In determining future taxable income, assumptions utilized include the anticipated amount of pre-tax domestic operating income and enacted tax rates. The Company concluded that the positive evidence supporting the realizability of the domestic deferred tax assets was sufficient, without having to assume the use of potentially available feasible and prudent tax planning strategies. The assumptions utilized in forecasting pre-tax income are based on historical data and expected business cycles. The domestic losses were generated in fiscal years 2008 and 2009 and were mainly attributable to expenses associated with the Liz Claiborne license agreement and charges related to the Global Efficiency Re-engineering Initiative and are not considered to be reflective of the core historical earnings of the business. In fiscal 2009, the retail and consumer markets were severely impacted by one of the worst holiday seasons in recent history. The markets have begun to recover, and the Company believes this positive recovery trend will continue and that it will generate pre-tax profits as markets improve. The Company has a strong domestic earnings history, including domestic pre-tax book income in fiscal years 2005, 2006 and 2007 of $28.8 million, $18.5 million, and $7.6 million, respectively. These earnings were based on a consistent business model of selling fragrances and cosmetics with strong brand recognition. The Company also anticipates that improved pre-tax operating income will result from improved gross margins due to the Global Efficiency Re-engineering Initiative and the Liz Claiborne license agreement.
At June 30, 2010, the Company had United States federal operating loss carryforwards of $46.9 million that will begin to expire on June 30, 2024. The Company had state and local net operating loss carryforwards of $80.1 million that will expire as follows: approximately $0.8 million at June 30, 2011, $0.7 million at June 30, 2013, $9.1 million during the period from 2014 to 2017, and $69.5 million in 2018 and thereafter. An equivalent amount of federal and state taxable income would need to be generated in order to fully realize the United States federal and state net deferred tax assets before their expiration. In contrast to the U.S. Internal Revenue Code, many U.S. states do not allow the carryback of a net operating loss in any significant amount or have suspended the utilization of net operating losses for a specific period of time. As a result, in these states the Company’s net operating loss carryforwards are significantly higher than the federal net operating loss carryforward. To the extent that the Company does not generate sufficient state taxable income within the statutory carryforward periods to utilize the loss carryforwards in these states, the loss carryforwards will expire unused. The state and local net operating loss carryforwards have an
74
Table of Contents
ELIZABETH ARDEN, INC. AND SUBSIDIARIES
NOTES TO CONSOLIDATED FINANCIAL STATEMENTS—(Continued)
effective tax rate of approximately 4.7%. The Company believes that, based on its projections of future taxable income in its domestic jurisdictions, it will realize these net operating losses before they expire.
At June 30, 2010, the Company had foreign net operating loss carryforwards of approximately $4.4 million that begin to expire in fiscal year 2011. The Company’s ability to use foreign net operating loss carryforwards is dependent on generating sufficient future taxable income prior to their expiration. As a result, an equivalent amount of foreign taxable income would need to be generated in order to fully realize the foreign net deferred tax assets. However, due to the Company’s limited operating history in certain foreign jurisdictions and the uncertainty of achieving sufficient profits to utilize foreign net operating loss carryforwards in these jurisdictions, and the near-term expiration of certain foreign net operating loss carryforwards, as of June 30, 2010 the Company has recorded a valuation allowance of approximately $0.6 million related to these foreign net operating loss carryforwards and $0.2 million on other net deferred tax assets.
In evaluating the need for a valuation allowance, the Company estimates future taxable income based on management approved forecasts. This process requires significant judgment by management about matters that are by nature uncertain. If future events differ significantly from the Company’s current forecasts, a valuation allowance may need to be established, which could have a material adverse effect on its results of operations and financial condition. The Company will continue to monitor and update its assumptions and forecasts of future taxable income and assess the need for a valuation allowance.
Deferred tax assets relating to tax benefits of employee stock option awards have been reduced to reflect stock option exercises during the year ended June 30, 2010. Some exercises resulted in tax deductions in excess of previously recorded benefit based on the option value at the time of grant (“windfalls”). Although the additional tax benefit for the windfalls is reflected in net operating loss carryforwards, the additional tax benefit associated with the windfalls is not recognized for financial statement purposes until the deduction reduces taxes payable. Accordingly, windfall gross tax benefits of $1.6 million are not reflected in deferred tax assets. The deferred tax assets will be recognized with an offset to additional paid-in capital as the windfall reduces current taxes payable. At June 30, 2010, the Company had a deferred tax asset of $3.1 million related to the Company’s market-based restricted stock (“MBRS”) compensation expense (see Note 14 to the Notes to Consolidated Financial Statements). At June 30, 2010 the MBRS award had not vested and the grant expires in March 2011. If the MBRS award does not vest, the related deferred tax asset that has been recognized will be required to be written off in March 2011 to the extent there are sufficient realized windfall credits recognized in paid-in capital.
At June 30, 2010, the total amount of gross unrecognized tax benefits was $5.8 million. These unrecognized tax benefits could favorably affect the effective tax rate in a future period, if and to the extent recognized. The Company does not expect changes in the amount of unrecognized tax benefits to have a significant impact on its results of operations over the next 12 months.
75
Table of Contents
ELIZABETH ARDEN, INC. AND SUBSIDIARIES
NOTES TO CONSOLIDATED FINANCIAL STATEMENTS—(Continued)
A reconciliation of the beginning and ending amount of gross unrecognized tax benefits as of June 30, 2010, 2009 and 2008 was as follows:
| Year Ended June 30, | |||||||||||
| (Amounts in thousands) | 2010 | 2009 | 2008 | ||||||||
| Beginning balance |
$ | 6,725 | $ | 6,033 | $ | 5,337 | |||||
| Additions based on tax positions related to the current year |
106 | 1,348 | 676 | ||||||||
| Additions for tax positions of prior years |
— | 284 | — | ||||||||
| Reductions due to lapse of applicable statute of limitations |
(994 | ) | (989 | ) | — | ||||||
| Gross balance at June 30, 2010 |
5,837 | 6,676 | 6,013 | ||||||||
| Interest and penalties |
(20 | ) | 49 | 20 | |||||||
| Ending balance |
$ | 5,817 | $ | 6,725 | $ | 6,033 | |||||
The Company and its domestic subsidiaries file income tax returns with federal, state and local tax authorities within the United States. The Company also files tax returns for its international affiliates in various foreign jurisdictions. The statute of limitations for the Company’s U.S. federal tax return years remains open for the year ended June 30, 2007 and subsequent fiscal years. The year ended June 30, 2004 and subsequent fiscal years remain subject to examination for various state tax jurisdictions. In addition, the Company has subsidiaries in various foreign jurisdictions that have statutes of limitations generally ranging from one to ten years. The year ended January 31, 2002 and subsequent fiscal years remain subject to examination for various foreign jurisdictions.
The Company recognizes interest accrued related to unrecognized tax benefits in interest expense and related penalties in the provision for income taxes in the consolidated statement of operations, which is consistent with the recognition of these items in prior reporting periods.
NOTE 13. Repurchases of Common Stock
On November 5, 2008, the Board authorized the Company to extend its existing $80 million Common Stock repurchase program through November 30, 2010. As of June 30, 2010, the Company had repurchased 3,430,498 shares of Common Stock on the open market under the stock repurchase program, at an average price of $16.86 per share, at a cost of $57.9 million, including sales commissions, leaving $22.1 million available for additional Common Stock repurchases under the program. During the year ended June 30, 2010, the Company repurchased 904,260 shares of Common Stock, respectively, on the open market under the stock repurchase program at an average price of $16.55 and at a cost of $15.0 million, including sales commissions. The Company accounted for the acquisition of these shares under the treasury method.
NOTE 14. Stock Plans
At June 30, 2010, the Company had three active stock incentive plans, one for the benefit of non-employee directors of the Company’s Board of Directors (the “Board”) (the “2004 Director Plan”), and two for the benefit of eligible employees and independent contractors (the 2000 Stock Incentive Plan and the 2004 Stock Incentive Plan). In addition, as of June 30, 2010, stock options granted under the Company’s 1995 Stock Option Plan and 1995 Non-Employee Director Plan were still outstanding. The 1995 Stock Option Plan has expired by its terms and no further grants of options will occur under the 1995 Stock Option Plan. The 2004 Director Plan replaced the 1995 Non-Employee Director Plan, and no further grants of stock options will occur under the 1995 Non-Employee Director Plan. All five plans were adopted by the Board and approved by the Company’s shareholders.
76
Table of Contents
ELIZABETH ARDEN, INC. AND SUBSIDIARIES
NOTES TO CONSOLIDATED FINANCIAL STATEMENTS—(Continued)
The 2004 Stock Incentive Plan (the “2004 Incentive Plan”) authorizes the Company to grant awards with respect to a total of 2,700,000 shares of Common Stock. The stock options awarded under the 2004 Incentive Plan are exercisable at any time or in any installments as determined by the compensation committee of the Board at the time of grant and may be either incentive or non-qualified stock options under the Internal Revenue Code, as determined by the compensation committee. The exercise price for stock option grants is equal to the closing price of the Common Stock on the date of grant. At June 30, 2010, 243,985 shares of Common Stock remained available for grant under the 2004 Incentive Plan. In addition, at June 30, 2010, 14,899 shares of Common Stock remained available for grant under the 2000 Stock Incentive Plan.
On August 16, 2010, all outstanding shares of performance-based restricted stock originally granted on August 20, 2007, were forfeited because the applicable cumulative earnings per diluted share target was not achieved. As a result, an additional 26,300 shares of Common Stock became available for grant under the 2004 Incentive Plan, and an additional 33,500 shares of Common Stock became available under the 2000 Stock Incentive Plan.
The 2004 Director Plan authorizes the Company to grant non-qualified stock options for up to 350,000 shares of Common Stock to non-employee directors of the Company. Each year on the date of the annual meeting of the shareholders and provided that a sufficient number of shares remain available under the 2004 Director Plan, there will automatically be granted to each eligible director who is re-elected to the Board an option to purchase 6,000 shares of Common Stock or such other amount as the Board determines based on a competitive review of comparable companies. Each option granted under the 2004 Director Plan on an annual shareholders meeting date will become exercisable three years from the date of grant if such person has continued to serve as a director until that date, unless exercisability of the option is accelerated due to death, disability or retirement in good standing at or after age 70. No option may be exercisable after the expiration of ten years from the date of grant. The exercise price will equal the closing price of the Common Stock on the date of grant. At June 30, 2010, 167,000 shares of Common Stock remained available for grant under the 2004 Director Plan.
For the years ended June 30, 2010, 2009 and 2008, total share-based compensation cost charged against income for all stock plans was $4.8 million, $2.8 million, and $7.1 million, respectively. The tax benefit related to the compensation cost charged to income for the years ended June 30, 2010, 2009 and 2008, was approximately $0.7 million, $1.6 million and $0.5 million, respectively.
As of June 30, 2010, there were approximately $4.6 million of unrecognized compensation costs related to non-vested share-based arrangements granted under the Company’s share-based compensation plans. These costs are expected to be recognized over a weighted-average period of approximately three years.
Stock Options
On August 16, 2010, the Board granted to employees stock options for 171,700 shares of Common Stock under the 2004 Incentive Plan. The stock options are due to vest in equal thirds over a three-year period on dates that are two business days after the Company’s financial results for each of the fiscal years ending June 30, 2011, 2012 and 2013, are publicly announced, but only if the person receiving the grant is still employed by the Company at the time of vesting. The exercise price of those stock options is $16.15 per share, which was the closing price of the Common Stock on the effective date of grant. The weighted-average grant-date fair value of options granted was $7.22 per share based on the Black-Scholes option pricing model. The options expire ten years from the date of grant.
Year Ended June 30, 2010. On August 17, 2009, the Board granted to employees stock options for 288,000 shares of Common Stock under the 2004 Incentive Plan. The stock options are due to vest in equal thirds over a three-year period on dates that are two business days after the
77
Table of Contents
ELIZABETH ARDEN, INC. AND SUBSIDIARIES
NOTES TO CONSOLIDATED FINANCIAL STATEMENTS—(Continued)
Company’s financial results for each of the fiscal years ending June 30, 2010, 2011 and 2012, are publicly announced, but only if the person receiving the grant is still employed by the Company at the time of vesting. The exercise price of those stock options is $9.33 per share, which was the closing price of the Common Stock on the effective date of grant. The weighted-average grant-date fair value of options granted was $4.11 per share based on the Black-Scholes option-pricing model. The options expire ten years from the date of grant.
On November 12, 2009, the date of the Company’s most recent annual shareholders meeting, the Company granted stock options for an aggregate of 30,000 shares of Common Stock to five non-employee directors under the Company’s 2004 Non-Employee Director Stock Option Plan. In addition, the Board on that date granted 6,000 shares of Common Stock to an employee director under the Company’s 2004 Incentive Plan. All of the stock options granted on November 12, 2009, are exercisable three years from the date of grant if such persons continue to serve as a director until that date. The exercise price of those stock options is $13.48 per share, which was the closing price of the Common Stock on the date of grant. The weighted-average grant-date fair value of options granted was $5.98 per share based on the Black-Scholes option-pricing model. The options expire ten years from the date of grant.
Year Ended June 30, 2009. On August 18, 2008, the Board granted to employees stock options for 294,600 shares of Common Stock under the 2004 Incentive Plan. The stock options are due to vest in equal thirds over a three-year period on dates that are two business days after the Company’s financial results for each of the fiscal years ending June 30, 2009, 2010 and 2011, are publicly announced, but only if the person receiving the grant is still employed by the Company at the time of vesting. The exercise price of those stock options is $18.88 per share, which was the closing price of the Common Stock on the effective date of grant. The weighted-average grant-date fair value of options granted was $7.10 per share based on the Black-Scholes option-pricing model. The options expire ten years from the date of grant.
On November 12, 2008, the date of the Company’s 2008 annual shareholders meeting, the Company granted stock options for an aggregate of 30,000 shares of Common Stock to five non-employee directors under the Company’s 2004 Non-Employee Director Stock Option Plan. In addition, the Board on that date granted 6,000 shares of Common Stock to an employee director under the Company’s 2004 Incentive Plan. All of the stock options granted on November 12, 2008, are exercisable three years from the date of grant if such persons continue to serve as a director until that date. The exercise price of those stock options is $13.88 per share, which was the closing price of the Common Stock on the date of grant. The weighted-average grant-date fair value of the options granted was $4.99 per share based on the Black-Scholes option-pricing model. The options expire ten years from the date of grant.
Year Ended June 30, 2008. On August 20, 2007, the Board granted to employees stock options for 347,150 shares of Common Stock under the 2004 Incentive Plan. The stock options are due to vest in equal thirds over a three-year period on dates that are two business days after the Company’s financial results for each of the fiscal years ending June 30, 2008, 2009 and 2010, are publicly announced, but only if the person receiving the grant is still employed by the Company at the time of vesting. The exercise price of those stock options is $23.59 per share, which was the closing price of the Common Stock on the effective date of grant. The weighted-average grant-date fair value of options granted was $8.76 per share based on the Black-Scholes option-pricing model. The options expire ten years from the date of grant.
On November 14, 2007, the date of the Company’s 2007 annual shareholders meeting, the Company granted stock options for an aggregate of 30,000 shares of Common Stock to five non-employee directors under the 2004 Director Plan and 6,000 shares of Common Stock to an
78
Table of Contents
ELIZABETH ARDEN, INC. AND SUBSIDIARIES
NOTES TO CONSOLIDATED FINANCIAL STATEMENTS—(Continued)
employee director under the 2004 Incentive Plan. All of the stock options granted on November 14, 2007, are exercisable three years from the date of grant if such persons continue to serve as a director until that date. The exercise price of those stock options is $24.31 per share, which was the closing price of the Common Stock on the date of grant. The weighted-average grant-date fair value of the options granted was $8.75 per share based on the Black-Scholes option-pricing model. The options expire ten years from the date of grant.
Compensation expense recorded for the years ended June 30, 2010, 2009 and 2008, resulting from stock option grants to employees and directors of the Company amounted to approximately $2.2 million, $2.4 million, and $2.7 million, respectively.
The option activities under the Company’s stock option plans are as follows:
| Year Ended June 30, | ||||||||||||||||||
| 2010 | 2009 | 2008 | ||||||||||||||||
| Shares | Weighted Average Exercise Price |
Shares | Weighted Average Exercise Price |
Shares | Weighted Average Exercise Price | |||||||||||||
| Beginning outstanding options |
3,310,627 | $ | 16.74 | 3,191,393 | $ | 16.59 | 3,397,968 | $ | 15.31 | |||||||||
| New grants |
324,000 | 9.79 | 330,600 | 18.34 | 383,150 | 23.66 | ||||||||||||
| Exercised |
(154,993 | ) | 10.26 | (62,216 | ) | 10.73 | (523,941 | ) | 13.03 | |||||||||
| Canceled/Expired |
(10,350 | ) | 23.56 | (149,150 | ) | 19.80 | (65,784 | ) | 18.88 | |||||||||
| Ending outstanding options |
3,469,284 | $ | 16.36 | 3,310,627 | $ | 16.75 | 3,191,393 | $ | 16.59 | |||||||||
| Exercisable at end of period |
2,784,491 | 16.62 | 2,622,983 | 2,431,761 | ||||||||||||||
| Weighted average fair value per share of options granted during the year |
$ | 4.32 | $ | 6.87 | $ | 8.76 | ||||||||||||
| Options Outstanding |
Options Exercisable | |||||||||||||
| Range of |
Number Outstanding as of June 30, 2010 |
Weighted Average Remaining Contractual Life |
Weighted Average Exercise Price |
Number Exercisable as of June 30, 2010 |
Weighted Average Remaining Contractual Life |
Weighted Average Exercise Price | ||||||||
| $ 7.25 — $14.00 |
1,647,690 | 3.1 | $ | 12.07 | 1,287,690 | 1.4 | $ | 12.59 | ||||||
| $14.01 — $20.00 |
832,868 | 5.5 | $ | 17.13 | 647,598 | 4.7 | $ | 16.63 | ||||||
| $20.01 — Over |
988,726 | 5.3 | $ | 22.87 | 849,203 | 5.0 | $ | 22.73 | ||||||
| 3,469,284 | 4.3 | $ | 16.36 | 2,784,491 | 3.3 | $ | 16.62 | |||||||
The intrinsic value of a stock option is the amount by which the current market value of the underlying stock exceeds the exercise price of the option. The intrinsic value of stock options outstanding and exercisable at June 30, 2010, 2009 and 2008 was $2.5 million, $0.1 million, and $4.5 million, respectively. The total intrinsic value of stock options exercised during the years ended June 30, 2010, 2009 and 2008, based upon the average market price during the period, was approximately $1.0 million, $0.2 million, and $5.3 million, respectively.
79
Table of Contents
ELIZABETH ARDEN, INC. AND SUBSIDIARIES
NOTES TO CONSOLIDATED FINANCIAL STATEMENTS—(Continued)
The weighted-average grant-date fair value of options granted during the years ended June 30, 2010, 2009 and 2008, was estimated on the grant date using the Black-Scholes option-pricing model with the following assumptions:
| Year Ended June 30, | |||||||||
| 2010 | 2009 | 2008 | |||||||
| Expected dividend yield |
0.00 | % | 0.00 | % | 0.00 | % | |||
| Expected price volatility |
55.0 | % | 37.0 | % | 32.7 | % | |||
| Risk-free interest rate |
2.22 — 2.45 | % | 2.37 — 3.17 | % | 4.06 — 4.66 | % | |||
| Expected life of options in years |
4 | 5 | 5 | ||||||
In February 2008, the Company accepted the tender of 120,861 shares of Common Stock at a fair market value of $18.72 per share, representing a cost of approximately $2.3 million, as payment for the exercise price of stock options exercised by the Company’s chief executive officer as permitted under the 1995 Stock Option Plan and authorized by the compensation committee of the Board. The fair market value of the tendered shares was equal to the closing price of the Common Stock on the date that the Company was given notice of the tender of shares. The acquisition of these shares by the Company was accounted for under the treasury method.
In September 2007, the Company accepted the tender of 81,230 shares of Common Stock at a fair market value of $26.93 per share, representing a cost of approximately $2.2 million, as payment for the exercise price of stock options exercised by the Company’s chief executive officer as permitted under the 1995 Stock Option Plan and authorized by the compensation committee of the Board. The fair market value of the tendered shares was equal to the closing price of the Common Stock on the date that the Company was given notice of the tender of shares and the tender of shares was approved by the compensation committee of the Board. The acquisition of these shares by the Company was accounted for under the treasury method.
Employee Stock Purchase Plan. The Company currently has an Employee Stock Purchase Plan (“ESPP”) under which employees in certain countries are permitted to deposit after tax funds from their wages for purposes of purchasing Common Stock at a 15% discount from the lowest of the closing price of the Common Stock at either the start of the contribution period or the end of the contribution period. On May 30, 2010 and November 30, 2009, purchases of Common Stock occurred under this plan for 61,368 shares and 87,957 shares, respectively. For the years ended June 30, 2010, 2009 and 2008, the Company recorded costs associated with the ESPP of approximately $0.5 million, $0.4 million and $0.5 million respectively. The next purchase under the ESPP will be consummated on November 30, 2010.
Restricted Stock
On August 16, 2010, the Board granted to employees 146,400 shares of service-based restricted stock. The service-based restricted stock will vest in equal thirds over a three-year period on a date that is two business days after the Company’s financial results for each of the years ending June 30, 2011, 2012 and 2013 are publicly announced, but only if the person receiving the grant is still employed by the Company at the time of vesting. The fair value of the service-based restricted stock granted was based on the closing price of the Company’s common stock on the date of grant. The service-based restricted stock is recorded as additional paid-in capital in shareholders’ equity as amortization occurs over the three-year vesting period.
Year Ended June 30, 2010. On August 17, 2009, the Board granted to employees 259,200 shares of service-based restricted stock. The service-based restricted stock will vest in equal thirds over a three-year period on a date that is two business days after the Company’s financial results for
80
Table of Contents
ELIZABETH ARDEN, INC. AND SUBSIDIARIES
NOTES TO CONSOLIDATED FINANCIAL STATEMENTS—(Continued)
each of the years ending June 30, 2010, 2011 and 2012 are publicly announced, but only if the person receiving the grant is still employed by the Company at the time of vesting. The fair value of the service-based restricted stock granted was based on the closing price of the Company’s common stock on the date of grant. The service-based restricted stock is recorded as additional paid-in capital in shareholders’ equity as amortization occurs over the three-year vesting period.
Year Ended June 30, 2009. On August 18, 2008, the Board granted to employees 117,800 shares of performance-based restricted stock and 121,133 shares of service-based restricted stock. All or part of the performance-based restricted stock will vest on a date that is two business days after the Company’s financial results for fiscal 2011 are released to the public, but only if (i) the person receiving the grant is still employed by the Company and (ii) the Company achieves a cumulative earnings per diluted share target. The service-based restricted stock will vest in equal thirds over a three-year period on a date that is two business days after the Company’s financial results for each of the fiscal years ending June 30, 2009, 2010 and 2011, are publicly announced but only if the person is still employed by the Company at the time of vesting. The fair value of the restricted stock granted was based on the closing price of the Common Stock on the date of grant. The restricted stock is recorded as additional paid-in capital in shareholders’ equity as amortization occurs over the three-year vesting period.
Year Ended June 30, 2008. On August 20, 2007, the Board granted to employees 68,700 shares of performance-based restricted stock and 80,300 shares of service-based restricted stock. All or part of the performance-based restricted stock will vest on a date that is two business days after the Company’s financial results for fiscal 2010 are released to the public, but only if (i) the person receiving the grant is still employed by the Company and (ii) the Company achieves a cumulative earnings per diluted share target. The service-based restricted stock will vest in equal thirds over a three-year period on a date that is two business days after the Company’s financial results for each of the fiscal years ending June 30, 2008, 2009 and 2010, are publicly announced but only if the person is still employed by the Company at the time of vesting. The fair value of the restricted stock granted was based on the closing price of the Common Stock on the date of grant. The restricted stock is recorded as additional paid-in capital in shareholders’ equity as amortization occurs over the three-year vesting period.
A summary of the Company’s restricted stock activity for the year ended June 30, 2010, is presented below:
| Restricted Stock |
Shares (000) |
Weighted Average Grant Date Fair Value | ||||
| Non-vested at July 1, 2009 |
842 | $ | 18.79 | |||
| Granted |
259 | $ | 9.33 | |||
| Vested |
(99 | ) | $ | 18.52 | ||
| Forfeited |
(111 | ) | $ | 15.15 | ||
| Non-vested at June 30, 2010 |
891 | $ | 16.52 | |||
81
Table of Contents
ELIZABETH ARDEN, INC. AND SUBSIDIARIES
NOTES TO CONSOLIDATED FINANCIAL STATEMENTS—(Continued)
In March 2005, the Company granted to employees 410,800 shares of MBRS. The MBRS will only vest if the Company’s total shareholder return surpasses the total shareholder return of the Russell 2000 Index over a three, four, five or six-year period from the date of grant, in which case the MBRS will vest at that time. As of June 30, 2010, the MBRS had not vested. If the grant does not vest in March 2011, the shares will be forfeited. Upon adoption of SFAS 123R on July 1, 2005, the Company revalued the MBRS using a Monte Carlo simulation model using the assumptions presented below:
| Three Months Ended September 30, 2005 |
|||
| Expected dividend yield |
0.00 | % | |
| Expected price volatility |
40.00 | % | |
| Risk-free interest rate |
3.72 | % | |
| Derived service period in years |
3 |
Compensation expense for the years ended June 30, 2010 and 2008, resulting from all restricted stock grants to employees of the Company, amounted to approximately $2.1 million and $3.9 million, respectively. Compensation expense for the year ended June 30, 2009 related to all restricted stock grants was insignificant. During the year ended June 30, 2009, the Company reversed $1.7 million in previously recognized share-based compensation relating to the performance-based restricted stock granted in August 2007 and 2006. In addition, by the end of fiscal 2009 the Company also reversed all share based compensation cost related to the August 2008 performance-based restricted stock grants that had been recorded in earlier interim periods during fiscal 2009 as the Company determined that the vesting of shares under the August 2006, 2007 and 2008 performance-based restricted stock grants was not probable.
NOTE 15. Fair Value Measurements
Accounting standards define fair value as the price that would be received to sell an asset or paid to transfer a liability in the principal or most advantageous market for the asset or liability in an orderly transaction between market participants at the measurement date. The accounting standards also have established a fair value hierarchy, which prioritizes the inputs to valuation techniques used in measuring fair value into three broad levels as follows:
Level 1 — Quoted prices in active markets for identical assets or liabilities
Level 2 — Inputs, other than the quoted prices in active markets, that are observable either directly or indirectly
Level 3 — Unobservable inputs based on the Company’s own assumptions
The Company’s derivative assets and liabilities are currently composed of foreign currency contracts. Fair values are based on market prices or determined using valuation models that use as their basis readily observable market data that is actively quoted and can be validated through external sources, including independent pricing services, brokers and market transactions.
The following table presents the fair value hierarchy for those of the Company’s financial assets and liabilities that were measured at fair value on a recurring basis as of June 30, 2010:
| (Amounts in thousands) | Level 1 | Level 2 | Level 3 | Total | ||||||||
| Assets |
||||||||||||
| Foreign currency contracts |
$ | — | $ | 504 | $ | — | $ | 504 | ||||
| Liabilities |
||||||||||||
| Foreign currency contracts |
$ | — | $ | 145 | $ | — | $ | 145 | ||||
82
Table of Contents
ELIZABETH ARDEN, INC. AND SUBSIDIARIES
NOTES TO CONSOLIDATED FINANCIAL STATEMENTS—(Continued)
As of June 30, 2009, the Company’s foreign currency contracts were measured at fair value under Level 2 as an asset of $0.5 million and as a liability of $0.4 million. See Note 16 for a discussion of the Company’s foreign currency contracts.
Accounting standards require non-financial assets and liabilities to be recognized at fair value subsequent to initial recognition when they are deemed to be other-than-temporarily impaired. As of June 30, 2010, the Company did not have any non-financial assets and liabilities measured at fair value.
NOTE 16. Derivative Financial Instruments
The Company operates in several foreign countries, which exposes it to market risk associated with foreign currency exchange rate fluctuations. The Company’s risk management policy is to enter into cash flow hedges to reduce a portion of the exposure of the Company’s foreign subsidiaries’ revenues to fluctuations in currency rates using foreign currency forward contracts. The Company also enters into cash flow hedges a portion of its forecasted inventory purchases to reduce the exposure of its Canadian and Australian subsidiaries’ cost of sales to such fluctuations. Additionally, when appropriate, the Company enters into and settles foreign currency contracts to reduce the exposure of the Company’s foreign subsidiaries’ balance sheets to fluctuations in currency rates. The principal currencies hedged are British pounds, Euros, Canadian dollars and Australian dollars. The Company does not enter into derivative financial contracts for speculative or trading purposes. The Company’s derivative financial instruments are recorded in the consolidated balance sheets at fair value determined using pricing models based on market prices or determined using valuation models that use as their basis readily observable market data that is actively quoted and can be validated through external sources, including independent pricing services, brokers and market transactions. Cash flows from derivative financial instruments are classified as cash flows from operating activities in the consolidated statements of cash flows.
Foreign currency contracts used to hedge forecasted revenues are designated as cash flow hedges. These contracts are used to hedge forecasted subsidiaries’ revenues generally over approximately 12 to 18 months. Changes to fair value of the foreign currency contracts are recorded as a component of accumulated other comprehensive income (loss) within stockholders’ equity to the extent such contracts are effective, and are recognized in net sales in the period in which the forecasted transaction affects earnings or the transactions are no longer probable of occurring. Changes to fair value of any contracts deemed to be ineffective would be recognized in earnings immediately. There were no amounts recorded in fiscal 2010, 2009, or 2008 relating to foreign currency contracts used to hedge forecasted revenues resulting from hedge ineffectiveness. As of June 30, 2010, the Company had notional amounts of 15.1 million British pounds under foreign currency contracts used to hedge forecasted revenues that expire between July 31, 2010 and May 30, 2011.
Foreign currency contracts used to hedge forecasted cost of sales are designated as cash flow hedges. These contracts are used to hedge forecasted Canadian and Australian subsidiaries’ cost of sales generally over approximately 12 to 18 months. Changes to fair value of the foreign currency contracts are recorded as a component of accumulated other comprehensive income (loss) within stockholders’ equity, to the extent such contracts are effective, and are recognized in cost of sales in the period in which the forecasted transaction affects earnings. Changes to fair value of any contracts deemed to be ineffective would be recognized in earnings immediately. There were no amounts recorded in fiscal 2010, 2009, or 2008 relating to foreign currency contracts used to hedge forecasted cost of sales resulting from hedge ineffectiveness. As of June 30, 2010, the Company had notional amounts of 6.8 million Canadian dollars and 7.9 million Australian dollars under foreign currency contracts used to hedge forecasted cost of sales that expire between July 31, 2010 and May 30, 2011.
83
Table of Contents
ELIZABETH ARDEN, INC. AND SUBSIDIARIES
NOTES TO CONSOLIDATED FINANCIAL STATEMENTS—(Continued)
When appropriate, the Company also enters into and settles foreign currency contracts for Euros, British pounds and Canadian dollars to reduce exposure of the Company’s foreign subsidiaries’ balance sheets to fluctuations in foreign currency rates. These contracts are used to hedge balance sheet exposure generally over one month and are settled before the end of the month in which they are entered into. Changes to fair value of the forward contracts are recognized in selling, general and administrative expense in the period in which the contracts expire. For the years ended June 30, 2010 and 2009, the Company recorded a credit of $1.3 million and $3.3 million, respectively in selling, general and administrative expenses related to these contracts. For the year ended June 30, 2008, the Company recorded a charge of $2.6 million in selling, general and administrative expenses. As of June 30, 2010, there were no such foreign currency contracts outstanding. There were no amounts recorded in fiscal 2010, 2009 and 2008 relating to foreign currency contracts to hedge subsidiary balance sheets resulting from hedge ineffectiveness.
The following tables illustrate the fair value of outstanding foreign currency contracts and the gains (losses) associated with the settlement of these contracts:
| Fair Value of Derivative Instruments | ||||||||||
| (Amounts in thousands) | Asset Derivatives As of June 30, 2010 |
Liability Derivatives As of June 30, 2010 | ||||||||
| Balance Sheet Location |
Fair Value |
Balance Sheet Location |
Fair Value | |||||||
| Derivatives designated as effective hedges |
||||||||||
| Foreign Exchange Contracts |
Other assets | $ | 504 | Other payables | $ | 145 | ||||
| Total |
$ | 504 | $ | 145 | ||||||
At June 30, 2009, the Company’s foreign currency contracts were measured at fair value under Level 2 as an asset of $0.5 million and as a liability of $0.4 million.
Gain (Loss) Recognized on Derivatives in Other Comprehensive Income (Loss), Net of Tax (Effective Portion)
| Year Ended June 30, | |||||||||||
| (Amounts in thousands) | 2010 | 2009 | 2008 | ||||||||
| Currency Contracts—Sales |
$ | 745 | $ | 8,944 | $ | (7,972 | ) | ||||
| Currency Contracts—Cost of Sales |
(366 | ) | 567 | (196 | ) | ||||||
| Total |
$ | 379 | $ | 9,511 | $ | (8,168 | ) | ||||
Gain (Loss) Reclassified from Accumulated Other Comprehensive Income into Income (Effective Portion)
| Year Ended June 30, | |||||||||||
| (Amounts in thousands) | 2010 | 2009 | 2008 | ||||||||
| Currency Contracts—Sales (1) |
$ | 766 | $ | 14,124 | $ | (8,854 | ) | ||||
| Currency Contracts—Cost of Sales (2) |
(662 | ) | 852 | (620 | ) | ||||||
| Total |
$ | 104 | $ | 14,976 | $ | (9,474 | ) | ||||
| (1) | Recorded in net sales on the consolidated statements of income. |
| (2) | Recorded in cost of sales on the consolidated statements of income. |
84
Table of Contents
ELIZABETH ARDEN, INC. AND SUBSIDIARIES
NOTES TO CONSOLIDATED FINANCIAL STATEMENTS—(Continued)
NOTE 17. Quarterly Data (Unaudited)
Condensed consolidated quarterly and interim information is as follows: (Amounts in thousands, except per share data)
| Fiscal Quarter Ended | |||||||||||||
| June 30, 2010 |
March 31, 2010 |
December 31, 2009 |
September 30, 2009 | ||||||||||
| Net sales |
$ | 228,243 | $ | 217,026 | $ | 393,345 | $ | 265,164 | |||||
| Gross profit |
104,218 | 101,811 | 174,324 | 115,620 | |||||||||
| Income (Loss) from operations |
3,664 | (1,023 | ) | 36,483 | 5,668 | ||||||||
| Net income (loss) |
2,293 | (3,856 | ) | 21,056 | 40 | ||||||||
| Income (loss) per common share: |
|||||||||||||
| Basic |
$ | 0.08 | $ | (0.14 | ) | $ | 0.75 | $ | — | ||||
| Diluted |
$ | 0.08 | $ | (0.14 | ) | $ | 0.73 | $ | — | ||||
| Fiscal Quarter Ended | |||||||||||||||
| June 30, 2009 |
March 31, 2009 |
December 31, 2008 |
September 30, 2008 |
||||||||||||
| Net sales |
$ | 212,562 | $ | 203,471 | $ | 370,005 | $ | 284,187 | |||||||
| Gross profit |
90,820 | 86,557 | 150,475 | 105,303 | |||||||||||
| (Loss) Income from operations |
(38 | ) | (5,115 | ) | 24,800 | (9,313 | ) | ||||||||
| Net (loss) income |
(3,609 | ) | (3,704 | ) | 13,666 | (12,516 | ) | ||||||||
| (Loss) income per common share: |
|||||||||||||||
| Basic |
$ | (0.13 | ) | $ | (0.13 | ) | $ | 0.49 | $ | (0.45 | ) | ||||
| Diluted |
$ | (0.13 | ) | $ | (0.13 | ) | $ | 0.48 | $ | (0.45 | ) | ||||
NOTE 18. Condensed Consolidating Financial Information
The following condensed financial statements as of June 30, 2010 and June 30, 2009, and for the years ended June 30, 2010, 2009 and 2008, show the consolidated financial statements of the Company, and, in separate financial statements, the financial statements of those subsidiaries that are guarantors of the 7 3/4% Senior Subordinated Notes, plus, in each case, the financial statements of non-guarantor entities, elimination adjustments and the consolidated total. The Company’s subsidiaries, DF Enterprises, Inc., FD Management, Inc., Elizabeth Arden International Holding, Inc., Elizabeth Arden (Financing), Inc., RDEN Management, Inc. and Elizabeth Arden Travel Retail, Inc., are guarantors of the 7 3 /4% Senior Subordinated Notes. Equity income of the guarantor subsidiaries is included in other expense (income), net. All subsidiaries listed in this note are wholly-owned subsidiaries of the Company and their guarantees are joint and several, full and unconditional. All information presented is in thousands.
[Remainder of Page Intentionally Left Blank]
85
Table of Contents
ELIZABETH ARDEN, INC. AND SUBSIDIARIES
NOTES TO CONSOLIDATED FINANCIAL STATEMENTS—(Continued)
Balance Sheet
| As of June 30, 2010 | ||||||||||||||||||||
| Company | Non- Guarantors |
7
3/4% Senior Subordinated Notes Guarantors |
Eliminations | Total | ||||||||||||||||
| ASSETS | ||||||||||||||||||||
| Current Assets: |
||||||||||||||||||||
| Cash and cash equivalents |
$ | 6,349 | $ | 20,515 | $ | 17 | $ | — | $ | 26,881 | ||||||||||
| Accounts receivable, net |
85,759 | 84,308 | — | — | 170,067 | |||||||||||||||
| Inventories |
189,287 | 81,771 | — | — | 271,058 | |||||||||||||||
| Intercompany receivable |
52,556 | 9,481 | 235,795 | (297,832 | ) | — | ||||||||||||||
| Deferred income taxes |
30,726 | 2,770 | — | — | 33,496 | |||||||||||||||
| Prepaid expenses and other assets |
31,411 | 27,034 | 447 | — | 58,892 | |||||||||||||||
| Total current assets |
396,088 | 225,879 | 236,259 | (297,832 | ) | 560,394 | ||||||||||||||
| Property and equipment, net |
53,017 | 23,566 | — | — | 76,583 | |||||||||||||||
| Other Assets: |
||||||||||||||||||||
| Investment in subsidiaries |
312,467 | — | 9,136 | (321,603 | ) | — | ||||||||||||||
| Exclusive brand licenses, trademarks and intangibles, net |
25,752 | 5,735 | 147,957 | — | 179,444 | |||||||||||||||
| Goodwill |
21,054 | — | — | — | 21,054 | |||||||||||||||
| Debt financing costs, net |
3,509 | — | — | — | 3,509 | |||||||||||||||
| Other |
582 | 1,898 | — | 7 | 2,487 | |||||||||||||||
| Total other assets |
363,364 | 7,633 | 157,093 | (321,596 | ) | 206,494 | ||||||||||||||
| Total assets |
$ | 812,469 | $ | 257,078 | $ | 393,352 | $ | (619,428 | ) | $ | 843,471 | |||||||||
| LIABILITIES AND SHAREHOLDERS’ EQUITY |
||||||||||||||||||||
| Current Liabilities: |
||||||||||||||||||||
| Short-term debt |
$ | 59,000 | $ | — | $ | — | $ | — | $ | 59,000 | ||||||||||
| Accounts payable — trade |
78,624 | 19,817 | — | — | 98,441 | |||||||||||||||
| Intercompany payable |
37,499 | 50,508 | 218,969 | (306,976 | ) | — | ||||||||||||||
| Other payables and accrued expenses |
49,259 | 47,155 | — | 15 | 96,429 | |||||||||||||||
| Total current liabilities |
224,382 | 117,480 | 218,969 | (306,961 | ) | 253,870 | ||||||||||||||
| Long-term debt |
218,699 | — | — | — | 218,699 | |||||||||||||||
| Deferred income taxes and other liabilities |
16,771 | 1,514 | — | — | 18,285 | |||||||||||||||
| Total liabilities |
459,852 | 118,994 | 218,969 | (306,961 | ) | 490,854 | ||||||||||||||
| Shareholders’ Equity |
||||||||||||||||||||
| Common stock |
319 | — | — | — | 319 | |||||||||||||||
| Additional paid-in capital |
297,137 | 9,136 | 187,161 | (196,297 | ) | 297,137 | ||||||||||||||
| Retained earnings (accumulated deficit) |
118,946 | 130,309 | (12,778 | ) | (117,531 | ) | 118,946 | |||||||||||||
| Treasury stock |
(62,303 | ) | — | — | — | (62,303 | ) | |||||||||||||
| Accumulated other comprehensive loss |
(1,482 | ) | (1,361 | ) | — | 1,361 | (1,482 | ) | ||||||||||||
| Total shareholders’ equity |
352,617 | 138,084 | 174,383 | (312,467 | ) | 352,617 | ||||||||||||||
| Total liabilities and shareholders’ equity |
$ | 812,469 | $ | 257,078 | $ | 393,352 | $ | (619,428 | ) | $ | 843,471 | |||||||||
86
Table of Contents
ELIZABETH ARDEN, INC. AND SUBSIDIARIES
NOTES TO CONSOLIDATED FINANCIAL STATEMENTS—(Continued)
Balance Sheet
| As of June 30, 2009 | ||||||||||||||||||||
| Company | Non- Guarantors |
7
3/4% Senior Subordinated Notes Guarantors |
Eliminations | Total | ||||||||||||||||
| ASSETS | ||||||||||||||||||||
| Current Assets: |
||||||||||||||||||||
| Cash and cash equivalents |
$ | 1,936 | $ | 20,969 | $ | 197 | $ | — | $ | 23,102 | ||||||||||
| Accounts receivable, net |
104,939 | 85,334 | — | — | 190,273 | |||||||||||||||
| Inventories |
225,721 | 92,814 | — | — | 318,535 | |||||||||||||||
| Intercompany receivable |
47,704 | 4,632 | 269,819 | (322,155 | ) | — | ||||||||||||||
| Deferred income taxes |
15,729 | (902 | ) | — | — | 14,827 | ||||||||||||||
| Prepaid expenses and other assets |
35,794 | 13,649 | 581 | — | 50,024 | |||||||||||||||
| Total current assets |
431,823 | 216,496 | 270,597 | (322,155 | ) | 596,761 | ||||||||||||||
| Property and equipment, net |
42,990 | 21,120 | — | — | 64,110 | |||||||||||||||
| Other Assets: |
||||||||||||||||||||
| Investment in subsidiaries |
298,411 | — | 9,136 | (307,547 | ) | — | ||||||||||||||
| Exclusive brand licenses, trademarks and intangibles, net |
28,967 | 6,598 | 150,756 | — | 186,321 | |||||||||||||||
| Goodwill |
21,054 | — | — | — | 21,054 | |||||||||||||||
| Debt financing costs, net |
4,705 | — | — | — | 4,705 | |||||||||||||||
| Other |
12,252 | (1,146 | ) | 11 | 7 | 11,124 | ||||||||||||||
| Total other assets |
365,389 | 5,452 | 159,903 | (307,540 | ) | 223,204 | ||||||||||||||
| Total assets |
$ | 840,202 | $ | 243,068 | $ | 430,500 | $ | (629,695 | ) | $ | 884,075 | |||||||||
| LIABILITIES AND SHAREHOLDERS’ EQUITY |
||||||||||||||||||||
| Current Liabilities: |
||||||||||||||||||||
| Short-term debt |
$ | 115,000 | $ | — | $ | — | $ | — | $ | 115,000 | ||||||||||
| Accounts payable — trade |
102,952 | 18,461 | — | — | 121,413 | |||||||||||||||
| Intercompany payable |
9,165 | 71,042 | 251,076 | (331,283 | ) | — | ||||||||||||||
| Other payables and accrued expenses |
39,600 | 33,593 | — | (1 | ) | 73,192 | ||||||||||||||
| Current portion of long-term debt |
545 | — | — | — | 545 | |||||||||||||||
| Total current liabilities |
267,262 | 123,096 | 251,076 | (331,284 | ) | 310,150 | ||||||||||||||
| Long-term debt |
223,366 | — | — | — | 223,366 | |||||||||||||||
| Deferred income taxes and other liabilities |
12,796 | 985 | — | — | 13,781 | |||||||||||||||
| Total liabilities |
503,424 | 124,081 | 251,076 | (331,284 | ) | 547,297 | ||||||||||||||
| Shareholders’ Equity |
||||||||||||||||||||
| Common stock |
316 | — | — | — | 316 | |||||||||||||||
| Additional paid-in capital |
285,847 | 9,136 | 197,411 | (206,547 | ) | 285,847 | ||||||||||||||
| Retained earnings (accumulated deficit) |
99,413 | 111,193 | (17,987 | ) | (93,206 | ) | 99,413 | |||||||||||||
| Treasury stock |
(47,334 | ) | — | — | — | (47,334 | ) | |||||||||||||
| Accumulated other comprehensive loss |
(1,464 | ) | (1,342 | ) | — | 1,342 | (1,464 | ) | ||||||||||||
| Total shareholders’ equity |
336,778 | 118,987 | 179,424 | (298,411 | ) | 336,778 | ||||||||||||||
| Total liabilities and shareholders’ equity |
$ | 840,202 | $ | 243,068 | $ | 430,500 | $ | (629,695 | ) | $ | 884,075 | |||||||||
87
Table of Contents
ELIZABETH ARDEN, INC. AND SUBSIDIARIES
NOTES TO CONSOLIDATED FINANCIAL STATEMENTS—(Continued)
Statement of Operations
| Year Ended June 30, 2010 | ||||||||||||||||||
| Company | Non- Guarantors |
7
3/4%
Senior Subordinated Notes Guarantors |
Eliminations | Total | ||||||||||||||
| Net sales |
$ | 670,321 | $ | 433,456 | $ | 13,184 | $ | (13,184 | ) | $ | 1,103,777 | |||||||
| Cost of goods sold: |
||||||||||||||||||
| Cost of sales |
405,565 | 197,198 | — | — | 602,763 | |||||||||||||
| Depreciation related to cost of goods sold |
4,428 | 612 | — | — | 5,040 | |||||||||||||
| Total cost of goods sold |
409,993 | 197,810 | — | — | 607,803 | |||||||||||||
| Gross profit |
260,328 | 235,646 | 13,184 | (13,184 | ) | 495,974 | ||||||||||||
| Selling, general and administrative costs |
243,207 | 198,965 | (1,226 | ) | (13,184 | ) | 427,762 | |||||||||||
| Depreciation and amortization |
11,500 | 8,852 | 3,067 | — | 23,419 | |||||||||||||
| Income from operations |
5,621 | 27,829 | 11,343 | — | 44,793 | |||||||||||||
| Other expense (income): |
||||||||||||||||||
| Interest expense (income) |
21,822 | 754 | (691 | ) | — | 21,885 | ||||||||||||
| Debt extinguishment charges |
82 | — | — | — | 82 | |||||||||||||
| Other |
(33,160 | ) | 5,113 | 3,722 | 24,325 | — | ||||||||||||
| Income (loss) before income taxes |
16,877 | 21,962 | 8,312 | (24,325 | ) | 22,826 | ||||||||||||
| (Benefit from) provision for income taxes |
(2,656 | ) | 2,846 | 3,103 | — | 3,293 | ||||||||||||
| Net income |
$ | 19,533 | $ | 19,116 | $ | 5,209 | $ | (24,325 | ) | $ | 19,533 | |||||||
88
Table of Contents
ELIZABETH ARDEN, INC. AND SUBSIDIARIES
NOTES TO CONSOLIDATED FINANCIAL STATEMENTS—(Continued)
Statement of Operations
| Year Ended June 30, 2009 | |||||||||||||||||||
| Company | Non- Guarantors |
7
3/4%
Senior Subordinated Notes Guarantors |
Eliminations | Total | |||||||||||||||
| Net sales |
$ | 652,741 | $ | 417,484 | $ | 12,471 | $ | (12,471 | ) | $ | 1,070,225 | ||||||||
| Cost of goods sold: |
|||||||||||||||||||
| Cost of sales |
423,863 | 208,791 | — | — | 632,654 | ||||||||||||||
| Depreciation related to cost of goods sold |
3,845 | 571 | — | — | 4,416 | ||||||||||||||
| Total cost of goods sold |
427,708 | 209,362 | — | — | 637,070 | ||||||||||||||
| Gross profit |
225,033 | 208,122 | 12,471 | (12,471 | ) | 433,155 | |||||||||||||
| Selling, general and administrative costs |
229,179 | 185,689 | (1,319 | ) | (12,471 | ) | 401,078 | ||||||||||||
| Depreciation and amortization |
11, 447 | 7,282 | 3,013 | — | 21,742 | ||||||||||||||
| (Loss) income from operations |
(15,593 | ) | 15,151 | 10,777 | — | 10,335 | |||||||||||||
| Other expense (income): |
|||||||||||||||||||
| Interest expense (income) |
24,770 | 1,038 | (994 | ) | — | 24,814 | |||||||||||||
| Other |
(18,203 | ) | 2,769 | 3,586 | 11,848 | — | |||||||||||||
| (Loss) income before income taxes |
(22,160 | ) | 11,344 | 8,185 | (11,848 | ) | (14,479 | ) | |||||||||||
| (Benefit from) provision for income taxes |
(15,997 | ) | 2,881 | 4,800 | — | (8,316 | ) | ||||||||||||
| Net (loss) income |
$ | (6,163 | ) | $ | 8,463 | $ | 3,385 | $ | (11,848 | ) | $ | (6,163 | ) | ||||||
89
Table of Contents
ELIZABETH ARDEN, INC. AND SUBSIDIARIES
NOTES TO CONSOLIDATED FINANCIAL STATEMENTS—(Continued)
Statement of Operations
| Year Ended June 30, 2008 | ||||||||||||||||||
| Company | Non- Guarantors |
7
3/4%
Senior Subordinated Notes Guarantors |
Eliminations | Total | ||||||||||||||
| Net sales |
$ | 685,351 | $ | 455,724 | $ | 14,776 | $ | (14,776 | ) | $ | 1,141,075 | |||||||
| Cost of goods sold: |
||||||||||||||||||
| Cost of sales |
465,558 | 209,399 | — | — | 674,957 | |||||||||||||
| Depreciation related to cost of goods sold |
3,598 | 647 | — | — | 4,245 | |||||||||||||
| Total cost of goods sold |
469,156 | 210,046 | — | — | 679,202 | |||||||||||||
| Gross profit |
216,195 | 245,678 | 14,776 | (14,776 | ) | 461,873 | ||||||||||||
| Selling, general and administrative costs |
206,590 | 201,881 | (1,375 | ) | (14,776 | ) | 392,320 | |||||||||||
| Depreciation and amortization |
10,924 | 6,638 | 2,961 | — | 20,523 | |||||||||||||
| (Loss) income from operations |
(1,319 | ) | 37,159 | 13,190 | — | 49,030 | ||||||||||||
| Other expense (income): |
||||||||||||||||||
| Interest expense (income) |
27,569 | 1,602 | (1,576 | ) | — | 27,595 | ||||||||||||
| Other |
(39,862 | ) | 771 | 4,618 | 34,473 | — | ||||||||||||
| Income (loss) before income taxes |
10,974 | 34,786 | 10,148 | (34,473 | ) | 21,435 | ||||||||||||
| (Benefit from) provision for income taxes |
(8,927 | ) | 6,800 | 3,661 | — | 1,534 | ||||||||||||
| Net income |
$ | 19,901 | $ | 27,986 | $ | 6,487 | $ | (34,473 | ) | $ | 19,901 | |||||||
90
Table of Contents
ELIZABETH ARDEN, INC. AND SUBSIDIARIES
NOTES TO CONSOLIDATED FINANCIAL STATEMENTS—(Continued)
Statement of Cash Flows
| Year Ended June 30, 2010 | ||||||||||||||||||||
| Company | Non Guarantors |
7
3/4% Senior Subordinated Notes Guarantors |
Eliminations | Total | ||||||||||||||||
| Operating activities: |
||||||||||||||||||||
| Net cash provided by (used in) operating activities |
$ | 91,757 | $ | 37,727 | $ | (15,543 | ) | $ | 18 | $ | 113,959 | |||||||||
| Investing activities: |
||||||||||||||||||||
| Additions to property and equipment |
(25,580 | ) | (9,808 | ) | — | — | (35,388 | ) | ||||||||||||
| Acquisition of licenses and other assets |
(333 | ) | — | — | — | (333 | ) | |||||||||||||
| Net cash used in investing activities |
(25,913 | ) | (9,808 | ) | — | — | (35,721 | ) | ||||||||||||
| Financing activities: |
||||||||||||||||||||
| Payments on short-term debt |
(56,000 | ) | — | — | — | (56,000 | ) | |||||||||||||
| Payments on long-term debt |
(545 | ) | — | — | — | (545 | ) | |||||||||||||
| Repurchase of senior subordinated notes |
(5,000 | ) | — | — | — | (5,000 | ) | |||||||||||||
| Payments under capital lease |
(1,927 | ) | — | — | — | (1,927 | ) | |||||||||||||
| Repurchase of common stock |
(13,779 | ) | — | — | — | (13,779 | ) | |||||||||||||
| Proceeds from the exercise of stock options |
1,591 | — | — | — | 1,591 | |||||||||||||||
| Proceeds from the issuance of common stock under ESPP |
1,323 | — | — | — | 1,323 | |||||||||||||||
| Financing fees paid |
— | — | — | — | — | |||||||||||||||
| Net change in intercompany obligations |
13,028 | (28,373 | ) | 15,363 | (18 | ) | — | |||||||||||||
| Net cash (used in) provided by financing activities |
(61,309 | ) | (28,373 | ) | 15,363 | (18 | ) | (74,337 | ) | |||||||||||
| Effect of exchange rate changes on cash and cash equivalents |
(122 | ) | — | — | — | (122 | ) | |||||||||||||
| Net increase (decrease) in cash and cash equivalents |
4,413 | (454 | ) | (180 | ) | — | 3,779 | |||||||||||||
| Cash and cash equivalents at beginning of year |
1,936 | 20,969 | 197 | — | 23,102 | |||||||||||||||
| Cash and cash equivalents at end of year |
$ | 6,349 | $ | 20,515 | $ | 17 | $ | — | $ | 26,881 | ||||||||||
91
Table of Contents
ELIZABETH ARDEN, INC. AND SUBSIDIARIES
NOTES TO CONSOLIDATED FINANCIAL STATEMENTS—(Continued)
Statement of Cash Flows
| Year Ended June 30, 2009 | ||||||||||||||||||||
| Company | Non Guarantors |
7
3/4% Senior Subordinated Notes Guarantors |
Eliminations | Total | ||||||||||||||||
| Operating activities: |
||||||||||||||||||||
| Net cash provided by operating activities |
$ | 18,697 | $ | 15,217 | $ | 997 | $ | 2,075 | $ | 36,986 | ||||||||||
| Investing activities: |
||||||||||||||||||||
| Additions to property and equipment |
(15,217 | ) | (11,113 | ) | — | — | (26,330 | ) | ||||||||||||
| Acquisition of licenses and other assets |
(5,333 | ) | — | — | — | (5,333 | ) | |||||||||||||
| Net cash used in investing activities |
(20,550 | ) | (11,113 | ) | — | — | (31,663 | ) | ||||||||||||
| Financing activities: |
||||||||||||||||||||
| Payments on short-term debt |
(4,000 | ) | — | — | — | (4,000 | ) | |||||||||||||
| Payments on long-term debt |
(1,149 | ) | — | — | — | (1,149 | ) | |||||||||||||
| Payments under capital lease |
(2,009 | ) | — | — | — | (2,009 | ) | |||||||||||||
| Repurchase of common stock |
(1,566 | ) | — | — | — | (1,566 | ) | |||||||||||||
| Proceeds from the exercise of stock options |
668 | — | — | — | 668 | |||||||||||||||
| Proceeds from the issuance of common stock under ESPP |
1,390 | — | — | — | 1,390 | |||||||||||||||
| Financing fees paid |
(863 | ) | — | — | — | (863 | ) | |||||||||||||
| Net change in intercompany obligations |
8,919 | (5,936 | ) | (908 | ) | (2,075 | ) | — | ||||||||||||
| Net cash provided by (used in) financing activities |
1,390 | (5,936 | ) | (908 | ) | (2,075 | ) | (7,529 | ) | |||||||||||
| Effect of exchange rate changes on cash and cash equivalents |
(1,088 | ) | — | — | — | (1,088 | ) | |||||||||||||
| Net (decrease) increase in cash and cash equivalents |
(1,551 | ) | (1,832 | ) | 89 | — | (3,294 | ) | ||||||||||||
| Cash and cash equivalents at beginning of year |
3,487 | 22,801 | 108 | — | 26,396 | |||||||||||||||
| Cash and cash equivalents at end of year |
$ | 1,936 | $ | 20,969 | $ | 197 | $ | — | $ | 23,102 | ||||||||||
92
Table of Contents
ELIZABETH ARDEN, INC. AND SUBSIDIARIES
NOTES TO CONSOLIDATED FINANCIAL STATEMENTS—(Continued)
Statement of Cash Flows
| Year Ended June 30, 2008 | ||||||||||||||||||||
| Company | Non Guarantors |
7
3/4% Senior Subordinated Notes Guarantors |
Eliminations | Total | ||||||||||||||||
| Operating activities: |
||||||||||||||||||||
| Net cash (used in) provided by operating activities |
$ | (10,187 | ) | $ | 26,382 | $ | (7,059 | ) | $ | (1,099 | ) | $ | 8,037 | |||||||
| Investing activities: |
||||||||||||||||||||
| Additions to property and equipment |
(15,355 | ) | (6,800 | ) | — | — | (22,155 | ) | ||||||||||||
| Acquisition of licenses and other assets |
(6,433 | ) | — | — | — | (6,433 | ) | |||||||||||||
| Net cash used in investing activities |
(21,788 | ) | (6,800 | ) | — | — | (28,588 | ) | ||||||||||||
| Financing activities: |
||||||||||||||||||||
| Proceeds from short-term debt |
21,360 | — | — | — | 21,360 | |||||||||||||||
| Payments on long-term debt |
(1,227 | ) | — | — | — | (1,227 | ) | |||||||||||||
| Repurchase of common stock |
(7,439 | ) | — | — | — | (7,439 | ) | |||||||||||||
| Proceeds from the exercise of stock options |
2,378 | — | — | — | 2,378 | |||||||||||||||
| Proceeds from the issuance of common stock under ESPP |
1,719 | — | — | — | 1,719 | |||||||||||||||
| Net change in intercompany obligations |
11,524 | (19,782 | ) | 7,159 | 1,099 | — | ||||||||||||||
| Net cash provided by (used in) financing activities |
28,315 | (19,782 | ) | 7,159 | 1,099 | 16,791 | ||||||||||||||
| Effect of exchange rate changes on cash and cash equivalents |
(131 | ) | — | — | — | (131 | ) | |||||||||||||
| Net (decrease) increase in cash and cash equivalents |
(3,791 | ) | (200 | ) | 100 | — | (3,891 | ) | ||||||||||||
| Cash and cash equivalents at beginning of year |
7,278 | 23,001 | 8 | — | 30,287 | |||||||||||||||
| Cash and cash equivalents at end of year |
$ | 3,487 | $ | 22,801 | $ | 108 | $ | — | $ | 26,396 | ||||||||||
NOTE 19. Segment Data and Related Information
Reportable operating segments, as defined by Codification Topic 280, Segment Reporting, include components of an enterprise about which separate financial information is available that is evaluated regularly by the chief operating decision maker (the “Chief Executive”) in deciding how to allocate resources and in assessing performance. As a result of the similarities in the procurement, marketing and distribution processes for all of the Company’s products, much of the information provided in the consolidated financial statements is similar to, or the same as, that reviewed on a regular basis by the Chief Executive.
93
Table of Contents
ELIZABETH ARDEN, INC. AND SUBSIDIARIES
NOTES TO CONSOLIDATED FINANCIAL STATEMENTS—(Continued)
At June 30, 2010, our operations were organized into the following reportable segments:
| • | North America Fragrance — The North America Fragrance segment sells the Company’s portfolio of owned, licensed and distributed fragrances to department stores, mass retailers and distributors in the United States, Canada and Puerto Rico. This segment also sells the Company’s Elizabeth Arden products in prestige department stores in Canada and Puerto Rico and to other selected retailers. This segment also includes the Company’s direct to consumer business which is comprised of its Elizabeth Arden branded retail stores and global e-commerce business. |
| • | International — The International segment sells the Company’s portfolio of owned and licensed brands, including the Elizabeth Arden products, in approximately 100 countries outside of North America through perfumeries, boutiques, department stores and travel retail outlets worldwide. |
| • | Other — The Other reportable segment sells the Company’s Elizabeth Arden products in prestige department stores in the United States and through the Red Door beauty salons, which are owned and operated by an unrelated third party that licenses the Elizabeth Arden and Red Door trademarks from the Company for use in its salons. |
Commencing July 1, 2010, our operations were reorganized into two reportable segments, North America and International. The portion of the Company’s business operations that sells Elizabeth Arden products in prestige department stores in the United States and through the Red Door beauty salons has been consolidated with the North America Fragrance segment to create the North America segment.
The Chief Executive evaluates segment profit based upon operating income, which represents earnings before income taxes, interest expense and depreciation and amortization charges. The accounting policies for each of the reportable segments are the same as those described in Note 1— “General Information and Summary of Significant Accounting Policies.” The assets and liabilities of the Company are managed centrally and are reported internally in the same manner as the consolidated financial statements; thus, no additional information regarding assets and liabilities of the Company’s reportable segments is produced for the Chief Executive or included herein.
Segment profit (loss) excludes depreciation and amortization, interest expense, debt extinguishment charges, consolidation and elimination adjustments and unallocated corporate expenses, which are shown in the table below reconciling segment profit (loss) to consolidated net income (loss) before income taxes. Included in unallocated corporate expenses are (i) employee incentive costs, (ii) restructuring charges, (iii) costs related to the Initiative, and (iv) costs related to the Liz Claiborne license agreement. These expenses are recorded in unallocated corporate expenses as these items are centrally directed and controlled and are not included in internal measures of segment operating performance. The Company does not have any intersegment sales.
94
Table of Contents
ELIZABETH ARDEN, INC. AND SUBSIDIARIES
NOTES TO CONSOLIDATED FINANCIAL STATEMENTS—(Continued)
The following table is a comparative summary of the Company’s net sales and segment profit by reportable segment for the fiscal years ending June 30, 2010, 2009 and 2008.
| Year Ended June 30, | ||||||||||||
| (Amounts in thousands) | 2010 | 2009 | 2008 | |||||||||
| Segment Net Sales: |
||||||||||||
| North America Fragrance |
$ | 672,990 | $ | 662,235 | $ | 688,807 | ||||||
| International |
384,447 | 366,361 | 400,689 | |||||||||
| Other |
46,340 | 41,629 | 54,799 | |||||||||
| Total |
$ | 1,103,777 | $ | 1,070,225 | $ | 1,144,295 | ||||||
| Reconciliation: |
||||||||||||
| Segment Net Sales |
$ | 1,103,777 | $ | 1,070,225 | $ | 1,144,295 | ||||||
| Less: |
||||||||||||
| Unallocated Sales Allowances |
— | — | 3,220 | (5) | ||||||||
| Net Sales |
$ | 1,103,777 | $ | 1,070,225 | $ | 1,141,075 | ||||||
| Segment Profit: |
||||||||||||
| North America Fragrance |
$ | 114,474 | $ | 107,289 | $ | 116,855 | ||||||
| International |
17,250 | (2,232 | ) | 16,997 | ||||||||
| Other |
(2,802 | ) | (10,688 | ) | (3,450 | ) | ||||||
| Total |
$ | 128,922 | $ | 94,369 | $ | 130,402 | ||||||
| Reconciliation: |
||||||||||||
| Segment Profit |
$ | 128,922 | $ | 94,369 | $ | 130,402 | ||||||
| Less: |
||||||||||||
| Depreciation and Amortization |
28,459 | 26,158 | 24,768 | |||||||||
| Interest Expense |
21,885 | 24,814 | 27,595 | |||||||||
| Consolidation and Elimination Adjustments |
23,103 | (1) | 16,469 | 15,141 | ||||||||
| Unallocated Corporate Expenses(2) |
32,649 | (3) | 41,407 | (4) | 41,463 | (5) | ||||||
| Income (Loss) Before Income Taxes |
$ | 22,826 | $ | (14,479 | ) | $ | 21,435 | |||||
| (1) | Amounts shown for the year ended June 30, 2010 include $5.5 million related to lower than normal pricing charged to the North America Fragrance segment for certain sales of inventory by that segment that were undertaken at the direction of corporate, rather than segment, management. |
| (2) | Unallocated corporate expenses include (i) employee incentive costs, (ii) restructuring charges, (iii) costs related to the Initiative, and (iv) costs related to the Liz Claiborne license agreement. Excluding items addressed in footnotes (3) through (5) below, unallocated corporate expenses for the year ended June 30, 2010 increased as compared to June 30, 2009 and 2008 primarily due to higher incentive compensation costs. |
| (3) | Amounts for the year ended June 30, 2010, include (i) $1.9 million of restructuring expenses related to the Initiative, (ii) $1.5 million of restructuring expenses not related to the Initiative, (iii) $3.9 million of expenses related to the implementation of an Oracle accounting and order processing system, and (iv) $0.1 million of debt extinguishment costs. |
| (4) | In May 2008, we entered into an exclusive long-term global licensing agreement for the Liz Claiborne fragrance brands, which became effective on June 9, 2008. Amounts shown for the year ended June 30, 2009 include (i) $23.3 million of expenses ($18.9 million of which did not require the use of cash) related to our Liz Claiborne license agreement due to Liz Claiborne inventory that was purchased at a higher cost prior to the June 2008 effective date of the license agreement and transition expenses, (ii) $3.5 million of restructuring expenses related to the |
95
Table of Contents
ELIZABETH ARDEN, INC. AND SUBSIDIARIES
NOTES TO CONSOLIDATED FINANCIAL STATEMENTS—(Continued)
| Initiative, (iii) $1.1 million of restructuring expenses not related to the Initiative, and (iv) $3.4 million of expenses related to the implementation of our Oracle accounting and order processing systems. |
| (5) | Amounts shown for the year ended June 30, 2008, include (i) $27.0 million of expenses, including unallocated sales allowances and product discontinuation charges related to the Liz Claiborne license agreement, (ii) $0.7 million of restructuring expenses related to the Initiative, and (iii) $2.3 million of restructuring expenses not related to the Initiative. |
During the year ended June 30, 2010, the Company sold its products in approximately 100 countries outside the United States through its international affiliates and subsidiaries with operations headquartered in Geneva, Switzerland, and through third party distributors. The Company’s international operations are subject to certain risks, including political instability in certain regions of the world and diseases or other factors affecting customer purchasing patterns, economic and political consequences of terrorist attacks or the threat of such attacks and fluctuations in foreign exchange rates that could adversely affect its results of operations. See Item 1A — “Risk Factors.” The value of international assets is affected by fluctuations in foreign currency exchange rates. For a discussion of foreign currency translation, see Note 1.
The Company’s consolidated net sales by principal geographic areas and principal classes of products are summarized as follows:
| Year Ended June 30, | |||||||||
| (Amounts in thousands) | 2010 | 2009 | 2008 | ||||||
| Net sales: |
|||||||||
| United States |
$ | 670,321 | $ | 652,741 | $ | 685,351 | |||
| United Kingdom |
70,257 | 73,560 | 85,710 | ||||||
| Foreign (other than United Kingdom) |
363,199 | 343,924 | 370,014 | ||||||
| Total |
$ | 1,103,777 | $ | 1,070,225 | $ | 1,141,075 | |||
| Classes of similar products (net sales): |
|||||||||
| Fragrance |
$ | 854,000 | $ | 835,344 | $ | 845,394 | |||
| Skin care |
182,996 | 175,167 | 217,628 | ||||||
| Cosmetics |
66,781 | 59,714 | 78,053 | ||||||
| Total |
$ | 1,103,777 | $ | 1,070,225 | $ | 1,141,075 | |||
Information concerning consolidated long-lived assets for the U.S. and foreign operations is as follows:
| June 30, | ||||||
| (Amounts in thousands) | 2010 | 2009 | ||||
| Long-lived assets |
||||||
| United States(1) |
$ | 247,780 | $ | 243,766 | ||
|
Foreign(2) |
29,301 | 27,719 | ||||
| Total |
$ | 277,081 | $ | 271,485 | ||
| (1) | Primarily exclusive brand licenses, trademarks and intangibles, net, and property and equipment, net. |
| (2) | Primarily property and equipment, net. |
96
Table of Contents
| ITEM 9. | CHANGES IN AND DISAGREEMENTS WITH ACCOUNTANTS ON ACCOUNTING AND FINANCIAL DISCLOSURE |
None.
ITEM 9A. CONTROLS AND PROCEDURES
Our Chairman, President and Chief Executive Officer, and our Executive Vice President and Chief Financial Officer, who are the principal executive officer and principal financial officer, respectively, have evaluated the effectiveness and operation of our disclosure controls and procedures (as defined in Rules 13a-15(e) and 15d-15(e) of the Securities Exchange Act of 1934, as amended), as of the end of the period covered by this quarterly report (the “Evaluation Date”). Based upon such evaluation, they have concluded that, as of the Evaluation Date, our disclosure controls and procedures are functioning effectively.
We completed the first phase of the implementation of an Oracle financial accounting system (general ledger and accounts payable) in July 2009, and we completed the remaining portion of the financial accounting system as well as an order processing system in April 2010. Both phases of this significant project were completed in accordance with our projected timeline and on budget. As part of this implementation, we also migrated to a shared services model for our primary global transaction processing functions. As a result of these activities, internal controls related to user security, account structure and hierarchy, system reporting and approval procedures have been modified and redesigned to conform with and support the new financial accounting and order processing system and the new shared services model. Management’s review and evaluation of the design of key controls in the new Oracle financial accounting system and order processing system and the accuracy of the data conversion that took place during the implementation did not uncover a control deficiency or combination of control deficiencies that management believes meets the definition of a material weakness in internal control over financial reporting.
There have been no other changes in our internal control over financial reporting during our most recent fiscal quarter that have materially affected, or are likely to materially affect, our internal control over financial reporting.
Management’s report on our internal control over financial reporting (as such term is defined in Rules 13a-15(f) and 15d-15(f) under the Exchange Act), is included in our Financial Statements in Item 8 under the heading Report of Management — Report on Internal Control Over Financial Reporting and is hereby incorporated by reference. The related report of our independent registered public accounting firm is also included in our Financial Statements in Item 8 under the heading Report of Independent Registered Public Accounting Firm.
None.
PART III
ITEM 10. DIRECTORS, EXECUTIVE OFFICERS AND CORPORATE GOVERNANCE
We have adopted a Supplemental Code of Ethics for the Directors and Executive and Finance Officers that applies to our directors, our chief executive officer, our chief financial officer, and our other executive officers and finance officers. The full text of this Code of Ethics, as approved by our board of directors, is published on our website, at www.elizabetharden.com, under the section “Corporate Info — Investor Relations — Corporate Governance — Code of Ethics.” We intend to disclose future amendments to and waivers of the provisions of this Code of Ethics on our website.
97
Table of Contents
The other information required by this item will be contained in the Company’s Proxy Statement relating to the 2010 Annual Meeting of Shareholders to be filed within 120 days after the end of our fiscal year ended June 30, 2010 (the proxy statement) and is incorporated herein by this reference or is included in Part I under “Executive Officers of the Company.”
ITEM 11. EXECUTIVE COMPENSATION
The information required by this item will be contained in the proxy statement and is incorporated herein by this reference.
| ITEM 12. | SECURITY OWNERSHIP OF CERTAIN BENEFICIAL OWNERS AND MANAGEMENT AND RELATED STOCKHOLDER MATTERS |
The information required by this item will be contained in the proxy statement and is incorporated herein by this reference.
| ITEM 13. | CERTAIN RELATIONSHIPS AND RELATED TRANSACTIONS, AND DIRECTOR INDEPENDENCE |
The information required by this item will be contained in the proxy statement and is incorporated herein by this reference.
ITEM 14. PRINCIPAL ACCOUNTING FEES AND SERVICES
The information required by this item will be contained in the proxy statement and is incorporated herein by this reference.
PART IV
ITEM 15 EXHIBITS, FINANCIAL STATEMENT SCHEDULES
| (a) |
1. | Financial Statements — The consolidated financial statements, Report of Management and Report of Independent Registered Public Accounting Firm are listed in the “Index to Financial Statements and Schedules” on page 50 and included on pages 51 through 58. | ||
| 2. | Financial Statement Schedules — All schedules for which provision is made in the applicable accounting regulations of the Securities and Exchange Commission (the “Commission”) are either not required under the related instructions, are not applicable (and therefore have been omitted), or the required disclosures are contained in the financial statements included herein. | |||
| 3. | Exhibits (including those incorporated by reference). | |||
| Exhibit |
Description | |
| 3.1 | Amended and Restated Articles of Incorporation of the Company dated November 17, 2005 (incorporated herein by reference to Exhibit 3.1 filed as part of the Company’s Form 10-Q for the quarter ended December 31, 2005 (Commission File No. 1-6370)). | |
| 3.2 | Amended and Restated By-laws of the Company (incorporated herein by reference to Exhibit 3.1 filed as part of the Company’s Form 8-K dated October 27, 2009 (Commission File No. 1-6370)). | |
98
Table of Contents
| Exhibit |
Description | |
| 4.1 | Indenture dated as of January 13, 2004, among the Company and FD Management, Inc., DF Enterprises, Inc., Elizabeth Arden International Holding, Inc., RDEN Management, Inc., Elizabeth Arden (Financing), Inc., Elizabeth Arden Travel Retail, Inc., as guarantors, and HSBC Bank USA, as trustee (incorporated herein by reference to Exhibit 4.3 to the Company’s Form 10-K for the year ended January 31, 2004 (Commission File No. 1-6370)). | |
| 10.1 | Second Amended and Restated Credit Agreement dated as of December 24, 2002 among the Company, JPMorgan Chase Bank, as administrative agent, Fleet National Bank, as collateral agent, and the banks listed on the signature pages thereto (incorporated herein by reference to Exhibit 4.1 filed as part of the Company’s Form 8-K dated December 30, 2002 (Commission File No. 1-6370)). | |
| 10.2 | First Amendment to Second Amended and Restated Credit Agreement dated as of February 25, 2004, among the Company, JPMorgan Chase Bank, as administrative agent, Fleet National Bank, as collateral agent, and the banks listed on the signature pages thereto (incorporated herein by reference to Exhibit 4.5 filed as part of the Company’s Form 10-K for the year ended January 31, 2004 (Commission File No. 1-6370)). | |
| 10.3 | Second Amendment to Second Amended and Restated Credit Agreement dated as of June 2, 2004, among the Company, JPMorgan Chase Bank, as administrative agent, Fleet National Bank, as collateral agent, and the banks listed on the signature pages thereto (incorporated herein by reference to Exhibit 4.6 to the Company’s Form 10-Q for the quarter ended May 1, 2004 (Commission File No. 1-6370)). | |
| 10.4 | Third Amendment to Second Amended and Restated Credit Agreement dated as of September 30, 2004, among the Company, JPMorgan Chase Bank, as administrative agent, Fleet National Bank, as collateral agent, and the banks listed on the signature pages thereto (incorporated herein by reference to Exhibit 4.1 filed as part of the Company’s Form 8-K dated October 1, 2004 (Commission File No. 1-6370)). | |
| 10.5 | Fourth Amendment to Second Amended and Restated Credit Agreement dated as of November 2, 2005, among the Company, JPMorgan Chase Bank, as administrative agent, Bank of America, N. A. (successor in interest by merger to Fleet National Bank), as the collateral agent, and the banks listed on the signature pages thereto (incorporated herein by reference to Exhibit 4.8 filed as part of the Company’s Form 10-Q for the quarter ended September 30, 2005 (Commission File No. 1-6370)). | |
| 10.6 | Fifth Amendment to Second Amended and Restated Credit Agreement dated as of August 11, 2006, among the Company, JPMorgan Chase Bank, as administrative agent, Bank of America, N. A. (successor in interest by merger to Fleet National Bank), as the collateral agent, and the banks listed on the signature pages thereto (incorporated herein by reference to Exhibit 4.7 filed as part of the Company’s Form 10-K for the year ended June 30, 2006 (Commission File No.1-6370)). | |
| 10.7 | Sixth Amendment to Second Amended and Restated Credit Agreement dated as of August 15, 2007, among the Company, JPMorgan Chase Bank, as administrative agent, Bank of America, N. A. (successor in interest by merger to Fleet National Bank), as the collateral agent, and the banks listed on the signature pages thereto (incorporated herein by reference to Exhibit 10.7 filed as part of the Company’s Form 10-K for the year ended June 30, 2007 (Commission File No. 1-6370)). | |
99
Table of Contents
| Exhibit |
Description | |
| 10.8 | Seventh Amendment to Second Amended and Restated Credit Agreement dated as of November 13, 2007, among the Company, JPMorgan Chase Bank, as administrative agent, Bank of America, N. A. (successor in interest by merger to Fleet National Bank), as the collateral agent, and the banks listed on the signature pages thereto (incorporated herein by reference to Exhibit 10.8 filed as part of the Company’s Form 10-Q for the quarter ended December 31, 2007 (Commission File No. 1-6370)). | |
| 10.9 | Eighth Amendment to Second Amended and Restated Credit Agreement dated as of July 21, 2008, among the Company, JPMorgan Chase Bank, as administrative agent, Bank of America, N. A. (successor in interest by merger to Fleet National Bank), as the collateral agent, and the banks listed on the signature pages thereto (incorporated herein by reference to Exhibit 10.1 filed as part of the Company’s Form 8-K dated July 21, 2008 (Commission File No. 1-6370)). | |
| 10.10 | Exhibits to the Second Amended and Restated Credit Agreement dated as of December 24, 2002, among the Company, JPMorgan Chase Bank, as administrative agent, Bank of America, N. A. (successor in interest by merger to Fleet National Bank), as the collateral agent, and the banks listed on the signature pages thereto, as amended through the Eighth Amendment thereto dated as of July 21, 2008. Portions of this exhibit have been omitted pursuant to a request for confidential treatment (incorporated herein by reference to Exhibit 10.10 filed as part of the Company’s Form 10-Q for the quarter ended December 31, 2009 (Commission File No. 1-6370)). | |
| 10.11 | Amended and Restated Security Agreement dated as of January 29, 2001, made by the Company and certain of its subsidiaries in favor of Fleet National Bank, as administrative agent (incorporated herein by reference to Exhibit 4.5 filed as part of the Company’s Form 8-K dated January 23, 2001 (Commission File No. 1-6370)). | |
| 10.12 | Amended and Restated Deed of Lease dated as of January 17, 2003, between the Company and Liberty Property Limited Partnership (incorporated herein by referenced to Exhibit 10.5 filed as a part of the Company’s Form 10-Q for the quarter ended April 26, 2003 (Commission File No. 1-6370)). | |
| 10.13+ | 2004 Stock Incentive Plan, as amended and restated (incorporated herein by reference to Exhibit 10.12 filed as part of the Company’s Form 10-Q for the quarter ended December 31, 2007 (Commission File No. 1-6370)). | |
| 10.14+ | 2004 Non-Employee Director Stock Option Plan, as amended (incorporated herein by reference to Exhibit 10.2 filed as part of the Company’s Form 10-Q for the quarter ended September 30, 2006 (Commission File No. 1-6370)). | |
| 10.15+ | 2000 Stock Incentive Plan, as amended (incorporated herein by reference to Exhibit 10.14 filed as part of the Company’s Form 10-Q for the quarter ended December 31, 2007 (Commission File No. 1-6370)). | |
| 10.16+ | 1995 Stock Option Plan, as amended (incorporated herein by reference to Exhibit 10.4 filed as part of the Company’s Form 10-Q for the quarter ended September 30, 2006 (Commission File No. 1-6370)). | |
| 10.17+ | Amended 2002 Employee Stock Purchase Plan (incorporated herein by reference to Exhibit 10.17 filed as part of the Company’s Form 10-Q for the quarter ended December 31, 2009 (Commission File No. 1-6370)). | |
| 10.18+ | Non-Employee Director Stock Option Plan, as amended (incorporated herein by reference to Exhibit 10.6 filed as part of the Company’s Form 10-Q for the quarter ended September 30, 2006 (Commission File No. 1-6370)). | |
100
Table of Contents
| Exhibit |
Description | |
| 10.19+ | Form of Nonqualified Stock Option Agreement for stock option awards under the Company’s Non-Employee Director Stock Option Plan (incorporated herein by reference to Exhibit 10.8 filed as a part of the Company’s Form 10-Q for the quarter ended March 31, 2005 (Commission File No. 1-6370)). | |
| 10.20+ | Form of Incentive Stock Option Agreement for stock option awards under the Company’s 1995 Stock Option Plan (incorporated herein by reference to Exhibit 10.9 filed as a part of the Company’s Form 10-Q for the quarter ended March 31, 2005 (Commission File No. 1-6370)). | |
| 10.21+ | Form of Nonqualified Stock Option Agreement for stock option awards under the Company’s 1995 Stock Option Plan (incorporated herein by reference to Exhibit 10.10 filed as a part of the Company’s Form 10-Q for the quarter ended March 31, 2005 (Commission File No. 1-6370)). | |
| 10.22+ | Form of Stock Option Agreement for stock option awards under the Company’s 2000 Stock Incentive Plan (incorporated herein by reference to Exhibit 10.11 filed as a part of the Company’s Form 10-Q for the quarter ended March 31, 2005 (Commission File No. 1-6370)). | |
| 10.23+ | Form of Restricted Stock Agreement for service-based restricted stock awards (one-year vesting) under the Company’s 2000 Stock Incentive Plan (incorporated herein by reference to Exhibit 10.12 filed as a part of the Company’s Form 10-Q for the quarter ended March 31, 2005 (Commission File No. 1-6370)). | |
| 10.24+ | Form of Restricted Stock Agreement for the performance-based restricted stock awards under the Company’s 2000 Stock Incentive Plan (incorporated herein by reference to Exhibit 10.13 filed as a part of the Company’s Form 10-Q for the quarter ended March 31, 2005 (Commission File No. 1-6370)). | |
| 10.25+ | Form of Stock Option Agreement for stock option awards under the Company’s 2004 Non-Employee Director Stock Option Plan (incorporated herein by reference to Exhibit 10.14 filed as a part of the Company’s Form 10-Q for the quarter ended March 31, 2005 (Commission File No. 1-6370)). | |
| 10.26+ | Form of Restricted Stock Agreement for the market-based restricted stock awards under the Company’s 2004 Stock Incentive Plan (incorporated herein by reference to Exhibit 10.15 filed as a part of the Company’s Form 10-Q for the quarter ended March 31, 2005 (Commission File No. 1-6370)). | |
| 10.27+ | Form of Stock Option Agreement for stock option awards under the Company’s 2004 Stock Incentive Plan (incorporated herein by reference to Exhibit 10.19 filed as a part of the Company’s Form 10-K for the year ended June 30, 2005 (Commission File No. 1-6370)). | |
| 10.28+ | Form of Restricted Stock Agreement for the restricted stock awards under the Company’s 2004 Stock Incentive Plan (incorporated herein by reference to Exhibit 10.20 filed as a part of the Company’s Form 10-K for the year ended June 30, 2005 (Commission File No. 1-6370)). | |
| 10.29+ | 2005 Management Bonus Plan, as amended (incorporated herein by reference to Exhibit 10.28 filed as part of the Company’s Form 10-Q for the quarter ended December 31, 2007 (Commission File No. 1-6370)). | |
| 10.30+ | 2005 Performance Bonus Plan, as amended (incorporated herein by reference to Exhibit 10.29 filed as part of the Company’s Form 10-Q for the quarter ended December 31, 2007 (Commission File No. 1-6370)). | |
101
Table of Contents
| Exhibit |
Description | |
| 10.31+ | Elizabeth Arden, Inc. Severance Policy, as amended and restated on May 4, 2010 (incorporated herein by reference to Exhibit 10.31 filed as part of the Company’s Form 10-Q for the quarter ended March 31, 2010 (Commission File No. 1-6370)). | |
| 10.32+ | Form of Restricted Stock Agreement for service-based restricted stock awards (three-year vesting period) under the Company’s 2000 Stock Incentive Plan (incorporated herein by reference to Exhibit 10.32 filed as part of the Company’s Form 10-K for the year ended June 30, 2007 (Commission File No. 1-6370)). | |
| 10.33+ | Termination Agreement between Elizabeth Arden International S.à.r.l. and Jacobus A. J. Steffens dated November 5, 2008 (incorporated herein by reference to Exhibit 10.32 filed as part of the Company’s Form 10-Q for the quarter ended December 31, 2008 (Commission File No. 1-6370)). | |
| 10.34+ | Form of Indemnification Agreement for Directors and Officers of Elizabeth Arden, Inc. (incorporated by reference to Exhibit 10.1 filed as part of the Company’s Form 8-K dated August 11, 2009 (Commission File No. 1-6370)). | |
| 12.1* | Ratio of Earnings to Fixed Charges. | |
| 21.1* | Subsidiaries of the Registrant. | |
| 23.1* | Consent of PriceWaterhouse Coopers LLP. | |
| 24.1* | Power of Attorney (included as part of the signatures page). | |
| 31.1* | Section 302 Certification of Chief Executive Officer. | |
| 31.2* | Section 302 Certification of Chief Financial Officer. | |
| 32* | Section 906 Certifications of the Chief Executive Officer and the Chief Financial Officer. | |
| + | Management contract or compensatory plan or arrangement. |
| * | Filed herewith. |
102
Table of Contents
Pursuant to the requirements of Section 13 or 15(d) of the Securities Exchange Act of 1934, the registrant has duly caused this report to be signed on its behalf by the undersigned, thereunto duly authorized, as of the 17th day of August 2010.
| ELIZABETH ARDEN, INC. | ||
| By: |
/s/ E. SCOTT BEATTIE | |
| E. Scott Beattie Chairman, President, Chief Executive Officer and Director (Principal Executive Officer) | ||
We, the undersigned directors and officers of Elizabeth Arden, Inc., hereby severally constitute E. Scott Beattie and Stephen J. Smith, and each of them singly, our true and lawful attorneys with full power to them and each of them to sign for us, in our names in the capacities indicated below, any and all amendments to this Annual Report on Form 10-K filed with the Securities and Exchange Commission.
Pursuant to the requirements of the Securities Exchange Act of 1934, this report has been signed by the following persons on behalf of the registrant and in the capacities and on the dates indicated.
| Signature |
Title |
Date | ||
| /s/ E. SCOTT BEATTIE E. Scott Beattie |
Chairman, President and Chief Executive Officer and Director (Principal Executive Officer) |
August 17, 2010 | ||
| /s/ STEPHEN J. SMITH Stephen J. Smith |
Executive Vice President and Chief Financial Officer (Principal Financial and Accounting Officer) |
August 17, 2010 | ||
| /s/ FRED BERENS Fred Berens |
Director |
August 17, 2010 | ||
| /s/ MAURA J. CLARK Maura J. Clark |
Director |
August 17, 2010 | ||
| /s/ RICHARD C.W. MAURAN Richard C.W. Mauran |
Director |
August 17, 2010 | ||
| /s/ WILLIAM M. TATHAM William M. Tatham |
Director |
August 17, 2010 | ||
| /s/ J.W. NEVIL THOMAS J.W. Nevil Thomas |
Director |
August 17, 2010 | ||
| /s/ PAUL F. WEST Paul F. West |
Director |
August 17, 2010 | ||
103
Table of Contents
EXHIBIT INDEX
| Exhibit |
Description | |
| 12.1 | Ratio of earnings to fixed charges. | |
| 21.1 | Subsidiaries of the Registrant. | |
| 23.1 | Consent of PricewaterhouseCoopers LLP. | |
| 24.1 | Power of Attorney (included as part of signature page). | |
| 31.1 | Section 302 Certification of Chief Executive Officer. | |
| 31.2 | Section 302 Certification of Chief Financial Officer. | |
| 32 | Section 906 Certifications of the Chief Executive Officer and the Chief Financial Officer. | |