Attached files
| file | filename |
|---|---|
| EX-23.2(J) - CONSENT OF JAVIER G. TERUEL TO BE NAMED AS A DIRECTOR NOMINEE - Nielsen Holdings plc | dex232j.htm |
| EX-23.1 - CONSENT OF ERNST & YOUNG LLP - Nielsen Holdings plc | dex231.htm |
Table of Contents
As filed with the Securities and Exchange Commission on August 16, 2010
Registration No. 333-167271
UNITED STATES
SECURITIES AND EXCHANGE COMMISSION
Washington, D.C. 20549
Amendment No. 3
to
FORM S-1
REGISTRATION STATEMENT
UNDER
THE SECURITIES ACT OF 1933
NIELSEN HOLDINGS B.V.
(To be converted into Nielsen Holdings N.V.)
(Exact name of registrant as specified in its charter)
| The Netherlands | 7374 | 98-0662038 | ||
| (State or other jurisdiction of incorporation or organization) |
(Primary Standard Industrial Classification Code Number) |
(I.R.S. Employer Identification Number) |
James W. Cuminale, Esq.
Nielsen Holdings B.V.
770 Broadway
New York, New York 10003
(646) 654-5000
(Address, including zip code, and telephone number, including area code, of registrant’s principal executive offices)
| Joseph H. Kaufman, Esq. Simpson Thacher & Bartlett LLP 425 Lexington Avenue New York, New York 10017-3954 (212) 455-2000 |
William M. Hartnett, Esq. William J. Miller, Esq. Douglas S. Horowitz, Esq. Cahill Gordon & Reindel LLP 80 Pine Street New York, New York 10005 (212) 701-3000 |
Approximate date of commencement of proposed sale to the public: As soon as practicable after this Registration Statement is declared effective.
If any of the securities being registered on this Form are to be offered on a delayed or continuous basis pursuant to Rule 415 under the Securities Act of 1933, check the following box. ¨
If this Form is filed to register additional securities for an offering pursuant to Rule 462(b) under the Securities Act, please check the following box and list the Securities Act registration statement number of the earlier effective registration statement for the same offering. ¨
If this Form is a post-effective amendment filed pursuant to Rule 462(c) under the Securities Act, check the following box and list the Securities Act registration statement number of the earlier effective registration statement for the same offering. ¨
If this Form is a post-effective amendment filed pursuant to Rule 462(d) under the Securities Act, check the following box and list the Securities Act registration statement number of the earlier effective registration statement for the same offering. ¨
Indicate by check mark whether the registrant is a large accelerated filer, an accelerated filer, a non-accelerated filer, or a smaller reporting company. See the definitions of “large accelerated filer,” “accelerated filer” and “smaller reporting company” in Rule 12b-2 of the Exchange Act.
| Large accelerated filer | ¨ | Accelerated filer | ¨ | |||
| Non-accelerated filer | x (Do not check if a smaller reporting company) | Smaller reporting company | ¨ |
CALCULATION OF REGISTRATION FEE
| Title of Each Class of Securities to be Registered |
Proposed Maximum Aggregate Offering Price(1)(2) |
Amount of Registration Fee | ||||
| Common Stock, par value €0.04 per share |
$2,012,500,000 | $143,491(3) | ||||
| (1) | Includes shares to be sold upon exercise of the underwriters’ option. See “Underwriting.” |
| (2) | Estimated solely for the purpose of calculating the amount of the registration fee pursuant to Rule 457(o) under the Securities Act of 1933, as amended. |
| (3) | $124,775 of which was previously paid. |
The registrant hereby amends this Registration Statement on such date or dates as may be necessary to delay its effective date until the registrant shall file a further amendment which specifically states that this Registration Statement shall thereafter become effective in accordance with Section 8(a) of the Securities Act of 1933, as amended, or until the Registration Statement shall become effective on such date as the Securities and Exchange Commission, acting pursuant to said Section 8(a), may determine.
Table of Contents
The information in this preliminary prospectus is not complete and may be changed. We may not sell these securities until the registration statement filed with the Securities and Exchange Commission is effective. This preliminary prospectus is not an offer to sell these securities and we are not soliciting an offer to buy these securities in any jurisdiction where the offer or sale is not permitted.
Subject to Completion, dated August 16, 2010
Preliminary Prospectus
Shares

Common Stock
We are selling shares of our common stock. This is an initial public offering of our common stock. Prior to this offering, there has been no public market for our common stock. The initial public offering price is estimated to be between $ and $ per share. We have applied to have our common stock listed on the New York Stock Exchange under the symbol “NLSN.” We intend to use the anticipated net proceeds of this offering to repay certain of our existing indebtedness.
After the completion of this offering, the Sponsors (as defined herein) will continue to own a majority of the voting power of our outstanding common stock. As a result, we will be a “controlled company” within the meaning of the corporate governance standards of the New York Stock Exchange. See “Principal Stockholders.”
| Per Share |
Total | |||||
| Initial public offering price |
$ | $ | ||||
| Underwriting discount |
$ | $ | ||||
| Proceeds to us, before expenses |
$ | $ | ||||
We have granted the underwriters an option for a period of 30 days to purchase up to additional shares of common stock on the same terms and conditions set forth above to cover over-allotments, if any.
Investing in our common stock involves a high degree of risk. See “Risk Factors ” beginning on page 14.
Neither the Securities and Exchange Commission nor any state securities commission has approved or disapproved of these securities or passed upon the adequacy or accuracy of this prospectus. Any representation to the contrary is a criminal offense.
The underwriters expect to deliver the shares of common stock on , 2010.
| J.P. Morgan |
Morgan Stanley |
| Credit Suisse |
Deutsche Bank Securities | Goldman, Sachs & Co. | Citi | |||||
BofA Merrill Lynch
| William Blair & Company |
Guggenheim Securities | |
| RBS |
Wells Fargo Securities |
| Blaylock Robert Van, LLC | HSBC | Loop Capital Markets | ||
| Mizuho Securities USA Inc. | Ramirez & Co., Inc. | The Williams Capital Group, L.P. | ||
, 2010
Table of Contents

Table of Contents
| Page | ||
| 1 | ||
| 14 | ||
| 28 | ||
| 29 | ||
| 30 | ||
| 31 | ||
| 33 | ||
| 35 | ||
| Management’s Discussion and Analysis of Financial Condition and Results of Operations |
37 | |
| 84 | ||
| 95 | ||
| 96 | ||
| 105 | ||
| 128 | ||
| 133 | ||
| 137 | ||
| 143 | ||
| 152 | ||
| 154 | ||
| 161 | ||
| 168 | ||
| 168 | ||
| 169 | ||
| F-1 |
You should rely only on the information contained in this prospectus. We have not authorized anyone to provide you with information different from that contained in this prospectus. We are not making an offer to sell nor seeking offers to buy these securities in any jurisdiction where an offer or sale is not permitted. The information contained in this prospectus is accurate only as of the date of this prospectus, regardless of the time of delivery of this prospectus or of any sale of our common stock.
Nielsen® and our logo are registered trademarks of ours. This prospectus includes other registered and unregistered trademarks of ours. Other products, services and company names mentioned in this prospectus are the service marks/trademarks of their respective owners.
Until , 2010 (25 days after the date of this prospectus), all dealers that effect transactions in our common stock, whether or not participating in this offering, may be required to deliver a prospectus. This requirement is in addition to a dealer’s obligation to deliver a prospectus when acting as an underwriter and with respect to unsold allotments or subscriptions.
i
Table of Contents
This summary highlights significant aspects of our business and this offering, but it is not complete and does not contain all of the information that you should consider before making your investment decision. You should carefully read the entire prospectus, including the information presented under the section entitled “Risk Factors” and our audited consolidated financial statements, unaudited condensed consolidated financial statements and related notes included elsewhere in this prospectus, before making an investment decision. This summary contains forward-looking statements that involve risks and uncertainties. Our actual results may differ significantly from the results discussed in the forward-looking statements as a result of certain factors, including those set forth in “Risk Factors” and “Cautionary Statement Regarding Forward-Looking Statements.”
The terms “Company,” “Nielsen,” “we,” “our” or “us,” as used herein, refer to Nielsen Holdings B.V. and its affiliates prior to the Conversion (as defined below) and to Nielsen Holdings N.V. and its affiliates upon and after the Conversion, including, in each case, The Nielsen Company B.V., unless otherwise stated or indicated by context. The term “Nielsen Holdings,” as used herein, refers to Nielsen Holdings B.V. prior to the Conversion and to Nielsen Holdings N.V. after the Conversion, in each case, without including any of its affiliates, unless otherwise stated or indicated by context. The term “affiliates” means our direct and indirect subsidiaries and partnerships and joint ventures in which such subsidiaries are partners.
We evaluate our results of operations on both an as reported and a constant currency basis. The constant currency presentation is a non-GAAP financial measure, which excludes the impact of fluctuations in foreign currency exchange rates. We believe providing constant currency information provides valuable supplemental information regarding our results of operations, consistent with how we evaluate our performance. We calculate constant currency percentages by converting our prior-period local currency financial results using the current period foreign currency exchange rates and comparing these adjusted amounts to our current period reported results. This calculation may differ from similarly titled measures used by others and, accordingly, the constant currency presentation is not meant to be a substitution for recorded amounts presented in conformity with U.S. generally accepted accounting principles (“GAAP”) nor should such amounts be considered in isolation.
Our Company
We are a leading global information and measurement company that provides clients with a comprehensive understanding of consumers and consumer behavior. We deliver critical media and marketing information, analytics and industry expertise about what consumers watch (consumer interaction with television, online and mobile) and what consumers buy on a global and local basis. Our information, insights and solutions help our clients maintain and strengthen their market positions and identify opportunities for profitable growth. We have a presence in approximately 100 countries, including many developing and emerging markets, and hold leading market positions in many of our services and geographies. Based on the strength of the Nielsen brand, our scale and the breadth and depth of our solutions, we believe we are the global leader in measuring and analyzing consumer behavior in the segments in which we operate.
We help our clients enhance their interactions with consumers and make critical business decisions that we believe positively affect our clients’ sales. Our data and analytics solutions, which have been developed through substantial investment over many decades, are deeply embedded into our clients’ workflow as demonstrated by our long-term client relationships, multi-year contracts and high contract renewal rates. The average length of relationship with our top ten clients, which include The Coca-Cola Company, NBC Universal, Nestle S.A., News Corp., The Procter & Gamble Company and the Unilever Group, is more than 30 years. Typically, before the start of each year, nearly 70% of our annual revenue has been committed under contracts in our combined Watch and Buy segments.
We align our business into three reporting segments, the principal two of which are What Consumers Watch (media audience measurement and analytics) and What Consumers Buy (consumer purchasing measurement and
1
Table of Contents
analytics). Our Watch and Buy segments, which together generated 96% of our revenues in 2009, are built on an extensive foundation of proprietary data assets designed to yield essential insights for our clients to successfully measure, analyze and grow their businesses. The information from our Watch and Buy segments, when brought together, can deliver powerful insights into the effectiveness of advertising by linking media consumption trends with consumer purchasing data to better understand how media exposure drives purchase behavior. We believe these integrated insights will better enable our clients to enhance the return on investment of their advertising and marketing spending.
David Calhoun was appointed as our Chief Executive Officer in August 2006 following the purchase of our Company by a consortium of private equity firms on May 24, 2006. Mr. Calhoun and the management team have focused on building an open, simple and integrated operating model that drives innovation, delivers greater value to our clients and enhances the scalability of our global platform. We have made significant investments in expanding and optimizing our product portfolio and extending our technology platform to strengthen our analytics, measurement science and client delivery capabilities. We have also improved our operating efficiencies by streamlining our organizational structure and processes throughout the Company.
As a result of the May 2006 acquisition, we incurred a significant amount of indebtedness and have a net tangible book deficit ($8.4 billion and $8.8 billion, respectively, as of June 30, 2010). We also have generated net losses since that time ($489 million, $589 million and $354 million for the years ended December 31, 2009, 2008 and 2007, respectively). As a result of the initiatives made since the acquisition, certain of our financial performance metrics have improved significantly between the year ended December 31, 2006 and the year ended December 31, 2009:
| • | Revenues increased to $4.8 billion, generating a compound annual growth rate of 6.2% on an as reported basis and 5.7% on a constant currency basis; |
| • | Adjusted EBITDA increased to $1.3 billion, generating a compound annual growth rate of 14.3% on an as reported basis and 13.9% on a constant currency basis; and |
| • | Adjusted EBITDA as a percentage of revenue increased to 27.3% from 21.9%. |
See note 7 to “—Summary Financial and Other Data” for a definition of Adjusted EBITDA and a reconciliation of Adjusted EBITDA to net income.
Our Segments
Our Watch segment provides viewership data and analytics primarily to the media and advertising industries across television, online and mobile screens. According to ZenithOptimedia, a leading global media services agency, in 2008, total global spending on advertising across television, online and mobile platforms was at least $236 billion. Our Watch data is used by our media clients to understand their audiences, establish the value of their advertising inventory and maximize the value of their content, and by our advertising clients to plan and optimize their spending. Within our Watch segment, our ratings are the primary metrics used to determine the value of programming and advertising in the U.S. total television advertising marketplace, which was approximately $77 billion in 2008 according to a report by Veronis Suhler Stevenson. In addition to the United States, we measure television viewing in 29 countries. We also measure markets that account for approximately 80% of global internet users and offer mobile measurement services in 10 countries, including the United States, where we are the market leader. Watch represented 34% of our total revenues in 2009.
Our Buy segment provides retail transactional measurement data, consumer behavior information and analytics primarily to businesses in the consumer packaged goods industry. According to Euromonitor International, global consumer spending in the product categories we measure was over $7.1 trillion in 2008. Our
2
Table of Contents
extensive database of retail and consumer information, combined with our advanced analytical capabilities, helps generate strategic insights that influence our clients’ key business decisions. We track billions of sales transactions per month in retail outlets in approximately 100 countries around the world and our data is used by our clients to measure their sales and market share. We are the only company offering such extensive global coverage for the collection, provision and analysis of this information for consumer packaged goods. Our Buy products and services also enable our clients to better manage their brands, uncover new sources of demand, launch and grow new products, analyze their sales, improve their marketing mix and establish more effective consumer relationships. Buy represented 62% of our total revenues in 2009.
Our Expositions segment operates one of the largest portfolios of business-to-business trade shows in the United States. Each year, we produce approximately 40 trade shows, which in 2009 connected approximately 270,000 buyers and sellers across 20 industries. Expositions represented 4% of our total revenue in 2009.
The Nielsen Opportunity
We believe companies, including our clients, require an increasing amount of data and analytics to set strategy and direct operations. This has resulted in a large market for business information and insight which we believe will continue to grow. Our clients are media, advertising and consumer packaged goods companies in the large and growing markets described above. We believe that significant economic, technological, demographic and competitive trends facing consumers and our clients will provide a competitive advantage to our business and enable us to capture a greater share of our significant market opportunity.
Developing markets present significant expansion opportunities. Brand marketers are focused on attracting new consumers in developing countries as a result of the fast-paced population growth of the middle class in these regions. In addition, the retail trade in these markets is quickly evolving from small, local formats toward larger, more modern formats with electronic points of sale, a similar evolution to what occurred in developed markets over the last several decades. We provide established measurement methodologies to help give consumer packaged goods companies, retailers and media companies an accurate understanding of local consumers to allow them to harness growing consumer buying power in fast growing markets like Brazil, Russia, India and China.
The media landscape is dynamic and changing. Consumers are rapidly changing their media consumption patterns. The growing availability of the internet, and the proliferation of new formats and channels such as mobile devices, social networks and other forms of user-generated media have led to an increasingly fragmented consumer base that is more difficult to measure and analyze. In addition, simultaneous usage of more than one screen is becoming a regular aspect of daily consumer media consumption. We have effectively measured and tracked media consumption through numerous cycles in the industry’s evolution—from broadcast to cable, from analog to digital, from offline to online and from live to time-shifted. We believe our distinct ability to provide metrics across television, online and mobile platforms helps our clients better understand, adapt to and profit from the continued transformation of the global media landscape.
Increasing amounts of consumer information are leading to new marketing approaches. The advent of the internet and other digital platforms has created rapid growth in consumer data that is expected to intensify as more entertainment and commerce are delivered across these platforms. As a result, companies are looking for real-time access to more granular levels of data to understand growth opportunities more quickly and more precisely. This presents a significant opportunity for us to work with companies to effectively manage, integrate and analyze large amounts of information and extract meaningful insights that allow marketers to generate profitable growth.
Consumers are more connected, informed and in control. Today, more than three-quarters of the world’s homes have access to television, there are more than 1.8 billion internet users around the globe, and there are
3
Table of Contents
two-thirds as many mobile phones in the world as people. Advances in technology have given consumers a greater level of control of when, where and how they consume information and interact with media and brands. They can compare products and prices instantaneously and have new avenues to learn about, engage with and purchase products and services. These shifts in behavior create significant complexities for our clients. Our broad portfolio of information and insights enables our clients to engage consumers with more impact and efficiency, influence consumer purchasing decisions and actively participate in and shape conversations about their brands.
Demographic shifts and changes in spending behavior are altering the consumer landscape. Consumer demographics and related trends are constantly evolving globally, leading to changes in consumer preferences and the relative size and buying power of major consumer groups. Shifts in population size, age, racial composition, family size and relative wealth are causing marketers to continuously re-evaluate and reprioritize their consumer marketing strategies. We track and interpret consumer demographics that help enable our clients to engage more effectively with their existing consumers as well as forge new relationships with emerging segments of the population.
Consumers are looking for greater value. Economic and social trends have spurred consumers to seek greater value in what they buy as exemplified by the rising demand for “private label” (store branded) products. For instance, in the United States, the absolute dollar share for private label consumer packaged goods increased more than $10 billion over the last two years. This increased focus on value is causing manufacturers, retailers and media companies to re-evaluate brand positioning, pricing and loyalty. We believe companies will increasingly look to our broad range of consumer purchasing insights and analytics to more precisely and effectively measure consumer behavior and target their products and marketing offers at the right place and at the right price.
Our Competitive Advantages
Our key competitive advantages include:
Global Scale and Brand. For nearly 90 years, we have advanced the practice of market research and media audience measurement to provide our clients with a better understanding of their consumer. We provide a breadth of information and insights about the consumer in approximately 100 countries. We believe our global footprint, neutrality, credibility and leading market positions will continue to contribute to our long-term growth and strong operating margins as the number and role of multinational companies expands. Our scale is supported by our global brand, which is defined by the original Nielsen code created by our founder, Arthur C. Nielsen, Sr.: impartiality, thoroughness, accuracy, integrity, economy, price, delivery and service.
Strong, Diversified Client Relationships. Many of the world’s largest brands rely on us as their information and analytics provider to create value for their business. We maintain long-standing relationships across multiple industries, including consumer packaged goods, broadcast and cable television, advertising, online media, telecommunications, retail and automotive. We have more than 20,000 clients across our Watch and Buy segments, with no single client accounting for more than 4% of our total 2009 revenues. In addition, due to our growing presence in developing markets, we have cultivated strong relationships with local market leaders that can benefit from our services as they expand globally. The depth of our client relationships provides a foundation for recurring revenues as well as a platform for growth.
Enhanced Data Assets and Measurement Science. Our extensive portfolio of transactional and consumer behavioral data across our Watch and Buy segments enables us to provide critical information to our clients. Much of the information we provide is not available from any other source and would be difficult and costly for another party to replicate. For decades, we have employed advanced measurement methodologies that yield statistically accurate information about consumer behavior while having due regard for their privacy. We believe that our expertise, established standards and increasingly granular and comprehensive data assets provide us with a distinct advantage as we deliver more precise insights to our clients.
4
Table of Contents
Innovation. We have consistently focused on innovation to deepen our capabilities, expand in new and emerging forms of measurement, enhance our analytical offerings and capitalize on industry trends. We are continuously developing advanced delivery technologies that allow us to maximize the full suite of our data assets for our clients as evidenced by our new delivery platform, Nielsen Answers, which brings a broad portfolio of our data and information to a single client desktop.
Scalable Operating Model. Our global presence and operating model allow us to scale our services and solutions rapidly and efficiently. We have a long track record of establishing leading products that can be quickly expanded across clients, markets and geographies. Our global operations and technology organization enables us to achieve faster, higher quality outcomes for clients in a cost-efficient manner. Our flexible architecture allows us to incorporate leading third-party technologies as well as data from external sources, and enables our clients to use our technology and solutions on their own technology platforms.
Our Growth Strategy
We believe we are well-positioned for growth worldwide and have a multi-faceted strategy that builds upon our brand, strong client relationships and integral role in measuring and analyzing the global consumer.
Continue to grow in developing markets
Developing markets comprised approximately 17% of our 2009 revenues and represent a significant long-term opportunity for us given the growth of the middle class and the rapid evolution and modernization of the retail trade in these regions. Currently, the middle class is growing by 70 million people globally each year, with Brazil, Russia, India and China expected to contribute approximately half of all global consumption growth in 2010. Key elements of our strategy include:
| • | Continuing to grow our existing services in local markets while simultaneously introducing into developing markets new services drawn from our global portfolio; |
| • | Partnering with existing clients as they expand their businesses into developing and emerging markets and providing the high-quality measurement and insights to which they are accustomed; and |
| • | Building relationships with local companies that are expanding beyond their home markets by capitalizing on the global credibility and integrity of the Nielsen brand. |
Continue to develop innovative products and services
We intend to continue developing our product and service portfolio to provide our clients with comprehensive and advanced solutions. Key elements of our strategy include:
| • | Further developing our analytics offerings across all facets of our client base to provide a more comprehensive offering and help our clients think through their most important challenges; |
| • | Continuing to grow our leadership in measurement and insight services related to each individual screen (TV, online and mobile) and expanding our three screen measurement services to help our media clients more effectively reach their target audiences and better understand the value of their content; and |
| • | Expanding our Advertiser Solutions offering, which integrates our proprietary data and analytics from both the Watch and Buy segments, by developing powerful tools to help clients better understand the effectiveness of advertising spending on consumer purchasing behavior. |
5
Table of Contents
Continue to attract new clients and expand existing relationships
We believe that substantial opportunities exist to both attract new clients and to increase our revenue from existing clients. Building on our deep knowledge and the embedded position of our Watch and Buy segments, we expect to sell new and innovative solutions to our new and existing clients, increasing our importance to their decision making processes.
Continue to pursue acquisitions to complement our leadership positions
We have increased our capabilities and expanded our geographic footprint through acquisitions in the areas of online and mobile measurement, social networking, advanced analytics and advertising effectiveness. Going forward, we will consider select acquisitions of complementary businesses that enhance our product and geographic portfolio and can benefit from our scale, scope and status as a global leader.
Key Risks
An investment in our common stock involves substantial risks and uncertainties. Any of the factors set forth under “Risk Factors” may limit our ability to successfully execute our business strategy. Among these important risks are the following:
| • | we may be unable to adapt to significant technological change which could adversely affect our business; |
| • | consolidation in the consumer packaged goods, media, entertainment, telecommunications and technology industries could put pressure on the pricing of our products and services, thereby leading to decreased earnings; |
| • | continued adverse market conditions, particularly in the consumer packaged goods, media, entertainment, telecommunications or technology industries in particular, could adversely impact our revenue; and |
| • | our substantial indebtedness could adversely affect our financial health and we and our subsidiaries may still be able to incur substantially more debt, which could further increase the risk associated with our substantial leverage. |
Company Information
Nielsen Holdings B.V. is a Dutch private company with limited liability (besloten vennootschap met beperkte aansprakelijkeid), incorporated under the laws of the Netherlands on May 17, 2006. The Nielsen Company B.V. and its subsidiaries were purchased on May 24, 2006 through Nielsen Holdings (the “Acquisition”) by a consortium of private equity firms (AlpInvest Partners, The Blackstone Group, The Carlyle Group, Hellman & Friedman, Kohlberg Kravis Roberts & Co. and Thomas H. Lee Partners), who we collectively refer to in this prospectus as the “Original Sponsors.” Subsequently, Centerview Partners invested in the Company. Centerview Partners and the Original Sponsors are collectively referred to in this prospectus as the “Sponsors.” Investment funds associated with or designated by the Sponsors own shares of Nielsen Holdings indirectly through their holdings in Valcon Acquisition Holding (Luxembourg) S.à r.l., a private limited company incorporated under the laws of Luxembourg (“Luxco”). As of June 30, 2010, Luxco owned 433,194,313 shares (or approximately 95%) of our common stock. Upon the completion of this offering, it is anticipated Luxco will own approximately % of our common stock. See “Principal Stockholders.” As a result, we will be a “controlled company” within the meaning of the corporate governance rules of the New York Stock Exchange (the “NYSE”). See “Risk Factors—Risks Related to this Offering and Ownership of Our Common Stock—We
6
Table of Contents
are a “controlled company” within the meaning of the NYSE rules and, as a result, will qualify for, and intend to rely on, exemptions from certain corporate governance requirements. You will not have the same protections afforded to stockholders of companies that are subject to such requirements.” Upon completion of this offering, we will pay a fee to the Sponsors in connection with the termination of certain advisory agreements. See “Certain Relationships and Related Party Transactions—Advisory Agreements.”
We are a holding company whose only material asset is 100% of the shares of Valcon Acquisition B.V., a Dutch private company with limited liability, which in turn is a holding company whose only material asset is 100% of the shares of The Nielsen Company B.V. We are owned and controlled by a group of investment funds associated with the Sponsors.
Prior to the completion of this offering, our stockholders will resolve (i) to convert Nielsen Holdings B.V. into a Dutch public company with limited liability (naamloze vennootschap) incorporated under the laws of the Netherlands, and change our name to Nielsen Holdings N.V. and (ii) to amend our articles of association. These actions are collectively referred to herein as the “Conversion.”
Our registered office is located at Diemerhof 2, 1112 XL Diemen, the Netherlands and it is registered at the Commercial Register for Amsterdam under file number 34248449. The phone number of Nielsen in the Netherlands is +31 20 398 8777. Our headquarters are located in New York, New York and the phone number is +1 (646) 654-5000. We maintain a website at www.nielsen.com where general information about our business is available. The information contained on, or accessible from, our website is not a part of this prospectus.
7
Table of Contents
The Offering
| Common stock offered by us |
shares |
| Common stock to be outstanding after this offering |
shares ( shares if the underwriters exercise their option in full) |
| Use of Proceeds |
We estimate that the net proceeds to us from this offering, after deducting underwriting discounts and estimated offering expenses, will be approximately $1,661 million, assuming the shares are offered at $ per share, which is the mid-point of the estimated offering price range set forth on the cover page of this prospectus. |
We intend to use the anticipated net proceeds as follows:
| • | approximately $127 million of the net proceeds will be applied to repay approximately $127 million of senior secured term loans due 2013; |
| • | approximately $914 million of the net proceeds will be applied to redeem approximately $870 million in aggregate principal amount of our 10% Senior Notes due 2014; |
| • | approximately $195 million of the net proceeds will be applied to redeem approximately $163 million in aggregate principal amount (approximately $175 million face amount) of our 11.5% Senior Notes due 2016; |
| • | approximately $128 million of the net proceeds will be applied to redeem approximately $106 million in aggregate principal amount (approximately $115 million face amount) of our 11.625% Senior Notes due 2014; |
| • | approximately $194 million of the net proceeds will be applied to redeem approximately $186 million in aggregate principal amount of our 9% Senior Notes due 2014; and |
| • | approximately $103 million will be paid to the Sponsors as a fee in connection with the termination of certain advisory agreements in accordance with their terms, as described under “Certain Relationships and Related Party Transactions—Advisory Agreements.” |
The redemptions of the 11.5% Senior Notes due 2016 and 11.625% Senior Notes due 2014 will be made pursuant to a provision of the applicable indenture that permits us to redeem up to 35% of the aggregate principal amount of such notes with the net cash proceeds of certain equity offerings. In each case, we will pay accrued and unpaid interest on the notes through the redemption date with cash generated from operations. To the extent that the underwriters exercise all or a portion of their option to purchase additional shares of our common stock, the net proceeds received will be used for further repayment of indebtedness in amounts and denominations to be determined at such time.
8
Table of Contents
| Dividend policy |
We do not intend to pay dividends on our common stock for the foreseeable future. |
| Risk Factors |
You should carefully read and consider the information set forth under “Risk Factors” beginning on page 14 of this prospectus and all other information set forth in this prospectus before investing in our common stock. |
| Proposed NYSE ticker symbol |
NLSN |
Unless we indicate otherwise or the context otherwise requires, all information in this prospectus:
| • | assumes (1) no exercise of the underwriters’ option to purchase additional shares of our common stock; and (2) an initial public offering price of $ per share, the midpoint of the initial public offering range indicated on the cover of this prospectus; |
| • | assumes the completion of the Conversion; and |
| • | does not reflect (1) shares of our common stock issuable upon the exercise of outstanding stock options at a weighted average exercise price of $ per share as of June 30, 2010, of which were then exercisable; and (2) shares of our common stock reserved for future grants under our 2006 Stock Acquisition and Option Plan for Key Employees (the “2006 Stock Acquisition and Option Plan”) and/or any new employee benefits plans that we may create prior to the completion of this offering. |
9
Table of Contents
Summary Financial and Other Data
The following table sets forth our summary financial and other data as of the dates and for the periods indicated. The summary consolidated statement of operations and statement of cash flows data for the years ended December 31, 2009, 2008 and 2007 and summary consolidated balance sheet data as of December 31, 2009 have been derived from our audited consolidated financial statements and related notes appearing elsewhere in this prospectus.
The summary financial and other data as of June 30, 2010 and for the six months ended June 30, 2010 and 2009 have been derived from our unaudited condensed consolidated financial statements included elsewhere in this prospectus. The unaudited financial data presented have been prepared on a basis consistent with our audited consolidated financial statements. In the opinion of management, such unaudited financial data reflect all adjustments, consisting only of normal and recurring adjustments, necessary for a fair presentation of the results for those periods.
The results of operations for any period are not necessarily indicative of the results to be expected for any future period. The audited consolidated financial statements from which the historical financial information for the periods set forth below have been derived were prepared in accordance with GAAP. The summary financial and other data set forth below should be read in conjunction with, and are qualified by reference to “Management’s Discussion and Analysis of Financial Condition and Results of Operations,” “Selected Financial and Other Data” and our audited consolidated financial statements, unaudited condensed consolidated financial statements and related notes thereto appearing elsewhere in this prospectus.
| Six Months Ended June 30, |
Year Ended December 31, |
|||||||||||||||||||
| (IN MILLIONS, EXCEPT PER SHARE AMOUNTS) |
2010 | 2009 | 2009 | 2008 | 2007 | |||||||||||||||
| Statement of Operations Data: |
||||||||||||||||||||
| Revenues |
$ | 2,466 | $ | 2,284 | $ | 4,808 | $ | 4,806 | $ | 4,458 | ||||||||||
| Cost of revenues, exclusive of depreciation and amortization shown separately below |
1,048 | 963 | 2,023 | 2,057 | 1,992 | |||||||||||||||
| Selling, general and administrative expenses, exclusive of depreciation and amortization shown separately below |
805 | 762 | 1,523 | 1,616 | 1,506 | |||||||||||||||
| Depreciation and amortization(1) |
277 | 266 | 557 | 499 | 451 | |||||||||||||||
| Impairment of goodwill and intangible assets(2) |
— | — | 527 | 96 | — | |||||||||||||||
| Restructuring costs(3) |
22 | 9 | 62 | 118 | 133 | |||||||||||||||
| Operating income |
$ | 314 | $ | 284 | $ | 116 | $ | 420 | $ | 376 | ||||||||||
| Interest expense, net |
(320 | ) | (311 | ) | (640 | ) | (684 | ) | (661 | ) | ||||||||||
| Other non-operating income/(expense), net(4) |
143 | (13 | ) | (79 | ) | (7 | ) | (69 | ) | |||||||||||
| Income/(loss) from continuing operations before income taxes and equity in net (loss)/income of affiliates |
137 | (40 | ) | (603 | ) | (271 | ) | (354 | ) | |||||||||||
| (Provision)/benefit for income taxes |
(12 | ) | 25 | 197 | (36 | ) | (12 | ) | ||||||||||||
| Equity in net income/(loss) of affiliates |
— | 8 | (22 | ) | (7 | ) | 2 | |||||||||||||
| Income/(loss) from continuing operations |
125 | (7 | ) | (428 | ) | (314 | ) | (364 | ) | |||||||||||
| (Loss)/income from discontinued operations, net of tax |
(8 | ) | — | (61 | ) | (275 | ) | 10 | ||||||||||||
| Net income/(loss) |
117 | (7 | ) | (489 | ) | (589 | ) | (354 | ) | |||||||||||
| Net income attributable to noncontrolling interests |
1 | 1 | 2 | — | — | |||||||||||||||
| Net income/(loss) attributable to Nielsen stockholders |
$ | 116 | $ | (8 | ) | $ | (491 | ) | $ | (589 | ) | $ | (354 | ) | ||||||
| Income/(loss) from continuing operations per common share (diluted) |
$ | 0.28 | $ | (0.02 | ) | $ | (0.98 | ) | $ | (0.87 | ) | $ | (1.01 | ) | ||||||
| Net income/(loss) attributable to Nielsen stockholders per common share (diluted) |
$ | 0.26 | $ | (0.02 | ) | $ | (1.12 | ) | $ | (1.63 | ) | $ | (0.98 | ) | ||||||
10
Table of Contents
| Six Months Ended June 30, |
Year Ended December 31, |
|||||||||||||||||||
| (IN MILLIONS) |
2010 | 2009 | 2009 |
2008 | 2007 | |||||||||||||||
| Statement of Cash Flows Data: |
||||||||||||||||||||
| Net cash provided by operating activities |
$ | 129 | $ | 151 | $ | 517 | $ | 317 | $ | 233 | ||||||||||
| Net cash used in investing activities |
(154 | ) | (143 | ) | (227 | ) | (591 | ) | (517 | ) | ||||||||||
| Net cash used in financing activities |
(97 | ) | (99 | ) | (271 | ) | 367 | 9 | ||||||||||||
| (IN MILLIONS) |
June 30, 2010 |
December 31, 2009 | ||||
| Balance Sheet Data (at period end): |
||||||
| Cash and cash equivalents |
$ | 371 | $ | 514 | ||
| Goodwill and intangible assets(5) |
11,586 | 11,813 | ||||
| Total assets |
14,194 | 14,600 | ||||
| Total long-term debt and capital lease obligations, including current portions |
8,421 | 8,640 | ||||
| Total Nielsen stockholders’ equity |
2,796 | 2,798 | ||||
| Six Months Ended June 30, |
Year Ended December 31, |
|||||||||||||||||||
| (IN MILLIONS) |
2010 | 2009 | 2009 | 2008 | 2007 | |||||||||||||||
| Other Financial Data: |
||||||||||||||||||||
| Constant currency revenue growth(6) |
5.2 | % | * | 4.0 | % | 6.1 | % | * | ||||||||||||
| Adjusted EBITDA(7) |
$ | 638 | $ | 574 | $ | 1,312 | $ | 1,205 | $ | 1,081 | ||||||||||
| Capital expenditures |
(146 | ) | (132 | ) | (282 | ) | (370 | ) | (266 | ) | ||||||||||
| Cash paid for income taxes |
(64 | ) | (62 | ) | (139 | ) | (91 | ) | (99 | ) | ||||||||||
| (1) | Depreciation and amortization expense included charges for the depreciation and amortization of acquired tangible and intangible assets of $116 million and $122 million for the six months ended June 30, 2010 and 2009, respectively, and $247 million, $245 million and $233 million for the years ended December 31, 2009, 2008 and 2007, respectively. |
| (2) | Our results for the year ended December 31, 2009 included an aggregate goodwill impairment charge of $282 million and an aggregate customer-related intangible asset impairment charge of $245 million, which were recorded in the third quarter of 2009 relating to our Watch and Expositions segments. Our results for the year ended December 31, 2008 included a goodwill impairment charge of $96 million relating to our Watch segment. See Note 5 – Goodwill and Other Intangible Assets – to the audited consolidated financial statements included elsewhere in this prospectus for additional information. |
| (3) | Represents costs incurred associated with major restructuring initiatives, including the Transformation Initiative and Other Productivity Initiatives discussed further in Note 8 – Restructuring Activities – to the audited consolidated financial statements included elsewhere in this prospectus. |
| (4) | Includes foreign currency exchange transaction gains of $146 million and $31 million for the six months ended June 30, 2010 and 2009, respectively, a loss of $2 million for the year ended December 31, 2009, a gain of $20 million for the year ended December 31, 2008 and a loss of $110 million for the year ended December 31, 2007. These gains and losses resulted primarily from the fluctuation in the value of the U.S. dollar against the Euro applied to certain of our Euro denominated senior secured term loans and debenture loans as well as fluctuations in certain currencies including the Euro and Canadian dollar associated with a portion of our intercompany loan portfolio. Also includes losses on derivative financial instruments, primarily comprised of interest and currency swap arrangements, of $12 million and $33 million for the six months ended June 30, 2010 and 2009, respectively, losses of $60 million and $15 million for the years ended December 31, 2009 and 2008, respectively, and gains of $40 million for the year ended December 31, 2007. In addition, includes other |
11
Table of Contents
| income, net of $9 million and other expense, net of $11 million for the six months ended June 30, 2010 and 2009, respectively, other expenses, net of $17 million and $12 million for the years ended December 31, 2009 and 2008, respectively, and other income, net of $1 million for the year ended December 31, 2007. |
| (5) | Includes intangible assets subject to amortization of $2,704 million and $2,808 million as of June 30, 2010 and December 31, 2009, respectively. |
| (6) | Constant currency revenue growth represents, for each period presented, the percentage growth in revenues from the prior year period removing the positive and negative impacts of changes in foreign currency exchange rates. No data has been presented for the six months ended June 30, 2009 or year ended December 31, 2007 as financial information for the comparable prior year period is not included herein. See “Management’s Discussion and Analysis of Financial Condition and Results of Operations.” |
| (7) | We define Adjusted EBITDA as net income/(loss) attributable to Nielsen stockholders from our consolidated statements of operations before interest income and expense, income taxes, depreciation and amortization, restructuring charges, goodwill and intangible asset impairment charges, stock compensation expense and other non-operating items from our consolidated statements of operations as well as certain other items specifically described below. |
Adjusted EBITDA is not a presentation made in accordance with GAAP, and our use of the term Adjusted EBITDA may vary from the use of similarly titled measures by others in our industry due to the potential inconsistencies in the method of calculation and differences due to items subject to interpretation.
We believe that the presentation of Adjusted EBITDA provides useful information to management and investors regarding financial and business trends related to our results of operations and that when non-GAAP financial information is viewed with GAAP financial information, investors are provided with a more meaningful understanding of our ongoing operating performance. We also use Adjusted EBITDA to compare our results to those of our competitors and to consistently measure our performance from period to period.
Adjusted EBITDA should not be considered as an alternative to net income/(loss), operating income, cash flows from operating activities or any other performance measures derived in accordance with GAAP as measures of operating performance or cash flows as measures of liquidity. Adjusted EBITDA has important limitations as an analytical tool and should not be considered in isolation or as a substitute for analysis of our results as reported under GAAP.
12
Table of Contents
The below table presents a reconciliation from net income/(loss) attributable to Nielsen stockholders to Adjusted EBITDA for the periods presented elsewhere in this prospectus:
| Six Months Ended June 30, |
Year Ended December 31, |
|||||||||||||||||||
| (IN MILLIONS) |
2010 | 2009 | 2009 | 2008 | 2007 | |||||||||||||||
| Net income/(loss) attributable to Nielsen stockholders |
$ | 116 | $ | (8 | ) | $ | (491 | ) | $ | (589 | ) | $ | (354 | ) | ||||||
| Income attributable to noncontrolling interests |
1 | 1 | 2 | — | — | |||||||||||||||
| Net income/(loss) |
117 | (7 | ) | (489 | ) | (589 | ) | (354 | ) | |||||||||||
| Loss/(gain) on discontinued operations, net |
8 | — | 61 | 275 | (10 | ) | ||||||||||||||
| Equity in net loss/(income) of affiliates, net |
— | (8 | ) | 22 | 7 | (2 | ) | |||||||||||||
| Provision/(benefit) for income taxes |
12 | (25 | ) | (197 | ) | 36 | 12 | |||||||||||||
| Other non-operating (income)/expense, net |
(143 | ) | 13 | 79 | 7 | 69 | ||||||||||||||
| Interest expense, net |
320 | 311 | 640 | 684 | 661 | |||||||||||||||
| Operating income |
314 | 284 | 116 | 420 | 376 | |||||||||||||||
| Specified transaction costs(a) |
— | — | — | — | 37 | |||||||||||||||
| Restructuring costs |
22 | 9 | 62 | 118 | 133 | |||||||||||||||
| Impairment of goodwill and intangible assets |
— | — | 527 | 96 | — | |||||||||||||||
| Depreciation and amortization |
277 | 266 | 557 | 499 | 451 | |||||||||||||||
| Stock compensation expense/(credits) |
9 | (1 | ) | 14 | 18 | 52 | ||||||||||||||
| Sponsor monitoring fees |
6 | 6 | 12 | 11 | 10 | |||||||||||||||
| Other items(b) |
10 | 10 | 24 | 43 | 22 | |||||||||||||||
| Adjusted EBITDA |
$ | 638 | $ | 574 | $ | 1,312 | $ | 1,205 | $ | 1,081 | ||||||||||
| (a) | For the year ended December 31, 2007, we recorded $37 million of charges associated with transaction costs, legal settlements and incremental expenses associated with compensation arrangements and recruiting costs for certain corporate executives. |
| (b) | Other items include Transformation Initiative dual running costs of $2 million and $3 million for the six months ended June 30, 2010 and 2009, respectively, and $7 million, $15 million and $7 million for the years ended December 31, 2009, 2008 and 2007, respectively. Also includes consulting and other costs of $8 million and $7 million for the six months ended June 30, 2010 and 2009, respectively, and $17 million, $28 million and $15 million for the years ended December 31, 2009, 2008 and 2007, respectively, associated with information technology infrastructure transformation, fees associated with certain consulting arrangements and charges associated with a deferred compensation plan. |
13
Table of Contents
An investment in our common stock involves risk. You should carefully consider the following risks as well as the other information included in this prospectus, including “Management’s Discussion and Analysis of Financial Condition and Results of Operations” and our financial statements and related notes, before investing in our common stock. Any of the following risks could materially and adversely affect our business, financial condition or results of operations.
Risks Related to Our Business
We may be unable to adapt to significant technological change which could adversely affect our business.
We operate in businesses that require sophisticated data collection, processing systems, software and other technology. Some of the technologies supporting the industries we serve are changing rapidly. We will be required to adapt to changing technologies, either by developing and marketing new products and services or by enhancing our existing products and services, to meet client demand.
Moreover, the introduction of new products and services embodying new technologies and the emergence of new industry standards could render existing products and services obsolete. Our continued success will depend on our ability to adapt to changing technologies, manage and process ever-increasing amounts of data and information and improve the performance, features and reliability of our existing products and services in response to changing client and industry demands. We may experience difficulties that could delay or prevent the successful design, development, testing, introduction or marketing of our products and services. New products and services, or enhancements to existing products and services, may not adequately meet the requirements of current and prospective clients or achieve any degree of significant market acceptance.
Traditional methods of television viewing are changing as a result of fragmentation of channels and digital and other new television technologies, such as video-on-demand, digital video recorders and internet viewing. If we are unable to continue to successfully adapt our media measurement systems to new viewing habits, our business, financial position and results of operations could be adversely affected.
Consolidation in the consumer packaged goods, media, entertainment, telecommunications and technology industries could put pressure on the pricing of our products and services, thereby leading to decreased earnings.
Consolidation in the consumer packaged goods, media, entertainment, telecommunications and technology industries could reduce aggregate demand for our products and services in the future and could limit the amounts we earn for our products and services. When companies merge, the products and services they previously purchased separately are often purchased by the combined entity in the aggregate in a lesser quantity than before, leading to volume compression and loss of revenue. While we attempt to mitigate the revenue impact of any consolidation by expanding our range of products and services, there can be no assurance as to the degree to which we will be able to do so as industry consolidation continues, which could adversely affect our business, financial position and results of operations.
Client procurement strategies could put additional pressure on the pricing of our information products and services, thereby leading to decreased earnings.
Certain of our clients may continue to seek further price concessions from us. This puts pressure on the pricing of our information products and services, which could limit the amounts we earn. While we attempt to mitigate the revenue impact of any pricing pressure through effective negotiations and by providing services to individual businesses within particular groups, there can be no assurance as to the degree to which we will be able to do so, which could adversely affect our business, financial position and results of operations.
14
Table of Contents
Continued adverse market conditions, particularly in the consumer packaged goods, media, entertainment, telecommunications or technology industries in particular, could adversely impact our revenue.
As experienced in 2009, a number of adverse financial developments have impacted the U.S. and global financial markets. These developments include a significant economic deterioration both in the United States and globally, volatility and deterioration in the equity markets, and deterioration and tightening of liquidity in the credit markets. In addition, issues related to sovereign debt in Europe recently have negatively affected the global financial markets. The current economic environment has witnessed a significant reduction in consumer confidence and demand, impacting the demand for our customers’ products and services. Those reductions could adversely affect the ability of some of our customers to meet their current obligations to us and hinder their ability to incur new obligations until the economy and their businesses strengthen. The inability of our customers to pay us for our services and/or decisions by current or future customers to forego or defer purchases may adversely impact our business, financial condition, results of operations, profitability and cash flows and may continue to present risks for an extended period of time. We cannot predict the impact of economic slowdowns on our future financial performance.
We expect that revenues generated from our marketing information and television audience measurement services and related software and consulting services will continue to represent a substantial portion of our overall revenue for the foreseeable future. To the extent the businesses we service, especially our clients in the consumer packaged goods, media, entertainment, telecommunications and technology industries, are subject to the financial pressures of, for example, increased costs or reduced demand for their products, the demand for our services, or the prices our clients are willing to pay for those services, may decline.
Clients within our Watch segment derive a significant amount of their revenue from the sale or purchase of advertising. During challenging economic times, advertisers may reduce advertising expenditures and advertising agencies and other media may be less likely to purchase our media information services.
During challenging economic times, clients, typically advertisers, within our Buy segment may reduce their discretionary advertising expenditures and may be less likely to purchase our analytical services.
Our Expositions segment derives a significant amount of its revenues from business-to-business trade shows and events. As experienced in both 2008 and 2009, during challenging economic times exhibitors may cut back on attending our events which would have an adverse effect on our revenue.
We have suffered losses due to goodwill impairment charges and could do so again in the future.
Goodwill and indefinite-lived intangible assets are subject to annual review for impairment (or more frequently should indications of impairment arise). In addition, other intangible assets are also reviewed for impairment whenever events or changes in circumstances indicate that the carrying value of an asset may not be recoverable. Economic volatility has negatively impacted our financial results and, as a direct result, we recorded goodwill impairment charges of $282 million and $96 million for the years ended December 31, 2009 and 2008 respectively (as well as $55 million and $336 million in 2009 and 2008, respectively, relating to discontinued operations) and $245 million of intangible asset impairment charges for the year ended December 31, 2009. Subsequent to the recognition of these impairment charges and as of June 30, 2010, we had goodwill and intangible assets of approximately $11.6 billion. Any further downward revisions in the fair value of our reporting units or our intangible assets could result in further impairment charges for goodwill and intangible assets that could materially affect our financial performance.
Our substantial indebtedness could adversely affect our financial health.
We have now and will continue to have a significant amount of indebtedness. As of June 30, 2010, we had total indebtedness of $8,421 million, excluding bank overdrafts. Furthermore, the interest payments on our indebtedness could reduce the availability of our cash flow.
15
Table of Contents
Our substantial indebtedness could have important consequences. For example, it could:
| • | increase our vulnerability to the current general adverse economic and industry conditions; |
| • | require us to dedicate a substantial portion of our cash flow from operations to payments on our indebtedness, thereby reducing the availability of our cash flow to fund working capital, capital expenditures, product development efforts and other general corporate purposes; |
| • | limit our flexibility in planning for, or reacting to, changes in our business and the industry in which we operate; |
| • | expose us to the risk of increased interest rates as certain of our borrowings are at variable rates of interest; |
| • | restrict us from making strategic acquisitions or causing us to make non-strategic divestitures; |
| • | limit our ability to obtain additional financing for working capital, capital expenditures, product development, debt service requirements, acquisitions and general corporate or other purposes; |
| • | limit our ability to adjust to changing market conditions; and |
| • | place us at a competitive disadvantage compared to our competitors that have less debt. |
In addition, the indentures governing our outstanding notes and our credit facilities contain financial and other restrictive covenants that will limit the ability of our operating subsidiaries to engage in activities that may be in our best interests in the long term. The failure to comply with those covenants could result in an event of default which, if not cured or waived, could result in the acceleration of all of our debt.
Despite current indebtedness levels, we and our subsidiaries may still be able to incur substantially more debt. This could further increase the risks associated with our substantial leverage.
We and our subsidiaries may be able to incur substantial additional indebtedness in the future. If new debt is added to our and our subsidiaries’ current debt levels, the related risks that we and they now face could intensify.
To service our indebtedness, we will require a significant amount of cash as well as continued access to the capital markets. Our ability to generate cash and our access to the capital markets depend on many factors beyond our control.
Our ability to make payments on our indebtedness and to fund planned capital expenditures and product development efforts will depend on our ability to generate cash in the future and our ability to refinance our indebtedness. This, to a certain extent, is subject to general economic, financial, competitive, legislative, regulatory and other factors that are beyond our control.
We may not be able to generate sufficient cash flow from operations to pay our indebtedness or to fund our other liquidity needs. Our cash interest expense for the years ended December 31, 2009, 2008 and 2007 was $495 million, $494 million and $533 million, respectively, and $249 million and $231 million for the six-month periods ended June 30, 2010 and 2009, respectively. At June 30, 2010, we had $4,563 million of floating-rate debt under our 2006 Senior Secured Credit Facilities and our existing floating rate notes. A one percent increase in our floating rate indebtedness would increase annual interest expense by approximately $46 million. We may need to refinance all or a portion of our indebtedness on or before maturity. We may not be able to refinance any of our indebtedness, including our senior secured credit facilities, on commercially reasonable terms or at all.
The success of our business depends on our ability to recruit sample participants to participate in our research samples.
Our business uses scanners and diaries to gather consumer data from sample households as well as Set Meters, People Meters, Active/Passive Meters and diaries to gather television audience measurement data from
16
Table of Contents
sample households. It is increasingly difficult and costly to obtain consent from households to participate in the surveys. In addition, it is increasingly difficult and costly to ensure that the selected sample of households mirrors the behaviors and characteristics of the entire population and covers all of the demographic segments requested by our clients. Additionally, as consumers adopt modes of telecommunication other than traditional telephone service, such as mobile, cable and internet calling, it may become more difficult for our services to reach and recruit participants for consumer purchasing and audience measurement services. If we are unsuccessful in our efforts to recruit appropriate participants and maintain adequate participation levels, our clients may lose confidence in our ratings services and we could lose the support of the relevant industry groups. If this were to happen, our consumer purchasing and audience measurement services may be materially and adversely affected.
Data protection laws may restrict our activities and increase our costs.
Various statutes and rules regulate conduct in areas such as privacy and data protection which may affect our collection, use, storage and transfer of personally identifiable information both abroad and in the United States. Compliance with these laws may require us to make certain investments or may dictate that we not offer certain types of products and services or only offer such services or products after making necessary modifications. Failure to comply with these laws may result in, among other things, civil and criminal liability, negative publicity, data being blocked from use and liability under contractual warranties. In addition, there is an increasing public concern regarding data and consumer protection issues, and the number of jurisdictions with data protection laws has been slowly increasing. There is also the possibility that the scope of existing privacy laws may be expanded. For example, several countries including the United States have regulations that restrict telemarketing to individuals who request to be included on a do-not-call list. Typically, these regulations target sales activity and do not apply to survey research. If the laws were extended to include survey research, our ability to recruit research participants could be adversely affected. These or future initiatives may adversely affect our ability to generate or assemble data or to develop or market current or future products or services, which could negatively impact our business.
If we are unable to protect our intellectual property rights, our business could be adversely affected.
The success of our business will depend, in part, on:
| • | obtaining patent protection for our technology, products and services; |
| • | defending our patents, copyrights, trademarks, service marks and other intellectual property; |
| • | preserving our trade secrets and maintaining the security of our know-how and data; and |
| • | operating our business without infringing upon intellectual property rights held by third parties. |
We rely on a combination of contractual provisions, confidentiality procedures and the patent, copyright, trademark and trade secret laws of the United States and other countries to protect our intellectual property. These legal measures afford only limited protection and may not provide sufficient protection to prevent the infringement, misuse or misappropriation of our intellectual property. Intellectual property law in several foreign jurisdictions is subject to considerable uncertainty. There can be no assurances that the protections we have available for our proprietary technology in the United States and other countries will be available to us in all of the places we sell our products and services. Any infringement or misappropriation of our technology can have a negative impact on our business. The patents we own could be challenged, invalidated or circumvented by others and may not be of sufficient scope or strength to provide us with meaningful protection or commercial advantage. The expiration of our patents may lead to increased competition. Although our employees, consultants, clients and collaborators enter into confidentiality agreements with us, our trade secrets, data and know-how could be subject to unauthorized use, misappropriation or unauthorized disclosure. The growing need for global data, along with increased competition and technological advances, puts increasing pressure on us to share our intellectual property for client applications with others, which could result in infringement. Competitors
17
Table of Contents
may gain access to our intellectual property and proprietary information. Our trademarks could be challenged, which could force us to rebrand our products or services, result in a loss of brand recognition and require us to devote resources to advertising and marketing new brands. Furthermore, litigation may be necessary to enforce our intellectual property rights, to protect our trade secrets and to determine the validity and scope of our proprietary rights. Given the importance of our intellectual property, we will enforce our rights whenever it is necessary and prudent to do so. Any future litigation, regardless of the outcome, could result in substantial expense and diversion of time and attention of management, may not be resolved in our favor and could adversely affect our business.
If third parties claim that we infringe upon their intellectual property rights, our operating profits could be adversely affected.
We cannot be certain that we do not and will not infringe the intellectual property rights of others in operating our business. We may be subject to legal proceedings and claims in the ordinary course of our business, including claims that we have infringed third parties’ intellectual property rights. Any such claims of intellectual property infringement, even those without merit, could:
| • | be expensive and time-consuming to defend; |
| • | result in our being required to pay possibly significant damages; |
| • | cause us to cease providing our products and services that incorporate the challenged intellectual property; |
| • | require us to redesign or rebrand our products or services; |
| • | divert management’s attention and resources; or |
| • | require us to enter into potentially costly royalty or licensing agreements in order to obtain the right to use a third party’s intellectual property, although royalty or licensing agreements may not be available to us on acceptable terms or at all. |
Any of the above could have a negative impact on our operating profits and harm our future prospects and financial condition.
We generate revenues throughout the world which are subject to exchange rate fluctuations, and our revenue and net income may suffer due to currency translations.
We operate globally, deriving approximately 47% of revenues for the year ended December 31, 2009 in currencies other than U.S. dollars. Our U.S. operations earn revenue and incur expenses primarily in U.S. dollars, while our European operations earn revenue and incur expenses primarily in Euros, which have recently been subject to significant volatility. Outside the United States and the European Union, we generate revenue and expenses predominantly in local currencies. Because of fluctuations (including possible devaluations) in currency exchange rates, we are subject to currency translation exposure on the profits of our operations, in addition to economic exposure. In certain instances, we may not be able to freely convert foreign currencies into U.S. dollars due to limitations placed on such conversions. Certain of the countries in which we operate, such as Venezuela, have currencies which are considered to be hyperinflationary. This risk could have a material adverse effect on our business, results of operations and financial condition.
Our international operations are exposed to risks which could impede growth in the future.
We continue to explore opportunities in major international markets around the world, including China, Russia, India and Brazil. International operations expose us to various additional risks, which could adversely affect our business, including:
| • | costs of customizing services for clients outside of the United States; |
18
Table of Contents
| • | reduced protection for intellectual property rights in some countries; |
| • | the burdens of complying with a wide variety of foreign laws; |
| • | difficulties in managing international operations; |
| • | longer sales and payment cycles; |
| • | exposure to foreign currency exchange rate fluctuation; |
| • | exposure to local economic conditions; |
| • | exposure to local political conditions, including adverse tax policies, civil unrest and seizure of assets by a foreign government; and |
| • | the risks of an outbreak of war, the escalation of hostilities and acts of terrorism in the jurisdictions in which we operate. |
In countries where there has not been a historical practice of using consumer packaged goods retail information or audience measurement information in the buying and selling of advertising time, it may be difficult for us to maintain subscribers.
Criticism of our audience measurement service by various industry groups and market segments could adversely affect our business.
Due to the high-profile nature of our services in the media, internet and entertainment information industries, we could become the target of criticism by various industry groups and market segments. We strive to be fair, transparent and impartial in the production of audience measurement services, and the quality of our U.S. ratings services are voluntarily reviewed and accredited by the Media Rating Council, a voluntary trade organization, whose members include many of our key client constituencies. However, criticism of our business by special interests, and by clients with competing and often conflicting demands on our measurement service, could result in government regulation. While we believe that government regulation is unnecessary, no assurance can be given that legislation will not be enacted in the future that would subject our business to regulation, which could adversely affect our business.
A loss of one of our largest clients could adversely impact our results of operations.
Our top ten clients accounted for approximately 23% of our total revenues for the year ended December 31, 2009. We cannot assure you that any of our clients will continue to use our services to the same extent, or at all, in the future. A loss of one or more of our largest clients, if not replaced by a new client or an increase in business from existing clients, would adversely affect our prospects, business, financial condition and results of operations.
We rely on third parties to provide certain data and services in connection with the provision of our current services.
We rely on third parties to provide certain data and services for use in connection with the provision of our current services. For example, our Buy segment enters into agreements with third parties (primarily retailers of fast-moving consumer goods) to obtain the raw data on retail product sales it processes and edits and from which it creates products and services. These suppliers of data may increase restrictions on our use of such data, fail to adhere to our quality control standards, increase the price they charge us for this data or refuse altogether to license the data to us. In addition, we may need to enter into agreements with third parties to assist with the marketing, technical and financial aspects of expanding our services for other types of media. In the event we are unable to use such third party data and services or if we are unable to enter into agreements with third parties, when necessary, our business and/or our potential growth could be adversely affected. In the event that such data and services are unavailable for our use or the cost of acquiring such data and services increases, our business could be adversely affected.
19
Table of Contents
We rely on a third party for the performance of a significant portion of our worldwide information technology and operations functions, various services and assistance in certain integration projects. A failure to provide these functions, services or assistance in a satisfactory manner could have an adverse effect on our business.
Pursuant to the terms of a ten year agreement, effective February 19, 2008, we are dependent upon Tata America International Corporation and Tata Consultancy Services Limited (collectively, “TCS”) for the performance of a significant portion of our information technology and operations functions worldwide, the provision of a broad suite of information technology and business process services, including general and process consulting, product engineering, program management, application development and maintenance, coding, data management, finance and accounting services and human resource services, as well as assistance in integrating and centralizing multiple systems, technologies and processes on a global scale. The success of our business depends in part on maintaining our relationships with TCS and their continuing ability to perform these functions and services in a timely and satisfactory manner. If we experience a loss or disruption in the provision of any of these functions or services, or they are not performed in a satisfactory manner, we may have difficulty in finding alternate providers on terms favorable to us, or at all, and our business could be adversely affected.
Long term disruptions in the mail, telecommunication infrastructure and/or air service could adversely affect our business.
Our business is dependent on the use of the mail, telecommunication infrastructure and air service. Long term disruptions in one or more of these services, which could be caused by events such as natural disasters, the outbreak of war, the escalation of hostilities, civil unrest and/or acts of terrorism could adversely affect our business, results of operations and financial condition.
Hardware and software failures, delays in the operation of our computer and communications systems or the failure to implement system enhancements may harm our business.
Our success depends on the efficient and uninterrupted operation of our computer and communications systems. A failure of our network or data gathering procedures could impede the processing of data, delivery of databases and services, client orders and day-to-day management of our business and could result in the corruption or loss of data. While many of our services have appropriate disaster recovery plans in place, we currently do not have full backup facilities everywhere in the world to provide redundant network capacity in the event of a system failure. Despite any precautions we may take, damage from fire, floods, hurricanes, power loss, telecommunications failures, computer viruses, break-ins and similar events at our various computer facilities could result in interruptions in the flow of data to our servers and from our servers to our clients. In addition, any failure by our computer environment to provide our required data communications capacity could result in interruptions in our service. In the event of a delay in the delivery of data, we could be required to transfer our data collection operations to an alternative provider of server hosting services. Such a transfer could result in significant delays in our ability to deliver our products and services to our clients and could be costly to implement. Additionally, significant delays in the planned delivery of system enhancements and improvements, or inadequate performance of the systems once they are completed, could damage our reputation and harm our business. Finally, long-term disruptions in infrastructure caused by events such as natural disasters, the outbreak of war, the escalation of hostilities, civil unrest and/or acts of terrorism (particularly involving cities in which we have offices) could adversely affect our services. Although we carry property and business interruption insurance, our coverage may not be adequate to compensate us for all losses that may occur.
The presence of our Global Technology and Information Center in Florida heightens our exposure to hurricanes and tropical storms, which could disrupt our business.
The technological data processing functions for certain of our U.S. operations are concentrated at our Global Technology and Information Center (“GTIC”) at a single location in Florida. Our geographic concentration in
20
Table of Contents
Florida heightens our exposure to a hurricane or tropical storm. These weather events could cause severe damage to our property and technology and could cause major disruptions to our operations. Although our GTIC was built in anticipation of severe weather events and we have insurance coverage, if we were to experience a catastrophic loss, we may exceed our policy limits and/or we may have difficulty obtaining similar insurance coverage in the future. As such, a hurricane or tropical storm could have an adverse effect on our business.
Our services involve the storage and transmission of proprietary information. If our security measures are breached and unauthorized access is obtained, our services may be perceived as not being secure and panelists and survey respondents may hold us liable for disclosure of personal data, and clients and venture partners may hold us liable or reduce their use of our services.
We store and transmit large volumes of proprietary information and data that contains personally identifiable information about individuals. Security breaches could expose us to a risk of loss of this information, litigation and possible liability and our reputation could be damaged. For example, hackers or individuals who attempt to breach our network security could, if successful, misappropriate proprietary information or cause interruptions in our services. If we experience any breaches of our network security or sabotage, we might be required to expend significant capital and resources to protect against or to alleviate problems. We may not be able to remedy any problems caused by hackers or saboteurs in a timely manner, or at all. Techniques used to obtain unauthorized access or to sabotage systems change frequently and generally are not recognized until launched against a target and, as a result, we may be unable to anticipate these techniques or to implement adequate preventive measures. If an actual or perceived breach of our security occurs, the perception of the effectiveness of our security measures could be harmed and we could lose current and potential clients.
If we are unable to attract, retain and motivate employees, we may not be able to compete effectively and will not be able to expand our business.
Our success and ability to grow are dependent, in part, on our ability to hire, retain and motivate sufficient numbers of talented people, with the increasingly diverse skills needed to serve clients and expand our business, in many locations around the world. Competition for highly qualified, specialized technical and managerial, and particularly consulting personnel is intense. Recruiting, training and retention costs and benefits place significant demands on our resources. The inability to attract qualified employees in sufficient numbers to meet particular demands or the loss of a significant number of our employees could have an adverse effect on us, including our ability to obtain and successfully complete important client engagements and thus maintain or increase our revenues.
Changes in tax laws may adversely affect our reported results.
Changes in tax laws, regulations, related interpretations and tax accounting standards in the United States, the Netherlands and other countries in which we operate may adversely affect our financial results. For example, recent legislative proposals to reform U.S. taxation of non-U.S. earnings could have a material adverse effect on our financial results by subjecting a significant portion of our non-U.S. earnings to incremental U.S. taxation and/or by delaying or permanently deferring certain deductions otherwise allowed in calculating our U.S. tax liabilities. In addition, governments are increasingly considering tax law changes as a means to cover budgetary shortfalls resulting from the current economic environment.
We face competition, which could adversely affect our business, financial condition, results of operations and cash flow.
We are faced with a number of competitors in the markets in which we operate. Some of our competitors in each market may have substantially greater financial marketing and other resources than we do and may in the future engage in aggressive pricing action to compete with us. Although we believe we are currently able to compete effectively in each of the various markets in which we participate, we may not be able to do so in the
21
Table of Contents
future or be capable of maintaining or further increasing our current market share. Our failure to compete successfully in our various markets could adversely affect our business, financial condition, results of operations and cash flow.
We may be subject to antitrust litigation or government investigation in the future, which may result in an award of money damages or force us to change the way we do business.
In the past, certain of our business practices have been investigated by government antitrust or competition agencies, and we have on several occasions been sued by private parties for alleged violations of the antitrust and competition laws of various jurisdictions. Following some of these actions, we have changed certain of our business practices to reduce the likelihood of future litigation. Although each of these material prior legal actions have been resolved, there is a risk based upon the leading position of certain of our business operations that we could, in the future, be the target of investigations by government entities or actions by private parties challenging the legality of our business practices. Also, in markets where the retail trade is concentrated, regulatory authorities may perceive certain of our retail services as potential vehicles for collusive behavior by retailers or manufacturers. There can be no assurance that any such investigation or challenge will not result in an award of money damages, penalties or some form of order that might require a change in the way that we do business, any of which could adversely affect our revenue stream and/or profitability.
The use of joint ventures, over which we do not have full control, could prevent us from achieving our objectives.
We have conducted and will continue to conduct a number of business initiatives through joint ventures, some of which are or may be controlled by others. Our joint venture partners might have economic or business objectives that are inconsistent with our objectives. Our joint venture partners could go bankrupt, leaving us liable for their share of joint venture liabilities. Although we generally will seek to maintain sufficient control of any joint venture to permit our objectives to be achieved, we might not be able to take action without the approval of our joint venture partners. Also, our joint venture partners could take appropriate actions binding on the joint venture without our consent. In addition, the terms of our joint venture agreements may limit our business opportunities. Accordingly, the use of joint ventures could prevent us from achieving our intended objectives.
Risks Related to this Offering and Ownership of Our Common Stock
There is no existing market for our common stock and an active, liquid trading market may not develop.
Prior to this offering, there has not been a public market for our common stock. We cannot predict the extent to which investor interest in our company will lead to the development of a trading market on the NYSE or otherwise or how active and liquid that market may become. If an active and liquid trading market does not develop, you may have difficulty selling any of our common stock that you purchase. The initial public offering price for the shares will be determined by negotiations between us and the underwriters and may not be indicative of prices that will prevail in the open market following this offering. The market price of our common stock may decline below the initial offering price, and you may not be able to sell your shares of our common stock at or above the price you paid in this offering, or at all.
You will incur immediate and substantial dilution in the net tangible book value of the shares you purchase in this offering.
Prior investors have paid substantially less per share of our common stock than the price in this offering. The initial public offering price of our common stock is substantially higher than the net tangible book value per share of outstanding common stock prior to completion of the offering. Based on our net tangible book deficit as of June 30, 2010 and upon the issuance and sale of shares of common stock by us at an assumed initial public offering price of $ per share (the midpoint of the initial public offering price range indicated on the cover of this prospectus), if you purchase our common stock in this offering, you will pay more for your
22
Table of Contents
shares than the amounts paid by our existing stockholders for their shares and you will suffer immediate dilution of approximately $ per share in net tangible book value. We also have a large number of outstanding stock options to purchase common stock with exercise prices that are below the estimated initial public offering price of our common stock. To the extent that these options are exercised, you will experience further dilution.
Our stock price may change significantly following the offering, and you could lose all or part of your investment as a result.
The trading price of our common stock is likely to be highly volatile and could fluctuate due to a number of factors such as those listed in “—Risks Related to Our Business” and the following, some of which are beyond our control:
| • | quarterly variations in our results of operations; |
| • | results of operations that vary from the expectations of securities analysts and investors; |
| • | results of operations that vary from those of our competitors; |
| • | changes in expectations as to our future financial performance, including financial estimates by securities analysts and investors; |
| • | announcements by us, our competitors or our vendors of significant contracts, acquisitions, joint marketing relationships, joint ventures or capital commitments; |
| • | announcements by third parties of significant claims or proceedings against us; |
| • | future sales and anticipated future sales of our common stock; and |
| • | general domestic and international economic conditions. |
Furthermore, the stock market has experienced extreme volatility that, in some cases, has been unrelated or disproportionate to the operating performance of particular companies. These broad market and industry fluctuations may adversely affect the market price of our common stock, regardless of our actual operating performance.
In the past, following periods of market volatility, stockholders have instituted securities class action litigation. If we were involved in securities litigation, it could have a substantial cost and divert resources and the attention of executive management from our business regardless of the outcome of such litigation.
Certain stockholders’ shares are restricted from immediate resale but may be sold into the market in the near future. This could cause the market price of our common stock to drop significantly.
After the completion of this offering, we will have million shares of common stock outstanding ( million shares if the underwriters exercise their option to purchase additional shares in full). This number includes million shares sold in this offering, which may be resold immediately in the public market.
We, our directors and executive officers and certain holders of our outstanding common stock and options to purchase our common stock, including the Sponsors, have agreed not to offer or sell, dispose of or hedge, directly or indirectly, any common stock without the permission of J.P. Morgan Securities Inc. and Morgan Stanley & Co. Incorporated for a period of 180 days from the date of this prospectus, subject to certain exceptions and automatic extension in certain circumstances. In addition, pursuant to the shareholders’ agreement, we will grant to the Sponsors the right to cause us, in certain instances, at our expense, to file registration statements under the Securities Act covering resales of our common stock held by them. These shares will represent approximately % of our outstanding common stock after this offering, or % if the underwriters exercise their option to purchase additional shares in full. These shares also may be sold pursuant to Rule 144 under the Securities Act, depending on their holding period and subject to restrictions in the
23
Table of Contents
case of shares held by persons deemed to be our affiliates. As restrictions on resale end or if these stockholders exercise their registration rights, the market price of our stock could decline if the holders of restricted shares sell them or are perceived by the market as intending to sell them. See “Certain Relationships and Related Party Transactions—Shareholders’ Agreement.”
As of , 2010, shares of our common stock were outstanding, shares were issuable upon the exercise of outstanding vested stock options under our stock incentive plans, shares were subject to outstanding unvested stock options and restricted stock grants under our stock incentive plans, and shares were reserved for future grant under our 2006 Stock Acquisition and Option Plan and/or any new employee benefits plans that we may create prior to this offering. Shares acquired upon the exercise of vested options under our stock incentive plan will first become eligible for resale days after the date of this prospectus. Sales of a substantial number of shares of our common stock following the vesting of outstanding stock options could cause the market price of our common stock to decline.
The availability of shares for sale in the future could reduce the market price of our common stock.
In the future, we may issue securities to raise cash for acquisitions. We may also acquire interests in other companies by using a combination of cash and our common stock or just our common stock. We may also issue securities convertible into our common stock. Any of these events may dilute your ownership interest in our company and have an adverse effect on the price of our common stock.
In addition, sales of a substantial amount of our common stock in the public market, or the perception that these sales may occur, could reduce the market price of our common stock. This could also impair our ability to raise additional capital through the sale of our securities.
Because we do not currently intend to pay cash dividends on our common stock for the foreseeable future, you may not receive any return on investment unless you sell your common stock for a price greater than that which you paid for it.
We currently intend to retain future earnings, if any, for future operation, expansion and debt repayment and do not intend to pay any cash dividends for the foreseeable future. Any decision to declare and pay dividends in the future to the holders of our common stock will be made at the discretion of our board of directors, and the recommendation of the board will depend on, among other things, our results of operations, financial condition, cash requirements, contractual and legal restrictions and other factors that our board of directors may deem relevant. In addition, our ability to pay dividends may be limited by covenants of any existing and future outstanding indebtedness we or our subsidiaries incur, including our senior secured credit facilities and the indentures governing our notes. As a result, you may not receive any return on an investment in our common stock unless you sell our common stock for a price greater than that which you paid for it. Any dividend actually declared and paid may also be subject to a Dutch withholding tax, currently at a rate of 15 percent.
The Sponsors will continue to have significant influence over us after this offering, including control over decisions that require the approval of stockholders. This interest may conflict with yours and such influence could limit your ability to influence the outcome of key transactions, including a change of control.
We are controlled, and after this offering is completed will continue to be controlled, by the Sponsors. The Sponsors will indirectly own through their investment in Valcon Acquisition Holding (Luxembourg) S.à r.l. approximately % of our common stock (or % if the underwriters exercise their option to purchase additional shares in full) after the completion of this offering. In addition, prior to the completion of this offering, representatives of the Sponsors will have been appointed to our board of directors such that they occupy a majority of the seats on our board of directors. As a result, the Sponsors will have control over the board and thus our decisions to enter into any corporate transaction and the ability to prevent any transaction that requires stockholder approval regardless of whether others believe that the transaction is in our best interests. So long as
24
Table of Contents
the Sponsors continue to indirectly hold a majority of our outstanding common stock, they will have the ability to control the vote in any election of directors. See “Certain Relationships and Related Party Transactions” and “Principal Stockholders.”
The Sponsors are also in the business of making investments in companies and may from time to time acquire and hold interests in businesses that compete directly or indirectly with us. The Sponsors may also pursue acquisition opportunities that are complementary to our business and, as a result, those acquisition opportunities may not be available to us. So long as the Sponsors, or other funds controlled by or associated with the Sponsors, continue to indirectly own a significant amount of our outstanding common stock, even if such amount is less than 50%, the Sponsors will continue to be able to strongly influence or effectively control our decisions. The concentration of ownership may have the effect of delaying, preventing or deterring a change of control of our company, could deprive stockholders of an opportunity to receive a premium for their common stock as part of a sale of our company and might ultimately affect the market price of our common stock.
We are a “controlled company” within the meaning of the NYSE rules and, as a result, will qualify for, and intend to rely on, exemptions from certain corporate governance requirements. You will not have the same protections afforded to stockholders of companies that are subject to such requirements.
After completion of this offering, the Sponsors will continue to control a majority of the voting power of our outstanding common stock. As a result, we are a “controlled company” within the meaning of the corporate governance standards of the NYSE. Under these rules, a company of which more than 50% of the voting power is held by an individual, group or another company is a “controlled company” and may elect not to comply with certain corporate governance requirements, including:
| • | the requirement that a majority of the board of directors consist of independent directors; |
| • | the requirement that we have a nomination/corporate governance committee that is composed entirely of independent directors with a written charter addressing the committee’s purpose and responsibilities; |
| • | the requirement that we have a compensation committee that is composed entirely of independent directors with a written charter addressing the committee’s purpose and responsibilities; and |
| • | the requirement for an annual performance evaluation of the nomination/corporate governance and compensation committees. |
Following this offering, we intend to utilize each of these exemptions. As a result, we will not have a majority of independent directors, our nomination and corporate governance committee and compensation committee will not consist entirely of independent directors and such committees will not be subject to annual performance evaluations. Accordingly, you will not have the same protections afforded to stockholders of companies that are subject to all of the corporate governance requirements of the NYSE.
United States civil liabilities may not be enforceable against us.
We are incorporated under the laws of the Netherlands and substantial portions of our assets are located outside of the United States. As a result, it may be difficult for investors to effect service of process within the United States upon us or such other persons residing outside the United States, or to enforce outside the United States judgments obtained against such persons in U.S. courts in any action, including actions predicated upon the civil liability provisions of the U.S. federal securities laws. In addition, it may be difficult for investors to enforce, in original actions brought in courts in jurisdictions located outside the United States, rights predicated upon the U.S. federal securities laws.
There is no treaty between the United States and the Netherlands for the mutual recognition and enforcement of judgments (other than arbitration awards) in civil and commercial matters. Therefore, a final judgment for the payment of money rendered by any federal or state court in the United States based on civil liability, whether or not predicated solely upon the U.S. federal securities laws, would not be enforceable in the
25
Table of Contents
Netherlands unless the underlying claim is re-litigated before a Dutch court. Under current practice however, a Dutch court will generally grant the same judgment without a review of the merits of the underlying claim if (i) that judgment resulted from legal proceedings compatible with Dutch notions of due process, (ii) that judgment does not contravene public policy of the Netherlands and (iii) the jurisdiction of the United States federal or state court has been based on internationally accepted principles of private international law.
Based on the foregoing, it may not be possible for U.S. investors to enforce against us any judgments obtained in U.S. courts in civil and commercial matters, including judgments under the U.S. federal securities laws.
Dutch courts may refuse to enforce contracts governed by foreign law or which require performance in a foreign jurisdiction if such other laws do not comply with certain mandatory rules under Dutch law. Under the rules of Dutch private international law (and those of the EC Regulation on the Law Applicable to Contractual Obligations (Rome I) of June 17, 2008, or the “Rome I Regulation”), in applying the laws of another jurisdiction, the Dutch courts may (i) give effect to certain mandatory rules under Dutch law irrespective of the law otherwise applicable thereto, (ii) give effect to certain mandatory rules of the law of the country where any of the obligations arising out of an agreement have to be or have been performed, insofar as those rules render the performance of the agreement unlawful and (iii) refuse the application of a term or condition of an agreement or a rule of foreign law applicable thereto under the Rome I Regulation, if that application is manifestly incompatible with Dutch public policy. Furthermore, Dutch courts, when considering the manner of performance and the steps to be taken in the event of defective performance in respect of an agreement, will consider the law of the country in which performance takes place. In addition, there is doubt as to whether a Dutch court would impose civil liability on us in an original action predicated solely upon the U.S. federal securities or other laws brought in a court of competent jurisdiction in the Netherlands against us.
After the Conversion, we will be a Dutch public company with limited liability, which may grant different rights to our stockholders than the rights granted to stockholders of companies organized in the United States.
The rights of our stockholders may be different from the rights of stockholders governed by the laws of U.S. jurisdictions. After the Conversion, we will be a Dutch public company with limited liability (naamloze vennootschap). Our corporate affairs are governed by our articles of association and by the laws governing companies incorporated in the Netherlands. The rights of stockholders and the responsibilities of members of our board of directors may be different from the rights and obligations of stockholders in companies governed by the laws of U.S. jurisdictions. In the performance of its duties, our board of directors is required by Dutch law to consider the interests of our company, its stockholders, its employees and other stakeholders, in all cases with due observation of the principles of reasonableness and fairness. It is possible that some of these parties will have interests that are different from, or in addition to, your interests as a stockholder. See “Description of Capital Stock—Corporate Governance.”
In addition, the rights of holders of common stock are governed by Dutch law and our articles of association and differ from the rights of stockholders under U.S. law. Although stockholders will have the right to approve mergers and consolidations, Dutch law does not grant appraisal rights to the company’s stockholders who wish to challenge the consideration to be paid upon a merger or consolidation of the company. Also, generally only a company can bring a civil action against a third party against whom such company alleges wrongdoing, including the directors and officers of such company. A stockholder will have an individual right of action against such a third party only if the tortious act also constitutes a tortious act directly against such stockholder. The Dutch Civil Code provides for the possibility to initiate such actions collectively. A foundation or an association whose objective is to protect the rights of a group of persons having similar interests may institute a collective action. The collective action cannot result in an order for payment of monetary damages but may result in a declaratory judgment. The foundation or association and the defendant are permitted to reach (often on the basis of such declaratory judgment) a settlement which provides for monetary compensation for damages. The Dutch Enterprise Chamber may declare the settlement agreement binding upon all the injured parties with an opt-out
26
Table of Contents
choice for an individual injured party. An individual injured party, within the period set by the Dutch Enterprise Chamber, may also individually institute a civil claim for damages if such injured party is not bound by a collective agreement. See “Description of Capital Stock”.
The non-executive directors supervise the executive directors and our general affairs and provide general advice to the executive directors. Each director owes a duty to the company to properly perform the duties assigned to him and to act in the corporate interest of the company. Under Dutch law, the corporate interest extends to the interests of all corporate stakeholders, such as stockholders, creditors, employees, customers and suppliers. Any board resolution regarding a significant change in the identity or character of the company requires stockholders’ approval.
The provisions of Dutch corporate law and our articles of association have the effect of concentrating control over certain corporate decisions and transactions in the hands of our board. As a result, holders of our shares may have more difficulty in protecting their interests in the face of actions by members of the board of directors than if we were incorporated in the United States.
Our articles of association and Dutch corporate law contain provisions that may discourage a takeover attempt.
Provisions contained in our articles of association and the laws of the Netherlands could make it more difficult for a third party to acquire us, even if doing so might be beneficial to our stockholders. Provisions of our articles of association impose various procedural and other requirements, which could make it more difficult for stockholders to effect certain corporate actions.
For example, our shares and rights to subscribe for our shares may only be issued pursuant to (i) a resolution of the general meeting of stockholders at the proposal of the board of directors or (ii) a resolution of the board of directors, if by a resolution of the general meeting the board of directors has been authorized thereto for a specific period not exceeding five years. Following the Conversion, the board of directors will be empowered for a period of five years to issue cumulative preferred shares and shares of common stock.
Further, our amended articles of association will empower our board of directors to restrict or exclude pre-emptive rights on shares for a period of five years. Accordingly, an issue of new shares to a third party may make it more difficult for others to obtain control over the general meeting of stockholders.
Dutch insolvency laws to which we are subject may not be as favorable to you as U.S. or other insolvency laws.
As a company incorporated under the laws of the Netherlands with its registered offices in the Netherlands, subject to applicable EU insolvency regulations, any insolvency proceedings in relation to us may be based on Dutch insolvency law. Dutch insolvency proceedings differ significantly from insolvency proceedings in the United States and may make it more difficult for stockholders to recover the amount they may normally expect to recover in a liquidation or bankruptcy proceeding in the United States.
27
Table of Contents
CAUTIONARY STATEMENT REGARDING FORWARD-LOOKING STATEMENTS
This prospectus contains “forward-looking statements” within the meaning of the federal securities laws, including certain of the statements under “Prospectus Summary,” “Management’s Discussion and Analysis of Financial Condition and Results of Operations” and “Business.” Forward-looking statements include all statements that do not relate solely to historical or current facts, and can be identified by the use of words like “may,” “believe,” “will,” “expect,” “project,” “estimate,” “anticipate,” “plan,” “initiative” or “continue.” These forward-looking statements are based on our current plans and expectations and are subject to a number of known and unknown uncertainties and risks, many of which are beyond our control, that could significantly affect current plans and expectations and our future financial position and results of operations. These factors include, but are not limited to:
| • | the timing and scope of technological advances; |
| • | consolidation in our customers’ industries may reduce the aggregate demand for our services; |
| • | customer procurement strategies that could put additional pricing pressure on us; |
| • | general economic conditions, including the effects of the current economic environment on advertising spending levels, the costs of, and demand for, consumer packaged goods, media, entertainment and technology products and any interest rate or exchange rate fluctuations; |
| • | our substantial indebtedness; |
| • | certain covenants in our debt documents and our ability to comply with such covenants; |
| • | regulatory review by governmental agencies that oversee information gathering and changes in data protection laws; |
| • | the ability to maintain the confidentiality of our proprietary information gathering processes and intellectual property; |
| • | intellectual property infringement claims by third parties; |
| • | risks to which our international operations are exposed, including local political and economic conditions, the effects of foreign currency fluctuations and the ability to comply with local laws; |
| • | criticism of our audience measurement services; |
| • | the ability to attract and retain customers and key personnel; |
| • | the effect of disruptions to our information processing systems; |
| • | the effect of disruptions in the mail, telecommunication infrastructure and/or air services; |
| • | the impact of tax planning initiatives and resolution of audits of prior tax years; |
| • | future litigation or government investigations; |
| • | the possibility that the Sponsors’ interests will conflict with ours or yours; |
| • | the impact of competitive products; |
| • | the financial statement impact of changes in generally accepted accounting principles; and |
| • | the ability to successfully integrate our company in accordance with our strategy and success of our joint ventures. |
We caution you that the foregoing list of important factors may not contain all of the material factors that are important to you. In addition, in light of these risks and uncertainties, the matters referred to in the forward-looking statements contained in this prospectus may not in fact occur. We undertake no obligation to publicly update or revise any forward-looking statement as a result of new information, future events or otherwise, except as otherwise required by law.
28
Table of Contents
We estimate that the net proceeds we will receive from the sale of shares of our common stock in this offering, after deducting underwriters’ discounts and commissions and estimated expenses payable by us, will be approximately $1,661 million (or $ million if the underwriters exercise the option to purchase additional shares in full). This estimate assumes an initial public offering price of $ per share, the midpoint of the range set forth on the cover page of this prospectus. A $1.00 increase (decrease) in the assumed initial public offering price of $ per share would increase (decrease) the net proceeds to us from this offering by $ million, assuming the number of shares offered by us, as set forth on the cover page of this prospectus, remains the same and after deducting the estimated underwriting discounts and commissions and estimated expenses payable by us.
We intend to use the anticipated net proceeds as follows:
| • | approximately $127 million of the net proceeds will be applied to repay approximately $127 million of senior secured term loans due 2013; |
| • | approximately $914 million of the net proceeds will be applied to redeem approximately $870 million in aggregate principal amount of our 10% Senior Notes due 2014; |
| • | approximately $195 million of the net proceeds will be applied to redeem approximately $163 million in aggregate principal amount (approximately $175 million face amount) of our 11.5% Senior Notes due 2016; |
| • | approximately $128 million of the net proceeds will be applied to redeem approximately $106 million in aggregate principal amount (approximately $115 million face amount) of our 11.625% Senior Notes due 2014; |
| • | approximately $194 million of the net proceeds will be applied to redeem approximately $186 million in aggregate principal amount of our 9% Senior Notes due 2014; and |
| • | approximately $103 million will be paid to the Sponsors as a fee in connection with the termination of certain advisory agreements in accordance with their terms, as described under “Certain Relationships and Related Party Transactions—Advisory Agreements.” |
The redemptions of the 11.5% Senior Notes due 2016 and 11.625% Senior Notes due 2014 will be made pursuant to a provision of the applicable indenture that permits us to redeem up to 35% of the aggregate principal amount of such notes with the net cash proceeds of certain equity offerings. In each case, we will pay accrued and unpaid interest on the notes through the redemption date with cash generated from operations. To the extent that the underwriters exercise all or a portion of their option to purchase additional shares of our common stock, the net proceeds received will be used for further repayment of indebtedness in amounts and denominations to be determined at such time. A portion of the debt that will be repaid is held by the Sponsors and their affiliates as well as affiliates of the underwriters in this offering.
As of June 30, 2010, there was outstanding:
| • | $2,900 million and €309 million aggregate principal amount of senior secured term loans due 2013, which had a weighted average interest rate of 2.36% as of June 30, 2010 and mature on August 9, 2013; |
| • | $869 million aggregate principal amount of 10% Senior Notes due 2014, which bear interest at a rate of 10% per annum and mature on August 1, 2014; |
| • | $465 million aggregate principal amount ($500 million face amount) of 11.5% Senior Notes due 2014, which bear interest at a rate of 11.5% per annum and mature on May 1, 2016; |
| • | $304 million aggregate principal amount ($330 million face amount) of 11.625% Senior Notes due 2014, which bear interest at a rate of 11.625% per annum and mature on February 1, 2014; |
| • | €150 million aggregate principal amount of 9% Senior Notes due 2014, which bear interest at a rate of 9% per annum and mature on August 1, 2014 |
On August 12, 2010, the maturity of approximately $1.5 billion in principal amount of the senior secured term loans due 2013 was extended as described under “Description of Indebtedness—2006 Senior Secured Credit Facilities.”
29
Table of Contents
Following completion of the offering, we do not intend to pay any cash dividends on our common stock for the foreseeable future and instead may retain earnings, if any, for future operation and expansion and debt repayment. Any decision to declare and pay dividends in the future will be made at the discretion of our board of directors and will depend on, among other things, our results of operations, cash requirements, financial condition, contractual restrictions and other factors that our board of directors may deem relevant. Furthermore, a determination by the board of directors to distribute dividends must be approved by our stockholders. In addition, our ability to pay dividends is limited by covenants in our senior secured credit facilities and in the indentures governing our notes. See “Description of Indebtedness” and Note 10 to our audited consolidated financial statements for restrictions on our ability to pay dividends.
30
Table of Contents
The following table sets forth our capitalization as of June 30, 2010:
| • | on an actual basis; and |
| • | on an as adjusted basis to give effect to the issuance of common stock in this offering, the application of proceeds from the offering as described in “Use of Proceeds” and the extension of the maturity of approximately $1.5 billion aggregate principal amount of senior secured term loans due 2013 to 2016 as described under “Description of Indebtedness—2006 Senior Secured Credit Facilities” as if each had occurred on June 30, 2010. |
You should read this table in conjunction with “Prospectus Summary—Summary Financial and Other Data,” “Use of Proceeds,” “Selected Financial and Other Data,” and “Management’s Discussion and Analysis of Financial Condition and Results of Operations” and our financial statements and notes thereto, included elsewhere in this prospectus.
| June 30, 2010 | |||||||
| (IN MILLIONS) | |||||||
| Actual | As Adjusted | ||||||
| Cash and cash equivalents |
$ | 371 | $ | ||||
| Long-term obligations: |
|||||||
| Senior secured term loans due 2013(1) |
$ | 3,283 | $ | ||||
| Senior secured term loans due 2016(2) |
1,218 | ||||||
|
8 1/2 % Senior secured term loan due 2017 |
500 | ||||||
| Revolving credit facility(3) |
— | ||||||
|
11 5/8 % Senior Notes due 2014(4) |
304 | ||||||
| 10% Senior Notes due 2014(5) |
869 | ||||||
| 9% Senior Notes due 2014(6) |
186 | ||||||
|
12 1/2 % Senior Subordinated Discount Notes due 2016(7) |
940 | ||||||
|
11 1/8 % Senior Discount Notes due 2016(8) |
378 | ||||||
|
11 1/2 % Senior Notes due 2016(9) |
465 | ||||||
| Euro Medium Term Notes(10) |
145 | ||||||
| Other long-term debt |
5 | ||||||
| Capital lease obligations |
128 | ||||||
| Total long-term debt and capital lease obligations, including current portion(11) |
8,421 | ||||||
| Nielsen stockholders’ equity: |
|||||||
| Common stock, €0.04 par value, 1,250,000,000 shares authorized, 443,078,009 shares issued and 442,192,538 shares outstanding; pro forma 2,000,000,000 shares authorized, issued and shares outstanding |
22 | ||||||
| Cumulative preferred stock, Series PA, €0.04 par value, none authorized; pro forma 100,000,000 shares authorized, none issued and outstanding |
— | ||||||
| Cumulative preferred stock, Series PB, €0.04 par value, none authorized; pro forma 100,000,000 shares authorized, none issued and outstanding |
— | ||||||
| Additional paid-in capital |
4,578 | ||||||
| Accumulated deficit |
(1,623 | ) | |||||
| Accumulated other comprehensive loss, net of income taxes |
(181 | ) | |||||
| Total Nielsen stockholders’ equity |
2,796 | ||||||
| Total capitalization |
$ | 11,217 | $ | ||||
| (1) | Actual is comprised of two tranches of $2,900 million and €309 million. |
| (2) | Actual is comprised of two tranches of $1,000 million and €176 million. |
| (3) | Our revolving credit facility provides for availability of $688 million. As of June 30, 2010, we had no borrowings outstanding under our revolving credit facility, not including $19 million of outstanding letters of credit and bank guarantees. |
31
Table of Contents
| (4) | $330 million face amount. |
| (5) | $870 million face amount. |
| (6) | Denominated in Euros and had a face amount of €150 million. |
| (7) | $1,070 million face amount. |
| (8) | Debt is denominated in Euros and had a face amount of €343 million. |
| (9) | $500 million face amount. |
| (10) | Of the debt issued pursuant to our Euro Medium Term Note program, €80 million is denominated in Euros, of which €50 million is based on a variable rate of 3-month EURIBOR and the remaining €30 million carries a fixed rate of 6.75%. The remaining portion is denominated in Japanese yen, with an aggregate outstanding principal amount of ¥4,000 million based on a fixed rate of 2.50%. |
| (11) | Excludes bank overdrafts in the amount of $18 million. |
The table set forth above is based on the number of shares of our common stock outstanding as of June 30, 2010. This table does not reflect:
| • | shares of our common stock issuable upon the exercise of outstanding stock options at a weighted average exercise price of $ per share as of June 30, 2010, of which were then exercisable; and |
| • | shares of our common stock reserved for future grants under our 2006 Stock Acquisition and Option Plan and/or any new employee benefits plans that we may create prior to the completion of this offering. |
32
Table of Contents
If you invest in our common stock, your interest will be diluted to the extent of the difference between the initial public offering price per share of our common stock and the net tangible book value or deficiency per share of our common stock after this offering. Dilution results from the fact that the initial public offering price per share of common stock is substantially in excess of the net tangible book value or deficiency per share of our common stock attributable to the existing stockholders for our presently outstanding shares of common stock. We calculate net tangible book value or deficiency per share of our common stock by dividing the net tangible book value or deficiency (total consolidated tangible assets less total consolidated liabilities) by the number of outstanding shares of our common stock.
Our net tangible book deficit as of June 30, 2010 was $(8,781) million, or $(19.86) per share of our common stock, based on 442,192,538 shares of our common stock outstanding. Dilution is determined by subtracting pro forma net tangible book value or deficiency per share of our common stock after giving effect to this offering from the assumed initial public offering price per share of our common stock.
Without taking into account any other changes in such net tangible book value or deficiency after June 30, 2010, after giving effect to the sale of shares of our common stock in this offering assuming an initial public offering price of $ per share, less the underwriting discounts and commissions and the estimated offering expenses payable by us, our pro forma as adjusted net tangible book or deficit at June 30, 2010 would have been $ , or $ per share. This represents an immediate increase in net tangible book value (or decrease in net tangible book deficit) of $ per share of our common stock to the existing stockholders and an immediate dilution in net tangible book or deficit of $ per share of our common stock, to investors purchasing shares of our common stock in this offering. The following table illustrates such per share of our common stock dilution:
| Assumed initial public offering price per share of our common stock |
$ | ||
| Net tangible book deficit per share of our common stock as of June 30, 2010 |
|||
| Pro forma net tangible book deficit per share of our common stock after giving effect to this offering |
|||
| Amount of dilution per share of our common stock to new investors in this offering |
If the underwriters exercise their underwriters’ option in full, the adjusted net tangible book value or deficiency per share of our common stock after giving effect to the offering would be $ per share of our common stock. This represents an increase in adjusted net tangible book value (or decrease in net tangible book deficit) of $ per share of our common stock to existing stockholders and dilution of $ per share of our common stock to new investors.
A $1.00 increase (decrease) in the assumed initial public offering price of $ per share of our common stock would increase (decrease) our net tangible book value (or decrease in net tangible book deficit) after giving to the offering by $ million, or by $ per share of our common stock, assuming no change to the number of shares of our common stock offered by us as set forth on the cover page of this prospectus, and after deducting the estimated underwriting discounts and estimated expenses payable by us.
The following table summarizes, on a pro forma basis as of June 30, 2010, the total number of shares of our common stock purchased from us, the total cash consideration paid to us and the average price per share of our common stock paid by purchasers of such shares and by new investors purchasing shares of our common stock in this offering.
| Shares of our Common Stock Purchased |
Total Consideration | Average Price Per Share of our Common Stock | ||||||||||||
| Number | Percent | Amount | Percent | |||||||||||
| Prior purchasers |
% | $ | % | $ | ||||||||||
| New investors |
% | $ | % | $ | ||||||||||
| Total |
% | $ | % | $ | ||||||||||
33
Table of Contents
If the underwriters were to fully exercise the underwriters’ option to purchase additional shares of our common stock, the percentage of shares of our common stock held by existing stockholders who are directors, officers or affiliated person would be %, and the percentage of shares of shares of our common stock held by new investors would be %.
To the extent that we grant options to our employees in the future, and those options are exercised or other issuances of shares of our common stock are made, there will be further dilution to new investors.
34
Table of Contents
SELECTED FINANCIAL AND OTHER DATA
The following table sets forth selected historical consolidated financial data of Nielsen Holdings as of the dates and for the periods indicated. The successor selected consolidated statement of operations data for the years ended December 31, 2009, 2008 and 2007 and selected consolidated balance sheet data as of December 31, 2009 and 2008 have been derived from our audited consolidated financial statements and related notes appearing elsewhere in this prospectus. The successor selected consolidated statement of operations data for the period from May 24, 2006 to December 31, 2006 and selected consolidated balance sheet data as of December 31, 2007 and 2006 have been derived from our unaudited condensed consolidated financial statements which are not included in this prospectus. The predecessor selected consolidated statement of operations data for the period from January 1, 2006 to May 23, 2006 and the year ended December 31, 2005 and selected consolidated balance sheet data as of December 31, 2005 have been derived from our predecessor’s audited consolidated financial statements which are not included in this prospectus.
The selected financial and other data as of June 30, 2010 and for the six months ended June 30, 2010 and 2009 have been derived from our unaudited condensed consolidated financial statements included elsewhere in this prospectus. The selected unaudited financial data presented have been prepared on a basis consistent with our audited consolidated financial statements. In the opinion of management, such unaudited financial data reflect all adjustments, consisting only of normal and recurring adjustments, necessary for a fair presentation of the results for those periods.
The results of operations for any period are not necessarily indicative of the results to be expected for any future period. The audited consolidated financial statements from which the historical financial information for the periods set forth below have been derived were prepared in accordance with GAAP. The selected historical consolidated financial data set forth below should be read in conjunction with, and are qualified by reference to “Management’s Discussion and Analysis of Financial Condition and Results of Operations” and our audited consolidated financial statements and related notes thereto appearing elsewhere in this prospectus.
| Successor | Predecessor | |||||||||||||||||||||||||||||||
| (IN MILLIONS, EXCEPT PER |
Six Months Ended June 30, 2010(1) |
Six Months Ended June 30, 2009(2) |
Year Ended December 31, 2009(3) |
Year Ended December 31, 2008(4) |
Year Ended December 31, 2007(5) |
May 24- December 31, 2006(6) |
January 1- May 23, 2006 |
Year Ended December 31 2005(7) | ||||||||||||||||||||||||
| Statement of Operations Data: |
||||||||||||||||||||||||||||||||
| Revenues |
$ | 2,466 | $ | 2,284 | $ | 4,808 | $ | 4,806 | $ | 4,458 | $ | 2,405 | $ | 1,513 | $ | 3,789 | ||||||||||||||||
| Operating income |
314 | 284 | 116 | 420 | 376 | 86 | 39 | 314 | ||||||||||||||||||||||||
| Income/(loss) from continuing operations |
125 | (7 | ) | (428 | ) | (314 | ) | (364 | ) | (293 | ) | (24 | ) | 139 | ||||||||||||||||||
| Income/(loss) from continuing operations per common share (basic and diluted) |
0.28 | (0.02 | ) | (0.98 | ) | (0.87 | ) | (1.01 | ) | (0.84 | ) | (0.10 | ) | 0.51 | ||||||||||||||||||
| Cash dividends declared per common share |
— | — | — | — | — | — | — | 0.15 | ||||||||||||||||||||||||
| Successor | Predecessor | |||||||||||||||||||
| June
30, 2010 |
December 31, | December 31, 2005 | ||||||||||||||||||
| (IN MILLIONS) |
2009 | 2008 | 2007 | 2006 | ||||||||||||||||
| Balance Sheet Data: |
||||||||||||||||||||
| Total assets |
$ | 14,194 | $ | 14,600 | $ | 15,091 | $ | 16,135 | $ | 15,979 | $ | 10,663 | ||||||||
| Long-term debt including capital leases |
8,421 | 8,640 | 9,320 | 8,896 | 8,520 | 2,637 | ||||||||||||||
| (1) | Income for the six months ended June 30, 2010 included $322 million of interest expense and $22 million in restructuring costs. |
35
Table of Contents
| (2) | Income for the six months ended June 30, 2009 included $315 million of interest expense and $9 million in restructuring costs. |
| (3) | The loss in the year ended December 31, 2009 included $647 million of interest expense, a goodwill and intangible asset impairment charge of $527 million and $62 million in restructuring costs. |
| (4) | The loss in the year ended December 31, 2008 included $701 million of interest expense, a goodwill impairment charge of $96 million and $118 million in restructuring costs. |
| (5) | The loss in the year ended December 31, 2007 included $691 million of interest expense, $110 million in foreign currency exchange transaction losses and $133 million in restructuring costs. |
| (6) | The loss in the period May 24, 2006 to December 31, 2006 included $395 million of interest expense, $90 million relating to the deferred revenue purchase price adjustment, $43 million in foreign currency exchange transaction losses and $65 million in restructuring costs. |
| (7) | The 2005 income from continuing operations included $55 million in costs from the settlement of the antitrust agreement with Information Resources, Inc., a $36 million payment of failed deal costs to IMS Health and a $102 million loss from the early extinguishment of debt. |
36
Table of Contents
MANAGEMENT’S DISCUSSION AND ANALYSIS OF FINANCIAL CONDITION AND RESULTS OF OPERATIONS
You should read the following discussion of our results of operations and financial condition with “Prospectus Summary—Summary Financial and Other Data,” “Selected Financial and Other Data” and the audited consolidated financial statements, unaudited condensed consolidated financial statements and related notes included elsewhere in this prospectus. This discussion contains forward-looking statements and involves numerous risks and uncertainties, including, but not limited to, those described in the “Risk Factors” section of this prospectus. Actual results may differ materially from those contained in any forward-looking statements.
Background and Executive Summary
On May 17, 2006, Nielsen Holdings, formerly known as Valcon Acquisition Holding B.V., was formed by investment funds associated with the Original Sponsors as a subsidiary of Valcon Acquisition Holding (Luxembourg) S.à r.l. (“Luxco”). On May 24, 2006, The Nielsen Company B.V. (“TNC B.V.”) (formerly VNU Group B.V. and VNU N.V.) was acquired through a tender offer to stockholders by Valcon Acquisition B.V. (“Valcon”), a wholly owned subsidiary of the Company (herein referred to as the “Acquisition”). Valcon’s cumulative purchases totaled 99.4% of TNC B.V.’s outstanding common stock as of December 31, 2007. In May 2008, Valcon acquired the remaining TNC B.V. common stock through a statutory squeeze-out procedure pursuant to Dutch legal and regulatory requirements and therefore currently holds 100% of TNC B.V.’s outstanding common stock. As part of the Acquisition, Valcon also acquired all of the 7% preference shares of TNC B.V. Valcon also acquired 100% of TNC B.V.’s preferred B shares which were subsequently canceled in 2006. TNC B.V.’s common and preferred shares were delisted from the NYSE Euronext on July 11, 2006. The registered office of Nielsen Holdings is located in Diemen, the Netherlands, with its headquarters located in New York.
Nielsen Holdings, together with its subsidiaries, is a global information and measurement company that provides clients with a comprehensive understanding of consumers and consumer behavior. We deliver critical media and marketing information, analytics and industry expertise about what consumers watch (consumer interaction with television, online and mobile) and what consumers buy on a global and local basis. Our information, insights and solutions help our clients maintain and strengthen their market positions and identify opportunities for profitable growth. We have a presence in approximately 100 countries, including many developing and emerging markets, and hold leading market positions in many of our services and geographies.
We believe that important measures of our results of operations include revenue, operating income and adjusted operating income (defined below). Our long-term financial objectives include consistent revenue growth and expanding operating margins. Accordingly, we are focused on geographic market and service offering expansion to drive revenue growth and improving operating efficiencies including effective resource utilization, information technology leverage and overhead cost management.
Our business strategy is built upon a model that has traditionally yielded consistent revenue performance. Typically, before the start of each year, nearly 70% of our annual revenue has been committed under contracts in our combined Watch and Buy segments, which provides us with a high degree of stability to our revenue and allows us to effectively manage our profitability and cash flows. We continue to look for growth opportunities through global expansion, specifically within developing markets, as well as through the expansion of our insights services and measurement services across what we refer to as the three screens: television, online and mobile.
Our transformation and other productivity initiatives, which were implemented following the Acquisition, are focused on a combination of improving operating leverage through targeted cost-reduction programs, business process improvements, portfolio restructuring actions (e.g. the exit of our Publications businesses) while at the same time investing in key programs to enhance future growth opportunities.
37
Table of Contents
Achieving our business objectives requires us to manage a number of key risk areas. Our growth objective of geographic market and service expansion requires us to maintain the consistency and integrity of our information and underlying processes on a global scale, and to invest effectively our capital in technology and infrastructure to keep pace with our clients’ demands and our competitors. Our operating footprint across approximately 100 countries requires disciplined global and local resource management of internal and third party providers to ensure success. In addition, our high level of indebtedness requires active management of our debt profile, with a focus on underlying maturities, interest rate risk, liquidity and operating cash flows.
Business Segment Overview
We align our business into three reporting segments: Watch (media audience measurement and analytics), Buy (consumer purchasing measurement and analytics) and Expositions. Our Watch and Buy segments, which together generated substantially all of our revenues in 2009, are built on a foundation of proprietary data assets that are designed to yield essential insights for our clients to successfully measure, analyze and grow their businesses.
Our Watch segment provides viewership data and analytics primarily to the media and advertising industries across television, online and mobile screens. Our Watch data is used by our media clients to understand their audiences, establish the value of their advertising inventory and maximize the value of their content, and by our advertising clients to plan and optimize their spending. We are a leader in providing measurement services across the three screens.
Our Buy segment provides Information services, which includes our core tracking and scan data (primarily transactional measurement data and consumer behavior information) and Insights services (primarily comprised of our analytical solutions) to businesses in the consumer packaged goods industry. Our services also enable our clients to better manage their brands, uncover new sources of demand, launch and grow new products, analyze their sales, improve their marketing mix and establish more effective consumer relationships. Our data is used by our clients to measure their market share, tracking billions of sales transactions per month in retail outlets around the world. Our extensive database of retail and consumer information, combined with our advanced analytical capabilities, helps generate strategic insights that influence our clients’ key business decisions. Within our Buy segment, we have two primary geographic groups, developed and developing markets. Developed markets primarily include the United States, Canada, Western Europe, Japan and Australia while developing markets include Latin America, Eastern Europe, Russia, China, India and Southeast Asia.
Our Expositions segment operates one of the largest portfolios of business-to-business trade shows in the United States. Each year, we produce approximately 40 trade shows, which in 2009 connected approximately 270,000 buyers and sellers across 20 industries.
Certain corporate costs, other than those described above, including those related to selling, finance, legal, human resources, and information technology systems, are considered operating costs and are allocated to our segments based on either the actual amount of costs incurred or on a basis consistent with the operations of the underlying segment.
Critical Accounting Policies
The discussion and analysis of our financial condition and results of operations is based on our audited consolidated financial statements and unaudited condensed consolidated financial statements, each of which have been prepared in accordance with GAAP. The preparation of financial statements requires management to make estimates and assumptions that affect the reported amounts of assets and liabilities, revenues and expenses and the related disclosure of contingent assets and liabilities. The most significant of these estimates relate to: revenue recognition; business combinations including purchase price allocations; accruals for pension costs and
38
Table of Contents
other post-retirement benefits; accounting for income taxes; and valuation of long-lived assets including goodwill and indefinite-lived intangible assets, computer software and share-based compensation. We base our estimates on historical experience and on various other assumptions that we believe are reasonable under the circumstances, the results of which form the basis for making judgments about the valuation of assets and liabilities that are not readily apparent from other sources. We evaluate these estimates on an ongoing basis. Actual results could vary from these estimates under different assumptions or conditions. For a summary of the significant accounting policies, including critical accounting policies discussed below, see Note 1 to the audited consolidated financial statements “Description of Business, Basis of Presentation and Significant Accounting Policies,” included elsewhere in this prospectus.
Revenue Recognition
We recognize our revenues when persuasive evidence of an arrangement exists, services have been rendered or information has been delivered, the fee is fixed or determinable and the collectibility of the related revenue is reasonably assured.
A significant portion of our revenue is generated from information (primarily retail measurement and consumer panel services) and measurement (primarily from television, internet and mobile audiences) services. We generally recognize revenue from the sale of our services based upon fair value as the services are performed, which is usually ratably over the term of the contract(s). Invoiced amounts are recorded as deferred revenue until earned. Substantially all of our customer contracts are non-cancellable and non-refundable.
Our revenue arrangements may include multiple deliverables and in these arrangements, the individual deliverables within a contract are separated and recognized upon delivery based upon their fair values relative to the total contract value, to the extent that the fair values are readily determinable and the deliverables have stand-alone value to the customer. In certain cases, software is included as part of these arrangements to allow our customers to supplementally view delivered information and is provided for the term of the arrangement and is not significant to the marketing effort and is not sold separately. Accordingly, software provided to our customers is considered to be incidental to the arrangements and is not recognized as a separate element.
A discussion of our revenue recognition policies, by segment, follows:
Watch
Revenue from our Watch segment is primarily generated from television, internet and mobile measurement services and is recognized on a straight-line basis over the contract period, as the service is delivered to the customer.
Buy
Revenue from our Buy segment, primarily from retail measurement services and consumer panel services, is recognized on a straight-line basis over the period during which the services are performed and information is delivered to the customer.
We provide insights and solutions to customers through analytical studies that are recognized into revenue as value is delivered to the customer. The pattern of revenue recognition for these contracts varies depending on the terms of the individual contracts, and may be recognized proportionally or deferred until the end of the contract term and recognized when the information has been delivered to the customer.
Expositions
Revenue and certain costs within our Expositions segment are recognized upon completion of each event.
39
Table of Contents
Share-Based Compensation
Expense Recognition
We measure the cost of all share-based payments, including stock options, at fair value on the grant date and recognize such costs within the Consolidated Statements of Operations; however, no expense is recognized for stock options that do not ultimately vest. We recognize expense associated with stock options that vest upon a single date using the straight-line method. For those that vest over time, an accelerated graded vesting is used. We recorded $9 million of expense and $1 million of net credits for the six months ended June 30, 2010 and 2009, respectively. We also recorded $14 million, $18 million and $52 million of expense associated with share-based compensation for the years ended December 31, 2009, 2008 and 2007, respectively. The aggregate fair value of all outstanding vested and unvested options was $67 million and $66 million, respectively, as of June 30, 2010.
Fair Value Measurement and Valuation Methodologies
Share-based compensation expense is primarily based on the estimated grant date fair value using the Black-Scholes option pricing model. Determining the fair value of stock-based awards at the grant date requires considerable judgment, including the consideration of factors such as estimating the expected term of stock options, expected volatility of our stock, and the number of stock-based awards expected to be forfeited due to future terminations. Some of the critical assumptions used in estimating the grant date fair value are presented in the table below:
| Year Ended December 31, | |||||||||
| 2009 | 2008 | 2007 | |||||||
| Expected life (years) |
3.42 - 4.08 | 2.93 - 3.02 | 3.42 - 4.31 | ||||||
| Risk-free interest rate |
1.70 - 2.07 | % | 2.77 | % | 3.17 - 4.77 | % | |||
| Expected dividend yield |
0 | % | 0 | % | 0 | % | |||
| Expected volatility |
54.00 - 62.00 | % | 39.00 | % | 46.50 - 56.10 | % | |||
| Weighted average volatility |
57.77 | % | 39.00 | % | 55.03 | % | |||
In addition, for stock-based awards where vesting is dependent upon achieving certain operating performance goals, we estimate the likelihood of achieving the performance goals. Differences between actual results and these estimates could have a material effect on our financial results. We consider several factors in estimating the expected life of our options granted, including the expected lives used by a peer group of companies and the historical option exercise behavior of our employees, which we believe are representative of future behavior. Expected volatility is based primarily on a combination of the estimates of implied volatility of the Company’s peer-group and the Company’s historical volatility adjusted for its leverage. The assumptions used in calculating the fair value of share-based awards represent our best estimates, but these estimates involve inherent uncertainties and the application of management’s judgment.
| Stock Option Grant Period |
Number of Options Granted |
Weighted-Average Exercise Price |
Weighted-Average Grant Date Fair Value per Share |
Weighted-Average Grant Date Fair Value per Option | |||||||
| Three months ended June 30, 2009 |
908,700 | $ | 11.38 | $ | 10.00 | $ | 4.08 | ||||
| Three months ended September 30, 2009 |
99,000 | 11.38 | 10.00 | 4.08 | |||||||
| Three months ended December 31, 2009 |
767,188 | 11.42 | 10.00 | 4.24 | |||||||
| Three months ended March 31, 2010 |
1,539,348 | 11.67 | 11.50 | 4.98 | |||||||
| Three months ended June 30, 2010 |
203,435 | 12.14 | 11.56 | 5.53 | |||||||
40
Table of Contents
Our board of directors sets the exercise price of stock options with the intention that the price per share is not less than the estimated fair market value of our common stock on the date of grant. Our board has taken into consideration numerous objective and subjective factors to determine the fair market value of our common stock on each grant date in order to be able to set exercise prices. Such factors included, but were not limited to, (i) valuations using the methodologies described below, (ii) our operating and financial performance and (iii) the impact of global economic factors on market values.
Since our common stock is not publicly traded, we conduct common stock valuation analyses on a semi-annual basis (as of June 30th and December 31st for each annual period) as well as on an interim basis considering the significance of individual grants. We consider numerous objective and subjective factors in valuing our common stock at each valuation date in accordance with the guidance in the American Institute of Certified Public Accountants Practice Aid Valuation of Privately-Held-Company Equity Securities Issued as Compensation, or Practice Aid. These objective and subjective factors included, but were not limited to:
| • | arm’s-length sales of our common stock in privately negotiated transactions; |
| • | valuations of our common stock; |
| • | our stage of development and financial position; and |
| • | our future financial projections. |
Our common stock valuations performed from the Acquisition through the date of this prospectus were determined by taking a weighted-average value calculated under two different valuation approaches, the income approach and market approach.
The Income Approach quantifies the future cash flows that management expects to achieve consistent with our annual business plan and forecasting process. These future cash flows are discounted to their net present values using a rate corresponding to an estimated weighted-average cost of capital. The discount rate reflects the risks inherent in the cash flows and the market rates of return available from alternative investments of similar type and quality as of the valuation date. Our weighted average cost of capital (“WACC”) is calculated by weighting the required returns on interest-bearing debt and common equity capital in proportion to their estimated percentages in our capital structure as well as the capital structure of comparable publicly-traded companies. Our WACC assumptions utilized in the valuations performed during the period from April 1, 2009 through June 30, 2010 ranged from 9.6% to 9.8%.
The Market Approach considers the fair value of an asset based on the price at which comparable assets have been purchased under similar circumstances. The transactions are usually based on recent sale prices of similar assets based on an arm’s length transaction. Most commonly, the market approach relies on published transactions, based on a multiple of earnings before interest, taxes, depreciation and amortization (EBITDA), which is consistent with the primary profitability metric underlying our annual business plan and forecasting process. The EBITDA multiples were determined based on acquisition and/or trading multiples of a peer group of companies that are periodically reviewed by management for consistency with our business strategy, the businesses and markets in which we operate and our competitive landscape. The EBITDA multiples ranged from 8.5x to 10.0x in the valuations performed during the period from April 1, 2009 through June 30, 2010.
While we believe both of these two approaches provide reliable estimates of fair value, we apply a heavier weighting to the income approach as we believe this valuation method provides a more reasonable estimate of fair value given the market approach may reflect greater volatility based on the trading multiples of a peer group in an unstable or illiquid market. We have not applied a discounting factor to the resulting fair values obtained by averaging the values calculated under the income approach and the market for the lack of marketability of the common stock for being a private company.
During the periods discussed above, we performed valuations of our common stock in December 2008, June 2009, December 2009, March 2010, April 2010 and June 2010. As a standard part of its approval process for
41
Table of Contents
each of these valuations, our board of directors reviewed our current and projected financial performance, including the consideration of various scenarios of such performance and their corresponding impact on our common stock valuation. As part of our board’s assessment of our operating performance it considered general economic conditions. Additionally, our board reviewed the peer group of companies and their performance relative to our business strategy. Finally, on each valuation date, our board considered the volatility in the equity markets generally.
Business Combinations
We account for our business acquisitions under the purchase method of accounting. The total cost of acquisitions is allocated to the underlying net assets, based on their respective estimated fair values. Determining the fair value of assets acquired and liabilities assumed requires significant judgment and often involves the use of significant estimates and assumptions, including assumptions with respect to future cash inflows and outflows, discount rates, asset lives, and market multiples, among other items.
Goodwill and Indefinite-Lived Intangible Assets
Goodwill and other indefinite-lived intangible assets are stated at historical cost less accumulated impairment losses, if any.
Goodwill and other indefinite-lived intangible assets, consisting of certain trade names and trademarks, are each tested for impairment on an annual basis and whenever events or circumstances indicate that the carrying amount of such asset may not be recoverable. We have designated October 1st as the date in which the annual assessment is performed as this timing corresponds with the development of our formal budget and business plan review. We review the recoverability of its goodwill by comparing the estimated fair values of reporting units with their respective carrying amounts. We established, and continue to evaluate, our reporting units based on our internal reporting structure and generally define such reporting units at our operating segment level or one level below. Similar to the approach we take in valuing our common stock, the estimates of fair value of a reporting unit are determined using a combination of valuation techniques, primarily by an income approach using a discounted cash flow analysis and a market-based approach.
A discounted cash flow analysis requires the use of various assumptions, including expectations of future cash flows, growth rates, discount rates and tax rates in developing the present value of future cash flow projections. Many of the factors used in assessing fair value are outside of the control of management, and these assumptions and estimates can change in future periods. Changes in assumptions or estimates could materially affect the determination of the fair value of a reporting unit, and therefore could affect the amount of potential impairment. The following assumptions are significant to our discounted cash flow analysis:
| • | Business projections—the assumptions of expected future cash flows and growth rates are based on assumptions about the level of business activity in the marketplace as well as applicable cost levels that drive our budget and business plans. The budget and business plans are updated at least annually and are frequently reviewed by management and our board of directors. Actual results of operations, cash flows and other factors will likely differ from the estimates used in our valuation, and it is possible that differences and changes could be material. A deterioration in profitability, adverse market conditions and a slower or weaker economic recovery than currently estimated by management could have a significant impact on the estimated fair value of our reporting units and could result in an impairment charge in the future. |
| • | Long-term growth rates—the assumed long-term growth rate representing the expected rate at which a reporting unit’s earnings stream, beyond that of the budget and business plan period, is projected to grow. These rates are used to calculate the terminal value, or value at the end of the future earnings stream, of our reporting units, and are added to the cash flows projected for the budget and business plan period. The long-term growth rate for each reporting unit is influenced by general market conditions as well as factors specific to the reporting unit such as the maturity of the underlying services. The long-term growth rates we used for our reporting units were between 2% and 4%. |
42
Table of Contents
| • | Discount rates—the reporting unit’s combined future cash flows are discounted at a rate that is consistent with a weighted-average cost of capital that is likely to be used by market participants. The weighted-average cost of capital is our estimate of the overall after-tax rate of return required by equity and debt holders of a business enterprise. The discount rate for each reporting unit is influenced by general market conditions as well as factors specific to the reporting unit. The discount rates we used for our reporting units were between 9% and 14%. |
These estimates and assumptions vary between each reporting unit depending on the facts and circumstances specific to that unit. We believe that the estimates and assumptions we made are reasonable, but they are susceptible to change from period to period.
We also use a market-based approach in estimating the fair value of our reporting units. The market-based approach utilizes available market comparisons such as indicative industry multiples that are applied to current year revenue and earnings as well as recent comparable transactions.
To validate the reasonableness of the reporting unit fair values, we reconcile the aggregate fair values of our reporting units to our enterprise market capitalization. Enterprise market capitalization includes, among other factors, the estimated fair value of our common stock and the appropriate redemption values of our debt.
The following table summarizes the results of the eight reporting units that were subject to the October 1, 2009 annual impairment testing and the related goodwill value associated with the reporting units for (a) fair values exceeding carrying values by less than 10%, (b) fair values exceeding carrying values between 10% and 20% and (c) fair values exceeding carrying values by more than 20%.
| Fair value exceeds carrying value by: |
Number of reporting units |
Reporting units goodwill (in millions) | |||
| Less than 10%(1) |
3 | $ | 668 | ||
| 10% to 20% |
2 | 3,095 | |||
| Greater than 20% |
3 | 3,280 | |||
| Totals |
8 | $ | 7,043 | ||
| (1) | These reporting units were impaired during the third quarter of 2009 and therefore fair value approximated carrying value as of our October 1, 2009 annual impairment test. |
As of our October 1, 2009 testing date, we had $7,043 million of goodwill on our balance sheet and as discussed further below (See “—Impairment of Goodwill and Intangibles”), our results from continuing operations for the year ended December 31, 2009 includes an aggregate goodwill impairment charge of $282 million, which was recorded in the third quarter of 2009. We also recorded a goodwill impairment charge of $55 million in the third quarter of 2009 relating to our Publications operating segment, which has been accounted for as a discontinued operation. Our October 1, 2009 annual impairment testing indicated that the fair values of the reporting units exceeded the carrying values, thereby resulting in no further impairment.
We also perform sensitivity analyses on our assumptions, primarily around both long-term growth rate and discount rate assumptions. Our sensitivity analyses include several combinations of reasonably possible scenarios with regard to these assumptions. However, we consistently test a one percent movement in both our long-term growth rate and discount rate assumptions. When applying these sensitivity analyses, we noted this would result in one of our reporting units, with goodwill of $365 million as of our October 1, 2009 testing date, moving to the “less than 10%” classification and therefore $1,033 million, or approximately 15% of our total goodwill balance would be within this classification. However, since the effects of applying our sensitivity analyses based upon reasonably possible adverse changes in assumptions still resulted in fair values of our reporting units in excess of underlying carrying values, we concluded an impairment did not exist as of October 1, 2009 and it was not reasonably likely that an impairment would occur in the next twelve months from that date.
43
Table of Contents
Our operating results for the year ended December 31, 2008 include a goodwill impairment charge of $96 million. We also recorded a goodwill impairment charge of $336 million for the year ended December 31, 2008 relating to our Publications operating segment, which has been accounted for as a discontinued operation. The tests for 2007 confirmed that the fair value of our reporting units and indefinite lived intangible assets exceeded their respective carrying amounts and that no impairment was required.
The impairment test for other indefinite-lived intangible assets consists of a comparison of the fair value of the intangible asset with its carrying amount. If the carrying amount of the intangible asset exceeds its fair value, an impairment loss is recognized in an amount equal to that excess. The estimates of fair value of trade names and trademarks are determined using a “relief from royalty” discounted cash flow valuation methodology. Significant assumptions inherent in this methodology include estimates of royalty rates and discount rates. Discount rate assumptions are based on an assessment of the risk inherent in the respective intangible assets. Assumptions about royalty rates are based on the rates at which comparable trade names and trademarks are being licensed in the marketplace.
Pension Costs
We provide a number of retirement benefits to our employees, including defined benefit pension plans and post retirement medical plans. Pension costs, in respect of defined benefit pension plans, primarily represent the increase in the actuarial present value of the obligation for pension benefits based on employee service during the year and the interest on this obligation in respect of employee service in previous years, net of the expected return on plan assets. Differences between this expected return and the actual return on these plan assets and actuarial changes are not recognized in the statement of operations, unless the accumulated differences and changes exceed a certain threshold. The excess is amortized and charged to the statement of operations over, at the maximum, the average remaining term of employee service. We recognize obligations for contributions to defined contribution pension plans as expenses in the statement of operations as they are incurred.
The determination of benefit obligations and expenses is based on actuarial models. In order to measure benefit costs and obligations using these models, critical assumptions are made with regard to the discount rate, the expected return on plan assets and the assumed rate of compensation increases. We provide retiree medical benefits to a limited number of participants in the United States. and have ceased to provide retiree health care benefits to certain of our Dutch retirees. Therefore, retiree medical care cost trend rates are not a significant driver of our post retirement costs. Management reviews these critical assumptions at least annually. Other assumptions involve demographic factors such as turnover, retirement and mortality rates. Management reviews these assumptions periodically and updates them as necessary.
The discount rate is the rate at which the benefit obligations could be effectively settled. For our U.S. plans, the discount rate is based on a bond portfolio that includes only long-term bonds with an Aa rating, or equivalent, from a major rating agency. We believe the timing and amount of cash flows related to the bonds in this portfolio is expected to match the estimated payment benefit streams of our U.S. plans. For the Dutch and other non-U.S. plans, the discount rate is set by reference to market yields on high-quality corporate bonds.
To determine the expected long-term rate of return on pension plan assets, we consider, for each country, the structure of the asset portfolio and the expected rates of return for each of the components. For our U.S. plans, a 50 basis point decrease in the expected return on assets would increase pension expense on our principal plans by approximately $1 million per year. A similar 50 basis point decrease in the expected return on assets would increase pension expense on our principal Dutch plans by approximately $3 million per year. We assumed that the weighted averages of long-term returns on our pension plans were 6.4%, 6.4 % and 6.1% for the years ended December 31, 2009, 2008 and 2007, respectively. The actual return on plan assets will vary year to year from this assumption. Although the actual return on plan assets will vary from year to year, we believe it is appropriate to use long-term expected forecasts in selecting our expected return on plan assets. As such, there can be no assurance that our actual return on plan assets will approximate the long-term expected forecasts.
44
Table of Contents
Income Taxes
We have a presence in approximately 100 countries. Over the past five years, we completed many material acquisitions and divestitures, which have generated complex tax issues requiring management to use its judgment to make various tax determinations. We try to organize the affairs of our subsidiaries in a tax efficient manner, taking into consideration the jurisdictions in which we operate. Due to outstanding indemnification agreements, the tax payable on select disposals made in recent years has not been finally determined. Although we are confident that tax returns have been appropriately prepared and filed, there is risk that additional tax may be assessed on certain transactions or that the deductibility of certain expenditures may be disallowed for tax purposes. Our policy is to estimate tax risk to the best of our ability and provide accordingly for those risks and take positions in which a high degree of confidence exists that the tax treatment will be accepted by the tax authorities. The policy with respect to deferred taxation is to provide in full for temporary differences using the liability method.
Deferred tax assets and deferred tax liabilities are computed by assessing temporary differences resulting from differing treatment of items for tax and accounting purposes. The carrying value of deferred tax assets is adjusted by a valuation allowance to the extent that these deferred tax assets are not considered to be realized on a more likely than not basis. Realization of deferred tax assets is based, in part, on our judgment and is dependent upon our ability to generate future taxable income in jurisdictions where such assets have arisen. Valuation allowances are recorded in order to reduce the deferred tax assets to the amount expected to be realized in the future. In assessing the adequacy of our valuation allowances, we consider various factors including reversal of deferred tax liabilities, future taxable income and potential tax planning strategies.
Long-Lived Assets
We are required to assess whether the value of our long-lived assets, including our buildings, improvements, technical and other equipment, and amortizable intangible assets have been impaired whenever events or changes in circumstances indicate that the carrying amount of the assets might not be recoverable. We do not perform a periodic assessment of assets for impairment in the absence of such information or indicators. Conditions that would necessitate an impairment assessment include a significant decline in the observable market value of an asset, a significant change in the extent or manner in which an asset is used or a significant adverse change that would indicate that the carrying amount of an asset or group of assets is not recoverable. Recoverability of assets that are held and used is measured by comparing the sum of the future undiscounted cash flows expected to be derived from an asset (or a group of assets) to their carrying value. If the carrying value of the asset (or the group of assets) exceeds the sum of the future undiscounted cash flows, impairment is considered to exist. If impairment is considered to exist based on undiscounted cash flows, the impairment charge is measured using an estimation of the assets’ fair value, typically using a discounted cash flow method. The identification of impairment indicators, the estimation of future cash flows and the determination of fair values for assets (or groups of assets) requires us to make significant judgments concerning the identification and validation of impairment indicators, expected cash flows and applicable discount rates. These estimates are subject to revision as market conditions and our assessments change. Our operating results for the year ended December 31, 2009 include an aggregate customer-related intangible asset impairment charge of $245 million.
We capitalize software development costs with respect to major internal use software initiatives or enhancements. The costs are capitalized from the time that the preliminary project stage is completed, and we consider it probable that the software will be used to perform the function intended until the time the software is placed in service for its intended use. Once the software is placed in service, the capitalized costs are generally amortized over periods of three to six years. If events or changes in circumstances indicate that the carrying value of software may not be recovered, a recoverability analysis is performed based on estimated undiscounted cash flows to be generated from the software in the future. If the analysis indicates that the carrying value is not recoverable from future cash flows, the software cost is written down to estimated fair value and an impairment is recognized. These estimates are subject to revision as market conditions and as our assessments change.
45
Table of Contents
Factors Affecting Nielsen’s Financial Results
Divestitures
During the six months ended June 30, 2010, we received net cash proceeds of $25 million associated with business divestitures, including the sale of our box-office tracking operation as well as the remaining properties within the Publications operating segment discussed further below.
During the year ended December 31, 2009, we received $84 million in net proceeds associated with business divestitures, primarily associated with the sale of our media properties within the Publications operating segment. The impact of the remaining divestitures on our consolidated results of operations was not material.
During the year ended December 31, 2008, we received $23 million in net proceeds primarily associated with two divestitures within our Expositions segment and the final settlement of the sale of our Directories segment to World Directories Acquisition Corp (“World Directories”). The impact of these divestitures on our consolidated statement of operations was not material for all periods presented.
On October 30, 2007, we completed the sale of our 50% share in VNU Exhibitions Europe to Jaarbeurs (Holding) B.V. for cash consideration of $51 million.
Discontinued Operations
Nielsen Publications
In December 2009, we substantially completed the planned exit of our Publications operating segment through the sale of our media properties, including The Hollywood Reporter and Billboard, to e5 Global Media LLC. Our unaudited condensed and audited consolidated financial statements reflect the Publications operating segment as a discontinued operation. The sale resulted in a loss of approximately $14 million, net of taxes of $3 million. The net loss included $10 million of liabilities for certain obligations associated with transition services that were contractually retained by Nielsen. During the six months ended June 30, 2010, we completed the exit of the remaining properties and recorded a net loss on sale of $3 million associated with these divestitures.
Business Media Europe
On February 8, 2007, we completed the sale of a significant portion of our Business Media Europe unit (“BME”) to 3i, a European private equity and venture capital firm for $414 million in cash. During the year ended December 31, 2007, we recorded a gain on sale of discontinued operations of $17 million, primarily related to BME’s previously recognized currency translation adjustments from the date of the Acquisition to the date of sale, and a pension curtailment gain. No other material gain was recognized on the sale because the sales price approximated the carrying value. Our unaudited condensed and audited consolidated financial statements reflect BME as discontinued operations. A portion of the proceeds from the sale of BME was used to pay down our debt under our 2006 Senior Secured Credit Facilities.
See Note 4 to the consolidated and condensed consolidated financial statements, “Business Divestitures,” included elsewhere in this prospectus.
Acquisitions and Investments in Affiliates
For the six months ended June 30, 2010, we paid cash consideration of $38 million associated with both current period and previously executed acquisitions, net of cash acquired. In conjunction with these acquisitions, we recorded deferred consideration of $19 million, which is payable through 2013. Had the current period acquisitions occurred as of January 1, 2010, the impact on our consolidated results of operations would not have been material.
46
Table of Contents
For the six months ended June 30, 2009, we paid cash consideration of $43 million associated with both current period and previously executed acquisitions and investments in affiliates, net of cash acquired. Had these acquisitions occurred as of January 1, 2009, the impact on our consolidated results of operations would not have been material.
For the year ended December 31, 2009, we paid cash consideration of $50 million associated with both current period and previously executed acquisitions and investments in affiliates, net of cash acquired. In conjunction with these acquisitions, we recorded deferred consideration of $25 million, of which $22 million was attributable to a March 2009 acquisition, which in March 2010, was agreed to be settled by a cash payment of $11 million in April 2010 and the issuance of $11 million in equity, substantially all of which is payable through March 2012 and non-cash consideration of $7 million. Had the current period acquisitions occurred as of January 1, 2009, the impact on our consolidated results of operations would not have been material.
On December 19, 2008, we completed the purchase of the remaining 50% interest in AGB Nielsen Media Research (“AGBNMR”), a leading international television audience media measurement business, from WPP Group plc (“WPP”). With our full ownership of AGBNMR, we expect to be able to better leverage our global media product portfolio. In exchange for the remaining 50% interest in AGBNMR, we transferred business assets and ownership interests with an aggregate fair value of $72 million. No material gain or loss was recorded on the business assets and ownerships transferred.
On May 15, 2008, we completed the acquisition of IAG Research, Inc. (“IAG”), for $223 million (including non-cash consideration of $1 million), which was net of $12 million of cash acquired. The acquisition expands our television and internet analytics services through IAG’s measurement of consumer engagement with television programs, national commercials and product placements.
For the year ended December 31, 2008, we paid cash consideration of $39 million associated with other acquisitions and investments in affiliates, net of cash acquired. In conjunction with these acquisitions, and as of December 31, 2008, we recorded deferred consideration of $12 million, which was subsequently paid in January 2009. Had the AGBNMR, IAG and other acquisitions occurred as of January 1, 2008, the impact on our consolidated results of operations would not have been material.
For the year ended December 31, 2007, we completed several acquisitions with an aggregate consideration, net of cash acquired, of $837 million. The most significant acquisitions were the purchase of the remaining minority interest of Nielsen BuzzMetrics ($47 million) on June 4, 2007, the purchase of the remaining minority interest of Nielsen//NetRatings ($330 million, including $33 million to settle all outstanding share-based awards) on June 22, 2007 and the acquisition of Telephia, Inc. (“Telephia”) on August 9, 2007, for approximately $449 million including non-cash consideration of $6 million. Had these acquisitions occurred as of January 1, 2007, the impact on our consolidated results of operations would not have been material. Prior to these acquisitions, both Nielsen//NetRatings and Nielsen BuzzMetrics were consolidated subsidiaries of Nielsen up to the ownership interest.
Foreign Currency
Our financial results are reported in U.S. dollars and are therefore subject to the impact of movements in exchange rates on the translation of the financial information of individual businesses whose functional currencies are other than U.S. dollars. Our principal foreign exchange revenue exposure is spread across several currencies, primarily the Euro. The table below sets forth the profile of our revenue by principal currency.
| Six months ended June 30, 2010 |
Six months ended June 30, 2009 |
Year ended December 31, 2009 |
Year ended December 31, 2008 |
Year ended December 31, 2007 |
|||||||||||
| U.S. Dollar |
53 | % | 56 | % | 53 | % | 53 | % | 55 | % | |||||
| Euro |
14 | % | 13 | % | 16 | % | 16 | % | 15 | % | |||||
| Other Currencies |
33 | % | 31 | % | 31 | % | 31 | % | 30 | % | |||||
| Total |
100 | % | 100 | % | 100 | % | 100 | % | 100 | % |
47
Table of Contents
As a result, fluctuations in the value of foreign currencies relative to the U.S. dollar impact our operating results. Impacts associated with fluctuations in foreign currency are discussed in more detail under “—Quantitative and Qualitative Disclosures about Market Risk.” In countries with currencies other than the U.S. dollar, assets and liabilities are translated into U.S. dollars using end-of-period exchange rates; revenues, expenses and cash flows are translated using average rates of exchange. The average U.S. dollar to Euro exchange rate was $1.33 to €1.00 for both six-month periods ended June 30, 2010 and 2009. The average U.S. dollar to Euro exchange rate was $1.39 to €1.00, $1.47 to €1.00, and $1.37 to €1.00 for the years ended December 31, 2009, 2008 and 2007, respectively. Constant currency growth rates used in the following discussion of results of operations eliminate the impact of year-over-year foreign currency fluctuations.
We have operations in both our Watch and Buy segments in Venezuela and our functional currency for these operations is the Venezuelan bolivares fuertes. Venezuela’s currency was considered hyperinflationary as of January 1, 2010 and further, in January 2010, Venezuela’s currency was devalued and a new currency exchange rate system was announced. We have evaluated the new exchange rate system and have concluded that our local currency transactions will be denominated in U.S. dollars until Venezuela’s currency is deemed to be non hyperinflationary. We recorded a charge of $7 million associated with the currency devaluation in January 2010 in our foreign exchange transaction gains, net line item. In June 2010, a further revision to the currency exchange rate system was made. The impact of the hyperinflationary accounting was not material to our consolidated results of operations for the six months ended June 30, 2010.
We evaluate our results of operations on both an as reported and a constant currency basis. The constant currency presentation is a non-GAAP financial measure, which excludes the impact of fluctuations in foreign currency exchange rates. We believe providing constant currency information provides valuable supplemental information regarding our results of operations, consistent with how we evaluate our performance. We calculate constant currency percentages by converting our prior-period local currency financial results using the current period foreign currency exchange rates and comparing these adjusted amounts to our current period reported results. This calculation may differ from similarly titled measures used by others and, accordingly, the constant currency presentation is not meant to be a substitution for recorded amounts presented in conformity with GAAP nor should such amounts be considered in isolation.
48
Table of Contents
Results of Operations—Six Months Ended June 30, 2010 compared to Six Months Ended June 30, 2009
The following table sets forth, for the periods indicated, the amounts included in our Condensed Consolidated Statements of Operations:
| Six Months Ended June 30, |
||||||||
| (IN MILLIONS) |
2010 | 2009 | ||||||
| Revenues |
$ | 2,466 | $ | 2,284 | ||||
| Cost of revenues, exclusive of depreciation and amortization shown separately below |
1,048 | 963 | ||||||
| Selling, general and administrative expenses, exclusive of depreciation and amortization shown separately below |
805 | 762 | ||||||
| Depreciation and amortization |
277 | 266 | ||||||
| Restructuring costs |
22 | 9 | ||||||
| Operating income |
314 | 284 | ||||||
| Interest income |
2 | 4 | ||||||
| Interest expense |
(322 | ) | (315 | ) | ||||
| Loss on derivative instruments |
(12 | ) | (33 | ) | ||||
| Foreign currency exchange transaction gains, net |
146 | 31 | ||||||
| Other income/(expense), net |
9 | (11 | ) | |||||
| Income/(loss) from continuing operations before income taxes and equity in net income of affiliates |
137 | (40 | ) | |||||
| (Provision)/benefit for income taxes |
(12 | ) | 25 | |||||
| Equity in net income of affiliates |
— | 8 | ||||||
| Income/(loss) from continuing operations |
125 | (7 | ) | |||||
| Loss from discontinued operations, net of tax |
(8 | ) | — | |||||
| Net income/(loss) |
117 | (7 | ) | |||||
| Income attributable to noncontrolling interests |
1 | 1 | ||||||
| Net income/(loss) attributable to The Nielsen Company B.V. |
$ | 116 | $ | (8 | ) | |||
Consolidated Results for the Six Months Ended June 30, 2010 compared to the Six Months Ended June 30, 2009
When comparing our results for the six months ended June 30, 2010 with results for the six months ended June 30, 2009, the following should be noted:
Items affecting Operating Income for the six months ended June 30, 2010
| • | We incurred $22 million of restructuring expense. |
Items affecting Operating Income for the six months ended June 30, 2009
| • | We incurred $9 million of restructuring expense. |
Revenues
Our revenues increased 8.0% to $2,466 million for the six months ended June 30, 2010 from $2,284 million for the six months ended June 30, 2009, or 5.2% on a constant currency basis, excluding a 2.8% favorable impact of changes in foreign currency exchange rates. These increases were driven by an 11.1% increase within our Buy segment (7.4% on a constant currency basis) and a 5.1% increase within our Watch segment (3.5% on a constant currency basis), offset in part by a 13.4% decline in our Expositions segment (13.7% on a constant currency basis).
49
Table of Contents
Cost of Revenues, Exclusive of Depreciation and Amortization
Cost of revenues increased 8.8% to $1,048 million for the six months ended June 30, 2010 from $963 million for the six months ended June 30, 2009, or 6.4% on a constant currency basis, excluding a 2.4% unfavorable impact of changes in foreign currency exchange rates. These increases were driven by an 11.9% increase within our Buy segment (8.9% on a constant currency basis) due to the continued expansion of our Insights services globally as well as a 4.5% increase within our Watch segment (2.9% on a constant currency basis) due to volume related growth in global television measurement.
Selling, General and Administrative Expenses, Exclusive of Depreciation and Amortization
Selling, general and administrative (“SG&A”) expenses increased 5.8% to $805 million for the six months ended June 30, 2010 from $762 million for the six months ended June 30, 2009, or 2.8% on a constant currency basis, excluding a 3.0% unfavorable impact of changes in foreign currency exchange rates. These increases were driven by an 8.3% increase within our Buy segment (4.6% on a constant currency basis) due to the expansion of our Insights services globally as well as an 8.4% increase within our Watch segment (5.8% on a constant currency basis) due to increased spending on three-screen measurement initiatives and a $3 million increase in share-based compensation expense. These increases were partially offset by a 43.9% decline in our Expositions segment (43.0% on a constant currency basis) due to the impact of cost savings initiatives.
Depreciation and Amortization
Depreciation and amortization expense was $277 million for the six months ended June 30, 2010 as compared to $266 million for the six months ended June 30, 2009 driven by higher capital expenditures for software and infrastructure development.
Restructuring Costs
Transformation Initiative
In December 2006, we announced our intention to expand in-process cost efficiency programs to all areas of our operations worldwide. We further announced strategic changes as part of a major corporate transformation (“Transformation Initiative”). The Transformation Initiative was designed to make us a more successful and efficient enterprise by streamlining and centralizing certain corporate, operational and information technology functions, leveraging global procurement, consolidating real estate and expanding the outsourcing or off-shoring of certain other operational production processes. The Transformation Initiative, which continued through 2009, has been completed, but payments will continue through 2010.
We recorded net credits of $4 million for the six months ended June 30, 2010 associated with adjustments to previously established liabilities for employee severance. We incurred $9 million in restructuring charges, primarily relating to severance costs, for the six months ended June 30, 2009.
Other Productivity Initiatives
In December 2009, we commenced certain specific restructuring actions attributable to defined cost reduction programs, primarily in Europe and North America, directed towards achieving increased productivity in future periods. We recorded $26 million in restructuring charges associated with these initiatives during the six months ended June 30, 2010. Of these amounts, approximately $6 million related to property lease termination charges with the remainder relating to severance charges associated with employee terminations.
See Note 6 to our condensed consolidated financial statements, “Restructuring Activities” for additional information regarding our restructuring programs.
50
Table of Contents
Operating Income
Operating income increased 10.6% to $314 million for the six months ended June 30, 2010 from $284 million for the six months ended June 30, 2009, or 6.4% on a constant currency basis, excluding a 4.2% favorable impact of changes in foreign currency exchange rates. Excluding “Items affecting Operating Income,” specifically noted above, our adjusted operating income increased 14.3% (9.7% on a constant currency basis). Adjusted operating income within our Buy segment increased 23.4% (16.7% on a constant currency basis) due to the revenue performance mentioned above as well as cost savings effects of the Transformation Initiative and other productivity and cost savings initiatives. Adjusted operating income growth of $16 million within our Expositions segment, due to lower costs, was substantially offset by higher corporate costs due to increases in certain product investments and global infrastructure costs. Adjusted operating income within our Watch segment increased 1.7% (flat on a constant currency basis) as the revenue growth mentioned above was substantially offset by higher spending on three-screen measurement initiatives and $11 million in higher depreciation and amortization.
Interest Expense
Interest expense was $322 million for the six months ended June 30, 2010 compared to $315 million for the six months ended June 30, 2009, as increases in interest costs on new debentures were only partially offset by lower interest costs on senior secured term loans and related derivative instruments.
Loss on Derivative Instruments
The loss on derivative instruments was $12 million for the six months ended June 30, 2010 compared to a loss of $33 million for the six months ended June 30, 2009. The reduction in losses resulted from movements in the Euro relative to the U.S. Dollar associated with a foreign currency swap derivative instrument, which was terminated in March 2009 as well as the maturity of $1.5 billion in notional amount of interest rate swaps between November 2009 and March 2010 for which hedge accounting was discontinued in February 2009.
Foreign Currency Exchange Transaction Gains, Net
Foreign currency exchange transaction gains, net, represent the net gain or loss on revaluation of external debt, intercompany loans and other receivables and payables. Fluctuations in the value of foreign currencies relative to the U.S. Dollar have a significant effect on our operating results, particularly the Euro. The average U.S. Dollar to Euro exchange rate was $1.33 to €1.00 for both six month periods ended June 30, 2010 and 2009.
Foreign currency exchange resulted in a $146 million gain for the six months ended June 30, 2010 compared to a $31 million gain for the six months ended June 30, 2009. The gains resulted primarily from the fluctuation in the value of the U.S. Dollar against the Euro applied to certain of our Euro denominated senior secured term loans and debenture loans as well as fluctuations in certain currencies including the Euro and Canadian dollar associated with a portion of our intercompany loan portfolio.
Other Income/(Expense), Net
Other income of $9 million for the six months ended June 30, 2010 resulted from gains attributable to business divestitures. Other expense, net of $11 million for the six months ended June 30, 2009 primarily includes net charges of approximately $19 million associated with the purchase and cancellation of GBP 250 million 5.625% EMTN debenture notes and the write-off of deferred debt issuance costs associated with the modification of our senior secured credit facility offset by net gains of associated with certain divestitures.
51
Table of Contents
Income/(Loss) from Continuing Operations Before Income Taxes and Equity in Net Income of Affiliates
Income from continuing operations before income taxes and equity in net income of affiliates was $137 million for the six months ended June 30, 2010 compared to a loss of $40 million for the six months ended June 30, 2009. The fluctuation in results primarily reflects increased operating performance as well as increased foreign exchange transaction gains.
Income Taxes
The effective tax rates for the six months ended June 30, 2010 and 2009 were 9% expense and 63% (benefit) respectively. The effective tax rate for the six months ended June 30, 2010 is lower than the statutory expense rate primarily due to the favorable effect of certain foreign currency exchange gains and financing activities. The effective tax benefit rate for the six months ended June 30, 2009 is higher than the statutory rate primarily due to the favorable effect of certain foreign currency exchange gains, the impact of the tax rate differences in other jurisdictions where we file tax returns and the change in unrecognized income tax benefits, partially offset by the change in interest on liabilities for unrecognized income tax benefits.
Equity in Net Income of Affiliates
Equity in net income of affiliates was zero for the six months ended June 30, 2010 compared to $8 million for the six months ended June 30, 2009 as a result of lower income attributable to our Scarborough joint venture as well as increased expenses attributable to certain recently formed joint venture arrangements.
Discontinued Operations
For the six months ended June 30, 2010, loss from discontinued operations, net of tax was $8 million compared to zero for the six months ended June 30, 2009. Discontinued operations primarily relate to our Publications operating segment and the loss for the six months ended June 30, 2010 reflects the cessation of operations during 2010 and includes a first quarter 2010 net loss on sale of $3 million associated with these divestitures.
Business Segment Results for the Six Months Ended June 30, 2010 Compared to the Six Months Ended June 30, 2009
Revenues
The table below sets forth our segment revenue performance data for the six months ended June 30, 2010 compared to the six months ended June 30, 2009, both on an as-reported and constant currency basis.
| (IN MILLIONS) |
Six months ended June 30, 2010 |
Six months ended June 30, 2009 |
% Variance 2010 vs. 2009 Reported |
Six months ended June 30, 2009 Constant Currency |
% Variance 2010 vs. 2009 Constant Currency |
||||||||||
| Revenues by segment |
|||||||||||||||
| Watch |
$ | 837 | $ | 796 | 5.1 | % | $ | 809 | 3.5 | % | |||||
| Buy |
1,542 | 1,387 | 11.1 | % | 1,435 | 7.4 | % | ||||||||
| Expositions |
87 | 101 | (13.4 | )% | 101 | (13.7 | )% | ||||||||
| Total |
$ | 2,466 | $ | 2,284 | 8.0 | % | $ | 2,345 | 5.2 | % | |||||
Watch Segment Revenues
Revenues increased 5.1% to $837 million for the six months ended June 30, 2010 from $796 million for the six months ended June 30, 2009, or 3.5% on a constant currency basis. These increases were driven by 3.6% growth in North American television measurement as revenue increased from existing customers for existing
52
Table of Contents
products as well as increased revenue from new customers and 9.2% growth in Online and Mobile as a result of increases in both new and existing customer discretionary spending. These increases were partially offset by a 6.5% decline in international television measurement attributable to planned market closures.
Buy Segment Revenues
Revenues increased 11.1% to $1,542 million for the six months ended June 30, 2010 from $1,387 million for the six months ended June 30, 2009, or 7.4% on a constant currency basis, driven by a 21.6% increase in Developing markets (13.9% on a constant currency basis) and a 7.3% increase in Developed markets (4.9% on a constant currency basis), as our customers continue to expand geographically and increase their spending on analytical services.
Revenues from Information services increased 7.7% to $1,103 million for the six months ended June 30, 2010 from $1,025 million for the six months ended June 30, 2009, or 3.7% on a constant currency basis, excluding a 4.0% favorable impact of changes in foreign currency exchange rates. These increases were driven by 19.4% growth in Developing Markets (11.5% on a constant currency basis) as a result of continued expansion of both our retail measurement and consumer panel services to both new and existing customers and new markets. Revenue from Developed Markets increased 3.4% (relatively flat on a constant currency basis) as growth in retail measurement services in Western Europe and North America, primarily to existing customers, was offset by the impact of the divestiture of our box office scanning business.
Revenues from Insights services increased 20.9% to $439 million for the six months ended June 30, 2010 from $362 million for the six months ended June 30, 2009, or 17.9% on a constant currency basis, excluding a 3.0% favorable impact of changes in foreign currency exchange rates. These increases were driven by strong growth in both Developed and Developing Markets due to increases in customer discretionary spending on new product forecasting and other analytical services, which can be cyclical in nature.
Expositions Segment Revenues
Revenues declined 13.4% to $87 million for the six months ended June 30, 2010 from $101 million for the six months ended June 30, 2009, or 13.7% on a constant currency basis, primarily as a result of declines in exhibitor attendance.
53
Table of Contents
Operating Income/(Loss)
The table below sets forth comparative supplemental operating income data for the six months ended June 30, 2010 and 2009, both on an as reported and adjusted basis, adjusting for those items affecting operating income/(loss), as described above within the Consolidated Results commentary.
| SIX MONTHS ENDED JUNE 30, 2010 |
Reported Operating Income/(Loss) |
Restructuring Charges |
Non-GAAP Adjusted Operating Income/(Loss) |
||||||||
| Operating Income/(Loss) |
|||||||||||
| Watch |
$ | 156 | $ | 5 | $ | 161 | |||||
| Buy |
180 | 8 | 188 | ||||||||
| Expositions |
26 | — | 26 | ||||||||
| Corporate and Eliminations |
(48 | ) | 9 | (39 | ) | ||||||
| Total Nielsen |
$ | 314 | $ | 22 | $ | 336 | |||||
| SIX MONTHS ENDED JUNE 30, 2009 |
Reported Operating Income/(Loss) |
Restructuring Charges |
Non-GAAP Adjusted Operating Income/(Loss) |
||||||||
| Operating Income/(Loss) |
|||||||||||
| Watch |
$ | 153 | $ | 5 | $ | 158 | |||||
| Buy |
150 | 2 | 152 | ||||||||
| Expositions |
10 | 1 | 11 | ||||||||
| Corporate and Eliminations |
(29 | ) | 1 | (28 | ) | ||||||
| Total Nielsen |
$ | 284 | $ | 9 | $ | 293 | |||||
| (IN MILLIONS) |
Six months ended June 30, 2010 |
Six months ended June 30, 2009 |
% Variance 2010 vs. 2009 Reported |
Six
months ended June 30, 2009 Constant Currency |
% Variance 2010 vs. 2009 Constant Currency |
|||||||||||||
| Non-GAAP Adjusted Operating Income/(Loss) by Segment |
||||||||||||||||||
| Watch |
$ | 161 | $ | 158 | 1.7 | % | $ | 161 | 0.2 | % | ||||||||
| Buy |
188 | 152 | 23.4 | % | 161 | 16.7 | % | |||||||||||
| Expositions |
26 | 11 | NM | 11 | NM | |||||||||||||
| Corporate and Eliminations |
(39 | ) | (28 | ) | (46.2 | )% | (27 | ) | (47.3 | )% | ||||||||
| Total |
$ | 336 | $ | 293 | 14.3 | % | $ | 306 | 9.7 | % | ||||||||
Watch. Operating income of $156 million was flat for the six months ended June 30, 2010 as compared to $153 million for the six months ended June 30, 2009 as the revenue performance discussed above was substantially offset by increases in costs associated with three-screen measurement initiatives as well as an $11 million increase in depreciation and amortization associated with technology infrastructure initiatives and Local People Meters. Adjusted operating income for the six months ended June 30, 2010 was flat on a constant currency basis compared to the six months ended June 30, 2009.
Buy. Operating income increased 19.4% to $180 million for the six months ended June 30, 2010 as compared to $150 million for the six months ended June 30, 2009 due to the impact of changes in foreign currency exchange rates, strong revenue performance in Insights services as well as cost savings effects of the Transformation Initiative and other productivity initiatives, offset by an increase in restructuring charges. Adjusted operating income for the six months ended June 30, 2010 was $188 million compared to adjusted operating income of $152 million for the six months ended June 30, 2009, an increase of 16.7% on a constant currency basis.
54
Table of Contents
Expositions. Operating income was $26 million for the six months ended June 30, 2010 as compared to $10 million for the six months ended June 30, 2009 due to the impact of cost savings effects of the Transformation Initiative and other productivity initiatives.
Corporate and Eliminations. Operating loss was $48 million for the six months ended June 30, 2010 as compared to an operating loss of $29 million for the six months ended June 30, 2009 due to increases in certain product investments and global infrastructure costs as well as higher restructuring charges. Adjusted operating loss for the six months ended June 30, 2010 was $39 million compared to adjusted operating loss of $28 million for the six months ended June 30, 2009.
Results of Operations—(Years Ended December 31, 2009, 2008 and 2007)
The following table sets forth, for the periods indicated, the amounts included in our Consolidated Statements of Operations:
| Year
Ended December 31, |
||||||||||||
| (IN MILLIONS) |
2009 | 2008 | 2007 | |||||||||
| Revenues |
$ | 4,808 | $ | 4,806 | $ | 4,458 | ||||||
| Cost of revenues, exclusive of depreciation and amortization shown separately below |
2,023 | 2,057 | 1,992 | |||||||||
| Selling, general and administrative expenses, exclusive of depreciation and amortization shown separately below |
1,523 | 1,616 | 1,506 | |||||||||
| Depreciation and amortization |
557 | 499 | 451 | |||||||||
| Impairment of goodwill and intangible assets |
527 | 96 | — | |||||||||
| Restructuring costs |
62 | 118 | 133 | |||||||||
| Operating income |
116 | 420 | 376 | |||||||||
| Interest income |
7 | 17 | 30 | |||||||||
| Interest expense |
(647 | ) | (701 | ) | (691 | ) | ||||||
| (Loss)/gain on derivative instruments |
(60 | ) | (15 | ) | 40 | |||||||
| Foreign currency exchange transaction (losses)/gains, net |
(2 | ) | 20 | (110 | ) | |||||||
| Other (expense)/income, net |
(17 | ) | (12 | ) | 1 | |||||||
| Loss from continuing operations before income taxes and equity in net (loss)/income of affiliates |
(603 | ) | (271 | ) | (354 | ) | ||||||
| Benefit/(provision) for income taxes |
197 | (36 | ) | (12 | ) | |||||||
| Equity in net (loss)/income of affiliates |
(22 | ) | (7 | ) | 2 | |||||||
| Loss from continuing operations |
(428 | ) | (314 | ) | (364 | ) | ||||||
| (Loss)/income from discontinued operations, net of tax |
(61 | ) | (275 | ) | 10 | |||||||
| Net loss |
(489 | ) | (589 | ) | (354 | ) | ||||||
| Net income attributable to noncontrolling interests |
2 | — | — | |||||||||
| Net loss attributable to Nielsen Holdings |
$ | (491 | ) | $ | (589 | ) | $ | (354 | ) | |||
Consolidated Results for the year ended December 31, 2009 versus the year ended December 31, 2008
When comparing our results for the year ended December 31, 2009 with results for the year ended December 31, 2008, the following should be noted:
Items affecting Operating Income for the year ended December 31, 2009
| • | We incurred $527 million of non-cash goodwill and intangible impairment charges. |
| • | We incurred $62 million of restructuring expense. |
55
Table of Contents
Items affecting Operating Income for the year ended December 31, 2008
| • | We incurred a $96 million of non-cash goodwill impairment charge. |
| • | We incurred $118 million of restructuring expense. |
Revenues
Our revenues were flat at $4,808 million for the year ended December 31, 2009 compared to $4,806 million for the year ended December 31, 2008, an increase of 4.0% on a constant currency basis, which excludes the unfavorable impact of changes in foreign currency exchange rates. Our revenue performance included a 10.5% increase within our Watch segment (11.5% on a constant currency basis), a 2.9% decrease within our Buy segment (a 2.7% increase on a constant currency basis) and a 25.1% decline in our Expositions segment (24.6% on a constant currency basis).
Cost of Revenues, Exclusive of Depreciation and Amortization
Cost of revenues decreased 1.6% to $2,023 million for the year ended December 31, 2009 from $2,057 million for the year ended December 31, 2008, an increase of 2.6% on a constant currency basis, which excludes a 4.2% favorable impact of changes in foreign currency exchange rates. The change in cost of revenues was driven by a 4.0% increase from the impact of acquisitions and divestitures within both our Watch and Buy segments (4.2% increase on a constant currency basis) offset by cost savings due to the effects of the Transformation Initiative (see discussion below under “—Restructuring Costs—Transformation Initiative”) and other productivity initiatives. Cost of revenues within our Expositions segment decreased 30.6% (29.8% on a constant currency basis) due to lower variable exhibition costs.
Selling, General and Administrative Expenses, Exclusive of Depreciation and Amortization
SG&A expenses decreased 5.7% to $1,523 million for the year ended December 31, 2009 from $1,616 million for the year ended December 31, 2008, a decrease of 1.5% on a constant currency basis excluding a 4.2% favorable impact of changes in foreign currency exchange rates. SG&A expenses declined 44.6% and 14.9% (44.9% and 14.6% on a constant currency basis) in Corporate and our Expositions segments, respectively, which was slightly offset by a 3.5% increase (3.7% on a constant currency basis) due to the impact of acquisitions and divestitures in both our Watch and Buy segments.
Depreciation and Amortization
Depreciation and amortization increased to $557 million for the year ended December 31, 2009 from $499 million for the year ended December 31, 2008, driven by increased amortization due to the impact of acquisitions and divestitures and higher depreciation related to increased capital investment on projects to enhance our technology platform and global infrastructure.
Impairment of Goodwill and Intangible Assets
During 2009, we recorded a non-cash goodwill impairment charge of $282 million and a non-cash intangible asset impairment charge of $245 million. These charges related to both our Watch and Expositions segments. A deferred tax benefit of $103 million was recognized during the period as a result of these impairment charges. We recorded a $96 million non-cash goodwill impairment charge relating to a reporting unit within our Watch segment in 2008. A deferred tax benefit of $7 million was recognized during the period as a result of this impairment charge.
56
Table of Contents
Restructuring Costs
Transformation Initiative
The Transformation Initiative was completed during 2009; however, the payments will continue through 2010.
We incurred $33 million in restructuring charges primarily relating to severance costs for the year ended December 31, 2009. We recorded $118 million in restructuring charges for the year ended December 31, 2008. The charges included severance costs as well as $24 million of contractual termination costs and asset write-offs.
Other Productivity Initiatives
In December 2009, we commenced certain specific restructuring actions attributable to defined cost-reduction programs, primarily in Europe and North America, directed towards achieving increased productivity in future periods. We recorded $29 million in restructuring charges associated with these initiatives during the fourth quarter of 2009. The charges included severance costs of $22 million as well as $7 million of contractual termination costs and asset write-offs.
See Note 8 to our audited consolidated financial statements, “Restructuring Activities,” included elsewhere in this prospectus, for additional information regarding our restructuring programs.
Operating Income
Operating income for the year ended December 31, 2009 decreased to $116 million, from $420 million for the year ended December 31, 2008. Excluding “Items affecting Operating Income,” specifically noted above, our adjusted operating income increased 11.1%, or 14.8% on a constant currency basis, excluding a 3.7% unfavorable impact of changes in foreign currency exchange rates. Adjusted operating income within our Watch segment increased by 20.6% (20.9% on a constant currency basis) as a result of the 11.5% constant currency revenue growth mentioned above, the impact of the Transformation Initiative and other productivity initiatives, as well as the impact of acquisitions and divestitures. Adjusted operating income within our Buy segment increased 2.6% (7.6% on a constant currency basis) primarily driven by the impact of the Transformation Initiative and other productivity initiatives as well as the 2.7% constant currency revenue growth mentioned above. Adjusted operating income within our Expositions segment decreased by 54.8% (53.7% on a constant currency basis) primarily as result of lower exposition revenues. Adjusted operating expenses within Corporate declined 36.2% as a result of cost reductions from the impact of the Transformation Initiative as well as decreased spending on certain product initiatives.
Interest Income and Expense
Interest income was $7 million for the year ended December 31, 2009 compared to $17 million for the year ended December 31, 2008. Interest expense was $647 million for the year ended December 31, 2009 compared to $701 million for the year ended December 31, 2008. The decrease was driven primarily by the termination and subsequent capitalization of the term loan with Luxco and the impact of interest allocations to discontinued operations, slightly offset by higher interest expense on our debenture loan portfolio as a result of new debt issuances in 2009.
Loss on Derivative Instruments
The loss on derivative instruments was $60 million for the year ended December 31, 2009 compared to a loss of $15 million for the year ended December 31, 2008. The increased loss resulted primarily from the change in fair value of certain of our interest rate swaps for which hedge accounting was discontinued in February 2009 as well as losses attributable to movements in the Euro relative to the U.S. dollar associated with a foreign currency swap derivative instrument, which was terminated in March 2009.
57
Table of Contents
Foreign Currency Exchange Transaction (Losses)/Gains, Net
Foreign currency exchange transaction gains, net, represent the net gain or loss on revaluation of external debt, intercompany loans and other receivables and payables. Fluctuations in the value of foreign currencies relative to the U.S. dollar have a significant effect on our operating results, particularly the Euro. The average U.S. dollar to Euro exchange rate was $1.39 to €1.00 and $1.47 to €1.00 for the year ended December 31, 2009 and the year ended December 31, 2008, respectively.
Foreign currency exchange resulted in a $2 million loss for the year ended December 31, 2009 compared to a $20 million gain recorded in the year ended December 31, 2008 primarily as a result of the fluctuation in the value of the U.S. dollar against the Euro applied to certain of our Euro denominated senior secured term loans and debenture loans as well as a portion of our intercompany loan portfolio.
Other Expense, Net
Other expense, net was $17 million for the year ended December 31, 2009 versus $12 million for the year ended December 31, 2008. The 2009 amount primarily includes net charges of approximately $15 million associated with the purchase and cancellation of GBP 250 million 5.625% EMTN debenture notes and the write-off of deferred debt issuance costs associated with the modification of our 2006 Senior Secured Credit Facilities offset in part by net gains primarily associated with certain divestitures, including the sale of our Brazilian operations within our Expositions segment.
Loss from Continuing Operations Before Income Taxes and Equity in Net Loss of Affiliates
For the year ended December 31, 2009, loss from continuing operations before income taxes, and equity in net loss of affiliates was $603 million compared to a $271 million loss for the year ended December 31, 2008. The current period compared with the prior period results primarily reflects impairment of goodwill and intangible assets offset in part by lower restructuring expenses, lower interest costs and increased operating performance, primarily driven by cost reduction programs.
Equity in Net Loss of Affiliates
For the year ended December 31, 2009, equity in net loss of affiliates was $22 million compared to $7 million for the year ended December 31, 2008 primarily driven by an after-tax non-cash impairment charge of $26 million (net of a tax adjustment of $18 million) associated with our non-controlling ownership interest in Scarborough in the third quarter of 2009.
Income Taxes
The effective tax rates for the years ended December 31, 2009 and 2008 were a benefit of 32.7% and an expense of 13.3%, respectively. The effective tax rate for the year ended December 31, 2009 was higher than the Dutch statutory rate primarily due to state and foreign withholding and income taxes and the impact of the tax rate differences in other jurisdictions where we file tax returns, which is partially offset by impairments of goodwill and intangible assets, which had a tax basis significantly lower than the underlying book basis and therefore a lower tax benefit.
The effective tax rate for the year ended December 31, 2008 was lower than the Dutch statutory rate primarily due to the impairment of goodwill, which had a tax basis significantly lower than the book basis and therefore a lower tax benefit, tax on distribution from foreign subsidiaries, change in estimates related to global uncertain tax positions, state and foreign withholding and income taxes, change in estimates for other tax positions and certain non-deductible charges, which were partially offset by the impact of the tax rate differences in other jurisdictions where we file tax returns.
58
Table of Contents
At December 31, 2009 and December 31, 2008, we had gross uncertain tax positions of $129 million and $187 million, respectively. We also have accrued interest and penalties associated with these uncertain tax positions as of December 31, 2009 and December 31, 2008 of $23 million, and $22 million, respectively. Estimated interest and penalties related to the underpayment of income taxes is classified as a component of our benefit/(provision) for income taxes. It is reasonably possible that a reduction in a range of $9 million to $38 million of uncertain tax positions may occur within the next 12 months as a result of projected resolutions of worldwide tax disputes.
Our future effective tax rates could be adversely affected by earnings being lower than anticipated in countries where statutory rates are lower and earnings being higher than anticipated in countries where statutory rates are higher, by changes in the valuation of our deferred tax assets, or by changes in tax laws, regulations, accounting principles, or interpretations thereof.
Discontinued Operations
For the year ended December 31, 2009, loss from discontinued operations, net of tax of $31 million, was $61 million compared to a $275 million loss for the year ended December 31, 2008. Discontinued operations primarily relate to our Publications operating segment and the loss for the year ended December 31, 2009 includes a net loss on the sale of our media properties within the Publications operating segment, including The Hollywood Reporter and Billboard, to e5 Global Media LLC, of $14 million, net of tax of $3 million. Additionally, losses for both 2009 and 2008 include goodwill impairment charges associated with our Publications operating segment of $55 million and $336 million, respectively. The loss for the year ended December 31, 2008 is partially offset by a gain of $19 million relating to the settlement of tax contingencies associated with the sale of our Directories segment to World Directories.
Consolidated Results for the year ended December 31, 2008 versus the year ended December 31, 2007
When comparing our results for the year ended December 31, 2008 with results for the year ended December 31, 2007, the following should be noted:
Items affecting Operating Income for the year ended December 31, 2008
| • | We incurred a $96 million non-cash goodwill impairment charge. |
| • | We incurred $118 million of restructuring expense. |
Items affecting Operating Income for the year ended December 31, 2007
| • | We incurred $133 million of restructuring expense. |
| • | We incurred approximately $37 million in transaction costs, legal settlements and incremental expenses associated with compensation agreements and recruiting costs for certain corporate executives. |
Revenues
Our revenues increased 7.8% to $4,806 million for the year ended December 31, 2008 from $4,458 million for the year ended December 31, 2007, or 6.1% on a constant currency basis, excluding a 1.7% favorable impact of changes in foreign currency exchange rates. These increases were driven by a 10.5% increase within our Watch segment (10.4% on a constant currency basis) and a 7.5% increase within our Buy segment (5.0% on a constant currency basis), partially offset by a 3.4% decline in Expositions (3.9% on a constant currency basis).
Cost of Revenues, Exclusive of Depreciation and Amortization
Cost of revenues increased 3.1% to $2,057 million for the year ended December 31, 2008 from $1,992 million for the year ended December 31, 2007, or 1.2% on a constant currency basis, excluding a 1.9%
59
Table of Contents
unfavorable impact of changes in foreign currency exchange rates. These increases were driven by a 1.2% increase due to the impact of acquisitions, which were partly offset by productivity savings following actions implemented under the Transformation Initiative in both our Watch and Buy segments and a 4.5% decline in costs within our Expositions segment (5.3% on a constant currency basis).
Selling, General and Administrative Expenses, Exclusive of Depreciation and Amortization
SG&A expenses increased 7.1% to $1,616 million for the year ended December 31, 2008 versus $1,506 million for the year ended December 31, 2007, or 5.3% on a constant currency basis, excluding a 1.8% unfavorable impact of changes in foreign currency exchange rates. These increases were primarily due to a 2.4% increase as a result of the impact of acquisitions as well as continued investment in Developing Markets within our Buy segment. These increases were partly offset by the impact of the Transformation Initiative and other productivity related savings, a $34 million decrease in share based compensation expenses and a $37 million decrease in payments in connection with compensation agreements and recruiting expenses for certain corporate executives.
Depreciation and Amortization
Depreciation and amortization increased to $499 million for the year ended December 31, 2008 from $451 million for the year ended December 31, 2007, driven by increased depreciation related to capital investment in hardware and software and increased amortization due to the impact of acquisitions, partly offset by lower amortization on previously acquired intangible assets at our Expositions segment.
Impairment of Goodwill
We recorded a non-cash goodwill impairment charge of $96 million associated with a reporting unit within our Watch segment. A deferred tax benefit of $7 million was recognized as a result of this impairment charge.
Restructuring Costs
We recorded $118 million in restructuring charges for the year ended December 31, 2008 associated with the Transformation Initiative. The charges included severance costs as well as $24 million of contractual termination costs and asset write-offs.
We recorded $133 million in restructuring charges for the year ended December 31, 2007 associated with the Transformation Initiative. The charges included $92 million in severance costs as well as $6 million in asset write-offs and $35 million in consulting fees and other costs, related to reviews of corporate functions and outsourcing opportunities.
Operating Income
Operating income for the year ended December 31, 2008 increased 12.1% to $420 million from $376 million for the year ended December 31, 2007. Excluding “Items affecting Operating Income,” specifically noted above from our respective 2008 and 2007 operating results, adjusted operating income increased 16.5% (15.7% on a constant currency basis), for the year ended December 31, 2008 as compared to the year ended December 31, 2007. Adjusted operating income within our Watch segment increased 29.9% (30.4% on a constant currency basis) reflecting the impact of acquisitions, 10.4% constant currency revenue growth mentioned above and benefits realized from our Transformation Initiative. Adjusted operating income within our Buy segment increased 12.0% (10.5% on a constant currency basis) due to revenue growth in Developing Markets, as well as benefits realized from our Transformation Initiative. Adjusted operating income increased 9.4% (10.3% on a constant currency basis) within our Expositions segment as 3.9% constant currency revenue declines were largely offset by the impact of cost savings. Adjusted operating expenses increased 31.0% (32.4% on a constant currency basis) within Corporate as a result of increased expenditures on global infrastructure and product development initiatives.
60
Table of Contents
Interest Income and Expense
Interest income was $17 million for the year ended December 31, 2008 versus $30 million for the year ended December 31, 2007. Interest expense was $701 million for the year ended December 31, 2008 versus $691 million for the year ended December 31, 2007. This increase reflects the additional borrowings associated with our 2007 and 2008 acquisitions as well as an increase associated with the Luxco term loan, partially offset by a decline in the weighted average interest rates of our 2006 Senior Secured Credit Facilities.
(Loss)/Gain on Derivative Instruments
The loss on derivative instruments was $15 million for the year ended December 31, 2008 as compared to a gain of $40 million for the year ended December 31, 2007. The change resulted primarily from movements in the Euro relative to the U.S. dollar in the current period as compared to the prior period, resulting from a foreign currency swap derivative instrument entered into during 2007.
Foreign Currency Exchange Transaction Gains/(Losses), Net
Foreign currency exchange transaction gains or losses, net, represent the net gain or loss on revaluation of external debt and intercompany loans. Fluctuations in the value of foreign currencies, particularly the Euro, relative to the U.S. dollar have a significant effect on our operating results. The average U.S. dollar to Euro exchange rate was $1.47 to €1.00 and $1.37 to €1.00 for the year ended December 31, 2008 and the year ended December 31, 2007, respectively.
Foreign currency exchange resulted in a $20 million gain for the year ended December 31, 2008 versus a $110 million loss recorded in the year ended December 31, 2007 as a result of the appreciation of the U.S. dollar against the Euro and other currencies.
Other (Expense)/Income, net
Other expense was $12 million for the year ended December 31, 2008 as compared to income of $1 million for the year ended December 31, 2007. The 2008 expense was mainly due to a determination that there was a decline in the value of an investment in a publicly listed company and accounted for as an available-for-sale security which was other than temporary and therefore we recognized a $12 million loss.
Loss from Continuing Operations before Income Taxes, and Equity in Net (Loss)/Income of Affiliates
For the year ended December 31, 2008, there was a $271 million loss from continuing operations before income taxes and equity in net (loss)/income of affiliates versus a $354 million loss for the year ended December 31, 2007. The lower 2008 loss as compared with 2007 primarily reflects our improved operating performance as discussed above, lower restructuring expenses related to the Transformation Initiative, lower payments in connection with compensation agreements and recruiting expenses for certain corporate executives, and foreign currency exchange gains that occurred during the year ended December 31, 2008 only partly offset by the goodwill impairment charge of $96 million in 2008 and higher interest costs.
Income Taxes
The effective tax rates for the years ended December 31, 2008 and 2007 were an expense of 13.3% and 3.4%, respectively. The effective tax rate for the year ended December 31, 2008 was lower than the Dutch statutory rate primarily due to the impairment of goodwill which had a tax basis significantly lower than the book basis and therefore a lower tax benefit, tax on distributions from foreign subsidiaries, change in estimates related to global uncertain tax positions, state and foreign withholding and income taxes, change in estimates for other tax positions and certain non-deductible charges, which were partially offset by the impact of the tax rate differences in other jurisdictions where we file tax returns.
61
Table of Contents
The effective tax rate for the year ended December 31, 2007 was lower than the Dutch statutory rate primarily related to the tax impact on distributions from foreign subsidiaries. This was partially offset by the recognition of the tax benefit of interest expense related to the Valcon senior secured bridge facility based upon a favorable 2007 Dutch residency ruling. In addition, the change in estimates related to global uncertain tax positions and the valuation allowance also influenced the 2007 tax rate.
Discontinued Operations
For the year ended December 31, 2008, loss from discontinued operations, net of tax was $275 million as compared to a gain of $10 million for the year ended December 31, 2007. Discontinued operations relate to our Publications operating segment as well as our Directories segment. The loss for the year ended December 31, 2008 includes an impairment charge of $336 million relating to our Publications operating segment offset in part by a gain of $19 million relating to the settlement of tax contingencies associated with the sale of our Directories segment to World Directories as well as net losses attributable to the discontinued operations. The gain for the year ended December 31, 2007 includes a $17 million gain on the sale of our Business Media Europe unit offset by net losses attributable to the discontinued operations.
Business Segment Results for the year ended December 31, 2009 versus the year ended December 31, 2008
Revenues
The table below sets forth our segment revenue growth data for the year ended December 31, 2009 compared to the year ended December 31, 2008, both on an as-reported and constant currency basis. In order to determine the percentage change in revenue on a constant currency basis, we remove the positive and negative impacts of changes foreign currency exchange rates:
| (IN MILLIONS) |
Year ended December 31, 2009 |
Year ended December 31, 2008 |
% Variance 2009 vs. 2008 Reported |
Year
ended December 31, 2008 Constant Currency |
% Variance 2009 vs. 2008 Constant Currency |
||||||||||
| Revenues by segment |
|||||||||||||||
| Watch |
$ | 1,635 | $ | 1,480 | 10.5 | % | $ | 1,466 | 11.5 | % | |||||
| Buy |
2,993 | 3,084 | (2.9 | )% | 2,915 | 2.7 | % | ||||||||
| Expositions |
180 | 240 | (25.1 | )% | 238 | (24.6 | )% | ||||||||
| Corporate and eliminations |
— | 2 | n/a | 2 | n/a | ||||||||||
| Total |
$ | 4,808 | $ | 4,806 | 0.1 | % | $ | 4,621 | 4.0 | % | |||||
Watch Segment Revenues
Revenues increased 10.5% to $1,635 million for the year ended December 31, 2009 from $1,480 million for the year ended December 31, 2008, or 11.5% on a constant currency basis. Excluding the impact of acquisitions, revenue grew 1.7% (2.6% on a constant currency basis) as our television audience market expansion was offset by lower spending by our customers on enhanced analytical services. This growth was primarily driven by a 4.7% constant currency increase in North American television measurement due to volume increases associated with measurement data from five additional markets being added to the Local People Meter (“LPM”) program.
Buy Segment Revenues
Revenues decreased 2.9% to $2,993 million for the year ended December 31, 2009 from $3,084 million for the year ended December 31, 2008, an increase of 2.7% on a constant currency basis as our customers continue
62
Table of Contents
to expand geographically and increase their spending on analytical services. Revenue from Developing Markets decreased 2.6% (a 8.0% increase on a constant currency basis) and revenue from Developed Markets decreased 3.1% (a 0.8% increase on a constant currency basis).
Revenues from Information services decreased 4.7% to $2,157 million for the year ended December 31, 2009 from $2,262 million for the year ended December 31, 2008, an increase of 1.7%, on a constant currency basis excluding a 6.4% unfavorable impact of changes in foreign currency exchange rates. Revenue from Developing Markets declined 4.0%, however, was the primary driver for the constant currency increase mentioned above, increasing 7.5% on a constant currency basis as a result of continued geographic expansion of both our retail measurement and consumer panel services to both new and existing customers.
Revenues from Insights services increased 1.8% to $836 million for the year ended December 31, 2009 from $822 million for the year ended December 31, 2008, or 5.3% on a constant currency basis excluding a 3.5% unfavorable impact of changes in foreign currency exchange rates. These increases were driven by 0.8% growth in Developing Markets (8.9% on a constant currency basis) and the impact of acquisitions. The growth in Developing Markets related to continued expansion of our analytical services, primarily to existing customers who are expanding their presence in these markets.
Expositions Segment Revenues
Revenues for the year ended December 31, 2009 decreased 25.1% to $180 million from $240 million for the year ended December 31, 2008, due largely to lower exhibitor attendance driven by the economic environment.
Operating Income/(Loss)
The table below sets forth supplemental operating income data for the year ended December 31, 2009 compared to the year ended December 31, 2008, both on an as reported and adjusted basis, adjusting for the impact of changes in foreign currency exchange rates as well as those items affecting operating income/(loss), as described above within the Consolidated Results commentary.
| YEAR ENDED DECEMBER 31, 2009 |
Reported Operating Income/(Loss) |
Restructuring and Impairment Charges(1) |
Non-GAAP Adjusted Operating Income/(Loss) |
||||||||
| Operating Income/(Loss) |
|||||||||||
| Watch |
$ | (73 | ) | $ | 411 | $ | 338 | ||||
| Buy |
361 | 39 | 400 | ||||||||
| Expositions |
(105 | ) | 128 | 23 | |||||||
| Corporate and Eliminations |
(67 | ) | 11 | (56 | ) | ||||||
| Total Nielsen |
$ | 116 | $ | 589 | $ | 705 | |||||
| YEAR ENDED DECEMBER 31, 2008 |
Reported Operating Income/(Loss) |
Restructuring and Impairment Charges(1) |
Non-GAAP Adjusted Operating Income/(Loss) |
||||||||
| Operating Income/(Loss) |
|||||||||||
| Watch |
$ | 171 | $ | 110 | $ | 281 | |||||
| Buy |
315 | 74 | 389 | ||||||||
| Expositions |
50 | 1 | 51 | ||||||||
| Corporate and Eliminations |
(116 | ) | 29 | (87 | ) | ||||||
| Total Nielsen |
$ | 420 | $ | 214 | $ | 634 | |||||
| (1) | Includes $402 million and $96 million of goodwill and other intangible asset impairment charges within our Watch segment in 2009 and 2008, respectively and $125 million within our Expositions segment in 2009. |
63
Table of Contents
| (IN MILLIONS) |
Year ended December 31, 2009 |
Year ended December 31, 2008 |
% Variance 2009 vs. 2008 Reported |
Year ended December 31, 2008 Constant Currency |
% Variance 2009 vs. 2008 Constant Currency |
|||||||||||||
| Non-GAAP Adjusted Operating Income/(Loss) by Segment |
||||||||||||||||||
| Watch |
$ | 338 | $ | 281 | 20.6 | % | $ | 279 | 20.9 | % | ||||||||
| Buy |
400 | 389 | 2.6 | % | 371 | 7.6 | % | |||||||||||
| Expositions |
23 | 51 | (54.8 | )% | 51 | (53.7 | )% | |||||||||||
| Corporate and Eliminations |
(56 | ) | (87 | ) | (36.2 | )% | (87 | ) | (36.2 | )% | ||||||||
| Total |
$ | 705 | $ | 634 | 11.1 | % | $ | 614 | 14.8 | % | ||||||||
Watch. Operating loss was $73 million for the year ended December 31, 2009 compared to operating income of $171 million for the year ended December 31, 2008 due to increases in restructuring and impairment charges offset by the revenue growth mentioned above and cost savings from the impact of our Transformation Initiative. Adjusted operating income for the year ended December 31, 2009 was $338 million compared to adjusted operating income of $281 million for the year ended December 31, 2008, an increase of 20.9% on a constant currency basis.
Buy. Operating income increased to $361 million for the year ended December 31, 2009 from $315 million for the year ended December 31, 2008 due to lower restructuring charges, the revenue growth mentioned above and the effects of the Transformation Initiative and other productivity initiatives. Adjusted operating income for the year ended December 31, 2009 was $400 million compared to adjusted operating income of $389 million for the year ended December 31, 2008, an increase of 7.6% on a constant currency basis.
Expositions. Operating loss was $105 million for the year ended December 31, 2009 compared to operating income of $50 million for the year ended December 31, 2008 due to intangible asset impairment charges as well as declines in our revenues due to the economic environment. Adjusted operating income for the years ended December 31, 2009 was $23 million compared to $51 million, a decrease of 53.7% on a constant currency basis.
Corporate and Eliminations. Operating loss was $67 million for the year ended December 31, 2009 compared to $116 million for the year ended December 31, 2008. Adjusted operating loss for the year ended December 31, 2009 was $56 million versus the $87 million of adjusted operating loss for the year ended December 31, 2008. These decreases were due to lower expenses on certain product initiatives as well as the impact of the Transformation Initiative.
64
Table of Contents
Business Segment Results for the year ended December 31, 2008 versus the year ended December 31, 2007
Revenues
The table below sets forth certain supplemental revenue growth data for the year ended December 31, 2008 compared to the year ended December 31, 2007, both on an as-reported and constant currency basis. In order to determine the percentage change in items on a constant currency basis, we adjust these items to remove the positive and negative impacts of foreign exchange:
| (IN MILLIONS) |
Year ended December 31, 2008 |
Year ended December 31, 2007 |
% Variance 2008 vs. 2007 Reported |
Year ended December 31, 2007 Constant Currency |
% Variance 2008 vs. 2007 Constant Currency |
||||||||||
| Revenues by segment |
|||||||||||||||
| Watch |
$ | 1,480 | $ | 1,339 | 10.5 | % | $ | 1,341 | 10.4 | % | |||||
| Buy |
3,084 | 2,868 | 7.5 | % | 2,937 | 5.0 | % | ||||||||
| Expositions |
240 | 248 | (3.4 | )% | 249 | (3.9 | )% | ||||||||
| Corporate and eliminations |
2 | 3 | n/a | 3 | n/a | ||||||||||
| Total |
$ | 4,806 | $ | 4,458 | 7.8 | % | $ | 4,530 | 6.1 | % | |||||
Watch Segment Revenues
Revenues increased 10.5% to $1,480 million for the year ended December 31, 2008 from $1,339 million for the year ended December 31, 2007, or 10.4% on a constant currency basis. Excluding the impact of acquisitions and divestitures, Watch revenues increased 7.7% driven by volume increases leading to 8.0% growth in North American television measurement attributable to the launch of additional markets in 2008 under the LPM program. These volume increases were primarily attributable to existing customers.
Buy Segment Revenues
Revenues increased 7.5% to $3,084 million for the year ended December 31, 2008 from $2,868 million for the year ended December 31, 2007, or 5.0% on a constant currency basis. These increases were driven by 18.5% growth in Developing Markets (15.6% on a constant currency basis) and 3.9% growth in Developed Markets (1.5% on a constant currency basis).
Information services revenues increased 6.2% to $2,262 million for the year ended December 31, 2008 from $2,130 million for the year ended December 31, 2007, or 3.6% on a constant currency basis, excluding a 2.6% favorable impact of changes in foreign currency exchange rates. These increases were driven by 17.6% growth in Developing Markets (13.8% on a constant currency basis) and slight increases in Developed Markets as growth in North America and Western Europe was offset by the closure of certain product lines in Japan in 2007.
Insights services revenues increased 11.1% to $822 million for the year ended December 31, 2008 from $738 million for the year ended December 31, 2007, or 9.3% on a constant currency basis, excluding a 1.8% favorable impact of changes in foreign currency exchange rates. These increases were driven by growth in both Developed and Developing Markets resulting from higher client demand for our analytical services.
Expositions Segment Revenues
Revenues for the year ended December 31, 2008 were $240 million versus $248 million for the year ended December 31, 2007 as lower exhibitor attendance was driven by the economic environment.
65
Table of Contents
Operating Income/(Loss)
The table below sets forth supplemental operating income data for the year ended December 31, 2008 compared to the year ended December 31, 2007, both on an as-reported and adjusted basis, adjusting for the impact of changes in foreign currency exchange rates as well as those items affecting operating income/(loss), as described above within the Consolidated Results commentary.
| YEAR ENDED DECEMBER 31, 2008 |
Reported Operating Income/(Loss) |
Restructuring and Impairment Charges |
Other Items Affecting Operating Income |
Non-GAAP Adjusted Operating Income/(Loss) |
||||||||||
| Operating Income |
||||||||||||||
| Watch |
$ | 171 | $ | 110 | $ | — | $ | 281 | ||||||
| Buy |
315 | 74 | — | 389 | ||||||||||
| Expositions |
50 | 1 | — | 51 | ||||||||||
| Corporate and Eliminations |
(116 | ) | 29 | — | (87 | ) | ||||||||
| Total Nielsen |
$ | 420 | $ | 214 | $ | — | $ | 634 | ||||||
| YEAR ENDED DECEMBER 31, 2007 |
Reported Operating Income/(Loss) |
Restructuring Charges |
Other Items Affecting Operating Income |
Non-GAAP Adjusted Operating Income/(Loss) |
||||||||||
| Operating Income |
||||||||||||||
| Watch |
$ | 188 | $ | 10 | $ | 18 | $ | 216 | ||||||
| Buy |
264 | 84 | — | 348 | ||||||||||
| Expositions |
44 | 2 | — | 46 | ||||||||||
| Corporate and Eliminations |
(120 | ) | 37 | 19 | (64 | ) | ||||||||
| Total Nielsen |
$ | 376 | $ | 133 | $ | 37 | $ | 546 | ||||||
| (IN MILLIONS) |
Year ended December 31, 2008 |
Year ended December 31, 2007 |
% Variance 2008 vs. 2007 Reported |
Year
ended December 31, 2007 Constant Currency |
% Variance 2008 vs. 2007 Constant Currency |
|||||||||||||
| Non-GAAP Adjusted Operating Income/(Loss) by Segment |
||||||||||||||||||
| Watch |
$ | 281 | $ | 216 | 29.9 | % | $ | 352 | 30.4 | % | ||||||||
| Buy |
389 | 348 | 12.0 | % | 215 | 10.5 | % | |||||||||||
| Expositions |
51 | 46 | 9.4 | % | 46 | 10.3 | % | |||||||||||
| Corporate and Eliminations |
(87 | ) | (64 | ) | 31.0 | % | (65 | ) | 32.4 | % | ||||||||
| Total |
$ | 634 | $ | 546 | 16.5 | % | $ | 548 | 15.7 | % | ||||||||
Watch. Operating income was $171 million for the year ended December 31, 2008 compared to $188 million for the year ended December 31, 2007. The decrease in operating income was due to increases in restructuring and impairment charges and increases in SG&A expenses, offset by the revenue performance mentioned above and cost savings from the Transformation Initiative. Adjusted operating income was $281 million for the year ended December 31, 2008 compared to an adjusted operating income of $216 million for the year ended December 31, 2007, an increase of 30.4%, on a constant currency basis.
Buy. Operating income was $315 million for the year ended December 31, 2008 compared to $264 million for the year ended December 31, 2007. Adjusted operating income for the year ended December 31, 2008 was $389 million compared to operating income of $348 million for the year ended December 31, 2007, an increase of 10.5%, on a constant currency basis. These increases were due to the revenue performance mentioned above
66
Table of Contents
as well as productivity savings following actions implemented under the Transformation Initiative. These savings were partially offset by an increase in SG&A expenses mentioned above due in equal part to the impact of acquisitions and continued investment in Developing Markets.
Expositions. Operating income was $50 million for the year ended December 31, 2008 compared to $44 million for the year ended December 31, 2007. Adjusted operating income was $51 million for the year ended December 31, 2008 compared to an adjusted operating income of $46 million for the year ended December 31, 2007, an increase of 10.3%, on a constant currency basis. These increases were primarily attributable to cost savings initiatives.
Corporate and Eliminations. Operating loss was $116 million for the year ended December 31, 2008 compared to $120 million for the year ended December 31, 2007. The decrease in operating loss was primarily attributable to lower restructuring and other items affecting operating income offset by increased spending on certain product initiatives and increased share compensation expense when compared to 2007. Adjusted operating loss was $87 million for the year ended December 31, 2008 compared to an adjusted operating loss of $64 million for the year ended December 31, 2007.
Supplemental Quarterly Financial Information
The below table presents selected unaudited quarterly financial information for each of the interim periods in the years ended December 31, 2009 and 2008.
| 2008 | 2009 | |||||||||||||||||||||||||||||||
| (IN MILLIONS) |
First Quarter |
Second Quarter |
Third Quarter |
Fourth Quarter |
First Quarter |
Second Quarter |
Third Quarter |
Fourth Quarter |
||||||||||||||||||||||||
| Revenues |
$ | 1,156 | $ | 1,241 | $ | 1,223 | $ | 1,186 | $ | 1,102 | $ | 1,182 | $ | 1,227 | $ | 1,297 | ||||||||||||||||
| Depreciation and amortization |
116 | 122 | 127 | 134 | 130 | 136 | 143 | 148 | ||||||||||||||||||||||||
| Operating income/(loss)(1) |
106 | 154 | 124 | 36 | 112 | 172 | (326 | ) | 158 | |||||||||||||||||||||||
| Discontinued operations, net of tax(2) |
— | 1 | (6 | ) | (270 | ) | (4 | ) | 4 | (58 | ) | (3 | ) | |||||||||||||||||||
| Net income/(loss) attributable to Nielsen Holdings |
$ | (108 | ) | $ | (6 | ) | $ | 22 | $ | (497 | ) | $ | 2 | $ | (10 | ) | $ | (527 | ) | $ | 44 | |||||||||||
| (1) | Includes restructuring charges of $45 million and $58 million for the third quarter and the fourth quarter of 2008, respectively. The fourth quarter of 2008 also includes a goodwill impairment charge of $96 million. Includes restructuring charges of $56 million in the fourth quarter of 2009. The third quarter of 2009 also includes charges for the impairment of goodwill impairment and intangible assets of $527 million. |
| (2) | The fourth quarter of 2008 includes a goodwill impairment charge relating to the Publications operating segment of $336 million. Includes a net loss after taxes of $14 million relating to the sale of the media properties within our Publications operating segment during the fourth quarter of 2009. The third quarter of 2009 includes a goodwill impairment charge relating to the Publications operating segment of $55 million. |
Liquidity and Capital Resources
Overview
As a result of the Acquisition and related financing, our contractual obligations, commitments and debt service requirements over the next several years are significant. Our primary source of liquidity will continue to be cash generated from operations as well as existing cash. At June 30, 2010, cash and cash equivalents were $371 million and our total indebtedness, excluding bank overdrafts, was $8,421 million. In addition, we also had $669 million available for borrowing under our senior secured revolving credit facility at June 30, 2010.
We believe we will have available resources to meet both our short-term and long-term liquidity requirements, including our senior secured debt service. We expect the cash flow from our operations, combined with existing cash and amounts available under the revolving credit facility, will provide sufficient liquidity to
67
Table of Contents
fund our current obligations, projected working capital requirements, restructuring obligations, and capital spending over the next year. In addition we may, from time to time, purchase, repay, redeem or retire any of our outstanding debt securities (including any publicly issued debt securities) in privately negotiated or open market transactions, by tender offer or otherwise. It is possible that continued changes to global economic conditions could adversely affect our cash flows through increased interest costs or our ability to obtain external financing or to refinance existing indebtedness.
Financing Transactions
Overview of Financing Transactions
In connection with the Acquisition, we entered into financing transactions consisting of (i) senior secured credit facilities consisting of seven-year $4,175 million and €800 million senior secured term loan facilities and a six-year $688 million senior secured revolving credit facility and (ii) debt securities, consisting of $650 million 10% and €150 million 9% Senior Notes due 2014 of Nielsen Finance LLC and Nielsen Finance Co., $1,070 million 12.5% Senior Subordinated Discount Notes due 2016 of Nielsen Finance LLC and Nielsen Finance Co. and €343 million 11.125% Senior Discount Notes due 2016 of TNC B.V.
Subsequent to the Acquisition, we entered into the following transactions in 2007:
| • | Effective January 19, 2007, we entered into a cross-currency swap maturing in May, 2010 to hedge our exposure to foreign currency exchange rate movements on part of our GBP-denominated external debt. With this transaction a notional amount of GBP 225 million with a fixed interest rate of 5.625% was swapped to a notional amount of €344 million with a fixed interest rate of 4.033%. The swap was designated as a foreign currency cash flow hedge. |
| • | Effective January 22, 2007, we obtained a 50 and 25 basis point reduction of the applicable margin on our U.S. dollar and Euro senior secured term loan facilities. As of December 31, 2007, this reduction has resulted in estimated interest savings of $22 million. |
| • | On February 9, 2007, we applied $328 million of the BME sale proceeds towards making a mandatory pre-payment on the €800 million senior secured term loan facility which reduced the amount of the Euro facility to €545 million. By making this pre-payment, we were no longer required to pay the scheduled Euro quarterly installments for the remainder of the term of the senior secured term loan facility. |
| • | Effective February 9, 2007, we entered into a cross-currency swap maturing February, 2010 to convert part of our Euro-denominated external debt to U.S. dollar-denominated debt. With this transaction, a notional amount of €200 million with a 3-month Euribor based interest rate is swapped to a notional amount of $259 million with an interest rate based on 3-month USD-Libor minus a spread. No hedge designation was made for this swap. |
| • | Effective May 31, 2007, we obtained a further 25 basis point reduction of the applicable margin on our U.S. dollar and Euro senior secured term loan facilities as a result of achieving a secured leverage ratio below 4.25 as of March 31, 2007. |
| • | To finance the acquisition of Nielsen//NetRatings for $330 million, we borrowed $115 million of the $688 million senior secured revolving credit facility. |
| • | On August 9, 2007, we completed the acquisition of Telephia, Inc. for approximately $449 million. $350 million of the purchase price was borrowed under the incremental provision of our senior secured term loan facilities which increased the total U.S. dollar facility to $4,525 million, and the balance funded through the availability under our senior secured revolving credit facility and cash on hand. |
We entered into the following transactions in 2008:
| • | In February 2008, we entered into a 2-year interest rate swap agreement which fixed the LIBOR-related portion of the interest rates for $500 million of our variable rate debt. |
68
Table of Contents
| • | Effective April 2, 2008, we obtained a 25 basis point reduction of the applicable margin on our U.S. dollar and Euro senior secured term loan facilities as a result of achieving a secured leverage ratio below 4.25 as of December 31, 2007. In addition, we obtained a 25 basis point reduction of the applicable margin on our senior secured revolving credit facility as a result of achieving a total leverage ratio below 6.0 as of December 31, 2007. |
| • | On April 16, 2008, we issued $220 million aggregate principal amount of 10% Senior Notes due 2014. The net proceeds of the offering were used to finance our acquisition of IAG and to pay related fees and expenses. |
We entered into the following transactions in 2009:
| • | In January 2009, we issued $330 million in aggregate principal amount of 11.625 % Senior Notes due 2014 at an issue price of $297 million with cash proceeds of approximately $290 million, net of fees and expenses. |
| • | In February 2009, we entered into two three-year forward interest rate swap agreements with starting dates of November 9, 2009. These agreements fix the LIBOR-related portion of interest rates for $500 million of our variable-rate debt at an average rate of 2.47%. The commencement date of the interest rate swaps coincides with a $1 billion notional amount interest rate swap maturity that was entered into in November 2006. These derivative instruments have been designated as interest rate cash flow hedges. |
| • | In March 2009, we purchased and cancelled approximately GBP 101 million of our total GBP 250 million outstanding 5.625% EMTN debenture notes. This transaction was pursuant to a cash tender offer, whereby we paid, and participating note holders received, a price of £940 per £1,000 in principal amount of the notes, plus accrued interest. In conjunction with the GBP note cancellation we satisfied, and paid in cash, a portion of the remarketing settlement value associated with the cancelled notes to the two holders of a remarketing option associated with the notes. In addition, we unwound a portion of our existing GBP/Euro foreign currency swap, which was previously designated as a foreign currency cash flow hedge. We recorded a net loss of $3 million as a result of the combined elements of this transaction in March 2009 as a component of other expense, net in the consolidated statement of operations. The net cash paid for the combined elements of this transaction was approximately $197 million. |
| • | In March 2009, we terminated €200 million notional to $259 million notional cross-currency swap, which previously converted part of our Euro-denominated external debt to U.S. dollar debt and received a cash settlement of approximately $2 million. No hedge designation was made for this swap and therefore all prior changes in fair value were recorded in earnings. |
| • | In April 2009, we issued $500 million in aggregate principal amount of 11.5% Senior Notes due 2016 at an issue price of $461 million with cash proceeds of approximately $452 million, net of fees and expenses. |
| • | In June 2009, we purchased and cancelled all of our remaining outstanding GBP 149 million 5.625% EMTN debenture notes. This transaction was pursuant to a cash tender offer, whereby we paid, and participating note holders received, par value for the notes, plus accrued interest. In conjunction with the GBP note cancellation, we satisfied, and paid in cash, the remarketing settlement value to two holders of the remaining portion of the remarketing option associated with the notes. In addition, we unwound the remaining portion of our existing GBP/Euro foreign currency swap, which was previously designated as a foreign currency cash flow hedge. We recorded a net loss of approximately $12 million in June 2009 as a component of other expense, net in the consolidated statement of operations as a result of the combined elements of this transaction. The net cash paid for the combined elements of this transaction was approximately $330 million. |
| • | In June 2009, we entered into a Senior Secured Loan Agreement with Goldman Sachs Lending Partners, LLC, which provides for senior secured term loans in the aggregated principal amount of $500 million (the “New Term Loans”) bearing interest at a fixed rate of 8.50%. The New Term Loans |
69
Table of Contents
| are secured on a pari passu basis with our existing obligations under our 2006 Senior Secured Credit Facilities and have a maturity of eight years. The net proceeds from the issuance of the New Term Loans of approximately $481 million were used in their entirety to pay down senior secured term loan obligations under our 2006 Senior Secured Credit Facilities. |
| • | In June 2009, we received the requisite consent to amend our 2006 Senior Secured Credit Facilities to permit, among other things: (i) future issuances of additional secured notes or loans, which may include, in each case, indebtedness secured on a pari passu basis with our obligations under the 2006 Senior Secured Credit Facilities, so long as (a) the net cash proceeds from any such issuance are used to prepay term loans under the 2006 Senior Secured Credit Facilities at par until $500 million of term loans have been paid, and (b) 90% of the net cash proceeds in excess of the first $500 million from any such issuance (but all of the net cash proceeds after the first $2.0 billion) are used to prepay term loans under the 2006 Senior Secured Credit Facilities at par; and (ii) allow us to agree with lenders to extend the maturity of their term loans and revolving commitments and for us to pay increased interest rates or otherwise modify the terms of their loans in connection with such an extension (subject to certain limitations, including mandatory increases of interest rates under certain circumstances) (collectively, the “Amendment”). In connection with the Amendment, we extended the maturity of $1.26 billion of existing term loans from August 9, 2013 to May 1, 2016. The interest rate margins of term loans that were extended were increased to 3.75%. The Amendment and the subsequent extension of maturity of a portion of the existing term loans is considered a modification of our existing obligations and has been reflected as such in the audited consolidated financial statements. We recorded a charge of approximately $4 million in June 2009 as a component of other expense, net in the consolidated statement of operations primarily relating to the write-off of previously deferred debt issuance costs as a result of this modification. |
| • | In December 2009, we elected to permanently repay $75 million of our existing term loans due August 2013. |
We entered into the following transactions during 2010:
| • | On March 9, 2010, we entered into a three-year interest swap to fix the LIBOR-related portion of interest rates for $250 million of the our variable-rate debt at 1.69%. This swap replaced the $500 million notional amount interest rate swap that matured on February 9, 2010. This derivative instrument has been designated as an interest rate cash flow hedge. |
| • | In March 2010, we elected to permanently repay $25 million of our existing term loans due August 2013. |
| • | In May 2010, our EUR 50 million variable rate EMTN matured and was repaid. |
| • | On August 12, 2010, we completed a term loan extension offer in accordance with the terms of our 2006 Senior Secured Credit Facilities. In connection with completing the term loan extension offer and in order to document the terms of the new class C term loans, as of such date we entered into an amendment to the 2006 Senior Secured Credit Facilities (the “2010 Amendment”). Pursuant to the term loan extension offer and the 2010 Amendment, approximately $1.495 billion of our class A term loans (which mature May 2013) and approximately $5 million of our class B term loans (which mature May 2016) were exchanged for the same principal amount of new class C term loans. The new class C term loans mature on May 1, 2016 and bear a tiered floating interest rate of LIBOR plus a margin of (x) 3.75% to the extent that Nielsen Finance LLC’s Total Leverage Ratio (as defined in the 2006 Senior Secured Credit Facilities) is greater than 5.0 to 1.0 and (y) 3.50% to the extent that Nielsen Finance LLC’s Total Leverage Ratio (as defined in the 2006 Senior Secured Credit Facilities) is less than or equal to 5.0 to 1.0. The foregoing margins are also subject to a decrease of 0.25% in the event and for so long as Nielsen Finance LLC’s corporate credit and/or family rating, as applicable, from either S&P or Moody’s is at least Ba3 or BB-, respectively. The class C term loans will amortize in equal quarterly installments in aggregate annual amounts equal to 1.00% of the original principal amount. No optional prepayments of class C term loans may be made so long as any class A or class B term loans are outstanding. Except as set forth in the 2010 Amendment, the class C term loans shall have the same terms as the class B term loans. |
70
Table of Contents
As a result of the transactions described above, we are highly leveraged and our debt service requirements are significant. At June 30, 2010, December 31, 2009 and 2008, we had $8,439 million, $8,655 million and $9,384 million in aggregate indebtedness, including bank overdrafts, respectively. Our cash interest paid for the six months ended June 30, 2010 and the years ended December 31, 2009, 2008 and 2007 was $249 million, $495 million, $494 million and $533 million, respectively.
2006 Senior Secured Credit Facilities
The description of the 2006 Senior Secured Credit Facilities below is as of June 30, 2010. On August 12, 2010, we completed a term loan extension offer in accordance with the terms of the 2006 Senior Secured Credit Facilities. See “Overview of Financing Transactions” for further information on the 2010 Amendment.
The senior secured credit agreement provides for two term loan facilities of $2,983 million and €321 million maturing in 2013 and two term loan facilities of $1,013 million and €179 million maturing in 2016, for which total outstanding borrowings were $4,501 million at June 30, 2010. In addition, the senior secured credit agreement contains a six-year $688 million senior secured revolving credit facility under which we had no borrowings outstanding as of June 30, 2010. We had an aggregate of $19 million of letters of credit and bank guarantees outstanding as of June 30, 2010, which reduced our total borrowing capacity to $669 million. The senior secured revolving credit facility of Nielsen Finance LLC, The Nielsen Company (US), Inc., Nielsen Holding and Finance B.V. can be used for revolving loans, letters of credit, guarantees and for swingline loans, and is available in U.S. dollars, Euros and certain other currencies. See “Overview of Financing Transactions” section for further information on 2009 transactions relating to these facilities.
We are required to repay installments only on the borrowings under the two senior secured term loan facilities maturing in 2016 in quarterly principal amounts of 0.25% of their original principal amount, with the remaining amount payable on their maturity date.
Borrowings under the senior secured term loan facilities bear interest at a rate as determined by the type of borrowing, equal to either (a) a base rate determined by reference to the higher of (1) the federal funds rate plus 0.5% or (2) the prime rate or (b) a LIBOR rate for the currency of such borrowings (collectively, the “Base Rate”), plus, in each case, an applicable margin. The applicable margins for the senior secured term loans that mature in 2013 vary depending on our secured leverage ratio. The applicable margins for the senior secured term loans that mature in 2016 are set at fixed rates.
Borrowings under the senior secured revolving credit facility bear interest at a rate equal to an applicable margin plus the Base Rate. The applicable margins for the senior secured revolving credit facility vary depending on our total leverage ratio. We pay a quarterly commitment fee of 0.5% on unused commitments under the senior secured revolving facility. The applicable commitment fee rate may vary subject to us attaining certain leverage ratios.
Our 2006 Senior Secured Credit Facilities are guaranteed by TNC B.V., substantially all of the wholly owned U.S. subsidiaries of TNC B.V. and certain of the non-U.S. wholly-owned subsidiaries of TNC B.V., and are secured by substantially all of the existing and future property and assets (other than cash) of the U.S. subsidiaries of TNC B.V. and by a pledge of substantially all of the capital stock of the guarantors, the capital stock of substantially all of the U.S. subsidiaries of TNC B.V., and up to 65% of the capital stock of certain of the non-U.S. subsidiaries of TNC B.V. Under a separate security agreement, substantially all of the assets of TNC B.V. are pledged as collateral for amounts outstanding under the senior secured credit facilities.
Our 2006 Senior Secured Credit Facilities contain a number of covenants that, among other things, restrict, subject to certain exceptions, the ability of Nielsen Holding and Finance B.V. and its restricted subsidiaries (which together constitute most of our subsidiaries) (collectively, the “Credit Facilities Covenant Parties”) to incur additional indebtedness or guarantees, incur liens and engage in sale and leaseback transactions, make certain loans and investments, declare dividends, make payments or redeem or repurchase capital stock, engage in certain mergers, acquisitions and other business combinations, prepay, redeem or purchase certain indebtedness, amend or otherwise alter terms of certain indebtedness, sell certain assets, transact with affiliates, enter into agreements limiting subsidiary distributions and alter the business the Credit Facilities Covenant Parties conduct. In addition,
71
Table of Contents
the Credit Facilities Covenant Parties are required to maintain a maximum total leverage ratio and a minimum interest coverage ratio. Neither Nielsen Holdings nor TNC B.V. is bound by any financial or negative covenants contained in the credit agreement. The senior secured credit facilities also contain certain customary affirmative covenants and events of default. We have maintained compliance with all such covenants described above.
2009 Senior Secured Term Loan
In June 2009, we entered into a Senior Secured Loan Agreement with Goldman Sachs Lending Partners, LLC, which provides for senior secured term loans in the aggregate principal amount of $500 million (the “New Term Loans”) bearing interest at a fixed rate of 8.50%. The New Term Loans are secured on a pari passu basis with our existing obligations under its senior secured credit facilities and have a maturity of eight years. The net proceeds from the issuance of the New Term Loans of approximately $481 million were used in their entirety to pay down senior secured term loan obligations under our existing senior secured credit facilities.
Our New Term Loans are guaranteed by TNC B.V., substantially all of our wholly owned U.S. subsidiaries and certain of our non-U.S. wholly-owned subsidiaries, and are secured by substantially all of the existing and future property and assets (other than cash) of Nielsen’s U.S. subsidiaries and by a pledge of substantially all of the capital stock of the guarantors, the capital stock of substantially all of Nielsen’s U.S. subsidiaries, and up to 65% of the capital stock of certain of Nielsen’s non-U.S. subsidiaries. Under a separate security agreement, substantially all of the assets of Nielsen are pledged as collateral for amounts outstanding under the New Term Loans.
In addition, the New Term Loans include negative covenants, subject to significant exceptions, restricting or limiting the ability of the Credit Facilities Covenant Parties to, among other things, incur, assume or permit to exist additional indebtedness or guarantees, make certain loans and investments, declare dividends, make payments or redeem or repurchase capital stock, engage in mergers, acquisitions and other business combinations, prepay, redeem or purchase certain indebtedness, sell certain assets, transact with affiliates and enter into agreements limiting subsidiary distributions.
Neither Nielsen Holdings nor TNC B.V. is bound by any financial or negative covenants contained in the credit agreement.
The New Term Loans also contain certain customary affirmative covenants and events of default.
Debt Securities
On May 1, 2009, Nielsen Finance LLC and Nielsen Finance Co. (together, “Nielsen Finance”), subsidiaries wholly owned by us, consummated a private offering of $500 million aggregate principal amount of 11.5% Senior Notes due 2016 (the “11.5% Senior Notes”). The 11.5% Senior Notes mature on May 1, 2016. Cash interest accrues at a rate of 11.5% per annum from the issue date and is payable semi-annually from November 2009. In July 2009, we completed an exchange offer for the 11.5% Senior Notes.
In January 2009, Nielsen Finance LLC and Nielsen Finance Co. consummated a private offering of $330 million in aggregate principal amount of 11.625% Senior Notes due 2014 (the “11.625% Senior Notes”). The 11.625% Senior Notes mature on February 1, 2014. Cash interest accrues at a rate of 11.625% per annum from the issue date and is payable semi-annually from August 2009. In July 2009, we completed an exchange offer for the 11.625% Senior Notes.
On April 16, 2008, Nielsen Finance LLC and Nielsen Finance Co. consummated a private offering of $220 million aggregate principal amount of 10% Senior Notes due 2014 (the “10% Senior Notes”). The 10% Senior Notes mature on August 1, 2014. Cash interest accrues at a rate of 10% per annum from the issue date and is payable semi-annually from August 2008. In July 2009, we completed an exchange offer for the 10% Senior Notes.
In August 2006, Nielsen Finance LLC and Nielsen Finance Co. issued $650 million 10% and €150 million 9% senior notes due 2014 (the “ Nielsen Finance Senior Notes”). Interest is payable semi-annually from February 2007. In September 2007, we completed an exchange offer for the Nielsen Finance Senior Notes.
72
Table of Contents
The senior notes above are collectively referred to herein as the “Senior Notes.”
The carrying values of the combined issuances of the Senior Notes were $1,824 million at June 30, 2010. The Senior Notes are senior unsecured obligations and rank equal in right of payment to all of the existing and future senior indebtedness of Nielsen Finance LLC and Nielsen Finance Co.
The indentures governing the Senior Notes and Senior Subordinated Discount Notes limit the ability of Nielsen Holding and Finance B.V. and its restricted subsidiaries (which together constitute a majority of Nielsen’s subsidiaries) to incur additional indebtedness, pay dividends or make other distributions or repurchase our capital stock, make certain investments, enter into certain types of transactions with affiliates, use assets as security in other transactions and sell certain assets or merge with or into other companies subject to certain exceptions. Upon a change in control, Nielsen Finance is required to make an offer to redeem all of the Senior Notes and Senior Subordinated Discount Notes at a redemption price equal to the 101% of the aggregate accreted principal amount plus accrued and unpaid interest. The Senior Notes and Senior Subordinated Discount Notes are jointly and severally guaranteed by TNC B.V., substantially all of our wholly owned U.S. subsidiaries, and certain of our non-U.S. wholly-owned subsidiaries.
In August 2006, we received proceeds of €200 million ($257 million) on the issuance by TNC B.V. of the €343 million 11.125% senior discount notes due 2016 (“Senior Discount Notes”), with a carrying value of $378 million at June 30, 2010. Interest accretes through 2011 and is payable semi-annually commencing February 2012. The Senior Discount Notes are senior unsecured obligations and rank equal in right of payment to all of the existing and future senior indebtedness of TNC B.V. The notes are effectively subordinated to the existing and future secured indebtedness of TNC B.V. to the extent of the assets securing such indebtedness and will be structurally subordinated to all obligations of the subsidiaries of TNC B.V.
EMTN Program and Other Financing Arrangements
We have a Euro Medium Term Note program (“EMTN”) program in place. All debt securities and most private placements are quoted on the Luxembourg Stock Exchange. We had carrying values of $145 million outstanding under the EMTN program at June 30, 2010. The company can no longer issue new debt under the EMTN program.
Cash Flows six months ended June 30, 2010 versus June 30, 2009
Operating activities. Net cash provided by operating activities was $129 million for the six months ended June 30, 2010, compared to $151 million for the six months ended June 30, 2009. The primary driver for the reduction in cash provided by operating activities was the reduction in working capital performance and higher interest payments, which more than offset the growth in operating income excluding the impact of non-cash depreciation and amortization. The reduction in working capital performance resulted primarily from an approximately $74 million reduction due to the timing of client billings and lower year over year accounts receivable collection performance. Our key collections performance measure, days billing outstanding (DBO), increased by 1 day to 51 days for the six months ended June 30, 2010 compared to a decrease of 1 day to 54 days for the six months ended June 30, 2009. These reductions were only partially offset by the timing of employee compensation and other accruals as well as lower restructuring payments.
Investing activities. Net cash used in investing activities was $154 million for the six months ended June 30, 2010, compared to $143 million for the six months ended June 30, 2009. The primary driver for the increase in the usage of cash from investing activities was the increase in capital expenditures.
Capital expenditures for property, plant, equipment, software and other assets totaled $146 million for the six months ended June 30, 2010 compared to $132 million for the six months ended June 30, 2009. The primary reasons for the increase in capital expenditures related to higher spending for software and technology infrastructure development.
73
Table of Contents
Financing activities. Net cash used in financing activities was $97 million and $99 million for the six months ended June 30, 2010 and 2009, respectively. Although the amounts were flat year over year, we repaid our EUR 50 million EMTN in May 2010 and repaid $220 million on our senior secured revolving credit facility and executed numerous financing transactions in 2009 described under the “Overview of Financing Transactions” section above.
Cash Flows 2009 versus 2008
At December 31, 2009, cash and cash equivalents were $514 million, an increase of $47 million from December 31, 2008. Our total indebtedness was $8,655 million.
Operating activities. Net cash provided by operating activities was $517 million for the year ended December 31, 2009, compared to $317 million for the year ended December 31, 2008. The primary drivers for the increase in cash flows from operating activities were growth in operating income excluding the impact of non-cash depreciation and amortization and impairment charges. This growth was further driven by improved working capital performance, offset slightly by an increase in tax payments. The improved working capital performance primarily resulted from a benefit of approximately $149 million relating to improvement in year-over-year accounts receivable collections as well as lower bonus payments. Our DBO decreased by five days to 50 days during the year ended December 31, 2009 compared to an increase of four days to 55 days during the year ended December 31, 2008.
Investing activities. Net cash used in investing activities was $227 million for the year ended December 31, 2009, compared to $591 million for the year ended December 31, 2008. The lower net cash usage was primarily driven by lower acquisition payments as a result of our acquisition of IAG in May 2008 as well as lower capital expenditures and proceeds from the sale of divestitures in 2009, primarily resulting from the sale of the media properties within our Publications operating segment in December 2009.
Financing activities. For the year ended December 31, 2009, we had net cash used in financing activities of $271 million as compared to net cash provided by financing activities of $367 million for the year ended December 31, 2008. The comparative use of cash was mainly driven by our repayments of $295 million on our revolving credit facility in 2009 as compared to net borrowings of $285 million in 2008 as well as the results of the financing transactions described above under the “Overview of Financing Transactions” section above.
Cash Flows 2008 versus 2007
At December 31, 2008, cash and cash equivalents were $467 million, an increase of $65 million from December 31, 2007. Our total indebtedness was $9,384 million at December 31, 2008.
Operating activities. Net cash provided by operating activities was $317 million for the year ended December 31, 2008 compared to $233 million for the year ended December 31, 2007. The primary drivers for the increase in cash flows from operating activities were the growth in operating income excluding the impact of non-cash depreciation and amortization and impairment charges. The growth was further driven by lower interest and tax payments partially offset by lower working capital performance. The lower working capital performance primarily resulted from higher pension, bonus and one-time payments. The year-over-year accounts receivable collection performance was flat where our DBO increased by four days to 55 days and 51 days during the years ended December 31, 2008 and December 31, 2007, respectively.
Investing activities. Net cash used in investing activities was $591 million for the year ended December 31, 2008 compared to $517 million for the year ended December 31, 2007. The higher net cash used was primarily driven by lower proceeds from sale of subsidiaries of $417 million, increased capital expenditures and the impact of the 2007 sale of marketable securities. This was offset by a $594 million reduction of acquisition related expenditures.
74
Table of Contents
Financing activities. Net cash provided by financing activities was $367 million for the year ended December 31, 2008 as compared to $9 million for the year ended December 31, 2007. The higher source of cash was mainly driven by higher net borrowings on the senior secured revolving credit facility and lower repayments of other debt, offset by lower proceeds from issuances of other debt as well as the impact of a 2007 capital contribution from Luxco.
Capital Expenditures
Investments in property, plant, equipment, software and other assets totaled $282 million, $370 million and $266 million in 2009, 2008 and 2007, respectively. The most significant expenditures in 2009, 2008, and 2007 were the investment in the data factory systems in U.S. and Europe and NMR U.S.’s rollout of the LPM, active/passive Meter and the expansion of the National People Meter. The decrease in capital spending in 2009 versus 2008 was due to a reduction in LPM spending as well as the completion of other key investments in 2008.
Covenant EBITDA Attributable to TNC B.V.
Our 2006 Senior Secured Credit Facilities contain a covenant that requires our indirect wholly-owned subsidiary, Nielsen Holding and Finance B.V. and its restricted subsidiaries, to maintain a maximum ratio of consolidated total net debt, excluding certain TNC B.V. net debt, to Covenant EBITDA, calculated for the trailing four quarters (as determined under our 2006 Senior Secured Credit Facilities). Currently, the maximum ratio is 8.0 to 1.0, with such maximum ratio declining over time to 6.25 to 1.0 for periods after October 1, 2012.
In addition, our 2006 Senior Secured Credit Facilities contain a covenant that requires Nielsen Holding and Finance B.V. and its restricted subsidiaries to maintain a minimum ratio of Covenant EBITDA to Consolidated Interest Expense, including interest expense relating to TNC B.V., calculated for the trailing four quarters (as determined under our 2006 Senior Secured Credit Facilities). Currently, the minimum ratio is 1.65 to 1.0, with such minimum ratio varying between 1.75 to 1.0 to 1.50 to 1.0 for subsequent periods.
Failure to comply with either of these covenants would result in an event of default under our 2006 Senior Secured Credit Facilities unless waived by our senior credit lenders. An event of default under our senior credit facility can result in the acceleration of our indebtedness under the facility, which in turn would result in an event of default and possible acceleration of indebtedness under the agreements governing our debt securities as well. As our failure to comply with the covenants described above can cause us to go into default under the agreements governing our indebtedness, management believes that our 2006 Senior Secured Credit Facilities and these covenants are material to us. As of June 30, 2010, we were in compliance with the covenants described above.
We also measure the ratio of secured net debt to Covenant EBITDA, as it impacts the applicable borrowing margin under our senior secured term loans due 2013. During periods when the ratio is less than 4.25 to 1.0, the applicable margin is 25 basis points lower than it would be otherwise.
Covenant earnings before interest, taxes, depreciation and amortization (“Covenant EBITDA”) is a non-GAAP measure used to determine our compliance with certain covenants contained in our senior secured credit facilities. Covenant EBITDA is defined in our 2006 Senior Secured Credit Facilities as net income/(loss) from continuing operations for TNC B.V., as adjusted for the items summarized in the table below. Covenant EBITDA is not a presentation made in accordance with GAAP, and our use of the term Covenant EBITDA varies from others in our industry due to the potential inconsistencies in the method of calculation and differences due to items subject to interpretation. Covenant EBITDA should not be considered as an alternative to net income/(loss), operating income or any other performance measures derived in accordance with GAAP as measures of operating performance or cash flows as measures of liquidity. Covenant EBITDA has important limitations as an analytical tool and should not be considered in isolation or as a substitute for analysis of our results as reported under GAAP. Because of these limitations we rely primarily on our GAAP results. However, we believe that the inclusion of supplementary adjustments to EBITDA applied in presenting Covenant EBITDA is appropriate to provide additional information to investors to demonstrate compliance with our financing covenants.
75
Table of Contents
The following is a reconciliation of TNC B.V.’s income/(loss) from continuing operations, for the twelve months ended June 30, 2010, to Covenant EBITDA as defined above under our 2006 Senior Secured Credit Facilities:
| Covenant EBITDA (unaudited) |
||||
| (IN MILLIONS) |
Twelve months ended June 30, 2010 |
|||
| Loss from continuing operations |
$ | (299 | ) | |
| Interest expense, net |
649 | |||
| Benefit for income taxes |
(158 | ) | ||
| Depreciation and amortization |
568 | |||
| EBITDA |
760 | |||
| Non-cash charges |
547 | |||
| Unusual or non-recurring items(1) |
(51 | ) | ||
| Restructuring charges and business optimization costs |
87 | |||
| Sponsor monitoring fees |
12 | |||
| Other(2) |
41 | |||
| Covenant EBITDA |
$ | 1,396 | ||
| Credit Statistics: |
||||
| Net debt, including TNC B.V. net debt(3) |
$ | 8,087 | ||
| Less: Unsecured debenture loans |
(3,287 | ) | ||
| Less: Other unsecured net debt |
(5 | ) | ||
| Secured net debt |
$ | 4,795 | ||
| Net debt, excluding $377 million (at June 30, 2010) of TNC B.V. net debt |
$ | 7,710 | ||
| Ratio of secured net debt to Covenant EBITDA |
3.43 | |||
| Ratio of net debt (excluding net debt of TNC B.V.) to Covenant EBITDA |
5.52 | |||
| Consolidated interest expense, including TNC B.V. interest expense(4) |
$ | 506 | ||
| Ratio of Covenant EBITDA to Consolidated Interest Expense, including TNC B.V. interest expense |
2.76 |
| (1) | Unusual or non-recurring items include (amounts in millions): |
| Twelve months ended June 30, 2010 |
||||
| Currency exchange rate differences on financial transactions and other losses, net |
$ | (115 | ) | |
| Loss on derivative Instruments |
39 | |||
| Duplicative running costs |
7 | |||
| U.S. listing costs/consulting fees |
7 | |||
| Other |
11 | |||
| Total |
$ | (51 | ) | |
| (2) | These adjustments include the pro forma EBITDA impact of businesses that were acquired during the last twelve months, loss on sale of fixed assets, subsidiaries and affiliates, dividends received from affiliates; equity in net loss of affiliates, and the exclusion of Covenant EBITDA attributable to unrestricted subsidiaries. |
| (3) | Net debt, including net debt of TNC B.V., is not a defined term under GAAP. Net debt is calculated as total debt less cash and cash equivalents at June 30, 2010 excluding a contractual $10 million threshold and cash and cash equivalents of unrestricted subsidiaries of $6 million. |
76
Table of Contents
| (4) | Consolidated interest expense is not a defined term under GAAP. Consolidated interest expense for any period is defined in our senior secured credit facilities as the sum of (i) the cash interest expense of Nielsen Holding and Finance B.V. and its subsidiaries with respect to all outstanding indebtedness, including all commissions, discounts and other fees and charges owed with respect to letters of credit and bankers’ acceptance and net costs under swap contracts, net of cash interest income, and (ii) any cash payments in respect of the accretion or accrual of discounted liabilities during such period related to borrowed money (with a maturity of more than one year) that were amortized or accrued in a previous period, excluding, in each case, however, among other things, the amortization of deferred financing costs and any other amounts of non-cash interest, the accretion or accrual of discounted liabilities during such period, commissions, discounts, yield and other fees and charges incurred in connection with certain permitted receivables financing and all non-recurring cash interest expense consisting of liquidated damages for failure to timely comply with registration rights obligations and financing fees. |
See “—Liquidity and Capital Resources” for further information on our indebtedness and covenants.
Transactions with Related Parties
We recorded $6 million, $12 million, $11 million, $11 million and $7 million, respectively, in SG&A related to management fees payable to the Sponsors under advisory agreements, sponsor travel and consulting for the six months ended June 30, 2010 and for the years ended December 31, 2009, 2008, 2007 and 2006, respectively. From the date of acquisition through June 30, 2010, we have paid $47 million in these fees to the Sponsors. Upon the completion of this offering, we anticipate that we will pay a fee of approximately $103 million to the Sponsors in connection with the termination of such advisory agreements in accordance with their terms.
In May 2006, Luxco, our direct parent, executed a loan agreement with us for principal amount Euro 500 million in conjunction with the Acquisition. The loan accreted interest at 10.00% per annum and was payable annually at the request of Luxco or the Company. If interest was not paid at the end of each year, such interest was deemed capitalized. No interest was paid on this loan through December 31, 2008 and the corresponding carrying value at such date, including capitalized interest, was $892 million. In January 2009, the loan agreement was terminated and the underlying carrying value, including accrued interest, was capitalized by Luxco in exchange for 78,332,870 shares in the Company’s common stock. Nielsen recorded $3 million, $3 million, $86 million and $73 million in interest expense associated with this loan for the six months ended June 30, 2009 and the years ended December 31, 2009, 2008 and 2007, respectively.
A portion of the borrowings under the senior secured credit facility have been purchased by certain of the Sponsors in market transactions not involving the Company. Based on information made available to the Company, amounts held by the Sponsors and their affiliates were $554 million and $445 million as of December 31, 2009 and 2008, respectively. Interest expense associated with amounts held by the Sponsors and their affiliates approximated $16 million, $22 million and $28 million during the years ended December 31, 2009, 2008 and 2007, respectively. At June 30, 2010, $527 million of the senior secured credit facilities and $22 million of senior debenture loans were held by the Sponsors and their affiliates. Of the $549 million of debt held by the Sponsors and their affiliates, Kohlberg Kravis Roberts & Co. and their affiliates held $236 million, The Blackstone Group and their affiliates held $198 million and The Carlyle Group and their affiliates held $115 million. The Sponsors, their subsidiaries, affiliates and controlling stockholders may, from time to time, depending on market conditions, seek to purchase debt securities issued by Nielsen or its subsidiaries or affiliates in open market or privately negotiated transactions or by other means. Nielsen makes no undertaking to disclose any such transactions except as may be required by applicable laws and regulations.
Effective January 1, 2009, we entered into an employer health program arrangement with Equity Healthcare LLC (“Equity Healthcare”). Equity Healthcare negotiates with providers of standard administrative services for health benefit plans and other related services for cost discounts, quality of service monitoring, data services and
77
Table of Contents
clinical consulting and oversight by Equity Healthcare. Because of the combined purchasing power of its client participants, Equity Healthcare is able to negotiate pricing terms from providers that are believed to be more favorable than the companies could obtain for themselves on an individual basis. Equity Healthcare is an affiliate of The Blackstone Group, one of our Sponsors.
In consideration for Equity Healthcare’s provision of access to these favorable arrangements and its monitoring of the contracted third parties’ delivery of contracted services to us, we pay Equity Healthcare a fee of $2 per participating employee per month (“PEPM Fee”). As of December 31, 2009, we had approximately 8,000 employees enrolled in our self-insured health benefit plans in the United States. Equity Healthcare may also receive a fee (“Health Plan Fees”) from one or more of the health plans with whom Equity Healthcare has contractual arrangements if the total number of employees joining such health plans from participating companies exceeds specified thresholds.
Commitments and Contingencies
Outsourced Services Agreements
On February 19, 2008, we amended and restated our Master Services Agreement dated June 16, 2004 (“MSA”), with Tata America International Corporation and Tata Consultancy Services Limited (jointly “TCS”). The term of the amended and restated MSA is for ten years, effective October 1, 2007; with a one year renewal option granted to us, during which ten year period (or if we exercise our renewal option, eleven year period) we have committed to purchase at least $1 billion in services from TCS. Unless mutually agreed, the payment rates for services under the amended and restated MSA are not subject to adjustment due to inflation or changes in foreign currency exchange rates. TCS will provide us with Information Technology, Applications Development and Maintenance and Business Process Outsourcing services globally. The amount of the purchase commitment may be reduced upon the occurrence of certain events, some of which also provide us with the right to terminate the agreement.
In addition, in 2008, we entered into an agreement with TCS to outsource our global IT Infrastructure services. The agreement has an initial term of seven years, and provides for TCS to manage our infrastructure costs at an agreed upon level and to provide Nielsen’s infrastructure services globally for an annual service charge of $39 million per year, which applies towards the satisfaction of our aforementioned purchased services commitment with TCS of at least $1 billion over the term of the amended and restated MSA. The agreement is subject to earlier termination under certain limited conditions.
Other Contractual Obligations. Our other contractual obligations include capital lease obligations, facility leases, leases of certain computer and other equipment, agreements to purchase data and telecommunication services, the payment of principal on debt and pension fund obligations.
At December 31, 2009, the minimum annual payments under these agreements and other contracts that had initial or remaining non-cancelable terms in excess of one year are as listed in the following table. There were no significant changes to our minimum commitments that occurred through the date of this prospectus. Due to the uncertainty with respect to the timing of future cash flows associated with our unrecognized tax benefits at December 31, 2009, we are unable to make reasonably reliable estimates of the timing of any potential cash settlements with the respective taxing authorities. Therefore, $152 million of unrecognized tax benefits (which includes interest and penalties of $23 million) have been excluded from the contractual obligations table below. See Note 13 – Income Taxes – to the audited consolidated financial statements included elsewhere in this prospectus for a discussion on income taxes.
78
Table of Contents
| Payments due by period | |||||||||||||||||||||
| (IN MILLIONS) |
Total | 2010 | 2011 | 2012 | 2013 | 2014 | After 2014 | ||||||||||||||
| Capital lease obligations and other debt(a) |
$ | 236 | $ | 34 | $ | 19 | $ | 19 | $ | 19 | $ | 15 | $ | 130 | |||||||
| Operating leases(b) |
397 | 92 | 74 | 63 | 47 | 41 | 80 | ||||||||||||||
| Other contractual obligations(c) |
908 | 331 | 220 | 219 | 132 | 4 | 2 | ||||||||||||||
| Short-term and long-term debt(a) |
8,509 | 85 | 57 | 128 | 3,381 | 1,397 | 3,461 | ||||||||||||||
| Interest(d) |
3,114 | 481 | 430 | 576 | 533 | 463 | 631 | ||||||||||||||
| Pension fund obligations(e) |
28 | 28 | — | — | — | — | — | ||||||||||||||
| Total |
$ | 13,192 | $ | 1,051 | $ | 800 | $ | 1,005 | $ | 4,112 | $ | 1,920 | $ | 4,304 | |||||||
| (a) | Our short-term and long-term debt obligations, including capital lease and other financing obligations, are described in Note 10 to the audited consolidated financial statements “Long-Term Debt and Other Financing Arrangements.” Other debt includes bank overdrafts of $15 million due within one year. |
| (b) | Our operating lease obligations are described in Note 15 to the audited consolidated financial statements “Commitments and Contingencies.” |
| (c) | Other contractual obligations represent obligations under agreement, which are not unilaterally cancelable by us, are legally enforceable and specify fixed or minimum amounts or quantities of goods or services at fixed or minimum prices. We generally require purchase orders for vendor and third party spending. The amounts presented above represent the minimum future annual services covered by purchase obligations including data processing, building maintenance, equipment purchasing, photocopiers, land and mobile telephone service, computer software and hardware maintenance, and outsourcing. Our remaining commitments under the outsourced services agreements with TCS have been included above on an estimated basis over the years within the contractual period in which we expect to satisfy our obligations. |
| (d) | Interest payments consist of interest on both fixed-rate and variable-rate debt. See Note 10 to the audited consolidated financial statements, “Long-Term Debt and Other Financing Arrangements.” |
| (e) | Our contributions to pension and other post-retirement defined benefit plans were $44 million, $49 million and $31 million during 2009, 2008 and 2007, respectively. Future pension and other post-retirement benefits contributions are not determinable for time periods after 2010. See Note 9 to the audited consolidated financial statements, “Pensions and Other Post-Retirement Benefits,” for a discussion on plan obligations. |
Guarantees and Other Contingent Commitments
At December 31, 2009, we were committed under the following significant guarantee arrangements:
Sub-lease guarantees. We provide sub-lease guarantees in accordance with certain agreements pursuant to which we guarantee all rental payments upon default of rental payment by the sub-lessee. To date, we have not been required to perform under such arrangements, and do not anticipate making any significant payments related to such guarantees and, accordingly, no amounts have been recorded.
Letters of credit and bank guarantees. Letters of credit and bank guarantees issued and outstanding amount to $19 million at June 30, 2010.
Legal Proceedings and Contingencies. In addition to the legal proceedings described below and in Note 15 to the audited consolidated financial statements, “Commitments and Contingencies,” we are presently a party to certain lawsuits arising in the ordinary course of our business. We believe that none of our current legal proceedings will have a material adverse effect on our business, results of operations or financial condition.
Sunbeam Television Corp. Sunbeam Television Corp. (“Sunbeam”) filed a lawsuit in Federal District Court in Miami, Florida on April 30, 2009. The lawsuit alleges that Nielsen Media Research, Inc. violated Federal and Florida state antitrust laws and Florida’s unfair trade practices laws by attempting to maintain a monopoly and abuse its position in the market, and breached its contract with Sunbeam by producing defective ratings data through its sampling methodology. The complaint did not specify the amount of damages sought and also sought declaratory and equitable relief. Nielsen believes this lawsuit is without merit and intends to defend it vigorously.
79
Table of Contents
Off-Balance Sheet Arrangements
Except as disclosed above, we have no off-balance sheet arrangements that currently have or are reasonably likely to have a material effect on our consolidated financial condition, changes in financial condition, results of operations, liquidity, capital expenditure or capital resources.
Summary of Recent Accounting Pronouncements
Business Combinations
In December 2007, the Financial Accounting Standards Board (“FASB”) issued a revised standard for accounting for business combinations, which was effective for fiscal years beginning on or after December 15, 2008 and applies to all business combinations. The standard provides that, upon initially obtaining control, an acquirer shall recognize 100 percent of the fair values of acquired assets, including goodwill, and assumed liabilities, with only limited exceptions, even if the acquirer has not acquired 100 percent of its target. As a consequence, the prior step acquisition model was eliminated. Additionally, the standard changed prior practice, in part, as follows: (i) contingent consideration arrangements are fair valued at the acquisition date and included on that basis in the purchase price consideration; (ii) transaction costs are expensed as incurred, rather than capitalized as part of the purchase price; (iii) pre-acquisition contingencies, such as those relating to legal matters, are generally accounted for in purchase accounting at fair value; (iv) in order to accrue for a restructuring plan in purchase accounting, the requirements for accounting for costs associated with exit or disposal activities have to be met at the acquisition date; and (v) changes to valuation allowances for deferred income tax assets and adjustments to unrecognized tax benefits generally are recognized as adjustments to income tax expense rather than goodwill. We adopted the new standard effective January 1, 2009 and such adoption did not have a material impact on our audited consolidated financial statements as of December 31, 2009 and for the year then ended.
Fair Value Measurements
In January 2010, the FASB issued updates to its fair value measurements standards that require entities to provide new disclosures and clarify existing disclosures relating to fair value measurements. The new disclosures and clarifications of existing disclosures are effective for interim and annual reporting periods beginning after December 15, 2009, except for the disclosures about purchases, sales, issuances, and settlements in Level 3 fair value measurements, which are effective for fiscal years beginning after December 15, 2010. We do not currently have fair value measurements within the Level 3 category and therefore the adoption did not have a material impact on our unaudited condensed consolidated financial statements as of June 30, 2010 or for the six months then ended.
In February 2008, the FASB delayed the effective date of its fair value measurements standard for all non-financial assets and non-financial liabilities, except for items that are recognized or disclosed at fair value in the financial statements on a recurring basis (at least annually), until the beginning of the first quarter of 2009. Therefore, effective January 1, 2009, we adopted the standard for non-financial assets and non-financial liabilities. The adoption did not have a significant impact on our audited consolidated financial statements as of December 31, 2009 and for the year then ended. The additional disclosures required by this statement are included in Note 7—“Fair Value Measurements”.
Derivative Instruments Disclosures
In March 2008, the FASB issued a revised standard, which enhances required disclosures regarding derivative instruments and hedging activities, including enhanced disclosures regarding how: (a) an entity uses derivative instruments; (b) derivative instruments and related hedged items are accounted for as hedges as defined by the FASB’s hedge accounting guidance; and (c) derivative instruments and related hedged items affect an entity’s financial position, financial performance, and cash flows. The adoption of this standard,
80
Table of Contents
effective January 1, 2009, had no impact on our audited consolidated financial statements as of December 31, 2009 and for the year then ended. The additional disclosures required by this statement are included in Note 7 to the audited consolidated financial statements, “Fair Value Measurements.”
Revenue Recognition
In October 2009, the FASB issued updates to its accounting standards pertaining to multiple-deliverable revenue arrangements requiring entities to allocate revenue in an arrangement using estimated selling prices of the delivered goods and services based on a selling price hierarchy. The guidance eliminates the residual method of revenue allocation and requires revenue to be allocated using the relative selling price method and is effective prospectively for revenue arrangements entered into or materially modified in fiscal years beginning on or after June 15, 2010. We are currently evaluating the impact of the revised accounting standards, but do not expect its adoption to have a material impact on our consolidated financial statements.
Changes in the Consolidation Model for Variable Interest Entities
In June 2009, the FASB issued an update that amends the consolidation guidance applicable to variable interest entities (“VIE”) and changes how a reporting entity evaluates whether an entity is considered the primary beneficiary of a VIE and is therefore required to consolidate such VIE and will also require assessments at each reporting period of which party within the VIE is considered the primary beneficiary and will require a number of new disclosures related to VIE. These updates are effective for fiscal years beginning after November 15, 2009. The adoption of this guidance did not have a material impact on our unaudited condensed consolidated financial statements.
Quantitative and Qualitative Disclosures About Market Risk
Market risk is the potential loss arising from adverse changes in market rates and market prices such as interest rates, foreign currency exchange rates, and changes in the market value of equity instruments. We are exposed to market risk, primarily related to foreign exchange and interest rates. We actively monitor these exposures. Historically, in order to manage the volatility relating to these exposures, we entered into a variety of derivative financial instruments, mainly interest rate swaps, cross-currency swaps and forward rate agreements. Currently we only employ basic contracts, that is, without options, embedded or otherwise. Our objective is to reduce, where it is deemed appropriate to do so, fluctuations in earnings, cash flows and the value of our net investments in subsidiaries resulting from changes in interest rates and foreign currency rates. It is our policy not to trade in financial instruments.
Foreign Currency Exchange Rate Risk
We operate globally and we predominantly generate revenue and expenses in local currencies. Because of fluctuations (including possible devaluations) in currency exchange rates or the imposition of limitations on conversion of foreign currencies into our reporting currency, we are subject to currency translation exposure on the profits of our operations, in addition to transaction exposure.
Foreign currency translation risk is the risk that exchange rate gains or losses arise from translating foreign entities’ statements of earnings and balance sheets from functional currency to our reporting currency (the U.S. Dollar) for consolidation purposes. Translation risk exposure is managed by creating “natural hedges” in our financing or by using derivative financial instruments aimed at offsetting certain exposures in the statement of earnings or the balance sheet. We do not use derivative financial instruments for trading or speculative purposes.
81
Table of Contents
The table below details the percentage of revenues and expenses by currency for the six months ended June 30, 2010 and the year ended December 31, 2009:
| U.S. Dollars | Euro | Other Currencies | |||||||
| Six months ended June 30, 2010 |
|||||||||
| Revenues |
53 | % | 14 | % | 33 | % | |||
| Operating costs |
54 | % | 15 | % | 31 | % | |||
| Year ended December 31, 2009 |
|||||||||
| Revenues |
53 | % | 16 | % | 31 | % | |||
| Operating costs |
59 | % | 15 | % | 26 | % |
Based on the year ended December 31, 2009, a one cent change in the U.S. dollar/Euro exchange rate will impact revenues by approximately $5 million annually, with an immaterial impact on operating income.
We have operations in both our Watch and Buy segments in Venezuela and our functional currency for these operations is the Venezuelan bolivares fuertes. Venezuela’s currency was considered hyperinflationary as of January 1, 2010 and further, in January 2010, Venezuela’s currency was devalued and a new currency exchange rate system was announced. We have evaluated the new exchange rate system and have concluded that our local currency transactions will be denominated in U.S. dollars until Venezuela’s currency is deemed to be non hyperinflationary. We recorded a charge of $7 million associated with the currency devaluation in January 2010 in our foreign exchange transaction gains, net line item. In June 2010, a further revision to the currency exchange rate system was made. The impact of the hyperinflationary accounting was not material to our consolidated results of operations for the six months ended June 30, 2010.
Effective July 1, 2010, we designated our EUR 321 million variable rate senior secured term loan due 2013 and our EUR 179 million variable rate senior secured term loan due 2016 as non-derivative hedges of our net investment in a European subsidiary. Beginning on July 1, 2010, gains or losses attributable to fluctuations in the Euro as compared to the U.S. Dollar associated with this debenture will be recorded to the cumulative translation adjustment within stockholders’ equity, net of income tax. Our net income/(loss) reflected foreign currency exchange gains of $96 million for the six months ended June 30, 2010 and losses of $7 million for the six months ended June 30, 2009 associated with these loans.
Interest Rate Risk
We continually review our fixed and variable rate debt along with related hedging opportunities in order to ensure our portfolio is appropriately balanced as part of our overall interest rate risk management strategy. At June 30, 2010, we had $4,563 million in carrying value of floating-rate debt under our 2006 Senior Secured Credit Facilities and our EMTN floating rate notes. A one percentage point increase in these floating rates would increase our annual interest expense by approximately $46 million. Recent developments in the U.S. and global financial markets have resulted in adjustments to our tolerable exposures to interest rate risk. In February 2009, we modified the reset interest rate underlying our $4,525 million senior secured term loan in order to achieve additional economic interest benefit and, as a result, all existing floating-to-fixed interest rate swap derivative financial instruments became ineffective. All changes in fair value of the affected interest rate swaps are reflected as a component of derivative gains and losses within our consolidated statement of operations.
On March 9, 2010, we entered into a three-year interest swap to fix the LIBOR-related portion of interest rates for $250 million of our variable-rate debt at 1.69%. This swap replaced the $500 million notional amount interest rate swap that matured on February 9, 2010. This derivative instrument has been designated as an interest rate cash flow hedge.
82
Table of Contents
In February 2009, we entered into two three-year forward interest rate swap agreements with starting dates of November 9, 2009. These agreements fix the LIBOR-related portion of interest rates for $500 million of our variable-rate debt at an average rate of 2.47%. The commencement date of the interest rate swaps coincided with the $1 billion notional amount interest rate swap that matured on November 9, 2009. These derivative instruments have been designated as interest rate cash flow hedges.
Derivative instruments involve, to varying degrees, elements of non-performance, or credit risk. We do not believe that we currently face a significant risk of loss in the event of non-performance by the counterparties associated with these instruments, as these transactions were executed with a diversified group of major financial institutions with a minimum investment-grade or better credit rating. Our credit risk exposure is managed through the continuous monitoring of our exposures to such counterparties.
83
Table of Contents
Our Company
We are a leading global information and measurement company that provides clients with a comprehensive understanding of consumers and consumer behavior. We deliver critical media and marketing information, analytics and industry expertise about what consumers watch (consumer interaction with television, online and mobile) and what consumers buy on a global and local basis. Our information, insights and solutions help our clients maintain and strengthen their market positions and identify opportunities for profitable growth. We have a presence in approximately 100 countries, including many developing and emerging markets, and hold leading market positions in many of our services and geographies. Based on the strength of the Nielsen brand, our scale and the breadth and depth of our solutions, we believe we are the global leader in measuring and analyzing consumer behavior in the segments in which we operate.
We help our clients enhance their interactions with consumers and make critical business decisions that we believe positively affect our clients’ sales. Our data and analytics solutions, which have been developed through substantial investment over many decades, are deeply embedded into our clients’ workflow as demonstrated by our long-term client relationships, multi-year contracts and high contract renewal rates. The average length of relationship with our top ten clients, which include The Coca-Cola Company, NBC Universal, Nestle S.A., News Corp., The Procter & Gamble Company and the Unilever Group, is more than 30 years. Typically, before the start of each year, nearly 70% of our annual revenue has been committed under contracts in our combined Watch and Buy segments.
We align our business structure into three reporting segments, the principal two of which are What Consumers Watch (media audience measurement and analytics) and What Consumers Buy (consumer purchasing measurement and analytics). Our Watch and Buy segments, which together generated 96% of our revenues in 2009, are built on an extensive foundation of proprietary data assets that are designed to yield essential insights for our clients to successfully measure, analyze and grow their businesses.
Our Watch segment provides viewership data and analytics primarily to the media and advertising industries across television, online and mobile screens. According to ZenithOptimedia, a leading global media services agency, in 2008, total global spending on advertising across television, online and mobile platforms was at least $236 billion. Our Watch data is used by our media clients to understand their audiences, establish the value of their advertising inventory and maximize the value of their content, and by our advertising clients to plan and optimize their spending. Within our Watch segment, our ratings are the primary metrics used to determine the value of programming and advertising in the U.S. total television advertising marketplace, which was approximately $77 billion in 2008 according to Veronis Suhler Stevenson. Our Watch segment has more than 5,000 clients across the media, digital media and telecommunications industry, with renewal rates in excess of 90%. We are a leader in providing measurement services across what we refer to as the three screens: television, online and mobile.
Our Buy segment provides retail transactional measurement data, consumer behavior information and analytics primarily to businesses in the consumer packaged goods industry. According to Euromonitor International, global consumer spending in the product categories we measure was over $7.1 trillion in 2008. Our extensive database of retail and consumer information, combined with our advanced analytical capabilities, helps generate strategic insights that influence our clients’ key business decisions. We track billions of sales transactions per month in retail outlets in approximately 100 countries around the world and our data is used by our clients to measure their sales and market share. We are the only company offering such extensive global coverage for the collection, provision and analysis of this information for consumer packaged goods. Our Buy products and services also enable our clients to better manage their brands, uncover new sources of demand, launch and grow new products, analyze their sales, improve their marketing mix and establish more effective consumer relationships.
84
Table of Contents
The information from our Watch and Buy segments, when brought together, can deliver powerful insights into the effectiveness of advertising by linking media consumption trends with consumer purchasing data to better understand how media exposure drives purchase behavior. In 2009, we launched a new service entitled Advertiser Solutions. This offering will focus on our ability to link media consumption data across the three screens with consumer purchasing data to better understand how media exposure drives purchase behavior. We believe these integrated insights will better enable our clients to enhance the return on investment of their advertising and marketing spending.
Our third segment, Expositions, operates one of the largest portfolios of business-to-business trade shows in the United States. Each year, we produce approximately 40 trade shows, which in 2009 connected approximately 270,000 buyers and sellers across 20 industries. Expositions represented 4% of our 2009 revenues.
Our Company was founded in 1923 by Arthur C. Nielsen, Sr., who invented an approach to measuring competitive sales results that made the concept of “market share” a practical management tool. For nearly 90 years, we have advanced the practice of market research and media audience measurement to provide our clients a better understanding of their consumer. The Nielsen Company B.V. and its subsidiaries were purchased on May 24, 2006 through Nielsen Holdings by a consortium of private equity firms. Subsequently, David Calhoun was appointed Chief Executive Officer in August 2006. Mr. Calhoun and the management team have focused on building an open, simple and integrated operating model that drives innovation, delivers greater value to our clients and enhances the scalability of our global platform.
Services and Solutions
We align our business structure into three reporting segments: What Consumers Watch (media audience measurement and analytics), What Consumers Buy (consumer purchasing measurement and analytics) and Expositions. See Note 16 to our audited consolidated financial statements, “Segments,” for further information regarding our operating segments and our geographic areas.
What Consumers Watch
Our Watch segment provides viewership data and analytics primarily to the media and advertising industries across television, online and mobile devices. For the fiscal year ended December 31, 2009, revenues from our Watch segment represented approximately 34% of our consolidated revenue. This segment has historically generated stable revenue streams that are characterized by multi-year contracts and high contract renewal rates. At the beginning of each fiscal year, approximately 90% of the segment’s revenue base for the upcoming year is typically committed under existing agreements. As of 2009, our top five clients represented 26% of segment revenue and the average length of relationship with these same clients is more than 30 years. No customer accounted for 10% or more of our Watch segment revenue in 2009.
Television Audience Measurement Services
Nielsen is the global leader in television audience measurement. In the United States, which is by far the world’s largest market for television programming, broadcasters and cable networks use our television audience ratings as the primary currency to establish the value of their airtime and more effectively schedule and promote their programming. Advertisers use this information to plan television advertising campaigns, evaluate the effectiveness of their commercial messages and negotiate advertising rates.
Nielsen provides two principal television ratings services in the United States: measurement of national television audiences and measurement of local television audiences in all 210 designated local television markets. We use various methods to collect the data from households including electronic meters—which provide minute-by-minute viewing information for next day consumption by our clients—and written diaries. These methods enable us to collect not only television device viewing data but also the demographics of the
85
Table of Contents
audience (i.e., who in the household is watching), from which we calculate statistically reliable and accurate estimates of total television viewership. We have made significant investments over decades to build an infrastructure that can accurately and efficiently track television audience viewing, a process that has become increasingly complex as the industry has converted to digital transmission and integrated new technologies allowing for developments such as time-shifted viewing.
Our measurement techniques are constantly evolving to account for new television viewing behavior, increased fragmentation and new media technologies. For example, to help advertisers and programmers understand time-shifted viewing behavior, we created the “C3” ratings, which is a measure of how many people watch programming and commercials during live and time-shifted viewing up to three days after the program aired. The C3 rating has quickly become the primary metric for buying and selling advertising on national broadcast television.
We measure television viewing in 29 countries outside the United States, including Australia, Indonesia, Italy, Mexico and South Korea. The international television audience measurement industry operates on a different model than in the United States. In many international markets, a joint industry committee of broadcasters in each individual country selects a single official audience measurement provider, which provides the “currency” through an organized bidding process that is typically revisited every several years. We have strong relationships in these countries and see a significant opportunity to expand our presence into additional countries around the world.
Online Audience Measurement Services
Nielsen is a global provider of internet media and market research, audience analytics and social media measurement. We employ a variety of measurement offerings to provide online publishers, internet and media companies, marketers and retailers with metrics to better understand the behavior of online audiences. Our online measurement service has a presence in 46 countries including the United States, France, South Korea and Brazil—markets that account for approximately 80% of global internet users. Through a combination of patented panel and census data collection methods, we monitor and measure the internet surfing, online buying and video viewing (including television content) of online audiences. We provide critical advertising metrics such as audience demographics, page and ad views, and time spent—as well as quantify the effectiveness of advertising by reporting online behavioral observations, attitudinal changes and actual offline purchase activity. We track, measure and analyze consumer-generated media including opinions, advice, peer-to-peer discussions and shared personal experiences on over 100 million blogs, social networks, user groups and chat boards.
Mobile Measurement Services
We provide independent measurement and consumer research for telecom and media companies in the mobile telecommunications industry. Clients, principally mobile carriers and device manufacturers, rely upon our data to make consumer marketing, competitive strategy and resource allocation decisions. In the United States, our metrics are a leading indicator for market share, customer satisfaction, device share, service quality, revenue share, content audience and other key performance indicators. We also benchmark the end-to-end consumer experience to pinpoint problem areas in the service delivery chain, track key performance metrics for mobile devices and identify key market opportunities (e.g., demand tracking for device features and services). While mobile internet consumption is still nascent, we are expanding quickly in this area to capture internet, video and other media on mobile devices. As the mobile industry continues to grow, there is an opportunity for Nielsen to measure media and data content on mobile devices worldwide and to integrate mobile measurement with other media platforms. We offer mobile measurement services in 10 countries worldwide, including the United States, where we are the market leader, and are focused on expanding our presence in developing markets such as Brazil, China, India and Africa.
Three-Screen Media Measurement
We continue to develop advanced measurement techniques of the three principal screens—television, online and mobile devices. In the United States, we are already utilizing a single-source TV and PC panel to deliver
86
Table of Contents
cross-screen insights to clients. Our cross-screen measurement solution provides information about simultaneous usage of more than one screen (e.g. if a consumer uses Facebook while watching a TV program), unduplicated reach (i.e. total audience net of duplication across platforms), cause and effect analysis (e.g. if a TV advertisement spurs a consumer to view a specific website online) and program viewing behavior (e.g. what platforms consumers use to view certain programming). We also provide advertising effectiveness research across multiple platforms. We plan to continue evolving our cross media measurement capabilities, including mobile measurement, to provide more insights into cross-platform viewing behavior.
What Consumers Buy
Our Buy segment provides retail transactional measurement data, consumer behavior information and analytics primarily to businesses in the consumer packaged goods industry. This segment is organized into two areas: Information, which provides retail scanner and consumer panel-based measurement, and Insights, which provides a broad range of analytics. For the fiscal year ended December 31, 2009, revenues from our Buy segment represented approximately 62% of our consolidated revenue. This segment has historically generated stable revenue streams that are characterized by multi-year contracts and high contract renewal rates. At the beginning of each fiscal year, approximately 60% of the segment’s revenue base for the upcoming year is typically committed under existing agreements. As of 2009, our top five Buy segment clients represented 22% segment revenue and the average length of relationship with these same clients is over 30 years. No customer accounted for 10% or more of our Buy segment revenue in 2009.
Information: Retail Measurement Services
Nielsen is a global leader in retail measurement services. Our purchasing data provides market share, competitive sales volumes, and insights into such activities as distribution, pricing, merchandising and promotion. By combining this detailed information with our in-house expertise and professional consultative services, we produce valuable insights that help our clients improve their marketing and sales decisions and grow their market share.
Depending on the sophistication of each country’s retailer systems, we collect retail sales information from stores using electronic point-of-sale technology and/or teams of local field auditors. Stores within our worldwide retail network include grocery, drug, convenience and discount retailers, who, through various cooperation arrangements, share their sales data with us. The electronic retail sales information collected by stores through checkout scanners is transmitted directly to us. In certain developing markets where electronic retail sales information is unavailable, we collect information through in-store inventory and price checks conducted by over 15,000 field auditors. For all information we collect, our quality control systems validate and confirm the source data. The data is then processed into client-specific databases that clients access using our proprietary software that allows them to query the databases, conduct customized analysis and generate reports and alerts.
Information: Consumer Panel Measurement
We conduct consumer panels around the world that help our clients understand consumer purchasing dynamics at the household level. Among other things, this information offers insight into shopper behavior such as trial and repeat purchase for new products and likely substitutes, as well as customer segmentation. In addition, our panel data augments our retail measurement information in circumstances where we do not collect data from certain retailers.
Our consumer panels collect data from approximately 250,000 household panelists across 25 countries who use in-home scanners to record purchases from each shopping trip. In the United States, for example, approximately 100,000 selected households, constituting a demographically balanced sample, participate in the panels. Data received from household panels undergo a quality control process including UPC verification and validation, before being processed into databases and reports. Clients may access these databases to perform analyses.
87
Table of Contents
Insights: Analytical Services
Utilizing our foundation of consumer purchasing information, we provide a wide and growing selection of consumer intelligence and analytical services that help clients make smarter business decisions throughout their product development and marketing cycles. We draw actionable insights from our retail and consumer panel measurement data sets, our online behavioral information, as well as a variety of other proprietary data sets. For example, we maintain more than 2,500 demographic characteristics to describe households within each of the eight million U.S. census blocks to provide consumer segmentation and demographic insights. We continually expand an existing database by conducting approximately eight million surveys annually that capture consumer reaction to new product launches around the world to help our clients manage their product development cycles. We also collect and analyze more than 20 million surveys annually to measure consumer engagement and recall of advertisements across television and online to provide important insights on advertising and content effectiveness. We believe the analyses we derive from these comprehensive data sets help our clients answer some of their most challenging sales and marketing questions.
Our analytical services are organized into eight primary categories that follow our clients’ business development process:
| Growth and Demand Strategy: | We help clients identify unsatisfied customer demand and meet that demand by delivering the right products to the right place at the right price at the right time. | |
| Market Structure and Segmentation: | Using our demographic and retail databases, we provide clients with a precise understanding of market structures, and how to segment and reach their best customers. | |
| Brand and Portfolio Management: | We work with clients to maximize their product and brand portfolios including brand and category assessments, positioning and messaging evaluation and strategic portfolio alignment. | |
| Product Innovation Services: | We help clients forecast, evaluate and optimize the sales potential of new products, improve the positioning and performance of existing products, and refine go-to-market strategies. | |
| Pricing and Sales Modeling: | We use our extensive data to develop pricing simulations and modeling services that guide clients through pricing decisions. | |
| Retail Marketing Strategies: | We use our breadth of information to help retailers and manufacturers optimize use of in-store space, addressing factors such as channel selection, site and market selection, shelf space and assortment levels. | |
| Marketing ROI Strategies: | We integrate large-scale consumer purchasing and media consumption data to provide marketing return-on-investment analysis. | |
| Advertising Engagement: | We measure and provide insights into the effectiveness of advertising, product placement and programming across multiple platforms. | |
Insights: Advertiser Solutions
Our Advertiser Solutions offering will integrate data from our Watch and Buy segments and use the analytical services listed above to provide end-to-end solutions directly to advertisers. We believe this full suite of consumer behavior data and marketing insights will help our clients answer some of their most important marketing questions.
Expositions
In our Expositions segment, we operate one of the largest portfolios of business-to-business trade shows in the United States. Each year, we produce approximately 40 trade shows, which in 2009 connected approximately
88
Table of Contents
270,000 buyers and sellers across 20 industries. Our leading events include the Hospitality Design Conference and Expo, the Kitchen/Bath Industry Show, the ASD Merchandise Shows, the JA International Jewelry Summer and Winter Shows and the Interbike International Bike Show and Expo. This segment represented 4% of our 2009 revenues. In addition, we are developing digital platforms and solutions for buyers and sellers to connect and transact on a 365-day a year basis.
Competitive Advantages
We are faced with a number of competitors in the markets in which we operate. Some of our competitors in each market may have substantially greater financial marketing and other resources than we do and may benefit from other competitive advantages. See “—Competitive Landscape” and “Risk Factors—We face competition, which could adversely affect our business, financial condition, results of operations and cash flow.”
Notwithstanding the challenges presented by the competitive landscape, we believe that we have several competitive advantages including the following:
Global Scale and Brand. We provide a breadth of information and insights about the consumer in approximately 100 countries. In our Watch segment, our ratings are the primary metrics used to determine the value of programming and advertising in the U.S. total television advertising marketplace, which was approximately $77 billion in 2008 according to Veronis Suhler Stevenson. In our Buy segment, we track billions of sales transactions per month in retail outlets in approximately 100 countries around the world. We also have approximately 250,000 household panelists across 25 countries. We believe our footprint, neutrality, credibility and leading market positions will continue to contribute to our long-term growth and strong operating margins as the number and role of multinational companies expands. Our scale is supported by our global brand, which is defined by the original Nielsen code created by our founder, Arthur C. Nielsen, Sr.: impartiality, thoroughness, accuracy, integrity, economy, price, delivery and service.
Strong, Diversified Client Relationships. Many of the world’s largest brands rely on us as their information and analytics provider to create value for their business. We maintain long-standing relationships and multi-year contracts with high renewal rates due to the value of the services and solutions we provide. In our Watch segment, our client base includes leading broadcast, cable and internet companies such as CBS, Comcast, Disney/ABC, Google, Microsoft, NBC Universal, News Corp., Time Warner, Univision and Yahoo!; leading advertising agencies such as IPG, Omnicom and WPP; and leading telecom companies such as AT&T, Nokia and Verizon. In our Buy segment, our clients include the largest consumer packaged goods and merchandising companies in the world such as The Coca-Cola Company, Kraft Foods and The Procter & Gamble Company, as well as leading retail chains such as Carrefour, Kroger, Safeway, Tesco and Walgreens, and leading automotive companies such as Chrysler, Ford and Toyota. The average length of relationship with our top 10 clients across both our Watch and Buy segments is more than 30 years. In addition, due to our growing presence in developing markets, we have cultivated strong relationships with local market leaders that can benefit from our services as they expand globally. Our strong client relationships provide both a foundation for recurring revenues as well as a platform for growth.
Enhanced Data Assets and Measurement Science. Our extensive portfolio of transactional and consumer behavioral data across our Watch and Buy segments enables us to provide critical information to our clients. For decades, we have employed advanced measurement methodologies that yield statistically accurate information about consumer behavior while having due regard for their privacy. We have a particular expertise in panel measurement, which is a proven methodology to create statistically accurate research insights that are fully representative of designated audiences. This expertise is a distinct advantage as we extrapolate more precise insights from emerging large-scale census databases to provide greater granularity and segmentation for our clients. We continue to enhance our core competency in measurement science by improving research approaches and investing in new methodologies. We have also invested significantly in our data architecture to enable the integration of distinct data sets including those owned by third parties. We believe that our expertise, established standards and increasingly granular and comprehensive data assets provide us with a distinct advantage as we deliver more precise insights to our clients.
89
Table of Contents
Innovation. Nielsen has focused on innovation to deepen our capabilities, expand in new and emerging forms of measurement, enhance our analytical offerings and capitalize on industry trends. For example, we are continuously developing advanced delivery technologies that allow us to maximize the full suite of our data assets for our clients. The most significant example of this is our new delivery platform, Nielsen Answers, which brings our broad portfolio of our data and information to a single client desktop. As a second example, our Nielsen Catalina joint venture, announced in December 2009, will integrate consumer purchase and media consumption data sets to provide return-on-investment measurement for television and online advertising campaigns. In addition, our partnership with Facebook provides advertising effectiveness measurement of social networking activity on Facebook’s active user base of over 400 million.
Scalable Operating Model. Our global presence and operating model allow us to scale our services and solutions rapidly and efficiently. We have a long track record of establishing leading products that can be quickly expanded across clients, markets and geographies. Our global operations and technology organization enables us to achieve faster, higher quality outcomes for clients in a cost-efficient manner. Our flexible architecture allows us to incorporate leading third-party technologies as well as data from external sources, and enables our clients to use our technology and solutions on their own technology platforms. In addition, we work with leading technology partners such as Cognos, Netezza, Tata Consultancy Services and TIBCO, which allows for greater quality in client offerings and efficiency in our global operations.
The Nielsen Opportunity
We believe companies, including our clients, require an increasing amount of data and analytics to set strategy and direct operations. This has resulted in a large market for business information and insight which we believe will continue to grow. Our clients are media, advertising and consumer packaged goods companies in the large and growing markets. We believe that significant economic, technological, demographic and competitive trends facing consumers and our clients will provide a competitive advantage to our business and enable us to capture a greater share of our significant market opportunity. We may not be able to realize these opportunities if these trends do not continue or if we are otherwise unable to execute our strategies. See “Risk Factors—We may be unable to adapt to significant technological change which could adversely affect our business” and “Risk Factors—Our international operations are exposed to risks which could impede growth in the future.”
Developing markets present significant expansion opportunities. Brand marketers are focused on attracting new consumers in developing countries as a result of the fast-paced population growth of the middle class in these regions. In addition, the retail trade in these markets is quickly evolving from small, local formats toward larger, more modern formats with electronic points of sale, a similar evolution to what occurred in developed markets over the last several decades. We provide established measurement methodologies to help give consumer packaged goods companies, retailers and media companies an accurate understanding of local consumers to allow them to harness growing consumer buying power in fast growing markets like Brazil, Russia, India and China.
The media landscape is dynamic and changing. Consumers are rapidly changing their media consumption patterns. The growing availability of the Internet, and the proliferation of new formats and channels such as mobile devices, social networks and other forms of user-generated media have led to an increasingly fragmented consumer base that is more difficult to measure and analyze. In addition, simultaneous usage of more than one screen is becoming a regular aspect of daily consumer media consumption. We have effectively measured and tracked media consumption through numerous cycles in the industry’s evolution—from broadcast to cable, from analog to digital, from offline to online and from live to time-shifted. We believe our distinct ability to provide metrics across television, online and mobile platforms helps clients better understand, adapt to and profit from the continued transformation of the global media landscape.
Increasing amounts of consumer information are leading to new marketing approaches. The advent of the internet and other digital platforms has created rapid growth in consumer data that is expected to intensify as more entertainment and commerce are delivered across these platforms. As a result, companies are looking for real-time access to more granular levels of data to understand growth opportunities more quickly and more
90
Table of Contents
precisely. This presents a significant opportunity for us to work with companies to effectively manage, integrate and analyze large amounts of information and extract meaningful insights that allow marketers to generate profitable growth.
Consumers are more connected, informed and in control. Today, more than three-quarters of the world’s homes have access to television, there are more than 1.8 billion internet users around the globe, and there are two-thirds as many mobile phones in the world as people. Advances in technology have given consumers a greater level of control of when, where and how they consume information and interact with media and brands. They can compare products and prices instantaneously and have new avenues to learn about, engage with and purchase products and services. These shifts in behavior create significant complexities for our clients. Our broad portfolio of information and insights enables our clients to engage consumers with more impact and efficiency, influence consumer purchasing decisions and actively participate in and shape conversations about their brands.
Demographic shifts and changes in spending behavior are altering the consumer landscape. Consumer demographics and related trends are constantly evolving globally, leading to changes in consumer preferences and the relative size and buying power of major consumer groups. Shifts in population size, age, racial composition, family size and relative wealth are causing marketers continuously to re-evaluate and reprioritize their consumer marketing strategies. We track and interpret consumer demographics that help enable our clients to engage more effectively with their existing consumers as well as forge new relationships with emerging segments of the population.
Consumers are looking for greater value. Economic and social trends have spurred consumers to seek greater value in what they buy as exemplified by the rising demand for “private label” (store branded) products. For instance, in the United States, the absolute dollar share for private label consumer packaged goods increased more than $10 billion over the last two years. This increased focus on value is causing manufacturers, retailers and media companies to re-evaluate brand positioning, pricing and loyalty. We believe companies will increasingly look to our broad range of consumer purchasing insights and analytics to more precisely and effectively measure consumer behavior and target their products and marketing offers at the right place and at the right price.
Our Growth Strategy
We believe we are well-positioned for growth worldwide and have a multi-faceted strategy that builds upon our brand, strong client relationships and integral role in measuring and analyzing the global consumer. Our growth strategy is also subject to certain risks. For example, we may be unable to adapt to significant technological changes such as changes in the technology used to collect and process data or in methods of television viewing. In addition, consolidation in our customers’ industries may reduce the aggregate demand for our services. See “Risk Factors.”
Continue to grow in developing markets
Developing markets comprised approximately 17% of our 2009 revenues and represent a significant long-term opportunity for us given the growth of the middle class and the rapid evolution and modernization of the retail trade in these regions. Currently, the middle class is growing by 70 million people globally each year, with Brazil, Russia, India and China expected to contribute approximately half of all global consumption growth in 2010. Key elements of our strategy include:
| • | Continuing to grow our existing services in local markets while simultaneously introducing into developing markets new services drawn from our global portfolio; |
| • | Partnering with existing clients as they expand their businesses into developing and emerging markets and providing the high-quality measurement and insights to which they are accustomed; and |
| • | Building relationships with local companies that are expanding beyond their home markets by capitalizing on the global credibility and integrity of the Nielsen brand. |
91
Table of Contents
Continue to develop innovative products and services
We intend to continue developing our product and service portfolio to provide our clients with comprehensive and advanced solutions. Key elements of our strategy include:
| • | Further developing our analytics offerings across all facets of our client base to provide a more comprehensive offering and help our clients think through their most important challenges; |
| • | Continuing to grow our leadership in measurement and insight services related to each individual screen (TV, online and mobile) and expanding our three screen measurement services to help our media clients more effectively reach their target audiences and better understand the value of their content; and |
| • | Expanding our Advertiser Solutions offering, which integrates our proprietary data and analytics from both the Watch and Buy segments, by developing powerful tools to help clients better understand the effectiveness of advertising spending on consumer purchasing behavior. |
Continue to attract new clients and expand existing relationships
We believe that substantial opportunities exist to both attract new clients and to increase our revenue from existing clients. Building on our deep knowledge and the embedded position of our Watch and Buy segments, we expect to sell new and innovative solutions to our new and existing clients, increasing our importance to their decision making processes.
Continue to pursue strategic acquisitions to complement our leadership positions
We have increased our capabilities and expanded our geographic footprint through acquisitions in the areas of online and mobile measurement, social networking, advanced analytics and advertising effectiveness. Going forward, we will consider select acquisitions of complementary businesses that enhance our product and geographic portfolio and can benefit from our scale, scope and status as a global leader.
Technology Infrastructure
We operate with an extensive data and technology infrastructure utilizing 14 primary data centers in eight countries around the world. Our global database has the capacity to house approximately 21 petabytes of information, with our Watch segment processing approximately one billion tuning and viewing records each month and our Buy segment processing approximately nine trillion purchasing data points each month. Our technology infrastructure plays an instrumental role in meeting service commitments to global clients and allows us to quickly scale our products across practice areas and geographies. Our technology platform utilizes an open approach that facilitates integration of distinct data sets, interoperability with client data and technology, and partnerships with leading technology companies such as Cognos, Netezza, Tata Consulting and TIBCO.
Intellectual Property
Our patents, trademarks, trade secrets, copyrights and all of our other intellectual property are important assets that afford protection to our business. Our success depends to a degree upon our ability to protect and preserve certain proprietary aspects of our technology and our brand. To ensure that objective, we control access to our proprietary technology. Our employees and consultants enter into confidentiality, non-disclosure and invention assignment agreements with us. We protect our rights to proprietary technology and confidential information in our business arrangements with third parties through confidentiality and other intellectual property and business agreements.
We hold a number of third-party patent and intellectual property license agreements that afford us rights under third party patents, technology and other intellectual property. Such license agreements most often do not
92
Table of Contents
preclude either party from licensing its patents and technology to others. Such licenses may involve one-time payments or ongoing royalty obligations, and we cannot ensure that future license agreements can or will be obtained or renewed on acceptable terms, or at all.
Competitive Landscape
There is no single competitor that offers all of the services we offer in all of the markets in which we offer them. We have many competitors worldwide that offer some of the services we provide in selected markets. While we maintain leading positions in many markets in which we operate, our future success will depend on our ability to enhance and expand our suite of services, provide reliable and accurate measurement solutions and related information, drive innovation that anticipates and responds to emerging client needs, strengthen and expand our geographic footprint, and protect consumer privacy. See “Risk Factors—We face competition, which could adversely affect our business, financial condition, results of operations and cash flow.” We believe our global presence and integrated portfolio of services are key assets in our ability to effectively compete in the marketplace. A summary of the competitive landscape for each of our segments is included below:
What Consumers Watch
While we do not have one global competitor in our Watch segment, we face numerous competitors in various areas of our operations in different markets throughout the world. We are the clear market leader in U.S. television audience measurement; however, there are many emerging players and technologies that will increase competitive pressure. Numerous companies such as Canoe Ventures, Dish Networks, Kantar (a unit of WPP), Rentrak and TiVo are attempting to provide measurement solutions using set-top box data to provide an alternative form of television audience measurement. Our principal competitor in television audience measurement outside the United States is Kantar, with additional companies such as Ipsos, GfK and Médiamétrie representing competitors in individual countries. Our online service faces competition in the United States and globally from companies that provide panel-based internet measurement services such as comScore, providers of site-centric Web analytics solutions, including Coremetrics, Google, Omniture and WebTrends and companies that measure consumer generated media on the internet such as BuzzLogic, Cymfony, and Umbria. Although the mobile measurement service is still nascent, there are a variety of companies and technologies that could represent competitors to Nielsen in this area.
What Consumers Buy
While we do not have one global competitor in our Buy segment, we face numerous competitors in various areas of our service in different markets throughout the world. Competition includes companies specializing in marketing research, in-house research departments of manufacturers and advertising agencies, retailers that sell information directly or through brokers, information management and software companies, and consulting and accounting firms. In retail measurement, our principal competitor in the United States is Information Resources, Inc., which is also present in some European markets. Our retail measurement service also faces competition in individual markets from local companies. Our consumer panel services and analytics services have many direct and/or indirect competitors in all markets around the world including in selected cases GfK, Ipsos, Kantar and local companies in individual countries.
Expositions
The trade show industry is highly fragmented with numerous competitors serving individual business sectors or geographies. Our primary competitors in this segment are Reed Expositions, Advanstar and Hanley Wood.
Regulation
Our operations are subject to and affected by data protection laws in many countries. These laws constrain whether and how we collect personal data (i.e., information relating to an identifiable individual), how that data may be used and stored, and whether, to whom and where that data may be transferred. Data collection methods
93
Table of Contents
that may not always be obvious to the data subject, like the use of cookies online, or that present a higher risk of abuse, such as collecting data directly from children, tend to be more highly regulated; and data transfer constraints can impact multinational access to a central database and cross-border data transfers.
Some of the personal data we collect may be considered “sensitive” by the laws of many jurisdictions because they may include certain demographic information and consumption preferences. “Sensitive” personal data typically are more highly regulated than non-sensitive data. Generally, this means that for sensitive data the data subject’s consent should be more explicit and fully informed and security measures surrounding the storage of the data should be more rigorous. The greater constraints that apply to the collection and use of sensitive data increase the administrative and operational burdens and costs of panel recruitment and management.
The attention privacy and data protection issues attract can offer us a competitive advantage. Because we recognize the importance of privacy to our panelists, our customers, consumers in general, and regulators, we devote dedicated resources to enhancing our privacy and security practices in our product development plans and other areas of operation, and participate in privacy policy organizations and “think tanks.” We do this to improve both our practices and the perception of Nielsen as a leader in this area.
Professional Client Services
Our professional client services teams, which comprise approximately 9,500 employees, are responsible for leading our client relationships and coordinating our entire Nielsen experience with clients around the world. These teams are led by professional client business partners and analytics associates who understand our clients’ most important business issues and opportunities. Our professional and client services organization counsels a wide range of client executives who are charged with driving their own company’s growth agenda including, Presidents/CEOs, Chief Marketing Officers, and brand and sales executive teams.
Employees
As of June 30, 2010, we employed approximately 33,500 people worldwide. Approximately 20% of our employees are covered under collective bargaining or works council agreements. The Company may become subject to additional agreements or experience labor disruptions which may result in higher operating costs over time. We believe that our employee relations are good.
Properties
We lease property in more than 610 locations worldwide. We also own seven properties worldwide, including our offices in Oxford, United Kingdom, Mexico City, Mexico and Sao Paulo, Brazil. Our leased property includes offices in New York, New York, Oldsmar, Florida, and Markham, Canada. In addition, we are subject to certain covenants including the requirement that we meet certain conditions in the event we merge into or convey, lease, transfer or sell our properties or assets as an entirety or substantially as an entirety to, any person or persons, in one or a series of transactions.
Legal Proceedings
In addition to the legal proceedings described below, we are presently a party to certain lawsuits arising in the ordinary course of our business. We believe that none of our current legal proceedings will have a material adverse effect on our business, results of operations or financial condition.
Sunbeam Television Corp.
Sunbeam Television Corp. (“Sunbeam”) filed a lawsuit in Federal District Court in Miami, Florida on April 30, 2009. The lawsuit alleges that Nielsen Media Research, Inc. violated Federal and Florida state antitrust laws and Florida’s unfair trade practices laws by attempting to maintain a monopoly and abuse its position in the market, and breached its contract with Sunbeam by producing defective ratings data through its sampling methodology. The complaint did not specify the amount of damages sought and also sought declaratory and equitable relief. Nielsen believes this lawsuit is without merit and intends to defend it vigorously.
94
Table of Contents
Corporate Structure
The following chart reflects our corporate structure, assuming that the Conversion and this offering had been completed as of June 30, 2010.
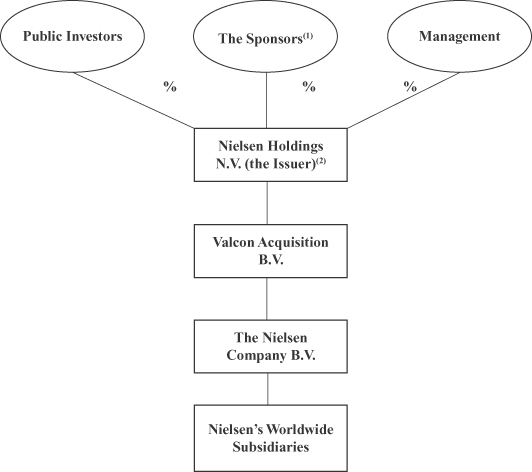
| (1) | The Sponsors hold their interest in Nielsen Holdings indirectly through their holdings in Valcon Acquisition Holding (Luxembourg) S.à r.l., a private limited company incorporated under the laws of Luxembourg. See “Principal Stockholders.” |
| (2) | As part of the Conversion, Nielsen Holdings B.V. will be converted into a Dutch public company with limited liability and renamed as Nielsen Holdings N.V. on or prior to the completion of this offering. See “Prospectus Summary—Company Information.” |
The data included in this prospectus regarding market share, market position and industry data pertaining to our business are based on reports of published industry sources and estimates based on our management’s knowledge and experience in the markets in which we operate. These estimates have been based on information obtained from our trade and business organizations and other contacts in the markets in which we operate. We believe these estimates to be accurate as of the date of this prospectus.
95
Table of Contents
The following description sets forth certain information about our management and management-related matters which we expect will be in place after the Conversion has taken place and this offering has been completed.
Directors and Executive Officers
Historically, the management of Nielsen’s business operations has been conducted through The Nielsen Company, B.V., an indirect subsidiary of Nielsen Holdings. Until the completion of the Conversion and the consummation of this offering, Nielsen Holdings will retain its current board structure with one executive director (Mr. Calhoun) and seven non-executive directors.
Upon the completion of the Conversion and the consummation of this offering, Nielsen Holdings will become a public company and will have a unitary board comprised of 15 members, one of whom will be an executive director and 14 of whom will be non-executive directors.
The executive director and executive officers set forth below will be responsible for achieving Nielsen’s goals, strategy, policies and results. The supervision of Nielsen’s management and the general course of its affairs and business operations will be entrusted to the non-executive directors.
The following table sets forth information concerning our officers and directors upon completion of the Conversion and the consummation of this offering, including their ages as of March 31, 2010:
| Name |
Age | Position(s) | ||
| Executive Director |
||||
| David L. Calhoun |
52 | Chief Executive Officer and Executive Director | ||
| Non-Executive Directors |
||||
| James A. Attwood, Jr. |
52 | Non-Executive Director | ||
| Richard J. Bressler |
52 | Non-Executive Director | ||
| Simon E. Brown |
39 | Non-Executive Director | ||
| Michael S. Chae |
41 | Non-Executive Director | ||
| Patrick Healy |
43 | Non-Executive Director | ||
| Gerald S. Hobbs |
68 | Non-Executive Director | ||
| James M. Kilts |
62 | Non-Executive Director and Chairman of the Board | ||
| Iain Leigh |
53 | Non-Executive Director | ||
| Eliot P.S. Merrill |
39 | Non-Executive Director | ||
| Alexander Navab |
44 | Non-Executive Director | ||
| Robert Pozen |
63 | Non-Executive Director | ||
| Robert Reid |
37 | Non-Executive Director | ||
| Scott A. Schoen |
51 | Non-Executive Director | ||
| Javier G. Teruel |
59 | Non-Executive Director | ||
| Other Executive Officers |
||||
| Susan Whiting |
53 | Vice Chairperson | ||
| Mitchell Habib |
49 | Executive Vice President, Global Business Services | ||
| Brian J. West |
40 | Chief Financial Officer | ||
| Itzhak Fisher |
54 | Executive Vice President, Global Product Leadership | ||
| Jeffrey R. Charlton |
48 | Senior Vice President and Corporate Controller | ||
| James W. Cuminale |
57 | Chief Legal Officer | ||
| Roberto Llamas |
62 | Chief Human Resources Officer | ||
David L. Calhoun. Mr. Calhoun has been the Chief Executive Officer of Nielsen Holdings since May 2010 and will be executive director of Nielsen Holdings upon the consummation of this offering. Mr. Calhoun also serves as Chairman of the Executive Board and Chief Executive Officer of TNC B.V., a position he has held since September 2006. Prior to joining Nielsen, Mr. Calhoun was a Vice Chairman of the General Electric Company and President and CEO of GE Infrastructure, the largest of GE’s six business segments and comprised
96
Table of Contents
of Aviation, Energy, Oil & Gas, Transportation, and Water & Process Technologies, as well as GE’s Commercial Aviation Services and Energy Financial Services businesses. From 2003 until becoming a Vice Chairman of GE and President and CEO of GE Infrastructure in 2005, Mr. Calhoun served as President and CEO of GE Transportation, which is made up of GE’s Aircraft Engines and Rail businesses. Prior to joining Aircraft Engines in July 2000, Mr. Calhoun served as President and CEO of Employers Reinsurance Corporation from 1999 to 2000; President and CEO of GE Lighting from 1997 to 1999; and President and CEO of GE Transportation Systems from 1995 to 1997. From 1994 to 1995, he served as President of GE Plastics for the Pacific region. Mr. Calhoun joined GE upon graduation from Virginia Polytechnic Institute in 1979. Mr. Calhoun serves on the boards of The Boeing Company and Medtronic, Inc.
Susan Whiting. Ms. Whiting will be the Vice Chairperson of Nielsen Holdings upon the consummation of this offering. Ms. Whiting also serves as Vice Chairperson of TNC B.V., a position she has held since November 2008. Ms. Whiting joined Nielsen Media Research in 1978 as part of its management training program. She served in numerous positions with Nielsen Media Research including President, Chief Operating Officer, CEO and Chairman. She was named Executive Vice President of The Nielsen Company in January 2007 with marketing and product leadership responsibilities for all Nielsen business units. Ms. Whiting serves on the Board of Directors of Wilmington Trust Corporation, MarkMonitor, Inc., the Ad Council, Denison University, the YMCA of Greater New York, the Center for Communications and the Notebaert Nature Museum. She graduated from Denison University with a Bachelor of Arts degree (cum laude) in Economics.
Mitchell Habib. Mr. Habib will be the Executive Vice President, Global Business Services of Nielsen Holdings upon the consummation of this offering. Mr. Habib also serves as Executive Vice President, Global Business Services of TNC B.V., a position he has held since March 2007. Prior to joining Nielsen, Mr. Habib was employed by Citigroup as the Chief Information Officer of its North America Consumer Business from September 2005 and prior to that its North America Credit Cards Division from June 2004. Before joining Citigroup, Mr. Habib served as Chief Information Officer for several major divisions of the General Electric Company over a period of seven years.
Brian J. West. Mr. West has been the Chief Financial Officer of Nielsen Holdings since May 2010. Mr. West also serves as the Chief Financial Officer of TNC B.V., a position he has held since February 2007. Prior to joining Nielsen, he was employed by the General Electric Company as the Chief Financial Officer of its GE Aviation division from June 2005. Prior to that, Mr. West held several senior financial management positions within the GE organization, including Chief Financial Officer of its GE Engine Services division, from March 2004, Chief Financial Officer of GE Plastics Lexan, from November 2002, and Chief Financial Officer of its NBC TV Stations division. Mr. West is a veteran of GE’s financial management program and spent more than 16 years with GE. Mr. West is a 1991 graduate from Siena College with a degree in Finance and holds a Masters of Business Administration from Columbia University.
Itzhak Fisher. Mr. Fisher will be the Executive Vice President, Global Product Leadership of Nielsen Holdings upon the consummation of this offering. Mr. Fisher also serves as Executive Vice President, Global Product Leadership of TNC B.V. and has overall responsibility for Nielsen’s Online, Telecom, IAG, Claritas and Entertainment businesses as well as Global Measurement Science, positions he has held since November 2008. Prior to this role, Mr. Fisher served as Executive Chairman of Nielsen Online. Prior to joining Nielsen in 2007, Mr. Fisher was an entrepreneur in high-technology businesses. He was co-founder and chairman of Trendum, a leader in internet search and linguistic analysis technologies and oversaw Trendum’s 2005 acquisition of BuzzMetrics, a market leader in online word-of-mouth research, and Trendum’s 2006 acquisition of Intelliseek. Mr. Fisher holds a Bachelor of Science degree in computer science from the New York Institute of Technology and pursued advanced studies in computer science at New York University.
Jeffrey R. Charlton. Mr. Charlton has been the Senior Vice President and Corporate Controller of Nielsen Holdings since May 2010. Mr. Charlton also serves as Senior Vice President and Corporate Controller of TNC B.V., a position he has held since June 2009. Previously, Mr. Charlton had served as Nielsen’s Senior Vice President of Corporate Audit since joining the Company in November 2007. Prior to joining Nielsen, he spent 11
97
Table of Contents
years with the General Electric Company in senior financial management positions, including Senior Vice President Corporate Finance and Controller of NBC Universal. Prior to joining GE, Mr. Charlton was employed by PepsiCo and began his career in 1983 with the public accounting firm of KPMG.
James W. Cuminale. Mr. Cuminale will be the Chief Legal Officer of Nielsen Holdings upon the consummation of this offering. Mr. Cuminale also serves as the Chief Legal Officer of TNC B.V., a position he has held since November 2006. Prior to joining Nielsen, Mr. Cuminale served for over ten years as the Executive Vice President—Corporate Development, General Counsel and Secretary of PanAmSat Corporation and PanAmSat Holding Corporation. In this role, Mr. Cuminale managed PanAmSat’s legal and regulatory affairs and its ongoing acquisitions and divestitures. Mr. Cuminale serves on the board of Universal Space Network, Inc.
Roberto Llamas. Mr. Llamas will be the Chief Human Resources Officer of Nielsen Holdings upon the consummation of this offering. Mr. Llamas also serves as Chief Human Resources Officer of TNC B.V., a position he has held since June 2007. In this role, he is responsible for all aspects of human resources worldwide. Prior to joining Nielsen, Mr. Llamas was the Chief Administrative Officer for The Cleveland Clinic beginning in 2004 and prior to that position he maintained a consulting business and was a Managing Partner and the Chief Human Resources Officer at Lehman Brothers. Mr. Llamas holds a Bachelor of Science degree in Marketing Management from California Polytechnic State University and a Masters of Science in Organizational Development from Pepperdine University.
James A. Attwood, Jr. Mr. Attwood has been a non-executive director of Nielsen Holdings since June 2006. Mr. Attwood has also served as a member of the Supervisory Board of TNC B.V. since July 28, 2006. Mr. Attwood is a Managing Director of The Carlyle Group and Head of the Global Telecommunications and Media Group. Prior to joining The Carlyle Group in 2000, Mr. Attwood was with Verizon Communications, Inc. and GTE Corporation. Prior to GTE, he was with Goldman, Sachs & Co. Mr. Attwood serves as a member of the Boards of Directors of Hawaiian Telcom and Insight Communications, Inc. Mr. Attwood graduated summa cum laude from Yale University with a B.A. in applied mathematics and an M.A. in statistics and received both J.D. and M.B.A. degrees from Harvard University.
Richard J. Bressler. Mr. Bressler will be a non-executive director of Nielsen Holdings upon the consummation of this offering. Mr. Bressler has also served as a member of the Supervisory Board of TNC B.V. since July 28, 2006. Mr. Bressler joined Thomas H. Lee Partners, L.P. as a Managing Director in 2006. From May 2001 through 2005, Mr. Bressler was Senior Executive Vice President and Chief Financial Officer of Viacom Inc. Before joining Viacom, Mr, Bressler was Executive Vice President of AOL Time Warner Inc. and Chief Executive Officer of AOL Time Warner Investments. Prior to that, Mr. Bressler served in various capacities with Time Warner Inc., including as Chairman and Chief Executive Officer of Time Warner Digital Media and Executive Vice President and Chief Financial Officer of Time Warner Inc. Before joining Time Warner Inc., Mr. Bressler was a partner with Ernst & Young. Mr. Bressler serves on the boards of Warner Music Group Corp., Gartner, Inc. and CC Media Holdings, Inc. and during the past five years has been a director of American Media Operations, Inc. He is also a Board Observer for Univision Communications, Inc. In addition, he serves as Chairman for the Center for Communication Board, the Duke University Fuqua School of Business Board of Visitors, New School University Board of Trustees, the J.P. Morgan Chase National Advisory Board and the Columbia University School of Arts Deans’ Council. Mr. Bressler holds a B.B.A. in Accounting from Adelphi University.
Simon E. Brown. Mr. Brown will be a non-executive director of Nielsen Holdings upon the consummation of this offering. Mr. Brown has also served as a member of the Supervisory Board of TNC B.V. since February 9, 2009. Mr. Brown is a member of KKR Management LLC, the general partner of KKR & Co. L.P. (prior to that, he was a member of KKR & Co. L.L.C., the general partner of Kohlberg Kravis Roberts & Co. L.P.), where he heads the Consumer Products & Services Team. Prior to joining KKR in 2003, Mr. Brown was with Madison Dearborn Partners, Thomas H. Lee Company and Morgan Stanley Capital Partners, where he was involved in a broad range of private equity transactions. He holds a B.Com, First Class Honours, from Queen’s University and an M.B.A. with High Distinction, Baker Scholar, John L. Loeb Fellow, from Harvard Business School.
98
Table of Contents
Michael S. Chae. Mr. Chae has been a non-executive director of Nielsen Holdings since June 2006. Mr. Chae has also served as a member of the Supervisory Board of TNC B.V. since June 13, 2006. Mr. Chae is a Senior Managing Director of the Private Equity Group of The Blackstone Group. Prior to joining The Blackstone Group in 1997, Mr. Chae was with The Carlyle Group and prior to that he was with Dillon, Read & Co. Mr. Chae is currently a director of Hilton Hotels, Michaels Stores, The Weather Channel Companies and Universal Orlando and a member of the Board of Trustees of the Lawrenceville School. Mr. Chae graduated magna cum laude from Harvard College, received an M.Phil from Cambridge University and received a J.D. from Yale Law School.
Patrick Healy. Mr. Healy has been a non-executive director of Nielsen Holdings since June 2006. Mr. Healy has also served as a member of the Supervisory Board of TNC B.V. since June 13, 2006. Mr. Healy is Deputy CEO of Hellman & Friedman LLC. He is a member of the firm’s Investment Committee and leads the firm’s London office and international activities. Prior to joining Hellman & Friedman in 1994, Mr. Healy was employed by James D. Wolfensohn Incorporated and Consolidated Press Holdings in Australia. Mr. Healy is currently a director of Mondrian Investment Partners Ltd., Gartmore Investment Management Limited and Gaztransport et Technigaz S.A.S. Mr. Healy graduated from Harvard College and earned an MBA from the Harvard Business School.
Gerald S. Hobbs. Mr. Hobbs will be a non-executive director of Nielsen Holdings upon the consummation of this offering. Mr. Hobbs has also served as a member of the Supervisory Board of TNC B.V. since January 1, 2004. Mr. Hobbs was formerly Vice Chairman of TNC B.V.’s Executive Board from 1999 until 2003. Mr. Hobbs is a Managing Director at Boston Ventures, Inc., which he joined in January 2005 as a partner. In addition, Mr. Hobbs is currently a director of The Bureau of National Affairs, Inc., Information Services Group, Inc., Medley Global Advisors, LLC, New Track Media and Western Institutional Review Board, Inc.
James M. Kilts. Mr. Kilts will be a non-executive director and Chairman of the Board of Nielsen Holdings upon the consummation of this offering. Mr. Kilts has also served as a member of the Supervisory Board of TNC B.V. since November 23, 2006 and has served as Chairman of the Supervisory Board of TNC B.V. from May 21, 2009. Mr. Kilts is a founding partner of Centerview Partners. Prior to joining Centerview Partners, Mr. Kilts was Vice Chairman of the Board, The Procter & Gamble Company. Mr. Kilts was formerly Chairman of the Board, Chief Executive Officer and President of The Gillette Company before the company’s merger with Procter & Gamble in October 2005. Prior to Gillette, Mr. Kilts had served at different times as President and Chief Executive Officer of Nabisco, Executive Vice President of the Worldwide Food Group of Philip Morris, President of Kraft USA and Oscar Mayer, President of Kraft Limited in Canada, and Senior Vice President of Kraft International. A graduate of Knox College, Galesburg, Illinois, Mr. Kilts earned a Masters of Business Administration degree from the University of Chicago. Mr. Kilts is currently a member of the Board of Directors of MetLife, MeadWestvaco and Pfizer. He is also a member of the Board of Overseers of Weill Cornell Medical College. Mr. Kilts serves on the Board of Trustees of Knox College and the University of Chicago and is a member of the Advisory Council of the University of Chicago Booth School of Business.
Iain Leigh. Mr. Leigh will be a non-executive director of Nielsen Holdings upon the consummation of this offering. Mr. Leigh has also served as a member of the Supervisory Board of TNC B.V. since June 13, 2006. Mr. Leigh is a Managing Partner and Head of the United States office of AlpInvest Partners. Prior to joining AlpInvest Partners in 2000, Mr. Leigh was Managing Investment Partner of Dresdner Kleinwort Benson Private Equity and a member of the Executive Committee of the firm’s global private equity business. Prior to that, he led the Restructuring Department within Kleinwort Benson’s Investment Banking division focusing on U.S. leveraged buy-outs and venture capital investments. Before moving to the United States, Mr. Leigh held a number of senior operating positions in Kleinwort Benson in Western Europe and Asia. Mr. Leigh is a Fellow of the Chartered Association of Certified Accountants, United Kingdom, and holds a Master’s degree in Business Administration from Brunel University, England.
Eliot P.S. Merrill. Mr. Merrill will be a non-executive director of Nielsen Holdings upon the consummation of this offering. Mr. Merrill has also served as a member of the Supervisory Board of TNC B.V. since February 4, 2008. Mr. Merrill is a Managing Director of The Carlyle Group, based in New York. Prior to joining The Carlyle
99
Table of Contents
Group in 2001, Mr. Merrill was a Principal at Freeman Spogli & Co., a buyout fund with offices in New York and Los Angeles. From 1995 to 1997, Mr. Merrill worked at Dillon Read & Co. Inc. and, before that, at Doyle Sailmakers, Inc. Mr. Merrill holds an A.B. Degree from Harvard College. Mr. Merrill is a member of the Board of Directors of AMC Entertainment Inc.
Alexander Navab. Mr. Navab has been a non-executive director of Nielsen Holdings since June 2006. Mr. Navab has also served as a member of the Supervisory Board of TNC B.V. since June 13, 2006. Since October 2009, Mr. Navab has been a member of KKR Management LLC, the general partner of KKR & Co. L.P. (prior to that, he was a member of KKR & Co. L.L.C., the general partner of Kohlberg Kravis Roberts & Co. L.P.), where he is co-head of North American Private Equity and heads the Media and Communications Industry Team. Prior to joining KKR in 1993, Mr. Navab was with James D. Wolfensohn Incorporated and prior to that he was with Goldman, Sachs & Co. Mr. Navab is currently a director of Visant. Mr. Navab received a B.A. with Honors, Phi Beta Kappa, from Columbia College and an M.B.A. with High Distinction from the Harvard Graduate School of Business Administration.
Robert Pozen. Mr. Pozen will be a non-executive director of Nielsen Holdings upon the consummation of this offering. Mr. Pozen has also served as a member of the Supervisory Board of TNC B.V. since May 1, 2010. Effective July 1, 2010, Mr. Pozen is Chairman Emeritus of MFS Investment Management. Prior to that, he was Chairman of MFS Investment Management since February 2004 and previously was Secretary of Economic Affairs for the Commonwealth of Massachusetts in 2003. Mr. Pozen was also the John Olin Visiting Professor, Harvard Law School; Vice Chairman of Fidelity Investments and President of Fidelity Management & Research and was the chairman of the SEC Advisory Committee on Improvements to Financial Reporting. He is currently a director of Medtronic, Inc. and was a director of BCE, Inc. until February 2009. He is a senior lecturer at Harvard Business School, an advisor to Grelesis, a private biotech company, a trustee of the MFS group of mutual funds and a director of the Commonwealth Fund and the Harvard Neuro-Discovery Center.
Robert Reid. Mr. Reid will be a non-executive director of Nielsen Holdings upon the consummation of this offering. Mr. Reid has also served as a member of Nielsen’s Supervisory Board since September 22, 2009. Mr. Reid is a Managing Director in the Corporate Private Equity group at The Blackstone Group. Prior to joining Blackstone in 1998, Mr. Reid worked at the Investment Banking Division at Morgan Stanley & Co. Mr. Reid received an AB in Economics from Princeton University where he graduated magna cum laude.
Scott A. Schoen. Mr. Schoen has been a non-executive director of Nielsen Holdings since June 2006. Mr. Schoen has also served as a member of the Supervisory Board of TNC B.V. since June 13, 2006. Mr. Schoen is Vice-Chairman of Thomas H. Lee Partners, L.P. From 2003 through 2009, Mr. Schoen was Co-President of Thomas H. Lee Partners, which he first joined in 1986. Prior to that, he began his career at Goldman, Sachs & Co. During the past five years, Mr. Schoen was a director of Simmons Company, Affordable Residential Communities, Transwestern Publishing, Refco Inc., Axis Specialty Ltd., Wyndham International Inc. and Spectrum Brands, Inc. He is a trustee of Spaulding Rehabilitation Hospital Network and Partners Continuing Care, Chairman of the Advisory Board of the Massachusetts General Hospital Center for Regenerative Medicine, and a director of Share Our Strength and United States 4 Kids. Mr. Schoen received a B.A. in History from Yale University, a J.D. from Harvard Law School and an M.B.A. from Harvard Graduate School of Business Administration. Mr. Schoen is a member of the New York Bar.
Javier G. Teruel. Mr. Teruel will be a non-executive director of Nielsen Holdings upon consummation of this offering. Mr. Teruel has also served as a member of the Supervisory Board of TNC B.V. since August 13, 2010. He is a Partner of Spectron Desarrollo, SC, an investment management and consulting firm; Retired Vice Chairman (2004 to 2007) of Colgate-Palmolive Company (consumer products), with which he served in positions of increasing importance since 1971, including as Executive Vice President responsible for Asia, Central Europe, Africa and Hill’s Pet Nutrition, as Vice President of Body Care in Global Business Development in New York, as President and General Manager of Colgate-Mexico, as President of Colgate-Europe, and as Chief Growth Officer responsible for the company’s growth functions; Director of The Pepsi Bottling Group, Inc. from 2007 to 2010; Director of Starbucks Corporation and a Director of JCPenney since 2008.
100
Table of Contents
Director Qualifications
The board of directors seeks to ensure that the board is composed of members whose particular experience, qualifications, attributes and skills, when taken together, will allow the board to satisfy its oversight responsibilities effectively. More specifically, in identifying candidates for membership on the board, the nominating and corporate governance committee takes into account (1) threshold individual qualifications, such as strength of character, mature judgment and industry knowledge or experience and (2) all other factors it considers appropriate, including alignment with our stockholders. In addition, subject to the contractual obligations of our Shareholders’ Agreement, the board will maintain a formal diversity policy governing the nomination of its members as described below.
When determining whether our current directors have the experience, qualifications, attributes and skills, taken as a whole, to enable our board to satisfy its oversight responsibilities effectively in light of our business and structure, our board focused primarily on our directors’ valuable contributions to our success in recent years and on the information discussed in the biographies set forth under “Management—Directors and Executive Officers.” In particular, Mr. Calhoun was selected to serve as the Executive Director because of his role as our Chief Executive Officer, the management perspective he brings to board deliberations and his extensive management expertise at public companies. Mr. Attwood was selected to serve as a director in light of his affiliation with The Carlyle Group, his financial expertise, his background in the telecommunications and media industries as well as his significant experience in working with companies controlled by private equity sponsors. Mr. Bressler was selected to serve as a director in light of his affiliation with Thomas H. Lee Partners, his financial and accounting expertise, his extensive experience in the media industry as well as his significant experience in working with companies controlled by private equity sponsors. Mr. Brown was selected to serve as a director in light of his affiliation with Kohlberg Kravis Roberts & Co., his financial expertise as well as his significant experience in working with companies controlled by private equity sponsors. Mr. Chae was selected to serve as a director in light of his affiliation with The Blackstone Group, his financial expertise and his significant experience in working with companies controlled by private equity sponsors. Mr. Healy was selected to serve as a director in light of his affiliation with Hellman & Friedman, his financial expertise as well as his significant experience in working with companies controlled by private equity sponsors. Mr. Hobbs was selected to serve as a director in light of his valuable experience with the Company both as a member of management and a director and his contributions to its ongoing success during his many years of service, as well as his experience as a director of other companies and financial and commercial acumen and insight. Mr. Kilts was selected to serve as a director in light of his experience as a public company CEO, his significant experience in the consumer packaged goods industry and financial expertise. Mr. Leigh was selected to serve as a director in light of his affiliation with AlpInvest Partners, his financial expertise and his significant experience in working with companies controlled by private equity sponsors. Mr. Merrill was selected to serve as a director in light of his affiliation with The Carlyle Group, his financial expertise and his significant experience in working with companies controlled by private equity sponsors. Mr. Navab was selected to serve as a director in light of his affiliation with Kohlberg Kravis Roberts & Co., his financial expertise, his background in the media and communications industries as well as his significant experience in working with companies controlled by private equity sponsors. Mr. Pozen was selected to serve as a director in light of his familiarity with financial reporting, his experience as a director of other companies, his work in the investment management industry and his financial and commercial acumen and insight. Mr. Reid was selected to serve as a director in light of his affiliation with The Blackstone Group and his financial expertise as well as his significant experience in working with companies controlled by private equity sponsors. Mr. Schoen was selected to serve as a director in light of his affiliation with Thomas H. Lee Partners, his financial expertise and his significant experience in working with companies controlled by private equity sponsors.
Diversity Policy
In accordance with the Dutch Corporate Governance Code, the board of directors will adopt a set of board regulations effective upon the initial public offering. Among other things, the board regulations will include a policy that the board shall aim for a diverse composition of directors, to the extent practicable and appropriate
101
Table of Contents
under the circumstances, in line with the global nature and identity of the Company and its business, in terms of such factors as nationality, background, gender and age.
We also expect to include a diversity policy in the charter for our nomination and corporate governance committee requiring the committee to consider age, gender, nationality, ethnic and racial background in nominating directors and to review and make recommendations, as the nomination and corporate governance committee deems appropriate, regarding the composition and size of the board of directors in order to ensure the board has the requisite expertise and its membership consists of persons with sufficiently diverse and independent backgrounds.
The implementation of these diversity policies will rest primarily with the nomination and corporate governance committee as the body responsible for identifying individuals believed to be qualified as candidates to serve on the board of directors and recommending that the board nominate the candidates for all directorships to be filled by the stockholders at their annual meetings.
As board seats become available, the nomination and corporate governance committee, and the board of directors as a whole, will have the opportunity to assess the effectiveness of the diversity policy and how, if at all, our implementation of the policy, or the policy itself, should be changed.
Board Structure
Upon the completion of this offering, we will have a unitary board, consisting of one executive director and 14 non-executive directors.
After this offering, the Sponsors through Valcon Acquisition Holding (Luxumberg) S.à r.l., will continue to own a majority of our outstanding common stock and we will be a “controlled company” under the corporate governance rules of the NYSE. As a controlled company, we are eligible for exemptions from some of the requirements of these rules, including the requirements (i) that a majority of our board of directors consist of independent directors, (ii) that we have a nomination and governance committee and a compensation committee, which are each composed entirely of independent directors and governed by a written charter addressing the committee’s purpose and responsibilities and (iii) for annual performance evaluations of the nomination and governance committee and the compensation committee. We intend to utilize some or all of these exemptions for so long as the Sponsors or any other person or entity continues to own a majority of our outstanding voting stock. In the event that we cease to be a controlled company within the meaning of these rules, we will be required to comply with these provisions after the specified transition periods.
The number of executive and non-executive directors will be determined by the board of directors. We will remain controlled by the Sponsors and they will continue to control the election of members of the board of directors subject to binding nominations made by the board of directors, which in turn will be made based on recommendations by the nomination and corporate governance committee. Pursuant to an amended and restated shareholders’ agreement to be entered into in connection with this offering, each of the Sponsors will have a contractual right to have one or more designees serving on our board of directors based on their percentage of share ownership, which initially shall be one member from AlpInvest Partners, two from The Blackstone Group, two from The Carlyle Group, one from Hellman & Friedman, two from Kohlberg Kravis Roberts & Co., two from Thomas H. Lee Partners and one from Centerview Partners. As our Sponsors’ ownership in our Company decreases, the number of directors whom they may designate will also decrease. See “Certain Relationships and Related Party Transactions—Shareholders’ Agreement.”
The members of our board of directors may be suspended or dismissed at any time at the general meeting of stockholders. If a resolution to suspend or dismiss a director is proposed by the board, such resolution may be adopted by an absolute majority of the votes validly cast. If no such proposal is passed by the board, then a director may be suspended or dismissed by the general meeting by at least a two-thirds majority of the votes cast, provided such majority represents more than half of our issued share capital.
102
Table of Contents
The general meeting of stockholders may, at all times resolve to break the binding nomination of the board of directors by a resolution passed with a two-thirds majority of the votes cast representing more than one-half of the issued capital.
Our chief executive officer and executive director is expected to be responsible for the day-to-day management of the Company.
Our non-executive directors are expected to supervise our chief executive officer and executive director and our general affairs and to provide general advice to the chief executive officer and executive director. The non-executive directors will perform those acts that are delegated to them pursuant to our articles of association or by our board regulations. One of the non-executive directors, Mr. Kilts, will be appointed as chairman of the board.
Each director will owe a duty to us to properly perform the duties assigned to him and to act in the corporate interest of our Company. Under Dutch law, the corporate interest extends to the interests of all corporate stakeholders, such as stockholders, creditors, employees, customers and suppliers. Our directors are expected to be appointed for one year and will be re-electable each year at the annual general meeting of stockholders.
The board of directors will be required to adopt board regulations upon Conversion governing its performance, its decision making, its composition, the tasks and working procedure of the committees and other matters relating to the board of directors, the chief executive officer, the non-executive directors and the committees established by the board of directors. Board regulations are expected to be adopted by our board of directors on or before the date of our Conversion. We expect that, in accordance with our board regulations, resolutions of our board of directors will be adopted by a simple majority of votes cast in a meeting at which at least the majority of its members is present or represented.
Board Committees
While retaining overall responsibilities, our board of directors will assign certain of its responsibilities to permanent committees consisting of board members appointed by it. Following this offering, our board of directors will have established an audit committee, a compensation committee and a nomination and corporate governance committee, each of which will have the responsibilities and composition described below:
Audit Committee. On and after the completion of this offering, our audit committee will consist of three non-executive directors being Messrs. , and . The chairman of our audit committee will be Mr. .
Our audit committee will supervise and monitor our financial reporting, risk management program and compliance with relevant legislation and regulations. It will oversee the preparation of our financial statements, our financial reporting process, our system of internal business controls and risk management, our internal and external audit process and our internal and external auditor’s qualifications, independence and performance. Our audit committee will also review our annual and interim financial statements and other public disclosures, prior to publication. Our audit committee will appoint our external auditors, subject to stockholder vote, and oversee the work of the external and internal audit functions, providing compliance oversight, preapproval of all audit engagement fees and terms, preapproval of audit and permitted non-audit services to be provided by the external auditor, establishing auditing policies, discussing the results of the annual audit, critical accounting policies, significant financial reporting issues and judgments made in connection with the preparation of the financial statements and related matters with the external auditor and reviewing earnings press releases and financial information provided to analysts and ratings agencies.
Our board of directors has determined that Mr. is qualified as an audit committee financial expert within the meaning of the SEC regulations. The board of directors has determined that each of Messrs. and meets the definition of “independent director” under the NYSE listing rules and Rule 10A-3 of the Exchange Act. We expect to appoint a third independent member within one year of the completion of the offering.
103
Table of Contents
The written charter for our audit committee will be available on our website.
Compensation Committee. Following this offering, our compensation committee will consist of non-executive directors being Messrs. , and . Mr. will be the chairman of our compensation committee.
Our compensation committee will be responsible for setting, reviewing and evaluating compensation, and related performance and objectives, of our senior management team. It will also be responsible for recommending to the board of directors the compensation package for our chief executive officer, with due observance of the compensation policy adopted by the general meeting of stockholders. It will review employment contracts entered into with our chief executive officer, make recommendations to our board of directors with respect to major employment-related policies and oversee compliance with our employment and compensation-related disclosure obligations under applicable laws.
As a “controlled company”, we are not required to have a compensation committee comprised entirely of independent directors. Our board of directors has affirmatively determined that each of Messrs. and meets the definition of “independent director” for purposes of the NYSE listing rules, the definition of “outside director” for purposes of Section 162(m) of the Internal Revenue Code of 1986, as amended (the “Code”), and the definition of “non-employee director” for purposes of Section 16 of the Exchange Act. In addition, we intend to establish a sub-committee of our compensation committee consisting of Messrs. and for purposes of approving any compensation that may otherwise be subject to Section 162(m) of the Code or Section 16 of the Exchange Act.
The written charter for our compensation committee will be available on our website.
Nomination and Corporate Governance Committee. Following this offering, our nomination and corporate governance committee will consist of non-executive directors being Messrs. , and . Mr. will be the chairman of our nomination and corporate governance committee.
Our nomination and corporate governance committee will determine selection criteria and appointment procedures for members of our board of directors, periodically assess the scope and composition of our board of directors and evaluate the performance of its individual members.
As a “controlled company”, we are not required to have a nomination and corporate governance committee comprised entirely of independent directors.
The written charter for our nomination and corporate governance committee will be available on our website.
Our chief executive officer and other executive officers will regularly report to the non-executive directors and the audit, compensation and nomination and corporate governance committees to ensure effective and efficient oversight of the Company’s activities and to assist in proper risk management and the ongoing evaluation of management controls. The senior vice president of corporate audit will report functionally and administratively to the Company’s chief financial officer and directly to the audit committee. The Company believes that the board’s leadership structure provides appropriate risk oversight of the Company’s activities given the controlling interests held by its stockholders.
Code of Ethics
Following this offering, we will have a code of ethics that applies to our employees, including our principal executive officer, our principal financial officer, principal accounting officer and persons performing similar functions. The Company’s code of ethics will be available on our website at www.nielsen.com.
104
Table of Contents
The following discusses the compensation for the Chief Executive Officer, the Chief Financial Officer, and the three other most highly compensated executive officers of The Nielsen Company B.V. for 2009. Upon the completion of this offering, these individuals are expected to be the Chief Executive Officer, the Chief Financial Officer and the three other most highly compensated executive officers of Nielsen Holdings. We refer to these individuals as our “Named Officers.”
Prior to the completion of this offering, The Nielsen Company B.V. had a compensation committee consisting of Messrs. Chae (as Chairman), Schoen, Navab, Attwood and Healy (the “Existing Compensation Committee”). The Existing Compensation Committee was responsible for setting, reviewing and evaluating compensation, and related performance and objectives, of our senior management team prior to the completion of this offering. Mr. Chae became Chairman of the Existing Compensation Committee in 2010. References in this section to the “Compensation Committee” are to the Existing Compensation Committee prior to the completion of this offering and to the Compensation Committee of Nielsen Holdings on and after the completion of this offering.
Compensation Committee Interlocks and Insider Participation
No member of the Existing Compensation Committee has served as one of our officers or employees at any time. Except as otherwise disclosed in this prospectus, no member of the Existing Compensation Committee has had any relationship with us requiring disclosure under Item 404 of Regulation S-K under the Exchange Act. None of our executive officers has served as a director or member of the compensation committee (or other committee serving an equivalent function) of any other organization, one of whose executive officers served as a member of our Board or Existing Compensation Committee.
Compensation Discussion and Analysis
Our executive compensation program was approved by the Existing Compensation Committee. None of the Named Officers are members of the Existing Compensation Committee or otherwise have any role in determining the compensation of other Named Officers, with the exception of our Chief Executive Officer, David Calhoun, who has a role in determining the compensation of the other Named Officers.
When the Company hires an executive officer, Mr. Calhoun reviews the compensation of the executive at his or her prior company, the expected impact of the executive on the Company and the compensation of similarly-situated executives at the Company to develop an appropriate compensation package to recommend to the Existing Compensation Committee. For executives already employed by the Company, Mr. Calhoun makes annual incentive recommendations considering the extent to which the Company met its financial objectives as well as each executive’s qualitative job performance for the year. From time-to-time, Mr. Calhoun also reviews the base salaries of executives considering each executive’s job performance, whether the executive’s position or the scope or complexity of his or her responsibilities have changed and how his or her position relates to other executives of the Company and their rate of base pay. In all cases, Mr. Calhoun reviews his recommendations with the Chairman of the Existing Compensation Committee before submitting the recommendations to the Existing Compensation Committee for approval.
Executive Compensation Program Objectives and Overview
The Compensation Committee annually reviews Nielsen’s executive compensation program to ensure that:
| • | The program appropriately rewards performance that is tied to creating stockholder value; and |
| • | The program is designed to achieve Nielsen’s goals of promoting financial and operational success by attracting, motivating and facilitating the retention of key employees with outstanding talent and ability. |
105
Table of Contents
Nielsen’s executive compensation is based on three components, which are designed to be consistent with the Company’s compensation philosophy: (1) base salary; (2) annual cash incentives; and (3) long-term stock awards, including stock options and occasional awards of restricted stock units (“RSUs”) that are subject to performance-based and time-based vesting conditions. Senior management is asked to invest in the Company to ensure alignment of interests with other owners and stock options are granted when an investment is made. Nielsen also provides certain perquisites to Named Officers. Severance benefits are provided to Named Officers whose employment terminates under certain circumstances. In the event of a change in control, time-vested stock option awards will vest in full and performance-vested stock options may vest depending upon the return to the Sponsors. These benefits are described in further detail below in the section entitled “—Potential Payments Upon Termination or Change in Control”.
In structuring executive compensation packages, the Compensation Committee considers how each element of compensation promotes retention and/or motivates performance by the executive. Base salaries, perquisites, severance and other termination benefits are all primarily intended to attract and retain qualified executives. These are the elements of our executive compensation program for which the value of the benefit in any given year is not dependent on performance (although base salary amounts and benefits determined with reference to base salary may increase from year to year depending on performance, among other things). Some of the elements, such as base salaries and perquisites, are generally paid out on a short-term or current basis. Other elements, such as benefits provided upon retirement or other terminations of employment, are generally paid out on a longer-term basis. We believe that this mix of short-term and long-term elements allows us to achieve our goals of attracting and retaining senior executives.
Our annual incentive opportunity is primarily intended to motivate Named Officers’ performance to achieve specific strategies and operating objectives, although we also believe it helps us attract and retain senior executives. Our long-term equity incentives are primarily intended to align Named Officers’ long-term interests with stockholders’ long-term interests, and we believe they help motivate performance and help us attract and retain senior executives. These are the elements of our executive compensation program that are designed to reward performance and the creation of stockholder value.
Although we believe that to attract and retain senior executives we must provide them with predictable benefit amounts that reward their continued service, we also believe that performance-based compensation such as annual incentives and long-term equity incentives play a significant role in aligning management’s interests with those of our stockholders. For this reason, these components of compensation constitute a substantial portion of compensation for our senior executives. Our compensation packages are designed to promote teamwork, initiative and resourcefulness by key employees whose performance and responsibilities directly affect the Company’s results of operations.
We generally do not adhere to rigid formulas or necessarily react to short-term changes in business performance in determining the amount and mix of compensation elements. We consider competitive market compensation but we do not look at specific companies nor attempt to maintain a certain target percentile. We incorporate flexibility into our compensation programs to respond to and adjust for changing business conditions. We believe that our short-term and long-term incentives provide the appropriate alignment between the interests of our owners and management. We did not use a compensation consultant in determining or recommending the amount or form of executive or director compensation.
Current Executive Compensation Program Elements
Base Salaries
We view base salary as a factor in our compensation package specifically related to retaining and attracting talented employees. In determining the amount of base salary that each Named Officer receives, we look to the rate of pay that the executive has received in the past, whether the executive’s position or responsibilities associated with his or her position have changed, if the complexity or scope of his or her responsibilities has
106
Table of Contents
increased, and how his or her position relates to other executives and their rate of base salary. Base salaries are reviewed annually or at some other appropriate time by the Compensation Committee and may be increased from time to time pursuant to such review. In determining base salary levels, the Compensation Committee considers Mr. Calhoun’s recommendations with respect to salary levels for Named Officers other than himself. In 2009, we did not provide salary increases to any Named Officers.
The Compensation Committee believes that the base salary levels of the Company’s senior executives are reasonable in view of competitive practices, the Company’s performance and the contribution and expected contribution of those executives to that performance. As described below under “—Narrative Disclosure to Summary Compensation Table and Grants of Plan-Based Awards in 2009 Table—Employment Agreement with Mr. David L. Calhoun,” the Company has entered into an employment agreement with Mr. Calhoun that sets the level of his base salary.
Signing Bonuses
In certain circumstances, the Compensation Committee may grant signing bonuses to new executives in order to attract talented employees for key positions. The amounts of the signing bonuses are determined based upon the facts and circumstances applicable to the new hire. There were no signing bonuses granted to Named Officers in 2009.
Annual Incentives
The Existing Compensation Committee granted annual cash incentives for 2009 under the Executive Incentive Plan (the “EIP”) on the basis of factors intended to create long-term value and to recognize the strong performance of the Company and its management team in a difficult business environment. The Existing Compensation Committee established an initial overall Company bonus pool for 2009 based upon the Operating Plan EBITDA performance indicated in the table below:
| Target Amount ($ millions) |
Actual Amount Achieved ($ millions) |
Percent of Target Realized |
Weight (as a % of the Named Officer’s target payout) |
Payout based on achievement of financial objectives (as a % of the Named Officer’s target payout) |
|||||||||||
| Operating Plan EBITDA(1) |
$ | 1,270 | $ | 1,270 | 100 | % | 100 | % | 108 | % | |||||
| (1) | Operating Plan EBITDA reflects earnings before interest, taxes, depreciation and amortization adjusted for unusual and non-recurring items, restructuring, goodwill impairment and stock-based compensation. Operating Plan EBITDA is also adjusted to exclude the impact of foreign exchange and, as a result, differs from the calculation of Adjusted EBITDA presented elsewhere in this prospectus. According to the EIP provisions, at 100% performance, the performance pool is increased by a percentage equal to the percent growth in EBITDA from 2008 to 2009. Since the year-to-year EBITDA growth was 8%, the performance pool was increased by 8%. |
The EIP contemplates that Mr. Calhoun will consult with the Existing Compensation Committee and take into account actual cash flow performance in relation to the annual cash flow budget and will consider reducing the overall bonus pool by an amount of up to 30% if warranted based upon this performance. The EIP does not contemplate increasing the overall bonus pool based upon cash flow performance. In 2009, Mr. Calhoun made no reduction to the overall bonus pool given positive cash flow performance for the year.
The target bonus amounts for the Named Officers (as reflected below in the Grants of Plan-Based Awards in 2009 Table) were based on 2007 payouts under the EIP. Although the Company’s Operating Plan EBITDA and cash flow performance would have indicated 2009 payouts under the EIP equal to 108% of the 2007 payouts, when determining the actual annual incentives to be paid to the Named Officers (as reflected below in the Non-Equity Incentive Plan Compensation column in the Summary Compensation Table), the Existing
107
Table of Contents
Compensation Committee determined that higher amounts should be awarded in light of the Company’s strong overall performance and on the basis of qualitative individual performance factors that reflect contributions by Named Officers that were not captured by overall financial measures. These individual performance factors included the Named Officer’s success in implementing the Company’s plans to integrate and streamline its operations and his or her judgment, vision and continued ability to lead the Company during a time of significant change.
The Existing Compensation Committee particularly considered certain elements of individual performance for each Named Officer. The Existing Compensation Committee considered Mr. Calhoun’s leadership of the Company through a difficult recessionary environment. Mr. Calhoun identified the recession early and focused the Company on cost management as well as continuing to provide clients insights to help them manage through the recession and beyond. The Company’s overall financial performance held steady during a recessionary year while the Company positioned itself for future growth. Mr. Calhoun also guided upgrades in leadership and talent throughout the organization as well as achieved significant productivity increases. For Mr. West, the Existing Compensation Committee considered his substantial results in several areas including cost management, his
leadership in accelerating receipt of cash receivables, strengthening the balance sheet by eliminating near-term debt maturities and extending long-term maturities as well as initiating the process for the Company’s public offering. For Mr. Habib, the Existing Compensation Committee considered his continued leadership of the GBS organization in providing strong productivity increases while increasing the quality of data. Additionally, under his leadership and personal involvement, GBS made significant progress with our key clients who increasingly view GBS as a real asset for them. For Ms. Whiting, the Existing Compensation Committee considered several things including her presence as the Company’s voice in vital areas such as media, public affairs and privacy. She also played a critical role in managing the implementation of our A2M2 and radio service product launches as well as responding to competitive threats. For Mr. Llamas, the Existing Compensation Committee considered his leadership of the Company’s human resources allocation during a recessionary environment, including hiring and wage management. Under his leadership, the Company also made significant progress on talent management and strengthening its leadership in a tough environment through programs such as university recruiting, diversity and leadership development.
Upon completion of this offering, we will implement a new annual incentive plan intended to comply with Section 162(m) of the Code. Under this new plan, we will be able to provide certain of our employees with cash incentive compensation based upon the achievement of pre-established performance goals. Annual incentives for 2010 were determined by the Existing Compensation Committee in its discretion similar to the determinations for 2009. The factors to be considered, in general, will include the achievement of the Company’s financial objectives, the Named Officer’s attainment of his or her individual goals and qualitative factors similar to those taken into account for the 2009 incentives. The Compensation Committee will also review the extent to which the Company has accomplished its planned integration and restructuring and the Named Officer’s contributions and expected future contributions to the Company’s operating and strategic plans.
Long-Term Equity Incentive Awards
Our policy is that the long-term equity compensation of our senior executives should be directly linked to the value provided to stockholders.
As described more fully below under “—2006 Stock Acquisition and Option Plan”, prior to the completion of this offering, we provided equity awards through common stock, stock options and, in limited circumstances, restricted stock units (RSUs). Prior to the completion of this offering, our board of directors intends to adopt a new equity incentive plan, which would provide the terms for grants of equity to the Company’s employees, directors and other service providers, and receive approval of such plan by the current stockholders. The new equity incentive plan is expected to be the source of new equity-based awards and is expected to permit us to grant to our key employees, including our named executive officers, incentive stock options, non-qualified stock options, stock appreciation rights, restricted stock and other awards based on shares of our common stock. In the
108
Table of Contents
future, the Compensation Committee may consider awarding such additional or alternative forms of equity awards to our named executive officers, although no decisions regarding the composition of future equity awards have been made at this time.
Executives selected to participate in the 2006 Stock Acquisition and Option Plan (as defined below) were asked to invest in the Company by purchasing common stock. The amount of common stock initially offered for purchase was based upon the executive’s position in the Company, his or her current impact and projected future impact on the Company. Once the executive purchased common stock at the fair market value as determined by the Executive Committee of The Nielsen Company B.V., a designated number of stock options was granted to the executive. The large majority of these options were granted at an exercise price equal to the “fair market value” as determined by the Executive Committee of The Nielsen Company B.V., while a smaller amount were granted at an exercise price equal to two times the “fair market value.” These stock options are 50% time-vested and 50% performance-vested. For the time-vested options, 5% are vested on the grant date and 19% are vested on December 31 of each of the first five anniversaries of December 31, 2006. For the performance-vested options, 5% are vested on the grant date, and 19% are vested on December 31 of each of the first five anniversaries of December 31, 2006 should the Company meet or exceed its targeted Management EBITDA performance in that year (as described above). If the Management EBITDA target is not met, that portion of the performance-vested options can vest in a future year if the multi-year cumulative Management EBITDA targets are met in the future year.
In light of the challenging business environment prevailing in 2009, the Existing Compensation Committee adjusted the level of annual performance target that would trigger vesting of the 2009 performance-based stock options from the 2009 Management EBITDA target of $1,542 million, which was set in 2007, to the 2009 Operating Plan EBITDA target of $1,270 million. Because actual EBITDA performance for 2009 was $1,270 million, the 2009 portion of the performance-based stock options vested. The 2009 multi-year cumulative EBITDA target was not met but did not impact the vesting of the 2009 portion of the performance–based stock options given the achievement of the 2009 annual target. The remainder of the EBITDA targets for performance-based stock options were not adjusted. However, if the 2010 and 2011 annual performance targets are not met, the performance-based stock options for those years will vest as time-based stock options as follows:
| • | the 2010 performance-based options will vest on December 31, 2012; and |
| • | the 2011 performance-based options will vest on December 31, 2013. |
Perquisites
We provide our Named Officers with perquisites, reflected in the “All Other Compensation” column of the Summary Compensation Table and described in the footnotes thereto. We believe that these are reasonable, competitive and consistent with our overall compensation program. The cost of these benefits is a small percentage of the overall compensation package, but the Compensation Committee believes that they allow the executives to work more efficiently. We provide financial and tax preparation services, executive physicals and car allowances. Where necessary for business purposes, we also provide reimbursement for private club membership.
Severance and Other Benefits Upon Termination of Employment or Change in Control
We believe that severance protections play a valuable role in attracting and retaining key executive officers. Accordingly, we provide these protections to our senior executives. Since 2007, we have offered these protections in conjunction with participation in the Company’s 2006 Stock Acquisition and Option Plan. In the case of Mr. Calhoun, however, these benefits are provided under his employment agreement, which is described in further detail below under the section “—Narrative Disclosure to Summary Compensation Table and Grants of Plan-Based Awards in 2009 Table—Employment Agreement with Mr. David L. Calhoun.” The Compensation Committee considers these severance protections to be an important part of an executive’s compensation. Consistent with his responsibilities as Chief Executive Officer and with competitive practice, Mr. Calhoun’s severance protections are higher than those of the other Named Officers.
109
Table of Contents
Summary Compensation Table
The following table presents information regarding compensation for fiscal 2009, fiscal 2008 and fiscal 2007 of the Named Officers.
SUMMARY COMPENSATION TABLE
| Name and Principal Position (a) |
Year (b) |
Salary ($)(1) (c) |
Bonus ($)(2) (d) |
Stock Awards ($)(3) (e) |
Option Awards ($)(4) (f) |
Non-Equity Incentive Plan Compensation ($)(5) (g) |
Change
in Pension Value and Nonqualified Deferred Compensation Earnings ($) (h) |
All
Other Compensation ($)(6) (i) |
Total ($) (j) | |||||||||
| David Calhoun |
2009 | 1,687,500 | 2,004,039 | — | — | 2,500,000 | — | 134,682 | 6,326,221 | |||||||||
| Chief Executive Officer |
2008 | 1,600,962 | 2,004,039 | — | — | 1,650,000 | — | 199,005 | 5,454,006 | |||||||||
| 2007 | 1,500,000 | 2,004,039 | — | — | 1,900,000 | — | 86,816 | 5,490,855 | ||||||||||
| Mitchell Habib |
2009 | 778,846 | — | 1,000,000 | — | 1,200,000 | — | 71,890 | 3,050,736 | |||||||||
| Executive Vice President |
2008 | 671,538 | — | — | — | 825,000 | — | 44,127 | 1,540,665 | |||||||||
| 2007 | 484,615 | 500,000 | — | 3,595,500 | 1,000,000 | — | 13,606 | 5,593,721 | ||||||||||
| Susan Whiting |
2009 | 934,615 | — | — | — | 850,000 | 29,718 | 176,242 | 1,990,575 | |||||||||
| Vice Chairperson |
2008 | 882,115 | — | — | — | 700,000 | 1,888 | 208,107 | 1,792,110 | |||||||||
| 2007 | 850,000 | — | 1,000,000 | 4,921,500 | 900,000 | 28,172 | 177,163 | 7,876,835 | ||||||||||
| Brian West |
2009 | 789,231 | — | — | — | 1,000,000 | — | 61,742 | 1,850,973 | |||||||||
| Chief Financial Officer |
2008 | 723,308 | — | — | — | 675,000 | — | 68,644 | 1,466,952 | |||||||||
| 2007 | 581,539 | 4,000,000 | — | 3,995,000 | 800,000 | — | 272,331 | 9,648,870 | ||||||||||
| Roberto Llamas |
2009 | 677,885 | — | — | — | 800,000 | — | 46,349 | 1,524,234 | |||||||||
| Chief HR Officer |
||||||||||||||||||
| (1) | Increase in salary primarily reflects 27 pay periods in 2009 versus 26 pay periods in prior years. |
| (2) | Represents signing bonuses. |
| (3) | Represents the aggregate grant date fair value of restricted stock units awarded to the Named Officers calculated in accordance with Financial Accounting Standards Board Accounting Standards Codification Topic 718, Compensation—Stock Compensation. For a discussion of the assumptions and methodologies used to value the awards reported in column (e), please see the discussion contained in Note 12 “Share-Based Compensation” to our audited consolidated financial statements, included elsewhere in this prospectus. All numbers exclude estimates of forfeitures. Adjustments to 2007 and 2008 totals have been made to reflect updated Securities and Exchange Commission reporting requirements. |
| (4) | Represents the aggregate grant date fair value of options awarded to the Named Officers calculated in accordance with Financial Accounting Standards Board Accounting Standards Codification Topic 718, Compensation—Stock Compensation. For a discussion of the assumptions and methodologies used to value the awards reported in column (f), please see the discussion of option awards contained in Note 12 “Share-Based Compensation” to our audited consolidated financial statements, included elsewhere in this prospectus. All numbers exclude estimates of forfeitures. Adjustments to 2007 and 2008 totals have been made to reflect updated Securities and Exchange Commission reporting requirements. |
| (5) | For 2009, the amounts reflected for Mr. Calhoun, Ms. Whiting and Messrs. Habib, West and Llamas represent the 2009 annual incentive payments made in February 2010. |
| (6) | For 2009, Mr. Calhoun’s amount includes financial planning ($29,663), amounts relating to his automobile and driver ($31,506), retirement plan contributions ($31,350) and tax gross-up amounts ($42,163). Mr. Habib’s amount includes car allowance ($16,200), correction for 2008 tax gross-up for car allowance not paid in 2008 ($14,921), financial planning ($8,357), medical exam ($1,421), retirement contributions ($19,062) and tax gross-up amounts ($11,929). Ms. Whiting’s amount includes club dues ($3,000), car expense ($17,383), financial planning ($8,741), apartment ($58,630), retirement contributions ($17,693) and tax gross-up amounts ($70,795). Mr. West’s amount includes car allowance ($16,200), correction for 2008 tax gross-up for car allowance not paid in 2008 ($13,293), financial planning ($7,800), retirement plan contributions ($12,708) and tax gross-up ($11,741). Mr. Llamas’ amount includes car allowance ($16,200), correction on 2008 tax gross-up for car allowance not paid in 2008 ($13,235), retirement contributions ($10,327) and tax gross-up ($6,587). |
Notes:
| – |
Principal positions of the Named Officers are those as of December 31, 2009. | |
| – |
The valued realized on vesting reflects the price of Company common stock on 12/31/09, which was $11.50/share. | |
110
Table of Contents
Grants of Plan-Based Awards in 2009
| Estimated Future Payouts
Under Non-Equity Incentive Plan Awards |
All Other Stock Awards: Number of Shares of Stock or Units (#) |
Grant Date Fair Value of Stock and Option Awards ($) | ||||||||||
| Name |
Grant Date |
Threshold ($) |
Target ($) |
Maximum ($) |
||||||||
| David Calhoun |
1/1/09 | — | 1,900,000 | — | — | — | ||||||
| Mitchell Habib |
1/1/09 | — | 1,000,000 | — | ||||||||
| 6/19/09 | — | — | — | 100,000 | 1,000,000 | |||||||
| Susan Whiting |
1/1/09 | — | 900,000 | — | — | — | ||||||
| Brian West |
1/1/09 | — | 800,000 | — | — | — | ||||||
| Roberto Llamas |
1/1/09 | — | 700,000 | — | — | — | ||||||
Narrative Disclosure to Summary Compensation Table and Grants of Plan-Based Awards in 2009 Table
The Summary Compensation Table above quantifies the value of the different forms of compensation earned by or awarded to our Named Officers in 2009. The primary elements of each Named Officer’s total compensation reported in the table are base salary, an annual cash incentive, and the stock and options award columns reflect their awards in the equity of Nielsen Holdings.
The Summary Compensation Table and the Grants of Plan-Based Awards in 2009 Table should be read in conjunction with the narrative descriptions that follow.
Equity Awards
Upon the purchase of a prescribed number of shares of common stock, each Named Officer received stock options at an exercise price of $10 per share and others at an exercise price of $20 per share. One-half of the options are time-vested, which became 5% vested on the grant date with the remaining time options vesting 19% a year on the last day of each of the calendar years 2007 through 2011. One-half of the options are performance-vested which became 5% vested on the grant date with the remaining performance options vesting 19% on the last day of each of the calendar years 2007 through 2011, if and only if the Company’s performance equals or exceeds the applicable annual Management EBITDA targets. The achievement of the annual Management EBITDA targets on a cumulative basis for any current year and all prior years will cause “catch-up” vesting of any prior year’s installments which were not vested because of a failure to achieve the applicable annual Management EBITDA target for any such prior year. The number of shares purchased by each of the Named Officers is as follows: Mr. Calhoun (2,000,000), Ms. Whiting (100,000), Mr. Habib (175,000), Mr. West (125,000) and Mr. Llamas (150,000).
Employment Agreement with Mr. David L. Calhoun
On August 22, 2006, we entered into an employment agreement with Mr. David L. Calhoun, our Chief Executive Officer, which was amended effective as of September 14, 2006. His employment agreement was amended and restated effective December 15, 2008.
The employment agreement has an employment term which commenced as of September 11, 2006 and, unless earlier terminated, will continue until December 31, 2011. On each December 31 thereafter, the employment agreement will be automatically extended for successive additional one-year periods unless either party provides the other 90 days’ prior written notice that the employment term will not be so extended. Under the employment agreement, Mr. Calhoun is entitled to a base salary of $1,500,000, subject to such increases, if any, as may be determined by the board. He is eligible to earn an annual bonus under the Company’s Executive Incentive Plan as determined by the Compensation Committee based upon the achievement of financial and
111
Table of Contents
individual performance goals. Effective January 1, 2008, Mr. Calhoun’s starting reference point for determining his annual incentive is the prior year’s award. For 2009 only, his starting reference point is the 2007 award. To the extent that he is subject to the golden parachute tax as a result of a change in control of Nielsen, the employment agreement entitles him to an additional amount to place him in the same after tax position he would have occupied had he not been subject to such excise tax. Mr. Calhoun is restricted, for a period of two years following termination of employment with us, from soliciting or hiring our employees, competing with us, or soliciting our clients. He is also subject to a nondisparagement provision.
In connection with entering into the employment agreement, Mr. Calhoun became entitled to a signing bonus of $10,613,699, which is to be paid in installments annually through January 2012. To make him whole for previous awards of stock and options forfeited upon leaving his prior employer, the employment agreement entitled Mr. Calhoun to a cash lump sum payment of $20,000,000, less the amount of any payments made by the prior employer in connection with his termination of employment. The lump sum amount paid to Mr. Calhoun pursuant to this make whole arrangement was $18,840,627. Additionally, in 2012 he is entitled to receive a lump sum deferred compensation benefit from us in the amount of $14,500,000 plus annual interest through such payment date, less any deferred compensation benefits he receives from previous employment. Mr. Calhoun is also a participant in the 2006 Stock Acquisition and Option Plan.
Pursuant to Mr. Calhoun’s employment agreement, he received an option grant to purchase 7,000,000 shares of Company common stock. The amount of his option grant was determined by the Compensation Committee in connection with Mr. Calhoun’s $20,000,000 investment in the Company. At the time of Mr. Calhoun’s investment, the Compensation Committee determined that a grant of options would be appropriate in order to further incentivize Mr. Calhoun and align his interests more closely with those of the Company and its equity holders. While there is no formal policy for the granting of options in connection with an equity investment, the Compensation Committee determined that a ratio of slightly less than 1 to 3 (i.e., 1,000,000 options for every $3,000,000 invested in the Company) was appropriate in light of Mr. Calhoun’s particular circumstances, including his early departure from his prior employer and the critical nature of his position with, and the extent of his financial commitment to, the Company and the risks related thereto. The exercise prices of the options were determined pursuant to the Compensation Committee’s goal of aligning Mr. Calhoun’s interests with those of the Company and its equity holders. Specifically, 6,000,000 of the options were given an exercise price of $10 per share, which was the fair value of our common stock on the date of the grant. The remaining 1,000,000 options were given an exercise price of $20 per share, which was twice the fair value of our common stock on the date of the grant, in order to incentivize Mr. Calhoun to increase the value of the Company to above $20 per share. One-half of the options are time-vested options and the other one-half are performance-vested options. The portion of the option grant subject to time-based vesting became vested and exercisable as to 5% of the shares of common stock subject thereto on grant date and 19% will vest and become exercisable on the last day of each of the next five calendar years. The portion of the option grant subject to performance-based vesting became vested and exercisable as to 5% of the shares of common stock subject thereto on December 31, 2006 and 19% will vest and become exercisable on the last day of each of the next five calendar years based on the achievement of Management EBITDA targets. The terms of the option grant subject to performance-based vesting were amended in 2009 as reflected in the Long-Term Equity Incentive Awards section above.
Under the employment agreement, Mr. Calhoun is entitled to the following payments and benefits in the event of a termination by us without “cause,” a non-extension of his employment term by us, or by Mr. Calhoun for “good reason” (as such terms are defined in the agreement) during the employment term: (1) subject to his compliance with certain restrictive covenants, an amount equal to two times the sum of his annual base salary and $2,000,000, provided that such payment is in lieu of any other severance benefits to which Mr. Calhoun might otherwise be entitled; (2) a pro-rata annual bonus for the year of termination based on attainment of performance goals; and (3) continued health and welfare benefits for two years at our cost.
On February 25, 2010, Mr. Calhoun was granted 250,000 stock options. These stock options have a strike price equal to $11.50 per share, the fair market value of a Company share on the date of grant, and will vest one-third each year on December 31, 2010, 2011 and 2012.
112
Table of Contents
Employment Arrangement with Ms. Susan Whiting
On December 4, 2006, we entered into a written employment arrangement with Ms. Susan D. Whiting,
Under the written employment arrangement, Ms. Whiting is entitled to a base salary of $850,000 effective November 13, 2006, subject to increase, if any, as may be determined by the Company. Ms. Whiting is eligible to earn a target annual bonus equal to 100% of base salary upon the achievement of performance goals based upon Management EBITDA to be determined in good faith in consultation with the Chief Executive Officer. Effective January 1, 2008, Ms. Whiting’s starting reference point for determining her annual incentive is the prior year’s award. For 2009 only, her starting reference point is the 2007 award. In connection with entering into the written employment arrangement, Ms. Whiting became entitled to purchase 100,000 shares of common for fair market value on the date of purchase as provided under the 2006 Stock Acquisition and Option Plan. This purchase was subsequently made in February 2007. In addition, Ms. Whiting received a stock option grant of 1,050,000 shares subject to her purchase of the common stock and a grant of 100,000 time-vested restricted stock units scheduled to vest over five years, commencing on January 15, 2007. 900,000 of the stock options were granted at $10 per share and 150,000 were granted at $20 per share.
Employment Arrangement with Mr. Brian West
On February 20, 2007, we offered the position of Chief Financial Officer to Mr. Brian West. Under the written offer letter, Mr. West is entitled to a base salary of $700,000, effective on his start date with the Company (February 23, 2007), subject to annual review along with other Company executives. Mr. West was eligible to earn a target annual bonus equal to 100% of base salary upon the achievement of both financial and individual performance goals. Effective January 1, 2008, Mr. West’s starting reference point for determining his annual incentive is the prior year’s award. For 2009 only, his starting reference point is the 2007 award. Additionally, Mr. West received a one-time, lump sum payment of $2,400,000 in consideration of his outstanding long-term incentive, restricted stock unit and stock option awards granted by his prior employer. He also became entitled to receive a lump sum deferred compensation benefit from the company equal to $1,600,000 with interest credited at the rate of 5.05%, less the actuarially equivalent value with regard to any amount he receives or is entitled to receive from the deferred compensation benefit from his prior employer. In connection with joining Nielsen, he also became entitled to purchase 125,000 shares of common stock for fair market value on the date of purchase as provided under the 2006 Stock Acquisition and Option Plan. This purchase was subsequently made in March 2007. In addition, Mr. West received a stock option grant of 875,000 shares subject to the subsequent purchase of the common stock. 750,000 of the stock options were granted at $10 per share and 125,000 were granted at $20 per share.
On March 18, 2010, Mr. West was granted 100,000 stock options. These stock options have a strike price equal to $11.50 per share, the fair market value of a Company share on the date of grant, and will vest one-third on each anniversary of the grant date.
Employment Arrangement with Mr. Mitchell Habib
Effective March 1, 2007, Mr. Mitchell Habib joined the Company as Executive Vice President for Global Business Services. Under his written offer letter, Mr. Habib is entitled to receive a base salary of $600,000, effective on his start date with the Company, subject to annual review with other Company executives. Mr. Habib is eligible to earn a target annual bonus of $900,000 based upon the achievement of both financial and individual performance goals. Effective January 1, 2008, Mr. Habib’s starting reference point for determining his annual incentive is the prior year’s award. For 2009 only, his starting reference point is the 2007 award. Additionally, Mr. Habib received a one-time, lump sum payment of $500,000 shortly after he joined the Company. In connection with joining Nielsen, he also became entitled to purchase 175,000 shares of common stock for fair market value at the date of purchase as provided under the 2006 Stock Acquisition and Option Plan. This purchase was subsequently made in March 2007. In addition, Mr. Habib received a stock option grant of 787,500 shares subject to the subsequent purchase of the common stock. 675,000 of the stock options were granted at $10 per share and 112,500 were granted at $20 per share.
On June 19, 2009, Mr. Habib was granted 100,000 restricted stock units that will vest ratably on December 31, 2010, 2011 and 2012.
113
Table of Contents
Employment Arrangement with Mr. Roberto Llamas
Effective June 11, 2007, Mr. Roberto Llamas joined the Company as Chief Human Resources Officer. Under his written offer letter, Mr. Llamas was entitled to a base salary of $600,000, effective on his start date, subject to annual review along with other Company executives. Mr. Llamas was eligible to earn a target annual bonus equal to 100% of base salary upon the achievement of both financial and individual goals. Effective January 1, 2008, Mr. Llamas’ starting reference point for determining his annual incentive is the prior year’s award. For 2009 only, his starting reference point is the 2007 award. In connection with joining Nielsen, he became entitled to purchase 150,000 shares of common stock of Nielsen for fair market value on the date of purchase as provided under the 2006 Stock Acquisition and Option Plan. This purchase was subsequently made in June 2007. In addition, Mr. Llamas received a stock option grant of 525,000 shares subject to the subsequent purchase of the common stock. 450,000 of the stock options were granted at $10 per share and 75,000 were granted at $20 per share.
On March 18, 2010, Mr. Llamas was granted 100,000 stock options. These stock options have a strike price equal to $11.50 per share, the fair market value of a Company share on the date of grant, and will vest one-third on each anniversary of the grant date.
Outstanding Equity Awards at 2009 Fiscal Year End
The following table presents information regarding the outstanding equity awards held by each of our Named Officers as of December 31, 2009.
| Option Awards(1) | Stock Awards | |||||||||||||||
| Name (a) |
Number of Securities Underlying Unexercised Options Exercisable (b) |
Number of Securities Underlying Unexercised Options Unexercisable (c) |
Equity Incentive Plan Awards: Number of Securities Underlying Unexercised Unearned Options (d) |
Option Exercise Price ($) (e) |
Option Expiration Date (f) |
Number of Shares or Units of Stock That Have Not Vested (g) |
Market Value of Shares or Units of Stock That Have Not Vested ($) (h) | |||||||||
| David Calhoun |
3,150,000 | 1,140,000 | 1,710,000 | $ | 10.00 | 11/22/2016 | — | — | ||||||||
| 525,000 | 190,000 | 285,000 | 20.00 | 11/22/2016 | — | — | ||||||||||
| Mitchell Habib |
354,375 | 128,250 | 192,375 | 10.00 | 3/21/2017 | 100,000 | $ | 1,150,000 | ||||||||
| 59,063 | 21,375 | 32,062 | 20.00 | 3/21/2017 | — | — | ||||||||||
| Susan Whiting |
472,500 | 171,000 | 256,500 | 10.00 | 2/2/2017 | 40,000 | $ | 460,000 | ||||||||
| 78,750 | 28,500 | 42,750 | 20.00 | 2/2/2017 | — | — | ||||||||||
| Brian West |
393,750 | 142,500 | 213,750 | 10.00 | 3/21/2017 | — | — | |||||||||
| 65,625 | 23,750 | 35,625 | 20.00 | 3/21/2017 | — | — | ||||||||||
| Roberto Llamas |
236,250 | 85,500 | 128,250 | 10.00 | 6/11/2017 | — | — | |||||||||
| 39,375 | 14,250 | 21,375 | 20.00 | 6/11/2017 | — | — | ||||||||||
| (1) | The terms of each option award reported in the table above are described above under “Narrative Disclosure to Summary Compensation Table and Grants of Plan-Based Awards in 2009 Table”. The option awards are subject to a vesting schedule, with 5% of the options on grant date, and 19% on each of the five anniversaries of December 31, 2006. The exercisable options shown in Column (b) above are currently vested. The unexercisable options shown in Column (c) and (d) above are unvested. As described above, options are subject to accelerated vesting in connection with a change in control of Nielsen and, in the case of Mr. Calhoun, certain terminations of his employment with Nielsen. The options at $20 per share exercise price represent options granted at twice the fair market value on the date of grant. Mr. Calhoun’s grant date was November 22, 2006. The grant dates for the remaining Named Officers are 10 years prior to the Option Expiration Date shown in the table above. |
114
Table of Contents
Option Exercises and Stock Vested in 2009
The following table presents information regarding the value realized by each of our Named Officers upon the exercise of option awards or the vesting of stock awards during the fiscal year ended December 31, 2009.
| Option Awards | Stock Awards | ||||||||
| Name (a) |
Number of Shares Acquired on Exercise (#) (b) |
Value Realized on Exercise ($) (c) |
Number of Shares Acquired on Vesting (#) (d) |
Value Realized on Vesting ($) (e) |
|||||
| David Calhoun |
— | — | — | — | |||||
| Mitchell Habib |
— | — | — | — | |||||
| Susan Whiting |
— | — | 20,000 | 230,000 | (1) | ||||
| Brian West |
— | — | — | — | |||||
| Roberto Llamas |
— | — | — | — | |||||
| (1) | This amount is based on a fair market value as of December 31, 2009 of $11.50 per share. |
Pension Benefits for 2009
| Name (a) |
Plan Name (b) | Number of Years Credited Service (#) (c) |
Present Value of Accumulated Benefit ($) (d) |
Payments During Last Fiscal Year ($) (e) | |||||
| David Calhoun |
— | — | — | — | |||||
| Mitchell Habib |
— | — | — | — | |||||
| Susan Whiting |
Qualified Plan | 26.67 | $ | 228,627 | — | ||||
| Excess Plan | 26.67 | $ | 250,278 | — | |||||
| Brian West |
— | — | — | — | |||||
| Roberto Llamas |
— | — | — | — | |||||
Assumptions for present value of accumulated benefit
Present values at December 31, 2009 were calculated using an interest rate of 6.00%, an interest credit rate of 4.50% and the RP 2000 mortality table (projected to 2012). Present values at December 31, 2008 were calculated using an interest rate of 6.00%, an interest credit rate of 4.50% and the RP 2000 mortality table (projected to 2006). These assumptions are consistent with those used for the financial statements of the Company’s retirement plans.
United States Retirement Plans
Effective August 31, 2006, the Company froze its United States qualified and non-qualified retirement plans. No participants may be added and no further benefits may accrue after this date. The retirement plans, as in existence immediately prior to the freeze, are described below.
We maintain a tax-qualified retirement plan (the “Qualified Plan”), a cash-balance pension plan that covers eligible United States employees who have completed at least one year of service. Prior to the freeze, we added monthly basic and investment credits to each participant’s account. The basic credit equals 3% of a participant’s eligible monthly compensation. Participants became fully vested in their accrued benefits after the earlier of five years of service or when the participant reached normal retirement age (which is the later of age 65 or the fifth anniversary of the date the participant first became eligible to participate in the plan). Unmarried participants receive retirement benefits as a single-life annuity, and married participants receive retirement benefits as a qualified joint-and-survivor annuity. Participants can elect an alternate form of payment such as a straight-life annuity, a joint-and-survivor annuity, years certain-and-life income annuity or a level income annuity option. Lump sum payment of accrued benefits is only available if the benefits do not exceed $5,000. Payment of benefits begins at the later of the participant’s termination of employment with us or reaching age 40.
115
Table of Contents
We also maintain a non-qualified retirement plan (the “Excess Plan”) for certain of our management and highly compensated employees. Prior to the freeze, the Excess Plan provided supplemental benefits to individuals whose benefits under the Qualified Plan are limited by the provisions of Section 415 and/or Section 401(a)(17) of the Code. The benefit payable to a participant under the Excess Plan is equal to the difference between the benefit actually paid under the Qualified Plan and the amount that would have been payable had the applicable Code limitations not applied. Although the Excess Plan is considered an unfunded plan and there is no current trust agreement for the Excess Plan, assets have been set aside in a “rabbi trust” fund. It is intended that benefits due under the Excess Plan will be paid from this rabbi trust or from the general assets of the Nielsen entity that employs the participants.
Ms. Whiting is the only Named Officer who is a participant in the Qualified Plan or the Excess Plan.
Nonqualified Deferred Compensation for 2009
Messrs. Calhoun and West received a supplementary deferred compensation contribution as part of their new hire arrangements (as explained above). Both Named Officers receive interest credits at 5.05% per annum.
The Company offers a voluntary nonqualified deferred compensation plan in the United States which allows selected executives the opportunity to defer a significant portion of their base salary and incentive payments to a future date. Earnings on deferred amounts are determined with reference to designated mutual funds. Ms. Whiting is the only Named Officer with a balance under this plan. There is no above market rate of return given to executives as defined by the Securities and Exchange Commission.
| Name (a) |
Executive Contributions in Last FY ($) (b) |
Registrant Contributions in Last FY ($) (c) |
Aggregate Earnings in Last FY ($) (d) |
Aggregate Withdrawals/ Distributions ($) (e) |
Aggregate Balance at Last FYE ($) (f) | ||||||||||
| David Calhoun |
$ | — | $ | — | $ | 839,339 | $ | — | $ | 17,050,571 | |||||
| Susan Whiting |
94,074 | — | 635 | — | 280,696 | ||||||||||
| Brian West |
— | — | 90,871 | — | 1,845,975 | ||||||||||
Note: Interest payments have not been reported in the Summary Compensation Table.
Potential Payments upon Termination or Change in Control
Severance Benefits—Termination of Employment
Mr. Calhoun
In the event Mr. Calhoun’s employment is terminated during the employment term due to death, disability, by the Company without cause, by Mr. Calhoun for good reason or due to the Company’s non-extension of the Term (as those terms are defined in the employment agreement), Mr. Calhoun will be entitled to severance pay that includes (1) payment equal to two times the sum of (a) Mr. Calhoun’s base salary, plus (b) $2,000,000, paid in equal installments for the severance period; (2) a pro-rata portion of Mr. Calhoun’s bonus for the year of the termination; (3) payment of balances in his deferred compensation account; (4) pro-rata payment of his next signing bonus installment and (5) continued health and welfare benefits for Mr. Calhoun and his family members for the term of the severance. If Mr. Calhoun’s employment had been terminated without cause by the Company or for good reason by the executive on December 31, 2009, he would have received total payments as shown in the following table plus continued health and welfare benefits coverage for Mr. Calhoun and his family members for up to two years, in an amount estimated to be $11,800 for the two year period. Additionally, Mr. Calhoun would be entitled to receive his balance under the nonqualified deferred compensation arrangement as shown above. In the event of a change in control, any then-unvested time-based stock options will become vested and exercisable in full. Any then-unvested performance-based stock options will become vested and exercisable in full, if as a result of such change in control, the Sponsors realize an aggregate return of at least 2.5 times their equity investment in the Company (including all dividends and other payments). As of December 31, 2009, the value of any accelerated vesting of options would be $4,275,000 because the per share price of the Company’s
116
Table of Contents
common stock ($11.50) was above the strike price of the majority of the stock options ($10) and below the strike price of the remainder of the stock options ($20).
| Name |
2 times the sum of Base Salary plus $2,000,000 |
Annual Incentive Award |
Signing Bonus |
Health & Welfare Benefits |
Total | ||||||||||
| David Calhoun |
$ | 7,250,000 | $ | 2,500,000 | $ | 2,004,039 | $ | 11,800 | $ | 11,765,839 | |||||
Named Officers Other Than Mr. Calhoun
In the event any of the other Named Officers are terminated by the Company without cause or by them for good reason, they will be entitled to severance pay that includes (1) payment equal to two times the sum of their base salary plus (2) a pro-rata portion of their bonus for the year of termination and (3) continued health and welfare benefits for the executive and their family members for the term of the severance. If an executive’s employment had been terminated without cause by the Company or for good reason by the executive on December 31, 2009, they would have received total payments as shown in the following table. Additionally, they would be eligible for continued health and welfare benefits coverage for the executives and their family members for up to two years, in an amount estimated to be $11,800 for the two year period. Additionally, Mr. West would be entitled to receive his balance under the nonqualified deferred compensation arrangement as shown above. In the event of a change in control, any then-unvested time-based stock options will become vested and exercisable in full. Any then-unvested performance-based stock options will become vested and exercisable in full, if as a result of such change in control, the Sponsors realize an aggregate return of at least the amounts set forth under the stock option agreement. As of December 31, 2009, the value of any accelerated vesting of options would be $641,250 for Ms. Whiting, $480,938 for Mr. Habib, $534,375 for Mr. West and $320,625 for Mr. Llamas because the per share price of the Company’s common stock ($11.50) was above the strike price of the majority of the stock options ($10) and below the strike price of the remainder of the stock options ($20).
| Name |
2 times Base Salary |
Annual Incentive Award |
Health & Welfare Benefits |
Total | ||||||||
| Susan Whiting |
$ | 1,800,000 | $ | 850,000 | $ | 11,800 | $ | 2,661,800 | ||||
| Mitchell Habib |
1,500,000 | 1,200,000 | 11,800 | 2,711,800 | ||||||||
| Brian West |
1,520,000 | 1,000,000 | 11,800 | 2,531,800 | ||||||||
| Roberto Llamas |
1,300,000 | 800,000 | 11,800 | 2,111,800 | ||||||||
Restrictive Covenants
Pursuant to Mr. Calhoun’s employment agreement, he has agreed not to disclose any Company confidential information at any time during or after his employment with Nielsen. In addition, Mr. Calhoun has agreed that, for a period of two years following a termination of his employment with Nielsen, he will not solicit or hire Nielsen’s employees or solicit Nielsen’s customers or materially interfere with any of Nielsen’s business relationships. He also agrees not to act as an employee, investor or in another significant function in any business that directly or indirectly competes with any business of the Company.
Pursuant to the severance agreements of the other Named Officers, they have agreed not to disclose any Company confidential information at any time during or after their employment with Nielsen. In addition, they have agreed that, for a period of two years following a termination of their employment with Nielsen, they will not solicit Nielsen’s employees or customers or materially interfere with any of Nielsen’s business relationships. They also agree not to act as an employee, investor or in another significant function in any business that directly or indirectly competes with any business of the Company.
In the event a Named Officer breaches the restrictive covenants, in addition to all other remedies that may be available to the Company, the Named Officer will be required to pay to the Company any amounts actually paid to him or her by the Company in respect of any repurchase by the Company of the options or shares of common stock underlying the options held by the officer.
117
Table of Contents
2006 Stock Acquisition and Option Plan
On December 7, 2006, the Company adopted the 2006 Stock Acquisition and Option Plan for Key Employees of Valcon Acquisition Holding B.V. and its subsidiaries, as amended (the “2006 Stock Acquisition and Option Plan”), including executives of Nielsen. The 2006 Stock Acquisition and Option Plan permits the grant of non-qualified stock options, incentive stock options, stock appreciation rights, purchase stock, restricted stock, dividend equivalent rights, and other stock-based awards to designated employees of Nielsen Holdings and its affiliates. As of February 25, 2010, a maximum of 36,250,000 shares of common stock of Nielsen Holdings were available for award or purchase under the 2006 Stock Acquisition and Option Plan. The number of shares issued or reserved pursuant to the 2006 Stock Acquisition and Option Plan (or pursuant to outstanding awards) is subject to adjustment for mergers, consolidations, reorganizations, stock splits, stock dividends and other dilutive changes in the common stock of Nielsen Holdings. Shares of common stock covered by awards that terminate or lapse and shares delivered by a participant or withheld to pay the minimum statutory withholding rate, in each case, will again be available for grant under the 2006 Stock Acquisition and Option Plan. Shares of common stock that are acquired pursuant to the 2006 Stock Acquisition and Option Plan will be subject to the Management Stockholder’s Agreement. This agreement places restrictions on the stockholder’s right to transfer and vote his or her shares and provides for call rights on the shares and stock options in the event the stockholder’s employment terminates prior to a change in control of Nielsen Holdings or the date on which the Original Sponsors’ ownership in the Company falls below 33 1/3% of their original ownership.
Stock Incentive Plan
Upon completion of this offering, we will implement the Nielsen Holdings 2010 Stock Incentive Plan (the “Stock Incentive Plan”). The following description of the Stock Incentive Plan is not complete and is qualified by reference to the full text of the Stock Incentive Plan, which has been filed as an exhibit to the registration statement of which this prospectus forms a part. The Stock Incentive Plan will be the source of new equity-based awards permitting us to grant to our key employees, directors and other service providers the following types of awards: incentive stock options (within the meaning of Section 422 of the Code), non-qualified stock options, stock appreciation rights, restricted stock, restricted stock units and other awards valued in whole or in part by reference to shares of our common stock and performance-based awards denominated in shares or cash.
Administration. The Compensation Committee will administer the Stock Incentive Plan. However, our board of directors may take any action delegated to the Compensation Committee under the Stock Incentive Plan as it deems necessary. The Compensation Committee will determine who will receive awards under the Stock Incentive Plan, as well as the form of the awards, the number of shares underlying the awards and the terms and conditions of the awards consistent with the terms of the Stock Incentive Plan. The Compensation Committee will have sole and absolute discretion to interpret and administer the Stock Incentive Plan, and any determinations will be final and binding on all parties concerned. The Compensation Committee may also correct any defect or supply any omission to reconcile any inconsistency in the Plan.
Shares Subject to the Stock Incentive Plan. The total number of shares of our common stock which may be issued under the Stock Incentive Plan is 19,392,000, plus the shares of common stock remaining available for award under the 2006 Stock Acquisition and Option Plan as of the effective date of the Stock Incentive Plan. The maximum number of shares for which incentive stock options may be granted is 9,696,000. The maximum number of shares in respect of which stock options or stock appreciation rights may be granted to any participant during any fiscal year of the Company is 2,000,000.
We will make available the number of shares of our common stock necessary to satisfy the maximum number of shares that may be issued under the Stock Incentive Plan. The shares of our common stock underlying (i) any award granted under the Stock Incentive Plan and (ii) any award that is outstanding as of the effective date of the Stock Incentive Plan under the 2006 Stock Acquisition and Option Plan, in any such case that are forfeited, terminated, canceled or expire unexercised; withheld or tendered to satisfy tax withholding obligations, the aggregate purchase price on the exercise of stock options or the purchase price for any other award granted
118
Table of Contents
under the Stock Incentive Plan or repurchased by us, in each case, will again become available for awards under the Stock Incentive Plan. Further, if an award is settled in cash, shares in respect of such award will also become available for awards. Awards may be made under the Stock Incentive Plan in substitution for outstanding awards previously granted by a company that is acquired by us, but the shares subject to such substituted awards will not be counted against the aggregate number of shares otherwise available for awards under the Stock Incentive Plan.
No award may be granted under the Stock Incentive Plan after the tenth anniversary of the effective date of the plan, but awards granted prior to such date may extend beyond such tenth anniversary, except that an automatic exercise through a net settlement of both the exercise price and the minimum withholding taxes will occur if the date on which the portion of the option is scheduled to expire falls during our blackout trading period applicable to the participant and the exercise price per share of such portion of the option is less than the fair market value of our common stock on the date of such automatic exercise. To the extent Dutch law requires it, awards granted pursuant to the Stock Incentive Plan (to the extent they constitute options or other rights to acquire shares) will be deemed to have been granted subject to the approval of such award by the Board (to the extent so delegated to the Board by the stockholders) or by our stockholders themselves at an annual meeting. No such authority from the Board or the stockholders is required for the issuance of shares upon exercise of a validly granted award.
Stock Options and Stock Appreciation Rights. The Compensation Committee may award non-qualified or incentive stock options under the Stock Incentive Plan. Stock options granted under the Stock Incentive Plan will become vested and exercisable at such times and upon such terms and conditions as may be determined by the Compensation Committee at the time of grant, but an option will generally not be exercisable for a period of more than ten years after it is granted.
Except with respect to substitute awards, the exercise price per share for any stock option awarded will not be less than the fair market value of a share of our common stock on the day the stock option is granted. To the extent required by Netherlands law, the option price will not be less than the nominal value per share in respect of which the option is being exercised. The exercise price of a stock option may be paid (1) in cash or its equivalent; (2) unless otherwise required by the Compensation Committee, in shares of our common stock having a fair market value equal to the aggregate stock option exercise price for the shares being purchased and upon satisfaction of such other requirements as may be imposed by the Compensation Committee; (3) unless otherwise required by the Compensation Committee, partly in cash and partly in shares of our common stock; (4) if there is a public market for shares of our common stock at such time, through the delivery of irrevocable instructions to a broker to sell shares of our common stock obtained upon the exercise of the stock option and to deliver promptly to us an amount out of the proceeds of the sale equal to the aggregate stock option exercise price for the shares of our common stock being purchased; or (5) through a net settlement feature as described in the Stock Incentive Plan (i.e., having a number of shares with a fair market value equal to the aggregate exercise price of the portion of the option to be exercised withheld by us from the number of shares that would have otherwise been received). The repricing of a stock option, after it has been granted, is prohibited without prior approval of our stockholders.
The Compensation Committee may grant options that are intended to be “incentive stock options” (“ISOs”) within the meaning of Section 422 of the Code and will comply with the requirements of Section 422 of the Code. No ISO may be granted to a participant who at the time of the grant owns more than 10% of the total combined voting power of all classes of our stock, unless (i) the option price for such ISO is at least 110% of the fair market value of a share on the date the ISO is granted, and (ii) the date on which the ISO terminates is not later than the day preceding the fifth anniversary of the day the ISO is granted. All options are intended to be non-qualified stock options, unless the applicable award agreement explicitly states that the option is intended to be an ISO.
The Compensation Committee may grant stock appreciation rights independent of or in connection with a stock option. The exercise price of a stock appreciation right will not be less than the fair market value of a share
119
Table of Contents
of our common stock on the date the stock appreciation right is granted, except that, in the case of a stock appreciation right granted in conjunction with a stock option, the exercise price will not be less than the exercise price of the related stock option. Further, the exercise price of a stock appreciation right that is granted in exchange for an option may be less than the fair market value if such exercise price is equal to the option price of the exchanged option. To the extent required by Dutch law, the exercise price per share of a stock appreciation right will not be less than the nominal value per share in respect of which the stock appreciation right is being exercised. Each stock appreciation right granted independent of a stock option will entitle a participant upon exercise to an amount equal to (i) the excess of (A) the fair market value on the exercise date of one share of our common stock over (B) the exercise price per share, multiplied by (ii) the number of shares of our common stock covered by the stock appreciation right. Each stock appreciation right granted in conjunction with a stock option will entitle a participant to surrender to us the stock option and to receive in exchange such amount. Payment will be made in shares of our common stock and/or cash (any share of our common stock valued at fair market value), as determined by the Compensation Committee. The repricing of a stock appreciation right, after it has been granted, is prohibited without prior approval of our stockholders.
Other Stock-Based Awards. The Compensation Committee in its sole discretion may grant or sell awards of shares of our common stock, restricted stock, RSUs and awards that are valued in whole or in part by reference to, or are otherwise based on the fair market value of, shares of our common stock. Any of these other stock-based awards will be in such form, and dependent on such conditions, as the Compensation Committee determines, including, without limitation, the right to receive, or vest with respect to, one or more shares of our common stock (or the equivalent cash value of such shares of our common stock) upon the completion of a specified period of service, the occurrence of an event and/or the attainment of performance objectives. The Compensation Committee may in its discretion determine whether other stock-based awards will be payable in cash, shares of our common stock, or a combination of both cash and shares. To the extent required by Dutch law, the price paid per share for shares awarded in respect of other stock-based awards will not be less than the nominal value of the underlying share.
Performance-Based Awards. The Compensation Committee in its sole discretion may grant certain awards that are denominated in shares or cash and may include awards of options, stock appreciation rights and other stock-based awards, to be granted in a manner which is intended to be deductible by us under Section 162(m) of the Code (such awards, “Performance-Based Awards”). To the extent required by Netherlands law, the price paid per share for shares awarded in respect of Performance-Based Awards will not be less than the nominal value of the underlying share.
Performance-Based Awards will be subject to the terms and conditions established by the Compensation Committee and will be based upon one or more of the following performance criteria: (1) consolidated income before or after taxes (including income before interest, taxes, depreciation and amortization); (2) EBITDA; (3) adjusted EBITDA, (4) operating income; (5) net income; (6) adjusted cash net income; (7) adjusted cash net income per share; (8) net income per share; (9) book value per share; (10) return on members’ or stockholders’ equity; (11) expense management; (12) return on investment; (13) improvements in capital structure; (14) profitability of an identifiable business unit or product; (15) maintenance or improvement of profit margins; (16) stock price; (17) market share; (18) revenue or sales; (19) costs; (20) cash flow; (21) working capital; (22) multiple of invested capital; (23) total return; and (24) such other objective performance criteria as determined by the Compensation Committee in its sole discretion to the extent such criteria would be permissible performance criteria under Section 162(m) of the Code. The foregoing criteria may relate to us, one or more of our subsidiaries or one or more of our divisions or units, or any combination of the foregoing, and may be applied on an absolute basis and/or be relative to one or more peer group companies or indices, or any combination thereof, as the Compensation Committee will determine. In addition, to the degree consistent with Section 162(m) of the Code, the performance goals may be calculated without regard to extraordinary items. The Compensation Committee will determine whether, with respect to a performance period, the applicable performance goals have been met with respect to a given participant and, if they have, during any period when Section 162(m) of the Code is applicable to us, will so certify and ascertain the amount of the applicable Performance-Based Award.
120
Table of Contents
During any period when Section 162(m) of the Code is applicable to us, no Performance-Based Awards will be paid to any participant for a given period of service until the Compensation Committee certifies that the objective performance goals (and any other material terms) applicable to such period have been satisfied.
The amount of the Performance-Based Award actually paid to a given participant may be less than the amount determined by the applicable performance goal formula, at the discretion of the Compensation Committee. The amount of the Performance-Based Award determined by the Compensation Committee for a performance period will be paid to the participant at such time as determined by the Compensation Committee in its sole discretion after the end of such performance period; provided, however, that a participant may, if and to the extent permitted by the Compensation Committee and consistent with the provisions of Section 409A of the Code, elect to defer payment of a Performance-Based Award. The maximum amount of a Performance-Based Award granted in respect of any performance period that may be earned by a participant during each fiscal year of the Company covered by the performance period will be (i) with respect to Performance-Based Awards that are denominated in shares, 1,000,000 shares, and (ii) with respect to Performance-Based Awards that are denominated in cash, $10,000,000.
Adjustments upon Certain Events. In the event of any share dividend or split, reorganization, recapitalization, merger, consolidation, spin-off, combination, or transaction or exchange of shares of our common stock or other corporate exchange, any equity restructuring as defined by FASB Accounting Standards Codification 718, or any distribution to stockholders other than regular cash dividends, or any transaction similar to the foregoing, the Compensation Committee in its sole discretion and without liability to any person will make such substitution or adjustment, if any, as it deems reasonably necessary to address, on an equitable basis, the effect of such event as to (1) the number or kind of shares or other securities issued or reserved for issuance pursuant to the Stock Incentive Plan or pursuant to outstanding awards, (2) the maximum number of shares for which stock options or stock appreciation rights may be granted during a fiscal year to any participant, (3) the maximum amount of a Performance-Based Award that may be granted during a calendar year to any participant, (4) the option price or exercise price of any option or stock appreciation right and/or (5) any other affected terms of such awards.
Change in Control. In the event of a “change in control” (as defined below) after the effective date of the Stock Incentive Plan, the Stock Incentive Plan provides that:
(1) if the successor or acquiring entity in the change in control does not agree to provide for the issuance of substitute awards on an equitable basis in a manner consistent with the relevant adjustment provisions of the Stock Incentive Plan (described above), as determined by the Compensation Committee in its sole discretion, then either (A) any outstanding awards held by a participant which are unexercisable or otherwise unvested or subject to lapse restrictions and are not assumed by a successor corporation will automatically be deemed exercisable or otherwise vested or no longer subject to lapse restrictions and (B) the Compensation Committee will (i) cancel the awards for fair value (as determined in the sole discretion of the Compensation Committee), or (ii) provide that, with respect to any awards that are stock options, for a period of at least ten days prior to the change in control, awards will be exercisable to the extent applicable as to all shares subject thereto and that upon the occurrence of the change in control, awards will terminate and be of no further force and effect;
(2) if the successor or acquiring entity does agree to provide for the issuance of substitute awards, then any outstanding awards held by participants which are unexercisable or otherwise unvested or subject to lapse restrictions will not automatically be deemed exercisable or otherwise vested or no longer subject to lapse restrictions, as the case may be, as of the date of the change in control, provided that if at any time during the two-year period following the change in control, the participant’s employment with us and our subsidiaries is terminated under a circumstance that would make the participant eligible to receive payment of severance compensation pursuant to our severance plan, policy or other arrangement, as of such date of termination, then any then unvested awards outstanding will become automatically deemed exercisable or otherwise vested or no longer subject to lapse restrictions; and
121
Table of Contents
(3) if the Compensation Committee establishes terms for the vesting or exercisability of any award in connection with a change in control that varies from the provisions set forth in the Stock Incentive Plan, then the same such terms must apply to all other awards having substantially similar vesting or exercisability terms that are held by all other participants as of such time.
A change in control, as defined in the Stock Incentive Plan, occurs upon (1) the sale or disposition of all or substantially all of our assets to any person or group other than the permitted holders; (2) any person or group, other than the permitted holders, becoming the beneficial owner of more than 50% of the total voting power of our voting stock, or any entity which controls us, such person will be deemed to have beneficial ownership of all shares that they have the right to acquire, whether such right is exercisable immediately or only after the passage of time; (3) a reorganization, recapitalization, merger or consolidation involving the company, unless securities representing 50% or more of the combined voting power of the then outstanding voting securities entitled to vote generally in the election of our board of directors or the board of directors of the corporation resulting from such transaction are held subsequent to such transaction by the person or persons who were the beneficial owners of the outstanding voting securities entitled to vote generally in the election of our board of directors immediately prior to such transaction; (4) during any rolling twenty-four month period, individuals who at the beginning of such period constituted our board of directors, together with any new directors whose election by such board or whose nomination for election by our stockholders was approved by a vote of a majority of our board of directors who were either directors at the beginning of this period or whose election or nomination for election was previously so approved, cease for any reason to constitute a majority of our board of directors then in office, however individuals who were elected or nominated as a director as a result of an actual or threatened contest with respect to directors or an actual or threatened solicitation of proxies by any person other than our board of directors, or individuals who were elected or nominated as a director pursuant to an agreement between Luxco or among one or more of the Sponsors and a third party under which Luxco or any Sponsor is required to nominate such director will not be considered in this determination; or (5) any transaction resulting in any person or group, other than any of the Sponsors or their affiliates, obtaining direct or indirect beneficial ownership of more than 50% of the voting rights attached to the entire issued share capital of Luxco.
Forfeiture and Clawback. The Compensation Committee may in its sole discretion specify in an award or a policy that is incorporated into an award by reference that the participant’s rights, payments, and benefits with respect to such award will be subject to reduction, cancellation, forfeiture or recoupment upon the occurrence of certain specified events, in addition to any otherwise applicable vesting or performance conditions contained in such award. Such events may include, but are not limited to, termination of employment for cause, termination of the participant’s provision of services to us, breach of noncompetition, confidentiality, or other restrictive covenants that may apply to the participant, or restatement of our financial statements to reflect adverse results from those previously released financial statements as a consequence of errors, omissions, fraud, or misconduct.
Transferability. Unless otherwise determined by the Compensation Committee, no award granted under the Stock Incentive Plan will be transferable or assignable by a participant in the plan, other than by will or by the laws of descent and distribution.
Amendment and Termination. Our board of directors may amend, alter or discontinue the Stock Incentive Plan or any outstanding award, but no amendment, alteration or discontinuance will be made (1) without the approval of our stockholders, to the extent such approval is required by or desirable to satisfy the requirements of any applicable law, regulation or other rule, including listing standards of the securities exchange that is the principal market for the shares of our common stock or (2) without the consent of a participant, if such action would materially and adversely affect any of the rights of the participant under any award theretofore granted to such participant under the Stock Incentive Plan; provided, however, that the Compensation Committee may amend the Stock Incentive Plan in such manner as it deems necessary to permit the Stock Incentive Plan and/or any outstanding awards to satisfy applicable requirements of the Code or other applicable laws.
122
Table of Contents
Federal Income Tax Consequences
Under present federal tax laws, awards under the Stock Incentive Plan have the following consequences:
| • | The grant of an option does not by itself result in the recognition of taxable income to an option recipient nor entitle us to a tax deduction at the time of such grant. |
| • | The exercise of an option which is an “incentive stock option” within the meaning of Section 422 of the Code generally does not, by itself, result in the recognition of taxable income to an option recipient nor entitle us to a deduction at the time of such exercise. However, the difference between the option exercise price and the fair market value of our common stock on the date of option exercise is an item of tax preference which may, in certain situations, trigger the alternative minimum tax for an option recipient. An option recipient recognizes capital gain or loss upon resale of the shares of our common stock received pursuant to the exercise of incentive stock options, provided that such shares are held for at least one year after transfer of the shares or two years after the grant of the option, whichever is later. Generally, if the shares are not held for that period, the option recipient recognizes ordinary income upon disposition in an amount equal to the difference between the option exercise price and the fair market value of our common stock on the date of exercise, or, if less, the sales proceeds of the shares acquired pursuant to the option. |
| • | The exercise of a non-incentive stock option results in the recognition of ordinary income by the option recipient on the date of exercise in an amount equal to the difference between the exercise price and the fair market value of our common stock acquired pursuant to the option. To the extent permitted by the Compensation Committee, the option recipient may elect to pay a portion or all of the resulting taxes by (i) delivery of shares, if such shares have been held by the option recipient for a required period of time, or (ii) with respect to minimum withholding amounts, shares with a fair market value equal to the amount withheld by us from any shares that would otherwise have been received by the option recipient (i.e. through a “net settlement” of such minimum tax withholding due). |
| • | We are allowed a tax deduction for federal tax purposes equal to the amount of ordinary income recognized by an option recipient at the time the option recipient recognizes such ordinary income. |
| • | Stock awards awarded under the Stock Incentive Plan are generally taxable to the recipient at the time that such awards become earned and non-forfeitable, based upon the fair market value of such stock at the time of such vesting. Alternatively, a recipient may make an election pursuant to Section 83(b) of the Code within 30 days of the date of the transfer of such stock award to elect to include in gross income for the current taxable year the fair market value of such award. Such election must be filed with the Internal Revenue Service within 30 days of the date of the transfer of the stock award. We are allowed a tax deduction for federal tax purposes as a compensation expense equal to the amount of ordinary income recognized by a recipient of stock awards and any payments related to dividends at the time the recipient recognizes taxable ordinary income. |
| • | Stock appreciation rights do not have federal income tax consequences for us or for recipients at the time of grant. When a stock appreciation right is exercised, the fair market value of the shares of common stock delivered in settlement of the stock appreciation right is included in the recipient’s gross income for federal income tax purposes, and we may be entitled to claim a federal tax deduction for a like amount. |
Section 162(m) of the Code imposes a $1 million cap on federal income tax deduction for compensation paid to our Chief Executive Officer and to certain other highly compensated officers during any fiscal year unless the compensation is “performance-based” under Section 162(m) of the Code. Under a special exception, any compensation paid pursuant to a compensation plan in existence before the effective date of this initial public offering will not be subject to the $1 million limitation until the earliest of: (i) the expiration of the compensation plan, (ii) a material modification of the compensation plan (as determined under Section 162(m) of the Code), (iii) the issuance of all the employer stock and other compensation allocated under the compensation plan, or (iv) the first meeting of stockholders at which directors are elected after the close of the third calendar year following
123
Table of Contents
the year in which the public offering occurs. We anticipate that both the Stock Incentive Plan and the Annual Incentive Plan (described below) will be eligible for this exception. However, to the extent Section 162(m) of the Code does apply, the Stock Incentive Plan and the Annual Incentive Plan (described below) have been designed to comply with the performance-based compensation exceptions available under Section 162(m) of the Code.
Executive Annual Incentive Plan
The following description of the Nielsen Holdings Executive Annual Incentive Plan, or the “Annual Incentive Plan”, is not complete and is qualified by reference to the full text of the Annual Incentive Plan, which has been filed as an exhibit to the registration statement of which this prospectus forms a part. Our board of directors intends to adopt the Annual Incentive Plan, and receive approval of such plan by our stockholders, prior to the effective date of this offering.
Purpose. The Annual Incentive Plan is a bonus plan designed to attract, retain, motivate and reward participants by providing them with the opportunity to earn competitive compensation directly linked to our performance.
Administration. The Annual Incentive Plan is to be administered and interpreted by the Compensation Committee. However, our board of directors may take any action delegated to the Compensation Committee under the Annual Incentive Plan as it deems necessary. The Compensation Committee may delegate its authority under the Annual Incentive Plan, except in cases where such delegation would disqualify compensation paid under the Annual Incentive Plan intended to be exempt under Section 162(m) of the Code.
Eligibility; Awards. Awards may be granted to our officers and key employees in the sole discretion of the Compensation Committee. The Annual Incentive Plan provides for the payment of incentive bonuses in the form of cash, or, at the sole discretion of the Compensation Committee, in awards under the Stock Incentive Plan. For performance-based bonuses intended to comply with the performance-based compensation exemption under Section 162(m) of the Code, by no later than the end of the first quarter of a given performance period (or such, the Compensation Committee will establish such target incentive bonuses for each individual participant in the Annual Incentive Plan. However, the Compensation Committee may in its sole discretion grant such bonuses, if any, to such participants as the Compensation Committee may choose, in respect of any given performance period, that is not intended to comply with the performance-based exemption under Section 162(m) of the Code. No participant may receive a bonus under the Annual Incentive Plan, with respect of any fiscal year, in excess of $7,500,000.
Performance Goals. The Compensation Committee will establish the performance periods over which performance objectives will be measured. A performance period may be for a fiscal year or a shorter period, as determined by the Compensation Committee. No later than the last day of the first quarter of a given performance period begins (or such other date as may be required or permitted by Section 162(m) of the Code to the extent applicable to us and the Annual Incentive Plan), the Compensation Committee will establish (1) the performance objective or objectives that must be satisfied for a participant to receive a bonus for such performance period, and (2) the target incentive bonus for each participant. Performance objective(s) will be based upon one or more of the following criteria, as determined by the Compensation Committee: (i) consolidated income before or after taxes (including income before interest, taxes, depreciation and amortization); (ii) EBITDA; (iii) adjusted EBITDA, (iv) operating income; (v) net income; (vi) adjusted cash net income; (vii) adjusted cash net income per share; (viii) net income per share; (ix) book value per share; (x) return on members’ or stockholders’ equity; (xi) expense management; (xii) return on investment; (xiii) improvements in capital structure; (xiv) profitability of an identifiable business unit or product; (xv) maintenance or improvement of profit margins; (xvi) stock price; (xvii) market share; (xviii) revenue or sales; (xiv) costs; (xx) cash flow; (xxi) working capital; (xxii) multiple of invested capital; (xxiii) total return; and (xxiv) such other objective performance criteria as determined by the Compensation Committee in its sole discretion to the extent permitted by Section 162(m) of the Code. The foregoing criteria may relate to us, one or more of our subsidiaries or one or more of our divisions or units, or any combination of the foregoing, and may be applied on an absolute
124
Table of Contents
basis and/or be relative to one or more peer group companies or indices, or any combination thereof, all as the Compensation Committee will determine. The performance measures and objectives established by the Compensation Committee may be different for different fiscal years and different objectives may be applicable to different officers and key employees.
As soon as practicable after the applicable performance period ends, the Compensation Committee will (x) determine (i) whether and to what extent any of the performance objective(s) established for such performance period have been satisfied and certify to such determination, and (ii) for each participant employed as of the date on which bonuses under the plan are payable, unless otherwise determined by the Compensation Committee (to the extent permitted under Section 162(m) of the Code, to the extent applicable to us and the Annual Incentive Plan), the actual bonus to which such participant will be entitled, taking into consideration the extent to which the performance objective(s) have been met and such other factors as the Compensation Committee may deem appropriate and (y) cause such bonus to be paid to such participant. The Compensation Committee has absolute discretion to reduce or eliminate the amount otherwise payable to any participant under the Annual Incentive Plan and to establish rules or procedures that have the effect of limiting the amount payable to each participant to an amount that is less than the maximum amount otherwise authorized as that participant’s target incentive bonus.
To the extent permitted under Section 162(m) of the Code, to the extent applicable to us and the Annual Incentive Plan, unless otherwise determined by the Compensation Committee, if a participant is hired or rehired by us after the beginning of a performance period (or such corresponding period if the performance period is not a fiscal year) for which a bonus is payable, such participant may, if determined by the Compensation Committee, receive an annual bonus equal to the bonus otherwise payable to such participant based upon our actual performance for the applicable performance period or, if determined by the Compensation Committee, based upon achieving targeted performance objectives pro-rated for the days of employment during such period or such other amount as the Compensation Committee may deem appropriate.
Forfeiture and Clawback. In addition to any otherwise applicable conditions under the Annual Incentive Plan, the Compensation Committee may, in its sole discretion, but acting in good faith, direct that we recover all or a portion of any bonus payable under the Annual Incentive Plan upon the occurrence of a breach of noncompetition, confidentiality or other restrictive covenants that may apply to a participant, or the restatement of our financial statements to reflect adverse results from those previously released financial statements, as a consequence of errors, omissions, fraud, or misconduct.
Change in Control. If there is a change in control (as defined in the Stock Incentive Plan, as described above), the Compensation Committee, as constituted immediately prior to the change in control, will determine in its sole discretion whether and to what extent the performance criteria have been met or will be deemed to have been met for the year in which the change in control occurs and for any completed performance period for which a determination under the plan has not been made.
Termination of Employment. If a participant dies or becomes disabled prior to date on which bonuses under the Annual Incentive Plan for the applicable performance period are payable, the participant may receive an annual bonus equal to the bonus otherwise payable to the participant based on actual company performance for the applicable performance period or, if determined by the Compensation Committee, based upon achieving targeted performance objectives, pro-rated for the days of employment during the performance period. Unless otherwise determined by the Compensation Committee, if a participant’s employment terminates for any other reason, such participant will not receive a bonus.
Payment of Awards. Payment of any bonus amount is made to participants as soon as is practicable after the Compensation Committee certifies that one or more of the applicable performance objectives has been attained or after the Compensation Committee determines the amount of such bonus. All payments thus made will be in accordance with or exempt from the requirements of Section 409A of the Code.
125
Table of Contents
Amendment and Termination of Plan. Our board of directors or the Compensation Committee may at any time amend, suspend, discontinue or terminate the Annual Incentive Plan, subject to stockholder approval if such approval is necessary to continue to qualify the amounts payable under the Annual Incentive Plan under Section 162(m) of the Code if such amounts are intended to be so qualified; provided, that no such amendment, suspension, discontinuance or termination will adversely affect the rights or any participant in respect of any fiscal year that has already begun. Unless earlier terminated, the Annual Incentive Plan will expire on the day immediately prior to our first shareholder meeting at which directors are to be elected that occurs after the close of the third calendar year following the calendar year in which the initial public offering of the company occurs.
Director Compensation
2009 Compensation
During most of 2009, the Supervisory Board of The Nielsen Company B.V. consisted of twelve members. Ten of the 12 members are representatives of the Original Sponsors and received no compensation for their services as board members. The other two members (or their affiliate) received annual compensation as follows:
| Member of the Supervisory Board. |
$ | 57,200 | |
| Member of the Audit Committee. |
$ | 11,440 |
The following table presents information regarding the compensation paid or accrued during 2009 to members or their affiliates of the Supervisory Board of The Nielsen Company B.V.
| Name |
Fees Earned or Paid in Cash as a Member of Supervisory Board ($) |
Fees Earned or Paid in Cash as a Member of the Audit Committee ($) |
Total ($) | ||||||
| Gerald S. Hobbs |
$ | 57,200 | $ | 11,440 | $ | 68,640 | |||
| Dudley G. Eustace(1) |
$ | 107,250 | — | $ | 107,250 | ||||
| Michael S. Chae |
— | — | — | ||||||
| Patrick Healy |
— | — | — | ||||||
| Iain Leigh |
— | — | — | ||||||
| Alexander Navab |
— | — | — | ||||||
| Scott Schoen |
— | — | — | ||||||
| James A. Attwood |
— | — | — | ||||||
| Richard J. Bressler |
— | — | — | ||||||
| Clive Hollick(2) |
— | — | — | ||||||
| James A. Quella(3) |
— | — | — | ||||||
| James Kilts(4) |
$ | 57,200 | — | $ | 57,200 | ||||
| Robert Pozen(5) |
— | — | — | ||||||
| Robert Reid(6) |
— | — | — | ||||||
| Eliot Merrill |
— | — | — | ||||||
| Simon Brown(7) |
— | — | — | ||||||
| Javier G. Teruel(8) |
— | — | — | ||||||
Payments for members of the Supervisory Board of The Nielsen Company B.V. are paid in Euros but converted to US$ above at a rate of 1 EUR = $1.43 which is the average exchange rate for 2009.
| (1) | Mr. Eustace resigned as Chairman and member of the Supervisory Board effective May 21, 2009. In connection with his resignation, he received a payment of $85,800 representing the amount otherwise payable to him had he continued as Chairman and member for the remainder of his expected term as well as the proportionate amount he was owed for services rendered in 2009. |
| (2) | Resigned effective February 9, 2009. |
126
Table of Contents
| (3) | Resigned effective September 22, 2009. |
| (4) | Mr. Kilts was elected Chairman of the Supervisory Board of The Nielsen Company B.V. effective May 21, 2009. |
| (5) | Mr. Pozen became a member of the Supervisory Board effective May 1, 2010. Mr. Pozen was also appointed to the Audit Committee of the Supervisory Board. Effective May 1, 2010, as a member of the board, Mr. Pozen receives an annual retainer of $60,000. The Company will pay a meeting fee of $2,000 for each meeting of the board over the five regularly scheduled meetings. As a member of the Audit Committee, Mr. Pozen receives an annual retainer of $10,000. The Company will also issue annually a number of stock options having a value, as determined by the Company, of $100,000, which will be issued on the date of appointment at the fair market value as of such date, will vest in four quarterly installments, and will have a term of ten years from the date of grant. Mr. Pozen will also receive a one-time grant of 10,000 restricted stock units to fully vest in 18 months. |
| (6) | Elected September 22, 2009. |
| (7) | Elected February 9, 2009. |
| (8) | Mr. Teruel became a member of the Supervisory Board effective August 13, 2010. Mr. Teruel is also expected to be appointed to the Audit Committee of the Supervisory Board as of September 30, 2010. Effective August 13, 2010, as a member of the board, Mr. Teruel receives an annual retainer of $60,000. The Company will pay a meeting fee of $2,000 for each meeting of the board over the five regularly scheduled meetings. As a member of the Audit Committee, Mr. Teruel will receive an annual retainer of $10,000. The Company will also issue annually a number of stock options having a value, as determined by the Company, of $100,000, which will be issued on the date of appointment, or as soon as practicable thereafter, at the fair market value as of such date, will vest in four quarterly installments, and will have a term of ten years from the date of grant. |
Director Compensation After This Offering
Dutch law requires the stockholders to adopt a general compensation policy applicable to the board of directors of Nielsen Holdings and covering, among other things, fixed and variable compensation and stock option plans. Prior to the consummation of this offering, we expect our stockholders to have adopted such a general policy. Upon Conversion, we expect that our articles of association will provide, consistent with applicable Dutch law, that the board may decide on the individual compensation applicable to our directors, within the framework permitted by the approved general compensation policy. In making its decision, our board will be assisted by the compensation committee. The executive director will not participate in the board’s discussion regarding his compensation. To the extent the board decides to include in the compensation package for directors a stock option plan, then such plan (at an aggregated level for all directors stating the number of options that may be granted and the material terms) is subject to the approval of our stockholders. Prior to consummation of this offering, we expect our stock option plan applicable to our executive director to have been approved by our stockholders.
After the completion of this offering, each of our non-executive directors who are not affiliated with the Original Sponsors will receive an annual cash retainer of $60,000. Members of the audit committee, the compensation committee and the nomination and corporate governance committee who are not affiliated with the Original Sponsors will each receive annual compensation of $10,000, $5,000 and $5,000, respectively, and the chairperson of each of these committees will receive annual compensation of $15,000, $10,000 and $10,000 respectively. Non-executive directors who are not affiliated with the Original Sponsors will receive $2,000 of additional compensation for each meeting attended in excess of five meetings in one year. We will also issue annually to each of our non-executive directors who are not affiliated with the Original Sponsors a number of stock options having a value, as determined by the Company, of $100,000, which will be issued on the date of appointment, or as soon as practicable thereafter, with an exercise price equal to the fair market value on the date of issuance. These options will vest in four quarterly installments and will have a term of seven years from the date of grant.
127
Table of Contents
The following table sets forth certain information regarding beneficial ownership of Nielsen Holdings’s capital stock as of June 30, 2010 with respect to:
| • | each person or group of affiliated persons known by Nielsen to own beneficially more than 5% of the outstanding shares of any class of its capital stock, together with their addresses; |
| • | each of Nielsen’s directors; |
| • | each of Nielsen’s Named Officers; and |
| • | all directors and nominees and executive officers as a group. |
Investment funds associated with or designated by the Sponsors own shares of Nielsen Holdings indirectly through their holdings in Luxco. As of June 30, 2010, Luxco owned 433,194,313 shares (or approximately 95%) of the common stock of Nielsen Holdings. Upon the completion of this offering, it is anticipated Luxco will own % of the common stock of Nielsen Holdings. The Named Officers own shares of Nielsen Holdings directly.
Percentage computations are based on 442,192,538 shares of our common stock outstanding as of June 30, 2010, 13,632,663 vested options to purchase shares of common stock as of that date and shares of common stock expected to be outstanding following this offering, including the shares of our common stock offered by us hereby, or shares of common stock, including shares of common stock offered hereby, if the underwriters exercise their option in full. As of June 30, 2010, there were 341 holders of record of our common stock.
| Name of Beneficial Owner |
Shares of Common Stock Beneficially Owned Prior to this Offering |
Percentage of Common Stock Beneficially Owned Prior to this Offering |
Percentage of Common Stock Beneficially Owned After this Offering | |||||||
| With Option(1) |
Without Option(2) | |||||||||
| AlpInvest Partners(3) |
(3 | ) | 6.58 | % | ||||||
| The Blackstone Group(4) |
(4 | ) | 19.33 | % | ||||||
| The Carlyle Group(5) |
(5 | ) | 19.33 | % | ||||||
| Hellman & Friedman(6) |
(6 | ) | 9.31 | % | ||||||
| Kohlberg Kravis Roberts & Co.(7) |
(7 | ) | 19.63 | % | ||||||
| Thomas H. Lee Partners(8) |
(8 | ) | 19.63 | % | ||||||
| James A. Attwood, Jr. |
— | — | ||||||||
| Richard J. Bressler |
— | — | ||||||||
| Simon Brown |
— | — | ||||||||
| Michael S. Chae |
— | — | ||||||||
| Patrick Healy |
— | — | ||||||||
| Gerald S. Hobbs |
— | — | ||||||||
| James M. Kilts(9) |
— | — | ||||||||
| Iain Leigh |
— | — | ||||||||
| Eliot Merrill |
— | — | ||||||||
| Alexander Navab |
— | — | ||||||||
| Robert Pozen |
— | * | ||||||||
| Robert Reid |
— | — | ||||||||
| Scott A. Schoen |
— | — | ||||||||
| Javier G. Teruel |
— | — | ||||||||
| David L. Calhoun(10) |
5,675,000 | 1.2 | % | |||||||
| Susan Whiting(10) |
731,250 | * | ||||||||
| Roberto Llamas(10) |
425,625 | * | ||||||||
| Brian West(10) |
584,375 | * | ||||||||
| Mitchell Habib(10) |
588,438 | * | ||||||||
| All Directors and Executive Officers as a Group (22 persons) |
9,546,393 | 2.1 | % | |||||||
128
Table of Contents
| * | less than 1% |
| (1) | Assumes the underwriters exercise their option to purchase an additional shares of our common stock in full. |
| (2) | Assumes the underwriters do not exercise their option to purchase additional shares of our common stock. |
| (3) | AlpInvest Partners CS Investments 2006 C.V. (“Investments 2006”) beneficially owns 27,805 ordinary shares of Luxco (“Ordinary Shares”) and 8,962,078 Yield Free Convertible Preferred Equity Certificates of Luxco (“YFCPECs”). The YFCPECs are convertible into ordinary shares of Luxco at any time at the option of Luxco or at the option of the holders thereof. The general partner of Investments 2006 is AlpInvest Partners 2006 B.V., whose managing director is AlpInvest Partners N.V. (“AlpInvest NV”). AlpInvest NV, by virtue of the relationships described above, may be deemed to have voting or investment control with respect to the shares held by Investments 2006. AlpInvest NV disclaims beneficial ownership of such shares. AlpInvest Partners Later Stage Co-Investments IIA C.V. (“LS IIA CV”) beneficially owns 280 Ordinary Shares and 50,666 YFCPECs. AlpInvest Partners Later Stage Co-Investments Custodian IIA B.V. (“LS IIA BV”) holds the shares as a custodian for LS IIA CV. The general partner of LS IIA CV is AlpInvest Partners Later Stage Co-Investments Management IIA B.V., whose managing director is AlpInvest NV. AlpInvest NV, by virtue of the relationships described above, may be deemed to have voting or investment control with respect to the shares held by LS IIA BV. AlpInvest NV disclaims beneficial ownership of such shares. The address of each of the entities and persons identified in this footnote is Jachthavenweg 118, 1081 KJ Amsterdam, the Netherlands. |
| Volkert Doeksen, Paul de Klerk, Wim Borgdorff and Erik Thyssen, in their capacities as managing directors of AlpInvest NV, effectively have the power to exercise voting and investment control over the shares held by Investments 2006 and LS IIA BV when two of them act jointly. Each of Messrs. Doeksen, De Klerk, Borgdorff and Thyssen disclaims beneficial ownership of such shares. |
| (4) | Blackstone Capital Partners (Cayman) V L.P. (“BCP V”) beneficially owns 38,695 Ordinary Shares and 12,418,075 YFCPECs. Blackstone Family Investment Partnership (Cayman) V L.P. (“BFIP V”) beneficially owns 1,220 Ordinary Shares and 390,752 YFCPECs. Blackstone Family Investment Partnership (Cayman) V-SMD L.P. (“BFIP V-SMD”) beneficially owns 2,745 Ordinary Shares and 880,769 YFCPECs. Blackstone Participation Partnership (Cayman) V L.P. (“BPPV”) beneficially owns 250 Ordinary Shares and 80,442 YFCPECs. Blackstone Capital Partners (Cayman) V-A, L.P. (“BCP V-A”) beneficially owns 35,830 Ordinary Shares and 11,496,981 YFCPECs. BCP (Cayman) V-S L.P. (“BCP V-S”) beneficially owns 3,070 Ordinary Shares and 984,684 YFCPECs. BCP V Co-Investors (Cayman) L.P. (“BCPVC” and, collectively with BCP V, BFIP V, BFIP V-SMD, BPPV, BCP V-A and BCP V-S, the “Blackstone Funds”) beneficially owns 620 Ordinary Shares and 198,728 YFCPECs. Blackstone Management Associates (Cayman) V, L.P. (“BMA”) is the general partner of each of the Blackstone Funds. Blackstone LR Associates (Cayman) V Ltd. (“BLRA”) is the general partner of BMA and may, therefore, be deemed to have shared voting and investment power over the Ordinary Shares and YFCPECs of Luxco. Mr. Stephen A. Schwarzman is director and controlling person of BLRA and as such may be deemed to share beneficial ownership of the Ordinary Shares and YFCPECs of Luxco controlled by BLRA. Mr. Schwarzman disclaims beneficial ownership of such shares. The address of each of the Blackstone Funds, BMA and BLRA is c/o Walkers SPV Limited, P.O. Box 908 GT, George Town, Grand Cayman. The address of each of Mr. Schwarzman is c/o The Blackstone Group, 345 Park Avenue, New York, NY 10154. |
| (5) | Carlyle Partners IV Cayman, L.P. (“CP IV”) beneficially owns 64,970 Ordinary Shares and 20,847,394 YFCPECs. CP IV’s general partner is TC Group IV Cayman, L.P., whose general partner is CP IV GP, Ltd., which is wholly owned by TC Group Cayman Investment Holdings, L.P. CP IV Coinvestment Cayman, L.P (“CPIV Coinvest”) beneficially owns 2,620 Ordinary Shares and 841,958 YFCPECs. CPIV Coinvest’s general partner is TC Group IV Cayman, L.P., whose general partner is CP IV GP, Ltd., which is wholly owned by TC Group Cayman Investment Holdings, L.P. CEP II Participations S.à r.l. SICAR (“CEP II P”) beneficially owns 14,840 Ordinary Shares and 4,761,076 YFCPECs (the Ordinary Shares and YFCPECs beneficially owned by CP IV, CPIV Coinvest and CEP II P are collectively referred to as the “Carlyle Shares”). CEP II P is directly or indirectly owned by Carlyle Europe Partners II, L.P., whose general partner is CEP II Managing GP, L.P., whose general partner is CEP II Managing GP Holdings, Ltd,, which is wholly owned by TC Group Cayman Investment Holdings, L.P. The general partner of TC Group Cayman Investment Holding, L.P. is TCG Holdings Cayman II, L.P. The general partner of TCG Holdings Cayman II, L.P. is DBD Cayman Limited, a Cayman Islands exempted limited liability company. DBD Cayman Limited has investment discretion and dispositive power over the Carlyle Shares. DBD Cayman Limited is controlled by its Class A members, William E. Conway, Jr., Daniel A. D’Aniello and David M. Rubenstein and all action relating to the investment and disposition of the Carlyle Shares requires their approval. William E. Conway, Jr., Daniel A. D’Aniello and David M. Rubenstein each disclaim beneficial ownership |
129
Table of Contents
| of the Carlyle Shares. Pursuant to an agreement between DBD Cayman Limited and its Class B member, Carlyle Offshore Partners II Limited, voting power over the Carlyle Shares is held by Carlyle Offshore Partners II, Limited. Carlyle Offshore Partners II Limited has 13 members, each of whom disclaims beneficial ownership of the Carlyle Shares. The address of CEP II P is 2 Avenue Charles de Gaulle, Luxembourg L-1653, Luxembourg; the address of William E. Conway, Jr., Daniel A. D’Aniello and David M. Rubenstein is c/o The Carlyle Group, 1001 Pennsylvania Ave., NW, Suite 220 South, Washington, D.C. 20004; the address of all other entities listed is c/o Walker Corporate Services Limited, Walker House, Mary Street, George Town, Grand Cayman KY-1-9005 Cayman Islands. |
| (6) | The Luxco shares shown as owned by Hellman & Friedman Investors V (Cayman), Ltd. are owned of record by (i) Hellman & Friedman Capital Partners V (Cayman), L.P., which owns 34,801 Ordinary Shares and 11,191,867 YFCPECs, (ii) Hellman & Friedman Capital Partners V (Cayman Parallel), L.P., which owns 4,874 Ordinary Shares and 1,537,166 YFCPECs, and (iii) Hellman & Friedman Capital Associates V (Cayman), L.P., which owns 10 Ordinary Shares and 6,359 YFCPECs. Hellman & Friedman Investors V (Cayman), Ltd. is the sole general partner of Hellman & Friedman Capital Associates V (Cayman), L.P. and Hellman & Friedman Investors V (Cayman), L.P. Hellman & Friedman Investors V (Cayman), L.P., in turn, is the sole general partner of each of Hellman & Friedman Capital Partners V (Cayman), L.P. and Hellman & Friedman Capital Partners V (Cayman Parallel), L.P. Hellman & Friedman Investors V (Cayman), Ltd. is owned and controlled by 12 shareholders, none of whom own more than 9.9% of Hellman & Friedman Investors V (Cayman), Ltd. Hellman & Friedman Investors V (Cayman), Ltd. has formed a five-member investment committee (the “Investment Committee”) that serves at the discretion of the company’s Board of Directors and makes recommendations to the Board with respect to matters presented to it. Members of the Investment Committee are F. Warren Hellman, Brian M. Powers, Philip U. Hammarskjold, Patrick J. Healy and Thomas F. Steyer. Each of the members of the Investment Committee and the shareholders of Hellman & Friedman Investors V (Cayman), Ltd. disclaim beneficial ownership of any Luxco shares beneficially owned by Hellman & Friedman Investors V (Cayman), Ltd. except to the extent of their pecuniary interest therein. Mr. Healy serves as a Managing Director of Hellman & Friedman LLC, an affiliate of Hellman & Friedman Investors V (Cayman), Ltd., is a shareholder of Hellman & Friedman Investors V (Cayman), Ltd. and is a member of the Investment Committee. The address of Hellman & Friedman Capital Partners V (Cayman), Ltd. is c/o Walkers SPV Limited, Walker House, 87 Mary Street, Georgetown, Grand Cayman KY1-9005, Cayman Islands. |
| (7) | KKR VNU Equity Investors, L.P. beneficially owns 13,655 Ordinary Shares and 4,455,265 YFCPECs and is controlled by its general partner, KKR VNU GP Limited. KKR VNU GP Limited is wholly-owned by KKR VNU (Millennium) Limited (“KKR VNU Limited”). KKR VNU (Millennium), L.P. beneficially owns 69,946 Ordinary Shares and 22,400,186 YFCPECs and is controlled by its general partner, KKR VNU Limited. Voting and investment control over the securities beneficially owned by KKR VNU Limited is exercised by its board of directors consisting of Messrs. Alexander Navab, Simon E. Brown and William J. Janetschek, who may be deemed to share beneficial ownership of any shares beneficially owned by KKR VNU Limited but disclaim such beneficial ownership. KKR Millenium Fund (Overseas), L.P. (“Millenium Fund”) beneficially owns 84 Ordinary Shares, and is controlled by its general partner, KKR Associates Millennium (Overseas), Limited Partnership, which is controlled by its general partner, KKR Millennium Limited. KKR Associates Millennium (Overseas), Limited Partnership also holds a majority of the equity interests of KKR VNU Limited. |
Each of KKR SP Limited (“KKR SP”) (as the voting partner of KKR Associates Millennium (Overseas), Limited Partnership); KKR Fund Holdings L.P. (“KKR Fund Holdings”) (as the sole shareholder of KKR Millennium Limited); KKR Fund Holdings GP Limited (“KKR Fund Holdings GP”) (as a general partner of KKR Fund Holdings); KKR Group Holdings L.P. (“KKR Group Holdings”) (as the sole shareholder of KKR Fund Holdings GP and a general partner of KKR Fund Holdings); KKR Group Limited (“KKR Group”) (as the general partner of KKR Group Holdings); KKR & Co. L.P. (“KKR & Co.”) (as the sole shareholder of KKR Group); and KKR Management LLC (“KKR Management”) (as the general partner of KKR & Co.) may also be deemed to be the beneficial owner of the securities held by Millennium Fund, KKR VNU (Millennium) L.P. and KKR VNU Equity Investors, L.P., KKR SP, KKR Fund Holdings, KKR Fund Holdings GP, KKR Group Holdings, KKR Group, KKR & Co. and KKR Management disclaim beneficial ownership of such securities.
As the designated members of KKR Management, Messrs. Henry R. Kravis and George R. Roberts may be deemed to be the beneficial owner of the securities held by Millennium Fund, KKR VNU (Millennium) L.P. and KKR VNU Equity Investors, L.P. but disclaim beneficial ownership of such securities. The principal business address of each of the entities and persons identified in this footnote except Mr. Roberts is c/o Kohlberg Kravis Roberts & Co. L.P., 9 West 57th Street, New York, New York, 10019. The principal business office for Mr. Roberts is c/o Kohlberg Kravis Roberts & Co. L.P., 2800 Sand Hill Road, Suite 200, Menlo Park, CA 94025.
130
Table of Contents
| (8) | The Luxco shares shown as owned by Thomas H. Lee Partners are owned of record by (i) Thomas H. Lee (Alternative) Fund VI, L.P. (“Alternative Fund VI”), Thomas H. Lee (Alternative) Parallel Fund VI, L.P. (“Alternative Parallel VI”) and Thomas H. Lee (Alternative) Parallel (DT) Fund VI, L.P. (“Alternative DT VI”); (ii) THL Equity Fund VI Investors (VNU), L.P., THL Equity Fund VI Investors (VNU) II, L.P., THL Equity Fund VI Investors (VNU) III, L.P. and THL Equity Fund VI Investors (VNU) IV, LLC; (iii) THL (Alternative) Fund V, L.P. (“Alternative Fund V”), Thomas H. Lee (Alternative) Parallel Fund V, L.P. (“Alternative Parallel V”) and Thomas H. Lee (Alternative) Cayman Fund V, L.P. (“Alternative Cayman V”) and (iv) THL Coinvestment Partners, L.P., Thomas H. Lee Investors Limited Partnership, Putnam Investments Holdings, LLC, Putnam Investments Employees’ Securities Company I LLC, Putnam Investments Employees’ Securities Company II LLC and Putnam Investments Employees’ Securities Company III LLC. THL Advisors (Alternative) VI, L.P. (“Advisors VI”) is the general partner of each of (a) Alternative Fund VI, which beneficially owns 24,920 Ordinary Shares and 7,996,953 YFCPECs, (b) Alternative Parallel VI, which beneficially owns 16,870 Ordinary Shares and 5,415,112 YFCPECs; and (c) Alternative DT VI, which beneficially owns 2,950 Ordinary Shares and 945,911 YFCPECs. Advisors VI is also the general partner of each of (x) THL Equity Fund VI Investors (VNU), L.P., which beneficially owns 17, 275 Ordinary Shares and 5,543,158 YFCPECs, (y) THL Equity Fund VI Investors (VNU) II, L.P. which beneficially owns 180 Ordinary Shares and 57,904 YFCPECs and (z) THL Equity Fund VI Investors (VNU) III, L.P., which beneficially owns 265 Ordinary Shares and 85,133 YFCPECs. Advisors VI is the managing member of THL Equity Fund VI Investors (VNU) IV, LLC, which beneficially owns 930 Ordinary Shares and 298,732 YFCPECs. Thomas H. Lee Advisors (Alternative) VI, Ltd. (“Advisors VI Ltd.”) is the general partner of Advisors VI and may, therefore, be deemed to have shared voting and investment power over the Ordinary Shares and YFCPECs of Luxco held by each of these entities. The address of each of these entities is c/o Walkers, Walker House, Mary Street, GeorgeTown, Grand Cayman, Cayman Islands, other than THL Equity Fund VI Investors (VNU) IV, LLC whose address is c/o Thomas H. Lee Partners, L.P., 100 Federal Street, Boston, Massachusetts 02110. THL Advisors (Alternative) V, L.P. (“Advisors V”) is the general partner of each of (a) Alternative Fund V, which beneficially owns 15,225 Ordinary Shares and 4,885,230 YFCPECs; (b) Alternative Parallel V, which beneficially owns 3,950 Ordinary Shares and 1,267,521 YFCPECs and (c) Alternative Cayman V, which beneficially owns 210 Ordinary Shares and 67,312 YFCPECs. Thomas H. Lee Advisors (Alternative) V Limited LDC (“LDC”) is the general partner of Advisors V and may, therefore, be deemed to have shared voting and investment power over the Ordinary Shares and YFCPECs held by each of these entities. The address of each of these entities is c/o Walkers, Walker House, Mary Street, GeorgeTown, Grand Cayman, Cayman Islands. Advisors VI Ltd. and LDC each have in excess of 15 stockholders or members, respectively, with no such stockholder or member controlling more than 8% of the vote. The controlling stockholders or members (the “Managing Directors”) are Anthony J. DiNovi, Scott A. Schoen, Scott M. Sperling, Seth W. Lawry, Thomas M. Hagerty, Kent R. Weldon, Todd M. Abbrecht, Charles A. Brizius, Scott L. Jaeckel, Soren L. Oberg and George Taylor, each of whom disclaims beneficial ownership of the Ordinary Shares and YFCPECs. The address of each of the Managing Directors is c/o Thomas H. Lee Partners, L.P., 100 Federal Street, Boston, Massachusetts 02110. THL Coinvestment Partners, L.P. beneficially owns 45 Ordinary Shares and 14,671 YFCPECs. Thomas H. Lee Investors Limited Partnership beneficially owns 295 Ordinary Shares and 94,680 YFCPECs. Each of THL Coinvestment Partners, L.P. and Thomas H. Lee Investors Limited Partnership are indirectly controlled by the Managing Directors, each of whom disclaims beneficial ownership of the Ordinary Shares and YFCPECs. The address of each of THL Coinvestment Partners, L.P. and Thomas H. Lee Investors Limited Partnership is c/o Thomas H. Lee Partners, L.P., 100 Federal Street, Boston, Massachusetts 02110. Putnam Investments Holdings, LLC beneficially owns 250 Ordinary Shares and 79,486 YFCPECs; Putnam Investments Employees’ Securities Company I LLC beneficially owns 105 Ordinary Shares and 33,204 YFCPECs; Putnam Investments Employees’ Securities Company II LLC beneficially owns 90 Ordinary Shares and 29,646 YFCPECs and Putnam Investments Employees’ Securities Company III LLC beneficially owns 125 Ordinary Shares and 40,799 YFCPECs. Each of these entities is contractually obligated to coinvest alongside either Thomas H. Lee (Alternative) Fund VI, L.P. or Thomas H. Lee (Alternative) Fund V, L.P. Therefore, Advisors VI and LDC may be deemed to have shared voting and investment power over the Ordinary Shares and YFCPECs held by these entities. The address for each of these entities is One Post Office Square, Boston, Massachusetts 02109. |
| (9) | Centerview Capital, L.P. (“Centerview Capital”) beneficially owns 3,860 Ordinary Shares and 1,237,025 YFCPECs. Centerview Employees, L.P. (“Centerview Employees”) beneficially owns 185 Ordinary Shares and 60,018 YFCPECs. The general partner of Centerview Capital is Centerview Capital GP, L.P., whose general partner is Centerview Capital GP LLC (“Centerview Capital GP”). The general partner of Centerview Employees is Centerview Capital GP. The sole member of Centerview Capital GP is Centerview Partners Holdings LLC (“Centerview Partners”). Centerview VNU LLC (“Centerview VNU”) |
131
Table of Contents
| beneficially owns 1,010 Ordinary Shares and 324,261 YFCPECs. The managing member of Centerview VNU is Centerview Partners. Centerview Partners, by virtue of the relationships described above, may be deemed to have voting or investment control with respect to the shares held by Centerview Capital, Centerview Employees and Centerview VNU. Centerview Partners disclaims beneficial ownership of such shares. The address of each of the entities and persons identified in this footnote is 31 West 52nd Street, New York, New York 10019. Centerview Partners has formed an investment committee (the “Centerview Investment Committee”) that has the power to exercise voting and investment control over the shares held by Centerview Capital, Centerview Employees and Centerview VNU. The members of the Centerview Investment Committee are Adam D. Chinn, Blair W. Effron, David M. Hooper, James M. Kilts and Robert A. Pruzan. Each of the members of the Centerview Investment Committee and the members of Centerview Partners disclaims beneficial ownership of such shares. Centerview Capital beneficially owns options to acquire 810,667 shares of common stock of Nielsen Holdings. |
Centerview Employees beneficially owns options to acquire 39,333 shares of common stock of Nielsen Holdings. The general partner of Centerview Capital is Centerview Capital GP, L.P., whose general partner is Centerview Capital GP. The general partner of Centerview Employees is Centerview Capital GP. The sole member of Centerview Capital GP is Centerview Partners. Centerview Partners, by virtue of the relationships described above, may be deemed to have voting or investment control with respect to the options held by Centerview Capital and Centerview Employees. Centerview Partners disclaims beneficial ownership of such options. The address of each of the entities and persons identified in this footnote is 31 West 52nd Street, New York, New York 10019. The Centerview Investment Committee has the power to exercise voting and investment control over the options held by Centerview Capital and Centerview Employees. Each of the members of the Centerview Investment Committee and the members of Centerview Partners disclaims beneficial ownership of such options.
| (10) | The addresses for Messrs. Calhoun, West, Llamas, Habib and Ms. Whiting is c/o The Nielsen Company B.V., 770 Broadway, New York, NY 10003 and 45 Danbury Road, Wilton, CT 06897. |
132
Table of Contents
CERTAIN RELATIONSHIPS AND RELATED PARTY TRANSACTIONS
Shareholders’ Agreement
In connection with the Acquisition and related financing transactions, investment funds associated with or designated by the Original Sponsors acquired, indirectly, shares of Nielsen. On December 21, 2006, investment funds associated with or designated by the Original Sponsors and Nielsen, Valcon Acquisition Holding (Luxembourg) S.à r.l. (“Luxco”) and Valcon entered into a shareholders’ agreement. The shareholders’ agreement contains agreements among the parties with respect to, among other matters, the election of the members of the supervisory board of The Nielsen Company B.V., restrictions on the issuance or transfer of securities (including tag-along rights, drag-along rights and public offering rights) and other special corporate governance provisions (including the right to approve various corporate actions and control committee composition). The shareholders’ agreement also provides for customary registration rights.
The shareholders’ agreement is expected to be amended and restated on or prior to the completion of this offering. The amended and restated shareholders’ agreement to be entered into in connection with this offering will provide our Original Sponsors with the contractual right to nominate for appointment one or more designees to our board of directors based on their percentage of stock ownership. Initially, the Original Sponsors will have the right to nominate for appointment the following number of directors: one director from AlpInvest Partners, two from The Blackstone Group, two from The Carlyle Group, one from Hellman & Friedman, two from Kohlberg Kravis Roberts & Co. and two from Thomas H. Lee Partners. In the event that the Sponsors collectively hold 50% or less of the then outstanding shares of our common stock, the Original Sponsors will have the right to nominate for appointment the following number of directors: one director each from The Blackstone Group, The Carlyle Group, Hellman & Friedman, Kohlberg Kravis Roberts & Co. and Thomas H. Lee Partners plus five additional directors who must be independent directors within the meaning of the corporate governance rules of the NYSE, which will be selected by AlpInvest Partners and one each by the four Original Sponsors owning the largest percentage of our common stock. In the event that the Sponsors collectively hold less than 25% of the then outstanding shares of our common stock, each Original Sponsor that owns at least 3% of the then outstanding shares of our common stock will have the right to nominate one director and each Original Sponsor that owns less than 3% will no longer have the right to nominate any directors.
Please see “Management—Board Structure” for further information regarding the appointment, suspension and dismissal of directors.
Investment Agreement
On November 6, 2006, Centerview Partners, the investment funds associated with or designated by the Original Sponsors, Luxco and Valcon entered into an investment agreement. The investment agreement contains agreements among the parties with respect to, among other matters, the purchase by Centerview Partners of approximately $50 million of new or existing securities issued by Luxco, the exercise of voting rights associated with the securities, the election of Mr. Kilts to the supervisory boards of Nielsen, Nielsen Finance Co. and Nielsen Finance LLC, restrictions on the transfer of securities and rights in connection with the sale or issuance of securities (including tag-along rights, drag-along rights and public offering rights). Since the investment by Centerview Partners, it has transferred all of the securities of Luxco that it purchased under the investment agreement to Centerview VNU LLC, which in turn has transferred a portion of the securities to Centerview Capital, L.P. and Centerview Employees, L.P. Centerview VNU LLC, Centerview Capital, L.P. and Centerview Employees, L.P. are investment funds associated with Centerview Partners.
On or prior to the completion of this offering, the investment agreement is expected to be amended and restated.
Registration Rights Agreement
On or prior to the completion of this offering, we expect to enter into a registration rights agreement with each of the Original Sponsors and Luxco. Pursuant to this registration rights agreement, the Original Sponsors
133
Table of Contents
will collectively have the right to an unlimited number of demand registrations, which may be exercised (i) at any time and from time to time after the expiration of the lock-up agreements described under “Shares Eligible for Future Sale—Lock-Up Agreements” and within two years following this offering by 50% or more of the voting interest of Luxco, (ii) at any time and from time to time thereafter but within three years following this offering by 33 1/3% or more of the voting interest of Luxco or (iii) at any time and from time to time by any Original Sponsor thereafter. Pursuant to such demand registration rights, we are required to register the shares of common stock beneficially owned by them directly or through Luxco with the Securities and Exchange Commission for sale by them to the public, provided that any demand that will result in the imposition of a lock-up on us and the Sponsors may not be made unless the shares requested to be sold by the demanding stockholders in such offering have an aggregate market value of at least $ million. In addition, in the event that we are registering additional shares of common stock for sale to the public, whether on our own behalf or on behalf of the Original Sponsors or other stockholders with registration rights, the Original Sponsors will have piggyback registration rights providing them the right to have us include the shares of common stock owned by them in any such registration. In each such event, we are required to pay the registration expenses.
Advisory Agreements
TNC (US) Holdings, Inc. is party to an advisory agreement with Valcon pursuant to which affiliates of the Sponsors provide management services on behalf of Valcon, including to support and assist management with respect to analyzing and negotiating acquisitions and divestitures, preparing financial projections, analyzing and negotiating financing alternatives, monitoring of compliance with financing agreements and searching and hiring executives. Pursuant to such agreement, Valcon receives a quarterly management fee equal to (i) $0.875 million per fiscal quarter for our fiscal year 2006 and (ii) for each fiscal year after 2006, an amount per fiscal quarter equal to 105% of the quarterly fee for the immediately preceding fiscal year, and reimbursement for reasonable travel and other out-of-pocket expenses incurred by Valcon or its designees and the affiliates of the Sponsors in connection with the provision of services under the advisory agreement. The advisory agreement also provides that Valcon may be entitled to receive fees in connection with certain financing, acquisition, disposition and change in control transactions based on terms and conditions customary for transactions of similar size and scope. The advisory agreement includes exculpation and indemnification provisions in favor of Valcon and the affiliates of the Sponsors. The advisory services referred to in the advisory agreement are provided by affiliates of the Sponsors and accordingly the fees received by Valcon that are described above are paid to such affiliates of the Sponsors under the terms of a similar advisory agreement among the affiliates of the Sponsors and Valcon.
ACN Holdings, Inc. is party to an advisory agreement with Valcon pursuant to which the affiliates of the Sponsors provide management services on behalf of Valcon. Pursuant to such agreement, Valcon receives a quarterly management fee equal to (i) $0.875 million per fiscal quarter for our fiscal year 2006 and (ii) for each fiscal year after 2006, an amount per fiscal quarter equal to 105% of the quarterly fee for the immediately preceding fiscal year, and reimbursement for reasonable travel and other out-of-pocket expenses incurred by Valcon and the affiliates of the Sponsors in connection with the provision of services under the advisory agreement. The advisory agreement also provides that Valcon may be entitled to receive fees in connection with certain financing, acquisition, disposition and change in control transactions based on terms and conditions customary for transactions of similar size and scope. The advisory agreement includes customary exculpation and indemnification provisions in favor of Valcon and the affiliates of the Sponsors. The advisory services referred to in the advisory agreement are provided by the Sponsors and accordingly the fees received by Valcon that are described above are paid to such affiliates of the Sponsors under the terms of a similar advisory agreement among the affiliates of the Sponsors and Valcon.
The Company recorded $6 million, $12 million, $11 million, $11 million and $7 million, respectively, in SG&A related to these management fees, sponsor travel and consulting for the six months ended June 30, 2010 and for the years ended December 31, 2009, 2008, 2007 and 2006, respectively. From the date of acquisition through June 30, 2010, we have paid $47 million in these fees to the Sponsors.
134
Table of Contents
The advisory agreements are expected to be terminated upon completion of the offering. The advisory agreements provide that upon the consummation of a change in control transaction or an initial public offering in excess of $200 million, each of the Sponsors will receive, in lieu of quarterly payments of the annual management fee, a fee equal to the net present value of the aggregate annual management fee that would have been payable to the Sponsors during the remainder of the term of the agreements (assuming an eight year term of the agreements), calculated using the treasury rate having a final maturity date that is closest to the eighth anniversary of the date of the agreements. Accordingly, upon the completion of this offering, we anticipate that we will pay a fee of approximately $103 million to the Sponsors in connection with the termination of such advisory agreements in accordance with their terms.
Sponsor-Held Debt
A portion of the borrowings under the senior secured credit facility have been purchased by certain of the Sponsors in market transactions not involving the Company. Based on information made available to the Company, amounts held by the Sponsors and their affiliates were $554 million and $445 million as of December 31, 2009 and 2008, respectively. Interest expense associated with amounts held by the Sponsors and their affiliates approximated $16 million, $22 million and $28 million during the years ended December 31, 2009, 2008 and 2007, respectively. At June 30, 2010, $527 million of the senior secured credit facilities and $22 million of senior debenture loans were held by the Sponsors and their affiliates. Of the $549 million of debt held by the Sponsors and their affiliates, Kohlberg Kravis Roberts & Co. and their affiliates held $236 million, The Blackstone Group and their affiliates held $198 million and The Carlyle Group and their affiliates held $115 million.
Equity Healthcare Arrangement
Effective January 1, 2009, we entered into an employer health program arrangement with Equity Healthcare LLC (“Equity Healthcare”). Equity Healthcare negotiates with providers of standard administrative services for health benefit plans and other related services for cost discounts, quality of service monitoring, data services and clinical consulting and oversight by Equity Healthcare. Because of the combined purchasing power of its client participants, Equity Healthcare is able to negotiate pricing terms from providers that are believed to be more favorable than the companies could obtain for themselves on an individual basis. Equity Healthcare is an affiliate of The Blackstone Group with whom Messrs. Chae and Reid, members of the board of directors of the Company and the Supervisory Board of The Nielsen Company B.V., are affiliated and in which they may have an indirect pecuniary interest.
In consideration for Equity Healthcare’s provision of access to these favorable arrangements and its monitoring of the contracted third parties’ delivery of contracted services to us, we pay Equity Healthcare a fee
of $2 per participating employee per month (“PEPM Fee”). As of December 31, 2009, we had approximately 8,000 employees enrolled in our self-insured health benefit plans in the United States. Equity Healthcare may also receive a fee (“Health Plan Fees”) from one or more of the health plans with whom Equity Healthcare has contractual arrangements if the total number of employees joining such health plans from participating companies exceeds specified thresholds.
Scarborough Research
We and Scarborough Research, a joint venture with Arbitron, entered into various related party transactions in the ordinary course of business. We and our subsidiaries provide various services to Scarborough Research, including data collection, accounting, insurance administration, and the rental of real estate. We pay royalties to Scarborough Research for the right to include Scarborough Research data in our products sold directly to our customers. Additionally, we sell various Scarborough Research products directly to our clients, for which we receive a commission from Scarborough Research. The net cash payments from Scarborough Research to us as a result of these transactions were $9 million, $9 million and $15 million for the years ended December 31, 2009,
135
Table of Contents
2008 and 2007, respectively. Obligations between us and Scarborough Research are net settled in cash on a monthly basis in the ordinary course of business; at June 30, 2010 and at December 31, 2009 and 2008, the related amounts outstanding were not significant.
Review, Approval or Ratification of Certain Transactions with Related Persons
We have a written code of conduct, applicable to directors, officers and employees that prohibits any action, investment or other interest that might interfere, or be thought to interfere, with the exercise of their judgment in our best interests. The types of transactions that will be covered by the code include financial and other transactions, arrangements or relationships in which we or any of our subsidiaries are a participant and in which any related person, including directors, officers and employees, have an interest.
Where a related party transaction could result in a conflict of interest, it will be reviewed and approved by our legal and human resources department and, where appropriate and material in nature, our Audit Committee.
Only those related party transactions that are consistent with our best interests will be approved. In making this determination, all available and relevant facts and circumstance will be considered, including the benefits to us, the impact of the transaction on the related party’s independence, the availability of other sources of comparable products or services, the terms of the transaction and the terms available from unrelated third parties.
Director Independence
Except for Messrs. Hobbs, Pozen and Teruel, each of whom would be considered independent under the listing rules of the NYSE, our directors are not independent pursuant to such rules because of their respective affiliations with the Company’s principal stockholders.
136
Table of Contents
2006 Senior Secured Credit Facilities
General
On August 9, 2006, we entered into our senior secured credit agreement with Citibank, N.A., as Administrative Agent, Swing Line Lender and L/C Issuer, ABN AMRO Bank N.V., as Swing Line Lender, Deutsche Bank Securities Inc., as Syndication Agent, JPMorgan Chase Bank, N.A., ABN AMRO Bank N.V. and ING Bank N.V., as Co-Documentation Agents and Citigroup Global Markets Inc., Deutsche Bank Securities Inc. and J.P. Morgan Securities Inc., as Co-Lead Arrangers and Joint Bookrunners, which was subsequently amended and restated on June 23, 2009. The senior secured credit agreement provides for two facilities of $2,983 million and €321 million maturing in 2013 and two facilities of $1,013 million and €179 million maturing in 2016 (collectively, the “2006 Term Facilities”), for which total outstanding borrowings were $4,501 million at June 30, 2010. In addition, the senior secured credit agreement contains a six-year $688 million senior secured revolving credit facility (the “Revolving Facility” and, together with the 2006 Term Facilities, the “2006 Senior Secured Credit Facilities”) under which we had no borrowings outstanding as of June 30, 2010. We had an aggregate of $19 million of letters of credit and bank guarantees outstanding as of June 30, 2010, which reduced our total borrowing capacity to $669 million.
In addition, we may request one or more incremental term loan facilities and/or increase commitments under our Revolving Facility, subject to certain conditions and receipt of commitments by existing or additional financial institutions or institutional lenders.
All borrowings under our Revolving Facility are subject to the satisfaction of customary conditions, including the absence of a default and the accuracy of representations and warranties. Loans under our Revolving Facility are available in multiple currencies and to multiple borrowers.
On August 12, 2010, we completed a term loan extension offer in accordance with the terms of our 2006 Senior Secured Credit Facilities. In connection with completing the term loan extension offer and in order to document the terms of the new class C term loans, as of such date we entered into an amendment to the 2006 Senior Secured Credit Facilities. Pursuant to the term loan extension offer and the 2010 Amendment, approximately $1.495 billion of our class A term loans (which mature May 2013) and approximately $5 million of our class B term loans (which mature May 2016) were exchanged for the same principal amount of new class C term loans. The new class C term loans mature on May 1, 2016 and bear a tiered floating interest rate of LIBOR plus a margin of (x) 3.75% to the extent that Nielsen Finance LLC’s Total Leverage Ratio (as defined in the 2006 Senior Secured Credit Facilities) is greater than 5.0 to 1.0 and (y) 3.50% to the extent that Nielsen Finance LLC’s Total Leverage Ratio (as defined in the 2006 Senior Secured Credit Facilities) is less than or equal to 5.0 to 1.0. The foregoing margins are also subject to a decrease of 0.25% in the event and for so long as Nielsen Finance LLC’s corporate credit and/or family rating, as applicable, from either S&P or Moody’s is at least Ba3 or BB-, respectively. The class C term loans will amortize in equal quarterly installments in aggregate annual amounts equal to 1.00% of the original principal amount. No optional prepayments of class C term loans may be made so long as any class A or class B term loans are outstanding. Except as set forth in the 2010 Amendment, the class C term loans shall have the same terms as the class B term loans.
Interest and Fees
Borrowings under the 2006 Term Facilities bear interest at a rate, as determined by the type of borrowing, equal to either (a) a base rate determined by reference to the higher of (1) the federal funds rate plus 0.5% or (2) the prime rate or (b) a LIBOR rate for the currency of such borrowing (collectively, the “Base Rate”), plus, in each case, an applicable margin. The applicable margins for the class A 2006 Term Facilities that mature in 2013 vary depending on our secured leverage ratio. The applicable margin for the class B 2006 Term Facilities that mature in 2016 is fixed. The applicable margins for the new class C term loans are tiered as set forth above.
137
Table of Contents
Borrowings under the Revolving Facility bear interest at a rate equal to an applicable margin plus the Base Rate. The applicable margins for the Revolving Facility vary depending on our total leverage ratio.
In addition, on the last day of each calendar quarter we are required to pay each lender (i) a commitment fee in respect of any unused commitments under the Revolving Facility equal to 0.375% or 0.50% depending on our total leverage ratio and (ii) a letter of credit fee in respect of the aggregate face amount of outstanding letters of credit under the Revolving Facility, which ranges from 1.50% to 2.25%, depending on our total leverage ratio.
Prepayments
Subject to exceptions, our 2006 Senior Secured Credit Facilities require mandatory prepayments of term loans in amounts equal to:
| • | 50% (as may be reduced based on our ratio of consolidated total net debt to consolidated EBITDA) of our annual excess cash flow (as defined in the credit agreement governing our 2006 Senior Secured Credit Facilities) less any voluntary prepayments made during the year; |
| • | 100% (as may be reduced based on our ratio of consolidated total net debt to consolidated EBITDA) of the net cash proceeds of all non-ordinary course asset sales or other dispositions of property, subject to reinvestment rights and certain other exceptions; and |
| • | 100% of the net cash proceeds from certain incurrences of debt. |
We may voluntarily prepay outstanding loans under the 2006 Senior Secured Credit Facilities at any time without premium or penalty, other than customary breakage costs with respect to Eurocurrency loans. No optional prepayments of class C term loans may be made and no mandatory prepayments of class C term loans with proceeds of a permitted debt offering are required so long as any class A or class B term loans are outstanding.
Amortization of Principal
Our class B 2006 Term Facilities which mature in 2016 require scheduled quarterly payments of 0.25% of their original principal amount, with the remaining amount payable on their maturity date. Our new class C 2006 Term Facilities which mature in 2016 will amortize in equal quarterly installments in aggregate annual amounts equal to 1.00% of the original principal amount. Our class A 2006 Term Facilities which mature in 2013 have no early scheduled amortization, and are fully due on their maturity date.
Collateral and Guarantors
Our 2006 Senior Secured Credit Facilities are guaranteed by The Nielsen Company B.V., substantially all of our wholly owned U.S. subsidiaries and certain of our non-U.S. wholly-owned subsidiaries, and are secured by substantially all of the existing and future property and assets (other than cash) of Nielsen’s U.S. subsidiaries and by a pledge of substantially all of the capital stock of the guarantors, the capital stock of substantially all of Nielsen’s U.S. subsidiaries, and up to 65% of the capital stock of certain of Nielsen’s non-U.S. subsidiaries. Under a separate security agreement, substantially all of the assets of Nielsen are pledged as collateral for amounts outstanding under the 2006 Senior Secured Credit Facilities.
Restrictive Covenants and Other Matters
Our 2006 Senior Secured Credit Facilities require that Nielsen Holding and Finance B.V., TNC (US) Holdings Inc., ACN Holdings, Inc. and VNU International B.V. and their restricted subsidiaries (collectively, the “Credit Facilities Covenant Parties”) comply on a quarterly basis with a maximum consolidated leverage ratio test and minimum interest coverage ratio test. In addition, our 2006 Senior Secured Credit Facilities include negative covenants, subject to significant exceptions, restricting or limiting the ability of the Credit Facilities Covenant Parties to, among other things:
| • | incur, assume or permit to exist additional indebtedness or guarantees; |
| • | incur liens and engage in sale and leaseback transactions; |
| • | make a loan, advance or capital contribution or purchase debt or equity securities or substantially all of the property and assets or business of another person or assets constituting a business unit, line of business or division; |
138
Table of Contents
| • | declare dividends, make payments or redeem or repurchase capital stock; |
| • | engage in mergers, acquisitions and other business combinations; |
| • | prepay, redeem or purchase subordinated indebtedness; |
| • | amend or otherwise alter terms of subordinated indebtedness; |
| • | sell or otherwise dispose of assets; |
| • | transact with affiliates; |
| • | enter into agreements limiting subsidiary distributions; and |
| • | alter the business that we conduct. |
Neither Nielsen Holdings nor The Nielsen Company B.V. is bound by any financial or negative covenants contained in the credit agreement.
The 2006 Senior Secured Credit Facilities also contain certain customary affirmative covenants and events of default.
2009 Senior Secured Term Loan
In June 2009, we entered into a Senior Secured Loan Agreement with Goldman Sachs Lending Partners, LLC, which provides for senior secured term loans in the aggregated principal amount of $500 million (the “New Term Loans”) bearing interest at a fixed rate of 8.50%. The New Term Loans are secured on a pari passu basis with our existing obligations under our 2006 Senior Secured Credit Facilities and have a maturity of eight years. The net proceeds from the issuance of the New Term Loans of approximately $481 million were used in their entirety to pay down the 2006 Term Facilities.
Prior to June 8, 2013, the borrowings under the New Term Loans may be voluntarily prepaid at 100% of the principal amount plus a make whole premium, plus accrued and unpaid interest. On and after June 8, 2013, we may voluntarily prepay the New Term Loans at the premiums set forth in the table below, plus accrued and unpaid interest:
| Period |
Premium | ||
| During the twelve months beginning on June 8, 2013 |
104.250 | % | |
| During the twelve months beginning on June 8, 2014 |
102.125 | % | |
| June 8, 2015 and thereafter |
100.000 | % |
We may be required to mandatorily prepay all or a portion of the New Term Loans with the proceeds from the sale of certain of our assets at a price equal to 100% of the principal amount. Upon the occurrence of a change of control, we must prepay the New Term Loans at a price equal to 101% of the aggregate principal amount of the New Term Loans.
Our New Term Loans are guaranteed by The Nielsen Company B.V., substantially all of our wholly owned U.S. subsidiaries and certain of our non-U.S. wholly-owned subsidiaries, and are secured by substantially all of the existing and future property and assets (other than cash) of Nielsen’s U.S. subsidiaries and by a pledge of substantially all of the capital stock of the guarantors, the capital stock of substantially all of Nielsen’s U.S. subsidiaries, and up to 65% of the capital stock of certain of Nielsen’s non-U.S. subsidiaries. Under a separate security agreement, substantially all of the assets of Nielsen are pledged as collateral for amounts outstanding under the New Term Loans.
In addition, the New Term Loans include negative covenants, subject to significant exceptions, restricting or limiting the ability of the Credit Facilities Covenant Parties to, among other things:
| • | incur, assume or permit to exist additional indebtedness or guarantees; |
| • | make certain loans and investments; |
139
Table of Contents
| • | declare dividends, make payments or redeem or repurchase capital stock; |
| • | engage in mergers, acquisitions and other business combinations; |
| • | prepay, redeem or purchase certain indebtedness; |
| • | sell certain assets; |
| • | transact with affiliates; and |
| • | enter into agreements limiting subsidiary distributions. |
Neither Nielsen Holdings nor The Nielsen Company B.V. is bound by any financial or negative covenants contained in the credit agreement.
The New Term Loans also contain certain customary affirmative covenants and events of default.
Senior Notes
General
On May 1, 2009, Nielsen Finance LLC and Nielsen Finance Co., subsidiaries wholly owned by us, consummated a private offering of $500 million aggregate principal amount of 11.5% Senior Notes due 2016 (the “11.5% Senior Notes”). The 11.5% Senior Notes mature on May 1, 2016. Cash interest accrues at a rate of 11.5% per annum from the issue date and is payable semi-annually from November 2009. In July 2009, we completed an exchange offer for the 11.5% Senior Notes.
In January 2009, Nielsen Finance LLC and Nielsen Finance Co. consummated a private offering of $330 million in aggregate principal amount of 11.625% Senior Notes due 2014 (the “11.625% Senior Notes”). The 11.625% Senior Notes mature on February 1, 2014. Cash interest accrues at a rate of 11.625% per annum from the issue date and is payable semi-annually from August 2009. In July 2009, we completed an exchange offer for the 11.625% Senior Notes.
On April 16, 2008, Nielsen Finance LLC and Nielsen Finance Co. consummated a private offering of $220 million aggregate principal amount of 10% Senior Notes due 2014 (the “10% Senior Notes”). The 10% Senior Notes mature on August 1, 2014. Cash interest accrues at a rate of 10% per annum from the issue date and is payable semi-annually from August 2008. In July 2009, we completed an exchange offer for the 10% Senior Notes.
In August 2006, Nielsen Finance LLC and Nielsen Finance Co. issued $650 million 10% Senior Notes due 2014 and €150 million 9% Senior Notes due 2014. Interest is payable semi-annually from February 2007. In September 2007, we completed an exchange offer for these notes.
The senior notes above are collectively referred to herein as the “Senior Notes.”
The carrying values of the combined issuances of the Senior Notes were $1,824 million at June 30, 2010. The Senior Notes are senior unsecured obligations and rank equal in right of payment to all of the existing and future senior indebtedness of Nielsen Finance LLC and Nielsen Finance Co.
Covenants
The indentures governing the Senior Notes limit Nielsen Holding and Finance B.V. and its restricted subsidiaries (which together constitute most of Nielsen’s subsidiaries) ability to incur additional indebtedness, pay dividends or make other distributions or repurchase our capital stock, make certain investments, enter into certain types of transactions with affiliates, use assets as security in other transactions and sell certain assets or merge with or into other companies subject to certain exceptions. Upon a change in control, Nielsen Finance LLC and Nielsen Finance Co. are required to make an offer to redeem all of the Senior Notes at a redemption
140
Table of Contents
price equal to the 101% of the aggregate accreted principal amount plus accrued and unpaid interest. The Senior Notes, together with the Senior Subordinated Discount Notes referred to below, are jointly and severally guaranteed by The Nielsen Company B.V., substantially all of our wholly owned U.S. subsidiaries, and certain of our non-U.S. wholly-owned subsidiaries.
Senior Subordinated Discount Notes
General
In connection with the Acquisition, Nielsen Finance LLC and Nielsen Finance Co. issued $1,070 million principal amount at maturity of 12 1/2% unsecured senior subordinated discount notes due 2016, or the Senior Subordinated Discount Notes. The Senior Subordinated Discount Notes mature on August 1, 2016. The Senior Subordinated Discount Notes were issued at a significant discount from their principal amount at maturity. The accreted value of the Senior Subordinated Discount Notes increases in value from the date of issuance until August 1, 2011 at a rate of 12 1/2% per annum, compounded semiannually. No cash interest will accrue on the Senior Subordinated Discount Notes until August 1, 2011. Cash interest will accrue at a rate of 12 1/2% per annum from August 1, 2011 and will be payable semiannually on February 1 and August 1 of each year commencing on February 1, 2012.
Covenants
Nielsen Finance LLC, Nielsen Finance Co., Nielsen Holdings & Finance B.V., VNU International B.V. and certain subsidiaries of Nielsen are subject to numerous restrictive covenants under the indenture governing the Senior Subordinated Discount Notes, including restrictive covenants with respect to liens, indebtedness, mergers, disposition of assets, acquisition of assets, dividends, transactions with affiliates, investments, agreements, and other customary covenants.
Events of Default
The Senior Subordinated Discount Notes are subject to customary events of default, including non-payment of principal or interest, violation of covenants, cross accelerations under other indebtedness and insolvency or certain bankruptcy events. The occurrence of an event of default could result in the acceleration of principal of the Senior Subordinated Discount Notes.
Nielsen Senior Discount Notes due 2016
In connection with the Acquisition, The Nielsen Company B.V. issued €343 million aggregate principal amount at maturity of 11 1/8% Senior Discount Notes due 2016, or the Senior Discount Notes. No cash interest will accrue on the Senior Discount Notes until August 1, 2011. Cash interest will accrue at a rate of 11 1/8% per annum from August 1, 2011 and will be payable semiannually on February 1 and August 1 of each year commencing on February 1, 2012. The Senior Discount Notes contain a covenant that generally restricts the creation of security over indebtedness which are in the form of securities with a principal amount greater than €15 million, a maturity greater than twelve months and that are or are intended to be listed on a stock market. The Senior Discount Notes contain customary events of default, including non-payment of principal, interest or fees and cross default to other indebtedness of The Nielsen Company B.V. or certain material subsidiaries, insolvency or bankruptcy of The Nielsen Company B.V. or certain material subsidiaries.
Euro Medium Term Note Program
We have a Euro Medium Term Note (“EMTN”) program in place under which no further debenture loans and private placements can be issued. All debenture loans and most private placements are quoted on the Luxembourg Stock Exchange. At June 30, 2010 and December 31, 2009, amounts with a carrying value of $145 million and $233 million, respectively, were outstanding under the EMTN program.
141
Table of Contents
Outstanding Nielsen Euro Medium Term Note Program Securities
| Amount |
Interest Rate |
Maturity | ||
| ¥4,000,000,000 |
2.50% | 2011 | ||
| €30,000,000 |
6.75% | 2012 | ||
| €25,000,000 |
Floating | 2012 | ||
| €25,000,000 |
Floating | 2012 | ||
| €50,000,000 |
Floating | 2010 |
In May 2010, our €50 million variable rate EMTN matured and was repaid.
142
Table of Contents
Unless stated otherwise, the following is a description of the material terms of our articles of association and board regulations as each is anticipated to be in effect upon our Conversion. We refer to our common stock and our cumulative preferred stock together as the “shares,” unless otherwise stated or indicated by context.
Share Capital
Authorized Share Capital
Our articles of association are expected to authorize three classes of shares in our capital stock consisting of our common stock and two separate series of cumulative preferred stock. Upon the completion of the Conversion, our authorized share capital will be as follows:
| Series |
Nominal value per share |
Number of shares authorized | ||
| Common stock |
EUR 0.04 | 2,000,000,000 | ||
| Cumulative preferred stock, Series PA |
EUR 0.04 | 100,000,000 | ||
| Cumulative preferred stock, Series PB |
EUR 0.04 | 100,000,000 |
Our Series PA cumulative preferred stock can be issued in any number of series as determined by our board, each one of which will constitute a separate class.
All of our authorized shares will, when issued and outstanding, be existing under Dutch law.
Issued Share Capital
As of June 30, 2010, we had 442,192,538 shares of common stock issued and outstanding, all of which are fully paid up. Each share confers the right to cast one vote, except for shares which are legally or economically held by the company or a subsidiary, or which are pledged to the company or a subsidiary or for which the company or a subsidiary has a right of usufruct.
No shares of cumulative preferred stock will be issued prior to the completion of the Conversion.
Issue of Shares
Our board of directors is expected to have the exclusive power to resolve to issue shares within the scope of the authorized share capital and to determine the price and further terms and conditions of such share issue, if and in so far as the board of directors has been designated by the general meeting of stockholders as the exclusive authorized corporate body for this purpose. A designation as referred to above will only be valid for a specific period of no more than five years and may from time to time be extended with a period of no more than five years. We expect that our board of directors will be designated for a period of five years as of the date of our Conversion as being exclusively competent to issue shares and grant rights to subscribe for shares in the amount of our authorized share capital. We expect that a proposal to renew this delegation will be included with the agenda for each annual general meeting for so long as we remain controlled by the Sponsors.
Pre-emptive rights
We expect that under our articles of association, existing holders of our shares of common stock will have pre-emptive rights in respect of future issuances of shares of common stock in proportion to the number of shares of common stock held by them, unless limited or excluded as described below. Holders of the cumulative preferred shares will not have pre-emptive rights in respect of any future issuances of share capital. Pre-emptive rights do not apply with respect to shares of common stock issued for non-cash consideration or with respect to
143
Table of Contents
shares of common stock issued to our employees or to employees of one of our group companies. Under our articles of association, we expect that our board of directors will have the power to limit or exclude any pre-emptive rights to which stockholders may be entitled, provided that it has been authorized by the general meeting of stockholders to do so. The authority of the board of directors to limit or exclude pre-emptive rights can only be exercised if at that time the authority of the board to issue shares is in full force and effect as described. The authority to limit or exclude pre-emptive rights may be extended in the same manner as the authority to issue shares. If there is no designation of the board of directors to limit or exclude pre-emptive rights in force, the stockholders will be able to limit or exclude such pre-emptive rights at a general meeting of stockholders.
As a matter of Dutch law, resolutions of the general meeting of stockholders (i) to limit or exclude pre-emptive rights or (ii) to designate the board of directors as the corporate body that has authority to limit or exclude pre-emptive rights, require at least a two-thirds majority of the votes cast in an meeting of stockholders, if less than 50% of the issued share capital is present or represented.
The rules relating to issuances of shares and pre-emptive rights as described above apply equally to the granting of rights to subscribe for shares, such as options and warrants, but not the issue of shares upon exercise of such rights.
As described under “—Issue of Shares” above, we expect that the authority to limit or exclude pre-emptive rights in connection with the issuance of shares of common stock will be delegated to the board of directors for a period of five years as of the date of the Conversion and subsequently renewed each year at the annual general meeting at least for so long as we remain a controlled company.
Form and Transfer of Shares
We expect that our shares will be issued either in bearer form or in registered form at the discretion of the board of directors. No share certificates will be issued for registered shares. Bearer share certificates will either be available in denominations of one share, five shares, ten shares, one hundred shares and denomination of such higher number of shares as the board of directors may determine or in the form of one global certificate, as the board of directors may determine. A register of stockholders will be maintained by us or by third parties upon our instruction.
Repurchase by the Company of its Shares
As a matter of Dutch law, a public company with limited liability (naamloze vennootschap) may acquire its own shares, subject to certain provisions of Dutch law and the articles of association, if (i) the company’s stockholders’ equity less the payment required to make the acquisition does not fall below the sum of paid and called up part of its capital and any reserves required to be maintained by Dutch law or the articles of association and (ii) after the acquisition of shares, the company and its subsidiaries would not hold, or hold as pledgees, shares having an aggregate par value that exceeds 50% of the company’s issued share capital. The company may only acquire its own shares if the general meeting of stockholders so resolves or resolves to grant the board of directors the authority to effect such acquisition, which authority can be delegated to the board of directors for a maximum period of 18 months. Upon the Conversion, we will be a Dutch public company with limited liability. We expect that, prior to the consummation of this offering, our stockholders will authorize the board of directors for a period of 18 months to acquire our own shares up to the maximum number allowed under Dutch law and that, at least so long as we remain a controlled company, such authorization will be renewed for 18 months at each annual general meeting.
If we repurchase any of our shares, no votes may be cast at a general meeting of stockholders on the treasury shares held by us or our subsidiaries. Nonetheless, the holders of a right of usufruct and the holders of a right of pledge in respect of shares held by us or our subsidiaries in our share capital are not excluded from the right to
144
Table of Contents
vote on such shares, if the right of usufruct or the right of pledge was granted prior to the time such shares were acquired by us or any of our subsidiaries. Neither we nor any of our subsidiaries may cast votes in respect of a share on which we or such subsidiary hold a right of usufruct or a right of pledge.
As of June 30, 2010, we owned 885,471 shares of our common stock.
Capital Reduction
Upon our Conversion, subject to Dutch law and our articles of association, our stockholders may resolve to reduce the outstanding share capital at a general meeting of stockholders by cancelling shares or by reducing the nominal value of the shares. In either case, this reduction would be subject to applicable statutory provisions. In order to be approved, a resolution to reduce the capital requires approval of a majority of the votes cast at a meeting of stockholders if at least half the issued capital is represented at the meeting or at least a two-thirds majority of the votes cast in a meeting of stockholders, if less than 50% of the issued share capital is present or represented. A resolution that would result in the reduction of capital requires prior or simultaneous approval of the meeting of each group of holders of shares of the same class whose shares are subject by the reduction. A resolution to reduce capital requires notice to the creditors of the company who have the right to object to the reduction in capital under specified circumstances.
Dividends and Other Distributions
We do not anticipate paying any cash dividends for the foreseeable future, and instead intend to retain future earnings, if any, for use in the operation and expansion of our business and in the repayment of our debt.
Our ability to pay dividends may be limited by covenants of any existing and future outstanding indebtedness we or our subsidiaries incur. Whether or not dividends will be paid in the future will depend on, among other things, our results of operations, financial condition, level of indebtedness, cash requirements, contractual restrictions and other factors that our board of directors may deem relevant. Profits will be available to be distributed as dividends only if and to the extent our board of directors decides not to allocate profits to our reserves. Subject to certain exceptions, dividends may only be paid out of profits as shown in our annual financial statements as adopted by the general meeting of stockholders. Distributions may not be made if the distribution would reduce stockholders’ equity below the sum of the paid-up and called up capital and any reserves required by Dutch law or our articles of association.
Out of profits (including the par value and any paid up share premium), dividends must first be paid on outstanding cumulative preferred stock in a sum of the amount paid upon such shares. The dividends paid on the cumulative preferred stock, Series PA, will be based on a percentage of the amount paid-up on those shares, which percentage is based on the average of the interest charged for cash loans with a term of months as set by during the financial year for which this distribution is made, increased by a maximum margin of ( ) basis points to be fixed upon the issuance of such shares by the board of directors. The maximum margin may vary for each individual series of cumulative preferred stock, Series PA.
Annual dividends to be payable on the cumulative preferred stock, Series PB, will be % per annum.
If and to the extent that profits are not sufficient to pay the dividends on the cumulative preferred stock in full, the shortfall may be paid out of the reserves (the “distributable reserves”), with the exception of any reserves that were formed as share premium reserves upon the issuance of such shares of cumulative preferred stock. If profits and the distributable reserves, in the aggregate, are insufficient to make the distributions on the cumulative preferred stock, no further distributions may be made to the holders of the cumulative preferred stock or the common stock until all such unpaid distributions have been made to the holders of the cumulative preferred stock.
145
Table of Contents
The profits remaining after payment of any dividends on cumulative preferred stock will be kept in reserve or distributed as determined by the board of directors. Insofar as the profits have not been distributed or allocated to reserves as specified above, they are at the free disposal of the general meeting of stockholders provided that no further dividends will be distributed on the cumulative preferred stock.
The general meeting of stockholders may resolve, on the proposal of the board of directors, to distribute dividends or reserves, wholly or partially, in the form of our shares of common stock.
The board may resolve on the distribution of an interim dividend provided the amount of such interim distribution does not exceed an amount equal to the amount of equity exceeding the issued share capital plus the mandatory reserves.
Distributions, as described above, will be payable 30 days from the date of declaration.
Distributions in cash that have not been collected within five years and one day after they have become due and payable will revert to the company.
Corporate Governance
The Dutch Corporate Governance Code
Upon the completion of this offering, the Dutch corporate governance code will apply to us. The code is based on a “comply or explain” principle. Accordingly, companies are required to disclose in their annual reports filed in the Netherlands whether or not they comply with the various rules of the Dutch corporate governance code that are addressed to the board of directors and, if they do not apply those provisions, to give the reasons therefor. The code contains principles and best practice provisions for the board of directors (executives and non-executives), stockholders and general meeting of stockholders, financial reporting, auditors, disclosure, compliance and enforcement standards.
We intend to make efforts to comply with the Dutch corporate governance code, but inasmuch as we will have our stock listed on a U.S. stock exchange, we intend to comply with the rules and regulations of the SEC and the stock exchange on which our stock is listed, which may conflict with the Dutch corporate governance code.
The Dutch corporate governance code provides that if the general meeting of stockholders explicitly approves the Company’s corporate governance structure and policy and endorses the explanation for any deviation from the principles and best practice provisions, such company will be deemed to have complied with the Dutch corporate governance code.
The following discussion summarizes the expected differences between our expected corporate governance structure following this offering and the principles and best practice provisions of the Dutch corporate governance code:
| • | Best practice provision III.8.4 of the code states that the majority of the members of the board shall be independent. With respect to our board of directors, non-executive directors will be independent. It is our view that given the nature of our business and the practice in our industry and considering our stockholder structure, it is justified that only non-executive directors will be independent. In addition, we will use the definition of “independent director” under the NYSE listing rules rather than the definition under the Dutch corporate governance code. |
| • | Pursuant to best practice provision IV.1.1, a general meeting of stockholders is empowered to cancel binding nominations of candidates for the board, and to dismiss members of the board by a simple majority of votes of those in attendance, although the company may require a quorum of at least one third of the voting rights outstanding. If such quorum is not represented, but a majority of those in attendance vote in favor of the proposal, a second meeting may be convened and its vote will be |
146
Table of Contents
| binding, even without a one-third quorum. Our articles of association are expected to provide that the general meeting of stockholders may at all times overrule a binding nomination by a resolution adopted by at least two-thirds majority of the votes cast, if such majority represents more than half of the issued share capital. Although a deviation from provision IV.1.1 of the Dutch corporate governance code, we hold the view that these provisions will enhance the continuity of the Company’s management and policies. |
| • | Best practice provision II.2.4 of the Dutch Corporate Governance Code provides that option grants to executive directors shall not be exercised in the first three years after the date of grant. Mr. Calhoun will be the only executive director on the Nielsen board of directors. Options have been granted to Mr. Calhoun on two separate occasions, once in 2006 and again in 2010. The options granted in 2006 vest 5% on the option grant date and 19% on each of the five anniversaries of December 31, 2006 and in certain cases only upon the achievement of certain performance targets. The grant in 2010 vests annually in three equal installments beginning December 31, 2010. These vesting schedules are not in accord with the best practice provisions of the Dutch Corporate Governance Code. However, it has been determined by the compensation committee that such grants align Mr. Calhoun’s interests with that of the Company’s stockholders and reflect a vesting schedule that is appropriate for Mr. Calhoun’s position in light of the competitive market for his services. |
| • | Best practice provision II.2.8 of the Dutch Corporate Governance Code provides that remuneration for an executive director in the event of his dismissal may not exceed one year’s salary. If the maximum of one year’s salary would be manifestly unreasonable for an executive board member who is dismissed during his first term of office, such board member shall be eligible for severance pay not exceeding twice the annual salary. As described under “Executive Compensation—Potential Payments upon Termination or Change in Control,” Mr. Calhoun’s severance pay exceeds those prescribed by the Dutch Corporate Governance Code. The Compensation Committee has determined that, notwithstanding the best practice provisions of the Dutch Corporate Governance Code, Mr. Calhoun’s severance is appropriate in light of his position with the Company and the competitive market for his services. |
| • | Best practice provisions III.7.1 and III.7.2 of the Dutch Corporate Governance provide that non-executive board members may not be granted any shares and/or rights to shares by way of remuneration and that any shares held by a non-executive board member in the Company must be long-term investments. Certain of our directors will receive annual grants of stock options consistent with best practices in the United States that we believe will better align the interests of our directors with that of our stockholders. |
| • | Best practice provision II.1.8 of the Dutch Corporate Governance Code provides that an executive director may not be a member of the supervisory board (or similar non-executive position) of more than two listed companies in addition to being an executive director of the company for which he serves as an executive director. We expect to comply with this provision following this offering, although our corporate governance guidelines will allow our executive director to serve on additional boards as a non-executive member where appropriate under the circumstances and where approved in advance by our nomination and corporate governance committee. |
| • | Best practice provisions III.5.6 and III.5.11 of the Dutch Corporate Governance Code provide that neither the audit committee nor the compensation committee may be chaired by the chairman of our board of directors or by a former executive director of the Company. There is no prohibition in our corporate governance guidelines or other governing documents that would prevent the chairman of our board of directors from also serving as the chairman of one of these committees if the board of directors deemed it appropriate under the circumstances. However, we expect to comply with these best practice provisions of the Dutch Code following this offering. |
| • | Best practice provisions III.3.5 and III.3.6 of the Dutch Corporate Governance Code provide that directors should be appointed for no more than three four-year terms and that the board of directors |
147
Table of Contents
| shall draw up a retirement schedule in order to avoid, as far as possible, a situation in which many non- executive directors retire at the same time. We do not believe in term limits for directors because they would deprive our board of directors of the service of directors who have developed, through valuable experience over time, an increasing insight into the Company and its operations. Consistent with the standards of corporate governance in the United States, directors will instead be appointed to one-year terms, without limit to the number of terms a director may serve. |
General Meeting of Stockholders: Procedures, Admission and Voting Rights
General meetings of stockholders will be held in the Netherlands. A general meeting of stockholders shall be held once a year within the periods required under Dutch law and the NYSE listing rules to convene a general meeting of stockholders. Extraordinary general meetings of stockholders may be held as frequently as they are called by the board of directors, or whenever one or more stockholders representing at least ten percent of our issued capital so request the board of directors in writing. Public notice of a general meeting of stockholders or an extraordinary meeting of stockholders must be given by the board of directors in accordance with Dutch law and the regulations of NYSE, where our common stock will be officially listed, and the rules and regulations of the Securities and Exchange Commission.
All stockholders are entitled to attend the general meetings of stockholders, to address the general meeting of stockholders and to vote, either in person or by appointing a proxy to act for them. In order to exercise the right to attend the general meetings of stockholders, to address the general meeting of stockholders and/or to vote at the general meetings of stockholders, stockholders must notify the Company in writing of their intention to do so, no later than on the day and at the place mentioned in the notice convening the meeting.
Each share of common stock is expected to confer the right to cast one vote at the general meeting of stockholders. Blank votes and invalid votes shall be regarded as not having been cast. Resolutions proposed to the general meeting of stockholders by the board of directors will be adopted by a simple majority of votes cast, unless another majority of votes or quorum is required by virtue of Dutch law or our articles of association.
Meetings of holders of shares of a particular class or classes will be held as frequently and whenever such meeting is required by virtue of any statutory regulation or any regulation in our articles of association. Such meeting may be convened by the board of directors or one or more stockholders, who jointly represent at least ten percent of the capital issued and outstanding in the shares of the class concerned.
Stockholder Suits
Generally, only a company can bring a civil action against a third party against whom such company alleges wrongdoing, including the directors and officers of such company. A stockholder will have an individual right of action against such a third party only if the tortious act also constitutes a tortious act directly against such stockholder. The Dutch Civil Code provides for the possibility to initiate such actions collectively. A foundation or an association whose objective is to protect the rights of a group of persons having similar interests may institute a collective action. The collective action cannot result in an order for payment of monetary damages but may result in a declaratory judgment. The foundation or association and the defendant are permitted to reach (often on the basis of such declaratory judgment) a settlement which provides for monetary compensation for damages. The Dutch Enterprise Chamber may declare the settlement agreement binding upon all the injured parties with an opt-out choice for an individual injured party. An individual injured party, within a period set by the Dutch Enterprise Chamber, may also individually institute a civil claim for damages if such injured party is not bound by a collective settlement.
Stockholder Vote on Certain Major Transactions
Under Dutch law, the approval of our general meeting of stockholders is required for any significant change in the identity or nature of our company or business, including in the case of (i) a transfer of all or substantially
148
Table of Contents
all of our business to a third party, (ii) the entry into or termination by us or one of our subsidiaries of a significant long-term cooperation with another entity, or (iii) the acquisition or divestment by us or one of our subsidiaries of a participating interest in the capital of a company having a value of at least one-third of the amount of our assets, as stated in our consolidated balance sheet in our latest adopted annual accounts.
Amendment of the Articles of Association
Following the Conversion, we expect that the articles of association will only be amended by our stockholders at the general meeting of stockholders at the proposal of the board of directors. A proposal to amend the articles of association whereby any change would be made in the rights of the holders of shares of a specific class in their capacity as such will require the prior approval of the meeting of holders of the shares of that specific class.
Dissolution, Merger/Demerger
Following the Conversion, the Company may be dissolved only by the stockholders at a general meeting of stockholders, upon the proposal of the board of directors.
The liquidation of the Company may be carried out by the board of directors, if and to the extent the stockholders have not appointed one or more liquidators at the general meeting of stockholders. The remuneration of the liquidators, if any, will be determined by the general meeting of stockholders.
Under Dutch law, a resolution to merge or demerge must be adopted in the same manner as a resolution to amend the articles of association. The general meeting of stockholders may upon the proposal of the board of directors resolve to merge or demerge by a simple majority of votes cast. If less than half of the issued share capital is present or represented at the general meeting of stockholders, a two-thirds majority vote is required.
Squeeze-out
In accordance with Dutch law, a stockholder who (together with members of its group, as such term is defined under Dutch law) for its own account holds at least 95% of a company’s issued capital may institute proceedings against the company’s other stockholders jointly for the transfer of their shares to the claimant. The proceedings are held before the Dutch Enterprise Chamber and are instituted by means of a writ of summons served upon the minority stockholders in accordance with the provisions of the Dutch Civil Code. The Dutch Enterprise Chamber may grant the claim for the squeeze-out in relation to all minority stockholders and will determine the price to be paid for the shares, if necessary after appointment of one or three experts who will offer an opinion to the Dutch Enterprise Chamber on the value of the shares. Once the order to transfer has become final, the acquiror must give written notice of the price, and the date on which and the place where the price is payable to the minority stockholders whose addresses are known to it. Unless all addresses are known to the acquiror, it will also publish the same in a Dutch daily newspaper with nationwide distribution in the Netherlands.
In the case of a public offer having been made for shares, Dutch law provides for a special squeeze-out procedure to be initiated in the period of three months after termination of the tender period. Following a public offer, the offeror can initiate proceedings if it has acquired at least 95% of issued capital and at least 95% of the total voting rights in the general meeting of the target company. This squeeze-out procedure also provides for a fair price presumption to the effect that the offer price of a voluntary offer is presumed to be a “fair” price for the squeeze out if 90% or more of the shares to which the public bid was extended were acquired pursuant to the offer. The Dutch Enterprise Chamber will determine the price to be paid by the offeror for squeeze-out purposes.
The same legislation also entitles each remaining minority stockholder to demand a squeeze out if the offeror has acquired at least 95% of the class of shares held by it, representing at least 95% of the total voting rights in that class. This procedure must be initiated with the Dutch Enterprise Chamber within three months after the end of the period for tendering shares in the public offer. The price for the shares is determined in accordance with the procedure described in the preceding paragraph.
149
Table of Contents
Dutch Financial Reporting Supervision Act and Dutch Market Abuse Regulation
Pursuant to the Dutch Financial Reporting Supervision Act (Wet toezicht financiële verslaggeving, the “FRSA”), the Netherlands Authority for the Financial Markets (Stichting Autoriteit Financiële Markten, the “AFM”) supervises the application of financial reporting standards by companies whose statutory seat is in the Netherlands and whose securities are listed on a regulated Dutch or foreign stock exchange. Under the FRSA, the AFM has an independent right to: (i) request an explanation from listed companies to which the FRSA applies regarding their application of financial reporting standards if, based on publicly known facts or circumstances, it has reason to doubt that their financial reporting meets the applicable standards; and (ii) recommend to such companies the publication of further explanations. If a listed company to which the FRSA applies does not comply with such a request or recommendation, the AFM may request that the Dutch Enterprise Chamber of the Amsterdam Court of Appeal (Ondernemingskamer van het Gerechtshof Amsterdam) order the company to: (i) prepare its financial reports in accordance with the enterprise chamber’s instructions; and (ii) provide an explanation of the way it has applied financial reporting standards to its financial reports.
The Dutch Financial Markets Supervision Act (Wet ophet financiële toezicht, the “FMSA”) also provides for specific rules intended to prevent market abuse, such as insider trading, tipping and market manipulation. The Company is subject to the Dutch insider trading prohibition (in particular, if it trades in its own shares or in financial instruments the value of which is (co)determined by the value of the shares), the Dutch tipping prohibition and the Dutch prohibition on market manipulation. The Dutch prohibition on market manipulation may mean that certain restrictions apply to the ability of the Company to buy-back its shares. In certain circumstances, the Company’s investors can also be subject to the Dutch market abuse rules.
Pursuant to the FMSA rules on market abuse, members of the board of directors and any other person who have (co)managerial responsibilities in respect of the Company or who have the authority to make decisions affecting the Company’s future developments and business prospects and who may have regular access to inside information relating, directly or indirectly, to the Company, must notify the AFM of all transactions with respect to the shares or in financial instruments the value of which is (co)determined by the value of the shares, conducted for its own account.
In addition, certain persons closely associated with members of the board of directors or any of the other persons as described above and designated by the FMSA Decree on Market Abuse (Besluit Marktmisbruik Wft) must also notify the AFM of any transactions conducted for their own account relating to the shares or in financial instruments the value of which is (co)determined by the value of the shares. The FMSA Decree on Market Abuse also covers the following categories of persons: (i) the spouse or any partner considered by national law as equivalent to the spouse, (ii) dependent children, (iii) other relatives who have shared the same household for at least one year at the relevant transaction date, and (iv) any legal person, trust or partnership whose, among other things, managerial responsibilities are discharged by a person referred to under (i), (ii) or (iii) above or by the relevant member of the board of directors or other person with any authority in respect of the Company as described above.
These notifications must be made by means of a standard form and by no later than the fifth business day following the transaction date. The notification may be postponed until the moment that the value of the transactions performed for that person’s own account, together with the transactions carried out by the persons closely associated with that person, reach or exceed an amount of €5,000 in the calendar year in question.
The AFM keeps a public register of all notification under the FMSA on its website (www.afm.nl). The information contained on, or accessible from, this website is not a part of this prospectus. Third parties can request to be notified automatically by e-mail of changes to this public register kept by the AFM.
Pursuant to the rules on market abuse, we will adopt prior to the consummation of this offering an internal insider trading regulation policy, which will be available on our website. This policy provides for, among other things, rules on the possession of and transactions by members of the board of directors and employees in the shares or in financial instruments the value of which is (co)determined by the value of the shares.
150
Table of Contents
Limitation on Directors’ Liability and Indemnification
Unless prohibited by law in a particular circumstance, upon our Conversion, our articles of association will require us to reimburse the members of the board of directors and the former members of the board of directors for damages and various costs and expenses related to claims brought against them in connection with the exercise of their duties. However, the Company will not be obligated to provide indemnification (i) if a Dutch court has established in a final and conclusive decision that the act or failure to act of the person concerned may be characterized as willful (opzettelijk), intentionally reckless (bewust roekeloos) or seriously culpable (ernstig verwijtbaar) conduct, unless Dutch law provides otherwise or this would, in view of the circumstances of the case, be unacceptable according to standards of reasonableness and fairness, (ii) for any action initiated by the indemnitee, other than actions brought to establish a right to indemnification or the advancement of expenses or actions authorized by the board of directors or (iii) for any expenses incurred by an indemnitee with respect to any action instituted by the indemnitee to interpret the indemnification provisions, unless the indemnitee is successful or the court finds that indemnitee is entitled to indemnification. We may enter into indemnification agreements with the members of the board of directors and our officers to provide for further details on these matters. We expect to purchase directors’ and officers’ liability insurance for the members of the board of directors and certain other officers.
At present, there is no pending litigation or proceeding involving any member of the board of directors, officer, employee or agent where indemnification will be required or permitted. We are not aware of any threatened litigation or proceeding that might result in a claim for such indemnification.
Insofar as indemnification of liabilities arising under the Securities Act 1933, as amended, may be permitted to members of the board of directors, officers or persons controlling us pursuant to the foregoing provisions, we have been informed that, in the opinion of the SEC, such indemnification is against public policy as expressed in the Securities Act 1933, as amended, and is therefore unenforceable.
Transfer Agent and Registrar
BNY Mellon Shareowner services is the transfer agent and registrar for our common stock.
Listing
We intend to list our common stock on the NYSE under the symbol “NLSN.”
151
Table of Contents
SHARES ELIGIBLE FOR FUTURE SALE
Prior to this offering, there has not been a public market for our common stock, and we cannot predict what effect, if any, market sales of shares of common stock or the availability of shares of common stock for sale will have on the market price of our common stock prevailing from time to time. Nevertheless, sales of substantial amounts of common stock, including shares issued upon the exercise of outstanding options, in the public market, or the perception that such sales could occur, could materially and adversely affect the market price of our common stock and could impair our future ability to raise capital through the sale of our equity or equity-related securities at a time and price that we deem appropriate.
Upon the closing of this offering, we will have outstanding an aggregate of approximately shares of common stock ( shares of common stock if the underwriters exercise their option to purchase additional shares). In addition, options to purchase an aggregate of approximately shares of our common stock will be outstanding as of the closing of this offering. Of these options, will have vested at or prior to the closing of this offering and approximately will vest over the next three to six years. Of the outstanding shares, the shares sold in this offering will be freely tradable without restriction or further registration under the Securities Act, except that any shares held by our affiliates, as that term is defined under Rule 144 of the Securities Act, may be sold only in compliance with the limitations described below. The remaining outstanding shares of common stock will be deemed restricted securities, as defined under Rule 144. Restricted securities may be sold in the public market only if registered or if they qualify for an exemption from registration under Rule 144 under the Securities Act, which we summarize below.
The restricted shares and the shares held by our affiliates will be available for sale in the public market as follows:
| • | shares will be eligible for sale at various times after the date of this prospectus pursuant to Rule 144; and |
| • | shares subject to the lock-up agreements will be eligible for sale at various times beginning 180 days after the date of this prospectus pursuant to Rule 144. |
Certain management stockholders are subject to a management stockholder’s agreement that restricts, subject to certain exceptions, including pursuant to an effective registration statement, transfers of our common stock.
Rule 144
In general, under Rule 144 as in effect on the date of this prospectus, a person who is not one of our affiliates at any time during the three months preceding a sale, and who has beneficially owned shares of our common stock for at least six months, would be entitled to sell an unlimited number of shares of our common stock provided current public information about us is available and, after owning such shares for at least one year, would be entitled to sell an unlimited number of shares of our common stock without restriction. Our affiliates who have beneficially owned shares of our common stock for at least six months are entitled to sell within any three-month period a number of shares that does not exceed the greater of:
| • | 1% of the number of shares of our common stock then outstanding, which was equal to approximately shares as of June 30, 2010; or |
| • | the average weekly trading volume of our common stock on the NYSE during the four calendar weeks preceding the filing of a notice on Form 144 with respect to the sale. |
Sales under Rule 144 by our affiliates are also subject to manner of sale provisions and notice requirements and to the availability of current public information about us.
152
Table of Contents
Lock-Up Agreements
In connection with this offering, we, our executive officers and directors and certain holders of our outstanding common stock and options to purchase our common stock have agreed, subject to certain exceptions, not to sell, dispose of or hedge any of our common stock, during the period ending 180 days after the date of this prospectus, except with the prior written consent of J.P. Morgan Securities Inc. and Morgan Stanley & Co. Incorporated. This agreement does not apply to any existing employee benefit plans.
The 180-day restricted period described in the preceding paragraph will be automatically extended if:
| • | during the last 17 days of the 180-day restricted period we issue an earnings release or announce material news or a material event; or |
| • | prior to the expiration of the 180-day restricted period, we announce that we will release earnings results during the 16-day period following the last day of the 180-day period, |
in which case the restrictions described in this paragraph will continue to apply until the expiration of the 18-day period beginning on the issuance of the earnings release or the announcement of the material news or material event. See “Underwriting.”
Registration on Form S-8
We will file registration statements on Form S-8 under the Securities Act to register shares of common stock issuable under our 2006 Stock Acquisition and Option Plan and new employee benefits plans that we may enter into prior to the completion of this offering. As a result, shares issued pursuant to such stock incentive plans, including upon exercise of stock options, will be eligible for resale in the public market without restriction, subject to the Rule 144 limitations applicable to affiliates and the management stockholder’s agreements described above.
As of , 2010, shares of common stock were reserved pursuant to our 2006 Stock Acquisition and Option Plan and new employee benefits plans that we may enter into prior to the completion of this offering for future issuance in connection with the exercise of outstanding options awarded under this plan, and options with respect to of these shares were vested as of , 2010. In addition to the vested options as of , 2010, additional options to purchase approximately shares of common stock will vest on or prior to .
Registration Rights
We have granted the Sponsors the right to cause us, in certain instances, at our expense, to file registration statements under the Securities Act covering resales of our common stock held by them. These shares will represent approximately % of our outstanding common stock after this offering, or % if the underwriters exercise their option to purchase additional shares in full. These shares also may be sold under Rule 144 under the Securities Act, depending on their holding period and subject to restrictions in the case of shares held by persons deemed to be our affiliates.
For a description of rights some holders of common stock have to require us to register the shares of common stock they own, see “Certain Relationships and Related Party Transactions—Registration Rights Agreement.”
153
Table of Contents
Dutch Taxation
The following summary of certain Dutch taxation matters is based on the laws and practice in force as of the date of this prospectus and is subject to any changes in law and the interpretation and application thereof, which changes could be made with retroactive effect. The following summary does not purport to be a comprehensive description of all the tax considerations that may be relevant to a decision to acquire, hold or dispose of our common stock, and does not purport to deal with the tax consequences applicable to all categories of investors, some of which may be subject to special rules.
Among other things, this summary deals with the tax consequences of a holder of our common stock which has or will have a substantial interest or deemed substantial interest in the Company.
Generally speaking, an individual holding our common stock has a substantial interest in the Company if (a) such individual, either alone or together with his partner, directly or indirectly has, or (b) certain relatives of such individual or his partner, directly or indirectly have, (I) the ownership of, a right to acquire the ownership of, or certain rights over, stock representing 5 percent or more of either the total issued and outstanding capital of the Company or the issued and outstanding capital of any class of stock of the Company, or (II) the ownership of, or certain rights over, profit participating certificates (winstbewijzen) that relate to 5 percent or more of either the annual profit or the liquidation proceeds of the Company. Also, an individual holding our common stock has a substantial interest in the Company if his partner has, or if certain relatives of the individual or his partner have, a deemed substantial interest in the Company. Generally, an individual holding our common stock, or his partner or relevant relative, has a deemed substantial interest in the Company if either (a) such person or his predecessor has disposed of or is deemed to have disposed of all or part of a substantial interest or (b) such person has transferred an enterprise in exchange for stock in the Company, on a non-recognition basis.
Generally speaking, an entity holding our common stock has a substantial interest in the Company if such entity, directly or indirectly has (I) the ownership of, a right to acquire the ownership of, or certain rights over stock representing 5 percent or more of either the total issued and outstanding capital of the Company or the issued and outstanding capital of any class of stock of the Company, or (II) the ownership of, or certain rights over, profit participating certificates (winstbewijzen) that relate to 5 percent or more of either the annual profit or the liquidation proceeds of the Company. Generally, an entity holding our common stock has a deemed substantial interest in the Company if such entity has disposed of or is deemed to have disposed of all or part of a substantial interest on a non-recognition basis.
For the purpose of this summary, the term entity means a corporation as well as any other person that is taxable as a corporation for Dutch corporate tax purposes. Where this summary refers to a holder of our common stock, an individual holding our common stock or an entity holding our common stock, such reference is restricted to an individual or entity holding legal title to as well as an economic interest in our common stock.
Investors are advised to consult their professional advisers as to the tax consequences of purchase, ownership and disposition of our common stock.
Withholding Tax
In general, the Company must withhold tax (dividend tax) from dividends distributed on our common stock at the rate of 15 percent.
Dividends include, without limitation:
| (i) | Distributions of profits (including paid-in capital not recognized for dividend tax purposes) in cash or in kind, including deemed and constructive dividends; |
154
Table of Contents
| (ii) | liquidation distributions and, generally, proceeds realized upon a repurchase of our common stock by the Company or upon the transfer of our common stock to a direct or indirect subsidiary of the Company, in excess of the average paid-in capital recognized for dividend tax purposes; |
| (iii) | the par value of our common stock issued or any increase in the par value of our common stock, except where such (increase in) the par value of our common stock is funded out of the Company’s paid-in capital recognized for dividend tax purposes; and |
| (iv) | repayments of paid-in capital recognized for dividend tax purposes up to the amount of the Company’s profits (zuivere winst) unless the Company’s general meeting of stockholders has resolved in advance that the Company shall make such repayments and the par value of our common stock concerned has been reduced by a corresponding amount through an amendment of the Company’s articles of association. |
A holder of our common stock which is, is deemed to be, or—in the case of an individual—has elected to be treated as, resident in the Netherlands for the relevant tax purposes, is generally entitled to credit the dividend tax withheld against such holder’s liability to tax on income and capital gains or, in certain cases, to apply for a full refund of the withheld dividend tax.
A holder of our common stock which is not, is not deemed to be, and—in case the holder is an individual—has not elected to be treated as, resident in the Netherlands for the relevant tax purposes, may be eligible for a partial or full exemption or refund of the dividend tax under an income tax convention in effect between the Netherlands and the holder’s country of residence.
In addition, generally a non-resident holder of our common stock that is not an individual may be entitled to an exemption from dividend withholding tax, provided that the following tests are satisfied:
| (i) | such holder is, according to the tax law of a member state of the European Union or a state designated by ministerial decree that is a party to the agreement regarding the European Economic Area, resident in such state and is not transparent for tax purposes according to the tax law of such state; |
| (ii) | any one or more of the following threshold conditions are satisfied: |
| (a) | at the time the dividend is distributed by us, such holder has shares representing at least 5 percent of our nominal paid up capital; |
| (b) | such holder has held shares representing at least 5 percent of our nominal paid up capital for a continuous period of more than one year at any time during the four years preceding the time the dividend is distributed by us; |
| (c) | such holder is connected with us within the meaning of article 10a, paragraph 4, of the Dutch Corporation Tax Act 1969 (Wet op de Vennootschapsbelasting 1969); or |
| (d) | an entity connected with such holder within the meaning of article 10a, paragraph 4, of the Dutch Corporation Tax Act 1969 (Wet op de Vennootschapsbelasting 1969) holds at the time the dividend is distributed by us, shares representing at least 5 percent of our nominal paid up capital; |
| (iii) | such holder is not considered to be resident outside the member states of the European Union or the states designated by ministerial decree that are a party to the agreement regarding the European Economic Area, under the terms of a double taxation treaty concluded with a third state; and |
| (iv) | such holder does not perform a similar function as an investment institution (beleggingsinstelling) as meant by article 6a or article 28 of the Dutch Corporation Tax Act 1969 (Wet op de Vennootschapsbelasting 1969). |
Dividend distributions to a U.S. holder of our common stock (with an interest of less than 10 percent of the voting rights in our common stock) are subject to 15 percent dividend withholding tax, which is equal to the rate such U.S. holder may be entitled to under the current income tax treaty between the Netherlands and the United States (the “Treaty”). As such, there is no need to claim a refund of the excess of the amount withheld over the Treaty rate.
155
Table of Contents
On the basis of article 35 of the Treaty, qualifying U.S. pension trusts are under certain conditions entitled to a full exemption from or refund of Netherlands dividend withholding tax.
Under the terms of domestic anti-dividend stripping rules, a recipient of dividends distributed on our common stock will not be entitled to an exemption from, reduction, refund, or credit of dividend tax if the recipient is not the beneficial owner of such dividends as meant in those rules.
Taxes on Income and Capital Gains
Resident Entities
An entity holding our common stock which is, or is deemed to be, resident in the Netherlands for corporate tax purposes and which is not tax exempt, will generally be subject to corporate tax in respect of income or a capital gain derived from our common stock at rates up to 25.5 percent, unless the holder has the benefit of the participation exemption (deelnemingsvrijstelling) with respect to such common stock.
Resident Individuals
An individual holding our common stock who is, is deemed to be, or has elected to be treated as, resident in the Netherlands for income tax purposes will be subject to income tax in respect of income or a capital gain derived from our common stock at rates up to 52 percent if:
| (i) | the income or capital gain is attributable to an enterprise from which the holder derives profits (other than as a stockholder); or |
| (ii) | the income or capital gain qualifies as income from miscellaneous activities (belastbaar resultaat uit overige werkzaamheden) as defined in the Income Tax Act (Wet inkomstenbelasting 2001), including, without limitation, activities that exceed normal, active asset management (normaal, actief vermogensbeheer). |
If neither condition (i) nor (ii) applies, an individual holding our common stock will be subject to income tax in respect of income or a capital gain derived from our common stock at rates up to 25 percent if such individual has a substantial interest or deemed substantial interest in the Company.
If neither condition (i) nor (ii) applies and, furthermore, an individual holding our common stock does not have a substantial interest or deemed substantial interest in the Company, such individual will be subject to income tax on the basis of a deemed return, regardless of any actual income or capital gain derived from our common stock. The deemed return amounts to 4 percent of the average value of the individual’s net assets in the relevant fiscal year (including our common stock). Subject to application of personal allowances, the deemed return shall be taxed at a rate of 30 percent.
Non-Residents
A holder of our common stock which is not, is not deemed to be, and—in case the holder is an individual—has not elected to be treated as, resident in the Netherlands for the relevant tax purposes will not be subject to taxation on income or a capital gain derived from our common stock unless:
| (i) | the income or capital gain is attributable to an enterprise or part thereof which is either effectively managed in the Netherlands or carried on through a permanent establishment (vaste inrichting) or permanent representative (vaste vertegenwoordiger) in the Netherlands; |
| (ii) | the holder has a substantial interest or a deemed substantial interest in the Company and such interest does not form part of the assets of an enterprise; or |
| (iii) | the holder is an individual and the income or capital gain qualifies as income from miscellaneous activities (belastbaar resultaat uit overige werkzaamheden) in the Netherlands as defined in the Income Tax Act (Wet inkomstenbelasting 2001), including, without limitation, activities that exceed normal, active asset management (normaal, actief vermogensbeheer). |
156
Table of Contents
Gift and Inheritance Taxes
Dutch gift or inheritance taxes will not be levied on the occasion of the transfer of our common stock by way of gift by, or on the death of, a holder, unless:
| (i) | the holder is, or is deemed to be, resident in the Netherlands for the purpose of the relevant provisions; or |
| (ii) | the transfer is construed as an inheritance or gift made by, or on behalf of, a person who, at the time of the gift or death, is or is deemed to be resident in the Netherlands for the purpose of the relevant provisions. |
Value Added Tax
The issuance or transfer of our common stock, and payments made under our common stock, will not be subject to value added tax in the Netherlands.
Other Taxes
The subscription, issue, placement, allotment, delivery or transfer of our common stock will not be subject to registration tax, capital tax, customs duty, transfer tax, stamp duty, or any other similar tax or duty in the Netherlands.
Residence
A holder of our common stock will not be, or deemed to be, resident in the Netherlands for Dutch tax purposes and, subject to the exceptions set out above, will not otherwise be subject to Dutch taxation, by reason only of acquiring, holding or disposing of our common stock or the execution of, performance, delivery and/or enforcement of our common stock.
Certain U.S. Federal Income Tax Consequences
The following summary describes certain U.S. federal income tax consequences of the ownership of our common stock as of the date hereof. The discussion set forth below is applicable to U.S. Holders (as defined below) (i) who are residents of the United States for purposes of the Treaty, (ii) whose common stock is not, for purposes of the Treaty, effectively connected with a permanent establishment in the Netherlands and (iii) who otherwise qualify for the full benefits of the Treaty. Except where noted, this summary deals only with common stock held as a capital asset. As used herein, the term “U.S. Holder” means a holder of our common stock that is for U.S. federal income tax purposes:
| • | an individual citizen or resident of the United States; |
| • | a corporation (or other entity treated as a corporation for U.S. federal income tax purposes) created or organized in or under the laws of the United States, any state thereof or the District of Columbia; |
| • | an estate the income of which is subject to U.S. federal income taxation regardless of its source; or |
| • | a trust if it (1) is subject to the primary supervision of a court within the United States and one or more U.S. persons have the authority to control all substantial decisions of the trust or (2) has a valid election in effect under applicable U.S. Treasury regulations to be treated as a U.S. person. |
This summary does not represent a detailed description of the U.S. federal income tax consequences applicable to you if you are subject to special treatment under the U.S. federal income tax laws, including if you are:
| • | a dealer in securities or currencies; |
| • | a financial institution; |
157
Table of Contents
| • | a regulated investment company; |
| • | a real estate investment trust; |
| • | an insurance company; |
| • | a tax-exempt organization; |
| • | a person holding our common stock as part of a hedging, integrated or conversion transaction, a constructive sale or a straddle; |
| • | a trader in securities that has elected the mark-to-market method of accounting for your securities; |
| • | a person liable for alternative minimum tax; |
| • | a person who owns or is deemed to own 10% or more of our voting stock; |
| • | a partnership or other pass-through entity for U.S. federal income tax purposes; or |
| • | a person whose “functional currency” is not the U.S. dollar. |
The discussion below is based upon the provisions of the Internal Revenue Code of 1986, as amended (the “Code”), and regulations, rulings and judicial decisions thereunder as of the date hereof, and such authorities may be replaced, revoked or modified so as to result in U.S. federal income tax consequences different from those discussed below.
If a partnership holds our common stock, the tax treatment of a partner will generally depend upon the status of the partner and the activities of the partnership. If you are a partner of a partnership holding our common stock, you should consult your tax advisors.
This summary does not contain a detailed description of all the U.S. federal income tax consequences to you in light of your particular circumstances and does not address the effects of any state, local or non-U.S. tax laws. If you are considering the purchase, ownership or disposition of our common stock, you should consult your own tax advisors concerning the U.S. federal income tax consequences to you in light of your particular situation as well as any consequences arising under the laws of any other taxing jurisdiction.
Taxation of Dividends
The gross amount of distributions on our common stock (including amounts withheld to reflect Dutch withholding taxes) will be taxable as dividends to the extent paid out of our current or accumulated earnings and profits, as determined under U.S. federal income tax principles. Such income (including withheld taxes) will be includable in your gross income as ordinary income on the day actually or constructively received by you. Such dividends will not be eligible for the dividends received deduction allowed to corporations under the Code.
With respect to non-corporate U.S. Holders, certain dividends received in taxable years beginning before January 1, 2011 from a qualified foreign corporation may be subject to reduced rates of taxation. A qualified foreign corporation includes a foreign corporation that is eligible for the benefits of a comprehensive income tax treaty with the United States which the U.S. Treasury Department determines to be satisfactory for these purposes and which includes an exchange of information provision. The U.S. Treasury Department has determined that the Treaty meets these requirements, but we may not be eligible for the benefits of the Treaty. However, a foreign corporation is also treated as a qualified foreign corporation with respect to dividends paid by that corporation on shares that are readily tradable on an established securities market in the United States. U.S. Treasury Department guidance indicates that our common stock, which we intend to list on the NYSE, will be readily tradable on an established securities market in the United States as a result of such listing. There can be no assurance that our common stock will be considered readily tradable on an established securities market in later years. Non-corporate holders that do not meet a minimum holding period requirement during which they are
158
Table of Contents
not protected from the risk of loss or that elect to treat the dividend income as “investment income” pursuant to Section 163(d)(4) of the Code will not be eligible for the reduced rates of taxation regardless of our status as a qualified foreign corporation. In addition, the rate reduction will not apply to dividends if the recipient of a dividend is obligated to make related payments with respect to positions in substantially similar or related property. This disallowance applies even if the minimum holding period has been met. You should consult your own tax advisors regarding the application of this legislation to your particular circumstances.
Non-corporate U.S. Holders will not be eligible for reduced rates of taxation on any dividends received from us in taxable years beginning prior to January 1, 2011, if we are a passive foreign investment company (a “PFIC”) in the taxable year in which such dividends are paid or in the preceding taxable year.
Subject to certain conditions and limitations, Dutch withholding taxes on dividends may be treated as foreign taxes eligible for credit against your U.S. federal income tax liability. For purposes of calculating the foreign tax credit, dividends paid on our common stock will be treated as income from sources outside the United States and will generally constitute passive category income. Further, in certain circumstances, if you:
| • | have held our common stock for less than a specified minimum period during which you are not protected from risk of loss, or |
| • | are obligated to make payments related to the dividends, |
you will not be allowed a foreign tax credit for foreign taxes imposed on dividends paid on our common stock. The rules governing the foreign tax credit are complex. You are urged to consult your tax advisors regarding the availability of the foreign tax credit under your particular circumstances.
To the extent that the amount of any distribution exceeds our current and accumulated earnings and profits for a taxable year, as determined under U.S. federal income tax principles, the distribution will first be treated as a tax-free return of capital, causing a reduction in the adjusted basis of the common stock (thereby increasing the amount of gain, or decreasing the amount of loss, to be recognized by you on a subsequent disposition of the common stock), and the balance in excess of adjusted basis will be taxed as capital gain recognized on a sale or exchange. Consequently, such distributions in excess of our current and accumulated earnings and profits would generally not give rise to foreign source income and you would generally not be able to use the foreign tax credit arising from any Dutch withholding tax imposed on such distributions unless such credit can be applied (subject to applicable limitations) against U.S. federal income tax due on other foreign source income in the appropriate category for foreign tax credit purposes. However, we do not expect to keep earnings and profits in accordance with U.S. federal income tax principles. Therefore, you should expect that a distribution will generally be treated as a dividend (as discussed above).
Distributions of our common stock or rights to subscribe for our common stock that are received as part of a pro rata distribution to all of our stockholders generally will not be subject to U.S. federal income tax. Consequently, such distributions generally will not give rise to foreign source income, and you generally will not be able to use the foreign tax credit arising from Dutch withholding tax, if any, imposed on such distributions, unless such credit can be applied (subject to applicable limitations) against U.S. federal income tax due on other income derived from foreign sources.
Passive Foreign Investment Company
We do not believe that we are, for U.S. federal income tax purposes, a PFIC, and we expect to operate in such a manner so as not to become a PFIC. If, however, we are or become a PFIC, you could be subject to additional U.S. federal income taxes on gain recognized with respect to our common stock and on certain distributions, plus an interest charge on certain taxes treated as having been deferred under the PFIC rules. Non-corporate U.S. Holders will not be eligible for reduced rates of taxation on any dividends received from us in taxable years beginning prior to January 1, 2011, if we are a PFIC in the taxable year in which such dividends are paid or in the preceding taxable year.
159
Table of Contents
You are urged to consult your tax advisors concerning the U.S. federal income tax consequences of holding our common stock if we are considered a PFIC in any taxable year.
Taxation of Capital Gains
For U.S. federal income tax purposes, you will recognize taxable gain or loss on any sale or exchange of common stock in an amount equal to the difference between the amount realized for the common stock and your tax basis in the common stock. Such gain or loss will generally be capital gain or loss. Capital gains of individuals derived with respect to capital assets held for more than one year are eligible for reduced rates of taxation. The deductibility of capital losses is subject to limitations. Any gain or loss recognized by you will generally be treated as U.S. source gain or loss.
Information Reporting and Backup Withholding
In general, information reporting will apply to dividends in respect of our common stock and the proceeds from the sale, exchange or redemption of our common stock that are paid to you within the United States (and in certain cases, outside the United States), unless you are an exempt recipient. A backup withholding tax may apply to such payments if you fail to provide a taxpayer identification number or certification of other exempt status or fail to report in full dividend and interest income.
Any amounts withheld under the backup withholding rules will be allowed as a refund or a credit against your U.S. federal income tax liability provided the required information is furnished to the Internal Revenue Service.
160
Table of Contents
We and the underwriters named below have entered into an underwriting agreement with respect to the common stock to be sold in this offering. Each underwriter named below has severally agreed to purchase, and we have agreed to sell to each underwriter, the number of shares of common stock set forth opposite its name in the following table. J.P. Morgan Securities Inc. and Morgan Stanley & Co. Incorporated are the joint book-running managers and representatives of the underwriters. Credit Suisse Securities (USA) LLC, Deutsche Bank Securities Inc., Goldman, Sachs & Co. and Citigroup Global Markets Inc. are also joint book-running managers on this transaction.
| Underwriter |
Number of Shares | |
| J.P. Morgan Securities Inc. |
||
| Morgan Stanley & Co. Incorporated |
||
| Credit Suisse Securities (USA) LLC |
||
| Deutsche Bank Securities Inc. |
||
| Goldman, Sachs & Co. |
||
| Citigroup Global Markets Inc. |
||
| Merrill Lynch, Pierce, Fenner & Smith Incorporated |
||
| William Blair & Company, L.L.C. |
||
| Guggenheim Securities, LLC |
||
| RBS Securities Inc. |
||
| Wells Fargo Securities, LLC |
||
| Blaylock Robert Van, LLC |
||
| HSBC Securities (USA) Inc. |
||
| Loop Capital Markets LLC |
||
| Mizuho Securities USA Inc. |
||
| Samuel A. Ramirez & Company, Inc. |
||
| The Williams Capital Group, L.P. |
||
| Total |
||
The underwriting agreement provides that if the underwriters take any of the shares presented in the table above, then they must take all of the shares. No underwriter is obligated to take any shares allocated to a defaulting underwriter except under limited circumstances. The underwriting agreement provides that the obligations of the underwriters are subject to certain conditions precedent, including the absence of any material adverse change in our business and the receipt of certain certificates, opinions and letters from us, our counsel and our independent auditors.
The underwriters are offering the shares of common stock, subject to the prior sale of shares, and when, as and if such shares are delivered to and accepted by them. The underwriters will initially offer to sell shares to the public at the initial public offering price shown on the front cover page of this prospectus. The underwriters may sell shares to securities dealers at a discount of up to $ per share from the initial public offering price. Any such securities dealers may resell shares to certain other brokers or dealers at a discount of up to $ per share from the initial public offering price. After the initial public offering, the representatives may vary the public offering price and other selling terms.
If the underwriters sell more shares than the total number shown in the table above, the underwriters have the option to buy up to an additional shares of common stock from us to cover such sales. They may exercise this option during the 30-day period from the date of this prospectus. If any shares are purchased under this option, the underwriters will purchase shares in approximately the same proportion as shown in the table above. If any additional shares of common stock are purchased, the underwriters will offer the additional shares on the same terms as those on which the initial shares are being offered.
161
Table of Contents
The following table shows the per share and total underwriting discounts and commissions that we will pay to the underwriters. These amounts are shown assuming both no exercise and full exercise of the underwriters’ option to purchase additional shares.
| Paid by the Company | ||||||
| Without Option Exercise |
With Full Option Exercise | |||||
| Per Share |
$ | $ | ||||
| Total |
$ | $ | ||||
The underwriters have advised us that they may make short sales of our common stock in connection with this offering, resulting in the sale by the underwriters of a greater number of shares than they are required to purchase pursuant to the underwriting agreement. The short position resulting from those short sales will be deemed a “covered” short position to the extent that it does not exceed the shares subject to the underwriters’ over-allotment option and will be deemed a “naked” short position to the extent that it exceeds that number. A naked short position is more likely to be created if the underwriters are concerned that there may be downward pressure on the trading price of the common stock in the open market that could adversely affect investors who purchase shares in this offering. The underwriters may reduce or close out their covered short position either by exercising the over-allotment option or by purchasing shares in the open market. In determining which of these alternatives to pursue, the underwriters will consider the price at which shares are available for purchase in the open market as compared to the price at which they may purchase shares through the over-allotment option. Any “naked” short position will be closed out by purchasing shares in the open market. Similar to the other stabilizing transactions described below, open market purchases made by the underwriters to cover all or a portion of their short position may have the effect of preventing or retarding a decline in the market price of our common stock following this offering. As a result, our common stock may trade at a price that is higher than the price that otherwise might prevail in the open market.
The underwriters have advised us that, pursuant to Regulation M under the Exchange Act, they may engage in transactions, including stabilizing bids or the imposition of penalty bids, that may have the effect of stabilizing or maintaining the market price of the shares of common stock at a level above that which might otherwise prevail in the open market. A “stabilizing bid” is a bid for or the purchase of shares of common stock on behalf of the underwriters for the purpose of fixing or maintaining the price of the common stock. A “penalty bid” is an arrangement permitting the underwriters to claim the selling concession otherwise accruing to an underwriter or syndicate member in connection with the offering if the common stock originally sold by that underwriter or syndicate member is purchased by the underwriters in the open market pursuant to a stabilizing bid or to cover all or part of a syndicate short position. The underwriters have advised us that stabilizing bids and open market purchases may be effected on the NYSE, in the over-the-counter market or otherwise and, if commenced, may be discontinued at any time.
One or more of the underwriters may facilitate the marketing of this offering online directly or through one of its affiliates. In those cases, prospective investors may view offering terms and a prospectus online and, depending upon the particular underwriter, place orders online or through their financial advisor.
We estimate that our total expenses for this offering, excluding underwriting discounts, will be approximately $ million.
We have agreed to indemnify the underwriters against certain liabilities, including liabilities under the Securities Act.
We and our executive officers and directors and certain holders of our outstanding common stock and options to purchase our common stock have agreed that, during the period beginning from the date of this prospectus and continuing to and including the date 180 days after the date of this prospectus, none of them will,
162
Table of Contents
directly or indirectly, offer, sell, offer to sell, contract to sell or otherwise dispose of any shares of our common stock, other than in this offering without the prior written consent of J.P. Morgan Securities Inc. and Morgan Stanley & Co. Incorporated, except in limited circumstances.
We may issue shares of common stock for the benefit of our employees, directors and officers upon the exercise of options granted under benefit plans described in this prospectus provided that, during the term of the lock-up, we will not file a registration statement covering shares of our common stock issuable upon exercise of options outstanding on the date we enter into the underwriting agreement.
The underwriters have informed us that they do not intend sales to discretionary accounts to exceed 5% of the total number of shares of our common stock offered by them and that no sales to discretionary accounts may be made without prior written approval of the customer.
We intend to apply to list our common stock on the NYSE under the symbol “NLSN.” The underwriters intend to sell shares of our common stock so as to meet the distribution requirements of this listing.
There has been no public market for the common stock prior to this offering. We and the underwriters negotiated the initial public offering price. In determining the initial public offering price, we and the underwriters considered a number of factors in addition to prevailing market conditions, including:
| • | The information set forth in this prospectus and otherwise available to the underwriters; |
| • | the history of and prospects for our industry; |
| • | an assessment of our management; |
| • | our present operations; |
| • | our historical results of operations; |
| • | the trend of our operating results; |
| • | our earnings prospects; |
| • | the general condition of the securities markets at the time of this offering; |
| • | the recent market prices of, and demand for, publicly traded common stock of generally comparable companies; and |
| • | other factors deemed relevant by the underwriters and us. |
We and the underwriters considered these and other relevant factors in relation to the price of similar securities of generally comparable companies. Neither we nor the underwriters can assure investors that an active trading market will develop for the common stock, or that the common stock will trade in the public market at or above the initial public offering price.
The underwriters and their respective affiliates are full service financial institutions engaged in various activities, which may include securities trading, commercial and investment banking, financial advisory, investment management, investment research, principal investment, hedging, financing and brokerage activities. In the ordinary course of their various business activities, the underwriters and their respective affiliates may make or hold a broad array of investments and actively trade debt and equity securities (or related derivative securities) and financial instruments (including bank loans) for their own account and for the accounts of their customers, and such investment and securities activities may involve securities and/or instruments of the issuer.
From time to time in the ordinary course of their respective businesses, certain of the underwriters and their affiliates perform various financial advisory, investment banking and commercial banking services for us and our affiliates. Goldman Sachs Lending Partners LLC, an affiliate of Goldman, Sachs & Co., was the sole lead
163
Table of Contents
arranger and is the administrative agent for the New Term Loans. An affiliate of Goldman, Sachs & Co. is also a lender under the New Term Loans. Citibank, N.A., an affiliate of Citigroup Global Markets Inc., is an agent, letter of credit issuer and a lender under our 2006 Senior Secured Credit Facilities. Deutsche Bank Securities Inc. and JPMorgan Chase Bank, N.A., an affiliate of J.P. Morgan Securities Inc., are also agents under our 2006 Senior Secured Credit Facilities. Citigroup Global Markets Inc., Deutsche Bank Securities Inc. and J.P. Morgan Securities Inc. were co-lead arrangers and joint bookrunners under our 2006 Senior Secured Credit Facilities. Deutsche Bank AG New York, an affiliate of Deutsche Bank Securities Inc., JPMorgan Chase Bank, N.A., an affiliate of J.P. Morgan Securities Inc., affiliates of Goldman, Sachs & Co., HSBC Bank plc, an affiliate of HSBC Securities (USA) Inc., affiliates of Mizuho Securities USA Inc. and RBS NV, an affiliate of RBS Securities Inc., are also lenders under our 2006 Senior Secured Credit Facilities.
European Economic Area
In relation to each Member State of the European Economic Area which has implemented the Prospectus Directive (each, a Relevant Member State), each underwriter has represented and agreed that with effect from and including the date on which the Prospectus Directive is implemented in that Relevant Member State (the Relevant Implementation Date) it has not made and will not make an offer of shares to the public in that Relevant Member State prior to the publication of a prospectus in relation to the shares which has been approved by the competent authority in that Relevant Member State or, where appropriate, approved in another Relevant Member State and notified to the competent authority in that Relevant Member State, all in accordance with the Prospectus Directive, except that it may, with effect from and including the Relevant Implementation Date, make an offer of shares to the public in that Relevant Member State at any time:
(a) to legal entities which are authorized or regulated to operate in the financial markets or, if not so authorized or regulated, whose corporate purpose is solely to invest in securities;
(b) to any legal entity which has two or more of (1) an average of at least 250 employees during the last financial year; (2) a total balance sheet of more than €43,000,000 and (3) an annual net turnover of more than €50,000,000, as shown in its last annual or consolidated accounts;
(c) to fewer than 100 natural or legal persons (other than qualified investors as defined in the Prospectus Directive) subject to obtaining the prior consent of the representatives for any such offer; or
(d) in any other circumstances which do not require the publication of a prospectus pursuant to Article 3 of the Prospectus Directive.
For the purposes of this provision, the expression an “offer of shares to the public” in relation to any shares in any Relevant Member State means the communication in any form and by any means of sufficient information on the terms of the offer and the shares to be offered so as to enable an investor to decide to purchase or subscribe the shares, as the same may be varied in that Relevant Member State by any measure implementing the Prospectus Directive in that Relevant Member State and the expression Prospectus Directive means Directive 2003/71/EC and includes any relevant implementing measure in each Relevant Member State.
We have not authorized and do not authorize the making of any offer of securities through any financial intermediary on their behalf, other than offers made by the underwriters with a view to the final placement of the securities as contemplated in this prospectus. Accordingly, no purchaser of the securities, other than the underwriters, is authorized to make any further offer of the securities on behalf of us or the underwriters.
United Kingdom
This prospectus is only being distributed to, and is only directed at, persons in the United Kingdom that are qualified investors within the meaning of Article 2(1)(e) of the Prospectus Directive that are also (i) investment professionals falling within Article 19(5) of the Financial Services and Markets Act 2000 (Financial Promotion) Order 2005 (the “Order”) or (ii) high net worth entities, and other persons to whom it may lawfully be
164
Table of Contents
communicated, falling within Article 49(2)(a) to (d) of the Order (each such person being referred to as a “relevant person”). This prospectus and its contents are confidential and should not be distributed, published or reproduced (in whole or in part) or disclosed by recipients to any other persons in the United Kingdom. Any person in the United Kingdom that is not a relevant person should not act or rely on this document or any of its contents.
France
Neither this prospectus nor any other offering material relating to the shares described in this prospectus has been submitted to the clearance procedures of the Autorité des Marchés Financiers or of the competent authority of another member state of the European Economic Area and notified to the Autorité des Marchés Financiers. The shares have not been offered or sold and will not be offered or sold, directly or indirectly, to the public in France. Neither this prospectus nor any other offering material relating to the shares has been or will be:
| • | released, issued, distributed or caused to be released, issued or distributed to the public in France; or |
| • | used in connection with any offer for subscription or sale of the shares to the public in France. |
| • | Such offers, sales and distributions will be made in France only: |
| • | to qualified investors (investisseurs qualifiés) and/or to a restricted circle of investors (cercle restreint d’investisseurs), in each case investing for their own account, all as defined in, and in accordance with articles L.411-2, D.411-1, D.411-2, D.734-1, D.744-1, D.754-1 and D.764-1 of the French Code monétaire et financier; |
| • | to investment services providers authorized to engage in portfolio management on behalf of third parties; or |
| • | in a transaction that, in accordance with article L.411-2-II-1°-or-2°-or 3° of the French Code monétaire et financier and article 211-2 of the General Regulations (Règlement Général) of the Autorité des Marchés Financiers, does not constitute a public offer (appel public à l’épargne). |
The shares may be resold directly or indirectly, only in compliance with articles L.411-1, L.411-2, L.412-1 and L.621-8 through L.621-8-3 of the French Code monétaire et financier.
Hong Kong
The shares may not be offered or sold by means of any document other than (i) in circumstances which do not constitute an offer to the public within the meaning of the Companies Ordinance (Cap.32, Laws of Hong Kong), or (ii) to “professional investors” within the meaning of the Securities and Futures Ordinance (Cap.571, Laws of Hong Kong) and any rules made thereunder, or (iii) in other circumstances which do not result in the document being a “prospectus” within the meaning of the Companies Ordinance (Cap.32, Laws of Hong Kong), and no advertisement, invitation or document relating to the shares may be issued or may be in the possession of any person for the purpose of issue (in each case whether in Hong Kong or elsewhere), which is directed at, or the contents of which are likely to be accessed or read by, the public in Hong Kong (except if permitted to do so under the laws of Hong Kong) other than with respect to shares which are or are intended to be disposed of only to persons outside Hong Kong or only to “professional investors” within the meaning of the Securities and Futures Ordinance (Cap. 571, Laws of Hong Kong) and any rules made thereunder.
Singapore
This prospectus has not been registered as a prospectus with the Monetary Authority of Singapore. Accordingly, this prospectus and any other document or material in connection with the offer or sale, or invitation for subscription or purchase, of the shares may not be circulated or distributed, nor may the shares be offered or sold, or be made the subject of an invitation for subscription or purchase, whether directly or
165
Table of Contents
indirectly, to persons in Singapore other than (i) to an institutional investor under Section 274 of the Securities and Futures Act, Chapter 289 of Singapore (the “SFA”), (ii) to a relevant person, or any person pursuant to Section 275(1A), and in accordance with the conditions, specified in Section 275 of the SFA or (iii) otherwise pursuant to, and in accordance with the conditions of, any other applicable provision of the SFA.
Where the shares are subscribed or purchased under Section 275 by a relevant person which is: (a) a corporation (which is not an accredited investor) the sole business of which is to hold investments and the entire share capital of which is owned by one or more individuals, each of whom is an accredited investor; or (b) a trust (where the trustee is not an accredited investor) whose sole purpose is to hold investments and each beneficiary is an accredited investor, shares, debentures and units of shares and debentures of that corporation or the beneficiaries’ rights and interest in that trust shall not be transferable for 6 months after that corporation or that trust has acquired the shares under Section 275 except: (1) to an institutional investor under Section 274 of the SFA or to a relevant person, or any person pursuant to Section 275(1A), and in accordance with the conditions, specified in Section 275 of the SFA; (2) where no consideration is given for the transfer; or (3) by operation of law.
Japan
The shares offered in this prospectus have not been registered under the Financial Instruments and Exchange Law of Japan. The shares have not been offered or sold and will not be offered or sold, directly or indirectly, in Japan or to or for the account of any resident of Japan, (which term as used herein means any person resident in Japan, including any corporation or other entity organized under the laws of Japan) or to others for re-offering or resale, directly or indirectly, in Japan or to a resident of Japan, except (i) pursuant to an exemption from the registration requirements of the Securities and Exchange Law and (ii) in compliance with any other applicable requirements of the Financial Instruments and Exchange Law and any other applicable laws, regulations and ministerial guidelines of Japan.
Switzerland
This document as well as any other material relating to the shares which are the subject of the offering contemplated by this Prospectus (the “Shares”) do not constitute an issue prospectus pursuant to Article 652a of the Swiss Code of Obligations. The Shares will not be listed on the SWX Swiss Exchange and, therefore, the documents relating to the Shares, including, but not limited to, this document, do not claim to comply with the disclosure standards of the listing rules of SWX Swiss Exchange and corresponding prospectus schemes annexed to the listing rules of the SWX Swiss Exchange.
The Shares are being offered in Switzerland by way of a private placement, i.e. to a small number of selected investors only, without any public offer and only to investors who do not purchase the Shares with the intention to distribute them to the public. The investors will be individually approached by the Company from time to time.
This document as well as any other material relating to the Shares is personal and confidential and do not constitute an offer to any other person. This document may only be used by those investors to whom it has been handed out in connection with the offering described herein and may neither directly nor indirectly be distributed or made available to other persons without express consent of the Company. It may not be used in connection with any other offer and shall in particular not be copied and/or distributed to the public in (or from) Switzerland.
Norway
This prospectus has not been produced in accordance with the prospectus requirements laid down in the Norwegian Securities Trading Act 1997, as amended. This prospectus has not been approved or disapproved by, or registered with, either the Oslo Stock Exchange or the Norwegian Registry of Business Enterprises. This prospectus may not, either directly or indirectly, be distributed to Norwegian potential investors.
166
Table of Contents
Denmark
This prospectus has not been prepared in the context of a public offering of securities in Denmark within the meaning of the Danish Securities Trading Act No. 171 of 17 March 2005, as amended from time to time, or any Executive Orders issued on the basis thereof and has not been and will not be filed with or approved by the Danish Financial Supervisory Authority or any other public authority in Denmark. The offering of the shares of common stock pursuant to this prospectus will only be made to persons pursuant to one or more of the exemptions set out in Executive Order No. 306 of 28 April 2005 on Prospectuses for Securities Admitted for Listing or Trade on a Regulated Market and on the First Public Offer of Securities exceeding EUR 2,500,000 or Executive Order No. 307 of 28 April 2005 on Prospectuses for the First Public Offer of Certain Securities between EUR 100,000 and EUR 2,500,000, as applicable.
Sweden
Neither this prospectus nor the common stock offered hereunder has been registered with or approved by the Swedish Financial Supervisory Authority under the Swedish Financial Instruments Trading Act (1991:980) (as amended), nor will such registration or approval be sought. Accordingly, this prospectus may not be made available nor may the shares of common stock offered hereunder be marketed or offered for sale in Sweden other than in circumstances that are deemed not to be an offer to the public in Sweden under the Financial Instruments Trading Act. This prospectus may not be distributed to the public in Sweden and a Swedish recipient of this prospectus may not in any way forward this prospectus to the public in Sweden.
Dubai International Financial Centre
This document relates to an exempt offer in accordance with the Offered Securities Rules of the Dubai Financial Services Authority. This document is intended for distribution only to persons of a type specified in those rules. It must not be delivered to, or relied on by, any other person. The Dubai Financial Services Authority has no responsibility for reviewing or verifying any documents in connection with exempt offers. The Dubai Financial Services Authority has not approved this document nor taken steps to verify the information set out in it, and has no responsibility for it. The shares which are the subject of the offering contemplated by this Prospectus (the “Shares”) may be illiquid and/or subject to restrictions on their resale.
Prospective purchasers of the Shares offered should conduct their own due diligence on the Shares. If you do not understand the contents of this document you should consult an authorised financial adviser.
Stamp Taxes
Purchasers of the common stock offered by this prospectus may be required to pay stamp taxes and other charges under the laws and practices of the country of purchase, in addition to the offering price listed on the cover page of this prospectus. Accordingly, we urge you to consult a tax advisor with respect to whether you may be required to pay those taxes or charges, as well as any other tax consequences that may arise under the laws of the country of purchase.
167
Table of Contents
Certain legal matters in connection with the offering will be passed upon for us by Simpson Thacher & Bartlett LLP, New York, New York, and Clifford Chance LLP, Droogbak, Amsterdam. Certain legal matters in connection with the offering will be passed upon for the underwriters by Cahill Gordon & Reindel LLP, New York, New York and Loyens & Loeff N.V., Amsterdam.
The consolidated financial statements and schedules of Nielsen Holdings B.V. as of December 31, 2009 and 2008, and for each of the three years in the period ended December 31, 2009, appearing in this prospectus and registration statement of which this prospectus forms a part, have been audited by Ernst & Young LLP, independent registered public accounting firm, as set forth in their report thereon appearing elsewhere herein and are included in reliance upon such report given on the authority of such firm as experts in accounting and auditing.
168
Table of Contents
WHERE YOU CAN FIND MORE INFORMATION
We have filed with the Securities and Exchange Commission a registration statement on Form S-1 under the Securities Act with respect to the common stock offered in this prospectus. This prospectus is a part of the registration statement and does not contain all of the information set forth in the registration statement. For further information about us and our common stock, you should refer to the registration statement. This prospectus summarizes material provisions of contracts and other documents to which we refer you. Since the prospectus may not contain all of the information that you may find important, you should review the full text of these contracts and other documents. We have included or incorporated by reference copies of these documents as exhibits to our registration statement.
Our subsidiary, The Nielsen Company B.V., files annual, quarterly and special reports and other information with the SEC. Our filings with the SEC are available to the public on the SEC’s website at http://www.sec.gov. Those filings are also available to the public on our corporate web site at http://www.nielsen.com. The information contained on our corporate web site or any other web site that we may maintain is not part of this prospectus, any prospectus supplement or the registration statement of which this prospectus is a part. You may also read and copy, at SEC prescribed rates, any document we file with the SEC, including the registration statement (and its exhibits) of which this prospectus is a part, at the SEC’s Public Reference Room located at 100 F Street, N.E., Washington D.C. 20549. You can call the SEC at 1-800-SEC-0330 to obtain information on the operation of the Public Reference Room.
We also intend to provide our stockholders with annual reports containing financial statements audited by our independent auditors.
169
Table of Contents
Nielsen Holdings B.V.
Index to Consolidated Financial Statements
| Page | ||
| Audited Consolidated Financial Statements |
||
| F-2 | ||
| Consolidated Statements of Operations for the years ended December 31, 2009, 2008 and 2007 |
F-3 | |
| Consolidated Balance Sheets as of December 31, 2009 and 2008 |
F-4 | |
| Consolidated Statements of Cash Flows for the years ended December 31, 2009, 2008 and 2007 |
F-5 | |
| F-6 | ||
| F-9 | ||
| F-58 | ||
| F-60 | ||
| Unaudited Condensed Consolidated Financial Statements |
||
| F-61 | ||
| Condensed Consolidated Balance Sheets as of June 30, 2010 (unaudited) and December 31, 2009 |
F-62 | |
| F-63 | ||
| F-64 |
F-1
Table of Contents
REPORT OF INDEPENDENT REGISTERED PUBLIC ACCOUNTING FIRM
The Board and Stockholders
Nielsen Holdings B.V.
We have audited the accompanying consolidated balance sheets of Nielsen Holdings B.V. as of December 31, 2009 and 2008, and the related consolidated statements of operations, cash flows and changes in equity and accumulated other comprehensive income for each of the three years in the period ended December 31, 2009. Our audits also included the financial statement schedules listed in the Index to the Consolidated Financial Statements on page F-1. These financial statements and schedules are the responsibility of the Company’s management. Our responsibility is to express an opinion on these financial statements and schedules based on our audits.
We conducted our audits in accordance with the standards of the Public Company Accounting Oversight Board (United States). Those standards require that we plan and perform the audit to obtain reasonable assurance about whether the financial statements are free of material misstatement. We were not engaged to perform an audit of the Company’s internal control over financial reporting. Our audits included consideration of internal control over financial reporting as a basis for designing audit procedures that are appropriate in the circumstances, but not for the purpose of expressing an opinion on the effectiveness of the Company’s internal control over financial reporting. Accordingly, we express no such opinion. An audit also includes examining, on a test basis, evidence supporting the amounts and disclosures in the financial statements, assessing the accounting principles used and significant estimates made by management, and evaluating the overall financial statement presentation. We believe that our audits provide a reasonable basis for our opinion.
In our opinion, the financial statements referred to above present fairly, in all material respects, the consolidated financial position of Nielsen Holdings B.V. at December 31, 2009 and 2008, and the consolidated results of its operations and its cash flows for each of the three years in the period ended December 31, 2009, in conformity with U.S. generally accepted accounting principles. Also, in our opinion, the related financial statement schedules, when considered in relation to the basic financial statements taken as a whole, present fairly in all material respects the information set forth therein.
As discussed in Note 2 to the consolidated financial statements, Nielsen Holdings B.V. changed its method of accounting for business combinations, effective January 1, 2009.
/s/ ERNST & YOUNG LLP
New York, New York
June 2, 2010
F-2
Table of Contents
Consolidated Statements of Operations
| Year Ended December 31, | ||||||||||||
| (IN MILLIONS EXCEPT SHARE AND PER SHARE DATA) |
2009 | 2008 | 2007 | |||||||||
| Revenues |
$ | 4,808 | $ | 4,806 | $ | 4,458 | ||||||
| Cost of revenues, exclusive of depreciation and amortization shown separately below |
2,023 | 2,057 | 1,992 | |||||||||
| Selling, general and administrative expenses, exclusive of depreciation and amortization shown separately below |
1,523 | 1,616 | 1,506 | |||||||||
| Depreciation and amortization |
557 | 499 | 451 | |||||||||
| Impairment of goodwill and intangible assets |
527 | 96 | — | |||||||||
| Restructuring costs |
62 | 118 | 133 | |||||||||
| Operating income |
116 | 420 | 376 | |||||||||
| Interest income |
7 | 17 | 30 | |||||||||
| Interest expense |
(647 | ) | (701 | ) | (691 | ) | ||||||
| (Loss)/gain on derivative instruments |
(60 | ) | (15 | ) | 40 | |||||||
| Foreign currency exchange transaction (losses)/gains, net |
(2 | ) | 20 | (110 | ) | |||||||
| Other (expense)/income, net |
(17 | ) | (12 | ) | 1 | |||||||
| Loss from continuing operations before income taxes and equity in net (loss)/income of affiliates |
(603 | ) | (271 | ) | (354 | ) | ||||||
| Benefit/(provision) for income taxes |
197 | (36 | ) | (12 | ) | |||||||
| Equity in net (loss)/income of affiliates |
(22 | ) | (7 | ) | 2 | |||||||
| Loss from continuing operations |
(428 | ) | (314 | ) | (364 | ) | ||||||
| (Loss)/income from discontinued operations, net of tax |
(61 | ) | (275 | ) | 10 | |||||||
| Net loss |
(489 | ) | (589 | ) | (354 | ) | ||||||
| Net income attributable to noncontrolling interests |
2 | — | — | |||||||||
| Net loss attributable to Nielsen stockholders |
$ | (491 | ) | $ | (589 | ) | $ | (354 | ) | |||
| Net loss per common stock, basic and diluted |
||||||||||||
| Loss from continuing operations |
$ | (0.98 | ) | $ | (0.87 | ) | $ | (1.01 | ) | |||
| (Loss)/income from discontinued operations |
(0.14 | ) | (0.76 | ) | 0.03 | |||||||
| Net loss attributable to Nielsen stockholders |
$ | (1.12 | ) | $ | (1.63 | ) | $ | (0.98 | ) | |||
| Weighted average common stock outstanding, basic and diluted |
438,249,296 | 362,679,606 | 360,027,784 | |||||||||
The accompanying notes are an integral part of these consolidated financial statements.
F-3
Table of Contents
Consolidated Balance Sheets
| December 31, | ||||||||
| (IN MILLIONS, EXCEPT SHARE AND PER SHARE DATA) |
2009 | 2008 | ||||||
| Assets: |
||||||||
| Current assets |
||||||||
| Cash and cash equivalents |
$ | 514 | $ | 467 | ||||
| Trade and other receivables, net of allowances for doubtful accounts and sales returns of $31 and $33 as of December 31, 2009 and December 31, 2008, respectively |
937 | 958 | ||||||
| Prepaid expenses and other current assets |
195 | 189 | ||||||
| Total current assets |
1,646 | 1,614 | ||||||
| Non-current assets |
||||||||
| Property, plant and equipment, net |
593 | 603 | ||||||
| Goodwill |
7,056 | 7,185 | ||||||
| Other intangible assets, net |
4,757 | 5,070 | ||||||
| Deferred tax assets |
50 | 43 | ||||||
| Other non-current assets |
498 | 576 | ||||||
| Total assets |
$ | 14,600 | $ | 15,091 | ||||
| Liabilities and equity: |
||||||||
| Current liabilities |
||||||||
| Accounts payable and other current liabilities |
$ | 1,000 | $ | 1,020 | ||||
| Deferred revenues |
435 | 438 | ||||||
| Income tax liabilities |
82 | 138 | ||||||
| Current portion of long-term debt, capital lease obligations and short-term borrowings |
107 | 419 | ||||||
| Total current liabilities |
1,624 | 2,015 | ||||||
| Non-current liabilities |
||||||||
| Long-term debt and capital lease obligations |
8,548 | 8,965 | ||||||
| Deferred tax liabilities |
1,065 | 1,316 | ||||||
| Other non-current liabilities |
551 | 786 | ||||||
| Total liabilities |
11,788 | 13,082 | ||||||
| Commitments and contingencies (Note 16) |
||||||||
| Equity: |
||||||||
| Nielsen stockholders’ equity |
||||||||
| Common stock, €0.04 par value, 1,250,000,000 shares authorized, 442,607,460 and 363,217,074 and shares issued and 441,850,943 and 362,965,702 shares outstanding at December 31, 2009 and 2008, respectively |
22 | 18 | ||||||
| Additional paid-in capital |
4,563 | 3,697 | ||||||
| Accumulated deficit |
(1,739 | ) | (1,248 | ) | ||||
| Accumulated other comprehensive loss, net of income taxes |
(48 | ) | (474 | ) | ||||
| Total Nielsen stockholders’ equity |
2,798 | 1,993 | ||||||
| Noncontrolling interests |
14 | 16 | ||||||
| Total equity |
2,812 | 2,009 | ||||||
| Total liabilities and equity |
$ | 14,600 | $ | 15,091 | ||||
The accompanying notes are an integral part of these consolidated financial statements.
F-4
Table of Contents
Consolidated Statements of Cash Flows
| Year Ended December 31, |
||||||||||||
| (IN MILLIONS) |
2009 | 2008 | 2007 | |||||||||
| Operating Activities |
||||||||||||
| Net loss |
$ | (489 | ) | $ | (589 | ) | $ | (354 | ) | |||
| Adjustments to reconcile net loss to net cash provided by operating activities: |
||||||||||||
| Share-based payments expense |
14 | 18 | 52 | |||||||||
| Loss/(gain) on sale of discontinued operations, net of tax |
14 | (19 | ) | (17 | ) | |||||||
| Deferred income taxes |
(304 | ) | (126 | ) | (48 | ) | ||||||
| Currency exchange rate differences on financial transactions and other (gains)/losses |
23 | (6 | ) | 108 | ||||||||
| Loss/(gain) on derivative instruments |
60 | 15 | (40 | ) | ||||||||
| Equity in net loss/(income) from affiliates, net of dividends received |
33 | 18 | 6 | |||||||||
| Depreciation and amortization |
562 | 504 | 457 | |||||||||
| Impairment of goodwill and intangible assets |
582 | 432 | — | |||||||||
| Changes in operating assets and liabilities, net of effect of businesses acquired and divested: |
||||||||||||
| Trade and other receivables, net |
39 | (66 | ) | (115 | ) | |||||||
| Prepaid expenses and other current assets |
(20 | ) | (9 | ) | — | |||||||
| Accounts payable and other current liabilities and deferred revenues |
(96 | ) | (129 | ) | 48 | |||||||
| Other non-current liabilities |
(4 | ) | 2 | (14 | ) | |||||||
| Interest receivable |
— | 4 | (1 | ) | ||||||||
| Interest payable |
152 | 229 | 184 | |||||||||
| Income taxes payable |
(49 | ) | 39 | (33 | ) | |||||||
| Net cash provided by operating activities |
517 | 317 | 233 | |||||||||
| Investing Activities |
||||||||||||
| Acquisition of subsidiaries and affiliates, net of cash acquired |
(50 | ) | (238 | ) | (832 | ) | ||||||
| Proceeds from sale of subsidiaries and affiliates, net |
84 | 23 | 440 | |||||||||
| Additions to property, plant and equipment and other assets |
(139 | ) | (224 | ) | (154 | ) | ||||||
| Additions to intangible assets |
(143 | ) | (146 | ) | (112 | ) | ||||||
| Purchases of marketable securities |
— | — | (75 | ) | ||||||||
| Sale and maturities of marketable securities |
— | — | 210 | |||||||||
| Other investing activities |
21 | (6 | ) | 6 | ||||||||
| Net cash used in investing activities |
(227 | ) | (591 | ) | (517 | ) | ||||||
| Financing Activities |
||||||||||||
| Net (repayments)/borrowings from revolving credit facility |
(295 | ) | 285 | 10 | ||||||||
| Proceeds from issuances of debt, net of issuance costs |
1,223 | 217 | 352 | |||||||||
| Repayment of debt |
(976 | ) | (50 | ) | (378 | ) | ||||||
| Decrease in other short-term borrowings |
(50 | ) | (13 | ) | (69 | ) | ||||||
| Stock activity of subsidiaries, net |
(3 | ) | (2 | ) | — | |||||||
| Squeeze out of TNC B.V. shares |
— | (65 | ) | — | ||||||||
| Capital contribution from Luxco |
— | — | 50 | |||||||||
| Activity under stock plans |
(1 | ) | 7 | 45 | ||||||||
| Settlement of derivatives and other financing activities |
(169 | ) | (12 | ) | (1 | ) | ||||||
| Net cash provided (used in)/provided by financing activities |
(271 | ) | 367 | 9 | ||||||||
| Effect of exchange-rate changes on cash and cash equivalents |
28 | (28 | ) | 45 | ||||||||
| Net increase/(decrease) in cash and cash equivalents |
47 | 65 | (230 | ) | ||||||||
| Cash and cash equivalents at beginning of period |
467 | 402 | 632 | |||||||||
| Cash and cash equivalents at end of period |
$ | 514 | $ | 467 | $ | 402 | ||||||
| Supplemental Cash Flow Information |
||||||||||||
| Cash paid for income taxes |
$ | (139 | ) | $ | (91 | ) | $ | (99 | ) | |||
| Cash paid for interest, net of amounts capitalized |
$ | (495 | ) | $ | (494 | ) | $ | (533 | ) | |||
The accompanying notes are an integral part of these consolidated financial statements.
F-5
Table of Contents
Consolidated Statements of Changes in Equity and Accumulated Other Comprehensive Income
| (IN MILLIONS) |
Common Stock |
Additional Paid-in Capital |
Accumulated Deficit |
Accumulated Other Comprehensive Income/ (Loss), Net |
Total Nielsen Stockholders’ Equity |
Noncontrolling Interests |
Total Equity |
||||||||||||||||||||||||||||||
| Currency Translation Adjustments |
Net Unrealized Gains/ (Losses) on Securities |
Net Unrealized Gain/ (Loss) on Cash Flow Hedges |
Post Employment Adjustments |
||||||||||||||||||||||||||||||||||
| Balance, December 31, 2006 |
$ | 17 | $ | 3,509 | $ | (305 | ) | $ | 7 | $ | 1 | $ | 9 | $ | (1 | ) | $ | 3,237 | $ | 105 | $ | 3,342 | |||||||||||||||
| Comprehensive income/(loss): |
|||||||||||||||||||||||||||||||||||||
| Net loss |
(354 | ) | (354 | ) | (354 | ) | |||||||||||||||||||||||||||||||
| Other comprehensive income: |
|||||||||||||||||||||||||||||||||||||
| Currency translation adjustments, net of tax of $(38) |
218 | 218 | 218 | ||||||||||||||||||||||||||||||||||
| Unrealized gain on pension liability, net of tax of $(15) |
40 | 40 | 40 | ||||||||||||||||||||||||||||||||||
| Unrealized gain on available-for-sale securities |
(5 | ) | (5 | ) | (5 | ) | |||||||||||||||||||||||||||||||
| Cash flow hedges, net of tax of $32 |
(51 | ) | (51 | ) | (51 | ) | |||||||||||||||||||||||||||||||
| Total other comprehensive income |
202 | — | 202 | ||||||||||||||||||||||||||||||||||
| Total comprehensive loss |
(152 | ) | — | (152 | ) | ||||||||||||||||||||||||||||||||
| Acquisition of noncontrolling interest in consolidated subsidiaries |
(101 | ) | (101 | ) | |||||||||||||||||||||||||||||||||
| Share issuances |
1 | 104 | 105 | 105 | |||||||||||||||||||||||||||||||||
| Options issued in business acquisitions |
6 | 6 | 6 | ||||||||||||||||||||||||||||||||||
| Share-based payments expense |
52 | 52 | 52 | ||||||||||||||||||||||||||||||||||
| Balance, December 31, 2007 |
$ | 18 | $ | 3,671 | $ | (659 | ) | $ | 225 | $ | (4 | ) | $ | (42 | ) | $ | 39 | $ | 3,248 | $ | 4 | $ | 3,252 | ||||||||||||||
F-6
Table of Contents
Nielsen Holdings B.V.
Consolidated Statements of Changes in Equity and Accumulated Other Comprehensive Income—(Continued)
| (IN MILLIONS) |
Common Stock |
Additional Paid-in Capital |
Accumulated Deficit |
Accumulated Other Comprehensive Income/ (Loss), Net |
Total Nielsen Stockholders’ Equity |
Noncontrolling Interests |
Total Equity |
|||||||||||||||||||||||||||||||
| EUR 50 million private placement debenture loan (EMTN) (3-month EURIBOR based variable rate of 2.12%) due 2010 |
72 | 67 | 70 | 53 | ||||||||||||||||||||||||||||||||||
| EUR 50 million private placement debenture loan (EMTN) (3-month EURIBOR based variable rate of 2.13%) due 2012 |
72 | 66 | 70 | 45 | ||||||||||||||||||||||||||||||||||
| EUR 30 million 6.75% private placement debenture loan (EMTN) due 2012 |
44 | 43 | 44 | 28 | ||||||||||||||||||||||||||||||||||
| JPY 4,000 million 2.50% private placement debenture loan (EMTN) due 2011 |
45 | 40 | 45 | 32 | ||||||||||||||||||||||||||||||||||
| Total debenture loans (with weighted average interest rate) |
12.06 | % | 3,381 | 3,360 | 10.67 | % | 2,819 | 1,662 | ||||||||||||||||||||||||||||||
| Term loan with Valcon Acquisition Holding (Luxembourg) S.àr.l |
— | — | 10.00 | % | 892 | 892 | ||||||||||||||||||||||||||||||||
| Other loans |
— | — | 6.28 | % | 8 | 8 | ||||||||||||||||||||||||||||||||
| Total long-term debt |
6.91 | % | 8,509 | 8,177 | 6.91 | % | 9,199 | 6,253 | ||||||||||||||||||||||||||||||
| Capital lease and other financing obligations |
131 | 121 | ||||||||||||||||||||||||||||||||||||
| Bank overdrafts |
15 | 64 | ||||||||||||||||||||||||||||||||||||
| Total debt and other financing arrangements |
8,655 | 9,384 | ||||||||||||||||||||||||||||||||||||
| Less: Current portion of long-term debt, capital lease and other financing obligations and other short-term borrowings |
107 | 419 | ||||||||||||||||||||||||||||||||||||
| Non-current portion of long-term debt and capital lease and other financing obligations |
$ | 8,548 | $ | 8,965 | ||||||||||||||||||||||||||||||||||
F-36
Table of Contents
Nielsen Holdings B.V.
Notes to Consolidated Financial Statements—(Continued)
The fair value of the Company’s long-term debt instruments was based on the yield on public debt where available or current borrowing rates available for financings with similar terms and maturities.
The carrying amounts of Nielsen’s long-term debt are denominated in the following currencies:
| (IN MILLIONS) |
December 31, 2009 |
December 31, 2008 | ||||
| U.S. Dollars |
$ | 6,941 | $ | 6,381 | ||
| Euro |
1,523 | 2,407 | ||||
| British Pound (“GBP”) |
— | 366 | ||||
| Japanese Yen |
45 | 45 | ||||
| $ | 8,509 | $ | 9,199 | |||
Annual maturities of Nielsen’s long-term debt are as follows:
| (IN MILLIONS) |
|||
| 2010 |
$ | 85 | |
| 2011 |
57 | ||
| 2012 |
128 | ||
| 2013 |
3,381 | ||
| 2014 |
1,397 | ||
| Thereafter |
3,461 | ||
| $ | 8,509 | ||
Senior secured credit facilities
In August 2006, certain of Nielsen’s subsidiaries entered into two senior secured credit facilities. In June 2009 Nielsen received the requisite consent to amend its senior secured credit facilities to permit, among other things: (i) future issuances of additional secured notes or loans, which may include, in each case, indebtedness secured on a pari passu basis with Nielsen’s obligations under the senior secured credit facilities, so long as (a) the net cash proceeds from any such issuance are used to prepay term loans under the senior secured credit facilities at par until $500 million of term loans have been paid, and (b) 90% of the net cash proceeds in excess of the first $500 million from any such issuance (but all of the net cash proceeds after the first $2.0 billion) are used to prepay term loans under the senior secured credit facilities at par; and (ii) allow Nielsen to agree with lenders to extend the maturity of their term loans and revolving commitments and for it to pay increased interest rates or otherwise modify the terms of their loans in connection with such an extension (subject to certain limitations, including mandatory increases of interest rates under certain circumstances) (collectively, the “Amendment”). In connection with the Amendment, Nielsen extended the maturity of $1.26 billion of their existing term loans from August 9, 2013 to May 1, 2016. The interest rate margins of term loans that were extended were increased to 3.75%. The Amendment and the subsequent extension of maturity of a portion of the existing term loans is considered a modification of the Company’s existing obligations and has been reflected as such in the consolidated financial statements. The Company recorded a charge of approximately $4 million in June 2009 as a component of other expense, net in the consolidated statement of operations primarily relating to the write-off of previously deferred debt issuance costs as a result of this modification.
Outstanding borrowings under these senior secured term loan facilities at December 31, 2009 and 2008 were $4,628 million and $5,185 million, respectively.
F-37
Table of Contents
Nielsen Holdings B.V.
Notes to Consolidated Financial Statements—(Continued)
In August 2006, Nielsen also entered into a six-year $688 million senior secured revolving credit facility, of which no borrowings were outstanding at December 31, 2009 and $295 million in borrowings were outstanding as of December 31, 2008. The senior secured revolving credit facility can be used for revolving loans, letters of credit, guarantees and for swingline loans, and is available in U.S. Dollars, Euros and certain other currencies. As of December 31, 2009 and 2008 the Company had outstanding letters of credit and bank guarantees of $17 million and $5 million, respectively.
Nielsen is required to repay installments only on the borrowings under the senior secured term loan facilities maturing in 2016 in quarterly principal amounts of 0.25% of their original principal amount, with the remaining amount payable on the maturity date of the term loan facilities. Borrowings under the senior secured credit facilities bear interest at a rate equal to an applicable margin plus, at Nielsen’s option, various base rates. The applicable margin for borrowings under the senior secured revolving credit facility may be reduced subject to Nielsen attaining certain leverage ratios. Nielsen pays a quarterly commitment fee of 0.5% on unused commitments under the senior secured revolving credit facility. The applicable commitment fee rate may be reduced subject to Nielsen attaining certain leverage ratios.
In June 2009 Nielsen entered into a Senior Secured Loan Agreement with Goldman Sachs Lending Partners, LLC, which provides for senior secured term loans in the aggregated principal amount of $500 million (the “New Term Loans”) bearing interest at a fixed rate of 8.50%. The New Term Loans are secured on a pari passu basis with the Company’s existing obligations under its senior secured credit facilities and have a maturity of eight years. The net proceeds from the issuance of the New Term Loans of approximately $481 million were used in their entirety to pay down senior secured term loan obligations under the Company’s existing senior secured credit facilities.
The senior secured credit facilities are guaranteed by Nielsen, and certain of its existing and subsequently acquired or organized wholly-owned subsidiaries and are secured by substantially all of the existing and future property and assets (other than cash) of Nielsen’s U.S. subsidiaries and by a pledge of substantially all of the capital stock of the guarantors, by the capital stock of substantially all of Nielsen’s U.S. subsidiaries and by up to 65% of the capital stock of certain of Nielsen’s non-U.S. subsidiaries. Under a separate security agreement, substantially all of the assets of Nielsen are pledged as collateral for amounts outstanding under the senior secured credit facilities.
The senior secured credit facilities contain a number of covenants that, among other things, restrict, subject to certain exceptions, Nielsen and most of its subsidiaries’ ability to incur additional indebtedness or guarantees, incur liens and engage in sale and leaseback transactions, make certain loans and investments, declare dividends, make payments or redeem or repurchase capital stock, engage in certain mergers, acquisitions and other business combinations, prepay, redeem or purchase certain indebtedness, amend or otherwise alter terms of certain indebtedness, sell certain assets, transact with affiliates, enter into agreements limiting subsidiary distributions and alter the business that Nielsen conducts. The Company’s subsidiaries are restricted in their ability to transfer their net assets to the Parent Company, Nielsen Holdings B.V. Such restricted net assets amounted to approximately $2.8 billion at December 31, 2009. Beginning with the twelve month period ending September 30, 2007, Nielsen has been required to maintain a maximum total leverage ratio and a minimum interest coverage ratio. The senior secured credit facilities also contain certain customary affirmative covenants and events of default. Nielsen has been in compliance with all such covenants.
Debenture loans
In April 2009 Nielsen issued $500 million in aggregate principal amount of 11.5% Senior Notes due 2016 at an issue price of $461 million with cash proceeds of approximately $452 million, net of fees and expenses.
F-38
Table of Contents
Nielsen Holdings B.V.
Notes to Consolidated Financial Statements—(Continued)
In January 2009 Nielsen issued $330 million in aggregate principal amount of 11.625 % Senior Notes due 2014 at an issue price of $297 million with cash proceeds of approximately $290 million, net of fees and expenses.
In August 2006, Nielsen issued $650 million 10% and €150 million 9% senior notes due 2014. On April 16, 2008, Nielsen issued $220 million aggregate principal amount of additional 10% Senior Notes due 2014. These notes are referred to collectively as the “Senior Notes”. The carrying values of the combined issuances of these notes were $1,848 million and $1,078 million at December 31, 2009 and 2008, respectively. Interest is payable semi-annually. The Senior Notes are senior unsecured obligations and rank equal in right of payment to all of Nielsen’s existing and future senior indebtedness.
In August 2006, Nielsen also issued $1,070 million 12.5% senior subordinated discount notes due 2016 (“Senior Subordinated Discount Notes”) with a carrying amount of $885 million and $784 million at December 31, 2009 and December 31, 2008, respectively. Interest accretes through 2011 and is payable semi-annually commencing February 2012. The Senior Subordinated Discount Notes are unsecured senior subordinated obligations and are subordinated in right of payment to all Nielsen’s existing and future senior indebtedness, including the Senior Notes and the senior secured credit facilities.
The indentures governing the Senior Notes and Senior Subordinated Discount Notes limit the majority of Nielsen’s subsidiaries’ ability to incur additional indebtedness, pay dividends or make other distributions or repurchase our capital stock, make certain investments, enter into certain types of transactions with affiliates, use assets as security in other transactions and sell certain assets or merge with or into other companies subject to certain exceptions. Upon a change in control, Nielsen is required to make an offer to redeem all of the Senior Notes and Senior Subordinated Discount Notes at a redemption price equal to the 101% of the aggregate accreted principal amount plus accrued and unpaid interest. The Senior Notes and Senior Subordinated Discount Notes are jointly and severally guaranteed by Nielsen.
In August 2006, Nielsen issued €343 million 11.125% senior discount notes due 2016 (“Senior Discount Notes”), with a carrying value of $415 million and $362 million at December 31, 2009 and 2008, respectively. Interest accretes through 2011 and is payable semi-annually commencing February 2012. The Senior Discount Notes are senior unsecured obligations and rank equal in right of payment to all of Nielsen’s existing and future senior indebtedness. The notes are effectively subordinated to Nielsen’s existing and future secured indebtedness to the extent of the assets securing such indebtedness and will be structurally subordinated to all obligations of Nielsen’s subsidiaries.
Nielsen has a Euro Medium Term Note (“EMTN”) program in place under which no further debenture loans and private placements can be issued. All debenture loans and most private placements are quoted on the Luxembourg Stock Exchange. At December 31, 2009 and 2008, amounts with a carrying value of $233 million and $595 million, respectively, were outstanding under the EMTN program. In May 2010, our EUR 50 million variable rate EMTN matured and was repaid.
In March 2009 the Company purchased and cancelled approximately GBP 101 million of the total GBP 250 million outstanding 5.625% EMTN debenture notes. This transaction was pursuant to a cash tender offer, whereby the Company paid, and participating note holders received, a price of GBP 940 per GBP 1,000 in principal amount of the notes, plus accrued interest. In conjunction with the GBP note cancellation the Company satisfied, and paid in cash, a portion of the remarketing settlement value associated with the cancelled notes to the two holders of a remarketing option associated with the notes. In addition, the Company unwound a portion of its existing GBP/Euro foreign currency swap, which was previously designated as a foreign currency cash
F-39
Table of Contents
Nielsen Holdings B.V.
Notes to Consolidated Financial Statements—(Continued)
flow hedge. The Company recorded a net loss of $3 million as a result of the combined elements of this transaction in March 2009 as a component of other expense, net in the consolidated statement of operations. The net cash paid for the combined elements of this transaction was approximately $197 million.
In June 2009, the Company purchased and cancelled all of its remaining outstanding GBP 149 million 5.625% EMTN debenture notes. This transaction was pursuant to a cash tender offer, whereby the Company paid, and participating note holders received, par value for the notes, plus accrued interest. In conjunction with the GBP note cancellation the Company satisfied, and paid in cash, the remarketing settlement value to the two holders of the remaining portion of the remarketing option associated with the notes. In addition, the Company unwound the remaining portion of its existing GBP/Euro foreign currency swap, which was previously designated as a foreign currency cash flow hedge. The Company recorded a net loss of approximately $12 million in June 2009 as a component of other expense, net in the consolidated statement of operations as a result of the combined elements of this transaction. The net cash paid for the combined elements of this transaction was approximately $330 million.
Deferred financing costs
The costs related to the issuance of debt are capitalized and amortized to interest expense using the effective interest method over the life of the related debt. Deferred financing costs are $135 million and $112 million at December 31, 2009 and 2008, respectively.
Related party lenders
In May 2006, Luxco, the Company’s direct parent, executed a loan agreement with the Company for principal amount Euro 500 million in conjunction with Valcon’s acquisition of TNC B.V. The loan accreted interest at 10.00% per annum and was payable annually at the request of Luxco or the Company. If interest was not paid at the end of each year, such interest was deemed to be capitalized. No interest was paid on this loan through December 31, 2008 and the corresponding carrying value at such date, including capitalized interest, was $892 million. In January 2009 the loan agreement was terminated and the underlying carrying value, including accrued interest, was capitalized by Luxco in exchange for 78,332,870 shares in the Company’s common stock. Nielsen recorded $3 million, $86 million and $73 million in interest expense associated with this loan for the years ended December 31, 2009, 2008 and 2007, respectively.
A portion of the borrowings under the senior secured credit facility have been purchased by certain of the Sponsors in market transactions not involving the Company. Amounts held by the Sponsors were $554 million and $445 million as of December 31, 2009 and 2008, respectively. Interest expense associated with amounts held by the Sponsors approximated $16 million, $22 million and $28 million during the years ended December 31, 2009, 2008 and 2007, respectively.
Capital Lease and Other Obligations
Nielsen finances certain computer equipment, software, buildings and automobiles under capital leases and related transactions. These arrangements do not include terms of renewal, purchase options, or escalation clauses.
Assets under capital lease are recorded within property, plant and equipment See Note 6 “Property, Plant and Equipment.”
F-40
Table of Contents
Nielsen Holdings B.V.
Notes to Consolidated Financial Statements—(Continued)
Future minimum capital lease payments under non-cancelable capital leases at December 31, 2009 are as follows:
| (IN MILLIONS) |
|||
| 2010 |
$ | 19 | |
| 2011 |
19 | ||
| 2012 |
19 | ||
| 2013 |
19 | ||
| 2014 |
15 | ||
| Thereafter |
130 | ||
| Total |
221 | ||
| Less: amount representing interest |
90 | ||
| Present value of minimum lease payments |
$ | 131 | |
| Current portion |
$ | 7 | |
| Total non-current portion |
124 | ||
| Present value of minimum lease payments |
$ | 131 | |
Capital leases and other financing transactions have effective interest rates ranging from 4% to 10%. Interest expense recorded related to capital leases and other financing transactions during the years ended December 31, 2009, 2008 and 2007 was $11 million, $10 million and $10 million, respectively.
11. Stockholders’ Equity
The Company has the authority to issue 1,250,000,000 common stock with a par value of Euro 0.04 per share under its articles of association. No dividends were declared or paid on the common stock in 2009, 2008 or 2007. Common stock activity is as follows:
| Year ended December 31, 2009 |
Year ended December 31, 2008 |
Year ended December 31, 2007 |
|||||||
| (Actual number of shares outstanding) |
|||||||||
| Beginning of year |
362,965,702 | 362,217,956 | 351,861,422 | ||||||
| Shares issued to management |
1,057,516 | 979,118 | 5,376,534 | ||||||
| Shares issued to Luxco |
78,332,870 | — | 5,000,000 | ||||||
| Share repurchases |
(505,145 | ) | (231,372 | ) | (20,000 | ) | |||
| End of year |
441,850,943 | 362,965,702 | 362,217,956 | ||||||
Shares repurchased described above are privately negotiated transactions. Cumulative treasury shares were 756,517 and 251,372 as of December 31, 2009 and 2008, respectively with a corresponding value of $8 million and $3 million, respectively.
12. Share-Based Compensation
In connection with the Valcon Acquisition, Nielsen implemented an equity-based, management compensation plan (“Equity Participation Plan” or “EPP”) to align compensation for certain key executives with the performance of the Company. Under this plan, certain of the Company’s executives may be granted stock options, stock appreciation rights, restricted stock and dividend equivalent rights in the shares of the Company or purchase its shares.
F-41
Table of Contents
Nielsen Holdings B.V.
Notes to Consolidated Financial Statements—(Continued)
Nielsen granted 887,444, 1,379,097 and 8,130,350 time-based and 887,444, 1,379,097 and 8,130,350 performance-based stock options to purchase shares during the years ended December 31, 2009, 2008 and 2007, respectively. As of December 31, 2009, the total number of shares authorized for award of options or other equity-based awards was 35,030,000. The 2009 time-based awards become exercisable over a four-year vesting period tied to the executives’ continuing employment as follows: 25% on December 31, 2009 and 25% on the last day of each of the next three calendar years. The 2008 time-based awards become exercisable over a four-year vesting period tied to the executives’ continuing employment as follows: 25% on December 31, 2008 and 25% on the last day of each of the next three calendar years. The 2007 time-based awards become exercisable over a five-year vesting period to the executives’ continuing employment as follows: 5% upon grant date, 19% on the December 31, 2007 and 19% on the last day of each of the next four calendar years. The 2009 and 2008 performance options are tied to the executives’ continued employment and become vested and exercisable based on the achievement of certain annual EBITDA targets over a four-year vesting period. The 2007 and 2006 performance options are tied to the executives’ targets over a five-year vesting period. If the annual EBITDA targets are achieved on a cumulative basis for any current year and prior years, the options become vested as to a pro-rata portion for any prior year installments which were not vested because of failure to achieve the applicable annual EBITDA target. Both option tranches expire ten years from date of grant. Upon a change in control, any then-unvested time options will fully vest and any then-unvested performance options can vest, subject to certain conditions.
Nielsen’s share option plan activity is summarized below:
| Number Of
Options (Time Based and Performance Based) |
Weighted-Average Exercise Price |
|||||
| Outstanding at January 1, 2007 |
7,000,000 | 11.43 | ||||
| Granted |
16,260,700 | 11.41 | ||||
| Replacement Awards |
1,615,225 | 3.28 | ||||
| Expired |
— | — | ||||
| Canceled |
— | — | ||||
| Forfeited |
(536,685 | ) | (11.33 | ) | ||
| Exercised |
— | — | ||||
| Outstanding at December 31, 2007 |
24,339,240 | 10.88 | ||||
| Granted |
2,758,194 | 12.24 | ||||
| Replacement Awards. |
382,216 | 2.75 | ||||
| Expired |
— | — | ||||
| Canceled |
— | — | ||||
| Forfeited |
(1,080,535 | ) | (11.58 | ) | ||
| Exercised |
(309,262 | ) | (6.53 | ) | ||
| Outstanding at December 31, 2008 |
26,089,853 | 10.93 | ||||
| Granted |
1,774,888 | 11.40 | ||||
| Replacement Awards |
— | — | ||||
| Expired |
— | — | ||||
| Canceled |
— | — | ||||
| Forfeited |
(1,644,303 | ) | (11.43 | ) | ||
| Exercised |
(52,763 | ) | (2.53 | ) | ||
| Outstanding at December 31, 2009 |
26,167,675 | 10.95 | ||||
F-42
Table of Contents
Nielsen Holdings B.V.
Notes to Consolidated Financial Statements—(Continued)
The following table summarizes information about the nonvested shares as of December 31, 2009.
| Number Of Nonvested Options (Time Based and Performance Based) |
Weighted-Average Exercise Price |
|||||
| Nonvested at January 1, 2007 |
6,650,000 | 11.43 | ||||
| Granted |
16,260,700 | 11.41 | ||||
| Replacement Awards |
1,615,225 | 3.28 | ||||
| Vested |
(6,417,196 | ) | (9.68 | ) | ||
| Forfeited |
(536,685 | ) | (11.33 | ) | ||
| Nonvested at December 31, 2007 |
17,572,044 | 11.30 | ||||
| Granted |
2,758,194 | 12.24 | ||||
| Replacement Awards |
382,216 | 2.75 | ||||
| Vested |
(2,712,821 | ) | (10.58 | ) | ||
| Forfeited |
(1,080,535 | ) | (11.58 | ) | ||
| Nonvested at December 31, 2008 |
16,919,098 | 11.36 | ||||
| Granted |
1,774,888 | 11.40 | ||||
| Replacement Awards |
— | — | ||||
| Vested |
(5,115,436 | ) | (11.35 | ) | ||
| Forfeited |
(1,644,303 | ) | (11.43 | ) | ||
| Nonvested at December 31, 2009 |
11,934,247 | 11.37 | ||||
The replacement awards are time based awards and relate to the acquisitions of IAG in 2008 and Nielsen BuzzMetrics and Telephia in 2007. See the “Nielsen BuzzMetrics” note below.
On March 17, 2009, Nielsen completed an acquisition and allocated 681,818 shares to the selling stockholders. The shares vest ratably over three years on the annual anniversary date of the acquisition, subject to certain conditions.
On May 15, 2008, Nielsen completed the acquisition of IAG and concurrently provided 382,216 replacement awards under Nielsen’s existing Equity Participation Plan. The replacement awards granted on May 15, 2008, have exercise prices of $2.75 and a weighted average fair value of $8.25. All replacement options are vested under the identical terms applicable to Nielsen IAG options for which they were exchanged and the fair values of such awards which were vested were allocated as part of the preliminary purchase price allocation.
On August 9, 2007, Nielsen completed the acquisition of Telephia and concurrently provided 750,276 replacement options under Nielsen’s existing Equity Participation Plan. The replacement awards granted on August 9, 2007, have exercise prices ranging from $1.30 to $2.50 and a weighted average fair value of $8.07. All replacement options were fully vested and the fair values at grant date of such awards were allocated as part of the purchase price allocation.
The Black-Scholes option-pricing model was used to evaluate the fair value of the replacement awards with the assumptions consistent with the options granted under the Company’s Equity Participation Plan.
Time-based and performance-based options, excluding the replacement awards, have exercise prices of $10.00 and $20.00 per share for the year ended December 31, 2009 and 2007 and exercise prices of $11.00 and $22.00 per share for the year ended December 31, 2008. As of December 31, 2009, 2008 and 2007, the fair
F-43
Table of Contents
Nielsen Holdings B.V.
Notes to Consolidated Financial Statements—(Continued)
values of the time-based and performance-based awards were estimated using the Black-Scholes option pricing model. Expected volatility is based primarily on a combination of the estimates of implied volatility of the Company’s peer-group and the Company’s historical volatility adjusted for its leverage.
The following weighted average assumption ranges were used during 2009, 2008 and 2007:
| Year Ended December 31, | |||||||||
| 2009 | 2008 | 2007 | |||||||
| Expected life (years) |
3.42 - 4.08 | 2.93 - 3.02 | 3.42 - 4.31 | ||||||
| Risk-free interest rate |
1.70 - 2.07 | % | 2.77 | % | 3.17 - 4.77 | % | |||
| Expected dividend yield |
0 | % | 0 | % | 0 | % | |||
| Expected volatility |
54.00 - 62.00 | % | 39.00 | % | 46.50 - 56.10 | % | |||
| Weighted average volatility |
57.77 | % | 39.00 | % | 55.03 | % | |||
The weighted average grant date fair values for the time-based and performance-based options granted during the year ended December 31, 2009 are $4.16 and $4.16, respectively.
The Company recorded stock compensation expense of $14 million, $18 million and $41 million for the years ended December 31, 2009, 2008 and 2007, respectively. In the second quarter of 2009, the Company determined that it is not probable that the performance options that were expected to vest in December 31, 2010 and 2011 would vest. Because the performance options are no longer expected to vest, the cumulative share based compensation expense of $10 million related to these options were reversed; including $8 million recorded in prior years, and was accounted for as a change is estimate. Further, on June 2, 2009, a modification was made to the vesting provisions of the performance options scheduled to vest on December 31, 2010 and 2011. If the respective performance targets are not achieved, the modification will allow those performance options to convert to time based options, subject to continued employment, with a stated vesting date of December 31, 2012 and 2013, for the 2010 and 2011 options. The compensation expense related to the modification of the performance-based awards to time based awards scheduled to vest in 2012 through 2013 was recorded on a graded vesting method as of December 31, 2009 since the Company believes that the achievement of the financial performance goals is not probable. The expense in 2008 included the reversal of $4 million recorded in prior years for 2,388,145 performance options that did not vest as the Company did not meet its performance targets. The tax benefit related to the stock compensation expense was $4 million, $6 million and $16 million, for the respective periods.
In June 2009, the Company granted 350,000 time-based stock options to affiliates of Centerview Partners (“Centerview”), a stockholder of Nielsen parent, in connection with one of its partners being elected Chairman of the Supervisory Board of Nielsen. As of December 31, 2009, Centerview collectively holds 500,000 performance-based options and 350,000 time-based options to purchase shares in the Company. Cumulative expense related to these outstanding options amounted to approximately $2 million through December 31, 2009.
At December 31, 2009, there is approximately $34 million of unearned share-based compensation which the Company expects to record as share based compensation expense over the next five years. The compensation expense related to the time-based awards is amortized over the term of the award using the graded vesting method.
The weighted-average exercise price of the 26,167,675 options outstanding and 14,233,429 options exercisable was $10.95 and $10.55 as of December 31, 2009. The weighted-average remaining contractual term for the options outstanding and exercisable as of December 31, 2009 was 7.4 years and 7.2 years, respectively.
F-44
Table of Contents
Nielsen Holdings B.V.
Notes to Consolidated Financial Statements—(Continued)
As of December 31, 2009, 2008 and 2007, the weighted-average grant date fair value of the options granted was $4.16, $3.66, and $4.78, respectively, and the aggregate fair value of options vested was $24 million, $13 million and $34 million, respectively.
There were 52,763 options exercised for the year ended December 31, 2009.
The aggregate intrinsic value of options outstanding and exercisable was $29 million.
In both 2009 and 2007, 100,000 restricted stock units (RSUs) ultimately payable in shares of common stock were granted under the existing Equity Participation Plan. One third of the 2009 awards vest on December 31, 2010 and the remaining vest ratably at thirty three percent for the two years thereafter. Twenty percent of the 2007 awards vested upon the date of grant and the remaining vest ratably at twenty percent per year beginning with the first anniversary of the grant date. The restrictions on the awards lapse consistently along with the vesting terms and become 100 percent vested immediately prior to a change in control. The estimated grant date fair value of these units was $10.00. The impact of these grants was not material to the consolidated financial statements for any of the periods presented.
Subsidiary Share-Based Compensation
Nielsen//NetRatings
On June 22, 2007, concurrent with Nielsen’s acquisition of the remaining outstanding shares of Nielsen//NetRatings, all outstanding vested and unvested stock options and restricted stock units (“RSU’s”) of Nielsen//NetRatings were cancelled. Nielsen//NetRatings paid to each holder of options cash equal to the excess of the offer price of $21.00 per share over the exercise price, and paid $21.00 for each RSU outstanding. Cash required to settle all outstanding share-based awards totaled $33 million during 2007.
Nielsen recorded share-based payment expense for Nielsen//NetRatings’ compensation arrangements of $6 million for the year ended December 31, 2007. There is no book tax benefit related to the compensation expense as Nielsen//NetRatings has a full tax valuation allowance due to accumulated losses.
Information with respect to Nielsen//NetRatings’ plan activity is summarized as follows:
| Available for Grant |
Restricted Stock Outstanding | Stock Options Outstanding | |||||||||||
| Number
of Restricted Shares |
Weighted Average Grant Date Fair Value |
Number of Stock Options |
Weighted Average Exercise Price | ||||||||||
| Outstanding at January 1, 2007 |
419,000 | 774,000 | 13.77 | 2,225,000 | 10.76 | ||||||||
| Granted |
(4,000 | ) | 4,000 | 20.10 | — | — | |||||||
| Exercised/released |
390,000 | (270,000 | ) | 14.22 | (120,000 | ) | 8.44 | ||||||
| Restricted stock withheld for taxes(1) |
56,000 | — | — | — | — | ||||||||
| Canceled |
20,000 | (17,000 | ) | 13.42 | (3,000 | ) | 9.66 | ||||||
| Settled |
(881,000 | ) | (491,000 | ) | 13.56 | (2,102,000 | ) | 10.89 | |||||
| Outstanding at December 31, 2007 |
— | — | — | — | — | ||||||||
| (1) | Upon the release of certain shares of restricted stock, the Company withheld shares to satisfy certain tax obligations of the holder based on the market value of the shares on the date the shares of restricted stock were released. |
F-45
Table of Contents
Nielsen Holdings B.V.
Notes to Consolidated Financial Statements—(Continued)
Nielsen BuzzMetrics
On June 4, 2007, Nielsen completed the acquisition of the remaining outstanding shares of its subsidiary Nielsen BuzzMetrics and concurrently cancelled the majority of Nielsen BuzzMetrics outstanding vested and unvested options while certain executives obtained 864,949 replacement options under Nielsen’s existing Equity Participation Plan. The cancelled option holders received cash equal to the excess of the offer price of $7.79 over the exercise price, totaling $4 million. The acceleration expense recognized for the unvested options was not significant. Nielsen recognized $5 million in share-based compensation for Nielsen BuzzMetrics for the year ended December 31, 2007.
The Black-Scholes option-pricing model was used to evaluate the fair value of the replacement awards with assumptions consistent with the options granted under the Company’s Equity Participation Plan. The replacement awards granted on June 4, 2007, have exercise prices ranging from $0.10 to $10.00 and a weighted average grant date fair value of $5.19. The modification of certain awards to replacement options resulted in an insignificant amount of incremental compensation expense based on the newly determined fair value.
All Nielsen BuzzMetrics’ equity awards were modified to liability awards under applicable accounting standards due to the existence of a put feature on the underlying shares which permits the option holders to avoid the risk and rewards normally associated with equity ownership. On November 30, 2006, it became probable that the put right would become operable when Nielsen committed to acquiring an additional interest in Nielsen BuzzMetrics in 2007. The unvested portion of the options will be adjusted to fair value at each balance sheet date thereafter until the awards are settled with the adjustment recognized in the Consolidated Statements of Operations.
For purposes of Nielsen’s consolidated financial statements, Nielsen recorded no share-based compensation expense from Nielsen BuzzMetrics’ options for the period from June 4, 2007 to December 31, 2007.
A summary of Nielsen BuzzMetrics’ option activity is as follows:
| Number of Options |
Weighted-Average Exercise Price | ||||
| Outstanding at January 1, 2007 |
1,950,864 | 2.67 | |||
| Granted |
54,000 | 6.52 | |||
| Exercised |
— | — | |||
| Forfeited |
(29,401 | ) | 5.07 | ||
| Settled |
(865,131 | ) | 2.35 | ||
| Replacement Awards |
(1,110,332 | ) | 3.10 | ||
| Outstanding at December 31, 2007 |
— | — | |||
13. Income Taxes
The components of loss from continuing operations before income taxes and equity in net (loss)/income of affiliates, were:
| Year Ended December 31, | ||||||||||||
| (IN MILLIONS) |
2009 | 2008 | 2007 | |||||||||
| Dutch |
$ | 353 | $ | (46 | ) | $ | (7 | ) | ||||
| Non-Dutch |
(956 | ) | (225 | ) | (347 | ) | ||||||
| Loss from continuing operations before income taxes and equity in net (loss)/income of affiliates |
$ | (603 | ) | $ | (271 | ) | $ | (354 | ) | |||
F-46
Table of Contents
Nielsen Holdings B.V.
Notes to Consolidated Financial Statements—(Continued)
The above amounts for Dutch and non-Dutch activities were determined based on the location of the taxing authorities.
The (benefit)/provision for income taxes attributable to loss from continuing operations before income taxes and equity in net (loss)/income of affiliates consisted of:
| Year ended December 31, | ||||||||||||
| (IN MILLIONS) |
2009 | 2008 | 2007 | |||||||||
| Current: |
||||||||||||
| Dutch |
$ | 4 | $ | — | $ | (40 | ) | |||||
| Non-Dutch |
86 | 130 | 106 | |||||||||
| 90 | 130 | 66 | ||||||||||
| Deferred: |
||||||||||||
| Dutch |
15 | 16 | 61 | |||||||||
| Non-Dutch |
(302 | ) | (110 | ) | (115 | ) | ||||||
| (287 | ) | (94 | ) | (54 | ) | |||||||
| Total |
$ | (197 | ) | $ | 36 | $ | 12 | |||||
The Company’s (benefit)/provision for income taxes for the years ended December 31, 2009, 2008 and 2007 was different from the amount computed by applying the statutory Dutch federal income tax rates to loss from continuing operations before income taxes and equity in net (loss)/income of affiliates as a result of the following:
| Year ended December 31, | ||||||||||||
| (IN MILLIONS) |
2009 | 2008 | 2007 | |||||||||
| Loss from continuing operations before income taxes and equity in net (loss)/income of affiliates |
$ | (603 | ) | $ | (271 | ) | $ | (354 | ) | |||
| Dutch statutory tax rate |
25.5 | % | 25.5 | % | 25.5 | % | ||||||
| Benefit for income taxes at the Dutch statutory rate |
$ | (154 | ) | $ | (69 | ) | $ | (90 | ) | |||
| Impairment of goodwill and intangible assets |
70 | 20 | — | |||||||||
| Basis difference in sale of subsidiary |
— | 6 | — | |||||||||
| Foreign tax credits |
(20 | ) | — | — | ||||||||
| Tax impact on distributions from foreign subsidiaries |
— | 13 | 74 | |||||||||
| Effect of operations in non-Dutch jurisdictions, including foreign tax credits |
(61 | ) | (19 | ) | (32 | ) | ||||||
| U.S. state and local taxation |
(26 | ) | 11 | 3 | ||||||||
| Effect of Dutch financing activities |
(6 | ) | 22 | — | ||||||||
| Changes in estimates for uncertain tax positions |
(5 | ) | 37 | 36 | ||||||||
| Changes in valuation allowances |
7 | 4 | 17 | |||||||||
| Non-deductible interest expense |
— | — | (7 | ) | ||||||||
| Other, net |
(2 | ) | 11 | 11 | ||||||||
| Total (benefit)/provision for income taxes |
$ | (197 | ) | $ | 36 | $ | 12 | |||||
| Effective tax rate |
32.7 | % | (13.3 | )% | (3.4 | )% | ||||||
F-47
Table of Contents
Nielsen Holdings B.V.
Notes to Consolidated Financial Statements—(Continued)
The components of current and non-current deferred income tax assets/(liabilities) were:
| (IN MILLIONS) |
December 31, 2009 |
December 31, 2008 |
||||||
| Deferred tax assets (on balance): |
||||||||
| Net operating loss carryforwards |
$ | 531 | $ | 582 | ||||
| Interest expense limitation |
141 | 15 | ||||||
| Deferred compensation |
30 | 41 | ||||||
| Financial instruments |
192 | 174 | ||||||
| Employee benefits |
44 | 25 | ||||||
| Fixed asset depreciation |
28 | — | ||||||
| Tax credit carryforwards |
58 | 36 | ||||||
| Share-based payments |
28 | 18 | ||||||
| Accrued expenses |
33 | 55 | ||||||
| Other assets |
33 | 45 | ||||||
| 1,118 | 991 | |||||||
| Valuation allowances |
(233 | ) | (234 | ) | ||||
| Deferred tax assets, net of valuation allowances |
885 | 757 | ||||||
| Deferred tax liabilities (on balance): |
||||||||
| Intangible assets |
(1,733 | ) | (1,875 | ) | ||||
| Interest expense limitation |
— | — | ||||||
| Fixed asset depreciation |
— | (19 | ) | |||||
| Deferred revenues / costs |
(45 | ) | (60 | ) | ||||
| Computer software |
(141 | ) | (94 | ) | ||||
| (1,919 | ) | (2,048 | ) | |||||
| Net deferred tax liability |
$ | (1,034 | ) | $ | (1,291 | ) | ||
| Recognized as: |
||||||||
| Deferred income taxes, current |
$ | (19 | ) | $ | (18 | ) | ||
| Deferred income taxes, non-current |
(1,015 | ) | (1,273 | ) | ||||
| Total |
$ | (1,034 | ) | $ | (1,291 | ) | ||
At December 31, 2009 and 2008, the Company had net operating loss carryforwards of approximately $1,588 million and $1,679 million, respectively, which will begin to expire in 2010, of which approximately $993 million relates to the U.S. In addition, the Company had tax credit carryforwards of approximately $58 million and $36 million at December 31, 2009 and 2008, respectively, which will begin to expire in 2010. In certain jurisdictions, the Company has operating losses and other tax attributes that due to the uncertainty of achieving sufficient profits to utilize these operating loss carryforwards and tax credit carryforwards, the Company currently believes it is more likely than not that a portion of these losses will not be realized. Therefore, the Company has recorded a valuation allowance of approximately $203 million and $205 million at December 31, 2009 and 2008, related to these net operating loss carryforwards and tax credit carryforwards. In addition, the Company has established valuation allowances of $30 million and $29 million, at December 31, 2009 and 2008, respectively, on deferred tax assets related to other temporary differences, which the Company currently believes will not be realized.
As a consequence of the significant restructuring of the ownership of the Nielsen non-U.S. subsidiaries in 2007 and 2008 the Company has determined that as of December 31, 2009 no income taxes are required to be
F-48
Table of Contents
Nielsen Holdings B.V.
Notes to Consolidated Financial Statements—(Continued)
provided for on the approximately $2.8 billion, which is the excess of the book value of its investment in non-U.S. subsidiaries over the corresponding tax basis. Certain of these differences can be eliminated at a future date without tax consequences and the remaining difference which is equal to the undistributed historic earnings of such subsidiaries are indefinitely reinvested. It is not practical to estimate the additional income taxes and applicable withholding that would be payable on the remittance of such undistributed historic earnings.
At December 31, 2009 and 2008, the Company had gross uncertain tax positions of $129 million and $187 million, respectively. The Company has also accrued interest and penalties associated with these uncertain tax positions as of December 31, 2009 and 2008 of $23 million and $22 million, respectively. Estimated interest and penalties related to the underpayment of income taxes is classified as a component of benefit/(provision) for income taxes in the Consolidated Statement of Operations. The total amount of interest and penalties resulted in net expenses of $1 million, $1 million and $4 million for the years ended December 31, 2009, 2008 and 2007, respectively.
A reconciliation of the beginning and ending amount of unrecognized tax benefits is as follows:
| (IN MILLIONS) |
December 31, 2009 |
December 31, 2008 |
||||||
| Balance as of the beginning of period |
$ | 187 | $ | 195 | ||||
| Additions for current year tax positions |
7 | 36 | ||||||
| Additions for tax positions of prior years |
7 | 18 | ||||||
| Reductions for lapses of statute of limitations |
(74 | ) | (56 | ) | ||||
| Cumulative Translation of Non-U.S. denominated positions |
2 | (6 | ) | |||||
| Balance as of the end of the period |
$ | 129 | $ | 187 | ||||
These gross contingency additions do not take into account offsetting tax benefits associated with the correlative effects of potential adjustments. The uncertain tax position gross balance also includes cumulative translation adjustments associated with non-U.S. dollar denominated tax exposures.
If the balance of the Company’s uncertain tax positions is sustained by the taxing authorities in the Company’s favor, the reversal of the entire balance would reduce the Company’s effective tax rate in future periods.
The Company files numerous consolidated and separate income tax returns in the U.S. federal jurisdiction and in many state and foreign jurisdictions. With few exceptions, the Company is no longer subject to U.S. federal income tax examinations for 2005 and prior periods. In addition, the Company has subsidiaries in various states, provinces and countries that are currently under audit for years ranging from 1997 through 2008.
The IRS also commenced examinations of certain Company’s U.S. federal income tax returns for 2006 and 2007 in the first quarter of 2009. The Company is also under Canadian audit for the years 2006 and 2007. With the exception of the 2006 and 2007 U.S. federal examinations, it is anticipated that all examinations will be completed within the next twelve months. To date, the Company is not aware of any material adjustments not already accrued related to any of the current federal, state or foreign audits under examination.
It is reasonably possible that a reduction in a range of $9 million to $38 million of uncertain tax positions may occur within 12 months as a result of projected resolutions of worldwide tax disputes.
F-49
Table of Contents
Nielsen Holdings B.V.
Notes to Consolidated Financial Statements—(Continued)
14. Investments in Affiliates and Related Party Transactions
As of December 31, 2009 and 2008, Nielsen had investments in affiliates of $82 million and $117 million, respectively. Nielsen’s only significant investment, and its percentage of ownership as of December 31, 2009, was its 51% non-controlling ownership interest in Scarborough Research (“Scarborough”). During the third quarter of 2009, the Company concluded that the carrying value of its non-controlling ownership interest in Scarborough was impaired as a result of continued declines in customer discretionary spending and the related impact on the launch of new performance tracking and marketing products. The Company deemed this impairment to be other than temporary and, accordingly, recorded an after-tax non-cash impairment charge of $26 million (net of a tax adjustment of $18 million) during the period in “Equity in net loss of affiliates” in the Consolidated Statement of Operations. As of December 31, 2009, the carrying value of the Company’s investment in Scarborough was $54 million.
As discussed in Note 3 “Business Acquisitions,” on December 19, 2008 Nielsen completed the purchase of the remaining 50% interest in AGBNMR, a leading international television audience media measurement business, from WPP in exchange for certain assets valued at $72 million. Net cash acquired in this transaction was $23 million.
On October 30, 2007, Nielsen completed the sale of its 50% interest in VNU Exhibitions Europe B.V. to Jaarbeurs (Holding) B.V. for $51 million.
Related Party Transactions with Affiliates
Nielsen and Scarborough enter into various related party transactions in the ordinary course of business, including Nielsen’s providing certain general and administrative services to Scarborough. Nielsen pays royalties to Scarborough for the right to include Scarborough data in Nielsen products sold directly to Nielsen customers. Additionally, Nielsen sells various Scarborough products directly to its clients, for which it receives a commission from Scarborough. As a result of these transactions Nielsen received net payments from Scarborough of $9 million, $9 million and $15 million for the years ended December 31, 2009, 2008 and 2007. Obligations between Nielsen and Scarborough are settled in cash, on a monthly basis in the ordinary course of business and amounts outstanding were not material at December 31, 2009 or 2008.
Transactions with Sponsors
In connection with the Valcon Acquisition, two of Nielsen’s subsidiaries and the Sponsors entered into Advisory Agreements, which provide for an annual management fee, in connection with planning, strategy, oversight and support to management, and are payable quarterly and in advance to each Sponsor, on a pro rata basis, for the eight year duration of the agreements, as well as reimbursements for each Sponsor’s respective out-of-pocket expenses in connection with the management services provided under the agreement. Annual management fees are $10 million in the first year starting on the effective date of the Valcon Acquisition, and increases by 5% annually thereafter.
The Advisory Agreements provide that upon the consummation of a change in control transaction or an initial public offering in excess of $200 million, each of the Sponsors will receive, in lieu of quarterly payments of the annual management fee, a fee equal to the net present value of the aggregate annual management fee that would have been payable to the Sponsors during the remainder of the term of the agreements (assuming an eight year term of the agreements), calculated using the treasury rate having a final maturity date that is closest to the eighth anniversary of the date of the agreements.
The Advisory Agreements also provide that Nielsen will indemnify the Sponsors against all losses, claims, damages and liabilities arising in connection with the management services provided by the Sponsors under the fee agreement.
F-50
Table of Contents
Nielsen Holdings B.V.
Notes to Consolidated Financial Statements—(Continued)
For the years ended December 31, 2009, 2008 and 2007, the Company recorded $12 million, $11 million and $11 million, respectively in selling, general and administrative expenses related to these management fees, sponsor travel and consulting.
At December 31, 2008, long-term debt included $892 million associated with a loan payable to Luxco. See Note 10 “Long-term Debt and Other Financing Arrangements” for more information on this loan.
Equity Healthcare LLC
Effective January 1, 2009, Nielsen entered into an employer health program arrangement with Equity Healthcare LLC (“Equity Healthcare”). Equity Healthcare negotiates with providers of standard administrative services for health benefit plans and other related services for cost discounts, quality of service monitoring, data services and clinical consulting and oversight by Equity Healthcare. Because of the combined purchasing power of its client participants, Equity Healthcare is able to negotiate pricing terms from providers that are believed to be more favorable than the companies could obtain for themselves on an individual basis. Equity Healthcare is an affiliate of The Blackstone Group, one of the Sponsors.
In consideration for Equity Healthcare’s provision of access to these favorable arrangements and its monitoring of the contracted third parties’ delivery of contracted services to us, we pay Equity Healthcare a fee of $2 per participating employee per month (“PEPM Fee”). As of December 31, 2009, Nielsen had approximately 8,000 employees enrolled in its self-insured health benefit plans in the United States. Equity Healthcare may also receive a fee (“Health Plan Fees”) from one or more of the health plans with whom Equity Healthcare has contractual arrangements if the total number of employees joining such health plans from participating companies exceeds specified thresholds.
15. Commitments and Contingencies
Leases and Other Contractual Arrangements
On February 19, 2008, Nielsen amended and restated its Master Services Agreement dated June 16, 2004 (“MSA”), with Tata America International Corporation and Tata Consultancy Services Limited (jointly “TCS”). The term of the amended and restated MSA is for ten years, effective October 1, 2007; with a one year renewal option granted to Nielsen, during which ten year period (or if Nielsen exercises its renewal option, eleven year period) Nielsen has committed to purchase at least $1 billion in services from TCS. Unless mutually agreed, the payment rates for services under the amended and restated MSA are not subject to adjustment due to inflation or changes in foreign currency exchange rates. TCS will provide Nielsen with Information Technology, Applications Development and Maintenance and Business Process Outsourcing services globally. The amount of the purchase commitment may be reduced upon the occurrence of certain events, some of which also provide us with the right to terminate the agreement.
In addition, in 2008, Nielsen entered into an agreement with TCS to outsource our global IT Infrastructure services. The agreement has an initial term of seven years, and provides for TCS to manage Nielsen’s infrastructure costs at an agreed upon level and to provide Nielsen’s infrastructure services globally for an annual service charge of $39 million per year, which applies towards the satisfaction of Nielsen’s aforementioned purchased services commitment with TCS of at least $1 billion over the term of the amended and restated MSA. The agreement is subject to earlier termination under certain limited conditions.
Nielsen has also entered into operating leases and other contractual obligations to secure real estate facilities, agreements to purchase data processing services and leases of computers and other equipment used in
F-51
Table of Contents
Nielsen Holdings B.V.
Notes to Consolidated Financial Statements—(Continued)
the ordinary course of business and various outsourcing contracts. These agreements are not unilaterally cancelable by Nielsen, are legally enforceable and specify fixed or minimum amounts or quantities of goods or services at fixed or minimum prices.
The amounts presented below represent the minimum annual payments under Nielsen’s purchase obligations that have initial or remaining non-cancelable terms in excess of one year. These purchase obligations include data processing, building maintenance, equipment purchasing, photocopiers, land and mobile telephone service, computer software and hardware maintenance, and outsourcing.
| For the Years Ending December 31, | |||||||||||||||||||||
| (IN MILLIONS) |
2010 | 2011 | 2012 | 2013 | 2014 | Thereafter | Total | ||||||||||||||
| Operating leases |
$ | 92 | $ | 74 | $ | 63 | $ | 47 | $ | 41 | $ | 80 | $ | 397 | |||||||
| Other contractual obligations |
331 | 220 | 219 | 132 | 4 | 2 | 908 | ||||||||||||||
| Total |
$ | 423 | $ | 294 | $ | 282 | $ | 179 | $ | 45 | $ | 82 | $ | 1,305 | |||||||
Total expenses incurred under operating leases were $107 million, $108 million and $120 million for the years ended December 31, 2009, 2008 and 2007, respectively. Nielsen recognized rental income received under subleases of $12 million, $10 million and $8 million for the years ended December 31, 2009, 2008 and 2007, respectively. At December 31, 2009, Nielsen had aggregate future proceeds to be received under non-cancelable subleases of $58 million.
Nielsen also has minimum commitments under non-cancelable capital leases. See Note 10 “Long-term Debt and Other Financing Arrangements” for further discussion.
Guarantees and Other Contingent Commitments
At December 31, 2009, Nielsen was committed under the following significant guarantee arrangements:
Sub-lease guarantees
Nielsen provides sub-lease guarantees in accordance with certain agreements pursuant to which Nielsen guarantees all rental payments upon default of rental payment by the sub-lessee. To date, the Company has not been required to perform under such arrangements, does not anticipate making any significant payments related to such guarantees and, accordingly, no amounts have been recorded.
Letters of credit and bank guarantees
Letters of credit and bank guarantees issued and outstanding amount to $17 million and $5 million at December 31, 2009 and 2008, respectively.
D&B Legacy Tax Matters
In November 1996, D&B, then known as The Dun & Bradstreet Corporation (“Old D&B”) separated into three public companies by spinning off the A.C. Nielsen Company (“ACNielsen”) and Cognizant Corporation (“Cognizant”) (the “1996 Spin-Off”).
In June 1998, Old D&B changed its name to R.H. Donnelley Corporation (“Donnelley”) and spun-off The Dun & Bradstreet Corporation (“New D&B”) (the “D&B Spin”), and Cognizant changed its name to Nielsen Media Research, Inc. (“NMR”), now part of Nielsen, and spun-off IMS Health (the “Cognizant Spin”). In
F-52
Table of Contents
Nielsen Holdings B.V.
Notes to Consolidated Financial Statements—(Continued)
September 2000, New D&B changed its name to Moody’s Corporation (“Moody’s”) and spun-off a company now called The Dun & Bradstreet Corporation (“Current D&B”) (the “Moody’s Spin”). In November 1999, Nielsen acquired NMR and in 2001 Nielsen acquired ACNielsen.
Pursuant to the agreements affecting the 1996 Spin-Off, among other factors, certain liabilities, including certain contingent liabilities and tax liabilities arising out of certain prior business transactions (the “D&B Legacy Tax Matters”), were allocated among Old D&B, ACNielsen and Cognizant. The agreements provide that any disputes regarding these matters are subject to resolution by arbitration.
In connection with the acquisition of NMR, Nielsen recorded in 1999, a liability for NMR’s aggregate liability for payments related to the D&B Legacy Tax Matters. In June 2009, Nielsen paid approximately $11 million for the settlement of all probable claims relating to these matters.
Sunbeam Television Corp.
Sunbeam Television Corp. (“Sunbeam”) filed a lawsuit in Federal District Court in Miami, Florida on April 30, 2009. The lawsuit alleges that Nielsen Media Research, Inc. violated Federal and Florida state antitrust laws and Florida’s unfair trade practices laws by attempting to maintain a monopoly and abuse its position in the market, and breached its contract with Sunbeam by producing defective ratings data through its sampling methodology. The complaint did not specify the amount of damages sought and also sought declaratory and equitable relief. Nielsen believes this lawsuit is without merit and intends to defend it vigorously.
Other Legal Proceedings and Contingencies
Nielsen is subject to litigation and other claims in the ordinary course of business.
16. Segments
The Company aligns its operating segments in order to conform to management’s internal reporting structure, which is reflective of service offerings by industry. Management aggregates such operating segments into three reporting segments: What Consumers Watch (“Watch”), consisting principally of television, online and mobile audience and advertising measurement and corresponding analytics; What Consumers Buy (“Buy”), consisting principally of market research information and analytical services; and Expositions, consisting principally of trade shows, events and conferences. Corporate consists principally of unallocated items such as certain facilities and infrastructure costs as well as intersegment eliminations.
Certain corporate costs, other than those described above, including those related to selling, finance, legal, human resources, and information technology systems, are considered operating costs and are allocated to our segments based on either the actual amount of costs incurred or on a basis consistent with the operations of the underlying segment. Information with respect to the operations of each of Nielsen’s business segments is set forth below based on the nature of the products and services offered and geographic areas of operations.
F-53
Table of Contents
Nielsen Holdings B.V.
Notes to Consolidated Financial Statements—(Continued)
Business Segment Information
| Year Ended December 31, | |||||||||
| (IN MILLIONS) |
2009 | 2008 | 2007 | ||||||
| Revenues |
|||||||||
| Watch |
$ | 1,635 | $ | 1,480 | $ | 1,339 | |||
| Buy |
2,993 | 3,084 | 2,868 | ||||||
| Expositions |
180 | 240 | 248 | ||||||
| Corporate and eliminations |
— | 2 | 3 | ||||||
| Total |
$ | 4,808 | $ | 4,806 | $ | 4,458 | |||
| Year Ended December 31, | |||||||||
| (IN MILLIONS) |
2009 | 2008 | 2007 | ||||||
| Depreciation and amortization |
|||||||||
| Watch |
$ | 279 | $ | 245 | $ | 206 | |||
| Buy |
230 | 206 | 190 | ||||||
| Expositions |
40 | 40 | 42 | ||||||
| Corporate and eliminations |
8 | 8 | 13 | ||||||
| Total |
$ | 557 | $ | 499 | $ | 451 | |||
| Year Ended December 31, | |||||||||
| (IN MILLIONS) |
2009 | 2008 | 2007 | ||||||
| Impairment of goodwill and intangible assets |
|||||||||
| Watch |
$ | 402 | $ | 96 | $ | — | |||
| Buy |
— | — | — | ||||||
| Expositions |
125 | — | — | ||||||
| Corporate and eliminations |
— | — | — | ||||||
| Total |
$ | 527 | $ | 96 | $ | — | |||
| Year Ended December 31, | |||||||||
| (IN MILLIONS) |
2009 | 2008 | 2007 | ||||||
| Restructuring costs |
|||||||||
| Watch |
$ | 9 | $ | 14 | $ | 10 | |||
| Buy |
39 | 74 | 84 | ||||||
| Expositions |
3 | 1 | 2 | ||||||
| Corporate and eliminations |
11 | 29 | 37 | ||||||
| Total |
$ | 62 | $ | 118 | $ | 133 | |||
| Year Ended December 31, | |||||||||
| (IN MILLIONS) |
2009 | 2008 | 2007 | ||||||
| Share-Based Compensation |
|||||||||
| Watch |
$ | 3 | $ | 7 | $ | 24 | |||
| Buy |
6 | 4 | 7 | ||||||
| Expositions |
— | 1 | 3 | ||||||
| Corporate and eliminations |
5 | 6 | 18 | ||||||
| Total |
$ | 14 | $ | 18 | $ | 52 | |||
F-54
Table of Contents
Nielsen Holdings B.V.
Notes to Consolidated Financial Statements—(Continued)
| Year Ended December 31, | ||||||||||||
| (IN MILLIONS) |
2009 | 2008 | 2007 | |||||||||
| Operating (loss)/income |
||||||||||||
| Watch |
$ | (73 | ) | $ | 171 | $ | 188 | |||||
| Buy |
361 | 315 | 264 | |||||||||
| Expositions |
(105 | ) | 50 | 44 | ||||||||
| Corporate and eliminations |
(67 | ) | (116 | ) | (120 | ) | ||||||
| Total |
$ | 116 | $ | 420 | $ | 376 | ||||||
| (IN MILLIONS) |
December 31, 2009 |
December 31, 2008 | ||||
| Total assets |
||||||
| Watch |
$ | 6,556 | $ | 7,073 | ||
| Buy |
6,706 | 6,334 | ||||
| Expositions |
857 | 1,207 | ||||
| Corporate and eliminations(1) |
481 | 477 | ||||
| Total |
$ | 14,600 | $ | 15,091 | ||
| (1) | Includes cash of $151 million and $159 million and deferred bank fees of $135 million and $112 million as of December 31, 2009 and 2008, respectively. |
| (IN MILLIONS) |
Year ended December 31, | ||||||||
| 2009 | 2008 | 2007 | |||||||
| Capital expenditures |
|||||||||
| Watch |
$ | 127 | $ | 167 | $ | 124 | |||
| Buy |
136 | 166 | 120 | ||||||
| Expositions |
16 | 23 | 10 | ||||||
| Corporate and eliminations |
3 | 14 | 12 | ||||||
| Total |
$ | 282 | $ | 370 | $ | 266 | |||
Geographic Segment Information
| (IN MILLIONS) |
Revenues(1) | Operating Income/ (Loss) |
Long- lived Assets(2) | |||||||
| 2009 |
||||||||||
| United States(3) |
$ | 2,478 | $ | (260 | ) | $ | 8,804 | |||
| North and South America, excluding the United States |
477 | 145 | 1,627 | |||||||
| The Netherlands |
43 | — | 5 | |||||||
| Other Europe, Middle East & Africa |
1,298 | 159 | 1,424 | |||||||
| Asia Pacific |
512 | 72 | 546 | |||||||
| Total |
$ | 4,808 | $ | 116 | $ | 12,406 | ||||
F-55
Table of Contents
Nielsen Holdings B.V.
Notes to Consolidated Financial Statements—(Continued)
| (IN MILLIONS) |
Revenues(1) | Operating Income/ (Loss) |
Long- lived Assets(2) | ||||||
| 2008 |
|||||||||
| United States(3) |
$ | 2,485 | $ | 123 | $ | 9,601 | |||
| North and South America, excluding the United States |
497 | 121 | 1,435 | ||||||
| The Netherlands |
46 | 6 | 6 | ||||||
| Other Europe, Middle East & Africa |
1,292 | 124 | 1,385 | ||||||
| Asia Pacific |
486 | 46 | 431 | ||||||
| Total |
$ | 4,806 | $ | 420 | $ | 12,858 | |||
| (IN MILLIONS) |
Revenues(1) | Operating Income/ (Loss) |
|||||
| 2007 |
|||||||
| United States |
$ | 2,404 | $ | 159 | |||
| North and South America, excluding the United States |
440 | 89 | |||||
| The Netherlands |
35 | (10 | ) | ||||
| Other Europe, Middle East & Africa |
1,143 | 96 | |||||
| Asia Pacific |
436 | 42 | |||||
| Total |
$ | 4,458 | $ | 376 | |||
| (1) | Revenues are attributed to geographic areas based on the location of customers. |
| (2) | Long-lived assets include property, plant and equipment, goodwill and other intangible assets. |
| (3) | Operating loss includes charges for the impairment of goodwill and intangible assets of $527 million in 2009 and a goodwill impairment charge of $96 million in 2008. |
17. Additional Financial Information
Accounts payable and other current liabilities
| (IN MILLIONS) |
December 31, 2009 |
December 31, 2008 | ||||
| Trade payables |
$ | 117 | $ | 95 | ||
| Personnel costs |
305 | 294 | ||||
| Current portion of restructuring liabilities |
66 | 95 | ||||
| Data and professional services |
169 | 156 | ||||
| Interest payable |
97 | 96 | ||||
| Other current liabilities(1) |
246 | 284 | ||||
| Total accounts payable and other current liabilities |
$ | 1,000 | $ | 1,020 | ||
| (1) | Other includes multiple items, none of which is individually significant. |
F-56
Table of Contents
Nielsen Holdings B.V.
Notes to Consolidated Financial Statements—(Continued)
18. Quarterly Financial Data (unaudited)
| (IN MILLIONS) |
First Quarter |
Second Quarter |
Third Quarter |
Fourth Quarter |
||||||||||||
| 2009 |
||||||||||||||||
| Revenues |
$ | 1,102 | $ | 1,182 | $ | 1,227 | $ | 1,297 | ||||||||
| Operating income/(loss)(1) |
112 | 172 | (326 | ) | 158 | |||||||||||
| Income/(loss) from continuing operations before income taxes and equity in net (loss)/income of affiliates |
4 | (44 | ) | (534 | ) | (29 | ) | |||||||||
| Discontinued operations, net of tax(2) |
(4 | ) | 4 | (58 | ) | (3 | ) | |||||||||
| Net income/(loss) attributable to Nielsen stockholders |
$ | 2 | $ | (10 | ) | $ | (527 | ) | $ | 44 | ||||||
| (IN MILLIONS) |
First Quarter |
Second Quarter |
Third Quarter |
Fourth Quarter |
||||||||||||
| 2008 |
||||||||||||||||
| Revenues |
$ | 1,156 | $ | 1,241 | $ | 1,223 | $ | 1,186 | ||||||||
| Operating income(3) |
106 | 154 | 124 | 36 | ||||||||||||
| (Loss)/income from continuing operations before income taxes, minority interests and equity in net (loss)/income of affiliates |
(136 | ) | (2 | ) | 39 | (172 | ) | |||||||||
| Discontinued operations, net of tax(4) |
— | 1 | (6 | ) | (270 | ) | ||||||||||
| Net (loss)/income attributable to Nielsen stockholders |
$ | (108 | ) | $ | (6 | ) | $ | 22 | $ | (497 | ) | |||||
| (1) | Includes restructuring charges of $56 million in the fourth quarter of 2009. The third quarter of 2009 also includes charges for the impairment of goodwill impairment and intangible assets of $527 million. |
| (2) | Includes a net loss after taxes of $14 million relating to the sale of the media properties within our Publications operating segment during the fourth quarter of 2009. The third quarter of 2009 includes a goodwill impairment charge relating to the Publications operating segment of $55 million. |
| (3) | Includes restructuring charges of $45 million and $58 million for the third quarter and the fourth quarter of 2008, respectively. The fourth quarter of 2008 also includes a goodwill impairment charge of $96 million. |
| (4) | The third quarter of 2008 includes a goodwill impairment charge relating to the Publications operating segment of $336 million. |
F-57
Table of Contents
Schedule I—Condensed Financial Information of Registrant
Nielsen Holdings B.V.
Parent Company Only
Statements of Operations
| (IN MILLIONS) |
Year Ended December 31, | ||||||||
| 2009 | 2008 | 2007 | |||||||
| Interest income |
— | 1 | 2 | ||||||
| Interest expense |
(3 | ) | (86 | ) | (73 | ) | |||
| Foreign currency exchange transaction loss |
— | (2 | ) | (5 | ) | ||||
| Loss from continuing operations before income taxes and equity in net loss of subsidiaries |
(3 | ) | (87 | ) | (76 | ) | |||
| Benefit for income taxes |
2 | — | — | ||||||
| Equity in net loss of subsidiaries |
(490 | ) | (502 | ) | (278 | ) | |||
| Net loss |
(491 | ) | (589 | ) | (354 | ) | |||
Nielsen Holdings B.V.
Parent Company Only
Balance Sheets
| December 31, | ||||
| (IN MILLIONS) |
2009 | 2008 | ||
| Assets: |
||||
| Current Assets |
||||
| Cash and cash equivalents |
2 | 1 | ||
| Loan receivable-subsidiary |
3 | 2 | ||
| Total current assets |
5 | 3 | ||
| Deferred tax assets |
2 | — | ||
| Investment in subsidiaries |
2,786 | 2,874 | ||
| Other non-current assets |
5 | 8 | ||
| Total assets |
2,798 | 2,885 | ||
| Liabilities and equity: |
||||
| Non-current liabilities |
||||
| Long-term debt—Luxco |
— | 892 | ||
| Total liabilities |
— | 892 | ||
| Total equity |
2,798 | 1,993 | ||
| Total liabilities and equity |
2,798 | 2,885 | ||
F-58
Table of Contents
Nielsen Holdings B.V.
Parent Company Only
Statements of Cash Flows
| Year Ended December 31, | |||||||||
| (IN MILLIONS) |
2009 | 2008 | 2007 | ||||||
| Net cash provided by/(used in) operating activities |
3 | — | (5 | ) | |||||
| Investing Activities: |
|||||||||
| Investment in subsidiaries |
— | (61 | ) | (50 | ) | ||||
| Intercompany loans and advances with subsidiaries |
(1 | ) | 52 | (48 | ) | ||||
| Net cash used in investing activities |
(1 | ) | (9 | ) | (98 | ) | |||
| Financing Activities: |
|||||||||
| Repurchase of shares |
(5 | ) | (2 | ) | — | ||||
| Issuance of common stock |
4 | 10 | 105 | ||||||
| Net cash (used in)/provided by financing activities |
(1 | ) | 8 | 105 | |||||
| Net increase/(decrease) in cash and cash equivalents |
1 | (1 | ) | 2 | |||||
| Cash and cash equivalents, beginning of period |
1 | 2 | — | ||||||
| Cash and cash equivalents, end of period |
2 | 1 | 2 | ||||||
NOTES TO SCHEDULE I
1. Basis of presentation
(A) The notes to the consolidated financial statements of Nielsen Holdings B.V. (“the Company”) are an integral part of these unconsolidated financial statements.
(B) The Company has accounted for the earnings of its subsidiaries under the equity method in these unconsolidated financial statements.
2. Long Term Debt
In May 2006, Valcon Acquisition Holding (Luxembourg) S.à r.l., the Company’s direct parent (“Luxco”), executed a loan agreement with the Company for a principal amount of Euro 500 million in conjunction with Valcon’s acquisition of The Nielsen Company B.V. The loan accreted interest at 10.00% per annum and was payable annually at the request of Luxco or the Company. If interest was not paid at the end of each year, such interest was deemed to be capitalized. No interest was paid on this loan through December 31, 2008 and the corresponding carrying value at such date, including capitalized interest, was $892 million. In January 2009, the loan agreement was terminated and the underlying carrying value, including accrued interest, was capitalized by Luxco in exchange for 78,332,870 shares in the Company’s common stock.
3. Commitments and Contingencies
The Company had no material commitments during the reported periods.
F-59
Table of Contents
Schedule II—Valuation and Qualifying Accounts
For the Years ended December 31, 2009, 2008 and 2007
| (IN MILLIONS) |
Balance Beginning of Period |
Charged to Operating Income |
Acquisitions and Divestitures |
Deductions | Effect of Foreign Currency Translation |
Balance at End of Period | |||||||||||||||
| Allowance for accounts receivable and sales returns |
|||||||||||||||||||||
| For the year ended December 31, 2007 |
$ | 29 | $ | 3 | $ | (2 | ) | $ | (3 | ) | $ | — | $ | 27 | |||||||
| For the year ended December 31, 2008 |
$ | 27 | $ | 11 | $ | 3 | $ | (7 | ) | $ | (1 | ) | $ | 33 | |||||||
| For the year ended December 31, 2009 |
$ | 33 | $ | 14 | $ | (2 | ) | $ | (15 | ) | $ | 1 | $ | 31 | |||||||
| (IN MILLIONS) |
Balance Beginning of Period |
Charged to Expense |
Charged to Other Accounts |
Acquisitions and Divestitures |
Effect of Foreign Currency Translation |
Balance at End of Period | |||||||||||||||
| Valuation allowance for deferred taxes |
|||||||||||||||||||||
| For the year ended December 31, 2007 |
$ | 181 | $ | 17 | $ | 20 | $ | (20 | ) | $ | 3 | $ | 201 | ||||||||
| For the year ended December 31, 2008 |
$ | 201 | $ | 4 | $ | 26 | $ | 4 | $ | (1 | ) | $ | 234 | ||||||||
| For the year ended December 31, 2009 |
$ | 234 | $ | 6 | $ | (7 | ) | $ | — | $ | — | $ | 233 | ||||||||
F-60
Table of Contents
Nielsen Holdings B.V.
Condensed Consolidated Statements of Operations (Unaudited)
| Six Months Ended June 30, |
||||||||
| (IN MILLIONS EXCEPT PER SHARE DATA) |
2010 | 2009 | ||||||
| Revenues |
$ | 2,466 | $ | 2,284 | ||||
| Cost of revenues, exclusive of depreciation and amortization shown separately below |
1,048 | 963 | ||||||
| Selling, general and administrative expenses, exclusive of depreciation and amortization shown separately below |
805 | 762 | ||||||
| Depreciation and amortization |
277 | 266 | ||||||
| Restructuring costs |
22 | 9 | ||||||
| Operating income |
314 | 284 | ||||||
| Interest income |
2 | 4 | ||||||
| Interest expense |
(322 | ) | (315 | ) | ||||
| Loss on derivative instruments |
(12 | ) | (33 | ) | ||||
| Foreign currency exchange transaction gains, net |
146 | 31 | ||||||
| Other income/(expense), net |
9 | (11 | ) | |||||
| Income/(loss) from continuing operations before income taxes and equity in net income of affiliates |
137 | (40 | ) | |||||
| (Provision)/benefit for income taxes |
(12 | ) | 25 | |||||
| Equity in net income of affiliates |
— | 8 | ||||||
| Income/(loss) from continuing operations |
125 | (7 | ) | |||||
| Discontinued operations, net of tax |
(8 | ) | — | |||||
| Net income/(loss) |
117 | (7 | ) | |||||
| Less: net income attributable to noncontrolling interests |
1 | 1 | ||||||
| Net income/(loss) attributable to Nielsen stockholders |
$ | 116 | $ | (8 | ) | |||
| Net income/(loss) per common shares, basic and diluted |
||||||||
| Income/(loss) from continuing operations |
$ | 0.28 | $ | (0.02 | ) | |||
| Discontinued operations, net of tax |
(0.02 | ) | — | |||||
| Net income/(loss) attributable to Nielsen stockholders |
$ | 0.26 | $ | (0.02 | ) | |||
| Weighted average common shares outstanding, basic |
442,324,856 | 434,666,777 | ||||||
| Dilutive common shares |
4,258,438 | — | ||||||
| Weighted average common shares outstanding, diluted |
446,583,294 | 434,666,777 | ||||||
The accompanying notes are an integral part of these condensed consolidated financial statements.
F-61
Table of Contents
Nielsen Holdings B.V.
Condensed Consolidated Balance Sheets
| (IN MILLIONS, EXCEPT SHARE AND PER SHARE DATA) |
June 30, 2010 |
December 31, 2009 |
||||||
| (Unaudited) | ||||||||
| Assets: |
||||||||
| Current assets |
||||||||
| Cash and cash equivalents |
$ | 371 | $ | 514 | ||||
| Trade and other receivables, net of allowances for doubtful accounts and sales returns of $34 and $31 as of June 30, 2010 and December 31, 2009, respectively |
942 | 937 | ||||||
| Prepaid expenses and other current assets |
233 | 195 | ||||||
| Total current assets |
1,546 | 1,646 | ||||||
| Non-current assets |
||||||||
| Property, plant and equipment, net |
578 | 593 | ||||||
| Goodwill |
6,968 | 7,056 | ||||||
| Other intangible assets, net |
4,618 | 4,757 | ||||||
| Deferred tax assets |
49 | 50 | ||||||
| Other non-current assets |
435 | 498 | ||||||
| Total assets |
$ | 14,194 | $ | 14,600 | ||||
| Liabilities and equity: |
||||||||
| Current liabilities |
||||||||
| Accounts payable and other current liabilities |
$ | 863 | $ | 1,000 | ||||
| Deferred revenues |
427 | 435 | ||||||
| Income tax liabilities |
118 | 82 | ||||||
| Current portion of long-term debt, capital lease obligations and short-term borrowings |
40 | 107 | ||||||
| Total current liabilities |
1,448 | 1,624 | ||||||
| Non-current liabilities |
||||||||
| Long-term debt and capital lease obligations |
8,399 | 8,548 | ||||||
| Deferred tax liabilities |
1,033 | 1,065 | ||||||
| Other non-current liabilities |
509 | 551 | ||||||
| Total liabilities |
11,389 | 11,788 | ||||||
| Commitments and contingencies (Note 13) |
||||||||
| Equity: |
||||||||
| Nielsen stockholders’ equity |
||||||||
| Common stock, €0.04 par value, 1,250,000,000 shares authorized, 443,078,009 and 442,607,460 shares issued and 442,192,538 and 441,850,943 shares outstanding at June 30, 2010 and December 31, 2009, respectively |
22 | 22 | ||||||
| Additional paid-in capital |
4,578 | 4,563 | ||||||
| Accumulated deficit |
(1,623 | ) | (1,739 | ) | ||||
| Accumulated other comprehensive loss, net of income taxes |
(181 | ) | (48 | ) | ||||
| Total Nielsen stockholders’ equity |
2,796 | 2,798 | ||||||
| Noncontrolling interests |
9 | 14 | ||||||
| Total equity |
2,805 | 2,812 | ||||||
| Total liabilities and equity |
$ | 14,194 | $ | 14,600 | ||||
The accompanying notes are an integral part of these condensed consolidated financial statements.
F-62
Table of Contents
Nielsen Holdings B.V.
Condensed Consolidated Statements of Cash Flows (Unaudited)
| Six Months Ended June 30, |
||||||||
| (IN MILLIONS) |
2010 | 2009 | ||||||
| Operating Activities |
||||||||
| Net income/(loss) |
$ | 117 | $ | (7 | ) | |||
| Adjustments to reconcile net income/(loss) to net cash used in operating activities: |
||||||||
| Share-based payments expense/(credits) |
9 | (1 | ) | |||||
| Loss on sale of discontinued operations, net of tax |
3 | — | ||||||
| Currency exchange rate differences on financial transactions and other gains |
(155 | ) | (18 | ) | ||||
| Loss on derivative instruments |
12 | 33 | ||||||
| Equity in net loss/(income) from affiliates, net of dividends received |
6 | (1 | ) | |||||
| Depreciation and amortization |
277 | 269 | ||||||
| Changes in operating assets and liabilities, net of effect of businesses acquired and divested: |
||||||||
| Trade and other receivables, net |
(37 | ) | 43 | |||||
| Prepaid expenses and other current assets |
(22 | ) | (21 | ) | ||||
| Accounts payable and other current liabilities and deferred revenues |
(92 | ) | (146 | ) | ||||
| Other non-current liabilities |
(7 | ) | (4 | ) | ||||
| Interest receivable |
— | 3 | ||||||
| Interest payable |
73 | 85 | ||||||
| Income taxes |
(55 | ) | (84 | ) | ||||
| Net cash provided by operating activities |
129 | 151 | ||||||
| Investing Activities |
||||||||
| Acquisition of subsidiaries and affiliates, net of cash acquired |
(38 | ) | (43 | ) | ||||
| Proceeds from sale of subsidiaries and affiliates, net |
25 | 16 | ||||||
| Additions to property, plant and equipment and other assets |
(86 | ) | (61 | ) | ||||
| Additions to intangible assets |
(60 | ) | (71 | ) | ||||
| Other investing activities |
5 | 16 | ||||||
| Net cash used in investing activities |
(154 | ) | (143 | ) | ||||
| Financing Activities |
||||||||
| Repayments on revolving credit facility |
— | (220 | ) | |||||
| Proceeds from issuances of debt, net of issuance costs |
— | 1,222 | ||||||
| Repayment of debt |
(95 | ) | (893 | ) | ||||
| Increase/(decrease) in other short-term borrowings |
4 | (42 | ) | |||||
| Stock activity of subsidiaries, settlement of derivatives and other financing activities |
(6 | ) | (166 | ) | ||||
| Net cash used in financing activities |
(97 | ) | (99 | ) | ||||
| Effect of exchange-rate changes on cash and cash equivalents |
(21 | ) | 11 | |||||
| Net decrease in cash and cash equivalents |
(143 | ) | (80 | ) | ||||
| Cash and cash equivalents at beginning of period |
514 | 467 | ||||||
| Cash and cash equivalents at end of period |
$ | 371 | $ | 387 | ||||
| Supplemental Cash Flow Information |
||||||||
| Cash paid for income taxes |
$ | (64 | ) | $ | (62 | ) | ||
| Cash paid for interest, net of amounts capitalized |
$ | (249 | ) | $ | (231 | ) | ||
The accompanying notes are an integral part of these condensed consolidated financial statements.
F-63
Table of Contents
Nielsen Holdings B.V.
Notes to Condensed Consolidated Financial Statements
1. Background and Basis of Presentation
Background
On May 17, 2006, Nielsen Holdings B.V. (the “Company” or “Nielsen”), formerly known as Valcon Acquisition Holding B.V., was formed by investment funds associated with AlpInvest Partners, The Blackstone Group, The Carlyle Group, Hellman & Friedman, Kohlberg Kravis Roberts & Co., and Thomas H. Lee Partners (collectively, and with subsequent investor Centerview Partners, the “Sponsors”) as a subsidiary of Valcon Acquisition Holding (Luxembourg) S.à r.l. (“Luxco”). On May 24, 2006, The Nielsen Company B.V. (“TNC B.V.”) (formerly VNU Group B.V. and VNU N.V.) was acquired through a tender offer to stockholders by Valcon Acquisition B.V. (“Valcon”), a wholly owned subsidiary of the Company (herein referred to as the “Valcon Acquisition”). Valcon’s cumulative purchases totaled 99.4% of TNC B.V.’s outstanding common stock as of December 31, 2007. In May 2008, Valcon acquired the remaining TNC B.V. common stock through a statutory squeeze-out procedure pursuant to Dutch legal and regulatory requirements and therefore currently holds 100% of the TNC B.V.’s outstanding common stock. As part of the Valcon Acquisition,Valcon also acquired all of the 7% preference stock of TNC B.V. Valcon also acquired 100% of TNC B.V.’s preferred B shares which were subsequently canceled during 2006. TNC B.V.’s common and preferred shares were delisted from the NYSE Euronext on July 11, 2006.
Nielsen, together with its subsidiaries, is a leading global information and measurement company that provides clients with a comprehensive understanding of consumers and consumer behavior. Drawing from an extensive and long-standing foundation of consumer measurement, the Company delivers critical media and marketing information, analytics and industry expertise about what consumers watch (consumer interaction with television, online and mobile) and what consumers buy on a global and local basis to its clients. The information, insights and solutions provided to clients help them maintain and strengthen their market positions and identify opportunities for profitable growth. The Company has a presence in approximately 100 countries and holds leading market positions in many of its services and geographies with its headquarters located in Diemen, the Netherlands and New York, USA.
The Company’s business structure is aligned into three reporting segments: What Consumers Watch (media audience measurement and analytics) (“Watch”), What Consumers Buy (consumer purchasing measurement and analytics) (“Buy”) and Expositions. The Watch and Buy segments are built on a foundation of proprietary data assets that are designed to yield essential insights for our clients to successfully measure, analyze and grow their businesses.
Basis of Presentation
The accompanying condensed consolidated financial statements are unaudited but, in the opinion of management, contain all the adjustments (consisting of those of a normal recurring nature) considered necessary to present fairly the Company’s financial position and the results of operations and cash flows for the periods presented in conformity with accounting principles generally accepted in the U.S. (“U.S. GAAP”) applicable to interim periods. For a more complete discussion of significant accounting policies, commitments and contingencies and certain other information, refer to the consolidated financial statements for the year ended December 31, 2009 included in this prospectus. All amounts are presented in U.S. Dollars (“$”), except for share data or where expressly stated as being in other currencies, e.g., Euros (“€”). The condensed consolidated financial statements include the accounts of Nielsen and all subsidiaries and other controlled entities. The Company’s condensed consolidated balance sheets and condensed consolidated statements of cash flows do not reflect the presentation of the December 2009 exit of its Publications operating segment as a discontinued operation. Supplemental cash flows from discontinued operations are not material for either period presented in these condensed consolidated financial statements. Refer to Note 4 to the condensed consolidated financial statements, “Business Divestitures” for additional information regarding discontinued operations.
F-64
Table of Contents
Nielsen Holdings B.V.
Notes to Condensed Consolidated Financial Statements—(Continued)
The Company has evaluated events occurring subsequent to June 30, 2010 for potential recognition or disclosure in the unaudited condensed consolidated financial statements through July 30, 2010 and concluded there were no subsequent events that required recognition or disclosure other than those provided.
2. Summary of Recent Accounting Pronouncements
Consolidation
In June 2009, the FASB issued an update that amends the consolidation guidance applicable to variable interest entities (“VIE”) and changes how a reporting entity evaluates whether an entity is considered the primary beneficiary of a VIE and is therefore required to consolidate such VIE and will also require assessments at each reporting period of which party within the VIE is considered the primary beneficiary and will require a number of new disclosures related to VIE. These updates are effective for fiscal years beginning after November 15, 2009. The adoption of this guidance, effective January 1, 2010, did not have a material impact on the Company’s condensed consolidated financial statements as of June 30, 2010 or for the six months then ended.
Fair Value Measurements
In January 2010, the FASB issued updates to its fair value measurements standards that require entities to provide new disclosures and clarify existing disclosures relating to fair value measurements. The new disclosures and clarifications of existing disclosures are effective for interim and annual reporting periods beginning after December 15, 2009, except for the disclosures about purchases, sales, issuances, and settlements in Level 3 fair value measurements, which are effective for fiscal years beginning after December 15, 2010. The Company does not currently have fair value measurements within the Level 3 category and therefore the adoption did not have a material impact on the Company’s condensed consolidated financial statements as of June 30, 2010 or for the six months then ended.
Revenue Recognition
In October 2009, the FASB issued updates to its accounting standards pertaining to multiple-deliverable revenue arrangements requiring entities to allocate revenue in an arrangement using estimated selling prices of the delivered goods and services based on a selling price hierarchy. The guidance eliminates the residual method of revenue allocation and requires revenue to be allocated using the relative selling price method and is effective prospectively for revenue arrangements entered into or materially modified in fiscal years beginning on or after June 15, 2010. The Company is currently evaluating the impact of the revised accounting standards, but does not expect its adoption to have a material impact on the Company’s consolidated financial statements.
3. Acquisitions and Investments in Affiliates
For the six months ended June 30, 2010, Nielsen paid cash consideration of $38 million associated with both current period and previously executed acquisitions, net of cash acquired. In conjunction with these acquisitions, Nielsen recorded deferred consideration of $19 million, which is payable through 2013. Had the current period acquisitions occurred as of January 1, 2010, the impact on Nielsen’s consolidated results of operations would not have been material.
For the six months ended June 30, 2009, Nielsen paid cash consideration of $43 million associated with both current period and previously executed acquisitions and investments in affiliates, net of cash acquired. In conjunction with these acquisitions, Nielsen recorded deferred consideration of $34 million, of which $22 million was attributable to a March 2009 acquisition, which in March 2010, was agreed to be settled by a cash payment of $11 million in April 2010 and the issuance of $11 million in equity. Had these acquisitions occurred as of January 1, 2009, the impact on Nielsen’s consolidated results of operations would not have been material.
F-65
Table of Contents
Nielsen Holdings B.V.
Notes to Condensed Consolidated Financial Statements—(Continued)
4. Business Divestitures
During the six months ended June 30, 2010, Nielsen received net cash proceeds of $25 million associated with business divestitures, including the sale of its box-office tracking business as well as the remaining properties within the Publications operating segment discussed further below.
Discontinued Operations
Nielsen Publications
In December 2009 Nielsen substantially completed the planned exit of its Publications operating segment through the sale of its media properties, including The Hollywood Reporter and Billboard, to e5 Global Media LLC. The condensed consolidated statements of operations reflect the Publications operating segment as a discontinued operation. During the six months ended June 30, 2010, Nielsen completed the exit of the remaining properties and recorded a net loss on sale of $3 million associated with these divestitures.
Summarized results of operations for discontinued operations are as follows:
| Six Months Ended June 30, |
||||||||
| (IN MILLIONS) |
2010 | 2009 | ||||||
| Revenues |
$ | 8 | $ | 76 | ||||
| Operating (loss)/income |
(9 | ) | 9 | |||||
| (Loss)/income from operations before income taxes |
(9 | ) | 3 | |||||
| Benefit/(provision) for income taxes |
4 | (3 | ) | |||||
| Loss from operations |
(5 | ) | — | |||||
| Loss on sale, net of tax |
(3 | ) | — | |||||
| Loss from discontinued operations |
$ | (8 | ) | $ | — | |||
Nielsen allocated interest to discontinued operations based upon interest expense on debt that was assumed by the acquirers of Nielsen’s discontinued operations and a portion of the consolidated interest expense of Nielsen, based on the ratio of net assets sold as a proportion of consolidated net assets. No interest expense was allocated to discontinued operations for the six months ended June 30, 2010. Interest expense of $4 million was allocated to discontinued operations for the six months ended June 30, 2009.
5. Goodwill and Other Intangible Assets
Goodwill
The table below summarizes the changes in the carrying amount of goodwill by reportable segment for the six months ended June 30, 2010.
| (IN MILLIONS) |
Watch | Buy | Expositions | Total | ||||||||||||
| Balance, December 31, 2009 |
$ | 3,434 | $ | 3,066 | $ | 556 | $ | 7,056 | ||||||||
| Acquisitions, divestitures and purchase price adjustments |
8 | 4 | (3 | ) | 9 | |||||||||||
| Effect of foreign currency translation |
(21 | ) | (76 | ) | — | (97 | ) | |||||||||
| Balance, June 30, 2010 |
$ | 3,421 | $ | 2,994 | $ | 553 | $ | 6,968 | ||||||||
F-66
Table of Contents
Nielsen Holdings B.V.
Notes to Condensed Consolidated Financial Statements—(Continued)
At June 30, 2010, $223 million of the goodwill is expected to be deductible for income tax purposes.
Other Intangible Assets
| (IN MILLIONS) |
Gross Amounts | Accumulated Amortization | ||||||||||||
| June 30, 2010 |
December 31, 2009 |
June 30, 2010 |
December 31, 2009 |
|||||||||||
| Indefinite-lived intangibles: |
||||||||||||||
| Trade names and trademarks |
$ | 1,914 | $ | 1,949 | $ | — | $ | — | ||||||
| Amortized intangibles: |
||||||||||||||
| Trade names and trademarks |
$ | 104 | $ | 112 | $ | (24 | ) | $ | (22 | ) | ||||
| Customer-related intangibles |
2,753 | 2,747 | (545 | ) | (480 | ) | ||||||||
| Covenants-not-to-compete |
22 | 21 | (17 | ) | (15 | ) | ||||||||
| Computer software |
850 | 826 | (474 | ) | (421 | ) | ||||||||
| Patents and other |
63 | 63 | (28 | ) | (23 | ) | ||||||||
| Total |
$ | 3,792 | $ | 3,769 | $ | (1,088 | ) | $ | (961 | ) | ||||
Amortization expense for the six months ended June 30, 2010 and 2009 was $160 million and $159 million, respectively.
Certain of the trade names associated with Nielsen are deemed indefinite-lived intangible assets, as their associated Nielsen brand awareness and recognition has existed for over 50 years and the Company intends to continue to utilize these trade names. There are also no legal, regulatory, contractual, competitive, economic or other factors that may limit their estimated useful lives. Nielsen reconsiders the remaining estimated useful life of indefinite-lived intangible assets each reporting period.
6. Restructuring Activities
A summary of the changes in the liabilities for restructuring activities is provided below:
| (IN MILLIONS) |
Transformation Initiative |
Other Productivity Initiatives |
Total | |||||||||
| Balance at December 31, 2009 |
$ | 46 | $ | 29 | $ | 75 | ||||||
| (Credits)/charges |
(4 | ) | 26 | 22 | ||||||||
| Payments |
(25 | ) | (10 | ) | (35 | ) | ||||||
| Effect of foreign currency translation and reclassification adjustments |
(2 | ) | (1 | ) | (3 | ) | ||||||
| Balance at June 30, 2010 |
$ | 15 | $ | 44 | $ | 59 | ||||||
Transformation Initiative
During 2009 the Company continued to execute cost-reduction programs under this initiative through the streamlining and centralization of corporate, operational and information technology functions, leveraging global procurement, consolidating real estate, and expanding, outsourcing or off shoring certain other operational and production processes. The Transformation Initiative has been completed, but payments will continue through 2010.
F-67
Table of Contents
Nielsen Holdings B.V.
Notes to Condensed Consolidated Financial Statements—(Continued)
Nielsen recorded net credits of $4 million for the six months ended June 30, 2010 associated with adjustments to previously established liabilities for employee severance. Nielsen recorded $9 million in restructuring charges, primarily relating to severance costs, for the six months ended June 30, 2009.
Other Productivity Initiatives
In December 2009, Nielsen commenced certain specific restructuring actions attributable to defined cost-reduction programs directed towards achieving increased productivity in future periods primarily through targeted employee terminations. The Company recorded $26 million in restructuring charges associated with these initiatives during the six months ended June 30, 2010. Of these amounts, approximately $6 million related to property lease termination charges with the remainder relating to severance charges associated with employee terminations.
Of the $59 million in remaining liabilities for restructuring actions, $51 million is expected to be paid within one year and is classified as a current liability within the consolidated financial statements as of June 30, 2010.
7. Fair Value of Financial Instruments
The applicable FASB Codification guidance (ASC 820-10) defines fair value as the price that would be received from selling an asset or paid to transfer a liability in an orderly transaction between market participants at the measurement date. When determining fair value, the Company considers the principal or most advantageous market in which the Company would transact, and also considers assumptions that market participants would use when pricing the asset or liability, such as inherent risk, transfer restrictions, and risk of non-performance.
There are three levels of inputs that may be used to measure fair value:
| Level 1: |
Quoted market prices available in active markets for identical assets or liabilities as of the reporting date. | |
| Level 2: |
Pricing inputs other than quoted prices in active markets included in Level 1, which are either directly or indirectly observable as of the reporting date. | |
| Level 3: |
Pricing inputs that are generally unobservable and may not be corroborated by market data. | |
F-68
Table of Contents
Nielsen Holdings B.V.
Notes to Condensed Consolidated Financial Statements—(Continued)
Financial Assets and Liabilities Measured on a Recurring Basis
The Company’s financial assets and liabilities are measured and recorded at fair value, except for equity method investments, cost method investments, and long-term debt. Financial assets and liabilities are classified in their entirety based on the lowest level of input that is significant to the fair value measurements. The Company’s assessment of the significance of a particular input to the fair value measurements requires judgment, and may affect the valuation of the assets and liabilities being measured and their placement within the fair value hierarchy. The following table summarizes the valuation of the Company’s material financial assets and liabilities measured at fair value on a recurring basis as of June 30, 2010:
| (IN MILLIONS) |
June 30, 2010 |
(Level 1) | (Level 2) | (Level 3) | ||||||||
| Assets: |
||||||||||||
| Investments in mutual funds(1) |
$ | 2 | $ | 2 | $ | — | $ | — | ||||
| Plan assets for deferred compensation(2) |
16 | 16 | — | — | ||||||||
| Total |
$ | 18 | $ | 18 | $ | — | $ | — | ||||
| Liabilities: |
||||||||||||
| Interest rate swap arrangements(3) |
$ | 96 | — | $ | 96 | $ | — | |||||
| Deferred compensation liabilities(4) |
16 | 16 | — | — | ||||||||
| Total |
$ | 112 | $ | 16 | $ | 96 | $ | — | ||||
| (1) | Investments in mutual funds are money-market accounts held with the intention of funding certain specific retirement plans. |
| (2) | Plan assets are comprised of investments in mutual funds, which are intended to fund liabilities arising from deferred compensation plans. These investments are carried at fair value, which is based on quoted market prices at period end in active markets. These investments are classified as trading securities with any gains or losses resulting from changes in fair value recorded in other expense, net. |
| (3) | Interest rate swap arrangements are recorded at fair value based on externally-developed valuation models that use readily observable market parameters and the consideration of counterparty risk. |
| (4) | The Company offers certain employees the opportunity to participate in a deferred compensation plan. A participant’s deferrals are invested in a variety of participant directed stock and bond mutual funds and are classified as trading securities. Changes in the fair value of these securities are measured using quoted prices in active markets based on the market price per unit multiplied by the number of units held exclusive of any transaction costs. A corresponding adjustment for changes in fair value of the trading securities is also reflected in the changes in fair value of the deferred compensation obligation. |
Derivative Financial Instruments
Nielsen uses interest rate swap derivative instruments principally to manage the risk that changes in interest rates will affect the cash flows of its underlying debt obligations.
To qualify for hedge accounting, the hedging relationship must meet several conditions with respect to documentation, probability of occurrence, hedge effectiveness and reliability of measurement. Nielsen documents the relationship between hedging instruments and hedged items, as well as its risk management objective and strategy for undertaking various hedge transactions as well as the hedge effectiveness assessment, both at the hedge inception and on an ongoing basis. Nielsen recognizes all derivatives at fair value either as assets or liabilities in the consolidated balance sheets and changes in the fair values of such instruments are
F-69
Table of Contents
Nielsen Holdings B.V.
Notes to Condensed Consolidated Financial Statements—(Continued)
recognized currently in earnings unless specific hedge accounting criteria are met. If specific cash flow hedge accounting criteria are met, Nielsen recognizes the changes in fair value of these instruments in accumulated other comprehensive income/loss.
Nielsen manages exposure to possible defaults on derivative financial instruments by monitoring the concentration of risk that Nielsen has with any individual bank and through the use of minimum credit quality standards for all counterparties. Nielsen does not require collateral or other security in relation to derivative financial instruments. A derivative contract entered into between Nielsen or certain of its subsidiaries and a counterparty that was also a lender under Nielsen’s senior secured credit facilities at the time the derivative contract was entered into is guaranteed under the senior secured credit facilities by Nielsen and certain of its subsidiaries (see Note 8 “Long-term Debt and Other Financing Arrangements” for more information). Since it is Nielsen’s policy to only enter into derivative contracts with banks of internationally acknowledged standing, Nielsen considers the counterparty risk to be remote.
It is Nielsen’s policy to have an International Swaps and Derivatives Association (“ISDA”) Master Agreement established with every bank with which it has entered into any derivative contract. Under each of these ISDA Master Agreements, Nielsen agrees to settle only the net amount of the combined market values of all derivative contracts outstanding with any one counterparty should that counterparty default. Certain of the ISDA Master Agreements contain cross-default provisions where if the Company either defaults in payment obligations under its credit facility or if such obligations are accelerated by the lenders, then the Company could also be declared in default on its derivative obligations. At June 30, 2010, Nielsen had no exposure to potential economic losses due to counterparty credit default risk or cross-default risk on its derivative financial instruments.
Interest Rate Risk
Nielsen is exposed to cash flow interest rate risk on the floating-rate U.S. Dollar and Euro Term Loans, and uses floating-to-fixed interest rate swaps to hedge this exposure. These interest rate swaps have various maturity dates through March 2013. For these derivatives, Nielsen reports the after-tax gain or loss from the effective portion of the hedge as a component of accumulated other comprehensive income/loss and reclassifies it into earnings in the same period or periods in which the hedged transaction affects earnings, and within the same income statement line item as the impact of the hedged transaction.
On March 9, 2010, Nielsen entered into a three-year interest swap to fix the LIBOR-related portion of interest rates for $250 million of the Company’s variable-rate debt at 1.69%. This swap replaced the $500 million notional amount interest rate swap that matured on February 9, 2010. This derivative instrument has been designated as an interest rate cash flow hedge.
In February 2009, Nielsen entered into two three-year forward interest rate swap agreements with starting dates of November 9, 2009. These agreements fix the LIBOR-related portion of interest rates for $500 million of the Company’s variable-rate debt at an average rate of 2.47%. The commencement date of the interest rate swaps coincided with the $1 billion notional amount interest rate swap that matured on November 9, 2009. These derivative instruments have been designated as interest rate cash flow hedges.
In February 2009, Nielsen modified the reset interest rate underlying its senior secured term loan and, as a result, the related floating-to-fixed interest rate swap derivative financial instruments became ineffective. Cumulative losses deferred as a component of accumulated other comprehensive loss will be recognized in interest expense over the remaining term of the senior secured term loan being hedged. Beginning in February 2009, Nielsen began recording all changes in fair value of the floating-to-fixed interest rate swaps currently in earnings as a component of loss on derivative instruments.
F-70
Table of Contents
Nielsen Holdings B.V.
Notes to Condensed Consolidated Financial Statements—(Continued)
Nielsen expects to recognize approximately $46 million of pre-tax losses from accumulated other comprehensive loss to interest expense in the next 12 months associated with its interest-related derivative financial instruments, which includes the aforementioned modification.
As of June 30, 2010, the Company had the following outstanding interest rate swaps utilized in the management of its interest rate risk:
| Notional Amount | Maturity Date | Currency | |||||
| Interest rate swaps designated as hedging instruments |
|||||||
| US Dollar term loan floating-to-fixed rate swaps |
$ | 500,000,000 | November 2012 | US Dollar | |||
| US Dollar term loan floating-to-fixed rate swaps |
$ | 250,000,000 | March 2013 | US Dollar | |||
| Interest rate swaps not designated as hedging instruments |
|||||||
| US Dollar term loan floating-to-fixed rate swaps |
$ | 1,000,000,000 | November 2010 | US Dollar | |||
| US Dollar term loan floating-to-fixed rate swaps |
$ | 800,000,000 | November 2011 | US Dollar | |||
Foreign Currency Risk
Nielsen has managed its exposure to changes in foreign currency exchange rates attributable to certain of its long-term debt through the use of foreign currency swap derivative instruments. When the derivative financial instrument is deemed to be highly effective in offsetting variability in the hedged item, changes in its fair value are recorded in accumulated other comprehensive loss and recognized contemporaneously with the earnings effects of the hedged item.
Nielsen held a foreign currency swap, which had been designated as a foreign currency cash flow hedge, maturing in May 2010 to hedge its exposure to foreign currency exchange rate movements on its GBP 250 million outstanding 5.625% EMTN debenture notes. In March 2009 the Company purchased and cancelled approximately GBP 101 million of the total GBP 250 million outstanding 5.625% EMTN debenture notes through a tender offer and unwound a portion of the existing swap. Subsequent to the March 2009 tender offer, a notional amount of GBP 149 million with a fixed interest rate of 5.625% had been swapped to a notional amount of €227 million with a fixed interest rate of 4.033%. The swap was fully terminated in June 2009 in conjunction with the Company’s completion of a tender offer for these remaining outstanding debenture notes (see Note 8 “Long-term Debt and Other Financing Arrangements” for more information).
In March 2009, Nielsen terminated a foreign currency swap, which converted a portion of its Euro-denominated external debt to U.S. Dollar-denominated debt and had an original maturity in February 2010. Nielsen received a cash settlement of approximately $2 million associated with this termination.
The Company terminated all existing foreign currency exchange forward contracts during the first quarter of 2009. Since no hedge designation was made for these contracts, Nielsen recorded a net loss of $5 million for the six months ended June 30, 2009.
F-71
Table of Contents
Nielsen Holdings B.V.
Notes to Condensed Consolidated Financial Statements—(Continued)
Fair Values of Derivative Instruments in the Condensed Consolidated Balance Sheets
The fair values of our derivative instruments as of June 30, 2010 and December 31, 2009 were as follows:
| June 30, 2010 | December 31, 2009 | |||||||||||
| (IN MILLIONS) |
Accounts Payable and Other Current Liabilities |
Other Non- Current Liabilities |
Accounts Payable and Other Current Liabilities |
Other Non- Current Liabilities | ||||||||
| Derivatives designated as hedging instruments |
||||||||||||
| Interest Rate Swaps |
$ | — | $ | 22 | $ | — | $ | 9 | ||||
| Total derivatives designated as hedging instruments |
$ | — | $ | 22 | $ | — | $ | 9 | ||||
| Derivatives not designated as hedging instruments |
||||||||||||
| Interest Rate Swaps |
$ | 23 | $ | 51 | $ | 48 | $ | 60 | ||||
| Total derivatives not designated as hedging instruments |
$ | 23 | $ | 51 | $ | 48 | $ | 60 | ||||
Derivatives in Cash Flow Hedging Relationships
The pre-tax effect of derivative instruments in cash flow hedging relationships for the six months ended June 30, 2010 and 2009 was as follows (amounts in millions):
| Derivatives in Cash Flow Hedging Relationships |
Amount of Gain/(Loss) Recognized in OCI on Derivative (Effective Portion) Six Months Ended June 30, |
Location of Gain/(Loss) Reclassified from OCI into Income (Effective Portion) |
Amount of
Gain/ (Loss) Reclassified from OCI into Income (Effective Portion) Six Months Ended June 30, |
Amount of Gain/ (Loss) Recognized in Income on Derivative (Ineffective Portion and Amount Excluded from Effectiveness Testing) Six Months Ended June 30, |
||||||||||||||||||||||
| 2010 | 2009 | 2010 | 2009 | 2010 | 2009 | |||||||||||||||||||||
| Interest Rate Swaps |
$ | (20 | ) | $ | (18 | ) | Interest expense |
$ | (7 | ) | $ | (25 | ) | $ | (28 | ) | $ | (37 | ) | |||||||
| Foreign Currency Swap |
— | 23 | Foreign currency exchange transaction gains, net |
— | 28 | — | — | |||||||||||||||||||
| Total |
$ | (20 | ) | $ | 5 | $ | (7 | ) | $ | 3 | $ | (28 | ) | $ | (37 | ) | ||||||||||
Derivatives Not Designated as Hedging Instruments
The pre-tax effect of derivative instruments not designated as hedges for the six months ended June 30, 2010 and 2009 was as follows (amounts in millions):
| Derivatives Not Designated as Hedging Instruments |
Location of Gain/(Loss) Recognized in Statement of Operations on Derivatives |
Amount of Loss Recognized in Statement of Operations on Derivatives Six Months Ended June 30, |
||||||||
| 2010 | 2009 | |||||||||
| Interest Rate Swaps |
Loss on derivative instruments |
$ | (12 | ) | $ | (9 | ) | |||
| Foreign Currency Swaps |
Loss on derivative instruments |
— | (19 | ) | ||||||
| Foreign Currency Forward Contracts |
Loss on derivative instruments |
— | (5 | ) | ||||||
| Total |
$ | (12 | ) | $ | (33 | ) | ||||
F-72
Table of Contents
Nielsen Holdings B.V.
Notes to Condensed Consolidated Financial Statements—(Continued)
8. Long-term Debt and Other Financing Arrangements
Unless otherwise stated, interest rates are as of June 30, 2010.
| (IN MILLIONS) |
June 30, 2010 | December 31, 2009 | ||||||||||||||||
| Weighted Interest Rate |
Carrying Amount |
Fair Value |
Weighted Interest Rate |
Carrying Amount |
Fair Value | |||||||||||||
| Senior secured term loan ($2,983 million at June 30, 2010 and December 31, 2009) (LIBOR based variable rate of 2.35%) due 2013 |
$ | 2,900 | $ | 2,724 | $ | 2,918 | $ | 2,715 | ||||||||||
| $1,013 million senior secured term loan (LIBOR based variable rate of 4.10%) due 2016 |
1,000 | 960 | 1,005 | 948 | ||||||||||||||
| Senior secured term loan (EUR 321 million at June 30, 2010 and December 31, 2009) (EURIBOR based variable rate of 2.40%) due 2013 |
383 | 360 | 451 | 423 | ||||||||||||||
| EUR 179 million senior secured term loan (EURIBOR based variable rate of 4.15%) due 2016 |
218 | 207 | 254 | 238 | ||||||||||||||
| $500 million 8.50% senior secured term loan due 2017 |
500 | 479 | 500 | 493 | ||||||||||||||
| $688 million senior secured revolving credit facility (EURIBOR or LIBOR based variable rate) due 2012 |
— | — | — | — | ||||||||||||||
| Total senior secured credit facilities (with weighted average interest rate) |
3.64 | % | 5,001 | 4,730 | 3.51 | % | 5,128 | 4,817 | ||||||||||
| $1,070 million 12.50% senior subordinated discount debenture loan due 2016 |
940 | 892 | 885 | 809 | ||||||||||||||
| $870 million 10.00% senior debenture loan due 2014 |
869 | 888 | 869 | 905 | ||||||||||||||
| $500 million 11.50% senior debenture loan due 2016 |
465 | 508 | 463 | 517 | ||||||||||||||
| $330 million 11.625% senior debenture loan due 2014 |
304 | 332 | 301 | 337 | ||||||||||||||
| EUR 343 million 11.125% senior discount debenture loan due 2016 |
378 | 350 | 415 | 359 | ||||||||||||||
| EUR 150 million 9.00% senior debenture loan due 2014 |
186 | 187 | 215 | 217 | ||||||||||||||
| EUR 50 million private placement debenture loan (EMTN) (3-month EURIBOR based variable rate) due 2010 |
— | — | 72 | 67 | ||||||||||||||
| EUR 50 million private placement debenture loan (EMTN) (3-month EURIBOR based variable rate of 2.04%) due 2012 |
62 | 54 | 72 | 66 | ||||||||||||||
| EUR 30 million 6.75% private placement debenture loan (EMTN) due 2012 |
38 | 36 | 44 | 43 | ||||||||||||||
| JPY 4,000 million 2.50% private placement debenture loan (EMTN) due 2011 |
45 | 41 | 45 | 40 | ||||||||||||||
| Total debenture loans (with weighted average interest rate) |
12.35 | % | 3,287 | 3,288 | 12.06 | % | 3,381 | 3,360 | ||||||||||
| Other loans |
5 | 5 | — | — | ||||||||||||||
| Total long-term debt |
7.09 | % | 8,293 | 8,023 | 6.91 | % | 8,509 | 8,177 | ||||||||||
| Capital lease and other financing obligations |
128 | 131 | ||||||||||||||||
| Bank overdrafts |
18 | 15 | ||||||||||||||||
| Total debt and other financing arrangements |
8,439 | 8,655 | ||||||||||||||||
| Less: Current portion of long-term debt, capital lease and other financing obligations and other short-term borrowings |
40 | 107 | ||||||||||||||||
| Non-current portion of long-term debt and capital lease and other financing obligations |
$ | 8,399 | $ | 8,548 | ||||||||||||||
The fair value of the Company’s long-term debt instruments was based on the yield on public debt where available or current borrowing rates available for financings with similar terms and maturities.
F-73
Table of Contents
Nielsen Holdings B.V.
Notes to Condensed Consolidated Financial Statements—(Continued)
Annual maturities of Nielsen’s long-term debt are as follows:
| (IN MILLIONS) |
|||
| For July 1, 2010 to December 31, 2010 |
$ | 6 | |
| 2011 |
60 | ||
| 2012 |
114 | ||
| 2013 |
3,296 | ||
| 2014 |
1,371 | ||
| 2015 |
12 | ||
| Thereafter |
3,434 | ||
| $ | 8,293 | ||
In January 2009 Nielsen issued $330 million in aggregate principal amount of 11.625 % Senior Notes due 2014 at an issue price of $297 million with cash proceeds of approximately $290 million, net of fees and expenses.
In March 2009 the Company purchased and cancelled approximately GBP 101 million of the total GBP 250 million outstanding 5.625% EMTN debenture notes. This transaction was pursuant to a cash tender offer, whereby the Company paid, and participating note holders received, a price of £940 per £1,000 in principal amount of the notes, plus accrued interest. In conjunction with the GBP note cancellation the Company satisfied, and paid in cash, a portion of the remarketing settlement value associated with the cancelled notes to the two holders of a remarketing option associated with the notes. In addition, the Company unwound a portion of its existing GBP/Euro foreign currency swap, which was previously designated as a foreign currency cash flow hedge. The Company recorded a net loss of $3 million as a result of the combined elements of this transaction in March 2009 as a component of other expense, net in the condensed consolidated statement of operations. The net cash paid for the combined elements of this transaction was approximately $197 million. The Company completed a tender offer for the remaining outstanding debenture notes in June 2009.
In April 2009 Nielsen issued $500 million in aggregate principal amount of 11.5% Senior Notes due 2016 at an issue price of $461 million with cash proceeds of approximately $452 million, net of fees and expenses.
In June 2009, the Company purchased and cancelled all of its remaining outstanding GBP 149 million 5.625% EMTN debenture notes. This transaction was pursuant to a cash tender offer, whereby the Company paid, and participating note holders received, par value for the notes, plus accrued interest. In conjunction with the GBP note cancellation the Company satisfied, and paid in cash, the remarketing settlement value to the two holders of the remaining portion of the remarketing option associated with the notes. In addition, the Company unwound the remaining portion of its existing GBP/Euro foreign currency swap, which was previously designated as a foreign currency cash flow hedge. The Company recorded a net loss of approximately $12 million in June 2009 as a component of other expense, net in the condensed consolidated statement of operations as a result of the combined elements of this transaction. The net cash paid for the combined elements of this transaction was approximately $330 million.
In June 2009, Nielsen entered into a Senior Secured Loan Agreement with Goldman Sachs Lending Partners, LLC, which provides for senior secured term loans in the aggregated principal amount of $500 million (the “New Term Loans”) bearing interest at a fixed rate of 8.50%. The New Term Loans are secured on a pari passu basis with the Company’s existing obligations under its senior secured credit facilities and have a maturity
F-74
Table of Contents
Nielsen Holdings B.V.
Notes to Condensed Consolidated Financial Statements—(Continued)
of eight years. The net proceeds from the issuance of the New Term Loans of approximately $481 million were used in their entirety to pay down senior secured term loan obligations under the Company’s existing senior secured credit facilities.
In June 2009, Nielsen received the requisite consent to amend its senior secured credit facilities to permit, among other things: (i) future issuances of additional secured notes or loans, which may include, in each case, indebtedness secured on a pari passu basis with Nielsen’s obligations under the senior secured credit facilities, so long as (a) the net cash proceeds from any such issuance are used to prepay term loans under the senior secured credit facilities at par until $500 million of term loans have been paid, and (b) 90% of the net cash proceeds in excess of the first $500 million from any such issuance (but all of the net cash proceeds after the first $2.0 billion) are used to prepay term loans under the senior secured credit facilities at par; and (ii) allow Nielsen to agree with lenders to extend the maturity of their term loans and revolving commitments and for it to pay increased interest rates or otherwise modify the terms of their loans in connection with such an extension (subject to certain limitations, including mandatory increases of interest rates under certain circumstances) (collectively, the “Amendment”). In connection with the Amendment, Nielsen extended the maturity of $1.26 billion of their existing term loans from August 9, 2013 to May 1, 2016. The interest rate margins of term loans that were extended were increased to 3.75%. The Amendment and the subsequent extension of maturity of a portion of the existing term loans is considered a modification of the Company’s existing obligations and has been reflected as such in the condensed consolidated financial statements. The Company recorded a charge of approximately $4 million in June 2009 as a component of other expense, net in the condensed consolidated statement of operations primarily relating to the write-off of previously deferred debt issuance costs as a result of this modification.
In May 2010, our EUR 50 million variable rate EMTN matured and was repaid.
Subsequent Events
Effective July 1, 2010, the Company designated its EUR 321 million variable rate senior secured term loan due 2013 and its EUR 179 million variable rate senior secured term loan due 2016 as non-derivative hedges of its net investment in a European subsidiary. Beginning on July 1, 2010, gains or losses attributable to fluctuations in the Euro as compared to the U.S. Dollar associated with this debenture will be recorded to the cumulative translation adjustment within stockholders’ equity, net of income tax. The Company’s net income/(loss) reflected foreign currency exchange gains of $96 million for the six months ended June 30, 2010, and losses of $7 million for the six months ended June 30, 2009 associated with these loans.
In July 2010, Nielsen offered lenders under its senior secured credit facilities the option of extending the maturity of their existing term loans from August 9, 2013 to May 1, 2016. The interest rate margin of term loans that have been extended will be increased to 3.75%, subject to a 0.25% decrease based upon the Company attaining certain specified financial metrics, and, separately, subject to a further 0.25% reduction based upon the Company attaining certain credit ratings. As of July 29, 2010, lenders agreed to extend approximately $1.5 billion of their 2013 term loan commitments pursuant to the offer, and the Company intends to accept such amount for extension. The extension is expected to be formally completed in early August 2010.
9. Stockholders’ Equity
Share Capital
The Company has the authority to issue 1,250,000,000 shares of common stock with a par value of Euro €.04 per share under its articles of association. As of June 30, 2010, 443,078,009 shares were issued. The Company repurchased 128,954 shares during the six months ended June 30, 2010 and held 885,471 cumulative
F-75
Table of Contents
Nielsen Holdings B.V.
Notes to Condensed Consolidated Financial Statements—(Continued)
repurchased shares in treasury stock as of that date. No dividends were declared or paid on the common stock during the six months ended June 30, 2010.
Comprehensive Income/(Loss)
The following table sets forth the components of comprehensive income/(loss), net of income tax expense:
| Six Months Ended June 30, |
||||||||
| (IN MILLIONS) |
2010 | 2009 | ||||||
| Net income/(loss) |
$ | 117 | $ | (7 | ) | |||
| Other comprehensive income/(loss), net of tax |
||||||||
| Unrealized gains/(losses) on: |
||||||||
| Currency translation adjustments |
(144 | ) | 198 | |||||
| Available-for-sale securities |
— | (2 | ) | |||||
| Changes in the fair value of cash flow hedges |
9 | 12 | ||||||
| Pension liability |
— | (1 | ) | |||||
| Total other comprehensive (loss)/income |
(135 | ) | 207 | |||||
| Total comprehensive (loss)/income |
(18 | ) | 200 | |||||
| Comprehensive (loss)/income attributable to noncontrolling interests |
(1 | ) | 1 | |||||
| Total comprehensive (loss)/income attributable to Nielsen stockholders. |
$ | (17 | ) | $ | 199 | |||
10. Share-Based Compensation
The Company recorded $9 million in share-based compensation expense for the six months ended June 30, 2010. The Company granted 1,742,783 of combined performance and time-based options during the six months ended June 30, 2010. The weighted-average grant date fair value per share was $11.51 for the options granted in the six months ended June 30, 2010. No additional significant stock option activity occurred during the six months ended June 30, 2010.
The Company recorded net credits for share-based compensation of $1 million for the six months ended June 30, 2009 as a result of the Company’s second quarter 2009 determination that it was not probable that the performance options that were expected to vest on December 31, 2010 and 2011 would vest. Because the performance options were no longer expected to vest, the cumulative share based compensation expense of $10 million related to these options was reversed; including $8 million recorded in prior years, and was accounted for as a change in estimate. Further, on June 2, 2009, a modification was made to the vesting provisions of the performance options scheduled to vest on December 31, 2010 and 2011. Should the respective performance targets not be achieved, the modification would allow those performance options to convert to time-based options, subject to continued employment, with a stated vesting date of December 31, 2012 and December 31, 2013 for the 2010 and 2011 options, respectively.
11. Income Taxes
Nielsen has a presence in approximately 100 countries around the world and its earnings are taxed at the applicable local country income tax rate in effect.
The effective tax rates for the six months ended June 30, 2010 and 2009 were 9% expense and 63% (benefit), respectively.
F-76
Table of Contents
Nielsen Holdings B.V.
Notes to Condensed Consolidated Financial Statements—(Continued)
The effective tax rate for the six months ended June 30, 2010 is lower than the statutory expense rate primarily due to the favorable effect of certain foreign currency exchange gains and financing activities. The effective tax benefit rate for the six months ended June 30, 2009 is higher than the statutory rate primarily due to the favorable effect of certain foreign currency exchange gains, the impact of the tax rate differences in other jurisdictions where the Company files tax returns and the change in unrecognized income tax benefits which were partially offset by the change in interest on liabilities for unrecognized income tax benefits.
Liabilities for unrecognized income tax benefits totaled $123 million and $129 million as of June 30, 2010 and December 31, 2009, respectively. The decrease is primarily due to the recognition of certain income tax benefits as a result of statute of limitation expirations as well as fluctuations in foreign currency exchange rates. If the Company’s tax positions are favorably sustained by the taxing authorities, the reversal of the underlying liabilities would reduce the Company’s effective tax rate in future periods.
The Company files numerous consolidated and separate income tax returns in the U.S. Federal jurisdiction and in many state and foreign jurisdictions. With few exceptions, the Company is no longer subject to U.S. Federal income tax examinations for 2005 and prior periods. In addition, the Company has subsidiaries in various states, provinces and countries that are currently under audit for years ranging from 1997 through 2008.
The IRS commenced examinations of certain Company’s U.S. Federal income tax returns for 2006 and 2007 in the first quarter of 2009. The Company is under Canadian audit for the years 2006, 2007 and 2008. It is anticipated that all examinations will be completed within the next twelve months. To date, the Company is not aware of any material adjustments not already accrued related to any of the current Federal, state or foreign audits under examination.
12. Related Party Transactions
The Company recorded $6 million in selling, general and administrative expenses related to management fees, travel and consulting attributable to a number of the Sponsors for both the six months ended June 30, 2010 and 2009.
In May 2006, Luxco, the Company’s direct parent, executed a loan agreement with the Company for principal amount Euro 500 million in conjunction with Valcon’s acquisition of TNC B.V. The loan accreted interest at 10.00% per annum and was payable annually at the request of Luxco or the Company. The loan agreement stipulated that if interest was not paid at the end of each year, such interest was deemed to be capitalized. No interest was paid on this loan and in January 2009 the loan agreement was terminated and the underlying carrying value, including accrued interest, was capitalized by Luxco in exchange for 78,332,870 shares in the Company’s common stock. Nielsen recorded $3 million in interest expense associated with this loan for the six months ended June 30, 2009.
13. Commitments and Contingencies
Sunbeam Television Corp.
Sunbeam Television Corp. (“Sunbeam”) filed a lawsuit in Federal District Court in Miami, Florida on April 30, 2009. The lawsuit alleges that Nielsen Media Research, Inc. violated Federal and Florida state antitrust laws and Florida’s unfair trade practices laws by attempting to maintain a monopoly and abuse its position in the market, and breached its contract with Sunbeam by producing defective ratings data through its sampling methodology. The complaint did not specify the amount of damages sought and also sought declaratory and equitable relief. Nielsen believes this lawsuit is without merit and intends to defend it vigorously.
F-77
Table of Contents
Nielsen Holdings B.V.
Notes to Condensed Consolidated Financial Statements—(Continued)
Other Legal Proceedings and Contingencies
Nielsen is subject to litigation and other claims in the ordinary course of business.
14. Segments
The Company aligns its operating segments in order to conform to management’s internal reporting structure, which is reflective of service offerings by industry. Management aggregates such operating segments into three reportable segments: What Consumers Watch (“Watch”), consisting principally of television ratings, television, internet and mobile audience and advertising measurement and corresponding analytics; What Consumers Buy (“Buy”), consisting principally of market research information and analytical services; and Expositions, consisting principally of trade shows, events and conferences. Corporate consists principally of unallocated items such as certain facilities and infrastructure costs as well as intersegment eliminations.
Certain corporate costs, other than those described above, including those related to selling, finance, legal, human resources, and information technology systems, are considered operating costs and are allocated to our segments based on either the actual amount of costs incurred or on a basis consistent with the operations of the underlying segment. Information with respect to the operations of each of Nielsen’s business segments is set forth below based on the nature of the products and services offered and geographic areas of operations.
Business Segment Information
Six months ended June 30, 2010 and June 30, 2009
| (IN MILLIONS) |
Watch | Buy | Expositions | Corporate | Total | |||||||||||
| Six Months Ended June 30, 2010 |
||||||||||||||||
| Revenues |
$ | 837 | $ | 1,542 | $ | 87 | $ | — | $ | 2,466 | ||||||
| Depreciation and amortization |
$ | 146 | $ | 109 | $ | 14 | $ | 8 | $ | 277 | ||||||
| Restructuring costs |
$ | 5 | $ | 8 | $ | — | $ | 9 | $ | 22 | ||||||
| Share-Based Compensation |
$ | 2 | $ | 3 | $ | — | $ | 4 | $ | 9 | ||||||
| Operating income/(loss) |
$ | 156 | $ | 180 | $ | 26 | $ | (48 | ) | $ | 314 | |||||
| (IN MILLIONS) |
Watch | Buy | Expositions | Corporate | Total | |||||||||||||
| Six Months Ended June 30, 2009 |
||||||||||||||||||
| Revenues |
$ | 796 | $ | 1,387 | $ | 101 | $ | — | $ | 2,284 | ||||||||
| Depreciation and amortization |
$ | 135 | $ | 106 | $ | 19 | $ | 6 | $ | 266 | ||||||||
| Restructuring costs |
$ | 5 | $ | 2 | $ | 1 | $ | 1 | $ | 9 | ||||||||
| Share-Based Compensation |
$ | (1 | ) | $ | 1 | $ | — | $ | (1 | ) | $ | (1 | ) | |||||
| Operating income/(loss) |
$ | 153 | $ | 150 | $ | 10 | $ | (29 | ) | $ | 284 | |||||||
F-78
Table of Contents

Table of Contents
Shares
Common Stock
PROSPECTUS
| J.P. Morgan |
Morgan Stanley |
| Credit Suisse |
Deutsche Bank Securities | Goldman, Sachs & Co. | Citi | |||||
BofA Merrill Lynch
| William Blair & Company | Guggenheim Securities |
| RBS | Wells Fargo Securities |
| Blaylock Robert Van, LLC | HSBC | Loop Capital Markets | ||
| Mizuho Securities USA Inc. | Ramirez & Co., Inc. | The Williams Capital Group, L.P. | ||
Table of Contents
PART II
INFORMATION NOT REQUIRED IN PROSPECTUS
| Item 13. | Other Expenses of Issuance and Distribution. |
The following table sets forth the costs and expenses, other than underwriting discounts and commissions, payable solely by the Registrant in connection with the offer and sale of the securities being registered. All amounts are estimates except the registration fee.
| SEC registration fee |
$ | 143,491 | |
| FINRA filing fee |
$ | 75,500 | |
| Exchange listing fee |
* | ||
| Blue Sky fees and expenses |
* | ||
| Transfer agent’s fee |
* | ||
| Printing and engraving expenses |
* | ||
| Legal fees and expenses |
* | ||
| Accounting fees and expenses |
* | ||
| Liability insurance for directors and officers |
* | ||
| Miscellaneous |
* | ||
| Total |
* | ||
| * | To be completed by amendment. |
| Item 14. | Indemnification of Directors and Officers. |
Unless prohibited by law in a particular circumstance, upon our Conversion, our articles of association will require us to reimburse the members of the board of directors and the former members of the board of directors for damages and various costs and expenses related to claims brought against them in connection with the exercise of their duties. However, the Company will not be obligated to provide indemnification (i) if a Dutch court has established in a final and conclusive decision that the act or failure to act of the person concerned may be characterized as willful (opzettelijk), intentionally reckless (bewust roekeloos) or seriously culpable (ernstig verwijtbaar) conduct, unless Dutch law provides otherwise or this would, in view of the circumstances of the case, be unacceptable according to standards of reasonableness and fairness, (ii) for any action initiated by the indemnitee, other than actions brought to establish a right to indemnification or the advancement of expenses or actions authorized by the board of directors or (iii) for any expenses incurred by an indemnitee with respect to any action instituted by the indemnitee to interpret the indemnification provisions, unless the indemnitee is successful or the court finds that indemnitee is entitled to indemnification. We may enter into indemnification agreements with the members of the board of directors and our officers to provide for further details on these matters. We expect to purchase directors’ and officers’ liability insurance for the members of the board of directors and certain other officers.
At present, there is no pending litigation or proceeding involving any member of the board of directors, officer, employee or agent where indemnification will be required or permitted. We are not aware of any threatened litigation or proceeding that might result in a claim for such indemnification.
Insofar as indemnification of liabilities arising under the Securities Act 1933, as amended, may be permitted to members of the board of directors, officers or persons controlling us pursuant to the foregoing provisions, we have been informed that, in the opinion of the SEC, such indemnification is against public policy as expressed in the Securities Act 1933, as amended, and is therefore unenforceable.
II-1
Table of Contents
| Item 15. | Recent Sales of Unregistered Securities. |
Equity Securities
During the year ended December 31, 2007, we issued and sold to certain of our employees 5,411,534 shares of common stock for an aggregate purchase price of $54,115,340. We also granted to certain employees (i) 100,000 restricted stock units and (ii) options to purchase 18,565,305 million shares of common stock under our 2006 Stock Acquisition and Option Plan. The exercise prices for these options ranged from $1.31 to $20 per share. These securities were issued without registration in reliance on the exemptions afforded by Section 4(2) of the Securities Act of 1933, as amended (the “Securities Act”), and Rule 701 promulgated thereunder.
During the year ended December 31, 2008, we issued and sold to certain of our employees 973,209 shares of common stock for an aggregate purchase price of $10,575,299. We also granted to certain employees options to purchase 3,134,344 shares of common stock under our 2006 Stock Acquisition and Option Plan. The exercise prices for these options ranged from $2.75 to $22 per share. These securities were issued without registration in reliance on the exemptions afforded by Section 4(2) of the Securities Act and Rule 701 promulgated thereunder.
During the year ended December 31, 2009, we issued and sold to certain of our employees 1,037,516 shares of common stock for an aggregate purchase price of $10,375,160. We also granted to certain of our employees (i) 100,000 restricted stock units for and (ii) options to purchase 1,783,070 shares of common stock under our 2006 Stock Acquisition and Option Plan. The exercise prices for these options ranged from $10 to $22 per share. These securities were issued without registration in reliance on the exemptions afforded by Section 4(2) of the Securities Act and Rule 701 promulgated thereunder.
In June 2009, we granted 350,000 time-based stock options to affiliates of Centerview Partners (“Centerview”), one of our sponsors, in connection with one of Centerview’s partners being elected Chairman of the Supervisory Board of The Nielsen Company B.V. As of December 31, 2009, Centerview collectively holds 500,000 performance-based options and 350,000 time-based options to purchase shares in Valcon. The exercise price for these options is $10 per share. These securities were issued without registration in reliance on the exemption afforded by Section 4(2) of the Securities Act.
During the quarter ended March 31, 2010, we granted to certain of our employees options to purchase 1,375,000 shares of common stock under our 2006 Stock Acquisition and Option Plan. The exercise price for these options is $11.50 per share. These options were issued without registration in reliance on the exemptions afforded by Section 4(2) of the Securities Act and Rule 701 promulgated thereunder.
Debt Securities
On May 1, 2009, Nielsen Finance LLC and Nielsen Finance Co., subsidiaries wholly owned by us, issued $500 million aggregate principal amount of 11.5% Senior Notes due 2016 at a price of 92.173% of their face value resulting in approximately $452 million of gross proceeds, which were used for general corporate purposes. The initial purchasers for the senior notes issued on May 1, 2009 were J.P. Morgan Securities Inc., Goldman, Sachs & Co., Credit Suisse Securities (USA) LLC, Deutsche Bank Securities Inc. and Morgan Stanley & Co. Incorporated.
On January 27, 2009, Nielsen Finance LLC and Nielsen Finance Co. issued $330 million in aggregate principal amount of 11.625% Senior Notes due 2014 at a price of 90% of their face value resulting in approximately $290 million of gross proceeds, which were used for general corporate purposes. The initial purchasers for the senior notes issued on January 27, 2009 were J.P. Morgan Securities Inc., Deutsche Bank Securities Inc., Citigroup Global Markets Inc. and Goldman, Sachs & Co.
On April 16, 2008, Nielsen Finance LLC and Nielsen Finance Co. issued $220 million aggregate principal amount of 10% Senior Notes due 2014 at varying prices determined at the time of sale resulting in approximately $212 million of gross proceeds, which were used to finance the acquisition of IAG Research, Inc. The initial purchaser for the senior notes issued on April 16, 2008 was J.P. Morgan Securities Inc.
II-2
Table of Contents
Each of the above offerings of debt securities was offered and sold to qualified institutional buyers pursuant to Rule 144A under the Securities Act or to non-U.S. investors outside the United States in compliance with Regulation S of the Securities Act.
| Item 16. | Exhibits and Financial Statement Schedules. |
(a) Exhibits
See the Exhibit Index immediately following the signature page hereto, which is incorporated by reference as if fully set forth herein.
(b) Financial Statement Schedules
All schedules are omitted because the required information is either not present, not present in material amounts or presented within the consolidated financial statements included in the prospectus that is part of this registration statement.
| Item 17. | Undertakings. |
The undersigned registrant hereby undertakes that:
(1) For purposes of determining any liability under the Securities Act of 1933, the information omitted from the form of prospectus filed as part of this Registration Statement in reliance upon Rule 430A and contained in a form of prospectus filed by the Registrant pursuant to Rule 424(b)(1) or (4) or 497(h) under the Securities Act shall be deemed to be part of this Registration Statement as of the time it was declared effective.
(2) For the purpose of determining any liability under the Securities Act of 1933, each post-effective amendment that contains a form of prospectus shall be deemed to be a new registration statement relating to the securities offered therein, and the offering of such securities at that time shall be deemed to be the initial bona fide offering thereof.
(3) Insofar as indemnification for liabilities arising under the Securities Act of 1933 may be permitted to directors, officers and controlling persons of the registrant pursuant to the foregoing provisions, or otherwise, the registrant has been advised that in the opinion of the Securities and Exchange Commission such indemnification is against public policy as expressed in the Act and is, therefore, unenforceable. In the event that a claim for indemnification against such liabilities (other than the payment by the registrant of expenses incurred or paid by a director, officer or controlling person of the registrant in the successful defense of any action, suit or proceeding) is asserted by such director, officer or controlling person in connection with the securities being registered, the registrant will, unless in the opinion of its counsel the matter has been settled by controlling precedent, submit to a court of appropriate jurisdiction the question whether such indemnification by it is against public policy as expressed in the Act and will be governed by the final adjudication of such issue.
(4) The undersigned registrant hereby undertakes to provide to the underwriter at the closing specified in the underwriting agreement certificates in such denominations and registered in such names as required by the underwriter to permit prompt delivery to each purchaser.
II-3
Table of Contents
SIGNATURES
Pursuant to the requirements of the Securities Act of 1933, the registrant has duly caused this Registration Statement to be signed on its behalf by the undersigned, thereunto duly authorized, in the city of New York, State of New York, on August 16, 2010.
| Nielsen Holdings B.V. | ||
| By: | * | |
| Name: | Brian J. West | |
| Title: | Chief Financial Officer | |
Pursuant to the requirements of the Securities Act of 1933, this amendment to the Registration Statement has been signed by the following persons in the capacities and on August 16, 2010.
| Signature |
Title | |
| * David L. Calhoun |
Chief Executive Officer (Principal Executive Officer) | |
| * Brian J. West |
Chief Financial Officer (Principal Financial Officer) | |
| * Jeffrey R. Charlton |
Corporate Controller (Principal Accounting Officer) | |
| * Michael S. Chae |
Director | |
| * Alexander Navab |
Director | |
| * Scott A. Schoen |
Director | |
| * Patrick J. Healy |
Director | |
| * James A. Attwood, Jr. |
Director | |
| * Marcel Rutte |
Director | |
II-4
Table of Contents
| Signature |
Title | |
| * AlpInvest Partners 2006 B.V. (By AlpInvest Partners N.V., its managing director, by P.F.F. de van der Schueren, its representative) |
Director | |
|
* AlpInvest Partners 2006 B.V. (By AlpInvest Partners N.V., its managing director, by E.M.J. Thyssen, its director) |
||
| *By: | /S/ JAMES W. CUMINALE | |
| Attorney-in-fact |
II-5
Table of Contents
EXHIBIT INDEX
| Exhibit No. |
Description | |
| 1.1** | Form of Underwriting Agreement | |
| 3.1** | Form of Deed of Incorporation of Nielsen Holdings N.V. (formerly Valcon Acquisition Holding B.V.) | |
| 3.2** | Form of Amended and Restated Articles of Association of Nielsen Holdings N.V. (unofficial English translation) | |
| 4.1(a) | Credit Agreement, dated as of August 9, 2006, among Nielsen Finance LLC, as a U.S. Borrower, VNU, Inc., as a U.S. Borrower, VNU Holding and Finance B.V., as Dutch Borrower, the Guarantors party thereto from time to time, Citibank, N.A., as Administrative Agent, Swing Line Lender and L/C Issuer, ABN AMRO Bank N.V., as Swing Line Lender, the other Lenders party thereto from time to time, Deutsche Bank Securities Inc., as Syndication Agent, and JPMorgan Chase Bank, N.A., ABN AMRO Bank N.V. and ING Bank N.V., as Co-Documentation Agents | |
| 4.1(b) | Security Agreement, dated as of August 9, 2006, among Nielsen Finance LLC, the other Grantors identified therein and Citibank, N.A. as Collateral Agent | |
| 4.1(c) | Intellectual Property Security Agreement, dated as of August 9, 2006, among Nielsen Finance LLC, the other Grantors identified therein and Citibank, N.A. as Collateral Agent | |
| 4.1(d) | Amendment No. 1, dated as of January 22, 2007, to the Credit Agreement, dated as of August 9, 2006, among Nielsen Finance LLC, as a U.S. Borrower, The Nielsen Company (US), Inc., as a U.S. Borrower, VNU Holding and Finance B.V., as Dutch Borrower, the Guarantors party thereto from time to time, Citibank, N.A., as Administrative Agent, Swing Line Lender and L/C Issuer, ABN AMRO Bank N.V., as Swing Line Lender, the other Lenders party thereto from time to time, Deutsche Bank Securities Inc., as Syndication Agent, and JPMorgan Chase Bank, N.A., ABN AMRO Bank N.V. and ING Bank N.V., as Co-Documentation Agents (incorporated herein by reference to Exhibit 4.1(d) to Amendment No. 2 to the Registration Statement on Form S-4 of The Nielsen Company B.V. filed on July 12, 2007 (File No. 333-142546)) | |
| 4.1(e) | Amendment No. 2, dated as of August 9, 2007, to the Credit Agreement, dated as of August 9, 2006, among Nielsen Finance LLC, as a U.S. Borrower, The Nielsen Company (US), Inc., as a U.S. Borrower, VNU Holding and Finance B.V., as Dutch Borrower, the Guarantors thereto from time to time, Citibank, N.A., as Administrative Agent, Swing Line Lender and L/C Issuer, ABN AMRO Bank N.V., as Swing Line Lender, the other Lenders party thereto from time to time, Deutsche Bank Securities Inc., as Syndication Agent, and JPMorgan Chase Bank, N.A., ABN AMRO Bank N.V. and ING Bank N.V., as Co-Documentation Agents (incorporated herein by reference to Exhibit 10.1 to the Form 8-K of The Nielsen Company B.V. filed on August 14, 2007 (File No. 333-142546)) | |
| 4.1(f) | Amendment Agreement, dated as of June 16, 2009, to the Credit Agreement, dated as of August 9, 2006, among Nielsen Finance LLC, as a U.S. Borrower, The Nielsen Company (US), Inc., as a U.S. Borrower, VNU Holding and Finance B.V., as Dutch Borrower, the Guarantors thereto from time to time, Citibank, N.A., as Administrative Agent, Swing Line Lender and L/C Issuer, ABN AMRO Bank N.V., as Swing Line Lender, the other Lenders party thereto from time to time, Deutsche Bank Securities Inc., as Syndication Agent, and JPMorgan Chase Bank, N.A., ABN AMRO Bank N.V. and ING Bank N.V., as Co-Documentation Agents (incorporated herein by reference to Exhibit 4.1(a) to the Form 8-K/A of The Nielsen Company B.V. filed on June 26, 2009 (File No. 333-142546)) | |
II-6
Table of Contents
| Exhibit No. |
Description | |
| 4.1(g) | Senior Secured Loan Agreement, dated June 8, 2009, by and among Nielsen Finance LLC, the Guarantors party thereto from time to time, Goldman Sachs Lending Partners LLC and the other Lenders party thereto from time to time | |
| 4.1(h) | Amended and Restated Credit Agreement, dated August 9, 2006 and amended and restated as of June 23, 2009, among Nielsen Finance LLC, as a U.S. Borrower, TNC (US) Holdings Inc., as a U.S. Borrower, Nielsen Holding and Finance B.V., as Dutch Borrower, the Guarantors party thereto from time to time, Citibank, N.A., as Administrative Agent, Swing Line Lender and L/C Issuer, ABN AMRO Bank N.V., as Swing Line Lender, the other Lenders party thereto from time to time, Deutsche Bank Securities Inc., as Syndication Agent and JPMorgan Chase Bank, N.A., ABN AMRO Bank N.V. and ING Bank N.V., as Co-Documentation Agents | |
| 4.1(i) | First Lien Intercreditor Agreement, dated as of June 23, 2009, among Citibank, N.A., as Collateral Agent and Authorized Representative under the Credit Agreement, Goldman Sachs Lending Partners LLC, as the Initial Additional Authorized Representative, and each additional Authorized Representative from time to time party thereto (incorporated herein by reference to Exhibit 4.1(c) to the Form 8-K/A of The Nielsen Company B.V. filed on June 26, 2009 (File No. 333-142546)) | |
| 4.1(j) | Amended and Restated Security Agreement, dated as of August 9, 2006 and amended and restated as of June 23, 2009, among Nielsen Finance LLC, the other Grantors identified therein, and Citibank, N.A., as Collateral Agent | |
| 4.1(k) | Amendment No. 1, dated as of August 13, 2010, to the Amended and Restated Credit Agreement, dated August 9, 2006 and amended and restated as of June 23, 2009, among Nielsen Finance LLC, as a U.S. Borrower, TNC (US) Holdings Inc., as a U.S. Borrower, Nielsen Holding and Finance B.V., as Dutch Borrower, the Guarantors party thereto from time to time, Citibank, N.A., as Administrative Agent, Swing Line Lender and L/C Issuer, ABN AMRO Bank N.V., as Swing Line Lender, the other Lenders party thereto from time to time, Deutsche Bank Securities Inc., as Syndication Agent and JPMorgan Chase Bank, N.A., ABN AMRO Bank N.V. and ING Bank N.V., as Co-Documentation Agents (incorporated herein by reference to Exhibit 4.1 to the Form 8-K of The Nielsen Company B.V. filed on August 16, 2010 (File No. 333-142546)) | |
| 4.2 | Indenture, dated as of August 9, 2006, between VNU Group B.V. and Law Debenture Trust Company of New York, as Trustee, for the 11 1/8% Senior Notes due 2016 (incorporated herein by reference to Exhibit 4.2 to the Registration Statement on Form S-4 of The Nielsen Company B.V. filed on May 2, 2007 (File No. 333-142546)) | |
| 4.3(a) | Indenture, dated as of August 9, 2006, among Nielsen Finance LLC, Nielsen Finance Co., the Guarantors named on the signature pages thereto and Law Debenture Trust Company of New York, as Trustee, for the U.S. Dollar denominated 10% Senior Notes due 2014 and the Euro denominated 9% Senior Notes due 2014 (incorporated herein by reference to Exhibit 4.4(a) to the Registration Statement on Form S-4 of The Nielsen Company B.V. filed on May 2, 2007 (File No. 333-142546)) | |
| 4.3(b) | First Supplemental Indenture, dated as of October 16, 2006, among Radio and Records, Inc., an affiliate of Nielsen Finance LLC and Nielsen Finance Co., and Law Debenture Trust Company of New York, as Trustee, for the U.S. Dollar denominated 10% Senior Notes due 2014 and the Euro denominated 9% Senior Notes due 2014 (incorporated herein by reference to Exhibit 4.4(b) to the Registration Statement on Form S-4 of The Nielsen Company B.V. filed on May 2, 2007 (File No. 333-142546)) | |
| 4.3(c) | Second Supplemental Indenture, dated as of August 15, 2007, among NetRatings, Inc., an affiliate of Nielsen Finance LLC and Nielsen Finance Co., and Law Debenture Trust Company of New York, as Trustee, for the U.S. Dollar denominated 10% Senior Notes due 2014 and the Euro denominated 9% Senior Notes due 2014 (incorporated herein by reference to Exhibit 4.2 to the Form 10-Q of The Nielsen Company B.V. filed on November 14, 2007 (File No. 333-142546)) | |
II-7
Table of Contents
| Exhibit No. |
Description | |
| 4.3(d) | Third Supplemental Indenture, dated as of August 15, 2007, among Telephia, Inc., an affiliate of Nielsen Finance LLC and Nielsen Finance Co., and Law Debenture Trust Company of New York, as Trustee, for the U.S. Dollar denominated 10% Senior Notes due 2014 and the Euro denominated 9% Senior Notes due 2014 (incorporated herein by reference to Exhibit 4.4 to the Form 10-Q of The Nielsen Company B.V. filed on November 14, 2007 (File No. 333-142546)) | |
| 4.3(e) | Fourth Supplemental Indenture, dated as of November 28, 2007, among Nielsen Business Media Holding Company, an affiliate of Nielsen Finance LLC and Nielsen Finance Co., and Law Debenture Trust Company of New York, as Trustee, for the U.S. Dollar denominated 10% Senior Notes due 2014 and the Euro denominated 9% Senior Notes due 2014 (incorporated herein by reference to Exhibit 4.4(e) to the Registration Statement on Form S-4 of The Nielsen Company B.V. filed on June 4, 2008 (File No. 333-151408-28)) | |
| 4.3(f) | Fifth Supplemental Indenture, dated as of April 9, 2008, among Audience Analytics, L.L.C., Cannon Holdings, L.L.C., both affiliates of Nielsen Finance LLC and Nielsen Finance Co., and Law Debenture Trust Company of New York, as Trustee, for the U.S. Dollar denominated 10% Senior Notes due 2014 and the Euro denominated 9% Senior Notes due 2014 (incorporated herein by reference to Exhibit 4.4(f) to the Registration Statement on Form S-4 of The Nielsen Company B.V. filed on June 4, 2008 (File No. 333-151408-28)) | |
| 4.3(g) | Sixth Supplemental Indenture, dated as of April 16, 2008, among Nielsen Finance LLC, Nielsen Finance Co., the Guarantors named in the Indenture thereto and Law Debenture Trust Company of New York, as Trustee, for the U.S. Dollar denominated 10% Senior Notes due 2014 and the Euro denominated 9% Senior Notes due 2014 (incorporated herein by reference to Exhibit 4.1(a) to the Form 8-K of The Nielsen Company B.V. filed on April 21, 2008 (File No. 333-142546)) | |
| 4.3(h) | Seventh Supplemental Indenture, dated as of July 15, 2008, among Nielsen IAG, Inc. an affiliate of Nielsen Finance LLC and Nielsen Finance Co., and Law Debenture Trust Company of New York, as Trustee, for the U.S. Dollar denominated 10% Senior Notes due 2014 and the Euro denominated 9% Senior Notes due 2014 (incorporated herein by reference to Exhibit 4.4 to the quarterly report on Form 10-Q of The Nielsen Company B.V. for the fiscal quarter ended September 30, 2008 (File No. 333-142546)) | |
| 4.3(i) | Eighth Supplemental Indenture, dated as of July 15, 2008, among RewardTV, Inc., an affiliate of Nielsen Finance LLC and Nielsen Finance Co., and Law Debenture Trust Company of New York, as Trustee, for the U.S. Dollar denominated 10% Senior Notes due 2014 and the Euro denominated 9% Senior Notes due 2014 (incorporated herein by reference to Exhibit 4.6 to the quarterly report on Form 10-Q of The Nielsen Company B.V. for the fiscal quarter ended September 30, 2008 (File No. 333-142546)) | |
| 4.3(j) | Ninth Supplemental Indenture, dated as of September 24, 2008, among ACNeilsen eRatings.com, an affiliate of Nielsen Finance LLC and Nielsen Finance Co., and Law Debenture Trust Company of New York, as Trustee, for the U.S. Dollar denominated 10% Senior Notes due 2014 and the Euro denominated 9% Senior Notes due 2014 (incorporated herein by reference to Exhibit 4.8 to the quarterly report on Form 10-Q of The Nielsen Company B.V. for the fiscal quarter ended September 30, 2008 (File No. 333-142546)) | |
| 4.3(k) | Tenth Supplemental Indenture, dated as of February 13, 2009, among AGB Nielsen Media Research B.V., an affiliate of Nielsen Finance LLC and Nielsen Finance Co., and Law Debenture Trust Company of New York, as Trustee, for the U.S. Dollar denominated 10% Senior Notes due 2014 and the Euro denominated 9% Senior Notes due 2014 (incorporated herein by reference to Exhibit 4.4(k) to the quarterly report on Form 10-Q of The Nielsen Company B.V. for the fiscal quarter ended March 31, 2009 (File No. 333-142546)) | |
II-8
Table of Contents
| Exhibit No. |
Description | |
| 4.3(l) | Eleventh Supplemental Indenture, dated as of May 21, 2009, among The Cambridge Group, Inc., an affiliate of Nielsen Finance LLC and Nielsen Finance Co. and Law Debenture Trust Company of New York, as Trustee, for U.S. Dollar denominated 10% Senior Notes due 2014 and the Euro denominated 9% Senior Notes due 2014 (incorporated herein by reference to Exhibit 4.6(l) to the quarterly report on Form 10-Q of The Nielsen Company B.V. for the fiscal quarter ended June 30, 2009 (File No. 333-142546)) | |
| 4.4(a) | Indenture, dated as of August 9, 2006, among Nielsen Finance LLC, Nielsen Finance Co., the Guarantors named on the signature pages thereto and Law Debenture Trust Company of New York, as Trustee, for the 12 1/2% Senior Subordinated Discount Notes due 2016 (incorporated herein by reference to Exhibit 4.6(a) to the Registration Statement on Form S-4 of The Nielsen Company B.V. filed on May 2, 2007 (File No. 333-142546)) | |
| 4.4(b) | First Supplemental Indenture, dated as of October 16, 2006, among Radio and Records, Inc., an affiliate of Nielsen Finance LLC and Nielsen Finance Co., and Law Debenture Trust Company of New York, as Trustee, for the 12 1/2% Senior Subordinated Discount Notes due 2016 (incorporated herein by reference to Exhibit 4.6(b) to the Registration Statement on Form S-4 of The Nielsen Company B.V. filed on May 2, 2007 (File No. 333-142546)) | |
| 4.4(c) | Second Supplemental Indenture, dated as of August 15, 2007, among NetRatings, Inc., an affiliate of Nielsen Finance LLC and Nielsen Finance Co., and Law Debenture Trust Company of New York, as Trustee, for the 12 1/2% Senior Subordinated Discount Notes due 2016 (incorporated herein by reference to Exhibit 4.3 to the Form 10-Q of The Nielsen Company B.V. for the fiscal quarter ended September 30, 2007 (File No. 333- 142546)) | |
| 4.4(d) | Third Supplemental Indenture, dated as of August 15, 2007, among Telephia, Inc., an affiliate of Nielsen Finance LLC and Nielsen Finance Co., and Law Debenture Trust Company of New York, as Trustee, for the 12 1/2% Senior Subordinated Discount Notes due 2016 (incorporated herein by reference to Exhibit 4.5 to the Form 10-Q of The Nielsen Company B.V. for the fiscal quarter ended September 30, 2007 (File No. 333- 142546)) | |
| 4.4(e) | Fourth Supplemental Indenture, dated as of November 28, 2007, among Nielsen Business Media Holding Company, an affiliate of Nielsen Finance LLC and Nielsen Finance Co., and Law Debenture Trust Company of New York, as Trustee, for the 12 1/2% Senior Subordinated Discount Notes due 2016 (incorporated herein by reference to Exhibit 4.1 to the Form 10-Q of The Nielsen Company B.V. for the fiscal quarter ended March 31, 2008 (File No. 333-142546)) | |
| 4.4(f) | Fifth Supplemental Indenture, dated as of April 9, 2008, among Audience Analytics, L.L.C., Cannon Holdings, L.L.C., both affiliates of Nielsen Finance LLC and Nielsen Finance Co., and Law Debenture Trust Company of New York, as Trustee, for the 12 1/2% Senior Subordinated Discount Notes due 2016 (incorporated herein by reference to Exhibit 4.2 to the Form 10-Q of The Nielsen Company B.V. for the fiscal quarter ended March 31, 2008 (File No. 333-142546)) | |
| 4.4(g) | Sixth Supplemental Indenture, dated as of July 15, 2008, among Nielsen IAG, Inc., an affiliate of Nielsen Finance LLC and Nielsen Finance Co., and Law Debenture Trust Company of New York, as Trustee, for the 12 1/2% Senior Subordinated Discount Notes due 2016 (incorporated herein by reference to Exhibit 4.3 to the quarterly report on Form 10-Q of The Nielsen Company B.V. for the fiscal quarter ended September 30, 2008 (File No. 333-142546)) | |
| 4.4(h) | Seventh Supplemental Indenture, dated as of July 15, 2008, among RewardTV, Inc., an affiliate of Nielsen Finance LLC and Nielsen Finance Co., and Law Debenture Trust Company of New York, as Trustee, for the 12 1/2% Senior Subordinated Discount Notes due 2016 (incorporated herein by reference to Exhibit 4.5 to the quarterly report on Form 10-Q of The Nielsen Company B.V. for the fiscal quarter ended September 30, 2008 (File No. 333-142546)) | |
II-9
Table of Contents
| Exhibit No. |
Description | |
| 4.4(i) | Eighth Supplemental Indenture, dated as of September 24, 2008, among ACNielsen eRatings.com, an affiliate of Nielsen Finance LLC and Nielsen Finance Co., and Law Debenture Trust Company of New York, as Trustee, for the 12 1/2% Senior Subordinated Discount Notes due 2016 (incorporated herein by reference to Exhibit 4.7 to the quarterly report on Form 10-Q of The Nielsen Company B.V. for the fiscal quarter ended September 30, 2008 (File No. 333-142546)) | |
| 4.4(j) | Ninth Supplemental Indenture, dated as of February 13, 2009, among AGB Nielsen Media Research B.V., an affiliate of Nielsen Finance LLC and Nielsen Finance Co., and Law Debenture Trust Company of New York, as Trustee, for the 12 1/2% Senior Subordinated Discount Notes due 2016 (incorporated herein by reference to Exhibit 4.6(j) to the quarterly report on Form 10-Q of The Nielsen Company B.V. for the fiscal quarter ended March 31, 2009 (File No. 333-142546)) | |
| 4.4(k) | Tenth Supplemental Indenture, dated as of May 21, 2009, among The Cambridge Group, Inc., an affiliate of Nielsen Finance LLC and Nielsen Finance Co. and Law Debenture Trust Company of New York, as Trustee for U.S. Dollar denominated 12 1/2% Senior Subordinated Discount Notes due 2016 (incorporated herein by reference to Exhibit 4.6(k) to the quarterly report on Form 10-Q of The Nielsen Company B.V. for the fiscal quarter ended June 30, 2009 (File No. 333-142546)) | |
| 4.5(a) | Amended and Restated Trust Deed, dated October 29, 2002, by and between VNU N.V. and Deutsche Trustee Company Limited relating to the VNU N.V. €200,000,000 Euro Medium Term Note Programme (incorporated herein by reference to Exhibit 4.8(a) to Amendment No. 1 to the Registration Statement of The Nielsen Company B.V. on Form S-4 filed on June 21, 2007 (File No. 333-142546)) | |
| 4.5(b) | Supplemental Trust Deed, dated October 27, 2003, by and between VNU N.V. and Deutsche Trustee Company Limited relating to the €250,000,000 Euro Medium Term Note Programme (incorporated herein by reference to Exhibit 4.8(b) to Amendment No. 1 to the Registration Statement of The Nielsen Company B.V. on Form S-4 filed on June 21, 2007 (File No. 333- 142546)) | |
| 4.6(a) | Indenture, dated as of January 27, 2009, among Nielsen Finance LLC, Nielsen Finance Co., the Guarantors and Law Debenture Trust Company of New York for the 11.625% Senior Notes due 2014 (incorporated herein by reference to Exhibit 4.1(a) to the Form 8-K of The Nielsen Company B.V. filed on January 28, 2009 (File No. 333-142546)) | |
| 4.6(b) | First Supplemental Indenture, dated as of February 13, 2009, among AGB Nielsen Media Research B.V., an affiliate of Nielsen Finance LLC and Nielsen Finance Co., and Law Debenture Trust Company of New York, as Trustee, for the 11.625% Senior Notes due 2014 (incorporated herein by reference to Exhibit 4.9(a) to the quarterly report on Form 10-Q of The Nielsen Company B.V. for the fiscal quarter ended March 31, 2009 (File No. 333-142546)) | |
| 4.6(v) | Second Supplemental Indenture, dated as of May 21, 2009, among The Cambridge Group, Inc., an affiliate of Nielsen Finance LLC and Nielsen Finance Co. and Law Debenture Trust Company of New York, as Trustee for U.S. Dollar denominated 11.625% Senior Notes due 2014 (incorporated herein by reference to Exhibit 4.9(b) to the quarterly report on Form 10-Q of The Nielsen Company B.V. for the fiscal quarter ended June 30, 2009 (File No. 333-142546)) | |
| 4.6(d) | Third Supplemental Indenture, dated as of August 19, 2009, among ACNielsen eRatings.com, an affiliate of Nielsen Finance LLC, and Nielsen Finance Co., and Law Debenture Trust Company of New York, as trustee for the 11.625% Senior Notes due 2014 (incorporated herein by reference to Exhibit 4.9(c) to the quarterly report on Form 10-Q of The Nielsen Company B.V. for the fiscal quarter ended September 30, 2009 (File No. 333-142546)) | |
II-10
Table of Contents
| Exhibit No. |
Description | |
| 4.7(a) | Indenture, dated as of May 1, 2009, among Nielsen Finance LLC and Nielsen Finance Co. and Law Debenture Trust Company of New York, as Trustee for the 11 1/2% Senior Notes due 2016 (incorporated herein by reference to Exhibit 4.1(a) to the current report on Form 8-K of The Nielsen Company B.V. filed on May 1, 2009 (File No. 333-142546)) | |
| 4.7(b) | First Supplemental Indenture, dated as of May 21, 2009, among The Cambridge Group, Inc, an affiliate of Nielsen Finance LLC and Nielsen Finance Co. and Law Debenture Trust Company of New York, as Trustee for the 11 1/2% Senior Notes due 2016 (incorporated herein by reference to Exhibit 4.10(a) to the quarterly report on Form 10-Q of The Nielsen Company B.V. for the fiscal quarter ended June 30, 2009, incorporated herein by reference (File No. 333-142546)) | |
| 4.7(c) | Second Supplemental Indenture, dated as of August 19, 2009, among ACNielsenRatings.com, an affiliate of Nielsen Finance LLC, and Nielsen Finance Co., and Law Debenture Trust Company of New York, as trustee for the 11 1/2% Senior Notes due 2016 (incorporated herein by reference to Exhibit 4.10(b) to the quarterly report on Form 10-Q of The Nielsen Company B.V. for the fiscal quarter ended September 30, 2009, incorporated herein by reference (File No. 333-142546)) | |
| 5.1 | Form of Opinion of Clifford Chance LLP | |
| 10.1** | Form of Amended and Restated Shareholders’ Agreement regarding Nielsen Holdings N.V., among AlpInvest, Blackstone, Carlyle, Hellman & Friedman, KKR, Thomas H. Lee Partners, Valcon Acquisition Holding (Luxembourg) S.à r.l., Nielsen Holdings N.V., Valcon Acquisition B.V. and The Nielsen Company B.V. | |
| 10.2 | Advisory Agreement, dated as of July 31, 2006, by and among ACN Holdings Inc. and Valcon Acquisition B.V. (incorporated herein by reference to Exhibit 10.3 to the Registration Statement on Form S-4 of The Nielsen Company B.V. filed on May 2, 2007 (File No. 333-142546)) | |
| 10.3 | Advisory Agreement, dated as of July 31, 2006, by and among VNU Inc. and Valcon Acquisition B.V. (incorporated herein by reference to Exhibit 10.4 to the Registration Statement on Form S-4 of The Nielsen Company B.V. filed on May 2, 2007 (File No. 333-142546)) | |
| 10.4(a) | Employment Agreement, dated as of August 22, 2006, by and among David L. Calhoun, Valcon Acquisition Holding (Luxembourg) S.à r.l. and VNU, Inc. (incorporated herein by reference to Exhibit 10.5(a) to the Registration Statement on Form S-4 of The Nielsen Company B.V. filed on May 2, 2007 (File No. 333-142546)) | |
| 10.4(b) | Side Letter to the Employment Agreement of David L. Calhoun, dated as of August 22, 2006 (incorporated herein by reference to Exhibit 10.5(b) to the Registration Statement on Form S-4 of The Nielsen Company B.V. filed on May 2, 2007 (File No. 333-142546)) | |
| 10.4(c) | Employment Agreement, as amended and restated, dated as of December 15, 2008, by and among David L. Calhoun, Valcon Acquisition Holding (Luxembourg) S.à r.l. and TNC (US) Holdings, Inc. (incorporated herein by reference to Exhibit 10.5(c) to the Annual Report on Form 10-K of The Nielsen Company B.V. for the year ended December 31, 2008 (File No. 333-142546)) | |
| 10.5 | Employment Arrangement, dated December 4, 2006, between VNU Group B.V. and Susan D. Whiting (incorporated herein by reference to Exhibit 10.6 to Amendment No. 1 to the Registration Statement on Form S-4 of The Nielsen Company B.V. filed on June 21, 2007 (File No. 333-142546)) | |
| 10.6(a) | Form of Severance Agreement (incorporated herein by reference to Exhibit 10.10(b) to Amendment No. 1 to the Registration Statement on Form S-4 of The Nielsen Company B.V. filed on June 21, 2007 (File No. 333-142546)) | |
II-11
Table of Contents
| Exhibit No. |
Description | |
| 10.6(b) | Severance Agreement, dated as of February 2, 2007, by and between VNU Group B.V., VNU, Inc. and Susan D. Whiting (incorporated herein by reference to Exhibit 10.10(c) to Amendment No. 1 to the Registration Statement on Form S-4 of The Nielsen Company B.V. filed on June 21, 2007 (File No. 333-142546)) | |
| 10.6(c) | Restricted Stock Unit Award Agreement, dated as of January 15, 2007, between Valcon Acquisition Holding B.V. and Susan D. Whiting (incorporated herein by reference to Exhibit 10.10(d) to Amendment No. 1 to the Registration Statement on Form S-4 of The Nielsen Company B.V. filed on June 21, 2007 (File No. 333-142546)) | |
| 10.6(d) | Stock Option Agreement, dated as of February 2, 2007, between Valcon Acquisition Holding B.V. and Susan D. Whiting (incorporated herein by reference to Exhibit 10.10(e) to Amendment No. 1 to the Registration Statement on Form S-4 of The Nielsen Company B.V. filed on June 21, 2007 (File No. 333- 142546)) | |
| 10.6(e) | Sale Participation Agreement, dated as of February 2, 2007, between Valcon Acquisition Holding B.V. and Susan D. Whiting (incorporated herein by reference to Exhibit 10.10(f) to Amendment No. 1 to the Registration Statement on Form S-4 of The Nielsen Company B.V. filed on June 21, 2007 (File No. 333- 142546)) | |
| 10.6(f) | Management Stockholder’s Agreement, dated as of February 2, 2007, between Valcon Acquisition Holding B.V., Valcon Acquisition Holding (Luxembourg) S.à r.l. and Susan D. Whiting (incorporated herein by reference to Exhibit 10.10(g) to Amendment No. 1 to the Registration Statement on Form S-4 of The Nielsen Company B.V. filed on June 21, 2007 (File No. 333-142546)) | |
| 10.6(g) | Restricted Stock Unit Award Agreement, dated as of June 19, 2009, between Valcon Acquisition Holding B.V. and Mitchell Habib (incorporated herein by reference to Exhibit 10.10(h) to the quarterly report on Form 10-Q of The Nielsen Company B.V. for the fiscal quarter ended June 30, 2009 (File No. 333-142546)) | |
| 10.7(a) | VNU Excess Plan, as amended and restated, effective April 1, 2002 (incorporated herein by reference to Exhibit 10.12(a) to Amendment No. 1 to the Company’s Registration Statement on Form S-4 of The Nielsen Company B.V. filed on June 21, 2007 (File No. 333-142546)) | |
| 10.7(b) | Amendment to the VNU Excess Plan, effective August 31, 2006 (incorporated herein by reference to Exhibit 10.12(b) to Amendment No. 1 to the Registration Statement on Form S-4 of The Nielsen Company B.V. filed on June 21, 2007 (File No. 333-142546)) | |
| 10.7(c) | Second Amendment to the VNU Excess Plan, effective January 23, 2007 (incorporated herein by reference to Exhibit 10.12(c) to Amendment No. 1 to the Registration Statement on Form S-4 of The Nielsen Company B.V. filed on June 21, 2007 (File No. 333-142546)) | |
| 10.8(a) | VNU Deferred Compensation Plan, dated April 1, 2003 (incorporated herein by reference to Exhibit 10.13(a) to Amendment No. 1 to the Registration Statement on Form S-4 of The Nielsen Company B.V. filed on June 21, 2007 (File No. 333-142546)) | |
| 10.8(b) | Amendment to VNU, ACNielsen Corporation and VNU USA, Inc. Deferred Compensation Plan, dated May 10, 2006 (incorporated herein by reference to Exhibit 10.13(b) to Amendment No. 1 to the Registration Statement on Form S-4 of The Nielsen Company B.V. filed on June 21, 2007 (File No. 333-142546)) | |
| 10.8(c) | The Nielsen Company Deferred Compensation Plan, as amended and restated, effective October 28, 2008 (incorporated herein by reference to Exhibit 10.13(c) to the quarterly report on Form 10-Q of The Nielsen Company B.V. for the fiscal quarter ended September 30, 2008, incorporated herein by reference (File No. 333-142546)) | |
II-12
Table of Contents
| Exhibit No. |
Description | |
| 10.9(a) | 2006 Stock Acquisition and Option Plan for Key Employees of Valcon Acquisition Holding B.V. and its Subsidiaries, as amended and restated, effective February 8, 2008 (incorporated herein by reference to Exhibit 10.14 to the Form 10-K of The Nielsen Company B.V. filed on March 31, 2008 (File No. 333-142546)) | |
| 10.9(b) | 2006 Stock Acquisition and Option Plan for Key Employees of Valcon Acquisition Holding B.V. and its Subsidiaries, as amended and restated, effective February 25, 2010 (incorporated herein by reference to Exhibit 10.14(b) to the quarterly report on Form 10-Q of The Nielsen Company B.V. for the fiscal quarter ended March 31, 2010 (File No. 333-142546)) | |
| 10.10 | Form of Management Stockholder’s Agreement (incorporated herein by reference to Exhibit 10.15 to the Form 10-K of The Nielsen Company B.V. filed on March 31, 2008 (File No. 333-142546)) | |
| 10.11 | Form of Sale Participation Agreement (incorporated herein by reference to Exhibit 10.16 to the Form 10-K of The Nielsen Company B.V. filed on March 31, 2008 (File No. 333-142546)) | |
| 10.12 | Form of Stock Option Agreement (incorporated herein by reference to Exhibit 10.17 to the Form 10-K of The Nielsen Company B.V. filed on March 31, 2008 (File No. 333-142546)) | |
| 10.13 | Form of Offer Letter, dated October 24, 2006, by and between VNU and James W. Cuminale (incorporated herein by reference to Exhibit 10.18 to the Form 10-K of The Nielsen Company B.V. filed on March 31, 2008 (File No. 333-142546)) | |
| 10.14 | Form of Offer Letter, dated February 20, 2007, by and between The Nielsen Company B.V. and Brian J. West (incorporated herein by reference to Exhibit 10.19 to the Form 10-K of The Nielsen Company B.V. filed on March 31, 2008 (File No. 333-142546)) | |
| 10.15 | Form of Offer Letter, dated March 22, 2007, by and between The Nielsen Company B.V. and Mitchell J. Habib (incorporated herein by reference to Exhibit 10.20 to the Form 10-K of The Nielsen Company B.V. filed on March 31, 2008 (File No. 333-142546)) | |
| 10.16(a)† | Amended and Restated Master Services Agreement, effective as of October 1, 2007, by and between Tata America International Corporation & Tata Consultancy Services Limited and ACNielsen (US), Inc. | |
| 10.16(b)† | Amendment Number 1 to the Amended and Restated Master Services Agreement, effective as of March 31, 2008, by and between Tata America International Corporation, Tata Consultancy Services Limited and ACNielsen (US), Inc. | |
| 10.16(c) | Amendment Number 2 to the Amended and Restated Master Services Agreement, effective as of October 31, 2007, by and between Tata America International Corporation, Tata Consultancy Services Limited and ACNielsen (US), Inc. | |
| 10.16(d)† | Amendment Number 3 to the Amended and Restated Master Services Agreement, effective as of May 11, 2009, by and between Tata America International Corporation, Tata Consultancy Services Limited and ACNielsen (US), Inc. | |
| 10.17(a) | Severance Agreement, dated as of June 4, 2007, by and between The Nielsen Company B.V., The Nielsen Company (US), Inc. and Itzhak Fisher (incorporated herein by reference to Exhibit 10.22(a) to Form 10-K of The Nielsen Company B.V. filed on March 27, 2009 (File No. 333-142546)) | |
| 10.17(b) | Stock Option Agreement, dated as of June 4, 2007, between Valcon Acquisition Holding B.V. and Pereg Holdings LLC (incorporated herein by reference to Exhibit 10.22(b) to Form 10-K of The Nielsen Company B.V. filed on March 27, 2009 (File No. 333-142546)) | |
II-13
Table of Contents
| Exhibit No. |
Description | |
| 10.17(c) | Rollover Stock Option Agreement, dated as of June 4, 2007, between Valcon Acquisition Holding B.V. and Pereg Holdings LLC (incorporated herein by reference to Exhibit 10.22(c) to Form 10-K of The Nielsen Company B.V. filed on March 27, 2009 (File No. 333-142546)) | |
| 10.17(d) | Sale Participation Agreement, dated as of June 4, 2007, Valcon Acquisition Holding B.V., Pereg Holdings LLC and Itzhak Fisher (incorporated herein by reference to Exhibit 10.22(d) to Form 10-K of The Nielsen Company B.V. filed on March 27, 2009 (File No. 333-142546)) | |
| 10.17(e) | Management Stockholder’s Agreement, dated as of June 4, 2007, between Valcon Acquisition Holding B.V., Valcon Acquisition Holding (Luxembourg) S.à r.l, Pereg Holdings LLC and Itzhak Fisher (incorporated herein by reference to Exhibit 10.22(e) to Form 10-K of The Nielsen Company B.V. filed on March 27, 2009 (File No. 333-142546)) | |
| 10.18 | Form of Offer Letter, dated as of February 27, 2009, by and between The Nielsen Company B.V. and Itzhak Fisher (incorporated herein by reference to Exhibit 10.23 to Form 10-K of The Nielsen Company B.V. filed on March 27, 2009 (File No. 333-142546)) | |
| 10.19(a) | Form of Centerview Stock Option Agreement (incorporated herein by reference to Exhibit 10.22(f) to the quarterly report on Form 10-Q of The Nielsen Company B.V. for the fiscal quarter ended June 30, 2009, incorporated herein by reference (File No. 333-142546)) | |
| 10.19(b) | Form of Stock Option Agreement (incorporated herein by reference to Exhibit 10.24(b) to the quarterly report on Form 10-Q of The Nielsen Company B.V. for the fiscal quarter ended March 31, 2010 (File No. 333-142546)) | |
| 10.20 |
Form of Offer Letter, dated May 8, 2007, by and between The Nielsen Company B.V. and Roberto Llamas | |
| 10.21 | Investment Agreement regarding Valcon Acquisition Holding (Luxembourg) S.á r.l., made as of November 6, 2006, among each of the AlpInvest Funds, each of the Blackstone Funds, each of the Carlyle Funds, each of the Hellman & Friedman Funds, each of the KKR Funds, each of the Thomas H. Lee Funds (all as listed on Schedule 1 thereto), Valcon Acquisition Holding (Luxembourg) S.A.R.L. and Centerview Partners Holdings L.L.C. (incorporated herein by reference to Exhibit 10.2 to the Registration Statement on Form S-4 of The Nielsen Company B.V. filed on May 2, 2007 (File No. 333-142546)) | |
| 10.22** | Form of Amended and Restated Investment Agreement regarding Valcon Acquisition Holding (Luxembourg) S.á r.l., among each of the AlpInvest Funds, each of the Blackstone Funds, each of the Carlyle Funds, each of the Hellman & Friedman Funds, each of the KKR Funds, each of the Thomas H. Lee Funds (all as listed on Schedule 1 thereto), Valcon Acquisition Holding (Luxembourg) S.á r.l. and Centerview Partners Holdings L.L.C. | |
| 10.23 | Form of Termination Protection Agreement (incorporated herein by reference to Exhibit 10.11 to Amendment No. 1 to the Registration Statement on Form S-4 of The Nielsen Company B.V. filed on June 21, 2007 (File No. 333-142546)) | |
| 10.24 | Nielsen Holdings 2010 Stock Incentive Plan for Nielsen Holdings B.V. and its Subsidiaries | |
| 10.25 | Nielsen Holdings Executive Annual Incentive Plan for Nielsen Holdings B.V. and its Subsidiaries | |
| 10.26 | Form of Stock Option Agreement | |
| 10.27 | Form of Restricted Stock Unit Award Agreement | |
II-14
Table of Contents
| Exhibit No. |
Description | |
| 10.28** | Form of Registration Rights Agreement among Nielsen Holdings N.V., Valcon Acquisition Holding (Luxembourg) S.à r.l., AlpInvest Partners CS Investments 2006 C.V., Blackstone Capital Partners (Cayman) V L.P., Carlyle Partners IV Cayman, L.P., Hellman & Friedman Capital Partners V (Cayman), L.P., KKR VNU (Millennium) Limited, THL Fund VI Alternative Corp. and Centerview Partners Holdings L.L.C. | |
| 21.1 | Nielsen Holdings B.V. Active Subsidiaries | |
| 23.1* | Consent of Ernst & Young LLP, an Independent Registered Public Accounting Firm | |
| 23.2(a) | Consent of David L. Calhoun to be named as a director nominee | |
| 23.2(b) | Consent of Richard J. Bressler to be named as a director nominee | |
| 23.2(c) | Consent of Simon E. Brown to be named as a director nominee | |
| 23.2(d) | Consent of Gerald S. Hobbs to be named as a director nominee | |
| 23.2(e) | Consent of James M. Kilts to be named as a director nominee | |
| 23.2(f) | Consent of Iain Leigh to be named as a director nominee | |
| 23.2(g) | Consent of Eliot P.S. Merrill to be named as a director nominee | |
| 23.2(h) | Consent of Robert Pozen to be named as a director nominee | |
| 23.2(i) | Consent of Robert Reid to be named as a director nominee | |
| 23.2(j)* | Consent of Javier G. Teruel to be named as a director nominee | |
| 23.3 | Consent of Clifford Chance LLP (included in Exhibit 5.1) | |
| 24.1 | Powers of Attorney of the Directors and Officers of the Registrant (included on signature pages) | |
| * | Filed herewith. |
| ** | To be filed by amendment. |
| † | Certain portions have been omitted in accordance with a request for confidential treatment that the Company has submitted to the SEC. Omitted information has been filed separately with the SEC. |
II-15