Attached files
| file | filename |
|---|---|
| EX-5.1 - EXHIBIT 5.1 - ATLANTIC POWER CORP | a2199864zex-5_1.htm |
| EX-23.6 - EXHIBIT 23.6 - ATLANTIC POWER CORP | a2199864zex-23_6.htm |
| EX-23.3 - EXHIBIT 23.3 - ATLANTIC POWER CORP | a2199864zex-23_3.htm |
| EX-23.4 - EXHIBIT 23.4 - ATLANTIC POWER CORP | a2199864zex-23_4.htm |
| EX-23.5 - EXHIBIT 23.5 - ATLANTIC POWER CORP | a2199864zex-23_5.htm |
| EX-23.2 - EXHIBIT 23.2 - ATLANTIC POWER CORP | a2199864zex-23_2.htm |
Use these links to rapidly review the document
TABLE OF CONTENTS
Atlantic Power Corporation Index to Consolidated Financial Statements
As filed with the Securities and Exchange Commission on August 13, 2010
Registration No. 333-
UNITED STATES
SECURITIES AND EXCHANGE COMMISSION
WASHINGTON, D.C. 20549
FORM S-1
REGISTRATION STATEMENT UNDER THE SECURITIES ACT OF 1933
ATLANTIC POWER CORPORATION
(Exact Name of Registrant as Specified in Its Charter)
| British Columbia, Canada (State or Other Jurisdiction of Incorporation or Organization) |
4900 (Primary Standard Industrial Classification Code Number) |
55-0886410 (I.R.S. Employer Identification Number) |
200 Clarendon St., Floor 25
Boston, Massachusetts 02116
(617) 977-2400
(Address, Including Zip Code, and Telephone Number, Including
Area Code, of Registrant's Principal Executive Offices)
Barry E. Welch
President and Chief Executive Officer
Atlantic Power Corporation
200 Clarendon St., Floor 25
Boston, Massachusetts 02116
(617) 977-2400
(Name, Address, Including Zip Code, and Telephone Number, Including Area Code, of Agent For Service)
| Copies to: | ||
| Laura Hodges Taylor, Esq. Yoel Kranz, Esq. Goodwin Procter LLP Exchange Place Boston, Massachusetts 02109 (617) 570-1000 |
Christopher J. Cummings, Esq. Shearman & Sterling LLP Commerce Court West, Suite 4405 Toronto, Ontario Canada M5L 1E8 (416) 360-8484 |
|
Approximate date of commencement of proposed sale to the public: As soon as practicable after this Registration Statement becomes effective.
If any of the securities being registered on this Form are to be offered on a delayed or continuous basis pursuant to Rule 415 under the Securities Act of 1933, check the following box: o
If this Form is filed to register additional securities for an offering pursuant to Rule 462(b) under the Securities Act, check the following box and list the Securities Act registration statement number of the earlier effective registration statement for the same offering. o
If this Form is a post-effective amendment filed pursuant to Rule 462(c) under the Securities Act, check the following box and list the Securities Act registration statement number of the earlier effective registration statement for the same offering. o
If this Form is a post-effective amendment filed pursuant to Rule 462(d) under the Securities Act, check the following box and list the Securities Act registration statement number of the earlier effective registration statement for the same offering. o
Indicate by check mark whether the registrant is a large accelerated filer, an accelerated filer, a non-accelerated filer, or a smaller reporting company. See the definition of "larger accelerated filer," "accelerated filer" and "smaller reporting company" in Rule 12b-2 of the Exchange Act. (Check one):
| Large accelerated filer o | Accelerated filer o | Non-accelerated filer ý (Do not check if a smaller reporting company) |
Smaller reporting company o |
CALCULATION OF REGISTRATION FEE
|
||||
| Title of Securities to be Registered |
Proposed Maximum Aggregate Offering Price(1)(2) |
Amount of Registration Fee |
||
|---|---|---|---|---|
Common Shares, no par value |
$69,000,000.00 | $4,919.70 | ||
|
||||
- (1)
- Estimated
solely for the purpose of calculating the registration fee pursuant to Rule 457(o) under the Securities Act of 1933, as amended.
- (2)
- Includes the offering price of the common shares that may be purchased by the underwriters pursuant to their option to purchase additional common shares.
The registrant hereby amends this registration statement on such date or dates as may be necessary to delay its effective date until the registrant shall file a further amendment which specifically states that this registration statement shall thereafter become effective in accordance with Section 8(a) of the Securities Act of 1933, as amended, or until this registration statement shall become effective on such date as the Securities and Exchange Commission, acting pursuant to said Section 8(a), may determine.
The information in this prospectus is not complete and may be changed. We may not sell these securities until the registration statement filed with the Securities and Exchange Commission is effective. This preliminary prospectus is not an offer to sell these securities and we are not soliciting offers to buy these securities in any jurisdiction where the offer or sale is not permitted.
Subject to Completion
| |
|
|
|---|---|---|
| PRELIMINARY PROSPECTUS | August 13, 2010 |
Shares

Common Shares
We are offering common shares, no par value per share.
Our common shares are listed on the New York Stock Exchange under the symbol "AT" and on the Toronto Stock Exchange under the symbol "ATP." On August 12, 2010, the last reported sale price of our common shares on the New York Stock Exchange and the Toronto Stock Exchange was $12.69 and Cdn$13.25, respectively, per share.
Investing in our common shares involves a high degree of risk. Before buying any shares you should carefully read the discussion of material risks of investing in our common shares under the heading "Risk Factors" beginning on page 10 of this prospectus.
Neither the Securities and Exchange Commission nor any state securities commission has approved or disapproved of these securities or determined if this prospectus is truthful or complete. Any representation to the contrary is a criminal offense.
|
||||
| |
Per Share |
Total |
||
|---|---|---|---|---|
Public offering price |
$ | $ | ||
Underwriting discounts and commissions |
$ | $ | ||
Proceeds, before expenses, to us |
$ | $ | ||
|
||||
The underwriters may also purchase up to an additional common shares from us at the public offering price, less the underwriting discounts and commissions payable by us to cover over-allotments, if any, within 30 days from the date of this prospectus.
The underwriters are offering the common shares as set forth under "Underwriting." Delivery of the common shares will be made on or about , 2010.
Sole Book-Running Manager
UBS Investment Bank
The date of this prospectus is , 2010
You should rely only on information contained in this document or to which we have referred you. We have not, and our underwriters have not, authorized anyone to provide any information or to make any representations other than those contained in this prospectus or in any free writing prospectuses we have prepared. If anyone provides you with different or inconsistent information, you should not rely on it. We take no responsibility for, and can provide no assurance as to the reliability of, any other information that others may give you. We are not, and the underwriters are not, making an offer to sell the securities in any jurisdiction where the offer or sale is not permitted. This document may only be used where it is legal to sell these securities. The information contained in this prospectus may only be accurate as of the date on the cover of this prospectus. Our business, financial condition and results of operations may have changed since that date.
As used in this prospectus, the terms "Atlantic Power," the "Company," "we," "our," and "us" refer to Atlantic Power Corporation, together with those entities owned or controlled by Atlantic Power Corporation, unless the context indicates otherwise. All references to "Cdn$" and "Canadian dollars" are to the lawful currency of Canada and references to "$," "US$" and "U.S. dollars" are to the lawful currency of the United States. All dollar amounts herein are in U.S. dollars, unless otherwise indicated. This prospectus includes our trademarks and other trade names identified herein. All other trademarks and trade names appearing in this prospectus are the property of their respective holders.
i
The following summary may not contain all the information that may be important to you or that you should consider before deciding to purchase any common shares and is qualified in its entirety by the more detailed information appearing elsewhere in this prospectus. You should read the entire prospectus, especially the risks set forth under the heading "Risk Factors" in this prospectus, as well as the financial and other information included herein, before making an investment decision.
Atlantic Power Corporation is an independent power producer, with power projects located in major markets in the United States. Our current portfolio consists of interests in 12 operational power generation projects across eight states, one wind project under construction, a 500 kilovolt 84-mile electric transmission line located in California, and six development projects in five states. Our power generation projects have an aggregate gross electric generation capacity of approximately 1,823 megawatts (or "MW") in which our ownership interest is approximately 808 MW.
The following map shows the location of our projects, including joint venture interests, across the United States:
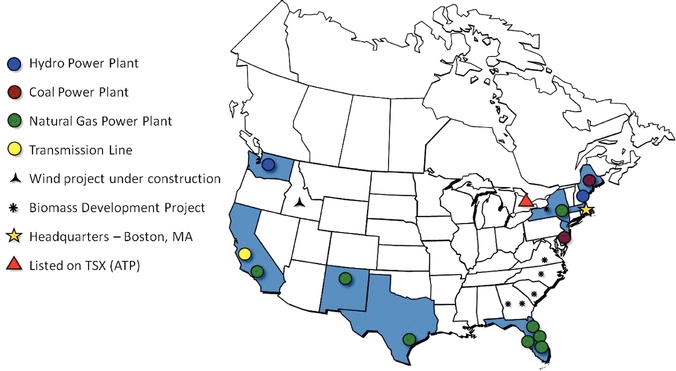
We sell the capacity and power from our power generation projects under power purchase agreements (or "PPAs") with a variety of utilities and other parties. Under the PPAs, which have expiration dates ranging from 2010 to 2037, we receive payments for electric energy sold to our customers (known as energy payments), in addition to payments for electric generation capacity (known as capacity payments). We also sell steam and/or other forms of thermal energy from a number of our projects under energy sales agreements to industrial purchasers ("steam sales agreements"). The transmission system rights (or "TSRs") we own in our power transmission project entitle us to payments indirectly from the utilities that make use of the transmission line.
Our power generation projects generally operate pursuant to long-term supply agreements, typically accompanied by fuel transportation arrangements. In most cases, the fuel supply and
1
transportation arrangements correspond to the term of the relevant PPAs and most of the PPAs and steam sales agreements provide for the pass-through or indexing of fuel costs to our customers.
We partner with recognized leaders in the independent power business to operate and maintain our projects, including Caithness Energy, LLC ("Caithness"), Cogentrix Energy, Inc. ("Cogentrix") and the Western Area Power Administration ("Western"). Under these operation, maintenance and management agreements, the operator is typically responsible for operations, maintenance and repair services.
Atlantic Power Corporation is organized under the laws of the Province of British Columbia. Our registered office is located at 355 Burrard Street, Suite 1900, Vancouver, British Columbia, Canada V6C 2G8 and our headquarters are located at 200 Clarendon Street, Floor 25, Boston, Massachusetts, USA 02116. Our telephone number is (617) 977-2400. Our website address is www.atlanticpower.com. Information contained on, or otherwise accessible through, our website is not incorporated into, and does not constitute a part of, this prospectus or any other report or documents we file with or furnish to the SEC.
We completed our initial public offering on the Toronto Stock Exchange, or the TSX, in November 2004. At the time of the initial public offering, our publicly-traded security was an "income participating security," or "IPS," each of which was comprised of one common share and Cdn$5.767 principal value of 11% subordinated notes due 2016. On November 27, 2009, our shareholders approved a conversion from the IPS structure to a traditional common share structure. Each IPS has been exchanged for one new common share and each old common share that did not form a part of an IPS was exchanged for approximately 0.44 of a new common share. Our shares trade on the TSX under the symbol "ATP" and began trading on the New York Stock Exchange, or the NYSE, under the symbol "AT" on July 23, 2010.
We believe we distinguish ourselves from other independent power producers through the following competitive strengths:
- •
- Diversified Projects. Our power generation projects have an aggregate gross electric generation capacity of approximately 1,823 MW, and our net ownership interest in the electric generation capacity of these projects is approximately 808 MW. Our power generation projects are diversified by geographic location, electricity and steam customers, and project operators. These projects are generally located in the deregulated and more liquid electricity markets of New England, New York, Mid-Atlantic, California and Texas, or are located in regions of relatively high electricity demand growth such as Florida and New Mexico.
- •
- Strong Customer
Base. Our customers are generally large utilities, and other parties with investment-grade credit ratings. The largest customers of our
power generation projects are Progress Energy Florida, Inc. ("PEF"), Tampa Electric Company ("TECO"), and Atlantic City Electric ("ACE"), which purchase approximately 40%, 15% and 11%,
respectively, of the net electric generation capacity of our projects. No other electric customer purchases more than 7% of the net electric generation capacity of our power generation projects.
- •
- Leading Third-Party Managers. Our power generation projects rely on a number of different operators for their operation, which are generally recognized leaders in the independent power business. Affiliates of Caithness, Cogentrix and Babcock and Wilcox Power Generation
Our power transmission project, known as the Path 15 project, is an 84-mile, 500-kilovolt transmission line built in order to alleviate north-south transmission congestion in California. It is a traditional rate-base asset whose revenues are regulated by the Federal Energy Regulatory Commission ("FERC") and is operated by Western, a U.S. Federal power agency.
2
- •
- Stability of Project Cash Flow. Each of our power generation projects has been in operation for over ten years. Cash flows from each project are generally supported by energy sales contracts with investment-grade utilities and other sophisticated counterparties. We believe that each project's combination of PPA(s), fuel supply agreement(s) and/or commodity hedges help stabilize operating margins as fuel prices fluctuate.
Group, Inc. operate projects representing approximately 49%, 21% and 9%, respectively, of the net electric generation capacity of our power generation projects. No other operator is responsible for the operation of projects representing more than 8% of the net electric generation capacity of our power generation projects.
Our Objectives and Business Strategies
Our objectives include maintaining the stability and sustainability of dividends to shareholders and to maximize the value of our company. In order to achieve these objectives, we intend to focus on enhancing the operating and financial performance of the projects and on pursuing additional acquisitions primarily in the electric power industry in the U.S. and Canada.
Organic Growth
We intend to enhance the operation and financial performance of our projects through:
- •
- optimization of commercial arrangements such as PPAs, fuel supply and transportation contracts, steam sales agreements,
and operations and maintenance agreements;
- •
- achievement of improved operating efficiencies;
- •
- upgrade or enhancement of existing equipment or plant configurations; and
- •
- expansion of existing projects.
Successfully extending PPAs and fuel agreements may facilitate refinancings that provide capital to fund growth opportunities.
Extending PPAs Following Their Expiration
PPAs in our portfolio have expiration dates ranging from 2010 to 2037. In each case, we plan for expirations by evaluating various options in the market for maximizing project cash flows. New arrangements may involve responses to utility solicitations for capacity and energy, direct negotiations with the original purchasing utility for PPA extensions, arrangements with creditworthy energy trading firms for tolling agreements, full service PPAs or the use of derivatives to lock in value. We do not assume that pricing under existing PPAs will necessarily be sustained after PPA expirations, since most original PPAs included capacity payments related to return of and return on original capital invested and counterparties or evolving regional electricity markets may or may not provide similar payments under new or extended PPAs.
Acquisition and Investment Strategy
We believe that new electricity generation projects will be required in the United States and Canada over the next several years as a result of growth in electricity demand, transmission constraints and the retirement of older generation projects due to obsolescence or environmental concerns. There is also a very active secondary market for existing projects. We intend to expand our operations by making accretive acquisitions with a focus on power generation, transmission, distribution and related facilities in the United States and Canada. We may also invest in other forms of energy-related projects, utility projects and infrastructure projects, as well as additional investments in development stage projects or companies where the prospects for creating long-term predictable cash flows are
3
attractive. Since the time of our initial public offering on the TSX in 2004, we have twice acquired the interest of another partner in one of our existing projects and will continue to look for such opportunities.
Our senior management has significant experience in the independent power industry and we believe the experience, reputation and industry relationships of our management team will provide us with enhanced access to future acquisition opportunities.
On July 2, 2010, we acquired a 27.6% equity interest in Idaho Wind Partners 1, LLC ("IWP" or "Idaho Wind") for approximately $40 million. IWP recently commenced construction of a 183 MW wind power project located near Twin Falls, Idaho, which is currently scheduled to be completed in late 2010 or early 2011. IWP has 20-year fixed-price PPAs with Idaho Power Company. Our investment in IWP was funded with cash on hand and a $20 million borrowing under our senior credit facility. Upon completion of construction, we expect Idaho Wind to provide after-tax cash flows to us of $4.5 million to $5.5 million for each full year of operations. Our investment in IWP will be accounted for under the equity method of accounting.
In April 2010, our majority-owned subsidiary, Rollcast Energy, Inc., signed an agreement with two banks to co-arrange project-level debt financing and entered into a construction agreement for a 53.5 MW biomass project, known as Piedmont Green Power, to be located in Barnesville, Georgia. Pursuant to the terms of our investment in Rollcast, we have the option, but not the obligation, to invest directly in biomass power plants under development by Rollcast. We are currently in advanced discussions that we expect will lead to our commitment to invest up to $75 million in the Piedmont Green Power project, representing substantially all of the equity interests in the project. Construction of the project is scheduled to begin in the third quarter of 2010. The Piedmont Green Power project has obtained a 20-year PPA with Georgia Power Company which includes an adjustment related to the cost of biomass fuel for the plant.
Concurrently with this offering, we are offering Cdn$ in aggregate principal amount of our % Series B convertible unsecured subordinated debentures due in a public offering in Canada. The debentures will be convertible into our common shares at the option of the holder at any time prior to the close of business on the earlier of and the business day immediately preceding the date specified by us for redemption of the debentures.
The completion of this offering of common shares is not subject to the completion of the concurrent offering of convertible debentures and the completion of the concurrent offering of convertible debentures is not subject to the completion of this offering. See "Description of Concurrent Offering of Convertible Debentures."
4
The following table outlines our portfolio of power generating and transmission assets in operation and under construction as of August 9, 2010, including our interest in each facility. Management believes the portfolio is well diversified in terms of electricity and steam buyers, fuel type, regulatory jurisdictions and regional power pools, thereby partially mitigating exposure to market, regulatory or environmental conditions specific to any single region.
|
|
||||||||||||||||||||||
|---|---|---|---|---|---|---|---|---|---|---|---|---|---|---|---|---|---|---|---|---|---|---|
| Project Name |
Location (State) |
Type |
Total MW |
Economic Interest(1) |
Accounting Treatment(2) |
Net MW(3) |
Electricity Purchaser |
Power Contract Expiry |
Customer S&P Credit Rating |
|||||||||||||
|
|
||||||||||||||||||||||
Auburndale |
Florida | Natural Gas | 155 | 100.00 | % | C | 155 | Progress Energy Florida | 2013 | BBB+ | ||||||||||||
|
|
||||||||||||||||||||||
Lake |
Florida | Natural Gas | 121 | 100.00 | % | C | 121 | Progress Energy Florida | 2013 | BBB+ | ||||||||||||
|
|
||||||||||||||||||||||
Pasco |
Florida | Natural Gas | 121 | 100.00 | % | C | 121 | Tampa Electric Co. | 2018 | BBB | ||||||||||||
|
|
||||||||||||||||||||||
Chambers |
New Jersey | Coal | 262 | 40.00 | % | E | 89(4) | ACE | 2024 | BBB | ||||||||||||
|
|
||||||||||||||||||||||
|
16 | DuPont | 2024 | A | ||||||||||||||||||
|
|
||||||||||||||||||||||
Path 15 |
California | Transmission | N/A | 100.00 | % | C | N/A | California Utilities via CAISO(5) | N/A | (6) | BBB+ to A(7) | |||||||||||
|
|
||||||||||||||||||||||
Orlando |
Florida | Natural Gas | 129 | 50.00 | % | E | 46 | Progress Energy Florida | 2023 | BBB+ | ||||||||||||
|
|
||||||||||||||||||||||
|
19 | Reedy Creek Improvement District | 2013 | (8) | A(9) | |||||||||||||||||
|
|
||||||||||||||||||||||
Selkirk |
New York | Natural Gas | 345 | 17.70% | (10) | E | 14 | Merchant | N/A | N/R | ||||||||||||
|
|
||||||||||||||||||||||
|
47 | Consolidated Edison | 2014 | A- | ||||||||||||||||||
|
|
||||||||||||||||||||||
Gregory |
Texas | Natural Gas | 400 | 17.10 | % | E | 59 | Fortis Energy Marketing and Trading | 2013 | A- | ||||||||||||
|
|
||||||||||||||||||||||
|
9 | Sherwin Alumina | 2020 | NR | ||||||||||||||||||
|
|
||||||||||||||||||||||
Topsham(11) |
Maine | Hydro | 14 | 50.00 | % | E | 7 | Central Maine Power | 2011 | BBB+ | ||||||||||||
|
|
||||||||||||||||||||||
Badger Creek |
California | Natural Gas | 46 | 50.00 | % | E | 23 | Pacific Gas & Electric | 2011 | BBB- | ||||||||||||
|
|
||||||||||||||||||||||
Rumford |
Maine | Coal/Biomass | 85 | 26.40 | % | E | 22 | Rumford Paper Co. | 2010 | N/R | ||||||||||||
|
|
||||||||||||||||||||||
Koma Kulshan |
Washington | Hydro | 13 | 49.80 | % | E | 6 | Puget Sound Energy | 2037 | BBB | ||||||||||||
|
|
||||||||||||||||||||||
Delta-Person |
New Mexico | Natural Gas | 132 | 40.00 | % | E | 53 | PNM | 2020 | BB- | ||||||||||||
|
|
||||||||||||||||||||||
Idaho Wind(12) |
Idaho | Wind | 183 | 27.56 | % | E | 51 | Idaho Power Co. | 2030 | BBB | ||||||||||||
|
|
||||||||||||||||||||||
- (1)
- Except
as otherwise noted, economic interest represents the percentage ownership interest in the project held indirectly by Atlantic Power.
- (2)
- Accounting
Treatment: C—Consolidated; and E—Equity Method of Accounting (for additional details, see Note 2 of
the accompanying consolidated financial statements for the year ended December 31, 2009).
- (3)
- Represents
our interest in each project's electric generation capacity based on our economic interest.
- (4)
- Includes
separate power sales agreement in which the project and ACE share profits on spot sales of energy and capacity not purchased by ACE
under the base PPA.
- (5)
- California
utilities pay TACs to California Independent System Operator ("CAISO"), who then pays owners of TSRs, such as Path 15, in
accordance with its FERC approved annual revenue requirement.
- (6)
- Path 15
is a FERC regulated asset with a FERC-approved regulatory life of 30 years: through 2034.
- (7)
- Largest
payers of fees supporting Path 15's annual revenue requirement are PG&E (BBB+), SoCal Ed (BBB+) and SDG&E (A). CAISO imposes
minimum credit quality requirements for any participants of A or better unless collateral is posted per CAISO imposed schedule.
- (8)
- Upon the expiry of the Reedy Creek PPA, the associated capacity and energy will be sold to PEF.
5
- (9)
- Fitch
rating on Reedy Creek Improvement District bonds.
- (10)
- Represents
our residual interest in the project after all priority distributions are paid, which is estimated to occur in 2012.
- (11)
- We
own our interest in this project as a lessor.
- (12)
- Project currently under construction and is expected to be completed in late 2010 or early 2011.
6
Issuer |
Atlantic Power Corporation, a British Columbia corporation. | |
Common Shares to Be Offered by Us |
shares. |
|
Common Shares to Cover Over-Allotments |
We have granted the underwriters an option to purchase up to additional common shares to cover over-allotments. |
|
Common Shares to Be Outstanding after this Offering |
Shares (or shares if the underwriters exercise their over-allotment option in full). |
|
Risk Factors |
Prospective purchasers should carefully review and evaluate certain risk factors relating to an investment in the common shares, including, but not limited to trading market for common shares and discretion in the use of proceeds. See "Risk Factors." |
|
United States Federal Income Tax Considerations |
You should consult your tax advisor with respect to the U.S. federal income tax consequences of owning the common shares in light of your own particular situation and with respect to any tax consequences arising under the laws of any state, local, foreign or other taxing jurisdiction. See "Certain United States Federal Income Tax Considerations." |
|
Concurrent Public Offering of Convertible Debentures |
Concurrently with this offering, we are also conducting a separate public offering in Canada of Cdn$ in aggregate principal amount of our convertible unsecured subordinated debentures (plus up to an additional Cdn$ in aggregate principal amount of our convertible debentures that we may issue and sell upon the exercise of the underwriter's option to purchase additional convertible debentures). |
|
|
This offering is not conditioned upon the successful completion of the concurrent offering of convertible debentures and the concurrent offering of convertible debentures is not conditioned upon the successful completion of this offering. See "Description of Concurrent Offering of Convertible Debentures." |
7
Use of Proceeds |
We expect to receive net proceeds from this offering of approximately $ million after deducting the underwriting discount and our estimated expenses (or approximately $ million if the underwriters exercise their option to purchase additional shares in full). We intend to use the net proceeds from this offering, along with the net proceeds we receive from our concurrent offering of convertible debentures, for (i) repayment of approximately $20 million borrowed under our revolving credit facility in June 2010 to partially fund our previously-announced acquisition of a 27.6% equity interest in Idaho Wind Partners 1, LLC, and (ii) to fund a likely investment of up to $75 million in the Piedmont Green Power biomass project in Barnesville, Georgia for substantially all of the equity interest in the project, which is currently in advanced discussions that we expect to lead to a commitment. Any remaining net proceeds will be used to fund additional growth opportunities and for general corporate purposes. |
|
Listing |
Our outstanding common shares are listed on the TSX under the symbol "ATP" and on the New York Stock Exchange under the symbol "AT." |
The number of common shares to be outstanding after this offering is based upon 60,510,070 shares outstanding as of August 13, 2010. The number of common shares to be outstanding after this offering does not include:
- •
- 582,000 shares reserved for issuance in connection with our Long Term Incentive Plan;
- •
- 11,473,000 shares issuable upon conversion, redemption, purchase for cancellation or maturity of our outstanding
convertible debentures; and
- •
- any shares reserved for issuance upon the conversion, redemption, purchase for cancellation or maturity of the convertible debentures being offered by us in the concurrent public offering.
8
Summary Historical Financial Information
The following table presents summary consolidated financial information, which should be read in conjunction with our consolidated financial statements beginning on page F-1 and the related notes thereto, and "Management's Discussion and Analysis of Financial Condition and Results of Operations" beginning on page 33. The annual historical information for each of the years in the three-year period ended December 31, 2009 has been derived from our audited consolidated financial statements included elsewhere in this prospectus. The historical information for the six-month periods ended June 30, 2009 and 2010 have been derived from our unaudited consolidated financial statements included elsewhere in this prospectus.
| |
|
|
|
|
|
Six months ended June 30, |
||||||||||||||||
|---|---|---|---|---|---|---|---|---|---|---|---|---|---|---|---|---|---|---|---|---|---|---|
| |
Year Ended December 31, | |||||||||||||||||||||
| (in thousands of U.S. dollars, except as otherwise stated) |
||||||||||||||||||||||
| 2009 | 2008 | 2007 | 2006(a) | 2005(a) | 2010(a) | 2009(a) | ||||||||||||||||
Project revenue |
$ | 179,517 | $ | 173,812 | $ | 113,257 | $ | 69,374 | $ | 57,711 | $ | 95,125 | $ | 90,304 | ||||||||
Project income |
48,415 | 41,006 | 70,118 | 57,247 | 48,256 | 19,405 | 25,995 | |||||||||||||||
Net (loss) income attributable to Atlantic Power Corporation |
(38,486 | ) | 48,101 | (30,596 | ) | (2,408 | ) | (509 | ) | (4,618 | ) | (6,486 | ) | |||||||||
Basic earnings per share, US$ |
$ |
(0.63 |
) |
$ |
0.78 |
$ |
(0.50 |
) |
$ |
(0.05 |
) |
$ |
(0.01 |
) |
$ |
(0.08 |
) |
$ |
(0.11 |
) |
||
Basic earnings per share, Cdn$ |
$ |
(0.72 |
) |
$ |
0.84 |
$ |
(0.53 |
) |
$ |
(0.06 |
) |
$ |
(0.02 |
) |
$ |
(0.08 |
) |
$ |
(0.13 |
) |
||
Diluted earnings per share, US$ |
$ |
(0.63 |
) |
$ |
0.73 |
$ |
(0.50 |
) |
$ |
(0.05 |
) |
$ |
(0.01 |
) |
$ |
(0.08 |
) |
$ |
(0.11 |
) |
||
Diluted earnings per share, Cdn$ |
$ |
(0.72 |
) |
$ |
0.86 |
$ |
(0.53 |
) |
$ |
(0.06 |
) |
$ |
(0.02 |
) |
$ |
(0.08 |
) |
$ |
(0.13 |
) |
||
Distribution declared per IPS |
$ |
0.51 |
$ |
0.60 |
$ |
0.59 |
$ |
0.57 |
$ |
0.53 |
$ |
— |
$ |
0.29 |
||||||||
Dividend declared per common share |
$ | 0.46 | $ | 0.40 | $ | 0.40 | $ | 0.37 | $ | 0.31 | $ | 0.52 | $ | 0.19 | ||||||||
Total assets |
$ |
869,576 |
$ |
907,995 |
$ |
880,751 |
$ |
965,121 |
$ |
636,138 |
$ |
862,525 |
$ |
873,923 |
||||||||
Total long-term liabilities |
$ |
402,212 |
$ |
654,499 |
$ |
715,923 |
$ |
613,423 |
$ |
475,533 |
$ |
407,413 |
$ |
675,159 |
||||||||
- (a)
- Unaudited
9
Investing in our common shares involves a high degree of risk. In addition to other information contained in this prospectus you should carefully consider the risks described below in evaluating our company and our business before making a decision to invest in our common shares. These risks are not the only ones faced by us. Additional risks not presently known or that we currently deem immaterial could also materially and adversely affect our financial condition, results of operations, business and prospects. The trading price of our common shares could decline due to any of these risks, and you may lose all or part of your investment. This prospectus also contains forward-looking statements that involve risks and uncertainties. Actual results could differ materially from those anticipated in these forward-looking statements as a result of certain factors, including the risks faced by us described below and elsewhere in this prospectus. Please refer to the section entitled "Cautionary Statements Regarding Forward-Looking Statements" in this prospectus.
Risks Related to Our Business and Our Projects
Our revenue may be reduced upon the expiration or termination of our power purchase agreements
Power generated by our projects, in most cases, is sold under PPAs that expire at various times. For example, PPAs at our Rumford, Badger Creek and Topsham projects expire between now and the end of 2011 and represent 52 MWs of our net generating capacity and the PPAs at our Auburndale, Lake and Gregory projects expire by the end of 2013 and represent 335 MWs of our net generating capacity. The table on page 5 contains details about all our projects' PPAs. In addition, these PPAs may be subject to termination in certain circumstances, including default by the project. When a PPA expires or is terminated, it is possible that the price received by the project for power under subsequent arrangements may be reduced significantly. It is possible that subsequent PPAs may not be available at prices that permit the operation of the project on a profitable basis. If this occurs, the affected project may temporarily or permanently cease operations.
Our projects depend on their electricity, thermal energy and transmission services customers
Each of our projects rely on one or more PPAs, steam sales agreements or other agreements with one or more utilities or other customers for a substantial portion of its revenue. The largest customers of our power generation projects, including projects recorded under equity method of accounting, are Progress Energy Florida, Inc. ("PEF"), Tampa Electric Company ("TECO"), and Atlantic City Electric ("ACE"), which purchase approximately 40%, 15% and 11%, respectively, of the net electric generation capacity of our projects. The amount of cash available to pay dividends to shareholders is highly dependent upon customers under such agreements fulfilling their contractual obligations. There is no assurance that these customers will perform their obligations or make required payments.
Certain of our projects are exposed to fluctuations in the price of electricity
Those of our projects with no PPA or PPAs based on spot market pricing will be exposed to fluctuations in the wholesale price of electricity. In addition, should any of the long-term PPAs expire or terminate, the relevant project will be required to either negotiate a new PPA or sell into the electricity wholesale market, in which case the prices for electricity will depend on market conditions at the time.
Our most significant exposure to market power prices is at the Selkirk and Chambers projects. At Selkirk, approximately 23% of the capacity of the facility is not contracted and is sold at market prices or not sold at all if market prices do not support profitable operation of that portion of the facility. At Chambers, our utility customer has the right to sell a portion of the plant's output into the spot power market if it is economical to do so and the Chambers project shares in the profits from these sales.
10
Our projects may not operate as planned
The revenue generated by our power generation projects is dependent, in whole or in part, on the amount of electric energy and steam generated by them. The ability of our projects to generate the required amount of power to be sold to customers under the PPAs is a primary determinant of the amount of cash that will be distributed from the projects to us, and that will in turn be available for dividends paid to our shareholders. There is a risk of equipment failure due to wear and tear, latent defect, design error or operator error, among other things, which could adversely affect revenues and cash flow. To the extent that our projects' equipment requires more frequent and/or longer than forecast down times for maintenance and repair, or suffers disruptions of power generation for other reasons, the amount of cash available for dividends may be adversely affected.
In general, our power generation projects transmit electric power to the transmission grid for purchase under the PPAs through a single step up transformer. As a result, the transformer represents a single point of vulnerability and may exhibit no abnormal behavior in advance of a catastrophic failure that could cause a temporary shutdown of the facility until a spare transformer can be found or a replacement manufactured.
If the reason for a shutdown is outside of the control of the operator, a power generation project may be able to make a force majeure claim for temporary relief of its obligations under the project contracts such as the PPA, fuel supply, steam sales agreement, a project-level debt agreement or otherwise mitigate impacts through business interruption insurance policies. If successful, such a claim may prevent a default or reduce monetary losses under such contracts. However, a force majeure claim may be challenged by the contract counterparty and, to the extent the challenge is successful, the outage may still have a materially adverse effect on the project.
Our projects depend on suppliers under fuel supply agreements and increases in fuel costs may adversely affect the profitability of the projects
Revenues earned by our projects may be affected by the availability, or lack of availability, of a stable supply of fuel at reasonable or predictable prices. To the extent possible, the projects attempt to match fuel cost setting mechanisms in supply agreements to energy payments formulas in the PPA. To the extent that fuel costs are not matched well to PPA energy payments, increases in fuel costs may adversely affect the profitability of the projects.
The amount of energy generated at the projects is highly dependent on suppliers under certain fuel supply agreements fulfilling their contractual obligations. The loss of significant fuel supply agreements or an inability or failure by any supplier to meet its contractual commitments may adversely affect our results.
Upon the expiration or termination of existing fuel supply agreements, we or our project operators will have to renegotiate these agreements or may need to source fuel from other suppliers. Our project operators may not be able to renegotiate these agreements or enter into new agreements on similar terms. Furthermore, there can be no assurance as to availability of the supply or pricing of fuel under new arrangements and it can be very difficult to accurately predict the future prices of fuel. For example, a portion of the required natural gas at our Auburndale project and all of the natural gas required at our Lake project is purchased at market prices, but the projects' PPAs that expire in 2013 do not effectively pass through changes in natural gas prices. We have executed a hedging program to substantially mitigate this risk through 2013.
The amount of energy generated at the projects is dependent upon the availability of natural gas, coal, oil or biomass. The long-term availability of such resources may not remain unchanged.
11
Our projects depend on a favorable regulatory regime
The profitability of our projects is in part dependent upon the continuation of a favorable regulatory climate with respect to the continuing operations and the future growth and development of the independent power industry. Should the regulatory regime in an applicable jurisdiction be modified in a manner which adversely affects the projects, including increases in taxes and permit fees, dividends to shareholders may be adversely affected. The failure to obtain all necessary licenses or permits, including renewals thereof or modifications thereto, may also adversely affect cash available to pay dividends.
Our operations are subject to the provisions of various energy laws and regulations
Generally, in the United States, our projects are subject to regulation by the Federal Energy Regulatory Commission, or "FERC," regarding the terms and conditions of wholesale service and rates, as well as by state agencies regarding PPAs entered into by qualifying facility projects and the siting of the generation facilities. The majority of our generation is sold by qualifying facility projects under PPAs that required approval by state authorities.
In August 2005, the Energy Policy Act of 2005 was enacted, which removed certain regulatory constraints on investment in utility power producers. The Energy Policy Act of 2005 also limited the requirement that electric utilities buy electricity from qualifying facilities to certain markets that lack competitive characteristics, potentially making it more difficult for our current and future projects to negotiate favorable PPAs with these utilities. Finally, the Energy Policy Act of 2005 amended and expanded the reach of the FERC's merger approval authority.
If any project that is a qualifying facility were to lose its status as a qualifying facility, then such project may no longer be entitled to exemption from provisions of the Public Utility Holding Company Act of 2005 or from provisions of the Federal Power Act and state law and regulations. Such project may be able to obtain exempt wholesale generator status to maintain its exemption from the provisions of the Public Utility Holding Company Act of 2005, however our projects may not be able to obtain such exemptions. Loss of qualifying facility status could trigger defaults under covenants to maintain qualifying facility status in the PPAs, steam sales agreements and project-level debt agreements and if not cured within allowed cure periods, could result in termination of agreements, penalties or acceleration of indebtedness under such agreements, plus interest.
Our projects would also have to file with the FERC for market-based rates or file for acceptance for filing of the rates set forth in the applicable PPA, and our projects' rates would then be subject to initial and potentially subsequent reviews by the FERC under the Federal Power Act, which could result in reductions to the rates.
Our projects require licenses, permits and approvals which can be in addition to any required environmental permits. No assurance can be provided that we will be able to obtain, comply with and renew, as required, all necessary licenses, permits and approvals for these facilities. If we cannot comply with and renew as required all applicable licenses, permits and approvals, our business, results of operations and financial condition could be adversely affected.
The Energy Policy Act of 2005 provides incentives for various forms of electric generation technologies, which may subsidize our competitors. In addition, pursuant to the Energy Policy Act of 2005, the FERC selected an electric reliability organization which imposes mandatory reliability rules and standards. Among other things, the FERC's rules implementing these provisions allow such reliability organizations to impose sanctions on generators that violate their new reliability rules.
The introductions of new laws, or other future regulatory developments, may have a material adverse impact on our business, operations or financial condition.
12
Future FERC rate determinations could negatively impact Path 15's cash flows
The stability of Path 15's cash flows will continue to be subject to the risk of the FERC's adjusting the expected formulation of revenues upon its rate review every three years, and a rate review is set to commence in 2011. The cost-of-service methodology currently applied by the FERC is well established and transparent; however, certain inputs in the FERC's determination of rates are subject to its discretion, including in response to protests from interveners in such rate cases, which include return on equity and the recovery of certain extraordinary expenses. Unfavorable decisions on these matters could adversely affect the cash flow, financial position and results of operations of us and Path 15, and could adversely affect our cash available for dividends.
Noncompliance with federal reliability standards may subject us and our projects to penalties
Our operations are subject to the regulations of the North American Electric Reliability Corporation ("NERC"), a self-regulatory organization that is a non-governmental entity which has statutory responsibility to regulate bulk power system users, generation and transmission owners and operators. NERC groups the users, owners, and operators of the bulk power system into 17 categories, known as functional entities—e.g., Generator Owner, Generator Operator, Purchasing-Selling Entity, etc.—according to the tasks they perform. The NERC Compliance Registry lists the entities responsible for complying with the mandatory reliability standards and the FERC, NERC, or a regional reliability organization may assess penalties against any responsible entity found to be in noncompliance. Violations may be discovered through self-certification, compliance audits, spot checking, self-reporting, compliance investigations by NERC (or a regional reliability organization) and the FERC, periodic data submittals, exception reporting, and complaints. NERC and the FERC have assigned a Violation Risk Factor of High, Medium, or Lower to each requirement of the mandatory reliability standards corresponding to the risk to the bulk power system associated with a violation of that requirement. The penalty that might be imposed for violating the requirements of the standards is a function of the Violation Risk Factor. Penalties for the most severe violations can reach as high as $1 million per violation, per day, and our projects could be exposed to these penalties if violations occur.
Our projects are subject to significant environmental and other regulations
Our projects are subject to numerous and significant federal, state and local laws, including statutes, regulations, by-laws, guidelines, policies, directives and other requirements governing or relating to, among other things: air emissions; discharges into water; ash disposal; the storage, handling, use, transportation and distribution of dangerous goods and hazardous, residual and other regulated materials, such as chemicals; the prevention of releases of hazardous materials into the environment; the prevention, presence and remediation of hazardous materials in soil and groundwater, both on and off site; land use and zoning matters; and workers' health and safety matters. As such, the operation of our projects carries an inherent risk of environmental, health and safety liabilities (including potential civil actions, compliance or remediation orders, fines and other penalties), and may result in the projects being involved from time to time in administrative and judicial proceedings relating to such matters.
The Clean Air Act and related regulations and programs of the Environmental Protection Agency extensively regulate the air emissions of sulfur dioxide, nitrogen oxides, mercury and other compounds emitted by power plants. Environmental laws and regulations have generally become more stringent over time, and this trend may continue. In particular, the U.S. Environmental Protection Agency has promulgated regulations under the federal Clean Air Interstate Rule ("CAIR") requiring additional reductions in nitrogen oxides, or "NOX," and sulphur dioxide, or "SO2," emissions, beginning in 2009 and 2010 respectively, and has also promulgated regulations requiring reductions in mercury emissions from coal-fired electric generating units, beginning in 2010 with more substantial reductions in 2018.
13
Moreover, certain of the states in which we operate have promulgated air pollution control regulations which are more stringent than existing and proposed federal regulations.
While CAIR was set aside by a court decision in 2008, that decision allowed the CAIR requirements to remain in place pending further rulemaking by the Environmental Protection Agency. On July 6, 2010, the Environmental Protection Agency proposed to replace CAIR by requiring 31 states and the District of Columbia to curb emissions of sulfur dioxide and nitrogen oxides from power plants through more aggressive state-by-state emissions budgets for nitrogen oxides and sulfur dioxide. Compliance with the proposed rule, which would take effect in 2012, may have a material adverse impact on our business, operations or financial condition.
The Environmental Protection Agency intends to propose new mercury emissions standards for power plants by March 2011 and to have new standards in place by November 2011. Meeting these new standards at our coal-fired facilities may have a material adverse impact on our business, operations or financial condition.
The Resource Conservation and Recovery Act ("RCRA") has historically exempted fossil fuel combustion wastes from hazardous waste regulation. However, in June 2010 the Environmental Protection Agency proposed two alternative sets of regulations governing coal ash. One set of proposed regulations would designate coal ash as "special waste" and bring ash impoundments at coal-fired power plants under federal regulations governing hazardous solid waste under Subtitle C of RCRA. Another set of proposed regulations would regulate coal ash as a non-hazardous solid waste. If the Environmental Protection Agency determines to regulate coal ash as a hazardous waste, our coal-fired facilities may be subject to increased compliance obligations and costs that may have a material adverse impact on our business, operations or financial condition.
Significant expenditures may be required for either capital expenditures or the purchase of allowances under any or all of these programs to keep the projects compliant with environmental laws and regulations. The projects' PPAs do not allow for the pass through of emissions allowance or emission reduction capital expenditure costs, with the exception of Pasco. If it is not economical to make those expenditures it may be necessary to retire or mothball facilities, or restrict or modify our operations to comply with more stringent standards.
Our projects have obtained environmental permits and other approvals that are required for their operations. Compliance with applicable environmental laws, regulations, permits and approvals and material future changes to them could materially impact our businesses. Although we believe the operations of the projects are currently in material compliance with applicable environmental laws, licenses, permits and other authorizations required for the operation of the projects and although there are environmental monitoring and reporting systems in place with respect to all the projects, there is no guarantee that more stringent laws will not be imposed, that there will not be more stringent enforcement of applicable laws or that such systems may not fail, which may result in material expenditures. Failure by the projects to comply with any environmental, health or safety requirements, or increases in the cost of such compliance, including as a result of unanticipated liabilities or expenditures for investigation, assessment, remediation or prevention, could result in additional expense, capital expenditures, restrictions and delays in the projects' activities, the extent of which cannot be predicted.
Our projects are subject to regulation of CO2 and other greenhouse gases (GHGs)
Ongoing public concerns about emissions of CO2 and other GHGs from power plants have resulted in the enactment of, and proposals for, laws and regulations at the federal, state and regional levels, some of which do or could apply to some of our project operations. For example, the multi-state CO2 cap-and-trade program known as the Regional Greenhouse Gas Initiative (RGGI) applies to our fossil fuel facilities in the Northeast region. The RGGI program went into effect on January 1, 2009.
14
CO2 allocations are now a tradeable commodity, currently averaging in the $2.05 to $3.20/ton range. The State of Florida has conducted stakeholder meetings as part of the process of developing GHG emissions regulations, the most recent of which was in January 2009. Discussions indicate favoring a program similar to that of RGGI.
California, New Mexico, Washington and other states are part of the Western Climate Initiative, which is developing a regional cap-and-trade program to reduce GHG emissions in the region to 15% below 2005 levels by 2020.
In 2006, the State of California passed legislation initiating two programs to control/reduce the creation of GHGs. The two laws, more commonly known as AB 32 and SB 1368, are currently in the regulatory rulemaking phase which will involve public comment and negotiations over specific provisions. Development towards the implementation of these programs continues.
Under AB 32 (the California Global Warming Act of 2006) the California Air Resources Board ("CARB") is required to adopt a GHG emissions cap on all major sources (not limited to the electric sector). In order to do so, it must adopt regulations for the mandatory reporting and verification of GHG emissions and to reduce state-wide emissions of GHGs to 1990 levels by 2020. This will most likely require that electric generating facilities reduce their emissions of GHGs or pay for the right to emit by the implementation date of January 1, 2012. The program has yet to be finalized and the decision as to whether allocations will be distributed or auctioned will be determined in the rulemaking process that is currently underway. Discussion to date favors an auction-based allocation program.
SB 1368 added the requirement that the California Energy Commission, in consultation with the California Public Utilities Commission (the "CPUC") and the CARB establish GHG emission performance standards and implement regulations for power purchase agreements that exceed five years entered into prospectively by publicly-owned electric utilities. The legislation directs the California Energy Commission to establish the performance standard as one not exceeding the rate of GHG emitted per megawatt-hour associated with combined-cycle, gas turbine baseload generation, such as our Badger Creek project. Provisions are under consideration in the rulemaking to allow facilities that have higher CO2 emissions to be able to negotiate PPA's for up to a five-year period or sell power to entities not subject to SB 1368.
In addition to the regional initiatives, legislation for the regulation of GHGs has been introduced at the federal level and if passed, may eventually override the regional efforts with a national cap and trade program. Federal bills to create both a cap-and-trade allowance system and a renewable/efficiency portfolio standard have been introduced in both the house and senate. Separately, the U.S. Environmental Protection Agency has taken several recent actions to regulate GHG emissions.
The Environmental Protection Agency's recent actions include its finding of "endangerment" to public health and welfare from GHGs, its issuance in September 2009 of the Final Mandatory Reporting of Greenhouse Gases Rule which requires large sources, including power plants, to monitor and report GHG emissions to the Environmental Protection Agency annually starting in 2011, and its publication in May 2010 of its final Prevention of Significant Deterioration and Title V Greenhouse Gas Tailoring Rule, to take effect in 2011, which requires large industrial facilities, including power plants, to obtain permits to emit, and to use best available control technology to curb emissions of, GHGs.
In addition, the United States is actively participating in various international initiatives to reduce GHG emissions globally that may result in further regulatory developments in the United States.
The implementation of existing CO2 and other GHG regulations, the introduction of new regulation, or other future regulatory developments may subject the Company to increased compliance obligations and costs that could have a material adverse impact on our business, operations or financial condition.
15
Increasing competition could adversely affect our performance and the performance of our projects
The power generation industry is characterized by intense competition, and our projects encounter competition from utilities, industrial companies and other independent power producers, in particular with respect to un-contracted output. In recent years, there has been increasing competition among generators for power sales agreements, and this has contributed to a reduction in electricity prices in certain markets where supply has surpassed demand plus appropriate reserve margins. In addition, many states have implemented or are considering regulatory initiatives designed to increase competition in the U.S. power industry. Increasing competition among participants in the power generation industry may adversely affect our performance and the performance of our projects.
We have limited control over management decisions at certain projects
In many cases, our projects are not wholly-owned by us or we have contracted for their operations and maintenance, and in some cases we have limited control over the operation of the projects. Although we generally prefer to acquire projects where we have control, we may make acquisitions in non-control situations to the extent that we consider it advantageous to do so and consistent with regulatory requirements and restrictions, including the Investment Company Act of 1940. Third-party operators (such as Caithness and GE) operate many of the projects. As such, we must rely on the technical and management expertise of these third-party operators, although typically we are represented on a management or operating committee if we do not own 100% of a project. To the extent that such third party operators do not fulfill their obligations to manage the operations of the projects or are not effective in doing so, the amount of cash available to pay dividends may be adversely affected.
We may face significant competition for acquisitions and may not successfully integrate acquisitions
Our business plan includes growth through identifying suitable acquisition opportunities, pursuing such opportunities, consummating acquisitions and effectively integrating them with our business. We may be unable to identify attractive acquisition candidates in the power industry in the future, and we may not be able to make acquisitions on an accretive basis or that acquisitions will be successfully integrated into our existing operations.
Although electricity demand is expected to grow, creating the need for more generation, and the U.S. power industry is continuing to undergo consolidation and may offer attractive acquisition opportunities, we are likely to confront significant competition for those opportunities and, to the extent that any opportunities are identified, we may be unable to effect acquisitions or investments.
Any acquisition or investment may involve potential risks, including an increase in indebtedness, the inability to successfully integrate operations, the potential disruption of our ongoing business, the diversion of management's attention from other business concerns and the possibility that we pay more than the acquired company or interest is worth. There may also be liabilities that we fail to discover, or are unable to discover, in our due diligence prior to the consummation of an acquisition, and we may not be indemnified for some or all these liabilities. In addition, our funding requirements associated with acquisitions and integration costs may reduce the funds available to us to make dividend payments.
Insurance may not be sufficient to cover all losses
Our business involves significant operating hazards related to the generation of electricity. While we believe that the projects' insurance coverage addresses all material insurable risks, provides coverage that is similar to what would be maintained by a prudent owner/operator of similar facilities, and are subject to deductibles, limits and exclusions which are customary or reasonable given the cost of procuring insurance, current operating conditions and insurance market conditions, there can be no
16
assurance that such insurance will continue to be offered on an economically feasible basis, nor that all events that could give rise to a loss or liability are insurable, nor that the amounts of insurance will at all times be sufficient to cover each and every loss or claim that may occur involving our assets or operations of our projects. Any losses in excess of those covered by insurance, which may include a significant judgment against any project or project operator, the loss of a significant permit or other approval or the imposition of a significant fine or penalty, could have a material adverse effect on our business, financial condition and future prospects and could adversely affect dividends to our shareholders.
Financing arrangements could negatively impact our business
Our current or future borrowings could increase the level of financial risk to us and, to the extent that the interest rates are not fixed and rise, or that borrowings are refinanced at higher rates, then cash available for dividends could be adversely affected. Covenants in those borrowings may also adversely affect cash available for dividends. In addition, most of the projects currently have term loan or other financing arrangements in place with various lenders. These financing arrangements are typically secured by all of the project assets and contracts as well as the equity interests in the project operator (including those owned by us). The terms of these financing arrangements generally impose many covenants and obligations on the part of the project operator and other borrowers and guarantors. For example, some agreements contain requirements to maintain specified debt service coverage ratios before cash may be distributed from the relevant project to us. In many cases, a default by any party under other project agreements (such as a PPA or a fuel supply agreement) will also constitute a default under the project's term loan or other financing arrangement. Failure to comply with the terms of these term loans or other financing arrangements, or events of default thereunder, may prevent cash distributions by the project to us and may entitle the lenders to demand repayment and/or enforce their security interests.
Our failure to refinance or repay any indebtedness when due could constitute a default under such indebtedness. Under such circumstances, it is expected that dividends to our shareholders would not be permitted until such indebtedness was refinanced or repaid and we may be required to sell assets or take other actions, including the initiation of bankruptcy proceedings or the commencement of an out-of-court debt restructuring.
Our equity interests in our projects may be subject to transfer restrictions
The partnership or other agreements governing some of the projects may limit a partner's ability to sell its interest. Specifically, these agreements may prohibit any sale, pledge, transfer, assignment or other conveyance of the interest in a project without the consent of the other partners. In some cases, other partners may have rights of first offer or rights of first refusal in the event of a proposed sale or transfer of our interest. These restrictions may limit or prevent us from managing our interests in the projects in the manner we see fit, and may have an adverse effect on our ability to sell our interests in these projects at the prices we desire.
The projects are exposed to risks inherent in the use of derivative instruments
We and the projects may use derivative instruments, including futures, forwards, options and swaps, to manage commodity and financial market risks. In the future, the project operators could recognize financial losses on these arrangements as a result of volatility in the market values of the underlying commodities or if a counterparty fails to perform under a contract. If actively quoted market prices and pricing information from external sources are not available, the valuation of these contracts would involve judgment or use of estimates. As a result, changes in the underlying assumptions or use of alternative valuation methods could affect the reported fair value of these contracts.
17
Most of these contracts are recorded at fair value with changes in fair value recorded currently in earnings, resulting in significant volatility in our income (as calculated in accordance with GAAP) that does not significantly affect current period cash flows or the underlying risk management purpose of the derivative instruments. As a result, we may be unable to accurately predict the impact that our risk management decisions may have on our quarterly and annual income (as calculated in accordance with GAAP).
If the values of these financial contracts change in a manner that we do not anticipate, or if a counterparty fails to perform under a contract, it could harm our financial condition, results of operations and cash flows. We have executed natural gas swaps to reduce our risks to changes in the market price of natural gas, which is the fuel consumed at many of our projects. Due to declining natural gas prices, we have incurred losses on these natural gas swaps. We execute these swaps only for the purpose of managing risks and not for speculative trading.
Risks Related to Our Structure
We are dependent on our projects for virtually all cash available for dividends
We are dependent on the operations and assets of the projects through our indirect ownership of interests in the projects. The actual amount of cash available for dividends to our shareholders depends upon numerous factors, including profitability, changes in revenues, fluctuations in working capital, availability under existing credit facilities, capital expenditure levels, applicable laws, compliance with contracts and contractual restrictive covenants contained in any debt documentation.
Distribution of available cash may restrict our potential growth
A payout of a significant portion of substantially all of our operating cash flow will make additional capital and operating expenditures dependent on increased cash flow or additional financing in the future. Lack of these funds could limit our future growth and cash flow. In addition, we may be precluded from pursuing otherwise attractive acquisitions or investments because they may not be accretive to us on a short-term basis.
Future dividends are not guaranteed
Our board of directors may, in their discretion, amend or repeal our existing dividend policy. Future dividends, if any, will depend on, among other things, the results of operations, working capital requirements, financial condition, restrictive covenants, business opportunities, provisions of applicable law and other factors that our board of directors may deem relevant. Our board of directors may decrease the level of or entirely discontinue payment of dividends.
Exchange rate fluctuations may impact our amount of cash available for dividends
Our payments to shareholders and convertible debenture holders are denominated in Canadian dollars. Conversely, all of our projects' revenues and expenses are denominated in U.S. dollars. As a result, we are exposed to currency exchange rate risks. Despite our hedges against this risk through 2013, any arrangements to mitigate this exchange rate risk may not be sufficient to fully protect against this risk. If hedging transactions do not fully protect against this risk, changes in the currency exchange rate between U.S. and Canadian dollars could adversely affect our cash available for distribution.
18
Our indebtedness could negatively impact our business and our projects
The degree to which we are leveraged on a consolidated basis could increase and have important consequences to our shareholders, including:
- •
- our ability in the future to obtain additional financing for working capital, capital expenditures, acquisitions or other
purposes may be limited;
- •
- we may be unable to refinance indebtedness on terms acceptable to us or at all; and
- •
- we may be limited in our ability to react to competitive pressures.
As of June 30, 2010, our consolidated long-term debt and our share of the debt of our unconsolidated affiliates represented approximately 55% of our total capitalization, comprised of debt and balance sheet equity.
Changes in our creditworthiness may affect the value of our common shares
Changes to our perceived creditworthiness may affect the market price or value and the liquidity of our common shares. The interest rate we pay on our credit facility may increase if certain credit ratios deteriorate.
Future issuances of our common shares could result in dilution
Our articles of incorporation authorize the issuance of an unlimited number of common shares for such consideration and on such terms and conditions as are established by our board of directors without the approval of any of our shareholders. We may issue additional common shares in connection with a future financing or acquisition. The issuance of additional common shares may dilute an investor's investment in us and reduce cash available for distribution per common share.
Investment eligibility
There can be no assurance that our common shares will continue to be qualified investments under relevant Canadian tax laws for trusts governed by registered retirement savings plans, registered retirement income funds, deferred profit sharing plans, registered education savings plans, registered disability savings plans and tax-free savings accounts.
We are subject to Canadian tax
As a Canadian corporation, we are generally subject to Canadian federal, provincial and other taxes, and dividends paid by us are generally subject to Canadian withholding tax if paid to a shareholder that is not a resident of Canada. We completed our initial public offering on the TSX in November 2004. At the time of the initial public offering, our public security was an IPS. Each IPS was comprised of one common share and Cdn$5.767 principal value of 11% subordinated notes due 2016. In the fourth quarter of 2009, we converted to a traditional common share company through a shareholder approved plan of arrangement in which each IPS was exchanged for one of our new common shares. Our new common shares were listed and posted for trading on the TSX commencing on December 2, 2009 and trade under the symbol "ATP," and the former IPSs, which traded under the symbol "ATP.UN," were delisted at that time. In connection with our conversion from an IPS structure to a traditional common share structure and the related reorganization of our organizational structure, we received a note from our primary U.S. holding company (the "Intercompany Note"). We are required to include in computing our taxable income interest on the Intercompany Note. We expect that our existing tax attributes initially will be available to offset this income inclusion such that it will not result in an immediate material increase to our liability for Canadian taxes. However, once we fully utilize our existing tax attributes (or if, for any reason, these attributes were not available to us), our
19
Canadian tax liability would materially increase. Although we intend to explore potential opportunities in the future to preserve the tax efficiency of our structure, no assurances can be given that our Canadian tax liability will not materially increase at that time.
Other Canadian federal income tax risks
There can be no assurance that Canadian federal income tax laws and Canada Revenue Agency ("CRA") administrative policies respecting the Canadian federal income tax consequences generally applicable to us, to our subsidiaries, or to a holder of common shares will not be changed in a manner which adversely affects holders of our common shares.
Our prior and current structure may be subject to additional U.S. federal income tax liability
Under our prior IPS structure, we treated the subordinated notes as debt for U.S. federal income tax purposes. Accordingly, we deducted the interest payments on the subordinated notes and reduced our net taxable income treated as "effectively connected income" for U.S. federal income tax purposes. Under our current structure, our subsidiaries that are incorporated in the United States are subject to U.S. federal income tax on their income at regular corporate rates (currently as high as 35%, plus state and local taxes), and our U.S. holding company will claim interest deductions with respect to the Intercompany Note in computing its income for U.S. federal income tax purposes. To the extent this interest expense is disallowed or is otherwise not deductible, the U.S. federal income tax liability of our U.S. holding company will increase, which could materially affect the after-tax cash available to distribute to us. While we received advice from our U.S. tax counsel, based on certain representations by us and our U.S. holding company and determinations made by our independent advisors, as applicable, that the subordinated notes and the Intercompany Note should be treated as debt for U.S. federal income tax purposes, it is possible that the Internal Revenue Service ("IRS") could successfully challenge those positions and assert that subordinated notes or the Intercompany Note should be treated as equity rather than debt for U.S. federal income tax purposes. In this case, the otherwise deductible interest on the subordinated notes or the Intercompany Note would be treated as non-deductible distributions and, in the case of the Intercompany Note, would be subject to U.S. withholding tax to the extent our U.S. holding company had current or accumulated earnings and profits. The determination of whether the subordinated notes and the U.S. holding company's indebtedness to us is debt or equity for U.S. federal income tax purposes is based on an analysis of the facts and circumstances. There is no clear statutory definition of debt for U.S. federal income tax purposes, and its characterization is governed by principles developed in case law, which analyzes numerous factors that are intended to identify the nature of the purported creditor's interest in the borrower. Furthermore, not all courts have applied this analysis in the same manner, and some courts have placed more emphasis on certain factors than other courts have. To the extent it were ultimately determined that our interest expenses on either the subordinated notes or the Intercompany Note were disallowed, our U.S. federal income tax liability for the applicable open tax years would materially increase, which could materially affect the after-tax cash available to us to distribute. Alternatively, the IRS could argue that the interest on the subordinated notes or the Intercompany Note exceeded or exceeds an arm's length rate, in which case only the portion of the interest expense that does not exceed an arm's length rate may be deductible and, in the case of the Intercompany Note, the remainder would be subject to U.S. withholding tax to the extent our U.S. holding company had current or accumulated earnings and profits. We have received advice from independent advisors that the interest rate on the subordinated notes and the Intercompany Note was and is, as applicable, commercially reasonable in the circumstances, but the advice is not binding on the IRS.
Furthermore, our U.S. holding company's deductions attributable to the interest expense on the Intercompany Note may be limited by the amount by which its net interest expense (the interest paid by our U.S. holding company on all debt, including the Intercompany Note, less its interest income)
20
exceeds 50% of its adjusted taxable income (generally, U.S. federal taxable income before net interest expense, net operating loss carryovers, depreciation and amortization). Any disallowed interest expense may currently be carried forward to future years. Moreover, proposed legislation has been introduced, though not enacted, several times in recent years that would further limit the 50% of adjusted taxable income cap described above to 25% of adjusted taxable income, although recent proposals in the Fiscal Year Budget for 2010 would only apply the revised rules to certain foreign corporations that were expatriated. Furthermore, if our U.S. holding company does not make regular interest payments as required under the Intercompany Note, other limitations on the deductibility of interest under U.S. federal income tax laws could apply to defer and/or eliminate all or a portion of the interest deduction that our U.S. holding company would otherwise be entitled to with respect to the Intercompany Note.
Passive foreign investment company treatment
We do not believe that we are a passive foreign investment company, and we do not expect to become a passive foreign investment company. However, if we were a passive foreign investment company while a taxable U.S. holder held common shares, such U.S. holder could be subject to an interest charge on any deferred taxation and the treatment of gain upon the sale of our stock as ordinary income.
Risks Related to the Common Shares
Market conditions and other factors may affect the value of our common shares
The trading price of our common shares will depend on many factors, which may change from time to time, including:
- •
- conditions in the power generation markets and the energy markets generally;
- •
- interest rates;
- •
- the market for similar securities;
- •
- government action or regulation;
- •
- general economic conditions or conditions in the financial markets;
- •
- our past and future dividend practice; and
- •
- our financial condition, performance, creditworthiness and prospects.
Accordingly, the common shares that an investor purchases, whether in this offering or in the secondary market, may trade at a price lower than that at which they were purchased.
The market price and trading volume of our common shares may be volatile
The market price of our common shares may be volatile, particularly given the current economic environment. In addition, the trading volume in our common shares may fluctuate and cause significant price variations to occur. If the market price of our common shares declines significantly, you may be unable to resell your shares at or above the public offering price. The market price of our common shares may fluctuate or decline significantly in the future.
Some of the factors that could negatively affect our share price or result in fluctuations in the price or trading volume of our common shares include:
- •
- quarterly variations in our operating results or the quality of our assets;
- •
- changes in applicable regulations or government action;
21
- •
- operating results that vary from the expectations of management, securities analysts and investors;
- •
- changes in expectations as to our future financial performance;
- •
- announcements of innovations, new products, strategic developments, significant contracts, acquisitions and other material
events by us or our competitors;
- •
- changes in financial estimates or publication of research reports and recommendations by financial analysts or actions
taken by rating agencies with respect to us or other companies in our industry;
- •
- the operating and securities price performance of other companies that investors believe are comparable to us;
- •
- changes in general market conditions, such as interest or foreign exchange rates, stock or commodity valuations, or
volatility; and
- •
- actions by our current shareholders, including sales of our common shares by existing shareholders and/or directors and executive officers.
Stock markets in general have experienced significant volatility over the past two years, and continue to experience significant price and volume volatility. As a result, the market price of our common shares may continue to be subject to similar market fluctuations that may be unrelated to our operating performance or prospects. Increased volatility could result in a decline in the market price of our common shares.
Present and future offerings of debt or equity securities, ranking senior to our common shares, may adversely affect the market price of our common shares
If we decide to issue debt or equity securities ranking senior to our common shares in the future it is likely that they will be governed by an indenture or other instrument containing covenants restricting our operating flexibility. Additionally, any convertible or exchangeable securities that we issue in the future may have rights, preferences and privileges more favorable than those of holders of our common shares and may result in dilution to holders of our common shares. We and, indirectly, our shareholders, will bear the cost of issuing and servicing such securities. Because our decision to issue debt or equity securities in any future offering will depend on market conditions and other factors beyond our control, we cannot predict or estimate the amount, timing or nature of our future offerings. Thus, holders of our common shares will bear the risk of our future offerings reducing the market price of our common shares and diluting the value of their share holdings in us.
The number of shares available for future sale could adversely affect the market price of our common shares
We cannot predict whether future issuances of our common shares or the availability of shares for resale in the open market will decrease the market price per common share. We may issue additional common shares, including securities that are convertible into or exchangeable for, or that represent the right to receive common shares. Sales of a substantial number of common shares in the public market or the perception that such sales might occur could materially adversely affect the market price of our common shares. Because our decision to issue securities in any future offering will depend on market conditions and other factors beyond our control, we cannot predict or estimate the amount, timing or nature of our future offerings. Thus, our shareholders bear the risk of our future offerings reducing the market price of our common shares and diluting their share holdings in us.
The exercise of the underwriters' option to purchase additional common shares, the exercise of any options granted to directors, executive officers and other employees under our stock compensation plans, and other issuances of our common shares could have an adverse effect on the market price of
22
our common shares, and the existence of options may materially adversely affect the terms upon which we may be able to obtain additional capital through the sale of equity securities. In addition, future sales of our common shares may be dilutive to existing shareholders.
The redemption of our outstanding debentures for or repayment of principal by issuing common shares may cause common shareholders dilution
We may determine to redeem outstanding debentures for common shares or to repay outstanding principal amounts thereunder at maturity of the debentures by issuing additional common shares. The issuance of additional common shares may have a dilutive effect on shareholders and an adverse impact on the price of our common shares.
Provisions of our articles of continuance could discourage potential acquisition proposals and could deter or prevent a change in control
We are governed by the Business Corporations Act (British Columbia). Our articles of continuance contain provisions that could have the effect of delaying, deferring or discouraging another party from acquiring control of our company by means of a tender offer, a proxy contest or otherwise. These provisions may make it more difficult for other persons, without the approval of our board of directors, to make a tender offer or otherwise acquire a substantial number of our common shares or to launch other takeover attempts that a shareholder might consider to be in his or her best interest. These provisions could limit the price that some investors might be willing to pay in the future for our common shares.
23
CAUTIONARY STATEMENTS REGARDING FORWARD-LOOKING STATEMENTS
Certain statements contained in this prospectus and in any related prospectus that are not historical facts may constitute forward-looking statements within the meaning of Section 27A of the Securities Act of 1933, as amended (the "Securities Act"), and Section 21E of the Securities Exchange Act of 1934, as amended, and are intended to be covered by the safe harbor provisions of the Private Securities Litigation Reform Act of 1995. Forward-looking statements involve risks and uncertainties. These statements, which are based on certain assumptions and describe our future plans, projections, strategies and expectations, can generally be identified by the use of the words "outlook," "objective," "may," "will," "should," "could," "would," "plan," "potential," "estimate," "project," "continue," "believe," "intend," "anticipate," "expect," "target" or the negatives of these words and phrases or similar expressions that are predictions of or indicate future events or trends and which do not relate solely to present or historical matters. These forward-looking statements include, but are not limited to, statements relating to:
- •
- our objectives, business, asset management and acquisition strategies;
- •
- success of acquisitions, future operations, market position and financial position;
- •
- expected opportunities for accretive acquisitions;
- •
- the amount of distributions expected to be received from the projects for the full year 2010;
- •
- estimated net cash tax refund in 2010;
- •
- our forecast of expected after-tax cash flows from Idaho Wind for each full year of operations;
- •
- our forecast of expected annual cash distributions from the Lake and Auburndale projects through 2012;
- •
- the expected resumption of distributions from our Chambers, Selkirk and Delta projects in 2011; and
- •
- the expected use of proceeds from this offering and the concurrent offering of convertible debentures.
Such forward-looking statements reflect our current expectations regarding future events and operating performance and speak only as of the date of this prospectus. Such forward-looking statements are based on a number of assumptions which may prove to be incorrect, including, but not limited to the assumption that the projects will operate and perform in accordance with our expectations. Forward-looking statements involve significant risks and uncertainties, should not be read as guarantees of future performance or results, and will not necessarily be accurate indications of whether or not or the times at or by which such performance or results will be achieved. A number of factors could cause actual results to differ materially from the results discussed in the forward-looking statements, including, but not limited to, the factors discussed under "Risk Factors" in this prospectus. Our business is both competitive and subject to various risks.
These risks include, without limitation:
- •
- a reduction in revenue upon expiration or termination of power purchase agreements;
- •
- the dependence of our projects on their electricity, thermal energy and transmission services customers;
- •
- exposure of certain of our projects to fluctuations in the price of electricity or natural gas;
- •
- projects not operating to plan;
- •
- the impact of significant environmental and other regulations on our projects;
24
- •
- increased competition, including for acquisitions;
- •
- our limited control over the operation of certain minority-owned projects; and
- •
- changes in assumptions used in making such forward-looking statements.
Other factors, such as general economic conditions, including exchange rate fluctuations, also may have an effect on the results of our operations. Many of these risks and uncertainties can affect our actual results and could cause our actual results to differ materially from those expressed or implied in any forward-looking statement made by us or on our behalf.
Material factors or assumptions that were applied in drawing a conclusion or making an estimate set out in the forward-looking information include third party projections of regional fuel and electric capacity and energy prices or cash flows that are based on assumptions about future economic conditions and courses of action. Although the forward-looking statements contained in this prospectus are based upon what are believed to be reasonable assumptions, investors cannot be assured that actual results will be consistent with these forward-looking statements, and the differences may be material. Therefore, investors are urged not to place undue reliance on our forward-looking statements. Certain statements included in this prospectus may be considered "financial outlook" for the purposes of applicable securities laws, and such financial outlook may not be appropriate for purposes other than this prospectus.
These forward-looking statements are made as of the date of this prospectus and, except as expressly required by applicable law, we assume no obligation to update or revise them to reflect new events or circumstances.
25
The following table sets forth, for each period indicated, the high and low exchange rates for one U.S. dollar, expressed in Canadian dollars, the average of such exchange rates on the last day of each month during such period and the exchange rate at the end of such period, based on the noon buying rate as quoted by the Bank of Canada. On August 12, 2010, the noon buying rate was US$1.00 = Cdn$1.0434.
| |
Six Months Ended June 30, |
12 Months Ended December 31, |
||||||
|---|---|---|---|---|---|---|---|---|
| |
2010 | 2009 | 2009 | 2008 | ||||
High |
Cdn$1.0778 | Cdn$1.3000 | Cdn$1.3000 | Cdn$1.2969 | ||||
Low |
Cdn$0.9961 | Cdn$1.0827 | Cdn$1.0292 | Cdn$0.9719 | ||||
Average |
Cdn$1.0338 | Cdn$1.2062 | Cdn$1.1420 | Cdn$1.0660 | ||||
Period End |
Cdn$1.0606 | Cdn$1.1625 | Cdn$1.0466 | Cdn$1.2112 | ||||
Source: Bank of Canada
26
We expect to receive net proceeds from this offering of approximately $ million after deducting the underwriting discounts and our estimated expenses of this offering (or approximately $ million if the underwriters exercise their option to purchase additional common shares in full). We intend to use the net proceeds from this offering and the concurrent offering of convertible debentures as follows:
- (i)
- approximately
$20 million to repay indebtedness incurred under our credit facility in June, 2010 to partially fund our previously-announced
acquisition of a 27.6% equity interest in Idaho Wind Partners 1, LLC; and
- (ii)
- up to $75 million to fund a likely investment in the Piedmont Green Power biomass project in Barnesville, Georgia for substantially all of the equity interest in the project, which is currently in advanced discussions that we expect to lead to a commitment.
Any remaining net proceeds will be used to fund additional growth opportunities and for general corporate purposes.
This offering is not conditioned upon the successful completion of the concurrent offering of convertible debentures and the concurrent offering of convertible debentures is not conditioned upon the successful completion of this offering. We expect to receive net proceeds from the concurrent offering of convertible debentures of approximately Cdn$ million after deducting the underwriting discounts and our estimated expenses of the concurrent offering of convertible debentures (or approximately Cdn$ million if the underwriters exercise in full their option to purchase additional debentures).
As of August 12, 2010, borrowings under our revolving credit facility were $20 million and were used to fund acquisitions. The revolving credit facility has a maturity date of August 12, 2012. Borrowings under the credit facility accrue interest at the London Interbank Offered Rate ("LIBOR") plus an applicable margin between 1.50% and 3.25% that varies based on the credit statistics of one of our subsidiaries. The margin is currently 1.50%.
27
On November 24, 2009, our shareholders approved our conversion to a common share structure. Subsequent to the conversion, we have continued to maintain our business strategy and our current distribution levels. Each IPS has been exchanged for one new common share. Our entire current monthly cash distribution of Cdn$0.0912 per common share is being paid as a dividend on the new common shares on the last business day of each month for holders of record on the last business day of the immediately preceding month. We expect to continue paying cash dividends in the future in amounts that are comparable to the distributions paid in 2009. Future dividends are paid at the discretion of our board of directors subject to our earnings and cash flow and are not guaranteed. The primary risk that impacts our ability to continue paying cash dividends at the current rate is the operating performance of our projects and their ability to distribute cash to us after satisfying project-level obligations.
28
MARKET PRICE OF AND DIVIDENDS ON THE COMMON SHARES AND
RELATED SHAREHOLDER MATTERS
The IPSs were listed and posted for trading on the TSX under the symbol ATP.UN from our initial public offering in November 2004 through November 30, 2009. Following the closing of the exchange of IPSs for common shares, our new common shares commenced trading on the TSX on December 2, 2009 under the symbol ATP. The following table sets forth the price ranges of the outstanding IPSs and common shares, as applicable, as reported by the TSX for the periods indicated. The table also reflects the dividends declared for the same periods.
Period
|
High (Cdn$) |
Low (Cdn$) |
|||||
|---|---|---|---|---|---|---|---|
Quarter ended September 30, 2010 (through August 12, 2010) |
13.40 | 12.11 | |||||
Quarter ended June 30, 2010 |
12.90 | 11.20 | |||||
Quarter ended March 31, 2010 |
13.85 | 11.50 | |||||
Quarter ended December 31, 2009 |
11.90 | 9.08 | |||||
Quarter ended September 30, 2009 |
9.49 | 8.55 | |||||
Quarter ended June 30, 2009 |
9.45 | 7.71 | |||||
Quarter ended March 31, 2009 |
9.28 | 6.34 | |||||
Quarter ended December 31, 2008 |
8.53 | 4.90 | |||||
Quarter ended September 30, 2008 |
9.30 | 6.28 | |||||
Quarter ended June 30, 2008 |
10.38 | 7.37 | |||||
Quarter ended March 31, 2008 |
11.00 | 9.67 | |||||
29
Period
|
Dividends Declared* |
|||
|---|---|---|---|---|
For the month ended July 31, 2010 |
0.091 | |||
For the month ended June 30, 2010 |
0.091 | |||
For the month ended May 31, 2010 |
0.091 | |||
For the month ended April 30, 2010 |
0.091 | |||
For the month ended March 31, 2010 |
0.091 | |||
For the month ended February 28, 2010 |
0.091 | |||
For the month ended January 31, 2010 |
0.091 | |||
For the month ended December 31, 2009 |
0.091 | |||
For the month ended November 30, 2009 |
0.091 | |||
For the month ended October 31, 2009 |
0.091 | |||
For the month ended September 30, 2009 |
0.091 | |||
For the month ended August 31, 2009 |
0.091 | |||
For the month ended July 31, 2009 |
0.091 | |||
For the month ended June 30, 2009 |
0.091 | |||
For the month ended May 31, 2009 |
0.091 | |||
For the month ended April 30, 2009 |
0.091 | |||
For the month ended March 31, 2009 |
0.091 | |||
For the month ended February 28, 2009 |
0.091 | |||
For the month ended January 31, 2009 |
0.091 | |||
For the month ended December 31, 2008 |
0.091 | |||
For the month ended November 30, 2008 |
0.088 | |||
For the month ended October 31, 2008 |
0.088 | |||
For the month ended September 30, 2008 |
0.088 | |||
For the month ended August 31, 2008 |
0.088 | |||
For the month ended July 31, 2008 |
0.088 | |||
For the month ended June 30, 2008 |
0.088 | |||
For the month ended May 31, 2008 |
0.088 | |||
For the month ended April 30, 2008 |
0.088 | |||
For the month ended March 31, 2008 |
0.088 | |||
For the month ended February 29, 2008 |
0.088 | |||
For the month ended January 31, 2008 |
0.088 | |||
- *
- Dividends include amounts distributed to holders of our IPSs in respect of both interest on the subordinated notes and dividends on the common shares.
Our shares began trading on the NYSE under the symbol "AT" on July 23, 2010. The following table sets forth the price ranges of our outstanding common shares, as reported by the NYSE from the date on which our common shares were listed through August 12, 2010. The table also reflects the dividends declared for the month ended July 31, 2010.
Period
|
High (US$) |
Low (US$) |
Dividends Declared |
|||||||
|---|---|---|---|---|---|---|---|---|---|---|
July 23, 2010 through August 12, 2010 |
13.48 | 12.30 | 0.089 | |||||||
On August 12, 2010, the closing price for our common shares on the TSX was Cdn$13.25, and the closing price for our common shares on the NYSE was $12.69. See "Exchange Rate Information" on page 26 for information regarding the exchange rate between Canadian dollars and U.S. dollars. There were approximately 36,600 shareholders of record of our common shares as of August 12, 2010.
Securities Authorized for Issuance under Equity Compensation Plans
See "Management—Compensation Discussion and Analysis" for information related to securities authorized for issuance under our equity compensation plans.
30
The following table shows our capitalization as of June 30, 2010 on a historical basis and on an as adjusted basis to give effect to:
- •
- the sale of our common shares, at an assumed offering price of $ per share, the last reported sale price of
our common shares on the New York Stock Exchange on July , 2010, after deducting underwriting discounts and estimated transaction expenses payable by us; and
- •
- the concurrent offering and sale of Cdn$ of our % Series B convertible unsecured subordinated debentures due , after deducting underwriting discounts and estimated transaction expenses payable by us.
You should read the information set forth in the table below together with our unaudited consolidated interim financial statements and the related notes for the six months ended June 30, 2010 included in this prospectus.
| |
As of June 30, 2010 | |||||||
|---|---|---|---|---|---|---|---|---|
| |
Historical | As Adjusted | ||||||
| |
(unaudited) (in thousands) |
|||||||
Cash and Cash Equivalents: |
$ | 63,314 | ||||||
Debt: |
||||||||
Revolving Credit Facility(1) |
20,000 | |||||||
Convertible debentures due 2014 |
56,360 | |||||||
Convertible debentures due 2017 |
81,016 | |||||||
Convertible debentures due 20 |
— | |||||||
Current portion of long-term debt |
18,330 | |||||||
Project-level debt |
214,527 | |||||||
Total Debt: |
390,233 | |||||||
Shareholder's Equity: |
||||||||
Common shares, no par value per share, unlimited authorized shares, 60,510 shares issued and outstanding, actual; shares issued and outstanding on a pro forma basis(2) |
544,647 | |||||||
Accumulated other comprehensive loss |
(194 | ) | ||||||
Retained deficit |
(163,299 | ) | ||||||
Noncontrolling interest |
3,481 | |||||||
Total shareholder's equity |
384,635 | |||||||
Total capitalization |
$ | 838,182 | ||||||
- (1)
- As
of August 12, 2010, the balance on our revolving credit facility was $20 million. On July 2, 2010, we acquired a 27.6% equity
interest in Idaho Wind Partners 1, LLC for approximately $40 million, which purchase price we financed in part by borrowing under our revolving credit facility.
- (2)
- Excludes (i) 11,473,000 shares issuable upon conversion, redemption, purchase for cancellation or maturity of our outstanding convertible debentures, (ii) shares upon conversion, redemption, purchase for cancellation or maturity of the convertible debentures being offered by us in the concurrent public offering, and (iii) 582,000 shares reserved for issuance in connection with our Long Term Incentive Plan.
31
SELECTED HISTORICAL FINANCIAL INFORMATION
The following table presents selected consolidated financial information, which should be read in conjunction with our consolidated financial statements beginning on page F-1 and the related notes thereto, and "Management's Discussion and Analysis of Financial Condition and Results of Operations" beginning on page 33. The annual historical information for each of the years in the three-year period ended December 31, 2009 has been derived from our audited consolidated financial statements included elsewhere in this prospectus. The historical information for the six-month periods ended June 30, 2009 and 2010 have been derived from our unaudited consolidated financial statements included elsewhere in this prospectus.
| |
Year Ended December 31, | Six months ended June 30, |
||||||||||||||||||||
|---|---|---|---|---|---|---|---|---|---|---|---|---|---|---|---|---|---|---|---|---|---|---|
| (in thousands of U.S. dollars, except as otherwise stated) |
2009 | 2008 | 2007 | 2006(a) | 2005(a) | 2010(a) | 2009(a) | |||||||||||||||
Project revenue |
$ | 179,517 | $ | 173,812 | $ | 113,257 | $ | 69,374 | $ | 57,711 | $ | 95,125 | $ | 90,304 | ||||||||
Project income |
48,415 | 41,006 | 70,118 | 57,247 | 48,256 | 19,405 | 25,995 | |||||||||||||||
Net (loss) income attributable to Atlantic Power Corporation |
(38,486 | ) | 48,101 | (30,596 | ) | (2,408 | ) | (509 | ) | (4,618 | ) | (6,486 | ) | |||||||||
Basic earnings per share, US$ |
$ |
(0.63 |
) |
$ |
0.78 |
$ |
(0.50 |
) |
$ |
(0.05 |
) |
$ |
(0.01 |
) |
$ |
(0.08 |
) |
$ |
(0.11 |
) |
||
Basic earnings per share, Cdn$ |
$ |
(0.72 |
) |
$ |
0.84 |
$ |
(0.53 |
) |
$ |
(0.06 |
) |
$ |
(0.02 |
) |
$ |
(0.08 |
) |
$ |
(0.13 |
) |
||
Diluted earnings per share, US$ |
$ |
(0.63 |
) |
$ |
0.73 |
$ |
(0.50 |
) |
$ |
(0.05 |
) |
$ |
(0.01 |
) |
$ |
(0.08 |
) |
$ |
(0.11 |
) |
||
Diluted earnings per share, Cdn$ |
$ |
(0.72 |
) |
$ |
0.86 |
$ |
(0.53 |
) |
$ |
(0.06 |
) |
$ |
(0.02 |
) |
$ |
(0.08 |
) |
$ |
(0.13 |
) |
||
Distribution declared per IPS |
$ |
0.51 |
$ |
0.60 |
$ |
0.59 |
$ |
0.57 |
$ |
0.53 |
— |
$ |
0.29 |
|||||||||
Dividend declared per common share |
$ | 0.46 | $ | 0.40 | $ | 0.40 | $ | 0.37 | $ | 0.31 | $ | 0.52 | $ | 0.19 | ||||||||
Total assets |
$ |
869,576 |
$ |
907,995 |
$ |
880,751 |
$ |
965,121 |
$ |
636,138 |
$ |
862,525 |
$ |
873,923 |
||||||||
Total long-term liabilities |
$ |
402,212 |
$ |
654,499 |
$ |
715,923 |
$ |
613,423 |
$ |
475,533 |
$ |
407,413 |
$ |
675,159 |
||||||||
- (a)
- Unaudited
32
MANAGEMENT'S DISCUSSION AND ANALYSIS OF FINANCIAL CONDITION AND
RESULTS OF OPERATIONS
The following management's discussion and analysis of financial condition and results of operations should be read in conjunction with our consolidated financial statements and notes thereto. All dollar amounts discussed below are in U.S. dollars, unless otherwise stated. The financial statements have been prepared in accordance with accounting principles generally accepted in the United States of America ("GAAP").
This report contains, in addition to historical information, forward-looking statements that involve risks and uncertainties. These forward-looking statements reflect our current views about future events and financial performance. Forward-looking statements are subject to a variety of factors that could cause actual results to differ materially from our expectations. Factors that could cause, or contribute to such differences include, without limitation, the factors described under "Risk Factors." In view of these uncertainties, investors are cautioned not to place undue reliance on these forward-looking statements. We assume no obligation, unless required by law, to update or revise publicly any forward-looking statements, whether as a result of new information, future events or otherwise.
Overview
Atlantic Power Corporation is an independent power producer, with power projects located in major markets in the United States. Our current portfolio consists of interests in 12 operational power generation projects across eight states, one wind project under construction in Idaho, a 500 kilovolt 84-mile electric transmission line located in California, and six development projects in five states. Our power generation projects in operation have an aggregate gross electric generation capacity of approximately 1,823 megawatts (or "MW"), in which our ownership interest is approximately 808 MW.
We sell the capacity and power from our power generation projects under power purchase agreements (or "PPAs") with a variety of utilities and other parties. Under the PPAs, which have expiration dates ranging from 2010 to 2037, we receive payments for electric energy sold to our customers (known as energy payments), in addition to payments for electric generation capacity (known as capacity payments). We also sell steam from a number of our projects under steam sales agreements to industrial purchasers. The transmission system rights (or "TSRs") we own in our power transmission project entitle us to payments indirectly from the utilities that make use of the transmission line.
Our power generation projects generally operate pursuant to long-term fuel supply agreements, typically accompanied by fuel transportation arrangements. In most cases, the fuel supply and transportation arrangements correspond to the term of the relevant PPAs, and most of the PPAs and steam sales agreements provide for the pass-through or indexing of fuel costs to our customers.
We partner with recognized leaders in the independent power business to operate and maintain our projects, including Caithness, Cogentrix and Western. Under these operation, maintenance and management agreements, the operator is typically responsible for operations, maintenance and repair services.
Current Trends in Our Business
Recession-related impacts
The recession caused significant decreases in both peak electricity demand and consumption that varied by region, although as always, upcoming summer peak demand will also be greatly influenced by weather. This has the effect of delaying projected increases in capacity requirements in varying degrees by region. Historically, electricity demand has made a strong recovery to pre-recession levels along with the economic recovery and the postponement of generation capacity additions are reduced to some extent as well, depending on the pace of the recovery. The reduced electricity peak demand and
33
consumption during a recession tends to impact base load (plants that typically operate at all times) and peaking plants (those that only operate in periods of very high demand) more than mid-merit plants (those that operate to meet the historical pattern of demand during the "peak" portion of most days, but not at night or in other lower demand periods such as weekends). During recessionary periods, base load plants are called on for lower levels of off-peak generation and peaking plants may be called on less frequently as a function of their efficiency and the overall peak demand level. The actual financial impacts on particular plants depend on whether contractual provisions, such as minimum load levels and/or significant capacity payments, partially mitigate the impact of reduced demand. One other recession-related industry impact was an easing of commodity costs, whose previous escalation had greatly increased new plant construction costs. The incipient economic recovery has moved prices higher again for copper, steel and other inputs, with labor costs a function of regional power plant and general construction activity levels, which in some locations includes increased renewable project construction.
Increased renewable power projects
The combination of federal stimulus provisions, state Renewable Portfolio Standards and state or regional CO2/greenhouse gases reduction programs has provided powerful incentives to build new renewable power capacity. One simple impact of this trend is the offsetting reduction in new fossil-fired generation, with the following exception. Because significant renewable capacity is being built as intermittent resources (e.g., wind and solar) there will be an increased need by system operators to have more "firming resources." These are units that can be started quickly or idled at low levels in order to be available to compensate for sudden decreases in output from the solar or wind projects. These firming resources are generally natural gas-fired generators or in more limited locations, pumped storage or reservoir-based hydro resources. The second significant impact of increased renewable projects is the increased need for new transmission lines to move power from renewable resources in typically more remote locations to the more highly-populated electricity load centers. This transmission requirement will require significant capital and tends to encounter a long and risky development and siting cycle.
Increased shale gas resources
The substantial additions of economically viable shale gas reserves and increasing production levels have put strong downward pressure on natural gas prices in both the spot and forward markets. One impact of the reduced prices is that gas-fired generators have displaced some generation from base load coal plants, particularly in the southeast U.S. Lower natural gas prices also have compressed, and in some cases turned negative, the "spark spread," which is the industry term for the profit margin between fuel and power prices. Reduced spark spreads directly impact the profitability of plants selling power into the spot market with no contract, which are referred to as merchant plants.
The lower power prices have a stifling impact on development of new renewable projects whose owners are attempting to negotiate power purchase agreements at favorable levels to support the financing and construction of the projects. The sense of reduced future volatility of gas prices due to increased supply has reinforced a growing expectation of natural gas' role as a "bridging fuel," helping from a carbon policy perspective to bridge the desired U.S. transition to both cleaner fuels and more commercially viable carbon removal and sequestration technologies.
Credit markets
Weak credit markets over the past two years reduced the number of lenders providing power project financing, as well as the size and length of loans resulting in higher costs for such financing. This reduces the number of new power projects that can be feasibly financed and built. Credit market conditions for project-lending have generally improved in late 2009 and in 2010, but are still much
34
weaker than pre-recession levels. However, base lending rates such as LIBOR have stayed quite low by historical standards, somewhat compensating for the increased interest rate spreads demanded by project lenders. Corporate level credit markets have experienced similar adverse impacts, which have impeded the ability of development companies to obtain financing for new power projects.
Factors That May Influence Our Results
Our primary objective is to generate consistent levels of cash flow to support dividends to our shareholders who we believe are primarily focused on income and secondarily on capital appreciation. Because we believe that our shareholders are focused on cash flow measures of our results, we provide supplementary non-GAAP information in this MD&A and discuss our results in terms of these non-GAAP measures, in addition to analysis of our results on a GAAP basis. See "Supplementary Non-GAAP Financial Information" on page 46 of this prospectus for additional details.
The primary components of our financial results are (i) the operating performance of our projects, (ii) non-cash gains and losses associated with derivative instruments and (iii) interest expense and foreign exchange impacts on corporate-level debt. We have recorded net losses in four of the past five years, primarily as a result of non-cash losses associated with items (ii) and (iii) above, which are described in more detail in the following paragraphs.
Operating performance of our projects
The operating performance of our projects supports cash distributions that are made to us after all operating and capital expenditures and debt service requirements are satisfied at the project-level. Our projects are able to pay distributions to us because they generally receive revenues from long-term contracts that provide relatively stable cash flows. Risks to the stability of these distributions include the following:
- •
- While approximately 60% of our power generation revenue in 2009 was related to contractual capacity payments, commodity
prices do influence our revenues and cost of fuel. Our PPAs are generally structured to minimize our risk to fluctuations in commodity prices by passing the cost of fuel through to our utility
customers, but some of our projects do have exposure to market power and fuel prices. For example, a portion of the natural gas required for our Auburndale and Lake projects is purchased at spot
market prices. We have executed a hedging strategy to substantially mitigate this risk. See "Outlook" below for additional details about our hedging program at Auburndale and Lake. Our most
significant exposure to market power prices exists at the Selkirk and Chambers projects. At Selkirk, approximately 23% of the capacity of the facility is not contracted and is sold at market power
prices or not sold at all if market prices do not support profitable operation of that portion of the facility. At Chambers, our utility customer has the right to sell a portion of the plant's output
to the spot power market if it is economical to do so, and the Chambers project shares in the profits from those sales.
- •
- When revenue or fuel contracts at our projects expire, we may not be able to sell power or procure fuel under new arrangements that provide the same level or stability of project cash flows. In particular, the power agreements at our Lake and Auburndale projects expire in 2013. We expect these projects to continue operating and making distributions to us after their existing power contracts expire, but with new agreements providing significantly lower levels than the distributions we are currently receiving. The level of these distributions is subject to market conditions at such time as we execute new power agreements for these projects and cannot be estimated at this time. Both of these projects will be free of debt at the time their PPAs expire in 2013, which provides us with some flexibility to pursue the most economic type of contract without restrictions that are sometimes imposed by project-level debt.
35
- •
- Some of our projects have non-recourse project-level debt that must be serviced before any distributions can be made to us. The project-level debt agreements typically contain cash flow coverage ratio tests that can prevent distributions to us if project cash flows do not exceed project-level debt service requirements by a specified amount. We are currently not receiving distributions from the Chambers, Selkirk and Delta-Person projects because of such restrictions. We expect to resume receiving distributions from all three of these projects in 2011. See the "Project-level debt" section of "Liquidity and Capital Resources" on page 57 for additional details.
Non-cash gains and losses on derivatives instruments
In the ordinary course of our business, we execute natural gas swap contracts to manage our exposure to fluctuations in commodity prices, forward foreign currency contracts to manage our exposure to fluctuations in foreign exchange rates and interest rate swaps to manage our exposure to changes in interest rates on variable rate project-level debt. Most of these contracts are recorded at fair value with changes in fair value recorded in earnings, resulting in significant volatility in our income that does not significantly affect current period cash flows or the underlying risk management purpose of the derivative instruments. See "Quantitative and Qualitative Disclosures About Market Risk" on page 65 for additional details about our derivative instruments.
Interest expense and other costs associated with debt
Interest expense relates to both non-recourse project-level debt and corporate-level debt. In addition, in connection with our common share conversion transaction, we recorded $16.2 million of charges to interest expense associated with the costs of the conversion and the write-off of unamortized debt issuance costs associated with the subordinated notes that were retired. The conversion transaction resulted in Cdn$348 million of subordinated notes bearing interest at 11% being converted to equity and, as a result, we expect a significant decrease in our interest expense beginning in 2010.
Our outstanding convertible debentures are denominated in Canadian dollars and, prior to our common share conversion transaction, the outstanding subordinated notes were also denominated in Canadian dollars. These debt instruments are revalued at each balance sheet date based on the U.S. dollar to Canadian dollar foreign exchange rate at the balance sheet date, with changes in the value of the debt recorded in the consolidated statement of operations. The U.S. dollar to Canadian dollar foreign exchange rate has been volatile in recent years, which in turn creates volatility in our results due to the revaluation of our Canadian dollar-denominated debt.
Outlook
The discussion below expresses management's outlook and expectations with respect to the future performance of our projects and businesses. Please see "Cautionary Statements Regarding Forward-Looking Statements."
Based on year-to-date results and our projections for the remainder of the year, we expect to receive distributions from our projects in the range of $75 million to $80 million for the full year 2010, an increase from our previous guidance of $70 million to $77 million. This amount represents a decrease of approximately $20 million to $25 million compared to distributions received from the projects in 2009. Changes in project distributions have historically been included in our long-term cash flow projections when we periodically confirm our ability to continue paying dividends to shareholders at current levels. Additional details about these changes are included below.
At the corporate level, we expect a net cash tax refund in 2010 in the range of $7 million to $9 million, compared to insignificant net cash taxes in 2009. Included in 2010 corporate-level costs will
36
be the $5 million payment under the terms of the management agreement termination, compared to a $6 million payment in 2009.
Looking ahead to 2011, we expect overall levels of cash flow to be improved over projected 2010 levels. Higher distributions from existing projects, initial distributions from our recent investment in Idaho Wind and a slightly lower payment under the management agreement termination are expected to be partially offset by the non-recurrence of the cash tax refunds that are anticipated in 2010. In 2012, still higher distributions from projects are expected to further increase operating cash flow compared to 2011. The most significant factor in the expected higher operating cash flow in 2012 is increased distributions from Selkirk following the final payment of its non-recourse project-level debt in 2012.
The following one-time items and contract expirations comprise the most significant of the decreases in projected 2010 project distributions compared to 2009.
- •
- Final insurance proceeds received in 2009 at Orlando due to the unplanned outage in early 2008.
- •
- Increase in debt principal payments in 2010 for Auburndale project-level debt.
- •
- Resolution in 2009 of the landowner litigation over right-of-way issues at Path 15, which
resulted in $6 million being released from the construction reserve account.
- •
- Final payment related to Pasco's prior PPA that expired at end of 2008 was received in early 2009.
In 2009, the following five projects comprised approximately 86% of project distributions received: Auburndale, Lake, Orlando, Path 15 and Pasco. For 2010, we expect these same five projects to contribute approximately 90% of total project distributions.
In addition to the items above, the following is a summary of other projections for project distributions in 2010 and beyond:
Lake
The Lake project is exposed to changes in natural gas prices from the expiration of its natural gas supply contract on June 30, 2009 through the expiration of its PPA in July 2013. We have executed a hedging strategy to mitigate this exposure by periodically entering into financial swaps that effectively fix the forward price of natural gas required at the project. We have taken advantage of the low market price of natural gas to make significant progress in our natural gas hedging strategy. These hedges are summarized below under "Quantitative and Qualitative Disclosures About Market Risk." We intend to continue, when appropriate, to evaluate opportunities to further mitigate natural gas price exposure at Lake in the 2010 to 2013 period, but do not intend to execute additional hedges at Lake for 2010 or 2012 because our natural gas exposure for those years is already substantially hedged.
The variable energy revenues in the Lake project's PPA are indexed to the price of coal consumed by a specific utility plant in Florida, PEF's Crystal River facility. The components of this coal price are proprietary to the utility, but we believe that the utility purchases coal for that plant under a combination of short to medium term contracts and spot market transactions.
Coal prices used in the electricity revenue component of the projected distributions from the Lake project incorporate a forecast of the applicable Crystal River facility coal cost provided by the utility based on their internal projections. The projected annual cash distributions change by approximately $1.0 million for every $0.25/Mmbtu change in the projected price of coal.
We expect to receive distributions from the Lake project of approximately $27 million to $29 million in 2010. In 2011 and 2012, distributions from Lake are expected to be $30 million to
37
$34 million per year. The increases in 2011 and 2012 are primarily due to higher expected contractual capacity and energy revenue and lower natural gas prices than in 2010.
Auburndale
Based on the current forecast, we expect distributions from Auburndale of $25 million to $27 million per year from 2010 through 2013, when the project's current PPA expires. Distributions received from Auburndale in the 2010 through 2013 period will be impacted by projected coal and gas prices in the forecast period.
The projected revenue from the Auburndale PPA contains a component related to coal costs at the utility off-taker's Crystal River facility as described above for the Lake project. Because that mechanism does not pass through changes in the project's fuel costs, Auburndale's operating margin is exposed to changes in natural gas prices for approximately 20% of its natural gas requirements through the expiration of the gas contract. The remaining 80% of the project's fuel requirements are supplied under an agreement with fixed prices through its expiration in mid-2012. We have been executing a strategy to mitigate the future exposure to changes in natural gas prices at Auburndale by periodically entering into financial swaps that effectively fix the forward price of natural gas required at the project. See "Quantitative and Qualitative Disclosures About Market Risk" for additional details about hedge contracts executed as of August 9, 2010. The 2010 and 2011 natural gas price exposure at Auburndale has been substantially hedged. We intend to continue, when appropriate, to evaluate opportunities to further mitigate natural gas price exposure at Auburndale in the 2012 to 2013 period.
Chambers
As expected, we have reported a significant decrease in cash flow at the Chambers project in 2009 due to a planned major maintenance outage, changes in market power prices and expected sales volumes and the expense associated with regional carbon allowance purchases.
As previously reported, the reduced cash flows resulted in the project not meeting cash flow coverage ratio tests in its non-recourse debt, so we received no distributions from Chambers in 2009 and do not expect to receive distributions from Chambers in 2010. Based on our current projections, we expect to resume receiving distributions from the project in 2011 based on meeting the required debt service coverage ratios.
38
Results of Operations
The following table and discussion is a summary of our consolidated results of operations for the three years ended December 31, 2009 and the six months ended June 30, 2010 and 2009. The results of operations by segment are discussed in further detail following this consolidated overview discussion.
| |
Year ended December 31, | Six months ended June 30, |
|||||||||||||||
|---|---|---|---|---|---|---|---|---|---|---|---|---|---|---|---|---|---|
| (in thousands of U.S. dollars, except as otherwise stated) |
2009 | 2008 | 2007 | 2010 | 2009 | ||||||||||||
| |
|
|
|
(unaudited) |
|||||||||||||
Project revenue |
|||||||||||||||||
Auburndale |
$ | 74,875 | $ | 10,003 | $ | — | $ | 40,037 | $ | 37,989 | |||||||
Lake |
62,285 | 61,610 | 53,210 | 34,083 | 31,104 | ||||||||||||
Pasco |
11,357 | 58,897 | — | 5,632 | 5,795 | ||||||||||||
Path 15 |
31,000 | 31,528 | 34,524 | 15,373 | 15,416 | ||||||||||||
Chambers |
— | — | — | — | — | ||||||||||||
Other Project Assets |
— | 11,774 | 25,523 | — | — | ||||||||||||
|
179,517 | 173,812 | 113,257 | 95,125 | 90,304 | ||||||||||||
Project expenses |
|||||||||||||||||
Auburndale |
59,435 | 7,669 | — | 30,133 | 29,324 | ||||||||||||
Lake |
47,005 | 39,951 | 36,429 | 24,007 | 21,049 | ||||||||||||
Pasco |
11,044 | 48,098 | — | 4,707 | 4,419 | ||||||||||||
Path 15 |
11,819 | 10,573 | 10,834 | 5,452 | 5,894 | ||||||||||||
Chambers |
— | — | — | — | — | ||||||||||||
Other Project Assets |
(254 | ) | 41 | 3,571 | 173 | (163 | ) | ||||||||||
|
129,049 | 106,332 | 50,834 | 64,472 | 60,523 | ||||||||||||
Project other income (expense) |
|||||||||||||||||
Auburndale |
(4,950 | ) | (225 | ) | — | (5,695 | ) | (1,314 | ) | ||||||||
Lake |
(5,060 | ) | 33 | (8,563 | ) | (6,220 | ) | (56 | ) | ||||||||
Pasco |
25 | (4,356 | ) | 6,159 | — | 67 | |||||||||||
Path 15 |
(11,682 | ) | (13,232 | ) | (12,016 | ) | (6,242 | ) | (5,215 | ) | |||||||
Chambers |
6,599 | 16,250 | 16,601 | 5,103 | 422 | ||||||||||||
Other Project Assets |
13,015 | (24,944 | ) | 5,514 | 1,806 | 2,310 | |||||||||||
|
(2,053 | ) | (26,474 | ) | 7,695 | (11,248 | ) | (3,786 | ) | ||||||||
Total project income (loss) |
|||||||||||||||||
Auburndale |
10,490 | 2,109 | — | 4,209 | 7,351 | ||||||||||||
Lake |
10,220 | 21,692 | 8,218 | 3,856 | 9,999 | ||||||||||||
Pasco |
338 | 6,443 | 6,159 | 925 | 1,443 | ||||||||||||
Path 15 |
7,499 | 7,723 | 11,674 | 3,679 | 4,307 | ||||||||||||
Chambers |
6,599 | 16,250 | 16,601 | 5,103 | 422 | ||||||||||||
Other Project Assets |
13,269 | (13,211 | ) | 27,466 | 1,633 | 2,473 | |||||||||||
|
48,415 | 41,006 | 70,118 | 19,405 | 25,995 | ||||||||||||
39
| |
Year ended December 31, | Six months ended June 30, |
|||||||||||||||
|---|---|---|---|---|---|---|---|---|---|---|---|---|---|---|---|---|---|
| (in thousands of U.S. dollars, except as otherwise stated) |
2009 | 2008 | 2007 | 2010 | 2009 | ||||||||||||
| |
|
|
|
(unaudited) |
|||||||||||||
Administrative and other expenses (income) |
|||||||||||||||||
Management fees and administration |
26,028 | 10,012 | 8,185 | 7,943 | 5,484 | ||||||||||||
Interest, net |
55,698 | 43,275 | 44,307 | 5,312 | 20,170 | ||||||||||||
Foreign exchange loss (gain) |
20,506 | (47,247 | ) | 30,142 | 2,432 | 9,506 | |||||||||||
Other expense, net |
362 | 425 | 975 | (26 | ) | (30 | ) | ||||||||||
Total administrative and other expenses |
102,594 | 6,465 | 83,609 | 15,661 | 35,130 | ||||||||||||
(Loss) income from operations before income taxes |
(54,179 | ) | 34,541 | (13,491 | ) | 3,744 | (9,135 | ) | |||||||||
Income tax expense (benefit) |
(15,693 | ) | (13,560 | ) | 17,105 | 8,491 | (2,649 | ) | |||||||||
Net (loss) income |
(38,486 | ) | 48,101 | (30,596 | ) | (4,747 | ) | (6,486 | ) | ||||||||
Less: Net loss attributable to non controlling Interest |
— | — | — | (129 | ) | — | |||||||||||
Net income (loss) attributable to Atlantic Power Corporation shareholders |
$ | (38,486 | ) | $ | 48,101 | $ | (30,596 | ) | $ | (4,618 | ) | $ | (6,486 | ) | |||
Consolidated Overview
We have six reportable segments: Auburndale, Chambers, Lake, Pasco, Path 15 and Other Project Assets. The results of operations are discussed below by reportable segment.
Project income is the primary GAAP measure of our operating results and is discussed in "Project Income" below. In addition, an analysis of non-project expenses impacting our results is set out in "Administrative and Other Expenses (Income)" below.
Significant non-cash items, which are subject to potentially significant fluctuations, include: (1) the change in fair value of certain derivative financial instruments that are required by GAAP to be revalued at each balance sheet date (see "Quantitative and Qualitative Disclosures About Market Risk" for additional information); (2) the non-cash impact of foreign exchange fluctuations from period to period on the U.S. dollar equivalent of our Canadian dollar-denominated obligations; and (3) the related deferred income tax expense (benefit) associated with these non-cash items.
Cash available for distribution was $66.3 million, $91.0 million and $58.5 million for the years ended December 31, 2009, 2008 and 2007, respectively. Cash available for distribution was $25.3 million and $39.3 million for the six months ended June 30, 2010 and 2009, respectively. See "Cash Available for Distribution" on page 56 for additional information.
Income (loss) from operations before income taxes for the years ended December 31, 2009, 2008 and 2007 was $(54.2) million, $34.5 million and $(13.5) million, respectively. Income (loss) from operations before income taxes for the six months ended June 30, 2010 and 2009 was $3.7 million and $(9.1) million, respectively. See "Project Income" below for additional information.
Income tax benefit was $15.7 million for the year ended December 31, 2009 compared to an income tax benefit of $13.6 million for the year ended December 31, 2008 and an income tax expense of $17.1 million for the year ended December 31, 2007. Our 2009 effective tax rate was 29 percent compared to negative 39 percent in 2008 and negative 127 percent in 2007. Our effective tax rate for the year ended December 31, 2009 was positively impacted by the recognition of a future tax benefit for net operating loss carryforwards in Canada due to an anticipated increase in Canadian taxable income in future years. Our effective tax rate for the year ended December 31, 2008 resulted primarily
40
from the decrease in valuation allowance attributable to the increase in the deferred tax liability associated with unrealized foreign exchange gains and the effect of other permanent differences. Our effective tax rate for the year ended December 31, 2007 was negatively impacted by the increase in valuation allowance attributable to an increase in net operating loss carryforwards in Canada partially offset by branch profits taxes on current year earnings, the impact of foreign earnings subject to tax at lower rates and the effect of other permanent differences.
Six months ended June 30, 2010 compared with six months ended June 30, 2009
Project Income
Auburndale Segment
Project income (loss) for our Auburndale segment decreased $3.2 million to $4.2 million in the six-month period ended June 30, 2010 from $7.4 million in the comparable 2009 period. The decrease in project income for the six months ended June 30, 2010 is primarily attributable to the $4.8 million non-cash change in fair value of derivative instruments associated with its natural gas swaps. These swaps were executed to financially hedge the project's exposure to the changes in market prices of natural gas. See "Quantitative and Qualitative Disclosures About Market Risk" below for additional details about our derivative instruments and other financial instruments. In addition, operations and maintenance costs were lower at Auburndale in the 2010 period due to timing.
Lake Segment
Project income for our Lake segment decreased $6.1 million to $3.9 million in the six-month period ended June 30, 2010 from $10.0 million in the comparable 2009 period. The decrease is primarily attributable to the non-cash change in fair value of derivative instruments associated with its natural gas swaps. These swaps were executed to financially hedge the project's exposure to the changes in market prices of natural gas. See "Quantitative and Qualitative Disclosures About Market Risk" below for additional details about our derivative instruments and other financial instruments.
Pasco Segment
Project income for our Pasco segment decreased $0.5 million to $0.9 million in the six-month period ended June 30, 2010 from $1.4 million in the comparable 2009 period. The decrease in project income at Pasco is attributable to the timing of operation and maintenance costs during the first quarter of 2009.
Path 15 Segment
Project income for our Path 15 segment decreased $0.6 million to $3.7 million in the six-month period ended June 30, 2010 from $4.3 million in the comparable 2009 period. The decrease in project income at Path 15 is attributable to a non-recurring gain in prior year related to the settlement of disputes with landowners over right-of-way issues.
Chambers Segment
Project income for our Chambers segment, which is recorded under the equity method of accounting, increased $4.7 million to $5.1 million in the six-month period ended June 30, 2010 from $0.4 million in the comparable 2009 period. The increase in project income at Chambers is primarily attributable to the non-recurrence of the planned major maintenance outage during the second quarter of 2009.
41
Other Project Assets Segment
Project income for our Other Project Assets segment decreased $0.9 million, to $1.6 million for the six months ended June 30, 2010 compared to a $2.5 million income in the comparable 2009 period. While the overall change in project income for the segment was not significant, the largest components of the change are as follows:
- •
- the absence of revenue at Rumford in 2010 as the contract that provided substantially all of the project's cash
flow expired in the fourth quarter 2009; and
- •
- combined losses in the 2009 period of $1.6 million at the Mid-Georgia and Stockton projects, which were sold in the fourth quarter of 2009.
Administrative and Other Expenses (Income)
Management fees and administration increased $2.4 million to $7.9 million for the six months ended June 30, 2010 from $5.5 million in the comparable period in 2009. The increase is primarily attributable to higher employee share-based compensation plan expense in 2010. The expense associated with the plan varies, in part, with the market price of our common shares, which increased significantly during the first half of 2010 compared to the first half of 2009, resulting in higher expense in the 2010 period. In addition, we incurred expenses associated with our initial NYSE listing completed in July 2010 as well as in increase in business development costs during 2010.
Interest expense at the corporate level in 2010 primarily relates to our convertible debentures. Interest expense decreased $14.9 million to $5.3 million in 2010 from $20.2 million in 2009. This decrease is primarily due to the extinguishment of the subordinated notes that were outstanding during 2009. In November 2009 we completed our common share conversion, which resulted in the extinguishment of Cdn$348 million principal value of 11% subordinated notes due 2016 that previously formed a part of each IPS.
Foreign exchange loss (gain) primarily reflects the unrealized impact of changes in foreign exchange rates on the U.S. dollar equivalent of our Canadian dollar-denominated obligations to holders of the convertible debentures and, through 2009, our subordinated notes. In addition, unrealized and realized gains and losses on our forward contracts for the purchase of Canadian dollars to satisfy these obligations and our dividends to shareholders are included in foreign exchange loss (gain). Foreign exchange loss decreased $7.1 million to a $2.4 million loss in 2010 compared to a $9.5 million loss in 2009. The U.S. dollar to Canadian dollar exchange rate increased by 1.3% during the six months ended June 30, 2010. During the six months ended June 30, 2009, the rate decreased by 4.7%. See "Quantitative and Qualitative Disclosures About Market Risk" below for additional details about our management of foreign currency risk and the components of the foreign exchange loss (gain) recognized during the six months ended June 30, 2010 compared to the foreign exchange loss (gain) in the comparable period of 2009.
Year ended December 31, 2009 vs. Year Ended December 31, 2008
Project Income
Auburndale Segment
Project income for our Auburndale segment increased $8.4 million to $10.5 million in 2009 from $2.1 million in 2008. The increase in project income for the twelve months ended December 31, 2009 was attributable to the fact that 2009 was the first full year of ownership of the project. The Auburndale project was acquired in November 2008.
42
Lake Segment
Project income for our Lake segment decreased $11.5 million, or 53%, to $10.2 million in 2009 from $21.7 million in 2008. The decrease was primarily attributable to higher fuel expense at Lake due to the expiration of its natural gas supply agreement as of June 30, 2009. A new gas supply agreement at higher prices was effective for the second half of 2009. In addition, non-cash losses associated with natural gas swaps were recorded in the change in fair value of derivative instruments during 2009 of $5.1 million. These swaps were executed to financially hedge the project's exposure to the changes in market prices of natural gas. See "Quantitative and Qualitative Disclosures About Market Risk" below for additional details about our derivative instruments and other financial instruments.
Pasco Segment
Project income for our Pasco segment decreased $6.1 million, or 95%, to $0.3 million in 2009 from $6.4 million in 2008. The decrease in project income at Pasco was attributable to lower revenues of $47.5 million from the project's new ten-year tolling agreement effective January 1, 2009, which provides for lower rates than the power purchase agreement that expired December 31, 2008, partially offset by lower fuel expense of $26.7 million, since the new agreement requires the utility to provide the natural gas needed to generate electricity at the plant. In addition, depreciation expense decreased by $8.2 million due to the full amortization of the intangible asset associated with the project's PPA that expired on December 31, 2008. The Pasco project also recorded a $3.4 million charge in change in fair value of derivative instruments in 2008 associated with natural gas swaps that terminated at the end of 2008.
Path 15 Segment
Project income at Path 15 for the year ended December 31, 2009 did not change significantly from 2008.
Chambers Segment
Project income for our Chambers segment, which is recorded under the equity method of accounting, decreased $9.7 million, or 59%, to $6.6 million in 2009 from $16.3 million in 2008 as a result of $9.4 million lower gross margin due to lower electricity sales volumes and prices throughout 2009 and a $4.6 million increase in operation and maintenance costs from a planned major maintenance outage in the second quarter of 2009. In addition, non-cash gains of $2.6 million associated with interest swaps were recorded in the change in fair value of derivative instruments during 2009 compared to $4.3 million of losses in 2008.
Other Project Assets Segment
Project income (loss) for our Other Project Assets segment increased $26.5 million to $13.3 million in 2009 compared to a $(13.2) million loss in 2008, primarily due to the following:
- •
- the gain on the sale of Mid-Georgia of $15.8 million in 2009;
- •
- an impairment charge of $18.5 million at Stockton in 2008;
- •
- the absence of revenue at Onondaga in 2009 as the contract that provided substantially all of the project's cash flow
expired in the second quarter 2008;
- •
- reduced expense at Selkirk in 2009 associated with the change in fair value of derivative instruments; and
- •
- an impairment of our equity investment in Rumford of $5.5 million in 2009.
43
Administrative and Other Expenses (Income)
Management fees and administration expenses includes the costs of operating as a public company, as well as the fees and costs associated with our management by Atlantic Power Management, LLC (the "Manager"). Effective December 31, 2009, the Manager no longer provides management and administrative services for our company. The Manager is indirectly owned by the ArcLight Funds and received compensation in the form of an annual base fee that was indexed to inflation and an incentive fee that was equal to 25% of the cash distributions to shareholders in excess of Cdn$1.00 per year per IPS. We also reimbursed the Manager for reasonable costs incurred to manage our company. Management fees and administration increased $16 million, or 160%, to $26 million in 2009 from $10.0 million in 2008. The increase is primarily attributable to a $14.1 million charge associated with the termination of the management agreements at the end of 2009. In addition, employee and director share-based compensation plan expense increased in 2009. The expense associated with these plans varies, in part, with the market price of our common shares, which increased significantly during 2009 compared to a decrease during the twelve months of 2008, resulting in higher expense in the 2009 period.
Interest expense primarily relates to required interest costs associated with the subordinated notes and the debentures. Interest expense increased $12.4 million, or 29%, to $55.7 million in 2009 from $43.3 million in 2008. This increase is primarily due to the write off of unamortized subordinated note deferred finance costs of $7.5 million, the write off of the unamortized subordinated note premium of $0.9 million and transaction costs of $4.7 million upon closing of our conversion to a common share structure. A charge of $3.1 million was also recorded when we redeemed the remaining subordinated notes in December 2009. This charge was comprised of a premium paid on the redemption of $1.9 million and the write-off of unamortized subordinated note deferred finance costs of $1.2 million. In addition, there were amounts outstanding on our revolving credit facility for a portion of the year ended December 31, 2009 related to the temporary financing of the acquisition of the Auburndale project in late 2008.
Foreign exchange loss (gain) primarily reflects the unrealized impact of changes in foreign exchange rates on the U.S. dollar equivalent of our Canadian dollar-denominated obligations to holders of subordinated notes and debentures. In addition, unrealized and realized gains and losses on our forward contracts for the purchase of Canadian dollars to satisfy these obligations are included in foreign exchange loss (gain). Foreign exchange loss (gain) increased $67.7 million to $20.5 million loss in 2009 compared to a $(47.2 million) gain in 2008. The U.S. dollar to Canadian dollar exchange rate decreased by 15.9% during the year ended December 31, 2009. During the year ended December 31, 2008, the rate increased by 18.6%. See "Quantitative and Qualitative Disclosures About Market Risk" below for additional details about our management of foreign currency risk and the components of the foreign exchange loss (gain) recognized during the year ended December 31, 2009 compared to the foreign exchange loss (gain) in 2008.
Year Ended December 31, 2008 vs. December 31, 2007
Project Income
Auburndale Segment
The Auburndale project was acquired in November 2008 and had no results of operations for the year ended December 31, 2007.
Lake Segment
Project income for our Lake segment increased $13.5 million, or 164%, to $21.7 million in 2008 from $8.2 million in 2007 primarily due to higher dispatch in 2008, a 5% increase in capacity payments
44
under the PPA and the non-recurrence of costs associated with a planned outage for a gas turbine upgrade during the fourth quarter of 2007.
Pasco Segment
Project income for our Pasco segment increased $0.2 million to $6.4 million in 2008 from $6.2 million in 2007 due to an increase in ownership of the project from 50% in 2007 to 100% in 2008, offset by higher fuel costs related to gas swap payments and an overhaul of the steam turbine during the fourth quarter of 2008.
Path 15 Segment
Project income for our Path 15 segment decreased $4 million, or 34%, to $7.7 million in 2008 from $11.7 million in 2007 as a result of lower revenues associated with the 2008-2010 rate case and a provision for rate case refund.
Chambers Segment
Project income for our Chambers segment decreased $0.3 million, or 2%, to $16.3 million in 2008 from $16.6 million in 2007 primarily due to timing differences of coal prices between the PPA and project fuel agreement.
Other Project Assets Segment
Project income (loss) for our Other Project Assets segment decreased $40.7 million, or 148%, to a $(13.2) million loss in 2008 compared to $27.5 million income in 2007, primarily due to the following:
- •
- an impairment charge at Stockton in 2008 in the amount of $18.5 million;
- •
- lower income at Selkirk attributable to a decrease in the fair value of its long-term gas supply agreement,
which is recorded as a derivative instrument; and
- •
- the absence of revenue at Onondaga for the second half of 2008 as the contract that provided substantially all of the project's cash flow expired in June 2008.
Administrative and Other Expenses
Management fees and administration increased $1.8 million, or 22%, to $10.0 million in 2008 from $8.2 million in 2007. The increase is primarily attributable to costs associated with pursuing acquisitions that were not completed in 2008, as well as personnel additions and expense recognized related to awards under our long-term incentive plan that were granted in March 2008 and March 2007.
Interest expense decreased $1.0 million, or 2%, to $43.3 million in 2008 from $44.3 million in 2007. Interest expense primarily relates to required interest payments to holders of the subordinated notes and the debentures. In addition, there were amounts outstanding on the revolving credit facility during the first half of 2007 related to the temporary financing of the acquisition of the Path 15 project, as well as amounts outstanding as of December 31, 2008 on the revolving credit facility due to the acquisition of Auburndale.
Foreign exchange loss (gain) increased $77.3 million to a $(47.2 million) gain in 2008 compared to a $30.1 million loss in 2007. The increase in foreign exchange loss (gain) is due primarily to an increase in the U.S. dollar to Canadian dollar exchange rate of approximately 18.6% during the year ended December 31, 2008. The rate decreased by 17% during the year ended December 31, 2007. See "Quantitative and Qualitative Disclosures About Market Risk" for additional details about our management of foreign currency risk and the components of the foreign exchange gains recognized
45
during the year ended December 31, 2008 compared to the foreign exchange losses in the prior year periods.
Supplementary Non-GAAP Financial Information
The key measure we use to evaluate the results of our projects is cash available for distribution. Cash available for distribution is not a measure recognized under GAAP, does not have a standardized meaning prescribed by GAAP and therefore may not be comparable to similar measures presented by other issuers. We believe cash available for distribution is a relevant supplemental measure of our ability to pay dividends to our shareholders. A reconciliation of net cash provided by operating activities to cash available for distribution is set out below under "cash available for distribution." Investors are cautioned that we may calculate this measure in a manner that is different from other companies.
The primary factor influencing cash available for distribution is cash distributions received from the projects. These distributions received are generally funded from Project Adjusted EBITDA generated by the projects, reduced by project-level debt service and capital expenditures, and adjusted for changes in project-level working capital and cash reserves. Project Adjusted EBITDA is defined as project income less interest, taxes, depreciation and amortization (including non-cash impairment charges) and changes in fair value of derivative instruments. Project Adjusted EBITDA is not a measure recognized under GAAP and does not have a standardized meaning prescribed by GAAP and is therefore unlikely to be comparable to similar measures presented by other companies. We use unaudited Project Adjusted EBITDA to provide comparative information about project performance without considering how projects are capitalized or whether they contain derivative contracts that are required to be recorded at fair value. Investors are cautioned that we may calculate this measure in a manner that is different from other companies.
Because Project Adjusted EBITDA and project distributions are key drivers of both the performance of our projects and cash available for distribution, please see the following supplementary unaudited non-GAAP information that summarizes Project Adjusted EBITDA by project and a reconciliation of Project Adjusted EBITDA by project to project distributions actually received by us.
Project Adjusted EBITDA (in thousands of U.S. dollars)
| |
Year ended December 31, | Six months ended June 30, |
|||||||||||||||
|---|---|---|---|---|---|---|---|---|---|---|---|---|---|---|---|---|---|
| (unaudited) |
2009 | 2008 | 2007 | 2010 | 2009 | ||||||||||||
Project Adjusted EBITDA by individual segment |
|||||||||||||||||
Auburndale |
35,221 | 4,461 | — | 19,802 | 18,547 | ||||||||||||
Lake |
25,378 | 32,892 | 28,042 | 14,612 | 15,621 | ||||||||||||
Pasco |
3,299 | 21,953 | 14,225 | 2,417 | 2,869 | ||||||||||||
Path 15 |
27,691 | 28,872 | 31,564 | 14,115 | 13,833 | ||||||||||||
Chambers |
13,595 | 27,603 | 28,028 | 10,129 | 5,024 | ||||||||||||
Total |
105,184 | 115,781 | 101,859 | 61,075 | 55,894 | ||||||||||||
46
| |
Year ended December 31, | Six months ended June 30, |
|||||||||||||||
|---|---|---|---|---|---|---|---|---|---|---|---|---|---|---|---|---|---|
| (unaudited) |
2009 | 2008 | 2007 | 2010 | 2009 | ||||||||||||
Other Project Assets |
|||||||||||||||||
Mid-Georgia |
2,509 | 4,206 | 5,587 | — | 1,386 | ||||||||||||
Stockton |
(675 | ) | 1,780 | 3,505 | — | (1,114 | ) | ||||||||||
Badger Creek |
3,245 | 3,762 | 4,109 | 1,510 | 1,732 | ||||||||||||
Koma Kulshan |
822 | 912 | 1,196 | 553 | 412 | ||||||||||||
Onondaga |
— | 7,865 | 21,966 | — | — | ||||||||||||
Orlando |
8,858 | 8,206 | 8,336 | 3,671 | 3,975 | ||||||||||||
Topsham |
1,879 | 2,629 | 2,031 | 963 | 1,118 | ||||||||||||
Delta Person |
894 | 2,012 | 2,255 | 904 | 824 | ||||||||||||
Gregory |
4,482 | 5,236 | 4,428 | 2,283 | 2,271 | ||||||||||||
Rumford |
2,590 | 2,395 | 2,585 | (7 | ) | 1,308 | |||||||||||
Selkirk |
15,059 | 19,104 | 24,197 | 7,056 | 7,650 | ||||||||||||
Rollcast |
(234 | ) | — | — | (189 | ) | (95 | ) | |||||||||
Other |
(434 | ) | 801 | 3,164 | (544 | ) | (306 | ) | |||||||||
Total adjusted EBITDA from Other Project Assets segment |
38,995 | 58,908 | 83,359 | 16,200 | 19,161 | ||||||||||||
Project income |
|||||||||||||||||
Total adjusted EBITDA from all Projects |
144,179 | 174,689 | 185,218 | 77,275 | 75,055 | ||||||||||||
Amortization |
67,643 | 60,125 | 59,141 | 32,982 | 35,005 | ||||||||||||
Interest expense, net |
31,511 | 30,316 | 31,678 | 11,878 | 15,613 | ||||||||||||
Change in the fair value of derivative instruments |
5,047 | 29,914 | 22,440 | 12,729 | (589 | ) | |||||||||||
Other (income) expense |
(8,437 | ) | 13,328 | 1,841 | 281 | (969 | ) | ||||||||||
Project income as reported in the statement of operations |
48,415 | 41,006 | 70,118 | 19,405 | 25,995 | ||||||||||||
47
Reconciliation of Project Distributions (in thousands of U.S. dollars)
For the six months ended June 30, 2010
| (unaudited) |
Project Adjusted EBITDA |
Repayment of long-term debt |
Interest expense, net |
Capital expenditures |
Change in working capital & other items |
Project distribution received |
||||||||||||||
|---|---|---|---|---|---|---|---|---|---|---|---|---|---|---|---|---|---|---|---|---|
Reportable Segments |
||||||||||||||||||||
Auburndale |
$ | 19,802 | $ | (4,900 | ) | $ | (886 | ) | $ | (8 | ) | $ | (1,008 | ) | $ | 13,000 | ||||
Chambers |
10,129 | (6,016 | ) | (3,327 | ) | (34 | ) | (742 | ) | — | ||||||||||
Lake |
14,612 | — | 6 | (1,004 | ) | 748 | 14,362 | |||||||||||||
Pasco |
2,417 | — | — | (467 | ) | 380 | 2,330 | |||||||||||||
Path 15 |
14,115 | (3,740 | ) | (6,242 | ) | — | 181 | 4,314 | ||||||||||||
Total Reportable Segments |
61,075 | (14,666 | ) | (10,449 | ) | (1,513 | ) | (441 | ) | 34,006 | ||||||||||
Other Project Assets |
||||||||||||||||||||
Badger Creek |
1,510 | — | (7 | ) | — | 138 | 1,641 | |||||||||||||
Delta Person |
904 | (1,023 | ) | (137 | ) | — | 256 | — | ||||||||||||
Gregory |
2,283 | (823 | ) | (112 | ) | (39 | ) | (443 | ) | 866 | ||||||||||
Koma Kulshan |
553 | — | — | — | (206 | ) | 347 | |||||||||||||
Orlando |
3,671 | — | 1 | (66 | ) | (1,706 | ) | 1,900 | ||||||||||||
Rumford |
(7 | ) | — | — | — | 7 | — | |||||||||||||
Selkirk |
7,056 | (4,657 | ) | (1,181 | ) | (309 | ) | (909 | ) | — | ||||||||||
Topsham |
963 | — | — | — | — | 963 | ||||||||||||||
Other |
(733 | ) | — | 7 | (40 | ) | 792 | 26 | ||||||||||||
Total Other Project Assets Segment |
16,200 | (6,503 | ) | (1,429 | ) | (454 | ) | (2,071 | ) | 5,743 | ||||||||||
Total all Segments |
$ | 77,275 | $ | (21,169 | ) | $ | (11,878 | ) | $ | (1,967 | ) | $ | (2,512 | ) | $ | 39,749 | ||||
48
Reconciliation of Project Distributions (in thousands of U.S. dollars)
For the six months ended June 30, 2009
| (unaudited) |
Project Adjusted EBITDA |
Repayment of long-term debt |
Interest expense, net |
Capital expenditures |
Change in working capital & other items |
Project distribution received |
||||||||||||||
|---|---|---|---|---|---|---|---|---|---|---|---|---|---|---|---|---|---|---|---|---|
Reportable Segments |
||||||||||||||||||||
Auburndale |
$ | 18,547 | $ | (1,750 | ) | $ | (1,314 | ) | $ | (246 | ) | $ | (2,364 | ) | $ | 12,873 | ||||
Chambers |
5,024 | (5,303 | ) | (4,029 | ) | (525 | ) | 4,833 | — | |||||||||||
Lake |
15,621 | — | 6 | (426 | ) | 309 | 15,510 | |||||||||||||
Pasco |
2,869 | — | 43 | (46 | ) | 4,084 | 6,950 | |||||||||||||
Path 15 |
13,833 | (3,801 | ) | (6,444 | ) | — | 5,194 | 8,782 | ||||||||||||
Total Reportable Segments |
55,894 | (10,854 | ) | (11,738 | ) | (1,243 | ) | 12,056 | 44,115 | |||||||||||
Other Project Assets |
||||||||||||||||||||
Mid-Georgia |
1,386 | (816 | ) | (1,734 | ) | — | 1,164 | — | ||||||||||||
Stockton |
(1,114 | ) | — | (35 | ) | 96 | 1,053 | — | ||||||||||||
Badger Creek |
1,732 | — | (2 | ) | — | (130 | ) | 1,600 | ||||||||||||
Delta Person |
824 | (541 | ) | (190 | ) | — | (93 | ) | — | |||||||||||
Gregory |
2,271 | (2,132 | ) | (221 | ) | (46 | ) | 728 | 600 | |||||||||||
Koma Kulshan |
412 | — | — | (18 | ) | (327 | ) | 67 | ||||||||||||
Orlando |
3,975 | — | 6 | (189 | ) | 2,658 | 6,450 | |||||||||||||
Rumford |
1,308 | — | — | — | (1,308 | ) | — | |||||||||||||
Selkirk |
7,650 | (4,247 | ) | (1,586 | ) | (59 | ) | 1,238 | 2,996 | |||||||||||
Topsham |
1,118 | (45 | ) | (2 | ) | — | — | 1,071 | ||||||||||||
Other |
(401 | ) | — | (111 | ) | (46 | ) | 1,091 | 533 | |||||||||||
Total Other Project Assets Segment |
19,161 | (7,781 | ) | (3,875 | ) | (262 | ) | 6,074 | 13,317 | |||||||||||
Total all Segments |
$ | 75,055 | $ | (18,635 | ) | $ | (15,613 | ) | $ | (1,505 | ) | $ | 18,130 | $ | 57,432 | |||||
49
Reconciliation of Project Distributions (in thousands of U.S. dollars)
For the twelve months ended December 31, 2009
| (unaudited) |
Project Adjusted EBITDA |
Repayment of long-term debt |
Interest expense, net |
Capital expenditures |
Change in working capital & other items |
Project distribution received |
||||||||||||||
|---|---|---|---|---|---|---|---|---|---|---|---|---|---|---|---|---|---|---|---|---|
Reportable Segments |
||||||||||||||||||||
Auburndale |
35,221 | (3,500 | ) | (2,832 | ) | (322 | ) | 2,419 | 30,986 | |||||||||||
Chambers |
13,595 | (10,570 | ) | (7,674 | ) | (689 | ) | 5,338 | — | |||||||||||
Lake |
25,378 | — | 4 | (1,278 | ) | (1,405 | ) | 22,699 | ||||||||||||
Pasco |
3,299 | — | — | (97 | ) | 5,148 | 8,350 | |||||||||||||
Path 15 |
27,691 | (7,519 | ) | (12,912 | ) | — | 3,798 | 11,058 | ||||||||||||
Total Reportable Segments |
105,184 | (21,589 | ) | (23,414 | ) | (2,386 | ) | 15,298 | 73,093 | |||||||||||
Other Project Assets |
||||||||||||||||||||
Mid-Georgia |
2,509 | (1,694 | ) | (3,271 | ) | 11 | 2,445 | — | ||||||||||||
Stockton |
(675 | ) | — | (70 | ) | (297 | ) | 1,042 | — | |||||||||||
Badger Creek |
3,245 | — | (17 | ) | — | 447 | 3,675 | |||||||||||||
Delta Person |
894 | (1,512 | ) | (224 | ) | — | 842 | — | ||||||||||||
Gregory |
4,482 | (2,903 | ) | (1,792 | ) | (98 | ) | 2,551 | 2,240 | |||||||||||
Koma Kulshan |
822 | — | 1 | (79 | ) | (553 | ) | 191 | ||||||||||||
Orlando |
8,858 | — | 14 | (632 | ) | 4,435 | 12,675 | |||||||||||||
Rumford |
2,590 | — | 2 | — | 309 | 2,901 | ||||||||||||||
Selkirk |
15,059 | (8,122 | ) | (2,777 | ) | 161 | (1,325 | ) | 2,996 | |||||||||||
Topsham |
1,879 | (45 | ) | (2 | ) | — | — | 1,832 | ||||||||||||
Other |
(668 | ) | — | 39 | (62 | ) | 1,248 | 557 | ||||||||||||
Total Other Project Assets Segment |
38,995 | (14,276 | ) | (8,097 | ) | (996 | ) | 11,441 | 27,067 | |||||||||||
Total all Segments |
144,179 | (35,865 | ) | (31,511 | ) | (3,382 | ) | 26,739 | 100,160 | |||||||||||
50
Reconciliation of Project Distributions (in thousands of U.S. dollars)
For the twelve months ended December 31, 2008
| (unaudited) |
Project Adjusted EBITDA |
Repayment of long-term debt |
Interest expense, net |
Capital expenditures |
Change in working capital & other items |
Project distribution received |
||||||||||||||
|---|---|---|---|---|---|---|---|---|---|---|---|---|---|---|---|---|---|---|---|---|
Reportable Segments |
||||||||||||||||||||
Auburndale |
4,461 | — | (225 | ) | — | 1,764 | 6,000 | |||||||||||||
Chambers |
27,603 | (9,639 | ) | (8,537 | ) | (145 | ) | 1,414 | 10,696 | |||||||||||
Lake |
32,892 | — | 33 | (814 | ) | (931 | ) | 31,180 | ||||||||||||
Pasco |
21,953 | (12,038 | ) | (978 | ) | (175 | ) | 10,883 | 19,645 | |||||||||||
Path 15 |
28,872 | (8,086 | ) | (13,232 | ) | — | 156 | 7,710 | ||||||||||||
Total Reportable Segments |
115,781 | (29,763 | ) | (22,939 | ) | (1,134 | ) | 13,286 | 75,231 | |||||||||||
Other Project Assets |
||||||||||||||||||||
Mid-Georgia |
4,206 | (2,646 | ) | (3,271 | ) | 11 | 1,700 | — | ||||||||||||
Stockton |
1,780 | — | (9 | ) | (61 | ) | (1,460 | ) | 250 | |||||||||||
Badger Creek |
3,762 | — | (3 | ) | — | 441 | 4,200 | |||||||||||||
Delta Person |
2,012 | (1,027 | ) | (738 | ) | — | (247 | ) | — | |||||||||||
Gregory |
5,236 | (1,807 | ) | 288 | (133 | ) | 6,827 | 10,411 | ||||||||||||
Koma Kulshan |
912 | — | 4 | (192 | ) | (528 | ) | 196 | ||||||||||||
Onondaga |
7,865 | — | 81 | (3 | ) | 11,693 | 19,636 | |||||||||||||
Orlando |
8,206 | (3,468 | ) | 16 | (306 | ) | (1,048 | ) | 3,400 | |||||||||||
Rumford |
2,395 | — | 2 | (187 | ) | 524 | 2,734 | |||||||||||||
Selkirk |
19,104 | (6,915 | ) | (3,403 | ) | (60 | ) | (695 | ) | 8,031 | ||||||||||
Topsham |
2,629 | (2,400 | ) | (193 | ) | — | (36 | ) | — | |||||||||||
Other |
801 | — | (151 | ) | (113 | ) | (137 | ) | 400 | |||||||||||
Total Other Project Assets Segment |
58,908 | (18,263 | ) | (7,377 | ) | (1,044 | ) | 17,034 | 49,258 | |||||||||||
Total all Segments |
174,689 | (48,026 | ) | (30,316 | ) | (2,178 | ) | 30,320 | 124,489 | |||||||||||
51
Reconciliation of Project Distributions (in thousands of U.S. dollars)
For the twelve months ended December 31, 2007
| (unaudited) |
Project Adjusted EBITDA |
Repayment of long-term debt |
Interest expense, net |
Capital expenditures |
Change in working capital & other items |
Project distribution received |
||||||||||||||
|---|---|---|---|---|---|---|---|---|---|---|---|---|---|---|---|---|---|---|---|---|
Reportable Segments |
||||||||||||||||||||
Auburndale |
— | — | — | — | — | — | ||||||||||||||
Chambers |
28,028 | (9,331 | ) | (11,549 | ) | (316 | ) | (264 | ) | 6,568 | ||||||||||
Lake |
28,042 | (574 | ) | 106 | (13,879 | ) | 11,755 | 25,450 | ||||||||||||
Pasco |
14,225 | (7,226 | ) | (395 | ) | (836 | ) | 6,267 | 12,035 | |||||||||||
Path 15 |
31,564 | (11,842 | ) | (11,217 | ) | — | (3,213 | ) | 5,292 | |||||||||||
Total Reportable Segments |
101,859 | (28,973 | ) | (23,055 | ) | (15,031 | ) | 14,545 | 49,345 | |||||||||||
Other Project Assets |
||||||||||||||||||||
Mid-Georgia |
5,587 | (2,411 | ) | (3,589 | ) | — | 413 | — | ||||||||||||
Stockton |
3,505 | — | (24 | ) | (391 | ) | 411 | 3,501 | ||||||||||||
Badger Creek |
4,109 | — | 43 | (192 | ) | (310 | ) | 3,650 | ||||||||||||
Delta Person |
2,255 | (935 | ) | (991 | ) | — | 762 | 1,091 | ||||||||||||
Gregory |
4,428 | (377 | ) | 364 | — | (4,415 | ) | — | ||||||||||||
Koma Kulshan |
1,196 | (925 | ) | (24 | ) | (271 | ) | 24 | — | |||||||||||
Onondaga |
21,966 | — | 54 | — | (3,070 | ) | 18,950 | |||||||||||||
Orlando |
8,337 | (3,980 | ) | (122 | ) | (132 | ) | (853 | ) | 3,250 | ||||||||||
Rumford |
2,585 | — | 32 | (291 | ) | 475 | 2,801 | |||||||||||||
Selkirk |
24,197 | (3,725 | ) | (3,810 | ) | — | (6,312 | ) | 10,350 | |||||||||||
Topsham |
2,031 | (1,625 | ) | (338 | ) | — | (68 | ) | — | |||||||||||
Other |
3,163 | (813 | ) | (218 | ) | (149 | ) | 4,405 | 6,388 | |||||||||||
Total Other Project Assets Segment |
83,359 | (14,791 | ) | (8,623 | ) | (1,426 | ) | (8,538 | ) | 49,981 | ||||||||||
Total all Segments |
185,218 | (43,764 | ) | (31,678 | ) | (16,457 | ) | 6,007 | 99,326 | |||||||||||
52
Project Operations Performance—Six months ended June 30, 2010 compared with six months ended June 30, 2009
Aggregate Project Adjusted EBITDA increased $2.2 million to $77.3 million in the six months ended June 30, 2010 from $75.1 million in the comparable 2009 period and included the following factors:
- •
- increased EBITDA at Chambers attributable to the non-recurrence of a planned major maintenance outage during
the six months ended June 30, 2009;
- •
- increased EBITDA at Auburndale due to increased contractual capacity payments under the projects PPA;
- •
- the absence of Stockton's loss during the first half of 2009 resulting from higher maintenance costs from a forced outage
during 2009. The Stockton project was sold in the fourth quarter of 2009;
- •
- the absence of EBITDA at Mid-Georgia as the project was sold in the fourth quarter of 2009;
- •
- the absence of EBITDA at Rumford in 2010 as the contract that provided substantially all of the project's cash flow
expired in the fourth quarter 2009; and
- •
- decreased EBITDA at Lake attributable to higher fuel expense due to natural gas purchases at higher prices than those under the supply contract that expired in June 2009. We have a hedging strategy to mitigate its future exposure to changes in natural gas prices. See "Quantitative and Qualitative Disclosures About Market Risk" for additional information.
Aggregate power generation for projects in operation at June 30, 2010 was 6.6% lower during the six-month period ended June 30, 2010 compared to the first half of 2009. Weighted average plant availability increased 3.9% over the same period in 2009. Generation during the first six months of 2010 compared to the prior year period was unfavorably impacted primarily by reduced dispatch at the Chambers and Selkirk projects due to lower power prices and the absence of Stockton and Mid-Georgia generation as the projects were sold in the fourth quarter of 2009, partially offset by increased generation at Lake due to favorable market conditions in the second quarter of 2009.
The project portfolio achieved a weighted average availability of 96.9% for the six months ended June 30, 2010 compared to 93.0% in the 2009 period. The increase in portfolio availability in the first half of 2010 was primarily due to the planned outages at Gregory and Chambers in the second half of 2009. Each of the projects with reduced availability was nevertheless able to achieve substantially all of its respective capacity payments as a result of contract terms that provide for certain levels of planned and unplanned outages.
Project Operations Performance—Year Ended December 31, 2009 vs. December 2008
Aggregate Project Adjusted EBITDA for the segments decreased $30.5 million, or 17%, to $144.2 million in 2009 from $174.7 million in 2008 and included the following factors:
- •
- increased EBITDA attributable to the acquisition of the Auburndale project in November 2008;
- •
- decreased EBITDA at Chambers attributable to lower levels of dispatch by the utility off-taker in connection
with reduced demand and lower natural gas and power prices in the region. Operating the plant at a lower capacity factor also decreased its efficiency, further contributing to reduced operating
margins. Additionally, decreased EBITDA attributable to a planned major outage at Chambers in the second quarter of 2009;
- •
- decreased EBITDA at Lake attributable to higher fuel expense resulting due to natural gas purchases at higher prices than those under the supply contract that expired in June 2009. We
53
- •
- decreased EBITDA at Pasco due to the commencement of the project's new ten-year tolling agreement on
January 1, 2009 at lower rates than the power purchase agreement that expired December 31, 2008; and
- •
- the absence of EBITDA at Onondaga as the contracts that provided substantially all of the project's cash flow expired in the second quarter of 2008.
have a hedging strategy to mitigate its future exposure to changes in natural gas prices. See "Quantitative and Qualitative Disclosures About Market Risk" for additional information;
Aggregate power generation for projects in operation at December 31, 2009 was 2.6% lower during 2009 as compared to 2008. Weighted average plant availability increased 1.1% over the same period. Generation during the twelve months of 2009 versus the prior years period was unfavorably impacted primarily by reduced dispatch at Chambers. This was due to low market prices and a planned major maintenance outage, offset by the acquisition of Auburndale in November 2008. Also contributing to the lower generation during the period was reduced generation at Pasco as a result of the expected lower dispatch under the new tolling agreement that went into effect on January 1, 2009, which was partially offset by increased generation at Orlando in 2009 due to its unscheduled outage in March 2008.
The project portfolio achieved a weighted average availability of 94.5% for 2009 versus 93.4% in 2008. The higher portfolio availability was primarily driven by the increased availability of Orlando versus the prior period resulting from the March 2008 unplanned outage as well as higher availability at Mid-Georgia due to a scheduled outage in April 2008, and the acquisition of Auburndale in November 2008, offset slightly by reduced availability at Chambers associated with a longer planned outage versus the prior period. Each of the projects with reduced availability was nevertheless able to achieve substantially all of its respective capacity payments as a result of contract terms that provide for certain levels of planned and unplanned outages.
Cash Flow from Operating Activities
Our cash flow from the projects may vary from year to year based on, among other things, changes in prices under the PPAs, fuel supply and transportation agreements, steam sales agreements and other project contracts, changes in regulated transmission rates, compliance with the terms of non-recourse project-level financing including debt repayment schedules, the transition to market or recontracted pricing following the expiration of PPAs, fuel supply and transportation contracts, working capital requirements and the operating performance of the projects. Project cash flows may have some seasonality and the pattern and frequency of distributions to us from the projects during the year can also vary.
Working capital includes trade receivables and payables at the projects.
Cash flow from operating activities increased by $5.5 million for the six months ended June 30, 2010 over the comparable period in 2009. The change from the prior year is primarily attributable to a significant decrease in cash interest expense as a result of our common share conversion in December 2009, which eliminated Cdn$348 million of outstanding subordinated notes. The positive change in operating cash flow attributable to the reduced interest expense was partially offset by a $4.5 million decrease in distributions from our Orlando project and no distributions in 2010 from our Selkirk project, both of which are equity method investments. The decrease in distributions from Orlando was the result of a one-time receipt of insurance proceeds in 2009 related to an unplanned outage that occurred in 2008. The Selkirk project is currently not making distributions to partners as a result of restrictions in its non-recourse project-level debt. We expect to resume receiving distributions from Selkirk in 2011. An increase in corporate general administrative expenses of $2.5 million also reduced operating cash flow in the six months ended June 30, 2010 compared to the first half of 2009.
54
Cash flow from operating activities decreased by $27.3 million for the year ended December 31, 2009 as compared to 2008. The changes from the prior period are consistent with and primarily attributable to the changes in Project Adjusted EBITDA described above. In addition, the $6.0 million payment in December 2009 under the terms of the management agreement termination reduced operating cash flow for the twelve months ended December 31, 2009.
Cash provided by operating activities for the year ended December 31, 2008 improved to $77.8 million compared to $58.1 million for the year ended December 31, 2007. Our improvement in cash provided by operating activities was primarily due to the addition of the Auburndale project acquired in November 2008, the acquisition of the additional 50% interest in Pasco in December 2007 as well as higher distributions from the Gregory project in 2008.
Cash Flow from Investing Activities
Cash flow from investing activities includes restricted cash. Restricted cash fluctuates from period to period in part because non-recourse project-level financing arrangements typically require all operating cash flow from the project to be deposited in restricted accounts and then released at the time that principal payments are made and project-level debt service coverage ratios are met. As a result, the timing of principal payments on project-level debt causes significant fluctuations in restricted cash balances, which typically benefits investing cash flow in the second and fourth quarters of the year and decreases investing cash flow in the first and third quarters of the year.
Cash flows used in investing activities for the six months ended June 30, 2010 were $1.9 million compared to $3.4 million for the six months ended June 30, 2009. We invested $3.0 million in Rollcast during the first quarter of 2009, compared to an additional $2.0 million investment in Rollcast during six months ended June 30, 2010. The cash consolidated in our balance sheet as a result of the additional investment in Rollcast was $2.5 million.
Cash flows provided by investing activities for the year ended December 31, 2009 were $25.0 million compared to cash flows used in investing activities of $128.6 million for the year ended December 31, 2008. We sold the assets of Mid Georgia in 2009 for proceeds of $29.1 million compared to no asset sales in 2008. In addition, we acquired Auburndale in 2008 for a total purchase price of $141.7 million compared to no acquisitions in 2009.
Cash flows used in investing activities for the year ended December 31, 2008 were $128.6 million compared to cash flows used in investing activities of $18.3 million for the year ended December 31, 2007. The change in cash flows from investing activities was primarily due to the acquisition of Auburndale in 2008, for a purchase price of $141.7 compared to the acquisition of the remaining 50% interest in the Pasco Project from our existing partners for $23.2 million in 2007. We also sold our equity investment in the Jamaica Project in 2007 for proceeds of $6.2 million compared to no asset sales in 2008.
Cash Flows from Financing Activities
Cash used in financing activities for the six months ended June 30, 2010 resulted in a net outflow of $20.7 million compared to a net outflow of $21.5 million for the same period in 2009. Although the total cash used in financing activities did not change significantly in the six months ended June 30, 2010 compared to the same period in the prior year, the 2010 period included an increase in dividends paid of approximately $20 million. We completed our common share conversion in November 2009. As a result, Cdn$348 million of subordinated notes were extinguished and our entire monthly distribution to shareholders is now paid in the form of a dividend as opposed to the monthly distribution being split between a subordinated notes interest payment and a common share dividend during the six months ended June 30, 2009. This increase in dividends paid was offset by the proceeds of $20 million from a
55
borrowing under our revolving credit facility that was used to partially fund our investment in Idaho Wind in July 2010.
Cash used in financing activities for the year ended December 31, 2009 resulted in a net outflow of $62.9 million compared to a net inflow of $38.4 million for the same period in 2008. Our significant cash flows from our 2009 and 2008 financing transactions are described below:
- •
- During the year ended December 31, 2009, we repaid $55 million previously borrowed under our revolving
credit facility that had been used to partially fund the acquisition of Auburndale in 2008.
- •
- During the year ended December 31, 2009, the cash used to repay project-level debt was lower compared to 2008 due
to the maturity of the Pasco debt in 2008.
- •
- During December 2009, we issued, in a public offering, Cdn$86.2 million aggregate principal amount of 6.25% convertible unsecured debentures for net proceeds of $78.3 million. The proceeds were partially used to redeem the remaining Cdn$40.7 million principal value of subordinated notes.
Cash used in financing activities for the year ended December 31, 2008 resulted in a net inflow of $38.4 million compared to a net outflow of $49.9 million for the same period in 2007. Our significant cash flows from our 2008 and 2007 financing transactions are described below:
- •
- In 2008, we acquired 100% of Auburndale. The purchase price was partially funded by a $55 million borrowing under
our credit facility and $35 million of project-level debt.
- •
- In 2007, we entered into a $48 million non-recourse term loan for the Path 15 project. This was the
permanent financing arrangement for the Path 15 project which was initially financed in 2006 by an $88 million acquisition credit facility. The acquisition credit facility was repaid in full in
2007 using $51 million of cash on hand and funds drawn on the credit facility.
- •
- In early 2007, proceeds from a 2006 financing were released from escrow and used to settle an obligation to redeem the non-controlling interest in Atlantic Holdings.
Cash Available for Distribution
Prior to our conversion to a common share structure, holders of our IPSs received monthly cash distributions in the form of interest payments on subordinated notes and dividends on common shares. Subsequent to the conversion, holders of common shares receive monthly cash distributions in the form of dividends on the new common shares. Dividends are paid at the discretion of our board of directors based on historical and projected cash available for distribution. Cash available for distribution decreased by $30.4 million for the year ended December 31, 2009 as compared to 2008 due primarily to the changes in cash flow from operating activities described above. In addition, project-level debt repayments were made at Auburndale, which was acquired in late 2008.
56
The table below presents our calculation of cash available for distribution for the six months ended June 30, 2010 and 2009 and the years ended December 31, 2009, 2008 and 2007 (in thousands of U.S. dollars, except as otherwise stated):
| |
Year ended December 31, | Six months ended June 30, |
||||||||||||||
|---|---|---|---|---|---|---|---|---|---|---|---|---|---|---|---|---|
| (unaudited) |
2009 | 2008 | 2007 | 2010 | 2009 | |||||||||||
Cash flows from operating activities(1) |
50,449 | 77,788 | 58,088 | 35,978 | 30,524 | |||||||||||
Project-level debt repayments |
(12,744 | ) | (22,275 | ) | (20,117 | ) | (9,141 | ) | (6,414 | ) | ||||||
Interest on IPS portion of Subordinated Notes(2) |
30,639 | 36,560 | 36,235 | — | 16,078 | |||||||||||
Purchases of property, plant and equipment |
(2,016 | ) | (1,102 | ) | (15,695 | ) | (1,520 | ) | (933 | ) | ||||||
Cash available for distribution(3) |
66,328 | 90,971 | 58,511 | 25,317 | 39,255 | |||||||||||
Interest on Subordinated Notes |
30,639 |
36,560 |
36,235 |
— |
16,078 |
|||||||||||
Dividends on Common Shares |
27,988 | 24,692 | 24,665 | 31,714 | 11,672 | |||||||||||
Total common share distributions |
58,627 | 61,252 | 60,900 | |||||||||||||
Payout ratio |
88 |
% |
67 |
% |
104 |
% |
125 |
% |
71 |
% |
||||||
Expressed in Cdn$ |
||||||||||||||||
Cash available for distribution |
75,673 | 97,102 | 62,814 | 26,187 | 47,320 | |||||||||||
Total common share distributions |
66,325 |
65,143 |
65,181 |
33,083 |
33,234 |
|||||||||||
- (1)
- Beginning
in the first quarter of 2010, changes in restricted cash in the consolidated statement of cash flows has been reported as an investing activity to
reflect the use of the restricted cash in the current period. In previous periods, changes in restricted cash were reported as cash flow from operating activities. The prior period amounts have been
reclassified to conform with the current year presentation. This reclassification does not impact the consolidated balance sheet or the consolidated statements of operations. We have changed the
classification of restricted cash because the revised presentation is more widely used by companies in our industry.
- (2)
- Prior
to the common share conversion on November 27, 2009, a portion of our monthly distribution to IPS holders was paid in the form of interest on
the subordinated notes comprising a part of the IPSs. Subsequent to the conversion, the entire monthly cash distribution is paid in the form of a dividend on our common shares.
- (3)
- Cash available for distribution is not a recognized measure under GAAP and does not have any standardized meaning prescribed by GAAP. Therefore, this measure may not be comparable to similar measures presented by other companies. See "Supplementary Non-GAAP Financial Information."
Liquidity and Capital Resources
Overview
Our primary source of liquidity is distributions from our projects and our revolving credit facility. A significant portion of the cash received from project distributions is used to pay dividends to our shareholders and interest on our outstanding convertible debentures. We may fund future acquisitions with a combination of cash on hand, the issuance of additional corporate debt or equity securities and the incurrence of privately-placed bank or institutional non-recourse operating level debt.
We believe that we will be able to generate sufficient amounts of cash and cash equivalents to maintain our operations and meet our obligations as they become due.
57
We do not expect any material unusual requirements for cash outflows in 2010 for capital expenditures or other required investments. In addition, there are no debt instruments with significant maturities or refinancing requirements in 2010. See "Outlook" above for information about changes in expected distributions from our projects in 2010.
Common Share Conversion and Dividend Policy
On November 24, 2009, our shareholders approved our conversion to a common share structure. Subsequent to the conversion, we have continued to maintain our business strategy and our current distribution levels. Each IPS has been exchanged for one new common share. Our entire current monthly cash distribution of Cdn$0.0912 per common share is being paid as a dividend on the new common shares. We expect to continue paying cash dividends in the future in amounts that are comparable to the dividends paid in 2009. Future dividends are paid at the discretion of our board of directors subject to our earnings and cash flow and are not guaranteed. The primary risk that impacts our ability to continue paying cash dividends at the current rate is the operating performance of our projects and their ability to distribute cash to us after satisfying project-level obligations.
Credit facility
We maintain a credit facility with a capacity of $100 million, $50 million of which may be utilized for letters of credit. The credit facility matures in August 2012.
In November 2008, we borrowed $55 million under the credit facility and used the proceeds to partially fund the acquisition of Auburndale. We executed an interest rate swap to fix the interest rate at 2.4% through November 2011 for the balance outstanding under this borrowing. In July 2009, $20 million of the outstanding borrowings under the credit facility was repaid with cash on hand. The remaining $35 million was repaid in November 2009 with cash proceeds from the sales of Mid-Georgia and Stockton and the interest rate swap to fix the interest at 2.4% through 2011 was terminated.
The credit facility bears interest at LIBOR plus an applicable margin between 1.50% and 3.25% that varies based on the credit statistics of one of our subsidiaries. As of June 30, 2010, the applicable margin was 1.50%. In November 2009, we amended the credit facility in order to facilitate the common share conversion. Under the terms of the amendment, we paid a fee of $250,000 and agreed to change the method of computing applicable margin on amounts outstanding under the credit facility.
As of June 30, 2010, $39.4 million was allocated, but not drawn, to support letters of credit for contractual credit support at seven of our projects. In June 2010, we borrowed $20 million under the credit facility and used the proceeds to partially fund the acquisition of IWP in July 2010.
We must meet certain financial covenants under the terms of the credit facility, which are generally based on the cash flow coverage ratios and also require us to report indebtedness ratios to our lenders. The facility is secured by pledges of assets and interests in certain subsidiaries. We expect to remain in compliance with the covenants of the credit facility for at least the next 12 months.
Convertible Debentures
On October 11, 2006, we issued, in a public offering, Cdn$60 million aggregate principal amount of 6.25% convertible secured debentures, which we refer to as the 2006 Debentures, for gross proceeds of $52.8 million. The 2006 Debentures pay interest semi-annually on April 30 and October 31 of each year. The 2006 Debentures initially had a maturity date of October 31, 2011. They are convertible into approximately 80.6452 common shares per Cdn$1,000 principal amount of 2006 Debentures, at any time, at the option of the holder, representing a conversion price of Cdn$12.40 per common share. The 2006 Debentures are secured by a subordinated pledge of our interest in certain subsidiaries and contain certain restrictive covenants.
58
In connection with our conversion to a common share structure on November 27, 2009, the holders of the 2006 Debentures approved an amendment to increase the annual interest rate from 6.25% to 6.50% and separately, an extension of the maturity date from October 2011 to October 2014.
On December 17, 2009, we issued, in a public offering, Cdn$75 million aggregate principal amount of 6.25% convertible debentures, which we refer to as the 2009 Debentures, for gross proceeds of $71.4 million. The 2009 Debentures pay interest semi-annually on March 15 and September 15 of each year beginning September 15, 2010. The 2009 Debentures mature on March 15, 2017 and are convertible into approximately 76.9231 common shares per Cdn$1,000 principal amount of 2009 Debentures, at any time, at the option of the holder, representing a conversion price of Cdn$13.00 per common share.
On December 24, 2009, the underwriters exercised their over-allotment option in full to purchase an additional Cdn$11.3 million aggregate principal amount of the 2009 Debentures.
A portion of the proceeds from the 2009 Debentures was used to redeem the remaining Cdn$40.7 million principal value of subordinated notes at 105% of the principal amount.
Project-level debt
The following table summarizes the maturities of project-level debt. The amounts represent our share of the non-recourse project-level debt balances at June 30, 2010 and exclude any purchase accounting adjustments recorded to adjust the debt to its fair value at the time the project was acquired. Certain of the projects have more than one tranche of debt outstanding with different maturities, different interest rates and/or debt containing variable interest rates. Project-level debt agreements contain covenants that restrict the amount of cash distributed by the project if certain debt service coverage ratios are not attained. As of June 30, 2010, the covenants at the Chambers, Selkirk and Delta Person projects are temporarily preventing those projects from making cash distributions to us. We expect these projects to resume cash distributions in 2011. All project-level debt is non-recourse to us and substantially all of the principal is amortized over the life of the projects' PPAs. The non-recourse holding company ("holdco") debt relating to our investment in Chambers is held at Epsilon Power Partners, our wholly-owned subsidiary. From January 1 to July 31, 2010, we have contributed approximately $2.7 million to Epsilon Power Partners for debt service payments on the holdco debt. We expect to make further contributions to Epsilon Power Partners ranging from $0.3 million to $0.9 million during the remainder of 2010 before it is expected to begin receiving distributions from Chambers in amounts that are adequate for servicing the holdco debt.
59
The range of interest rates presented represents the rates in effect at June 30, 2010. The amounts listed below are in thousands of U.S. dollars, except as otherwise stated.
| |
Range of Interest Rates |
Total Remaining Principal Repayments |
2010 | 2011 | 2012 | 2013 | 2014 | Thereafter | |||||||||||||||||
|---|---|---|---|---|---|---|---|---|---|---|---|---|---|---|---|---|---|---|---|---|---|---|---|---|---|
Consolidated Projects: |
|||||||||||||||||||||||||
Epsilon Power Partners |
8.4% | 36,982 | 500 | 1,500 | 1,500 | 3,000 | 5,000 | 25,482 | |||||||||||||||||
Path 15 |
7.9% - 9.0% | 157,608 | 3,740 | 7,987 | 8,667 | 9,402 | 8,065 | 119,747 | |||||||||||||||||
Auburndale |
5.1% | 26,600 | 4,900 | 9,800 | 7,000 | 4,900 | — | — | |||||||||||||||||
Total Consolidated Projects |
221,190 | 9,140 | 19,287 | 17,167 | 17,302 | 13,065 | 145,229 | ||||||||||||||||||
Equity Method Projects: |
|||||||||||||||||||||||||
Chambers |
0.4% - 7.2% | 80,571 | 5,526 | 11,294 | 12,176 | 10,783 | 5,780 | 35,012 | |||||||||||||||||
Delta-Person |
2.3% | 11,059 | 124 | 1,220 | 1,308 | 1,403 | 1,505 | 5,499 | |||||||||||||||||
Selkirk |
9.0% | 20,999 | 4,206 | 10,948 | 5,845 | — | — | — | |||||||||||||||||
Gregory |
2.1% - 7.5% | 15,217 | 934 | 1,901 | 2,044 | 2,205 | 2,385 | 5,748 | |||||||||||||||||
Total Equity Method Projects |
127,846 | 10,790 | 25,363 | 21,373 | 14,391 | 9,670 | 46,259 | ||||||||||||||||||
Total Project-Level Debt |
349,036 | 19,930 | 44,650 | 38,540 | 31,693 | 22,735 | 191,488 | ||||||||||||||||||
Restricted cash
The projects generally have reserve requirements to support payments for major maintenance costs and project-level debt service. For projects that are consolidated, our share of these amounts is reflected as restricted cash on the consolidated balance sheet. At December 31, 2009, restricted cash at the consolidated projects totaled $14.9 million.
Capital Expenditures
Routine and expected capital expenditures for the projects are generally made at the project level using project cash flows and project reserves. Therefore, the distributions that we receive from the projects are made net of capital expenditures needed at the projects. The projects in which we have investments generally consist of large capital assets that have established commercial operations. Ongoing capital expenditures for assets of this nature are generally not significant because most major expenditures relate to planned repairs and maintenance and are expensed when incurred. Capital expenditures in 2009 were approximately $2 million and we expect 2010 capital expenditures to also be approximately $2 million.
In 2009, several of the projects undertook planned outages to complete major maintenance work that prolonged the life and improved efficient and reliable operation of the assets. Major overhaul inspections were conducted during the period at Badger Creek, Chambers and Selkirk. The principal maintenance activity at Chambers was a major overhaul of the project's steam turbine. Selkirk conducted major overhaul inspections of two of its three gas turbines in 2009. Both Chambers and Selkirk have reserves that are funded from operating cash flow in anticipation of major maintenance expenditures. Reserve withdrawals cover a substantial portion of the actual maintenance costs. Typically, Selkirk is able to fully mitigate lost operating margin through the resale of natural gas not consumed.
Costs associated with the major gas turbine overhaul at Badger Creek are paid for by the operator of the plant based on a levelized operations and maintenance fee that the operator is paid by the project. Minor gas turbine inspections and overhauls were completed at Gregory and Auburndale. Both Gregory and Auburndale have long-term service agreements in place for their gas turbines with payments over time that cover a substantial portion of the overhaul cost. Gregory also funds a reserve
60
over time to cover certain maintenance expenditures. Each of the projects conducts maintenance activities during periods of the year when impacts to the project's margin on energy sales and contractual availability requirements can be minimized.
In 2010, several of the projects have planned outages to complete maintenance work. The level of maintenance and capital expenditures is reduced from 2009. In the second quarter, Selkirk completed a minor inspection of one of its combustion turbines, with costs and lost margin largely covered by reserves and gas resales proceeds, respectively. Selkirk's planned major overhaul of a steam turbine has been postponed to 2011 due to maintaining a high steam quality. At Orlando, a minor gas turbine inspection was completed in May. Auburndale is scheduled to conduct a minor inspection of one of the facility's combustion turbines, which is covered by its long-term service agreement, in conjunction with other maintenance work. Chambers completed its scheduled outage to inspect and complete customary repairs on one boiler. Due to the facility's low dispatch, the planned outage of its other boiler has been postponed to 2011.
Contractual Obligations and Commercial Commitments
The following table summarizes our contractual obligations as of December 31, 2009 (in thousands of U.S. dollars).
| |
Less than 1 Year |
1 - 3 Years | 3 - 5 Years | Thereafter | Total | |||||||||||
|---|---|---|---|---|---|---|---|---|---|---|---|---|---|---|---|---|
Debt(a) |
$ | 18,280 | $ | 36,454 | $ | 87,455 | $ | 227,294 | $ | 369,483 | ||||||
Interest payment on debt |
25,820 | 48,418 | 43,049 | 83,353 | 200,640 | |||||||||||
Total operating lease obligation(b) |
919 | 1,908 | 995 | 84 | 3,906 | |||||||||||
Total purchase obligations |
15,123 | 13,928 | 8,047 | 24,221 | 61,319 | |||||||||||
Total other long term liabilities |
— | 5,027 | — | 719 | 5,746 | |||||||||||
Total contractual obligations |
$ | 60,142 | $ | 105,735 | $ | 139,546 | $ | 335,671 | $ | 641,094 | ||||||
- (a)
- Debt
represents our consolidated share of project long-term debt. The amount presented excludes the net unamortized purchase price adjustment of
$12,030 related to the fair value of debt assumed in the Path 15 acquisition. Project debt is non-recourse to us and is generally amortized during the term of the respective revenue
generating contracts of the projects. The range of interest rates on long-term consolidated project debt at December 31, 2009 was 5.1% to 9.0%.
- (b)
- These lease payments are associated primarily with the lease of our headquarters office in Boston, MA which expires on March 31, 2015.
Off-Balance Sheet Arrangements
As of June 30, 2010, we had no off-balance sheet arrangements as defined in Item 303(a)(4) of Regulation S-K.
Critical Accounting Policies and Estimates
Accounting standards require information in financial statements about the risks and uncertainties inherent in significant estimates, and the application of generally accepted accounting principles involves the exercise of varying degrees of judgment. Certain amounts included in or affecting our consolidated financial statements and related disclosures must be estimated, requiring us to make certain assumptions with respect to values or conditions that cannot be known with certainty at the time our financial statements are prepared. These estimates and assumptions affect the amounts we report for our assets and liabilities, our revenues and expenses during the reporting period, and our disclosure of contingent assets and liabilities at the date of our financial statements. We routinely
61
evaluate these estimates utilizing historical experience, consultation with experts and other methods we consider reasonable in the particular circumstances. Nevertheless, actual results may differ significantly from our estimates and any effects on our business, financial position or results of operations resulting from revisions to these estimates are recorded in the period in which the facts that give rise to the revision become known.
In preparing our consolidated financial statements and related disclosures, examples of certain areas that require more judgment relative to others include our use of estimates in determining fair values of acquired assets, the useful lives and recoverability of property, plant and equipment and PPAs, the recoverability of equity investments, the recoverability of deferred tax assets and the fair value of derivatives.
For a summary of our significant accounting policies, see Note 2 to the accompanying consolidated financial statements included elsewhere in this prospectus. We believe that certain accounting policies are of more significance in our consolidated financial statement preparation process than others, which policies are discussed as follows.
Impairment of long-lived assets and equity investments
Long-lived assets, which include property, plant and equipment, transmission system rights and other intangible assets subject to depreciation and amortization, are reviewed for impairment whenever events or changes in circumstances indicate that the carrying amount of an asset may not be recoverable. If such assets are considered to be impaired, the impairment to be recognized is measured by the amount by which the carrying amount of the assets exceeds the fair value of the assets by factoring in the probability weighting of different courses of action available. Generally, fair value will be determined using valuation techniques such as the present value of expected future cash flows. We discount the estimated future cash flows associated with the asset using a single interest rate representative of the risk involved with such an investment or employ an expected present value method that probability-weights a range of possible outcomes. We also consider quoted market prices in active markets to the extent they are available. In the absence of such information, we may consider prices of similar assets, consult with brokers or employ other valuation techniques. We use our best estimates in making these evaluations. However, actual results could vary from the assumptions used in our estimates and the impact of such variations could be material.
Investments in and the operating results of 50%-or-less owned entities not required to be consolidated are included in the accompanying consolidated financial statements on the basis of the equity method of accounting. We review our investments in unconsolidated entities for impairment whenever events or changes in business circumstances indicate that the carrying amount of the investments may not be fully recoverable. Evidence of a loss in value that is other than temporary might include the absence of an ability to recover the carrying amount of the investment, the inability of the investee to sustain an earnings capacity which would justify the carrying amount of the investment, failure of cash flow coverage ratio tests included in project-level, non-recourse debt or, where applicable, estimated sales proceeds which are insufficient to recover the carrying amount of the investment. Our assessment as to whether any decline in value is other than temporary is based on our ability and intent to hold the investment and whether evidence indicating the carrying value of the investment is recoverable within a reasonable period of time outweighs evidence to the contrary.
When we determine that an impairment test is required, the future projected cash flows from the equity investment are the most significant factor in determining whether impairment exists and, if so, the amount of the impairment charges. We use our best estimates of market prices of power and fuel and our knowledge of the operations of the project and our related contracts when developing these cash flow estimates. In addition, when determining fair value using discounted cash flows, the discount rate used can have a material impact on the fair value determination. Discount rates are based on our
62
assessment of the risk of the cash flows in the estimate, including when applicable, the credit risk of the counterparty that is contractually obligated to purchase electricity or steam from the project.
We generally consider our investments in our equity method investees to be strategic long-term investments that comprise a significant portion of our core operating business. Therefore, we complete our assessments with a long-term view. If the fair value of the investment is determined to be less than the carrying value and the decline in value is considered to be other than temporary, an appropriate write-down is recorded based on the excess of the carrying value over the best estimate of fair value of the investment. The use of these methods involves the same inherent uncertainty of future cash flows as previously discussed with respect to undiscounted cash flows. Actual future market prices and project costs could vary from those used in our estimates and the impact of such variations could be material.
Fair Value of Derivatives
We utilize derivative contracts to mitigate our exposure to fluctuations in fuel commodity prices, foreign currency and to balance our exposure to variable interest rates. We believe that these derivatives are generally effective in realizing these objectives.
In determining fair value for our derivative assets and liabilities, we generally use the market approach and incorporate assumptions that market participants would use in pricing the asset or liability, including assumptions about market risk and/or the risks inherent in the inputs to the valuation techniques.
A fair value hierarchy exists for inputs used in measuring fair value that maximizes the use of observable inputs (Level 1 or Level 2) and minimizes the use of unobservable inputs (Level 3) by requiring that the observable inputs be used when available. Our derivative instruments are classified as Level 2. The fair value measurements of these derivative assets and liabilities are based largely on quoted prices from independent brokers in active markets who regularly facilitate our transactions. An active market is considered to have transactions with sufficient frequency and volume to provide pricing information on an ongoing basis.
Derivative assets are discounted for credit risk using credit spreads representative of the counterparty's probability of default. For derivative liabilities, fair value measurement reflects the nonperformance risk related to that liability, which is our own credit risk. We derive our nonperformance risk by applying credit spreads approximating our estimate of corporate credit rating against the respective derivative liability.
Certain derivative instruments qualify for a scope exception to fair value accounting, as they are considered normal purchases or normal sales. The availability of this exception is based upon the assumption that we have the ability and it is probable to deliver or take delivery of the underlying physical commodity. Derivatives that are considered to be normal purchases and normal sales are exempt from derivative accounting treatment and are recorded as executory contracts.
Income Taxes and Valuation Allowance for Deferred Tax Assets
In assessing the recoverability of our deferred tax assets, we consider whether it is more likely than not that some portion or all of the deferred tax assets will be realized. The ultimate realization of deferred tax assets is dependent upon projected future taxable income in the United States and in Canada and available tax planning strategies. As of December 31, 2009, we had recorded a valuation allowance of $67.1 million. This amount is comprised primarily of provisions against available Canadian and U.S. net operating loss carryforwards.
63
Recent Accounting Pronouncements
In June 2009, the Financial Accounting Standards Board ("FASB") approved the "FASB Accounting Standards Codification" as the single source of authoritative, nongovernmental GAAP as of July 1, 2009. The codification does not change current U.S. GAAP or how we account for our transactions or nature of related disclosures made; instead it is intended to simplify user access to all authoritative literature related to a particular topic in one place. All existing accounting standard documents will be superseded, and all other accounting literature not included in the codification will be considered non-authoritative. The codification is effective for interim and annual periods ending after September 15, 2009. The codification became effective for Atlantic Power beginning the quarter ending September 30, 2009 and did not have an impact in our balance sheet or results of operations for the year ended December 31, 2009.
In 2009, the FASB amended the consolidation guidance applied to variable interest entities ("VIEs"). This standard replaces the quantitative approach previously required to determine which entity has a controlling financial interest in a VIE with a qualitative approach. Under the new approach, the primary beneficiary of a VIE is the entity that has both (a) the power to direct the activities of the VIE that most significantly impact the entity's economic performance, and (b) the obligation to absorb losses of the entity, or the right to receive benefits from the entity, that could be significant to the VIE. This standard also requires ongoing reassessments of whether an entity is the primary beneficiary of a VIE and enhanced disclosures about an entity's involvement in VIEs. The standard is effective for fiscal years beginning after November 15, 2009. We do not expect this standard to have a material effect upon our financial statements.
In 2010, the FASB amended the Fair Value Measurements and Disclosures Topic of the codification to require additional disclosures about 1) transfers of Level 1 and Level 2 fair value measurements, including the reason for transfers, 2) purchases, sales, issuances and settlements in the roll-forward of activity in Level 3 fair value measurements, 3) additional disaggregation to include fair value measurement disclosures for each class of assets and liabilities and 4) disclosure of inputs and valuation techniques used to measure fair value for both recurring and nonrecurring fair value measurements. The amendment is effective for fiscal years beginning after December 15, 2009, except for the disclosures about purchases, sales, issuances and settlements in the roll-forward of activity in Level 3 fair value measurements, which is effective for fiscal years beginning after December 15, 2010. We do not expect this standard to have a material effect upon our financial statements.
We adopted the FASB's revised standard for business combinations on January 1, 2009. The provisions of the standard are applied prospectively to business combinations for which the acquisition date occurs after January 1, 2009. The standard requires an acquirer to recognize and measure in its financial statements the identifiable assets acquired, the liabilities assumed, and any noncontrolling interest in the acquiree at fair value at the acquisition date. It also recognizes and measures the goodwill acquired or a gain from a bargain purchase in the business combination and determines what information to disclose to enable users of an entity's financial statements to evaluate the nature and financial effects of the business combination. In addition, transaction costs are required to be expensed as incurred. This standard was further amended and clarified with regard to application issues on initial recognition and measurement, subsequent measurement and accounting, and disclosure of assets and liabilities arising from contingencies in a business combination. Our adoption of the standard did not have an impact on our results of operations, financial position, or cash flows.
In May 2009, the FASB issued a standard that incorporates the accounting and disclosure requirements related to subsequent events found in auditing standards into GAAP, effectively making management directly responsible for subsequent events accounting and disclosures. The standard also requires disclosure of the date through which subsequent events have been evaluated. The standard is effective for interim and annual reporting periods ending after June 15, 2009, and shall be applied prospectively. Our adoption of the standard did not have an impact on our results of operations, financial position, or cash flows.
64
In 2008, the FASB amended the disclosure requirements to improve financial reporting about derivatives and hedging activities. This standard became effective on January 1, 2009. We have adopted this standard as of January 1, 2009 and have adjusted our current disclosures accordingly.
In September 2006, the FASB issued a standard which provides enhanced guidance for using fair value measurements in financial reporting. While the standard does not expand the use of fair value in any new circumstance, it has applicability to several current accounting standards that require or permit entities to measure assets and liabilities at fair value. The standard defines fair value, establishes a framework for measuring fair value in GAAP and expands disclosures about fair value measurements. The impact of our adoption of this standard on January 1, 2008 resulted in a $25.2 million decrease to retained deficit.
In July 2006, the FASB issued an interpretation that requires a new evaluation process for all tax positions taken, recognizing tax benefits when it is more-likely-than-not that a tax position will be sustained upon examination by tax authorities. The benefit from a position that has surpassed the more-likely-than-not threshold is the largest amount of benefit that is more than 50% likely to be realized upon settlement. Differences between the amounts recognized in the statement of financial position prior to the adoption of the interpretation and the amounts reported after adoption are to be accounted for as an adjustment to the beginning balance of retained earnings. Our adoption of the standard did not have an impact on our results of operations, financial position, or cash flows.
Quantitative and Qualitative Disclosures About Market Risk
Market risk is the risk that changes in market prices, such as foreign exchange rates, interest rates and commodity prices, will affect our cash flows or the value of our holdings of financial instruments. The objective of market risk management is to minimize the impact that market risks have on our cash flows as described in the following paragraphs.
Our market risk sensitive instruments and positions have been determined to be "other than trading." Our exposure to market risk as discussed below includes forward-looking statements and represents an estimate of possible changes in fair value or future earnings that would occur assuming hypothetical future movements in fuel commodity prices, currency exchange rates or interest rates. Our views on market risk are not necessarily indicative of actual results that may occur and do not represent the maximum possible gains and losses that may occur, since actual gains and losses will differ from those estimated based on actual fluctuations in fuel commodity prices, currency exchange rates or interest rates and the timing of transactions.
Fuel Commodity Market Risk
Our current and future cash flows are impacted by changes in electricity, natural gas and coal prices. The combination of long-term energy sales and fuel purchase agreements are designed to mitigate the impacts to cash flows of changes in commodity prices by generally passing through changes in fuel prices to the buyer of the energy.
The Lake project's operating margin is exposed to changes in the market price of natural gas from the expiration of its natural gas supply contract on June 30, 2009 through the expiration of its PPA on July 31, 2013. The Auburndale project purchases natural gas under a fuel supply agreement which provides approximately 80% of the project's fuel requirements at fixed prices through June 30, 2012. The remaining 20% is purchased at market prices and therefore the project is exposed to changes in natural gas prices for that portion of its gas requirements through the termination of the fuel supply agreement and 100% of its natural gas requirements from the expiration of the fuel contract in mid-2012 until the termination of its PPA in 2013.
65
We have executed a strategy to mitigate the future exposure to changes in natural gas prices at Lake and Auburndale by periodically entering into financial swaps that effectively fix the price of natural gas required at these projects. These natural gas swaps are derivative financial instruments and are recorded in the consolidated balance sheet at fair value. Changes in the fair value of the natural gas swaps through June 30, 2009 were recorded in other comprehensive income (loss) as they were designated as a hedge of the risk associated with changes in market prices of natural gas. As of July 1, 2009, these natural gas swap hedges were de-designated and the changes in their fair value are recorded in change in fair value of derivative instruments in the consolidated statements of operations.
For the remainder of 2010, projected cash distributions at Auburndale would change by approximately $0.3 million per $1.00/Mmbtu change in the price of natural gas based on the current level of un-hedged and uncontracted natural gas volumes at the project. In 2010, projected cash distributions at Lake would change by approximately $0.5 million per $1.00/Mmbtu change in the price of natural gas based on the current level of unhedged natural gas volumes at the project.
Coal prices used in the revenue component of the projected distributions from the Lake and Auburndale projects incorporate a forecast of the applicable Crystal River facility coal cost provided by the utility based on their internal projections. The projected annual cash distributions from Lake and Auburndale combined would change by approximately $2.4 million for every $0.25/Mmbtu change in the projected price of coal.
The following tables summarize the hedge position related to natural gas needed to meet PPA requirements at Lake and Auburndale as of December 31, 2009 and as of August 12, 2010, including additional swaps executed during the first six months of 2010:
As of December 31, 2009
|
2010 | 2011 | 2012 | 2013 | |||||||||||
|---|---|---|---|---|---|---|---|---|---|---|---|---|---|---|---|
Portion of gas volumes currently hedged: |
|||||||||||||||
Lake: |
|||||||||||||||
Contracted |
— | — | — | — | |||||||||||
Financially hedged |
80 | % | 65 | % | 90 | % | 65 | % | |||||||
Total |
80 | % | 65 | % | 90 | % | 65 | % | |||||||
Auburndale: |
|||||||||||||||
Contracted |
80 | % | 80 | % | 40 | % | — | ||||||||
Financially hedged |
15 | % | 13 | % | 19 | % | 65 | % | |||||||
Total |
95 | % | 93 | % | 59 | % | 65 | % | |||||||
Average price of financially hedged volumes (per Mmbtu) |
|||||||||||||||
Lake |
$ | 7.11 | $ | 6.65 | $ | 6.90 | $ | 7.05 | |||||||
Auburndale |
$ | 6.30 | $ | 6.68 | $ | 6.67 | $ | 7.02 | |||||||
As of August 12, 2010
|
2010 | 2011 | 2012 | 2013 | |||||||||||
|---|---|---|---|---|---|---|---|---|---|---|---|---|---|---|---|
Portion of gas volumes currently hedged: |
|||||||||||||||
Lake: |
|||||||||||||||
Contracted |
— | — | — | — | |||||||||||
Financially hedged |
80 | % | 78 | % | 90 | % | 65 | % | |||||||
Total |
80 | % | 78 | % | 90 | % | 65 | % | |||||||
Auburndale: |
|||||||||||||||
Contracted |
80 | % | 80 | % | 40 | % | — | ||||||||
Financially hedged |
15 | % | 13 | % | 32 | % | 79 | % | |||||||
Total |
95 | % | 93 | % | 72 | % | 79 | % | |||||||
Average price of financially hedged volumes (per Mmbtu) |
|||||||||||||||
Lake |
$ | 7.11 | $ | 6.52 | $ | 6.90 | $ | 7.05 | |||||||
Auburndale |
$ | 6.30 | $ | 6.68 | $ | 6.51 | $ | 6.92 | |||||||
66
Foreign Currency Exchange Risk
We use forward foreign currency contracts to manage our exposure to changes in foreign exchange rates as we earn our income in the United States but pay dividends to shareholders in Canadian dollars. Since our inception, we have had an established hedging strategy for the purpose of reinforcing the long-term sustainability of our dividends. We have executed this strategy by entering into forward contracts to purchase Canadian dollars at fixed rates of exchange sufficient to make monthly distributions through December 2013 at the current annual dividend level of Cdn$1.094 per common share, as well as interest payments on the 2009 Debentures. Changes in the fair value of the forward contracts partially offset foreign exchange gains or losses on the U.S. dollar equivalent of our Canadian dollar obligations.
In addition to the forward contracts discussed above that settle on a monthly basis, we executed forward contracts to purchase Canadian dollars at fixed rates of exchange sufficient to make semi-annual payments on the 2006 Debentures. The contracts provide for the purchase of Cdn$1.9 million in April and in October of each year through 2011 at a rate of 1.1075 Canadian dollars per U.S. dollar. It is our intention to periodically consider extending the length of these forward contracts.
The foreign exchange forward contracts are recorded at estimated fair value based on quoted market prices and the estimation of the counter-party's credit risk. Changes in the fair value of the foreign currency forward contracts are reflected in foreign exchange (gain) loss in the consolidated statements of operations.
The following table contains the components of recorded foreign exchange (gain) loss for the periods indicated:
| |
Year ended December 31, | Six months ended June 30, |
|||||||||||||||
|---|---|---|---|---|---|---|---|---|---|---|---|---|---|---|---|---|---|
| |
2009 | 2008 | 2007 | 2010 | 2009 | ||||||||||||
Unrealized foreign exchange (gains) losses: |
|||||||||||||||||
Subordinated notes and convertible debentures |
$ | 55,508 | $ | (85,212 | ) | $ | 68,419 | $ | (2,505 | ) | $ | 17,635 | |||||
Forward contracts and other |
(31,138 | ) | 46,009 | (30,703 | ) | 7,704 | (8,005 | ) | |||||||||
|
24,370 | (39,203 | ) | 37,716 | 5,199 | 9,630 | |||||||||||
Realized foreign exchange gains on forward contract settlements |
(3,864 | ) | (8,044 | ) | (7,574 | ) | (2,767 | ) | (124 | ) | |||||||
|
$ | 20,506 | $ | (47,247 | ) | $ | 30,142 | $ | 2,432 | $ | 9,506 | ||||||
The following table illustrates the impact on our financial instruments of a 10% hypothetical change in the value of the U.S. dollar compared to the Canadian dollar as of June 30, 2010:
Convertible debentures |
$ | 13,738 | ||
Foreign currency forward contracts |
26,133 | |||
|
||||
Interest Rate Risk
The impact of changes in interest rates do not have a significant impact on cash payments that are required on our debt instruments as approximately 90% of our debt, including our share of the project-level debt associated with equity investments in affiliates, either bears interest at fixed rates or is financially hedged through the use of interest rate swaps.
We have executed interest rate swaps on the revolving credit facility and at our consolidated Auburndale project to economically fix a portion of their respective exposure to changes in interest rates related to variable-rate debt. The interest rate swap agreements were designated as a cash flow
67
hedge of the forecasted interest payments under the project-level Auburndale debt and the credit facility when they were executed in November 2008. The original interest rate swap expiration date for the Auburndale project-level debt was November 30, 2009. In November 2009, we executed a new interest rate swap designated as a cash flow hedge at Auburndale that expires on November 30, 2013. On November 30, 2009, we settled the interest rate swap on the revolving credit facility when the remaining outstanding balance on the credit facility was repaid. The remaining amount in accumulated other comprehensive income for this swap was recorded in the consolidated statements of operations.
In accounting for cash flow hedges, gains and losses on the derivative contracts are reported in other comprehensive income, outside "Net Income" reported in our consolidated statements of operations, but only to the extent that the gains and losses from the change in value of the derivative contracts can later offset the loss or gain from the change in value of the hedged future cash flows during the period in which the hedged cash flows affect net income. That is, for cash flow hedges, all effective components of the derivative contracts' gains and losses are recorded in other comprehensive income (loss), pending occurrence of the expected transaction. Other comprehensive income (loss) consists of those financial items that are included in "Accumulated other comprehensive loss" in our accompanying consolidated balance sheets but not included in our net income. Thus, in highly effective cash flow hedges, where there is no ineffectiveness, other comprehensive income changes by exactly as much as the derivative contracts and there is no impact on earnings until the expected transaction occurs.
After considering the impact of interest rate swaps, a hypothetical change in the average interest rate of 100 basis points would change annual interest costs, including interest at equity investments, by approximately $0.6 million.
68
BUSINESS
Overview
Atlantic Power Corporation is an independent power producer, with power projects located in major markets in the United States. Our current portfolio consists of interests in 12 operational power generation projects across eight states, one wind project under construction in Idaho, a 500 kilovolt 84-mile electric transmission line located in California, and six development projects in five states. Our power generation projects in operation have an aggregate gross electric generation capacity of approximately 1,823 megawatts (or "MW"), in which our ownership interest is approximately 808 MW.
The following map shows the location of our projects, including joint venture interests, across the United States:
We sell the capacity and power from our projects under PPAs with a variety of utilities and other parties. Under the PPAs, which have expiration dates ranging from 2010 to 2037, we receive payments for electric energy sold to our customers (known as energy payments), in addition to payments for electric generation capacity (known as capacity payments). We also sell steam from a number of our projects under steam sales agreements to industrial purchasers. The TSRs we own in our power transmission project entitle us to payments indirectly from the utilities that make use of the transmission line.
Our projects generally operate pursuant to long-term supply agreements, typically accompanied by fuel transportation arrangements. In most cases, the fuel supply and transportation arrangements correspond to the term of the relevant PPAs and most of the PPAs and steam sales agreements provide for the pass-through or indexing of fuel costs to our customers.
We partner with recognized leaders in the independent power business to operate and maintain our projects, including Caithness, Cogentrix and Western. Under these operation, maintenance and management agreements, the operator is typically responsible for operations, maintenance and repair services.
69
Atlantic Power Corporation is organized under the laws of the Province of British Columbia. Our registered office is located at 355 Burrard Street, Suite 1900, Vancouver, British Columbia, Canada V6C 2G8 and our headquarters are located at 200 Clarendon Street, Floor 25, Boston, Massachusetts, USA 02116. Our website is atlanticpower.com. Information contained on our website is not part of this prospectus.
We completed our initial public offering on the TSX in November 2004. At the time of our initial public offering, or IPO, our publicly traded security was an IPS, each of which was comprised of one common share and Cdn$5,787 principal value of 11% subordinated notes due 2016. On November 17, 2009, our shareholders approved a conversion from the IPS structure to a traditional common share structure. Each IPS has been exchanged for one new common share and each old common share that did not form part of an IPS was exchanged for approximately 0.44 of a new common share. Our shares trade on the TSX under the symbol "ATP" and began trading on the NYSE under the symbol "AT" on July 23, 2010.
History of Our Company
Atlantic Power Corporation is a Canadian corporation that was formed in 2004. The following timeline illustrates significant events in the development of our business since our initial public offering. Further details about these events are included below:
Atlantic Power History
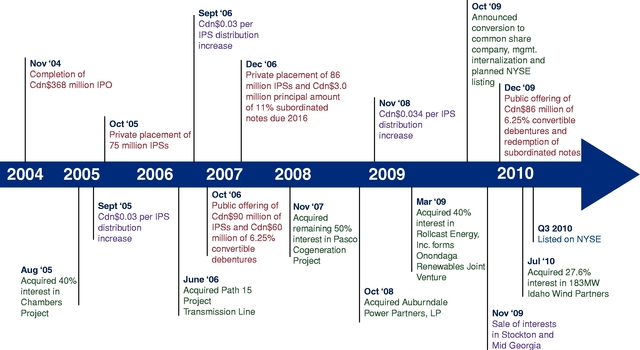
We used the proceeds from our IPO to acquire a 58% interest in Atlantic Power Holdings, LLC (now Atlantic Power Holdings, Inc., which we refer to herein as "Atlantic Holdings") from two private equity funds managed by ArcLight Capital Partners, LLC and from Caithness. Until December 31, 2009, we were externally managed by Atlantic Power Management, LLC, an affiliate of ArcLight. Under this external management arrangement, ArcLight provided administrative and office support services to us and was required to give us the opportunity to pursue investment opportunities that did not fit ArcLight's investment guidelines for its private equity funds. At the time of our IPO, Atlantic Holdings was granted a right of first offer related to ArcLight's interest in 11 power generating projects. Our acquisitions of a 40% interest in the Chambers project in 2005 and the Auburndale project in 2008 were completed under the terms of this right of first offer, which has since expired.
70
In August 2005, we acquired Epsilon Power Partners, LLC, which owns a 40% interest in the Chambers project, for approximately $63 million in cash and the assumption of $43 million in non-recourse debt.
In September 2006, we acquired 100% of the equity interests in Trans-Elect NTD Holdings Path 15, LLC (Path 15), which has since been renamed Atlantic Path 15 Holdings, LLC, which indirectly owns approximately 72% of the transmission system rights in the transmission line upgrade along the Path 15 transmission corridor located in central California. The purchase price was approximately $78.4 million.
In December 2006, we completed a private placement of 8,600,000 IPSs and Cdn$3.0 million principal amount of separate subordinated notes to three institutional investors. In February 2007, we used the net proceeds of the private placement to increase our ownership in Atlantic Holdings to 100%.
In December 2007, we increased our ownership interest in the Pasco project from 50% to 100%.
In November 2008, we acquired a 100% ownership interest in Auburndale Power Partners, L.P, which owns the Auburndale project for a purchase price of $139.9 million, subject to customary adjustments for working capital. The acquisition was funded with cash on hand, a $55 million borrowing under our credit facility and non-recourse acquisition debt of $35 million. The non-recourse acquisition debt associated with this transaction amortizes fully over the remaining term of the project's power purchase agreement.
In the first quarter of 2009, we transferred our remaining net interest in Onondaga Cogeneration Limited Partnership, at net book value, into a 50% owned joint venture, Onondaga Renewables, LLC, which is engaged in the redevelopment of the Onondaga project into a 40 MW biomass power plant.
In March 2009, we acquired a 40% equity interest in Rollcast Energy, Inc., a North Carolina corporation. Rollcast is a developer of biomass power plants in the southeastern U.S. with five, 50 MW projects in various stages of development. In March 2010, we agreed to invest $2.0 million to increase our ownership interest in Rollcast to 60%. Under the terms of the agreement, $1.2 million of the investment was made in March 2010 and the remaining $0.8 million was made in April 2010. As a result of this additional investment, we began to consolidate our investment in Rollcast beginning March 1, 2010. Pursuant to the terms of our investment in Rollcast, we have the option, but not the obligation, to invest directly in biomass power plants under development by Rollcast.
In October 2009, we agreed to pay ArcLight an aggregate of $15 million to terminate its management agreements with us, satisfied by a payment of $6 million on the termination date of December 31, 2009, and additional payments of $5 million, $3 million and $1 million on the respective first, second and third anniversaries of the termination date. In connection with the termination of the management agreements, we hired all of the then-current employees of Atlantic Power Management and entered into employment agreements with its officers.
In April 2010, Rollcast entered into a construction agreement for a 53.5 MW biomass project, known as Piedmont Green Power, to be located in Barnesville, Georgia. We are currently in advanced discussions that we expect will lead to our commitment to invest up to $75 million in the Piedmont Green Power project, representing substantially all of the equity interests in the project. We intend to use a sole arranger to syndicate project-level debt financing for Piedmont. Construction on the project is scheduled to begin in the third quarter of 2010. The Piedmont Green Power project has obtained a 20-year PPA with Georgia Power Company which includes an adjustment related to the cost of biomass fuel for the plant.
On July 2, 2010, we acquired a 27.6% equity interest in Idaho Wind Partners 1, LLC ("IWP" or "Idaho Wind") for approximately $40 million. IWP recently commenced construction of a 183 MW wind power project located near Twin Falls, Idaho, which is currently scheduled to be completed in late
71
2010 or early 2011. IWP has 20-year fixed-price PPAs with Idaho Power Company. Our investment in IWP was funded with cash on hand and a $20 million borrowing under our senior credit facility. Our investment in IWP will be accounted for under the equity method of accounting.
Our Competitive Strengths
- •
- Diversified Projects. Our power generation projects have an aggregate gross electric generation capacity of approximately 1,823 MW, and our net ownership interest in the electric generation capacity of these projects is approximately 808 MW. Our power generation projects are diversified by geographic location, electricity and steam customers, and project operators. These projects are generally located in the deregulated and more liquid electricity markets of New England, New York, Mid-Atlantic, California and Texas, or are located in regions of relatively high electricity demand growth such as Florida and New Mexico.
- •
- Strong Customer Base. Our customers are generally large
utilities, and other parties with investment-grade credit ratings. The largest customers of our power generation projects are Progress Energy Florida, Inc. ("PEF"), Tampa Electric Company
("TECO"), and Atlantic City Electric ("ACE"), which purchase approximately 40%, 15% and 11%, respectively, of the net electric generation capacity of our projects. No other electric customer purchases
more than 7% of the net electric generation capacity of our power generation projects.
- •
- Leading Third-Party Managers. Our power generation projects
rely on a number of different operators for their operation, which are generally recognized leaders in the independent power business. Affiliates of Caithness, Cogentrix and Babcock and Wilcox Power
Generation Group, Inc. operate projects representing approximately 49%, 21% and 9%, respectively, of the net electric generation capacity of our power generation projects. No other operator is
responsible for the operation of projects representing more than 8% of the net electric generation capacity of our power generation projects.
- •
- Stability of Project Cash Flow. Each of our power generation projects has been in operation for over ten years. Cash flows from each project are generally supported by energy sales contracts with investment-grade utilities and other sophisticated counterparties. We believe that each project's combination of PPA(s), fuel supply agreement(s) and/or commodity hedges help stabilize operating margins as fuel prices fluctuate.
Our power transmission project, known as the Path 15 project, is an 84-mile, 500-kilovolt transmission line built in order to alleviate north-south transmission congestion in California. It is a traditional rate-base asset whose revenues are regulated by the Federal Energy Regulatory Commission ("FERC") and is operated by Western, a U.S. Federal power agency.
Our Objectives and Business Strategy
Our objectives include maintaining the stability and sustainability of dividends to shareholders and to maximize the value of our company. In order to achieve these objectives, we intend to focus on enhancing the operating and financial performance of the projects and on pursuing additional acquisitions primarily in the electric power industry in the U.S. and Canada.
Organic Growth
We intend to enhance the operation and financial performance of our projects through:
- •
- optimization of commercial arrangements such as PPAs, fuel supply and transportation contracts, steam sales agreements, and operations and maintenance agreements;
72
- •
- achievement of improved operating efficiencies;
- •
- upgrade or enhancement of existing equipment or plant configurations; and
- •
- expansion of existing projects.
Successfully extending PPAs and fuel agreements may facilitate refinancings that provide capital to fund growth opportunities.
Extending PPAs Following Their Expiration
PPAs in our portfolio have expiration dates ranging from 2010 to 2037. In each case, we plan for expirations by evaluating various options in the market for maximizing project cash flows. New arrangements may involve responses to utility solicitations for capacity and energy, direct negotiations with the original purchasing utility for PPA extensions, arrangements with creditworthy energy trading firms for tolling agreements, full service PPAs or the use of derivatives to lock in value. We do not assume that pricing under existing PPAs will necessarily be sustained after PPA expirations, since most original PPAs included capacity payments related to return of and return on original capital invested and counterparties or evolving regional electricity markets may or may not provide similar payments under new or extended PPAs.
Acquisition and Investment Strategy
We believe that new electricity generation projects will be required in the United States and Canada over the next several years as a result of growth in electricity demand, transmission constraints and the retirement of older generation projects due to obsolescence or environmental concerns. There is also a very active secondary market for existing projects. We intend to expand our operations by making accretive acquisitions with a focus on power generation, transmission, distribution and related facilities in the United States and Canada. We may also invest in other forms of energy-related projects, utility projects and infrastructure projects, as well as additional investments in development stage projects or companies where the prospects for creating long-term predictable cash flows are attractive. Since the time of our initial public offering on the TSX in 2004, we have twice acquired the interest of another partner in one of our existing projects and will continue to look for such opportunities.
Our senior management has significant experience in the independent power industry and we believe the experience, reputation and industry relationships of our management team will provide us with enhanced access to future acquisition opportunities.
Acquisition Guidelines
We use the following general guidelines when reviewing and evaluating possible acquisitions:
- •
- each acquisition or investment should result in an increase in cash available for distribution to shareholders;
- •
- in the case of an acquisition of power generation facilities, facilities with long-term PPAs with major
electrical utilities or other creditworthy customers will be preferred; and, for facilities without such agreements, market electricity price assumptions used in acquisition evaluations will be
obtained from a recognized independent source; and
- •
- in the case of an acquisition of a power generation facility, the expected useful life of the facility and associated structures will, with regular maintenance, be long enough to conform with our objective of providing stable long-term dividends to shareholders.
73
Power Industry Overview
Historically, the North American electricity industry was characterized by vertically-integrated monopolies. During the late 1980s, several jurisdictions began a process of restructuring by moving away from vertically integrated monopolies toward more competitive market models. Rapid growth in electricity demand, environmental concerns, increasing electricity rates, technological advances and other concerns prompted government policies to encourage the supply of electricity from independent power producers.
In the independent power generation sector, electricity is generated from a number of sources, including natural gas, coal, water, waste products such as biomass (e.g., wood, wood waste, agricultural waste), landfill gas, geothermal, solar and wind. According to the North American Electric Reliability Council's Long-Term Reliability Assessment, published in December 2009, summer peak demand within the United States in the ten-year period from 2009 through 2018 is projected to increase 14.8%, while winter peak demand in Canada is projected to increase 8.8%.
The Non-Utility Power Generation Industry
Our 12 power generation projects are non-utility electric generating facilities that operate in the U.S. electric power generation industry. The electric power industry is one of the largest industries in the United States, generating retail electricity sales of approximately $365 billion in 2008, based on information published by the Energy Information Administration. A growing portion of the power produced in the United States is generated by non-utility generators. According to the Energy Information Administration, there were approximately 8,287 non-utility generators representing approximately 471 gigawatts of capacity in 2008, the most recent year for which data is available, (equal to 47% of total generating plants and 43% of nameplate capacity). Non-utility generators sell the electricity that they generate to electric utilities and other load-serving entities (such as municipalities and electric cooperatives) by way of bilateral contracts or open power exchanges. The electric utilities and other load-serving entities, in turn, generally sell this electricity to industrial, commercial and residential customers.
Based on our experience in the acquisition market since our IPO, as well as transactions we are currently evaluating for potential investment, we believe that an active secondary market for power generation projects will continue to provide us with meaningful acquisition and growth opportunities.
Our Power Projects
The following table outlines our portfolio of power generating and transmission assets in operation and under construction as of August 9 2010, including its interest in each facility. Management believes the portfolio is well diversified based on electricity and steam buyers, fuel type, regulatory jurisdictions and regional power pools, thereby partially mitigating exposure to market, regulatory or environmental conditions specific to any single region.
74
A corporate organizational chart, which includes all our operating and development projects, is included on the following page.
|
|
||||||||||||||||||||||
|---|---|---|---|---|---|---|---|---|---|---|---|---|---|---|---|---|---|---|---|---|---|---|
| Project Name |
Location (State) |
Type |
Total MW |
Economic Interest(1) |
Accounting Treatment(2) |
Net MW(3) |
Electricity Purchaser |
Power Contract Expiry |
Customer S&P Credit Rating |
|||||||||||||
|
|
||||||||||||||||||||||
Auburndale |
Florida | Natural Gas | 155 | 100.00 | % | C | 155 | PEF | 2013 | BBB+ | ||||||||||||
|
|
||||||||||||||||||||||
Lake |
Florida | Natural Gas | 121 | 100.00 | % | C | 121 | PEF | 2013 | BBB+ | ||||||||||||
|
|
||||||||||||||||||||||
Pasco |
Florida | Natural Gas | 121 | 100.00 | % | C | 121 | TECO | 2018 | BBB | ||||||||||||
|
|
||||||||||||||||||||||
Chambers |
New Jersey | Coal | 262 | 40.00 | % | E | 89 | (4) | ACE | 2024 | BBB | |||||||||||
|
|
||||||||||||||||||||||
|
16 | DuPont | 2024 | A | ||||||||||||||||||
|
|
||||||||||||||||||||||
Path 15 |
California | Transmission | N/A | 100.00 | % | C | N/A | California Utilities via CAISO(5) | N/A | (6) | BBB+ to A(7) | |||||||||||
|
|
||||||||||||||||||||||
Orlando |
Florida | Natural Gas | 129 | 50.00 | % | E | 46 | PEF | 2023 | BBB+ | ||||||||||||
|
|
||||||||||||||||||||||
|
19 | Reedy Creek Improvement District | 2013 | (8) | A(9) | |||||||||||||||||
|
|
||||||||||||||||||||||
Selkirk |
New York | Natural Gas | 345 | 17.70% | (10) | E | 14 | Merchant | N/A | N/R | ||||||||||||
|
|
||||||||||||||||||||||
|
47 | Consolidated Edison | 2014 | A- | ||||||||||||||||||
|
|
||||||||||||||||||||||
Gregory |
Texas | Natural Gas | 400 | 17.10 | % | E | 59 | Fortis Energy Marketing and Trading | 2013 | A- | ||||||||||||
|
|
||||||||||||||||||||||
|
9 | Sherwin Alumina | 2020 | NR | ||||||||||||||||||
|
|
||||||||||||||||||||||
Topsham(11) |
Maine | Hydro | 14 | 50.00 | % | E | 7 | Central Maine Power | 2011 | BBB+ | ||||||||||||
|
|
||||||||||||||||||||||
Badger Creek |
California | Natural Gas | 46 | 50.00 | % | E | 23 | Pacific Gas & Electric | 2011 | BBB+ | ||||||||||||
|
|
||||||||||||||||||||||
Rumford |
Maine | Coal/Biomass | 85 | 26.40 | % | E | 22 | Rumford Paper Co. | 2010 | N/R | ||||||||||||
|
|
||||||||||||||||||||||
Koma Kulshan |
Washington | Hydro | 13 | 49.80 | % | E | 6 | Puget Sound Energy | 2037 | BBB | ||||||||||||
|
|
||||||||||||||||||||||
Delta-Person |
New Mexico | Natural Gas | 132 | 40.00 | % | E | 53 | PNM | 2020 | BB- | ||||||||||||
|
|
||||||||||||||||||||||
Idaho Wind |
Idaho | Wind | 183 | 27.56 | % | E | 51 | Idaho Power Co. | 2030 | BBB | ||||||||||||
|
|
||||||||||||||||||||||
- (1)
- Except
as otherwise noted, economic interest represents the percentage ownership interest in the project held indirectly by Atlantic Power.
- (2)
- Accounting
Treatment: C—Consolidated; and E—Equity Method of Accounting (for additional details, see Note 2 of
the accompanying consolidated financial statements for the year ended December 31, 2009).
- (3)
- Represents
our interest in each project's electric generation capacity based on our economic interest.
- (4)
- Includes
separate power sales agreement in which the project and ACE share profits on spot sales of energy and capacity not purchased by ACE
under the base PPA.
- (5)
- California
utilities pay TACs to CAISO, who then pays owners of TSRs, such as Path 15, in accordance with its FERC approved annual revenue
requirement.
- (6)
- Path
15 is a FERC regulated asset with a FERC-approved regulatory life of 30 years: through 2034.
- (7)
- Largest
payers of fees supporting Path 15's annual revenue requirement are PG&E (BBB+), SoCal Ed (BBB+) and SDG&E (A). CAISO imposes minimum
credit quality requirements for any participants of A or better unless collateral is posted per CAISO imposed schedule.
- (8)
- Upon
the expiry of the Reedy Creek PPA, the associated capacity and energy will be sold to PEF.
- (9)
- Fitch
rating on Reedy Creek Improvement District bonds.
- (10)
- Represents
our residual interest in the project after all priority distributions are paid, which is estimated to occur in 2012.
- (11)
- We
own our interest in this project as a lessor.
- (12)
- Project currently under construction and is expected to be completed in late 2010 or early 2011.
75
The following corporate organization chart includes all of our operating and development projects:
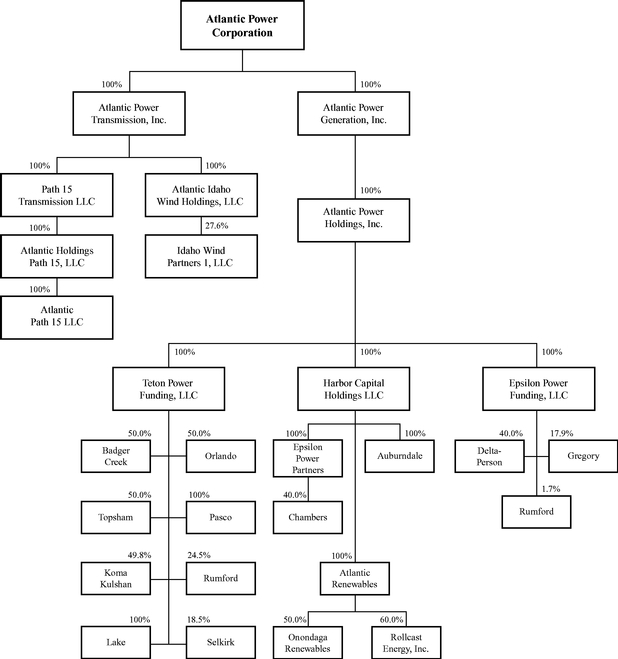
Our projects are organized into the following six business segments:
• Auburndale |
• Chambers |
|
• Lake |
• Path 15 |
|
• Pasco |
• Other Project Assets |
Auburndale Segment
General Description
The Auburndale Segment consists of a 155 MW dual-fired (natural gas and oil), combined-cycle, cogeneration plant located in Polk County, Florida, which commenced operations in July 1994. We own 100% of the Auburndale project, which is a "qualifying facility" (or "QF") under the rules promulgated
76
by FERC. We acquired Auburndale from ArcLight Energy Partners Fund I, L.P. and Calpine Corporation in a transaction that was completed on November 21, 2008.
Auburndale is located on an 11-acre site in the City of Auburndale, Florida. Capacity and energy from the project is sold to PEF under three PPAs expiring at the end of 2013. Auburndale typically operates as a mid-merit generator, which means that it is called upon by PEF to run during periods of peak electricity demand on most weekdays and occasionally during periods of lower electricity demand. Steam is supplied to Florida Distillers Company and Cutrale Citrus Juices USA, Inc. The Florida Distillers steam agreement is renewed annually, and the Cutrale Citrus Juices steam agreement expires in 2013.
Auburndale has non-recourse debt outstanding of $26.6 million as of June 30, 2010 which is required to be fully amortized over the term of its PPAs expiring in 2013. See "Project-Level Debt" on page 59 of this prospectus for additional details. Atlantic Power has provided letters of credit in the total amount of $13.4 million to support certain Auburndale obligations: $5.5 million to support its debt service reserve, $4.4 million to support its PPA, and $3.5 million to support its fuel supply agreement.
Power Purchase Agreement
Auburndale sells electricity to PEF under three PPAs each of which expires on December 31, 2013. Under the largest of the PPAs, Auburndale sells 114 MW of capacity and energy. An additional 17 MW of committed capacity is sold under two identical 8.5 MW agreements with PEF. Revenue from the sale of electricity under the three PPAs consists of capacity payments based on a fixed schedule of prices, and energy payments. Capacity payments under the largest PPA are dependent on the plant maintaining a minimum on-peak capacity factor of 92 percent on a rolling twelve-month average basis. On-peak capacity factor refers to the ratio of actual electricity generated during periods of peak demand to the capacity rating of the plant during such periods. The project has achieved the minimum on-peak capacity factor continuously since commercial operation. Capacity payments under the smaller two agreements are dependent on the project maintaining a minimum on-peak capacity factor of 70 percent. Energy payments under the largest PPA are comprised of a fuel component based on the delivered cost of coal at two PEF-owned coal-fired generating stations and a component intended to recover operating and maintenance costs. Energy payments under the smaller two agreements are based on the lesser of PEF's actual avoided energy cost or an energy price index based on the delivered fuel cost at a specific coal-fired power plant owned by TECO.
Steam Sales Agreement
Auburndale provides steam to Florida Distillers and Cutrale Citrus Juices under two separate steam purchase agreements. The Florida Distillers agreement automatically extends on an annual basis, and can be terminated by either party with 90 days notice. The Cutrale Citrus Juices agreement terminates on December 31, 2013 and contains automatic two-year renewal terms.
Fuel Supply Arrangements
Auburndale receives the majority of its required natural gas through a gas supply agreement with El Paso Merchant Energy, L.P. that expires on June 30, 2012. Under the agreement, El Paso provides a fixed amount of gas on a daily basis. The gas price is based on a fixed schedule of prices that escalate annually and is below current market prices. At historic utilization rates, the gas supplied under the El Paso contract has accounted for approximately 80% of the gas required by the project under its PPA commitments and the remaining required fuel is purchased at spot prices.
The required natural gas for the project is delivered through firm gas transportation agreements with Central Florida Gas Company ("Florida Gas") and Florida Gas Transmission Company and is transported through the gas distribution system owned by Peoples Gas Transmission, Inc. ("Peoples
77
Gas"). The gas transportation agreements are co-terminus with the PPAs, expiring on December 31, 2013.
Operations & Maintenance
The Auburndale project is operated and maintained by an affiliate of Caithness. In 2006, Auburndale entered into a maintenance agreement with Siemens Energy, Inc. for the long-term supply of certain parts, repair services and outage services related to the gas turbine. The term of the maintenance agreement is dependent on the timing of completion of a certain number of maintenance inspections and is expected to expire in late 2012.
Auburndale entered into an agreement with TECO to transmit electric energy from the project to PEF. The agreement expires in 2024, unless extended as provided for in the agreement. Auburndale's cost for these services is based on a contractual formula derived from TECO's cost of providing such services.
Factors Influencing Project Results
Auburndale derives a significant portion of its revenue through capacity payments received under the PPAs with PEF. In the event the project's on-peak capacity factor falls below a specified level, capacity payments will be adjusted downward or terminated altogether. Since it began commercial operation, the project has received full capacity payments.
During the term of the gas supply agreement, approximately 80% of the natural gas required to fulfill the project's PPAs is purchased at fixed prices. The remainder of the natural gas is purchased on the spot market. As a result, the project's operating margin is exposed to changes in spot market natural gas prices because the PPAs do not pass through those price changes to PEF. In order to mitigate this risk, Auburndale has entered into a series of financial swaps that effectively fix the price of natural gas to be purchased.
The following table summarizes the hedge position related to natural gas requirements to satisfy Auburndale's PPAs as of August 12, 2010:
| |
2010 | 2011 | 2012 | 2013 | ||||||||||
|---|---|---|---|---|---|---|---|---|---|---|---|---|---|---|
Amount of gas volumes currently hedged: |
||||||||||||||
Contracted at fixed prices |
80 | % | 80 | % | 40 | % | 0 | % | ||||||
Financially hedged with swaps |
15 | % | 13 | % | 32 | % | 79 | % | ||||||
Total |
95 | % | 93 | % | 72 | % | 79 | % | ||||||
Average price of financially hedged volumes (per Mmbtu)(US$) |
$ |
6.30 |
$ |
6.68 |
$ |
6.51 |
$ |
6.92 |
||||||
We will continue to periodically analyze whether to execute further hedge transactions intended to mitigate natural gas price exposure at Auburndale through the expiration of the PPAs with PEF.
The energy portion of Auburndale's revenue under the largest PPA with PEF is impacted by changes in the price of coal purchased by two power plants in Florida owned by PEF. Because these power plants purchase a significant portion of their coal through contracts of varying lengths, the price of coal burned at those plants is not directly correlated with changes in spot coal prices. Accordingly, changes in the price of coal procured by these two power plants will impact Auburndale's energy revenue.
78
Lake Segment
General Description
The Lake Segment consists of a 121 MW dual-fuel, combined-cycle QF cogeneration plant located in Florida, which began commercial operation in July 1993. We own 100% of the Lake project. In late 2007, the existing combustion turbines at the facility were upgraded to increase their efficiency by approximately 4% and output from 110 MW to 121 MW.
The Lake project is located on a 16-acre site at a citrus processing facility in Umatilla, Florida. Lake sells all of its capacity and electric energy to PEF under the terms of a PPA expiring in July 2013. The project is operated as a mid-merit facility typically running during 11 peak hours daily. Steam is sold to Citrus World, Inc. for use at its citrus processing facility and is also used to make distilled water in distillation units.
The Lake project does not have any debt outstanding. Atlantic Power has provided a $4.3 million letter of credit in favor of PEF to support the Lake project's obligations under its PPA.
Power Purchase Agreement
Electricity is sold to PEF pursuant to a PPA that expires on July 31, 2013. Revenues from the sale of electricity consist of a fixed capacity payment and an energy payment. Capacity payments are subject to the project maintaining a capacity factor of at least 90% during on-peak hours (11 hours daily), on a 12-month rolling average basis. Lake is subject to reductions in its capacity payment should it not achieve the 90% on-peak capacity factor. The project generally has achieved the minimum on-peak capacity factor continuously since commercial operation. Energy payments are comprised of a fuel component based on the cost of coal consumed at two PEF-owned coal-fired generating stations, a component intended to recover operations and maintenance costs, a voltage adjustment and an hourly performance adjustment. During off-peak hours, energy payments are made in accordance with a prescribed formula based on the price of natural gas, although Lake usually does not operate during off-peak hours.
Steam Sales Agreement
The Lake project provides steam to Citrus World under a steam purchase agreement that expires in 2013. The project also supplies steam to an affiliate that uses steam to make distilled water, which is sold to unaffiliated third parties.
Fuel Supply Arrangements
The natural gas requirements for the facility are provided by Iberdrola Renewables, Inc. and TECO Gas Services, Inc. ("TGS"). Both the Iberdrola and TGS agreements contain market index based prices, commenced on July 1, 2009 and expire on July 31, 2013.
Natural gas is transported to the project from supply points in Texas, Louisiana and Mississippi to Florida under contracts with Peoples Gas System, Inc.
Operations & Maintenance
The Lake project is operated and maintained by an affiliate of Caithness.
Lake also has a contractual services agreement and a lease engine agreement in place with General Electric (or "GE"). The contractual services agreement provides for planned and unplanned maintenance on the two gas turbines at the plant. The lease engine agreement provides temporary replacement gas turbines to Lake to support operations when the Lake turbines require significant maintenance.
79
Factors Influencing Project Results
The Lake project derives a significant portion of its operating margin through capacity revenues received under the PPA with PEF. In the event the facility's on-peak capacity factor falls below a specified level, capacity payments will be adjusted downward, although the project has rarely experienced such reductions. During the term of the current gas supply agreement, effective July 1, 2009, Lake's operating margins are exposed to changes in natural gas prices through the end of the PEF PPA in 2013. As a result, we have entered into a series of financial swaps that effectively fix the price of natural gas supplied to Lake thereby reducing fuel price risk.
The following table summarizes the volumes hedged relative to natural gas requirements under Lake's PPA as of August 12, 2010:
| |
2010 | 2011 | 2012 | 2013 | ||||||||||
|---|---|---|---|---|---|---|---|---|---|---|---|---|---|---|
Amount of gas volumes currently hedged: |
||||||||||||||
Contracted at fixed prices |
0 | % | 0 | % | 0 | % | 0 | % | ||||||
Financially hedged with swaps |
80 | % | 78 | % | 90 | % | 65 | % | ||||||
Total |
80 | % | 78 | % | 90 | % | 65 | % | ||||||
Average price of financially hedged volumes (per Mmbtu)(US$) |
$ |
7.11 |
$ |
6.52 |
$ |
6.90 |
$ |
7.05 |
||||||
We will continue to analyze whether to execute further hedge transactions to mitigate natural gas price exposure at Lake through expiration of the PPA with PEF.
The energy portion of Lake's revenue under the PPA with PEF is impacted by changes in the price of coal used by two of their power plants in Florida. Because these power plants secure a significant portion of their coal through contracts of varying lengths, the price of coal burned at those plants does not move in tandem with changes in spot coal prices.
The energy payment under the PPA includes a performance adjustment. For energy deliveries in excess of contracted capacity to PEF during on-peak periods in which the system price for energy exceeds the PPA energy rate, the project receives the then as-available energy rate, determined according to regulatory methodology. Conversely, when the project is not available and is dispatched by PEF, the project incurs negative performance adjustment charges corresponding to the difference between the then as-available energy rate and the PPA energy rate.
Pasco Segment
General Description
The Pasco Segment consists of the 100% owned Pasco project, a 121 MW dual fuel, combined-cycle, cogeneration plant located in Dade City, Florida, which began commercial operations in 1993 as a QF. With the expiration of the original PPA with PEF in 2008, and the commencement of the tolling agreement with TECO in 2009, Pasco self-certified with the FERC as an exempt wholesale generator and was no longer required to maintain QF status. The project owns the 2.7 acre site approximately 45 miles north of Tampa, Florida.
Power Purchase Agreement
Electricity is sold to TECO pursuant to a tolling agreement that commenced on January 1, 2009 and expires on December 31, 2018. Under the tolling agreement, TECO purchases the project's capacity and conversion services. Pasco converts fuel supplied by a TECO affiliate into electricity. Revenues consist of capacity payments, start-up charges, variable payments based on the amount of electricity generated and heat rate bonus payments based on the actual efficiency of the plant versus
80
the contract efficiency. Atlantic Power has provided a $10 million letter of credit in favor of TECO to support the project's obligations under the tolling agreement.
In exchange for obtaining the right to sell any potential excess emissions allowances from the plant, TECO accepted financial responsibility for any costs associated with additional allowances required and changes to environmental laws, including state or federal carbon legislation.
Fuel Supply Arrangements
Under the terms of the tolling agreement, TECO is responsible for the fuel supply and is financially responsible for fuel transportation to the project.
Operations & Maintenance
The Pasco project is operated and maintained by an affiliate of Caithness.
Pasco also has a services agreement and a lease engine agreement in place with GE. The services agreement provides for discounts for planned and unplanned maintenance on the project's two natural gas turbines, and commits the project to use GE for gas turbine maintenance activities. Under the lease engine agreement, GE rapidly provides temporary replacement natural gas turbines to the project to support operations when the project's turbines are removed from the site for significant maintenance.
Factors Influencing Project Results
The Pasco project derives the majority of its revenues under the tolling agreement with TECO through capacity payments. In the event the project does not maintain certain levels of availability, the capacity payments will be reduced. Based on historical performance, we expect the project to continue to exceed the availability requirement of 93% in the summer and 90% in the winter. A portion of the project's operating margin is based on three variable payments from TECO, consisting of a variable operation and maintenance charge, a start charge and a heat rate bonus. As a result, the project achieves a variable margin during periods of operation; and as a result, the level of variable margin is impacted by how often the plant is called on to produce electricity.
Chambers Segment
General Description
The Chambers Segment consists of our 40% equity investment in the Chambers project, a 262 MW pulverized coal-fired cogeneration facility located at the E.I. du Pont de Nemours and Company Chambers Works chemical complex near Carney's Point, New Jersey, which began commercial operation in March 1994 as a QF. Affiliates of Goldman Sachs Group, Inc. and Energy Investors Funds, an established private equity fund manager that invests in the U.S. energy and electric power sector, in the aggregate hold 60% of the general partner interests. Chambers sells electricity to ACE under two separate power purchase agreements, a "Base PPA" and a power sales agreement. Historically, the project has operated as a baseload plant, however, during periods of low energy market pricing, the facility has run at partial or minimum load. Steam and electricity are sold to DuPont pursuant to an energy services agreement. The project site is leased from DuPont. Under the terms of the ground lease, DuPont has a right to purchase the project within 60 days of the lease expiration in 2024, or upon earlier termination of the lease, at fair market value.
81
Chambers financed the construction of the project with a combination of term debt due March 31, 2014 and New Jersey Economic Development Authority bonds due July 1, 2021. The term loan is expected to amortize over its remaining term, while the bonds are repayable at maturity. Both are non-recourse to Atlantic Power. Our 40% share of the total debt outstanding at the Chambers project as of June 30, 2010 is $80.6 million. See "Project-Level Debt" on page 59 of this prospectus for additional details.
Epsilon Power Partners, L.P., our wholly-owned subsidiary, directly owns our interest in Chambers. Epsilon has outstanding debt of $37.0 million as of June 30, 2010 which fully amortizes by its final maturity in 2019 and is non-recourse to Atlantic Power. See "Project-Level Debt" on page 59 of this prospectus for additional details.
Power Purchase Agreements
Base PPA
The 30-year term of the Base PPA with ACE expires in 2024. ACE has agreed to purchase 184 MW of capacity and has dispatch rights for energy of up to 187.6 MW during the summer season (May 1 to October 31) and 173.2 MW during the winter season (November 1 to April 30). The project must be available to deliver power to ACE at 90% of the average availability rate of a specific group of mid-Atlantic generating stations. Capacity prices are determined using a fixed price with a capacity factor adjustment. The energy payment under the Base PPA is divided between on-peak and off-peak periods and linked to a coal index that is identical to the project's coal supply contract escalation provisions. Chambers is guaranteed a minimum energy payment equivalent to 3,500 hours of operation per contract year, whether or not it has dispatched that many hours, provided the project is available for energy production for at least 3,500 hours during the course of the contract year.
DuPont Energy Services Agreement
DuPont purchases all its electrical needs for its Chambers Works chemical complex from the Chambers project, subject to a peak requirement of 40 MW, under the energy services agreement. The initial term of the agreement expires in 2024 but will continue thereafter unless terminated by at least 36 months prior written notice. The electricity sold under the agreement contains a fixed price, which is adjusted quarterly by the lesser of either: (i) the price of coal delivered to the facility; and (ii) the change in ACE's average retail rate.
In December 2008, Chambers filed suit against DuPont for breach of the energy services agreement related to unpaid amounts associated with disputed price change calculations for electricity. DuPont subsequently filed a counterclaim for an unspecified level of damages. In the event the dispute cannot be resolved through settlement, a trial is expected in the second half of 2010. We do not believe that the outcome of this litigation will have a material impact on Atlantic Power.
Power Sales Agreement
Energy generated at the Chambers project in excess of amounts delivered to ACE under the Base PPA and to DuPont is sold to ACE under a separate power sales agreement. Under this agreement, energy that ACE does not find economically attractive at the Base PPA's energy rate, but which may be cost effective to sell into the spot market ("Undispatched Energy"), may be self-scheduled by the project to capture additional profits. Margins on Undispatched Energy sales are shared between ACE (40%) and the project (60%). Energy not committed to ACE under the Base PPA and not called upon by DuPont under the energy services agreement may also be sold into the market under a similar margin sharing arrangement with ACE (30% to ACE and 70% to Chambers). The agreement also provides for the sale by Chambers into the market of capacity not contracted under the Base PPA pursuant to the same margin sharing arrangement with ACE (30% to ACE and 70% to Chambers).
82
The power sales agreement expired in July 2010 and we entered into a one-month extension in order to negotiate the terms of a new power sales agreement.
Steam Sales Agreement
Some of the steam generated at the Chambers project is sold to DuPont under the energy services agreement, which expires in 2024, but will continue in effect thereafter unless terminated by either party on at least 36 months prior notice. The agreement requires steam to be provided to DuPont up to the peak steam requirement levels that vary throughout the year. DuPont may purchase steam in excess of the peak steam requirement from any third party, subject to Chambers' right of first refusal to provide steam at the same price. Subject to certain conditions, DuPont has the option to construct and operate its own steam generation facility after 2014. DuPont is required to purchase a minimum quantity of steam necessary for the project to maintain its status as a QF. The steam price is subject to quarterly adjustments based on the price of coal delivered to the project. DuPont has the option in certain circumstances to take over operation of the steam facility in the event of prolonged failure to deliver steam.
Fuel Supply Arrangements
Coal is supplied to the Chambers project pursuant to a coal purchase agreement with Consol Energy Inc. ("Consol"), which expires in 2014 and is subject to a five to ten-year renewal based on good faith negotiations. The agreement governs the sale of coal (including transportation) to the project and the disposal of related ash. Consol is obligated to supply the entire coal requirements for the project, which may include stockpiling. The price escalator under the Base PPA with ACE uses the same index as the coal supply agreement (average coal cost of 25 mid-Atlantic region coal power plants), effectively passing through changes in coal prices to ACE.
Operations & Maintenance
Operations and maintenance of the Chambers project is performed pursuant to an agreement with Cogentrix, which expires in April 2014. Thereafter, the agreement will be automatically renewed for periods of five years until terminated by either party on six months notice. Cogentrix is paid a base annual fee in addition to cost reimbursement. Cogentrix is also eligible for performance fees based on facility net availability, efficiency and excess energy optimization, and is eligible for an additional management performance bonus. The majority owner of the project is currently in the process of transferring management services from Cogentrix to Power Plant Management Services. We expect this transition to be complete in late August 2010.
Regional Greenhouse Gas Initiative
With New Jersey's implementation of the RGGI on January 1, 2009, the Chambers project was required to obtain carbon dioxide ("CO2") allowances in an amount corresponding to the CO2 emissions of the facility. Previously in 2008, the State of New Jersey passed legislation that provided for the sale of CO2 allowances at the price of $2.00 per allowance to certain generating facilities which were certified by the New Jersey Department of Environmental Protection ("NJDEP"). Chambers received this certification from the NJDEP in late 2009. Earlier in 2009, the project purchased approximately 480,000 allowances through the quarterly RGGI auctions and broker purchases. In December 2009, Chambers purchased 2.1 million allowances from the NJDEP at the price of $2 per allowance. A portion of the NJDEP purchase, in combination with the previously purchased allowances, satisfies the project's RGGI compliance requirements for 2009. The remainder of the 2009 NJDEP allowance purchase will be used to meet the 2010 requirements along with 2010 NJDEP allowance purchases.
83
Factors Influencing Project Results
The Chambers project derives a significant portion of its operating margin through capacity revenues received under the Base PPA. In the event the facility does not maintain a minimum level of availability under the Base PPA, the project's capacity payments from ACE would be reduced or eliminated, although it has never experienced such a reduction. Energy sales under the Base PPA are expected to generate positive margins due to the effective hedging of energy prices and coal costs through the use of identical indexing in the energy payment under the Base PPA and the coal prices under the coal supply contract. While the indexing is identical, adjustments to the energy price under the Base PPA occur annually, whereas coal price adjustments occur quarterly.
During periods of low spot market electricity prices, energy sales margins may be negatively impacted due to the pricing structure under the Base PPA and power sales agreement. ACE will reduce purchases under the Base PPA to the minimum requirement when the spot electricity price is below the price under the Base PPA. When spot market prices drop below the Base PPA price, but exceed the project's variable production cost, ACE pays for energy based on the power sales agreement, under which a portion of the margin above the project's production cost is shared with ACE. In the unusual situation when the spot electricity price is in excess of the Base PPA but less than the project's variable production cost (which may occur during off-peak periods), Chambers is required to sell energy to ACE at below its production cost. In some cases, the project is further negatively impacted by the facility's reduced fuel efficiency while operating at partial load to minimize operating at a negative margin.
The debt at our wholly-owned Epsilon holding company includes restrictions on the upstream distribution of our share of partner distributions from Chambers. Cash flow from Chambers may be held in a reserve account by Epsilon's lender to the extent certain debt service coverage ratios are not achieved. Upon meeting the coverage ratio requirements, funds are distributed to us.
Path 15 Segment
General Description
The Path 15 Segment consists of our ownership of 72% of the TSRs in the Path 15 project, an 84-mile, 500-kilovolt transmission line built along an existing transmission corridor in central California. The Path 15 project commenced commercial operations in 2004. The Path 15 project facilitates the movement of power from the Pacific Northwest to southern California in the summer months and from generators in southern California to northern California in the winter months. The TSRs entitle us to receive an annual revenue requirement that is regulated by the FERC The annual revenue requirement is collected from California utilities and remitted to owners of TSRs by the California Independent System Operator ("CAISO").
The Path 15 project and right of way is owned and operated by the Western Area Power Administration, a U.S. Federal power agency that operates and maintains approximately 17,000 miles of transmission lines. The operation of the Path 15 project consists entirely of the transmission of electric power, which is not subject to the same operating risks of a power plant or the volatility that may arise from changes in the price of electricity or fuel.
The CAISO is a not-for-profit corporation that acts as a clearinghouse to settle third-party transactions involving the purchase and sale of power in California. Owners of transmission assets must place their assets under the operational control of the CAISO by entering into a standard transmission control agreement with them. In general, the CAISO coordinates the dispatch of power generation and manages the reliability of, and provides open access to, the transmission grid.
Three of our wholly-owned subsidiaries have incurred non-recourse debt relating to our interest in the Path 15 project. Total debt outstanding at the Path 15 project as of June 30, 2010 is $157.6 million,
84
which is required to fully amortize over their remaining term ending 2028. See "Project-Level Debt" on page 59 of this prospectus for additional details. We have provided letters of credit totaling $8.4 million to support these debt service obligations.
Annual Revenue Requirement—FERC Rate Case
The revenue collected by Path 15 is regulated by the FERC on a cost-of-service rate base methodology. Path 15 files a rate case with the FERC every three years to establish its revenue requirement for the next three year period. The revenue requirement includes all prudently incurred operating costs, depreciation and amortization, taxes, and a return on capital.
In December 2007, we filed a rate application with the FERC to establish Path 15's revenue requirement through 2010. In January 2008, several parties filed protests and interventions to become parties to the proceeding. In February 2008, the FERC issued an order summarily approving the requested return on equity and, allowing the requested rates to go into effect as of February 20, 2008, subject to refund. California Public Utilities Commission and Southern California Edison filed requests for rehearing of that order. In February 2009, we filed an unopposed motion requesting suspension of the trial schedule to allow the parties to the rate case to finalize a settlement. In March 2009, we filed a settlement offer with the FERC. The settlement was supported by all parties to the proceeding. In August 2009, the FERC issued an order approving the settlement offer. We believe that the settlement was reasonable and has not significantly impacted the expected cash flow from the project. On October 30, 2009, the Path 15 project issued refunds reflecting the difference between the rates collected as of February 2008 pursuant to the December 2007 filing and the rates provided for under the settlement.
Factors Influencing Project Results
The primary factor influencing the Path 15 project results is its FERC-regulated revenue requirement. Under the FERC's cost of service methodology, all prudently incurred expenses are permitted to be recovered in the revenue requirement including costs of the rate case itself every three years. Cash distributions to us could be adversely impacted by factors such as which year is used to establish the revenue requirement for the next three years and whether the FERC approves a return on equity less than 13.5% in future rate cases.
Other Project Assets
Orlando Project
General Description
The Orlando project, a 129 MW natural gas-fired combined-cycle cogeneration facility located in an industrial park near Orlando in Orange County, Florida, commenced commercial operation in 1993 as a QF. We own a 50% interest in the project and Northern Star Generation, LLC ("Northern Star") owns the remaining 50% interest. The project is situated on a four acre site located adjacent to an air separation facility owned by Air Products and Chemicals, Inc. ("Air Products and Chemicals"), which serves as the project's steam customer. Orlando sells all of its electricity to PEF and Reedy Creek Improvement District ("Reedy Creek") under long-term PPAs, and also sells chilled water produced using steam from the project to Air Products and Chemicals. The Orlando project typically operates as a baseload plant. Both we and Northern Star have provided letters of credit in the amount of $1.6 million each in support of the project's obligations under the PEF PPA.
85
Power Purchase Agreements
Progress Energy Florida
Orlando sells electrical capacity and energy to PEF under a PPA that expires on December 31, 2023. The project is obligated to sell and deliver a committed capacity of 79.2 MW and has committed to a 93% on-peak capacity factor. Orlando receives a monthly capacity payment based on achieving the on-peak capacity factor and a monthly energy payment based on the total amount of electric energy actually delivered to PEF. The capacity payment escalates at 5.1% annually and is reduced if the facility's on-peak capacity factor is below 93%, on a 12-month rolling average basis. Energy payments are comprised of a fuel component based on the cost of coal purchased at two PEF-owned coal-fired generating stations, an operations and maintenance component, a voltage adjustment and an hourly performance adjustment. Off-peak energy prices are based on the on-peak spot market energy price discounted by 10%.
On August 4, 2009, PEF provided notice to Orlando that the committed capacity under its PPA would be increased to 115 MW upon expiration of the Reedy Creek PPA in 2013, upon meeting certain conditions.
Reedy Creek Improvement District
Orlando sells electrical capacity and energy to the Reedy Creek, a municipal district serving the Walt Disney World complex, under a PPA that expires in 2013. Orlando is obligated to sell and deliver 35 MW of electricity and has committed to a 93% average capacity factor. Orlando receives a monthly capacity payment based on the actual average capacity factor and a monthly energy payment based on the total amount of electric energy actually delivered to Reedy Creek. The PPA may be extended for an additional ten-year term upon the consent of both parties. The capacity payment is fixed at a rate that escalates at 4.5% annually and is based upon achieving a 93% average capacity factor, calculated on a three-year rolling average basis. The agreement provides both incentive and penalty provisions for performance above and below a 93% average capacity factor, respectively. Reedy Creek also reimburses Orlando for a portion of the reservation charges associated with the project's firm gas transportation agreement with Florida Gas. In 2005, Orlando executed an agreement with Reedy Creek for periodic sales of up to 15 MW of non-firm available energy at firm rates.
Excess Energy Sales
In 2006, Orlando executed a master purchase and sale agreement with Rainbow Energy Marketing Corporation ("Rainbow"). Under the agreement, Rainbow markets up to 15 MW of non-firm energy at spot market rates subject to the profitability of such sales. The arrangements with Rainbow can be terminated by either party upon 30 days notice.
Steam Sales Agreement
Orlando entered into an agreement with a subsidiary of Air Products and Chemicals to supply chilled water produced using steam from the project to its cryogenic air separation facility. Orlando does not have any minimum steam delivery requirements beyond the thermal and efficiency requirements required to maintain its QF status. Orlando is required to purchase its nitrogen requirements from Air Products and Chemicals, but does not have a minimum purchase requirement. Both the purchase price of nitrogen and the sales price of chilled water are at fixed prices that adjust based on the percentage increase/decrease in the producer price index.
Because of reduced demand for chilled water at Air Products and Chemicals during certain periods, and to ensure continued compliance with QF requirements, Orlando procured and installed water distiller units in 2009, and entered into contracts to provide the distilled water to unaffiliated third parties in the local area.
86
Fuel Supply Arrangements
Orlando buys natural gas from Orlando Power Holdings, LLC, which is indirectly owned by Northern Star, under an agreement expiring on December 31, 2013. Orlando Power has a back-to-back agreement for the purchase and supply of natural gas from Vastar Gas Marketing, Inc. ("Vastar"), which is a wholly-owned subsidiary of BP Energy Company. Under the agreement, which expires on December 31, 2013, Vastar is obligated to provide Orlando Power with its entire daily natural gas requirement. Orlando's purchase price is tied to the same coal-based and fixed escalators used for calculating the energy payments under the PPAs. Orlando also has a gas supply agreement with TGS, but is not currently purchasing any natural gas under this agreement.
Peoples Gas has entered into co-terminus back-to-back agreements with Florida Gas for the delivery of natural gas to the project. Orlando has a contractual right to extend these agreements. Transportation costs under the agreements are determined by Florida Gas' rate schedule as filed with the FERC. These agreements provide for the transportation of up to 23,600 Mmbtu per day to the project.
Operations & Maintenance
The Orlando project is operated and maintained by an affiliate of Northern Star under an operations and administrative services agreement expiring on December 31, 2023. The operator is compensated on a cost-reimbursement basis plus a fixed general and administrative charge. In addition, the operator is entitled to receive an incentive fee equal to a percentage of the excess of Orlando's operating cash flow after deducting originally anticipated maintenance capital and anticipated debt service. In 1997, Orlando also entered into a maintenance agreement with Alstom Power Inc. for the long-term supply of hot gas path gas turbine parts, under which Alstom receives a monthly fee from the partnership and additional fees in certain circumstances.
Factors Influencing Project Results
The Orlando project receives a significant portion of its revenues through capacity payments received under the PPA with PEF. In the event the facility's on-peak capacity factor falls below a specified level, capacity payments will be adjusted downward or eliminated. The energy payment under the PEF PPA largely consists of an energy component, which is adjusted based on the same coal index as used in the gas supply pricing.
The energy payment under the PPA with PEF includes a performance adjustment. During on-peak periods in which the market price for energy exceeds the PPA energy rate, for energy deliveries in excess of PEF scheduled capacity, the project receives the then as-available energy rate, determined according to regulatory methodology. Conversely, during on-peak periods when the project delivers less than the scheduled capacity, the project incurs negative performance adjustment charges corresponding to the difference between the then as-available energy rate and the PPA energy rate.
The Reedy Creek PPA also contains incentive and penalty provisions for performance above and below a specified capacity factor.
Selkirk Project
General Description
The Selkirk project is a 345 MW dual-fuel, combined-cycle cogeneration plant located in the Town of Bethlehem in Albany County, New York, and commenced commercial operation in 1994 as a QF. The project includes two units: Unit I (80 MW) sells electricity into the New York merchant market and Unit II (265 MW) sells electricity to Consolidated Edison, Inc. (or "Con Ed"). The Selkirk project is typically operated as a mid-merit plant. The other partners include affiliates of Cogentrix, Energy
87
Investors Funds, The McNair Group, and Fort Point Power LLC (an affiliate of Osaka Gas Energy America Corporation). Each of the partners has an interest in cash distributions by the project which changes when certain partners achieve a specified return on their equity contributions as set forth in the partnership agreement. We own: (i) 13.62% interest in the priority distributions up to a fixed semi-annual amount as described below; (ii) 19.94% interest on any distributions in excess of the priority distributions; and (iii) 17.7% of all distributions made after the last priority distribution is made, estimated to occur in 2012. If priority distributions are not made at the maximum amount, the unpaid amounts accumulate and are paid when funds are available in subsequent periods. As of December 31, 2009, our 13.62% share of unpaid priority distributions was $0.5 million. In addition to this accumulated amount, our share of the maximum semi-annual priority distributions in 2010, 2011 and 2012 is approximately $1.2 million, $0.8 million and $0.7 million, respectively. The 15.7 acre project site is situated adjacent to a Saudi Arabia Basic Industries Corporation (or "SABIC") plastics manufacturing plant, which also purchases steam from the project. Selkirk leases the project site under a long-term lease from SABIC.
The Selkirk project has 8.98% first mortgage bonds outstanding. Our share of the outstanding amount of these bonds was $15.2 million as of June 30, 2010, which fully amortizes over the remaining term ending in 2012. See "Project-Level Debt" on page 59 of this prospectus for additional details.
Power Purchase Agreements
Since the expiration of Selkirk's agreement to sell 80 MW of capacity and energy from Unit I to National Grid in July 2008, Selkirk has been selling energy from Unit 1 into the New York merchant market. 265 MW of capacity and energy from Unit II is sold to Con Ed under a PPA that expires on September 1, 2014, subject to a ten-year extension at the option of Con Ed under certain conditions. It is not known whether Con Ed intends to exercise this option. The Unit II PPA provides for a capacity payment, a fuel payment, an operations and maintenance payment and a payment for transmission from the project to Con Ed. The capacity payment, a portion of the fuel payment, a portion of the operations and maintenance payment and the transmission payment are fixed charges to be paid on the basis of plant availability.
Steam Sales Agreement
Selkirk sells steam generated at the project to the SABIC plastics manufacturing plant under an agreement that expires on September 1, 2014. Under the agreement, SABIC is not charged for steam in an amount up to the annual equivalent of 160,000 lbs/hr during each hour in which the SABIC plant is in production. SABIC pays the project a variable price for steam in excess of this amount. SABIC is required to purchase the minimum thermal output necessary for Selkirk to maintain its QF status.
Fuel Supply Arrangements
Selkirk buys natural gas for Unit I at spot market prices under a contract with Coral Energy Canada Inc. expiring on October 31, 2012. Selkirk has gas supply agreements for Unit II with Imperial Oil Resources Limited, EnCana Corporation and Canadian Forest Oil Ltd., which expire on October 31, 2014.
The project also has long-term contracts for the transportation of Units I and II natural gas volume on a firm 365-day per year basis in place with TransCanada Pipelines Limited, Iroquois Gas Transmission System LP and Tennessee Gas Pipeline Company. The Unit I and Unit II gas transportation contracts expire on November 1, 2012 and November 1, 2014, respectively.
Natural gas that is not used by Selkirk to generate power under its gas supply arrangements may be remarketed. Under certain market conditions, additional income is generated from such re-sales of natural gas. Units I and II have the capability to operate on fuel oil subject to certain limitations under the project's air permit and are able to switch fuel sources from natural gas to fuel oil and back without interrupting the generation of electricity.
88
Operations & Maintenance
GE operates the Selkirk project under an agreement expiring on December 31, 2012. The agreement provides for a fixed fee, capital parts discounts, a pass-through of management costs and a performance bonus. Management services for Selkirk are provided by Cogentrix under an administrative services agreement that expires in September 2014. Cogentrix is entitled to compensation under the agreement which is subject to renegotiation every four years and provides for the full recovery of its actual costs and properly allocated overhead plus a reasonable fee which must be approved by all of the Selkirk partners. The majority owner of the project is currently in the process of transferring management services from Cogentrix to Power Plant Management Services. We expect this transition to be complete in late August 2010.
Regional Greenhouse Gas Initiative
In 2009, in order to comply with RGGI, the project commenced purchasing CO2 allowances in the quarterly RGGI auctions. At year-end, the project had purchased adequate allowances to cover the amount needed for RGGI compliance in 2009, except for approximately 184,000 allowances. Under the RGGI rules, a compliance period consists of three years, during which time the emitter is required to obtain allowances corresponding to its CO2 emissions during the same period. New York State allocates a limited number of free allowances to generators that have long-term contracts. A portion of the project's 2009 requirement will be met with these free allowances. The project expects to purchase additional allowances in 2010 in order to satisfy its 2009 requirement. In resolution of a lawsuit brought by an unaffiliated owner of another New York power plant in 2009 challenging New York's RGGI rules, a consent decree is being finalized under which ConEd will reimburse the Selkirk project for the cost of additional allowances needed in excess of the free allowances allocated by New York.
Factors Influencing Project Results
Energy produced by Unit I (80 MW) is sold at market prices based on the project's bid into the spot market. The project is therefore exposed to fluctuations in market energy prices which may impact Unit I energy sales margins. Under the PPA with Con Ed, the Project receives significant capacity revenues based on meeting availability requirements and also receives an energy payment whenever Con Ed calls on Unit II (265 MW) to generate electricity. The energy payment is primarily dependent on the fuel price component, indexed predominantly to natural gas prices, but also has a small component based on oil prices.
In periods when Unit I or Unit II is not generating electricity, substantial volumes of natural gas are available to be re-sold. Depending on market prices when reselling compared to contract prices when the gas was nominated at the beginning of each month, the excess gas has been resold at significant positive margins and occasionally at a loss.
Gregory Project
General Description
The Gregory project is a 400 MW natural gas-fired combined cycle cogeneration QF located near Corpus Christi, Texas that commenced commercial operation in 2000. The Gregory project is owned by Gregory Power Partners, LP, a Texas limited partnership, and our ownership interest in Gregory Power is approximately 17%. The other owners are affiliates of JPMorgan Chase & Co. and John Hancock Life Insurance Company. Gregory currently sells approximately 345 MW of its capacity to Fortis Energy Marketing and Trading GP and sells up to 33 MW of electric energy and capacity to Sherwin Alumina Company, which is owned by Glencore International AG, with the remainder sold in the spot market. While not strictly a baseload facility, Gregory typically is operated at a high capacity factor. The project is located on a site adjacent to Sherwin Alumina's production facility, which also serves as
89
the project's steam customer. Gregory leases the land on which the project is located from Sherwin under an operating lease which expires in August 2035.
The Gregory project was financed by ING Capital Corporation ("ING") and a consortium of other lenders. The loan matures in 2017 and is required to be amortized over its remaining term. Our share of the total debt outstanding at the Gregory project as of June 30, 2010 was $15.2 million. See "Project-Level Debt" on page 59 of this prospectus for additional details.
In November 2008, Gregory's managing partner, discovered that the state authorization of the project's Prevention of Significant Deterioration Air Permit had lapsed due to a discrepancy in the representation of the renewal date of the state authorization by a consultant in 2002. The issue was self-reported to the Texas Commission of Environmental Quality (or "TCEQ"). During the first quarter of 2009, Gregory submitted its initial draft permit application to the TCEQ, which deemed it administratively complete, and completed the technical aspects of the permitting process. In December 2009, the TCEQ provided Gregory Power a draft of a new permit, and on March 15, 2010, the TCEQ issued the new permit. We believe the new permit limits are achievable by the project and will not require the installation of additional emissions control equipment.
Power Purchase Agreements
Gregory sells 345 MW of its output to Fortis under a PPA that began on January 1, 2009 and expires December 31, 2013. Under the terms of the Fortis agreement, Fortis pays a fixed capacity payment and an energy payment that is based on the price of natural gas at Houston Ship Channel and a contract heat rate. (Heat rate refers to the amount of energy that is required to generate one kilowatt hour of electricity.) Energy sales to Fortis consist of two tranches; a 234 MW "must-run" block and a 111 MW "dispatchable" block. The must-run block corresponds to the project's minimum energy output while satisfying Sherwin's electricity and steam requirements without the use of Gregory's auxiliary boilers. The dispatchable block is the portion of Gregory's output that can be scheduled at the option of Fortis as either energy, ancillary services or balancing energy. Credit support for the PPA consists of a $10 million letter of credit issued by ING which is backed by letters of credit from the project's partners, including a $1.7 million letter of credit provided by Atlantic Power.
Steam Sales Agreement
Gregory sells steam to Sherwin under an agreement that expires in 2020. Under the terms of the agreement, Gregory is the exclusive source of steam to Sherwin's alumina plant, up to a maximum of 1,500,000 lbs/hr.
Fuel Supply Arrangements
Gregory purchases natural gas under various short-term and long-term agreements. Gregory has the option of procuring 100% of its natural gas requirements from Kinder Morgan Tejas Pipeline, L.P., under a market-based gas supply agreement that expires in August 2010. Gregory Power has finalized a replacement supply agreement with Kinder Morgan and is seeking lender approval, as required under the project's financing agreements.
In March and June 2008, the project entered into pay fixed, receive floating, natural gas swap agreements with Sempra Energy Trading Corp. for the period January 2009 through December 2010. While Gregory has structured its power and steam sales agreements to mitigate the price risk between its fuel supply and electricity sales agreements, the project has some residual exposure to natural gas price risk due to the difference between the project's actual heat rate and the contractually guaranteed heat rate under the Fortis PPA. The swap agreements partially mitigate this natural gas price risk.
90
Operations & Maintenance
An affiliate of Babcock and Wilcox Power Generation Group, Inc. ("Babcock and Wilcox") is responsible for the operation and maintenance of the Gregory project under an agreement that terminates in July 14, 2015. The operator receives a fee for management of the facility (subject to escalation) on a quarterly basis and reimbursement of certain costs.
Energy Management Services
Tenaska Power Services, Co. ("Tenaska") provides Gregory with energy management services such as marketing excess power from the Project through the end of 2011. Tenaska optimizes Gregory's assets in the ancillary services market of the Electric Reliability Council of Texas, purchases natural gas for operations, provides scheduling services, provides back-office support and serves as Gregory's retail energy provider and qualified scheduling entity.
Factors Influencing Project Results
The Gregory project derives a significant portion of its operating margin through energy revenues under its PPA with Fortis. Energy revenues are dependent on the price of natural gas at Houston Ship Channel and a contract heat rate. The project achieves a margin on its energy revenue due to the facility's actual heat rate being lower than the contractually guaranteed heat rate.
Gregory also receives a capacity payment under the Fortis PPA which is dependent on maintaining certain minimum performance requirements. The project's capacity payments are subject to reduction or elimination if it fails to meet these requirements. Due to a forced outage in 2009, the project only received 98% of the full capacity revenue. However, historically the project has met all of the performance standards under the Fortis PPA.
Topsham Project
General Description
The Topsham project is a 14 MW hydroelectric facility located on the Androscoggin River at the Pejepscot dam near Topsham, Maine and began commercial operation in 1987 as a QF. A 100% undivided interest in the Topsham project and a 100% undivided interest in the Topsham project site are owned by a financial institution, in its capacity as owner trustee for the benefit of Atlantic Power (50%) and DaimlerChrysler Services North America LLC (50%) as owner participants. Electricity is sold to the Central Maine Power Company (or "CMP") under a PPA that expires in 2011.
The Topsham project is leased and operated by Topsham Hydro Partners Limited Partnership ("THP"), a Minnesota limited partnership. Pursuant to a sale and lease back transaction, THP leases both our interests in the project and in the project site until November 17, 2011. At the end of the lease term, THP has the option to renew the lease or acquire our share of the project and the project site. Lease payments made by THP are based on project's operating cash flows.
Power Purchase Agreement
Electrical output from the Topsham project is sold to CMP under a PPA that contains a fixed price schedule and terminates on December 31, 2011.
Operations & Maintenance
THP operates the project and provides all general and administrative services for the project under an agreement in effect until the earlier of December 31, 2027 or upon THP becoming the owner of 100% of the project and the project site.
91
Badger Creek Project
General Description
The Badger Creek project is a 46 MW simple-cycle, cogeneration facility located near Bakersfield, California which began commercial operation in 1991 as a QF. The Badger Creek project is owned by Badger Creek Limited, L.P. ("Badger"), a Texas limited partnership in which we own a 50% partnership interest. Juniper Generation, LLC, which is indirectly owned by affiliates of ArcLight Capital Partners, LLC, owns the other 50% partnership interest. Electricity is sold to Pacific Gas & Electric Corporation ("PG&E") under a PPA expiring in 2011. The project typically operates in a baseload configuration. Steam is sold to OXY USA Inc. ("OXY"), an affiliate of Occidental Petroleum Corporation, under an agreement that expires in 2011. Badger leases the approximately 3.5 acre site for the Badger Creek project under a ground lease. The term of the lease expires in July 2021 and the parties may extend for up to 10 additional one-year periods.
Power Purchase Agreement
Electricity generated by the Badger Creek project is purchased by PG&E under a PPA that expires in 2011. The PPA provides for monthly capacity and energy payments, and Badger is entitled to receive a performance bonus if the average on-peak capacity factor exceeds 85%. The energy price received under the PPA is linked to PG&E's interim "short-run avoided cost," as discussed below.
Steam Sales Agreement
Steam from the Badger Creek project is sold to OXY under an agreement which expires in 2011. The agreement provides for successive renewal terms of one year unless either party gives advance notice of termination. OXY utilizes the steam in its enhanced oil recovery operations to allow for more effective and efficient extraction of heavy crude oil. Subject to certain conditions, OXY has an obligation to buy steam under this agreement in an amount not less than the minimum requirements necessary to maintain the project's status as a QF. Although OXY is not currently purchasing any power from the project, the steam agreement allows for up to 1 MW of electricity to be sold to OXY.
Fuel Supply Arrangements
Natural gas is delivered to Badger Creek via a private pipeline that connects with the Kern River-Mojave Pipeline. The pipeline was constructed by a joint venture in which the project owns approximately 21%. An affiliate of Juniper operates the pipeline. In October 2006, Badger entered into a gas supply agreement, including transportation, with Sempra Energy Trading Corporation. In March 2008, the gas agreement was extended to cover fuel procurements through April 30, 2011.
Operations & Maintenance
Operations and maintenance for the Badger Creek project is performed by an affiliate of Juniper Generation, LLC under a fixed price operations and maintenance agreement. The agreement expires in 2011, but is terminable by either party upon six months' notice. The operator receives a base monthly fee, which is adjusted annually. In addition, the agreement provides for incentive fees and penalties based on the project's availability.
An affiliate of Juniper also provides all day-to-day management services required by the project and is paid a semi-annual fee for such management services based on a percentage of gross cash receipts of the project.
92
Factors Influencing Project Results
The Badger Creek Project derives a portion of its operating margin through energy revenues under the PG&E PPA. Energy revenues are dependent on PG&E's short-run avoided costs ("SRAC"), which is generally defined as the cost of electricity that a utility avoids incurring by purchasing the power from an independent power producer versus constructing and operating additional generating resources on its own. PG&E's SRAC is determined by the CPUC in conjunction with input from independent power producers, investor owned utilities and consumer groups through the state utility regulatory process. SRAC has been, and continues to be, a highly contested issue resulting in numerous CPUC proceedings and litigation. Until August 2009, SRAC was based on an administratively determined formula. In August 2009, the CPUC implemented a new SRAC methodology called the market index formula ("MIF"), which includes both a market-based component and an administratively determined component. Ultimately, the CPUC is moving toward a 100% market-based SRAC.
In April 2009, California's Market Reform and Technology Update energy market ("MRTU") commenced operation. The MRTU is expected to provide a robustly traded day-ahead market for energy that reflects the avoided marginal energy costs of California's utilities. Upon the determination by the CPUC that the MRTU is functioning properly, MIF will no longer include the administratively determined component, which is expected to lower MIF pricing and create larger differences between peak and off-peak prices. Such a determination has not been made by the CPUC.
Badger is a party to settlement negotiations among other QF facilities, California's major investor-owned utilities, and numerous consumer and independent power producer groups on a new energy pricing formula and possible extensions of firm capacity payments for project with existing contracts that will resolve many outstanding issues between the parties. Many of the SRAC and MIF related CPUC proceedings and litigation have been held in abeyance pending the outcome of the settlement negotiations.
It is expected that the CPUC regulations applicable to Badger will be in a state of transition for the foreseeable future, and there can be no assurance that decisions by the CPUC will not have an adverse impact on Badger.
Rumford Project
General Description
The Rumford Project is a 85 MW multi-fuel (coal, wood waste and tire-derived fuel) circulating fluidized bed boiler cogeneration facility located in the town of Rumford, Maine, which began commercial operation in 1990 as a QF. The Rumford project is owned by Rumford Cogeneration Company Limited Partnership, a Maine limited partnership ("Rumford LP"), in which we own an approximate 26% limited partnership interest. The project was constructed for the dual purpose of supplying steam and electricity to an adjacent paper mill, the Rumford Paper Company, owned by a subsidiary of NewPage Corporation ("NewPage") and electricity to the local utility. The project is situated on a site leased from the adjacent NewPage paper mill. The lease expires on December 31, 2020.
Power Purchase Agreement
In February 2007, Rumford LP executed an Interim Financial Obligation Consolidation Agreement with Rumford Paper Company. The agreement consolidated the payment obligations of the various prior agreements between Rumford LP and Rumford Paper Company into a single payment obligation effective January 1, 2007. The effect of the agreement is similar to a lease wherein Rumford Paper Company assumes the risk of fuel and power price volatility as well as most operating costs. Payments under the agreement have been made quarterly to Rumford LP over a three year term ended
93
December 31, 2009. During 2009, as a result of a dispute between NewPage and the limited partners regarding the making of the 2009 distributions and the economic viability of the project following the expiration of the agreement with Rumford Paper Company at the end of 2009, a settlement agreement was entered into which provided for the payment of the 2009 distributions to the partners. The settlement agreement further provided for the purchase by NewPage of the partners' interests in Rumford LP under certain conditions. If NewPage does purchase the partners' interests in Rumford LP, our share of the proceeds is expected to be approximately $2.5 million.
Koma Kulshan Project
General Description
The Koma Kulshan project is a 13.3 MW run-of-the-river hydroelectric generation facility located on the slopes of Mount Baker, approximately 80 miles north of Seattle, Washington, and began commercial operation in 1990 as a QF. The Koma Kulshan project is owned by Koma Kulshan Associates, a California limited partnership in which we own a 49.75% economic interest, Mt. Baker Corporation owns a 0.25% economic interest and Covanta Energy Corporation ("Covanta") owns the remaining 50%. The Koma Kulshan project was issued a 50-year hydro license from the FERC which expires in 2037. The project and its electrical output is sold to Puget Sound Energy, Inc. under a PPA expiring in 2037.
Our and Mt. Baker Corporation's interests in the project are held through Concrete Hydro Partners, L.P. Under the Concrete partnership agreement, Mt. Baker Corporation is entitled to reimbursement of certain deferred costs associated with the original development of the project from a portion of the distributions from the project. The full repayment of these deferred costs is expected in 2010, following which distributions are projected to be made ratably to us and Mt. Baker Corporation.
Power Purchase Agreement
Energy generated by the Koma Kulshan project is sold to Puget Sound Energy pursuant to a long-term PPA expiring in 2037. Power is sold at a per kilowatt hour rate that is adjusted annually. The term of the PPA is coterminous with the FERC license. Puget Sound Energy has the right to renew the PPA for a term equivalent to the term of any subsequent license or annual license granted by the FERC for the project.
Operations & Maintenance
Covanta performs the operations and maintenance of the facility pursuant to an operations and maintenance agreement which expires December 31, 2010. In addition to being reimbursed for actual costs incurred, Covanta receives an annual fee adjusted for inflation.
Delta-Person Project
General Description
The Delta-Person Project is a 132 MW natural gas-fired peaking facility located near Albuquerque, New Mexico, is an EWG that commenced commercial operation in 2000. We own a 40% interest in Delta-Person and affiliates of Olympus Power, LLC and John Hancock Mutual Life Insurance Company own the remaining interests. The Delta-Person Project is situated on PNM's (formerly Public Service of New Mexico) retired Delta Generating Station site under a lease agreement which is co-terminus with the project's PPA. The project operates as a peaking facility, which means that it is called upon to generate electricity only during unusually high periods of demand. The Delta-Person project sells all of its electrical output to PNM under a long-term PPA that expires in 2020.
94
Construction of the Delta-Person project was financed through a $59.7 million construction loan that was converted to permanent project financing once commercial operation was achieved. The permanent project financing was divided into two term loans: (i) Tranche A due March 31, 2017; and (ii) Tranche B due March 31, 2019, both of which amortize over their remaining terms. Our share of the total debt outstanding at the Delta-Person project as of June 30, 2010 was $11.1 million. See "Project-Level Debt" on page 59 of this prospectus for additional details.
Power Purchase Agreement
Electrical power generated by the Delta-Person project is purchased by PNM under a PPA that will expire in 2020. PNM has the unilateral right to extend the PPA for five years by giving written notice of such extension no later than two years prior to the end of the original term of the PPA. Subject to adjustments provided for in the PPA, PNM will purchase and accept the entire output of the project when PNM calls upon the capacity. Payments consist of: (i) the energy purchase price multiplied by the kilowatt hours delivered; (ii) the capacity purchase price multiplied by the dependable capacity; (iii) the project's cost of purchasing electric service from PNM for the operations and maintenance of the facility; and (iv) any other applicable charges. In order to earn full capacity payments, the project must maintain availability of at least 97%, which the project has historically achieved.
Fuel Supply Arrangements
The project purchases fuel from PNM Gas Services, a division of PNM, with fuel costs passed through to PNM under the PPA. The project has access to an interruptible gas supply and transportation like other standard industrial customers on PNM Gas Services' system.
Operations & Maintenance
As a simple cycle peaking facility, the project operations do not require extensive staffing and technical resources. Olympus Power provides asset management services, which include operational and contractual oversight of the facility, budget setting and environmental compliance.
Factors Influencing Project Results
The Delta-Person project derives a significant portion of its operating margin through capacity payments under the PPA with PNM. The capacity payment is based on two components which adjust annually with changes in inflation and interest rates. The capacity payment may be reduced on a monthly basis if the project's availability falls below 97%. The project has rarely experienced such adjustment. Energy payments are based on a variable operations and maintenance component, a fuel component and an availability incentive. The fuel component consists of the actual price the project pays for fuel and a contract heat rate. The contractually guaranteed heat rate is slightly higher than the project's average operating heat rate which generates additional energy revenue, because the contractually guaranteed heat rate represents the price that PNM pays for power that it purchases from Delta-Person. PNM will normally choose to purchase power from higher efficiency plants during periods of reduced demand. Reduced overall economic activity and related lower demand for electricity in the past two years has resulted in lower dispatch of Delta-Person by PNM.
95
Biomass Development Projects
Biomass-derived power is a well-established, conventional technology. In biomass power plants, the fuel is burned in a boiler to create steam that turns a turbine to generate electricity. In general, biomass power plants are designed to be operated as baseload units. While biomass encompasses a broad range of potential fuels, our activities are focused on "wood-residue" biomass. This feedstock includes virgin wood (from forests, wood processing facilities, etc.), agricultural residues, industrial and commercial waste, etc. Our facilities are eligible for renewable energy credits and may also qualify for certain federal tax benefits, depending on their construction schedule. We are pursuing six biomass projects with partners who bring specific skills to their development, as more fully described below.
Rollcast Energy, Inc.
Rollcast Energy, Inc. ("Rollcast") develops, owns and operates renewable power plants that use wood or biomass fuel. Rollcast, based in Charlotte, North Carolina, has five 50 MW biomass power plants in various stages of development in the southeastern U.S. In March 2009, we acquired a 40% equity interest in Rollcast for $3.0 million. In March 2010, we acquired an additional 15% interest for $1.2 million and in April 2010, we invested an additional $0.8 million to bring our total ownership interest to 60%. The terms of our investment in Rollcast provide us the option, but not the obligation, to invest directly in biomass power plants under development by Rollcast. Two of the development projects have obtained 20-year PPAs with terms that allow for the pass-through of fuel costs to the utility customer. In April 2010, Rollcast entered into a construction agreement for a 53.5 MW biomass project, known as Piedmont Green Power, to be located in Barnesville, Georgia. We are currently in advanced discussions that we expect will lead to our commitment to invest up to $75 million in the Piedmont Green Power project, representing substantially all of the equity interests in the project. We intend to use a sole arranger to syndicate project-level debt financing for Piedmont.
Onondaga Renewables, LLC
Onondaga Renewables, LLC is a 50/50 joint venture between us and Catalyst Renewables LLC formed in December 2008 to repower our decommissioned 91 MW gas-fired cogeneration facility located in Geddes, New York. Utilizing locally acquired biomass fuel, the proposed facility is expected to have a capacity of approximately 45 MW. Onondaga is currently in the process of obtaining a PPA for the full output of the facility.
Asset Management
Our asset management strategy is to partner with recognized leaders in the independent power business. Most of our projects are managed by Caithness; Cogentrix, a subsidiary of Goldman Sachs; and, in the case of Path 15, Western, a U.S. Federal power agency. On a case-by-case basis, Caithness, Cogentrix, and Western may provide: (i) day-to-day project-level management, such as operations and maintenance and asset management activities; (ii) partnership level management tasks, such as insurance renewals; and (iii) passive partnership level management, such as acting as limited partner. In some cases these project managers or the project partnerships may subcontract with other firms experienced in project operations, such as GE, to provide for day-to-day plant operations. In addition, employees of Atlantic Power Corporation with significant experience managing similar assets are involved in most decisions with the objective to choose value-creating transactions such as contract restructurings, asset-level refinancing, acquisitions and divestitures.
Caithness is one of the largest privately-held independent power producers in the United States. For over 25 years in the independent power business, Caithness, has been actively engaged in the development, acquisition and management of independent power facilities for its own account as well as in venture arrangements with other entities. Caithness operates our Auburndale, Lake and Pasco
96
projects and provides other asset management services for our Orlando, Selkirk and Badger Creek projects.
Cogentrix develops, owns, and operates independent power plants, located primarily in the U.S. Cogentrix manages the operation of the Chambers and Selkirk projects. New York-based investment firm Goldman Sachs Group acquired Cogentrix in December 2003. In November 2007, Goldman Sachs sold 80% of its interest in a number of the Cogentrix independent power plants, including Chambers and Selkirk to Energy Investors Funds, an established private equity fund manager that invests in the U.S. energy and electric power sector. Cogentrix continues to manage the Chambers and Selkirk projects.
Western markets and delivers hydroelectric power and related services within a 15-state region of the central and western United States. Western is one of four power marketing administrations within the U.S. Department of Energy whose role is to market and transmit electricity from multi-use water projects. Western's transmission system carries electricity from 57 power plants operated by the Bureau of Reclamation, U.S. Army Corps of Engineers and the International Boundary and Water Commission. Together, these plants have an operating capacity of approximately 8,785 MW. Western owns and operates the Path 15 transmission line.
Industry Regulation
Overview
In the United States, the trend towards restructuring the electric power industry and the introduction of competition in electricity generation began with the passage and implementation of the Public Utility Regulatory Policies Act of 1978, as amended ("PURPA"). Among other things, PURPA, as implemented by the FERC, generally required that vertically integrated electric utilities purchase power from QFs at their avoided cost. The FERC defines avoided cost as the incremental cost to a utility of energy or capacity which, but for the purchase from QFs, the utility would itself generate or purchase from another source. This requirement was modified in 2005, as discussed below.
Electric transmission assets, such as our Path 15 project, are regulated by the FERC on a traditional cost-of-service rate base methodology. This approach allows a transmission company to establish a revenue requirement which provides an opportunity to recover operating costs, depreciation and amortization, and a return on capital. The revenue requirement and calculation methodology is reviewed by the FERC in periodic rate cases. As determined by the FERC, all prudently incurred operating and maintenance costs, capital expenditures, debt costs and a return on equity may be collected in rates charged.
Carbon Emissions
In the United States, government policy addressing carbon emissions has continued to gain momentum over the last two years. Beginning in 2009, the RGGI was established in ten Northeast and Mid-Atlantic states as the first cap-and-trade program in the United States for CO2 emissions. The states have varied implementation plans and schedules. Two of these states, New York and New Jersey, also provide cost mitigation for independent power projects with certain types of power contracts. Other states and regions in the United Sates are developing similar regulations and it is expected that federal climate legislation will be established in the future.
Federal bills to create both a cap-and-trade allowance system and a renewable/efficiency portfolio standard have been introduced in both the U.S. House and Senate. Separately, the U.S. Environmental Protection Agency has taken several recent actions to regulate CO2 emissions.
Additionally, more than half of the U.S. states and most Canadian provinces have set mandates requiring certain levels of renewable energy production and/or energy efficiency during target
97
timeframes. This includes generation from wind, solar and biomass. In order to meet CO2 reduction goals, changes in the generation fuel mix are forecasted to include a reduction in existing coal resources, higher reliance on nuclear, natural gas, and renewable energy resources and an increase in demand-side resources. Investments in new or upgraded transmission lines will be required to move increasing renewable generation from more remote locations to load centers.
Regulation—Generating Projects
Ten of our power generating projects are qualified facilities under PURPA and related FERC regulations. The Delta-Person and Pasco projects are not QFs but are both EWGs under the Public Utility Holding Company Act of 2005, as amended ("PUHCA"). The generating projects with QF status and which are currently party to a power purchase agreement with a utility or have been granted authority to charge market-based rates are exempt from FERC rate-making authority. The FERC has granted seven of the projects the authority to charge market-based rates based primarily on a finding that the project lacks market power. These projects are thus not subject to FERC rate-making. The generating projects are exempt from regulation under PUHCA and the projects with QF status are also exempt from state regulation respecting the rates of electric utilities and the financial or organizational regulation of electric utilities.
A QF falls into one or both of two primary classes, both of which would facilitate more efficient use of fossil fuels to generate electricity than typical utility plants. The first class of QFs includes energy producers that generate power using renewable energy sources such as wind, solar, geothermal, hydro, biomass or waste fuels. The second class of QFs includes cogeneration facilities, which must meet specific fossil fuel efficiency requirements by producing both electricity and steam versus electricity only. With the exception of QFs, generation, transmission and distribution of electricity remained largely owned by vertically integrated electric utilities until the enactment of the Energy Policy Act of 1992 (the "EP Act of 1992") and subsequent orders in 1996, along with electric industry restructuring initiated at the state level. Among other things, the EP Act of 1992 enhanced the FERC's power to order open access to power transmission systems, contributing to significant growth in the independent power generation industry.
In August 2005, the Energy Policy Act of 2005 (the "EP Act of 2005") was enacted, which removed certain regulatory constraints on investment in utility power producers. The EP Act of 2005 also limited the requirement from PURPA that electric utilities buy electricity from QFs to certain markets that lack competitive characteristics. Finally, the EP Act of 2005 amended and expanded the reach of the FERC's corporate merger approval authority under Section 203 of the Federal Power Act.
All of our projects are subject to reliability standards developed and enforced by the North American Electric Reliability Corporation ("NERC"). NERC is a self-regulatory organization that is a non-governmental entity which has statutory responsibility to regulate bulk power system users, generation and transmission owners and operators through the adoption and enforcement of standards for fair, ethical and efficient practices.
In March 2007, the FERC issued an order approving mandatory reliability standards proposed by NERC in response to the August 2003 northeastern U.S. blackouts. As a result, users, owners and operators of the bulk power system can be penalized significantly for failing to comply with the FERC-approved reliability standards. We have designated our Senior Director for Asset Management as our FERC Compliance Officer responsible for meeting the FERC and NERC requirements and an outside law firm specializing in this area advises us on FERC and NERC compliance, including annual compliance training for relevant employees.
98
Regulation—Transmission Project
The revenues received by the Path 15 project are regulated by the FERC through a rate review process every three years that sets an annual revenue requirement. Under terms of the initial rate case settlement, the project must go through the FERC review every three years.
The Path 15 project's initial three-year rate period's revenue requirement expired at the end of 2007. On December 21, 2007, the Project submitted to the FERC its revenue requirement for the 2008 through 2010 period. In an order issued February 2008, the FERC allowed the rates as filed in December 2007 to go into effect subject to refund pending the outcome of the regulatory proceedings. The FERC also accepted several of the project's key methodological approaches, including use of a 13.5% return on equity. A number of parties requested rehearing on such issues. On March 23, 2009, the Path 15 project filed an uncontested settlement offer with the FERC, for rehearing in the Path 15 project's rate case proceeding. We believe that the settlement was reasonable and will not significantly impact the expected cash flow from the project. On August 3, 2009, the FERC issued an order approving the settlement. Thereafter, on October 30, 2009 the Path 15 project issued refunds reflecting the difference between the rates collected as of February 2008 pursuant to the December 2007 filing and the rates provided for under the settlement. Since May 2009, the Path 15 project has been receiving revenues based on the revenue requirement established by the settlement. Pursuant to the terms of the settlement, Path 15 is required to submit its revenue requirement for the 2011 through 2013 rate period to the FERC in February 2011. The preparation of this new rate filing will commence in the third quarter of 2010.
Competition
The power generation industry is characterized by intense competition, and our projects compete against utilities, industrial companies and other independent power producers. In recent years, there has been increasing competition among generators in an effort to obtain power sales agreements, and this competition has contributed to a reduction in electricity prices in certain markets where supply has surpassed demand plus appropriate reserve margins. In addition, many states are implementing or considering regulatory initiatives designed to increase competition in the U.S. power industry.
The U.S. power industry is continuing to undergo consolidation and may offer attractive acquisition and investment opportunities, although we believe that we will continue to confront significant competition for those opportunities and, to the extent that any opportunities are identified, we may be unable to effect acquisitions or investments on attractive terms. We compete for acquisition opportunities with numerous private equity funds, Canadian and U.S. independent power firms, utility genco subsidiaries and other strategic and financial players. Our competitive advantages include our diversified projects, strong customer base, leading third-party managers and stability of project cash flow. We have similar strength in asset management and optimization.
Legal Proceedings
From time to time, Atlantic Power, its subsidiaries and the projects are parties to disputes and litigation that arise in the normal course of business. We assess our exposure to these matters and record estimated loss contingencies when a loss is likely and can be reasonably estimated. There are no matters pending as of August 12, 2010 which we expect to have a material impact on our financial position or results of operations.
Employees
As of August 12, 2010, we had 13 full-time employees. None of our employees is represented by any collective bargaining unit or a party to any collective bargaining agreement.
99
Description of Property
We have included descriptions of the locations and general character of our principal physical operating properties, including an identification of the segments that use such properties, in "Business," which is incorporated herein by reference. A significant portion of our equity interests in the entities owning these properties are pledged as collateral under our senior credit facility or under non-recourse operating level debt arrangements. See Note 9 in the accompanying notes to our consolidated financial statements for additional information regarding our operating properties.
Our principal executive office is located at 200 Clarendon Street, Floor 25, Boston, Massachusetts under a lease that expires in 2015.
100
MANAGEMENT
The following table sets forth the names, ages and positions of each of our directors and executive officers:
Name
|
Age | Position | ||
|---|---|---|---|---|
| Irving Gerstein | 69 | Director, Board Chairman, Nominating and Governance Committee Chairman | ||
| Ken Hartwick | 47 | Director, Audit Committee Chairman, Compensation Committee Chairman | ||
| John McNeil | 68 | Director | ||
| Richard Foster Duncan | 56 | Director | ||
| Holli Nichols | 40 | Director | ||
| Barry Welch | 53 | Director, President and Chief Executive Officer | ||
| Patrick Welch | 42 | Chief Financial Officer and Corporate Secretary | ||
| Paul Rapisarda | 56 | Managing Director, Acquisitions and Asset Management | ||
| William Daniels | 51 | Senior Director, Asset Management | ||
| John J. Hulburt | 43 | Corporate Controller |
Irving R. Gerstein, C.M., O.Ont The Honourable Irving R. Gerstein has been a director of Atlantic Power since October 2004. Senator Gerstein is a Member of the Order of Canada and a Member of the Order of Ontario, and was appointed to the Senate of Canada in December 2008. He is a retired executive, and is currently a director of Medical Facilities Corporation, Student Transportation of America, Ltd., and Economic Investment Trust Limited, and previously served as a director of other public companies, including CTV Inc., Traders Group Limited, Guaranty Trust Company of Canada, Confederation Life Insurance Company and Scott's Hospitality Inc., and as an officer and director of Peoples Jewellers Limited. Senator Gerstein is an honorary director of Mount Sinai Hospital (Toronto), having previously served as Chairman of the Board, Chairman Emeritus and a director over a period of twenty-five years, and is currently a member of its Research Committee. Senator Gerstein earned his BSc in Economics from the University of Pennsylvania (Wharton School of Finance and Commerce).
Mr. Gerstein's substantial experience on the boards of numerous other public companies and his prior experience as an executive of a substantial public company make him a valued advisor and highly qualified to serve as chairman of our board of directors and as chairman of our Nominating and Corporate Governance Committee.
Ken Hartwick, C.A. has been a director of Atlantic Power since October 2004. Ken Hartwick has over 13 years of management experience in the energy sector, and 20 years experience in the financial sector. Mr. Hartwick's experience in the energy industry spans several markets having played an integral role as an executive officer for Just Energy since April 2004, helping launch their businesses in Alberta, British Columbia, Indiana, and Texas as well as growing the businesses already established in Manitoba, Ontario, Quebec, Illinois and New York. He currently serves as the President and CEO for, and is a director on the board of Just Energy, an integrated retailer of commodity products. Mr. Hartwick has served as President and CEO for Just Energy since June 2008, as President from 2006 until June 2008, and as Chief Financial Officer from April 2004 to 2006. Mr. Hartwick understands the issues facing the electricity industry through his previous role as Chief Financial Officer of one of the largest distribution companies in North America, Hydro One Inc., where he gained increasing executive-level responsibility throughout his career, and provided strategic direction as Ontario transitions towards a competitive energy marketplace. Mr. Hartwick earned his Honours of Business Administration from Trent University, Peterborough, Ontario.
Mr. Hartwick's substantial experience in the energy industry and financial sector make him a valued advisor and highly qualified to serve as a member of our board of directors and as chairman of our Audit and Compensation Committees.
101
John McNeil has been a director of Atlantic Power since October 2004. Mr. McNeil is President of BDR NorthAmerica Inc., an energy consulting company based in Toronto, Ontario. Prior to his appointment at BDR NorthAmerica Inc. in 2000, Mr. McNeil was Managing Director Investment Banking with Scotia Capital Inc. from 1996 to 1999. Previously, he was a Senior Vice-President and Director of ScotiaMcLeod Inc. from 1991 to 1995. Mr. McNeil has extensive expertise in the areas of asset management models, capitalization, mergers and acquisitions, business and enterprise valuations, capital markets and market ratings and has worked extensively throughout North America and Europe. Mr. McNeil specializes in the electric power sector and his major focus in recent years has been in the field of corporate and enterprise unbundling and reconstitution resulting from the restructuring of the electricity sector in North America. Mr. McNeil earned a B.A. (Honors) from Queens University, a Bachelor of Laws from the University of Toronto and a Master of Business Administration from the University of British Columbia.
Mr. McNeil's extensive experience in the financial and capital markets sectors, as well as his expertise in the electric power sector, make him a valued advisor and highly qualified to serve as a member of our board of directors.
Richard Foster Duncan was elected as a director of Atlantic Power at our annual general meeting of shareholders held on June 29, 2010. Mr. Duncan has more than 30 years of senior corporate, investment banking, and private equity experience. He joined Advantage Capital Partners in April 2009 as Managing Director with senior management responsibility for the firm's energy related portfolio and energy initiatives. From 2005 through April 2009, Mr. Duncan was managing member of KD Capital L.L.C., an affiliate of Kohlberg Kravis Roberts & Co. ("KKR"), which he and KKR formed in 2005. He worked with KKR and its portfolio companies in connection with creating value and identifying and investing in the energy, utility, natural resources, and infrastructure sectors. From 2001 through 2005 he was with Cinergy Corporation. Mr. Duncan joined Cinergy Corporation as Executive Vice President and CFO of Cinergy Corporation with overall corporate financial responsibility for all financial functions and also served as CEO and President of Cinergy's Commercial Business Unit in part of 2004 and 2005. While at Cinergy, he was responsible for Cinergy's energy merchant operations and regulated generation, including a portfolio of more than 19,000 megawatts. He was responsible for Cinergy's wholesale electric, natural gas and coal marketing, and international operations. Mr. Duncan is active with the Edison Electric Institute, serves as a member of the Wall Street Advisory Group, and is the past Chairman of the Finance Executive Advisory Committee. Earlier in his career, he has also held senior management positions at LG&E Energy Corp., a subsidiary of E.ON AG, and Freeport-McMoRan Copper & Gold and Howard, Weil, Labouisse, Friedrichs Inc. Mr. Duncan is on the board of directors of North American Energy Alliance, LLC in Iselin, NJ and SensorTran Inc. in Austin, TX and also serves on the Board of Advisors of GridPoint, Inc. in Arlington, VA. He is active in a number of civic organizations including the board of directors of the Eye, Ear, Nose and Throat Hospital Foundation in New Orleans, the Board of Trustees of Cincinnati Country Day School and in Charlottesville, Virginia the National Advisory Board of the University of Virginia Jefferson Scholars Program. Mr. Duncan graduated with Distinction from the University of Virginia and later received his MBA degree from the A. B. Freeman Graduate School of Business at Tulane University.
Mr. Duncan's extensive experience as a senior executive in the electric utility industry, as well as his experience in the private equity sector make him a valued advisor and highly qualified to serve on our board of directors.
Holli Nichols was elected as a director of Atlantic Power at our annual general meeting of shareholders held on June 29, 2010. Ms. Nichols has over 10 years of experience in financial roles at Dynegy, Inc., a large independent power company listed on the NYSE, and is a Certified Public Accountant. She is currently Executive Vice President and Chief Financial Officer of Dynegy and has been in that role since December 2005. From May 2004 to December 2005, she was Senior Vice President and Treasurer. From June 2003 to May 2004, she was Senior Vice President and Controller
102
and held other financial roles at the company from May 2000 through May 2004. Prior to joining Dynegy, Ms. Nichols was a Senior Audit Manager with PricewaterhouseCoopers. She also serves on the board of His Grace Foundation, which supports children who undergo bone marrow transplants. Ms. Nichols earned a bachelor's of science degree from Baylor University and a Masters of Business Administration from Rice University.
Ms. Nichols' extensive experience as a senior executive in the independent power industry, as well as her financial and accounting background make her a valued advisor and highly qualified to serve on our board of directors.
Barry Welch has been our President and Chief Executive Officer since October 2004 (until December 31, 2009, through the Manager) and a Director since June 2007. Prior to joining Atlantic Power Corporation, Mr. Welch was the Senior Vice President and co-head of the Bond & Corporate Finance Group of John Hancock Financial Services ("John Hancock"), Boston, Massachusetts, from 2000 to 2004. Mr. Welch served on several committees at John Hancock, including its Pension Investment Advisory Committee and Investment Operating Committee. Mr. Welch was Chairman of John Hancock's Bond Investment Committee and reported monthly on investment portfolio, strategy and activity to the Committee of Finance of John Hancock's board of directors. Mr. Welch also led the development and approval of John Hancock's involvement with ArcLight Capital Partners and served as a member of ArcLight Energy Partners Fund I's Investment Committee. During his time at John Hancock, Mr. Welch headed the Bond and Corporate Finance Group's Power and Energy investment team. From 1989 to 2004, he was involved directly or oversaw $25 billion of investments in more than 1,000 utility, project finance and oil and gas transactions. Prior to joining John Hancock, Mr. Welch spent more than three years as a developer of power projects at Thermo Electron Corporation's Energy Systems Division (later known as Thermo Ecotek). There, he was involved in greenfield development of natural gas, wood and waste-to-energy projects, as well as asset management roles for operating plants. Mr. Welch earned a Bachelors of Science in Mechanical and Aerospace Engineering from Princeton University, and a Masters of Business Administration from Boston College. Mr. Welch serves on the board of directors of the Walker Home and School in Needham, Massachusetts.
Mr. Welch's extensive experience in energy investment and related activities in the financial sector, as well as his in-depth knowledge of our company through his position as President and Chief Executive Officer, make him highly qualified to serve as a member of our board of directors.
Patrick Welch, who is not related to Barry Welch, has been our Chief Financial Officer since May 2006 (until December 31, 2009, through the Manager). He has an extensive background in the energy and independent power industries. Before joining Atlantic Power, from January 2004 to May 2006, Mr. Welch was Vice President and Controller of DCP Midstream, ("DCP") and DCP Midstream Partners, LP ("DCPLP") headquartered in Denver, Colorado. DCP is a private midstream natural gas company owned by Spectra Energy and ConocoPhillips and DCPLP is a public master limited partnership sponsored by DCP. In these roles, Mr. Welch was responsible for all accounting, budgeting, SEC and financial reporting and compliance with Section 404 of the Sarbanes-Oxley Act of 2002 for DCP and DCPLP. Prior to that he held various positions at Dynegy Inc. in Houston, Texas, including Vice President and Controller for Dynegy Generation, and Assistant Corporate Controller. Prior to Dynegy, Mr. Welch was a Senior Audit Manager in the Energy, Utilities and Mining Practice of PricewaterhouseCoopers LLP, predominantly in Houston, Texas, where he served several major energy clients. He earned his bachelors degree from the University of Central Oklahoma and is a Certified Public Accountant.
Paul Rapisarda has 25 years of experience in energy, utility and independent power investment banking. Mr. Rapisarda is currently Managing Director of Acquisitions and Asset Management at Atlantic Power. From 2001 to early 2008 he was a Principal with Compass Advisors, a boutique M&A advisory firm in New York, where he was involved in numerous strategic advisory, restructuring and
103
principal transactions in the energy and power sectors. Prior to Compass Advisors, Mr. Rapisarda held senior positions with the energy and utilities investment banking teams at Schroders, Merrill Lynch and BT Securities. Prior to that he was a Managing Director and Co-Head, Utilities and Structured Finance, at Drexel Burnham Lambert. While at Drexel, he also worked with the firm's chief financial officer in making direct tax-oriented investments on the firm's behalf. Over the course of his career, Mr. Rapisarda has worked on a broad range of capital markets and advisory transactions including substantial experience in cross-border and emerging markets. He earned his Bachelors degree from Amherst College and his MBA from Harvard Business School.
William Daniels has been with Atlantic Power since March 2007. He is currently Senior Director of Asset Management. Mr. Daniels has 26 years of experience in oil and gas exploration, independent power development, project finance and asset management. Prior to joining Atlantic Power, from January 2006 to February 2007, Mr. Daniels was Director, Asset Management at American National Power. He has held various positions in asset management and project finance at Calpine Corp. (March 2001 to January 2006), Edison Mission Energy, Citizens Power and the Toronto-Dominion Bank. Prior to receiving his MBA, he worked with Mitchell Energy Corp. as an exploration geologist. Mr. Daniels earned a Bachelor of Science degree in Geology from the University of Rochester, a Master of Science in Geology from the Ohio State University, and an MBA from Columbia University Business School.
John J. Hulburt has been the Corporate Controller of Atlantic Power since June 2008. Mr. Hulburt has 14 years of experience in the accounting industry. Before joining Atlantic Power, from February 2007 to June 2008, Mr. Hulburt was Controller of GreatPoint Energy, Inc. headquartered in Cambridge, Massachusetts. GreatPoint Energy is a technology-driven natural resources company and the developer of a proprietary, highly-efficient catalytic process, known as hydromethanation. Mr. Hulburt was responsible for all accounting, budgeting and financial reporting for GreatPoint Energy. Prior to that he was the Chief Financial Officer at Datawatch Corporation (December 2004 to January 2007) in Chelmsford, Massachusetts, and the Chief Financial Officer at Bruker Daltonics in Billerica, Massachusetts (April 2000 to June 2004). Datawatch and Bruker Daltonics were publicly listed Companies on the NASDAQ Exchange. He was responsible for all accounting, budgeting, SEC and financial reporting for Datawatch and Bruker Daltonics. Prior to Bruker Daltonics, Mr. Hulburt was an Audit Manager in the Hi-Technology and Manufacturing Practice of Ernst & Young LLP, where he served several major Hi-Tech and Manufacturing clients. He earned his bachelors degree from the Merrimack College and is a Certified Public Accountant.
Composition of our board of directors
Our directors are elected by our shareholders at our annual meeting, which is generally held in June of each year. Directors hold office for one year or until their successors are chosen. At our annual general and special meeting of shareholders on June 29, 2010, shareholders approved increasing the size of the board from five to six directors and approved changes to our Articles of Continuance reducing the minimum Canadian residency requirement for directors from 50% to 25%.
Our board of directors has evaluated the independence of each director within the meaning of the requirements of the NYSE and has determined that each of Messrs. Gerstein, Hartwick, McNeil and Duncan and Ms. Nichols is an "independent director" under our independence standards and under the NYSE corporate governance rules. These five directors comprise a majority of our six-member board of directors.
Compensation of Directors
Director Fees
Each independent director is entitled to receive an annual retainer of $40,000 and $1,500 per meeting attended in person or $500 per meeting attended by phone. The chair of the board of
104
directors' Audit Committee and Compensation Committee receive an additional $10,000 per year. Directors are reimbursed for out-of-pocket expenses for attending meetings. Our directors also participate in the insurance and indemnification arrangements described below.
Equity Ownership Guideline
On April 24, 2007, the board of directors adopted an equity ownership guideline for independent directors. The guideline provides that by April 24, 2010 (for existing independent directors) or within three years of their initial election (for new independent directors), each independent director should own equity securities of Atlantic Power (which will include notional shares issued under the deferred share unit plan described below), representing an investment by each independent director of three times their current annual retainer.
Deferred Share Unit Plan
On April 24, 2007, our board of directors established a deferred share unit plan ("DSU Plan") for directors. Under the DSU Plan, each non-management director is entitled to elect to have fees paid to them by Atlantic Power for their services as directors contributed to the DSU Plan. All fees contributed to the DSU Plan shall be credited to such director in the form of notional shares representing the estimated fair value, as determined by Atlantic Power, of the common share component of the IPSs at the time of contribution. For so long as the participant continues to serve on the board of directors, dividends will accrue on the notional shares consistent with amounts declared by the board of directors on our common shares and additional notional shares representing the dividends will be credited to the participant's notional share account. Notional shares credited to the participant's notional share account may be redeemed only when a participant no longer serves on the board of directors for any reason or upon a reorganization of Atlantic Power.
The following table describes director compensation for non-management directors for the year ended December 31, 2009. Directors who are also officers of Atlantic Power are not entitled to any compensation for their services as a director.
Name
|
Fees earned or Paid in Cash (US$) |
Total Compensation (US$) |
|||||
|---|---|---|---|---|---|---|---|
Irving R. Gerstein |
107,000 | 107,000 | |||||
Kenneth M. Hartwick(1) |
100,500 | 100,500 | |||||
John A. McNeil |
90,500 | 90,500 | |||||
William E. Whitman(2) |
91,000 | 91,000 | |||||
- (1)
- Mr. Hartwick
deferred all of his 2009 fees in the DSU Plan.
- (2)
- Mr. Whitman deferred 25% of his 2009 fees in the DSU Plan. Mr. Whitman is no longer a director as of June 29, 2010.
Compensation Committee Interlocks and Insider Participation
None of the members of the compensation committee of our board of directors is an officer or employee of Atlantic Power. No named executive officer of Atlantic Power serves as a member of the board of directors or compensation committee of any entity that has one or more named executive officers serving on our compensation committee.
During 2009, Barry Welch, our President and Chief Executive Officer presented recommendations in connection with deliberations of our board of directors concerning executive officer compensation.
105
During the last year, none of our executive officers served as: (i) a member of the compensation committee (or other committee of the board of directors performing equivalent functions or, in the absence of any such committee, the entire board of directors) of another entity, one of whose executive officers served on our compensation committee; (ii) a director of another entity, one of whose executive officers served on our board of directors; or (iii) a member of the compensation committee (or other committee of the board of directors performing equivalent functions or, in the absence of any such committee, the entire board of directors) of another entity, one of whose executive officers served on our board of directors.
Compensation Discussion and Analysis
Introduction
Until December 31, 2009, we were managed through a management services agreement with Atlantic Power Management, LLC, which we refer to herein as the "Manager," which is owned by two private equity funds managed by ArcLight Capital Partners, LLC. As such, we did not have any executive officers or other employees and all of the persons listed in this prospectus as "named executive officers" were employed by the Manager. Effective December 31, 2009, the management agreement was terminated and all of the employees of the Manager became our employees. In addition, Barry Welch, Patrick Welch and Paul Rapisarda entered into executive employment agreements with us in connection with the termination of the management agreement.
Compensation Objectives
Compensation plays an important role in achieving short and long-term business objectives that ultimately drives business success in alignment with long-term shareholder goals. The objectives of our compensation program are to:
- •
- attract and retain highly qualified executive officers with a history of proven success;
- •
- align the interests of our executive officers with shareholders' interests and with the execution of our business
strategy;
- •
- establish performance goals that, if met by Atlantic Power, are expected to improve long-term shareholder
value; and
- •
- tie compensation to performance with respect to those goals and provide meaningful rewards for achieving them.
Our compensation program is designed to provide adequate reward for services and incentive for our senior management team to implement both short-term and long-term strategies aimed at increasing shareholder value, and aligning the interests of senior management with those of our shareholders.
Our compensation program has been established in order to compete with remuneration practices of companies similar to us and those which represent potential competition for our executive officers and other employees. In this respect, we identify remuneration practices and remuneration levels of public companies that are likely to compete for our employees. In designing the compensation program, our board of directors focuses on remaining competitive in the market with respect to total compensation for each of our executive officers. However, our board of directors does review each element of compensation for market competitiveness and it may weigh a particular element more heavily based on the executive officer's role.
106
The following table lists our principal executive officer, principal financial officer, our third senior officer and our two other most highly compensated non-officer employees, collectively referred to as named executive officers:
| Barry E. Welch | President and CEO | |
| Patrick J. Welch | CFO and Corporate Secretary | |
| Paul H. Rapisarda | Managing Director, Asset Management and Acquisitions | |
| William B. Daniels | Senior Director, Asset Management | |
| John J. Hulburt | Corporate Controller |
Elements of Compensation
The compensation of each named executive officer includes a base salary, cash bonus and eligibility for awards under the long-term incentive plan. All compensation decisions are made by the Compensation Committee of our board of directors.
Base Salary
The base salaries for our named executive officers for 2009 were established by the Manager, but reviewed by our board of directors as part of the annual approval of the Manager's budget. This review is based on the level of responsibility, the experience level attained by the relevant named executive officer and his or her personal contribution to our financial performance with a goal to ensure that the base salaries are appropriate and competitive.
Annual Cash Bonus (Non-equity Incentive Plan Compensation)
Possible annual cash bonus awards are generally based on whether or not duties have been performed well based on the relevant named executive officer's success in contributing to our operating and financial performance, including achieving annual goals and objectives approved by the Compensation Committee. The annual goals and objectives are established at the company level and are broadly based on (i) company growth strategy through acquisitions and organic growth; (ii) operating performance of existing assets; (iii) investor relations; and (iv) risk management and administrative functions.
In the case of Barry Welch, Patrick Welch and Paul Rapisarda, for each of the three years 2009 through 2011 per the terms of their respective employment contracts there are three components: (i) a portion of the annual cash bonus, identified as "Bonus" in the Summary Compensation Table on page 111, is fixed based on the average amount in 2007 and 2008 of the portion of their bonuses that were paid by the Manager and not reimbursed by Atlantic Power; (ii) a second component is based on our total shareholder return compared to a group of our peer companies. For this portion, which is included in the column identified as "Non-equity Incentive Plan Compensation" in the Summary Compensation Table on page 111, a scale establishes a minimum of zero and a maximum of 110% of a target amount equal to $300,000, $130,000 and $130,000 for Barry Welch, Patrick Welch and Paul Rapisarda, respectively. Relative performance at greater than the 10th percentile of the peer group is required to earn the minimum award and at greater than the 85th percentile of the peer group in order to earn the maximum award; and (iii) a component from zero to a maximum of 20% of the target in (ii) above, which is also included in the column identified as "Non-equity Incentive Plan Compensation" in the Summary Compensation Table on page 111, is based on our board of directors' assessment of the senior officers' performance in contributing to achievement of the company's approved goals and objectives. Specifically in 2009, the directors based these assessments on (i) for Barry Welch, his contributions to the achievement of goals related to our growth strategy, risk management and investor relations, (ii) for Patrick Welch, his contributions to the achievement of goals
107
related to our growth strategy, risk management and investor relations, and (iii) for Paul Rapisarda, his contributions to the achievement of goals related to our growth strategy and operating performance of existing assets.
Total shareholder return refers to the rate of return that a shareholder would earn on an investment in our common shares (or, prior to the conversion of our IPSs to common shares, our IPSs) assuming the investment was held for the entire year and that monthly dividends were reinvested. Our Compensation Committee includes the following companies in the peer group for the purpose of determining our relative total shareholder return performance:
- •
- Brookfield Renewable Power Fund;
- •
- Capital Power Income LP;
- •
- Northland Power Income Fund;
- •
- Macquarie Power and Infrastructure Income Fund;
- •
- Innergex Power Income Fund;
- •
- Boralex, Inc.;
- •
- Boralex Income Fund;
- •
- Algonquin Power & Utilities Corp.; and
- •
- Maxim Power Corp.
In 2009, our total shareholder performance return was at the 89% percentile of our peer group, as calculated by Hugessen Consulting Group ("Hugessen"). For non-officer executives, the non-equity incentive plan compensation is determined based on the process of (i) the CEO discussing their performance with their respective managers together as the officers group, and (ii) the review and discussion by the CEO with the Compensation Committee and their approval. The percentages of salaries for awards range from 0% to maximum levels that vary for each individual based on an overall assessment of their contributions to achieving the company's approved goals and objectives.
Long Term Incentive Plan ("LTIP")
In 2006, our board of directors retained Mercer Human Resource Consulting ("Mercer") to assist in its review of the compensation of the employees of the Manager. The two primary roles of Mercer were (i) to provide a compensation benchmarking review, and (ii) to provide a review of LTIP alternatives and assist our board of directors in the design of the LTIP that was ultimately approved by the board of directors and by our shareholders. The compensation benchmarking review provided the board of directors with an objective review of each component of compensation relative to the same components within a competitive peer group and identified the appropriateness and desirability of implementing the LTIP to further align the interests of employees of the Manager with those of Atlantic Power and holders of IPSs, and to adequately assist with attracting and retaining qualified employees in the relevant U.S. labor pool. The competitive peer group included the Canadian energy trusts, U.S. oil and gas master limited partnerships and U.S. real estate investment trusts listed in the following table, as compiled from their respective publicly-filed proxy information. Mercer also generally considered the overall compensation results shown in the 2005 Financial Services Survey Suite—Private Equity Firms Compensation Survey. Mercer's review concluded that the overall
108
compensation plan, including the LTIP plan and each other component, was reasonable and appropriate.
| US REITs | Canadian Energy Trusts | US Oil & Gas MLPs | ||
|---|---|---|---|---|
| Developers Diversified Rlty | Just Energy Income Fund | Crosstex Energy Lp | ||
| Mack-Cali Realty Corp | Altagas Income Trust | Amerigas Partners Lp | ||
| Reckson Assocs Rlty Corp | ARC Energy Trust | Ferrellgas Partners Lp | ||
| Weingarten Realty Investment | Enerplus Res Fund | Inergy Lp | ||
| New Plan Excel Realty Tr | Fort Chicago Energy Ptnr | Genesis Energy Lp | ||
| SL Green Realty Corp | Bonavista Energy Trust | Magellan Midstream Prtnrs Lp | ||
| Carramerica Realty Corp | Acclaim Energy Trust | Northern Borders Partners Lp | ||
| Health Care Pptys Invest Inc. | PrimeWest Energy Trust | Pacific Energy Partners Lp | ||
| Arden Realty Inc. | Baytex Energy Trust | Markwest Energy Partners Lp | ||
| Federal Realty Invs Trust | Vermillion Energy Trust | Valero Lp | ||
| Regency Centers Corp | Pembina Pipeline Income Fund | K-Sea Transportation Lp | ||
| Equity Lifestyles Properties | Esprit Eng. Trust (fmr Cdn 88 Energy) | Atlas Pipeline Partner Lp | ||
| Glimcher Realty Trust | Paramount Energy Trust | |||
| Heritage Ppty Investment Tr | Advantage Energy Income Fund | |||
| Pan Pac Retail Pptys Inc. | Algonquin Power Income Fund | |||
| Equity One Inc. | Trinidad Drilling Ltd. | |||
| Affordable Residential Comm | Focus Energy Trust | |||
| Boykin Lodging Corp. | Total Energy Svcs Ltd. | |||
| Sun Communities Inc. | ||||
| Parkway Properties | ||||
| Tanger Factory Outlets Ctrs | ||||
| Associated Estates Realty Corp |
The named executive officers and other employees of the Company are eligible to participate in the LTIP as determined by our board of directors. The purpose of the LTIP is to align the interests of named executive officers with those of our shareholders and to assist in attracting, retaining and motivating key employees of the Manager by making a significant portion of their incentive compensation directly dependent upon the achievement of critical strategic, financial and operational objectives that are critical to ongoing growth and increasing the long-term value of Atlantic Power, as well as providing an opportunity to increase their share ownership over time. The LTIP is designed to help achieve short-term compensation objectives by setting yearly performance targets that trigger various levels of grants and also to achieve longer term objectives and assist in retention through the use of both a three-year vesting period and possible forfeiture of awards if certain levels of performance are not achieved during each grant's vesting period.
The following description applies to our initial LTIP, approved by shareholders in June 2006 and amended in June 2008. For each performance period (being, generally, a period of one calendar year commencing on January 1 of each year), for officers, the board of directors establishes LTIP award percentages that will determine the amount (based on a percentage of base salary) that each officer is entitled to receive under the LTIP if certain levels of target project cash flow for the performance period are achieved. For non-officers, a target range based on percentages of salaries is established by the officers and approved by the Compensation Committee, but the range is not directly tied to specific cash flow performance levels. Individual LTIP awards are proposed by the officers based on their evaluation of both the cash flow level achieved by the company and the individual's contribution to that performance, and approved by the Compensation Committee. Project cash flow is based on cash flows generated by our projects less management fees, administrative expenses, corporate interest, taxes and any other adjustments determined by our board of directors, which discretion is exercised narrowly and
109
may reflect either increases or decreases to project cash flow performance. LTIP awards for each performance period are determined by the board of directors based on our actual cash flow. In making this determination, the board of directors has discretion to consider other factors, related to our performance. If certain levels of target project cash flow are achieved as determined by our board of directors, the named executive officer will be eligible to receive a number of notional units (including fractional units) to be calculated by dividing an incentive amount (based on the LTIP award percentages and the named executive officer's base salary) by the market price per IPS. The market price per IPS or common share is defined in the LTIP as the weighted average closing price of IPSs or common shares on the TSX for the five days immediately preceding the applicable day. Notional units are meant to track the investment performance of IPSs or common shares, under the amended LTIP, including share prices and dividends. Any notional units granted to a participant in respect of a performance period will be credited to a notional unit account for each participant on the determination date for such performance period. Each notional unit is entitled to receive distributions equal to the distributions on an IPS, to be credited in the form of additional notional units immediately following any distribution on the IPSs. Subsequent to our conversion to a common share structure, all references to "IPS" in the LTIP were changed to "Common Shares" and all references to distributions on IPSs were changed to dividends on common shares.
For grants under the LTIP, one-third of the notional units in a participant's notional unit account for a performance period vest on the 13-month anniversary following the determination date for such performance period, 50% of the notional units remaining in a participant's notional unit account for a performance period vest on the second anniversary date of the determination date for such performance period, and all remaining notional units in a participant's notional unit account for a performance period vest on the third anniversary of the determination date for such performance period.
On the applicable vesting date for notional units held in a participant's notional unit account, we redeem such vested notional units as follows: (i) one-third by lump sum cash payment (generally intended to be withheld toward payment of taxes that will be owed due to the vesting), and (ii) the remaining two-thirds by an exchange for common shares. Notwithstanding the foregoing, a named executive officer may elect to redeem such notional units for 100% common shares upon prior written notice of such election. All issuances of common shares on redemption of notional units under the LTIP are subject to compliance with applicable securities laws. In addition, the board of directors has the discretion to redeem notional units 100% with cash and has exercised this discretion for all notional units vested since the inception of the LTIP, except for those that have vested in the notional unit accounts of our senior officers.
If the net cash flows (as determined by our board of directors) achieved in a performance period are less than 80% of the target project cash flow previously approved by our board of directors for that performance period, all notional units having a vesting date in the next performance period will be cancelled, will no longer be redeemable for common shares and the executive officers will forfeit all rights, title and interest with respect to such notional units, unless otherwise expressly determined by our board of directors, as administrators of the LTIP.
Pursuant to each senior executive's employment agreement, each senior executive is eligible for an annual award under the LTIP up to a maximum of 150% of their annual base salary. The same percentages versus target cash flow levels are used for all of the officers. In 2009, achieving a minimum of $69.0 million of project cash flow was required to obtain the first tier of 50% of salaries for officers, and their maximum 150% award could be achieved only if the we achieved at least $90.9 million of project cash flow. Named executive officers other than senior executives are eligible for an annual award under the LTIP ranging from 0% to 80% of their annual base salary. For William Daniels and John Hulburt, the minimum award is 0% of their salary and the maximum award is 80% of their salary.
110
In 2009, Hugessen was retained to assist the Board in assessing our existing LTIP and proposing several design changes. The purpose of the LTIP changes is to further align the interests of our officers and employees with shareholders and to assist in attracting, retaining and motivating our key employees.
In early 2010, our board of directors approved amendments to the LTIP. The amendments do not impact grants for the 2009 performance year or unvested notional units related to grants made prior to the amendments. The amended LTIP will be effective for grants beginning with the 2010 performance year and was approved by the shareholders at our annual general meeting held on June 29, 2010.
Under the amended LTIP, the notional units granted to plan participants will have the same characteristics as the notional units under the old LTIP. However, the number of notional units granted will be based, in part, on our total shareholder return compared to a group of peer companies in Canada. In addition, vesting of notional units for senior executives will occur on a three-year cliff basis as opposed to ratable vesting over three years under the old LTIP.
401(k) Matching Contributions
We also make annual matching contributions to each named executive officer's 401(k) plan account based upon a predetermined formula. The purpose of the matching contributions is to supplement the named executive officer's personal savings toward future retirement as we have no pension plan. The matching formula for all employees, including named executive officers, is equal to the employee's 401(k) contribution up to 7% of base salary and cash bonus, up to the maximum allowed by Internal Revenue Service ("IRS") regulations. The IRS maximum contribution in 2009 was $16,500 for participants under age 50 and $22,000 for participants 50 and over.
Summary Compensation Table
The following table sets forth a summary of salary and other annual compensation earned during the year ended December 31, 2009 by each named executive officer (in US$).
Name and Principal Position
|
Year | Salary | Bonus(1) | Stock Awards(2) |
Non-equity Incentive Plan Compensation |
All Other Compensation(3) |
Total Compensation |
||||||||||||||||
|---|---|---|---|---|---|---|---|---|---|---|---|---|---|---|---|---|---|---|---|---|---|---|---|
Barry E. Welch |
2009 | 535,000 | 400,000 | 472,500 | 390,000 | 22,000 | 1,819,500 | ||||||||||||||||
Director, President and Chief Executive Officer |
|||||||||||||||||||||||
Patrick J. Welch |
2009 |
259,500 |
130,000 |
226,800 |
169,000 |
16,500 |
801,800 |
||||||||||||||||
Chief Financial Officer and Corporate Secretary |
|||||||||||||||||||||||
Paul H. Rapisarda |
2009 |
257,500 |
130,000 |
225,000 |
169,000 |
22,000 |
800,500 |
||||||||||||||||
Managing Director, Asset Management and Acquisitions |
|||||||||||||||||||||||
William B. Daniels |
2009 |
185,000 |
— |
110,500 |
166,500 |
22,000 |
484,000 |
||||||||||||||||
Senior Director Asset Management |
|||||||||||||||||||||||
John J. Hulburt |
2009 |
180,000 |
— |
87,500 |
80,000 |
12,601 |
360,101 |
||||||||||||||||
Corporate Controller |
|||||||||||||||||||||||
- (1)
- Represents the fixed portion of annual cash bonus for 2009 through 2011 payable under the terms of each executive officer's new employment contract executed in connection with the management
111
internalization in December 2009. For 2009, these amounts were paid by the Manager and not reimbursed by Atlantic Power.
- (2)
- The
amounts shown above under "Stock Awards" reflect the grant date fair value of notional units granted during the year under the terms of the LTIP and are
calculated in accordance with FASB ASC Topic 718.
- (3)
- Amounts represent company matching contributions to the 401(k) plan accounts of each executive officer.
Following are grants of plan-based awards during the year ended December 31, 2009 for each named executive officer.
| |
|
Estimated Future Payouts Under Non-equity Incentive Plan Awards(a) |
|
|
||||||||||||||
|---|---|---|---|---|---|---|---|---|---|---|---|---|---|---|---|---|---|---|
| |
|
|
Grant Date Fair Value of LTIP Awards ($)(c) |
|||||||||||||||
Name
|
Grant Date | Minimum ($) |
Target ($) |
Maximum ($) |
All Other Stock Awards (#)(b) |
|||||||||||||
Barry E. Welch |
N/A | — | 300,000 | 390,000 | ||||||||||||||
|
3/31/09 | 82,008 | 472,500 | |||||||||||||||
Patrick J. Welch |
N/A |
— |
130,000 |
169,000 |
||||||||||||||
|
3/31/09 | 39,364 | 226,800 | |||||||||||||||
Paul H. Rapisarda |
N/A |
— |
130,000 |
169,000 |
||||||||||||||
|
3/31/09 | 39,052 | 225,000 | |||||||||||||||
William B. Daniels |
N/A |
— |
138,750 |
185,000 |
||||||||||||||
|
3/31/09 | 19,179 | 110,500 | |||||||||||||||
John J. Hulburt |
N/A |
— |
72,000 |
90,000 |
||||||||||||||
|
3/31/09 | 15,187 | 87,500 | |||||||||||||||
- (a)
- Amounts
shown represent the range of possible annual cash bonus. In addition Barry Welch, Patrick Welch and Paul Rapisarda receive an annual fixed bonus
under the terms of their executive employment agreements. The amount of the annual fixed bonus is $400,000 for Barry Welch and $130,000 for Patrick Welch and for Paul Rapisarda.
- (b)
- The
amount shown represents the number of notional units granted for the 2008 performance year that was approved by our board of directors on
March 31, 2009.
- (c)
- Amounts are calculated in accordance with FASB ASC Topic 718.
Compensation of Barry Welch
Prior to December 31, 2009, Barry Welch was the President and Chief Executive Officer of the Manager. Beginning in 2010, Mr. Welch became our President and Chief Executive Officer. For the year ended December 31, 2009, Mr. Welch received a base salary of $535,000, an annual bonus of $790,000 ($400,000 of which was paid by the Manager and not reimbursed by us), and in March 2010 a grant of 41,565 notional units under the initial LTIP with an estimated total fair market value of $535,000 as at the date of grant.
Mr. Welch's base salary was historically established by the Manager, but reviewed by our independent directors as part of the annual approval of the Manager's budget, based on his responsibilities, his execution of our strategic business plan, whether it is appropriate and competitive relative to compensation of similar positions with competitive peer firms and changes to local cost of living. His salary increased by $10,000 as of January 2009 and is unchanged for 2010.
112
Starting with the 2009 performance year, Mr. Welch's bonus was determined with one portion equal to the average level that the Manager's portion of his bonus had been paid for the prior two years, that being $400,000, which was paid by the Manager and not reimbursed by us. The other portion of Mr. Welch's bonus was determined based on the sum of a maximum $330,000 determined by our 2009 total shareholder return performance relative to our peer group and a maximum $60,000 based on the independent directors' assessment of his performance against annually approved goals and objectives.
The 2009 LTIP award to Mr. Welch was based on his contribution to achieving target levels of a cash flow measure that are approved each year by our independent directors, as well as progress in successfully executing our strategic plan and goals and objectives, which are also approved by our independent directors each year. The maximum annual award has been set at 150% of base salary with vesting occurring ratably over the three-year period immediately following the LTIP award. Based on our actual project cash flow of $78.8 million, and board of directors' discretion, the LTIP award for the 2009 performance year for all senior officers was set at 100% of their base salary, compared to the prior year's 90% and was granted by our board of directors on March 29, 2010.
Compensation of Patrick Welch
Prior to December 31, 2009, Patrick Welch was the Chief Financial Officer and Corporate Secretary of the Manager. Beginning in 2010, Mr. Welch became our Chief Financial Officer and Corporate Secretary. For the financial year ended December 31, 2009, Mr. Welch received a base salary of $259,000, and an annual bonus of $299,000 ($130,000 of which was paid by the Manager and not reimbursed by us), and in March 2010 a grant of 20,161 notional units under the LTIP with an estimated total fair market value of $259,500 as at the date of grant.
Mr. Welch's base salary was historically established by the Manager, but reviewed by our independent directors based on his responsibilities, his role in execution of our strategic business plan and whether it is appropriate and competitive relative to compensation of similar positions with competitive peer firms and changes to local cost of living. Mr. Welch's salary was increased by $7,500 as of January 2009 and is unchanged for 2010.
Starting with the 2009 performance year, Mr. Welch's bonus was determined with one portion fixed at approximately the average level that the Manager's portion of his bonus had been paid for the prior two years, or $130,000, which was paid by the Manager and not reimbursed by us. The other portion of Mr. Welch's bonus was determined based on the sum of a maximum $143,000 determined by our 2009 total shareholder return performance relative to our peer group and a maximum $26,000 based on the independent directors' assessment of his performance against annually approved goals and objectives.
LTIP awards to Mr. Welch are based on his contribution to achieving target levels of a cash flow measure that are approved each year by our independent directors, as well as progress in successfully executing our strategic plan and goals and objectives, which are also approved by our independent directors each year. Currently, the maximum annual award has been set at 150% of base salary with vesting occurring ratably over the three-year period immediately following the LTIP award. Based on our actual cash flow of $78.8 million, and the board of directors' discretion, the LTIP award for the 2009 performance year for all senior officers was set at 100% of base salary compared to the prior year's 90% and was granted by our board of directors on March 29, 2010.
Compensation of Paul Rapisarda
Prior to December 31, 2009, Paul Rapisarda was the Managing Director, Asset Management and Acquisitions of the Manager. Beginning in 2010, Mr. Rapisarda became our Managing Director, Asset Management and Acquisitions. For the financial year ended December 31, 2009, Mr. Rapisarda received a base salary of $257,500, an annual bonus of $299,000 ($130,000 of which was paid by the
113
Manager and not reimbursed by us), and a grant of 20,006 notional units under the LTIP with an estimated total fair market value of $257,500 as at the date of grant.
Mr. Rapisarda's base salary was historically established by the Manager, but reviewed by our independent directors based on his responsibilities, his role in execution of our strategic business plan and whether it is appropriate and competitive relative to compensation of similar positions with competitive peer firms and changes to local cost of living. His salary was increased by $7,500 in 2009 and is unchanged in 2010.
Starting with the 2009 performance year, Mr. Rapisarda's bonus was determined with one portion fixed at approximately the average level that the Manager's portion of his bonus had been paid for the prior two years, or $130,000, which was paid by the Manager and not reimbursed by us. The other portion of Mr. Rapisarda's bonus was determined based on the sum of a maximum $143,000 determined by our 2009 total shareholder return performance relative to our peer group and a maximum $26,000 based on the independent directors' assessment of his performance against annually approved goals and objectives.
LTIP awards to Mr. Rapisarda are based on his contribution to achieving target levels of a cash flow measure that are approved each year by our independent directors, as well as progress in successfully executing our strategic plan and goals and objectives, which are also approved by our independent directors each year. Currently, the maximum annual award has been set at 150% of base salary with vesting occurring over the three-year period immediately following the LTIP award. Based on our actual cash flow of $78.8 million, and the board of directors' discretion, the LTIP award for the 2009 performance year for all senior officers was set at 100% of base salary versus the prior year's 90% and was granted by our board of directors on March 29, 2010.
Compensation of William Daniels
Prior to December 31, 2009, William Daniels was the Senior Director, Asset Management of the Manager. Beginning in 2010, Mr. Daniels became our Senior Director, Asset Management. For the financial year ended December 31, 2009, Mr. Daniels received a base salary of $185,000, an annual bonus of $166,500 ($136,000 of which was paid by the Manager and not reimbursed by us) and a grant of 10,061 notional units under the LTIP with an estimated total fair market value of $129,500 as at the date of grant.
Mr. Daniels' base salary was historically established by the Manager, but reviewed by our independent directors based on his responsibilities, his role in execution of our strategic business plan and whether it is appropriate and competitive relative to compensation of similar positions with competitive peer firms and changes to local cost of living. His salary was increased by $15,000 in 2009 and is unchanged for 2010.
Mr. Daniels' 2009 annual bonus was determined using 90% of his salary, which was agreed upon among the Manager, the independent directors and our three senior executives based on an assessment of his contributions to achievement of our annual goals and objectives approved by our board of directors in January 2009.
LTIP awards to Mr. Daniels are based on his contribution to achieving target levels of a cash flow measure that are approved each year by our independent directors, as well as progress in successfully executing our strategic plan and goals and objectives, which are also approved by our independent directors each year. Vesting of this award occurs ratably over the three-year period immediately following the LTIP award. Based on our actual cash flow compared to the project cash flow levels, and the board of directors' discretion, Mr. Daniels' LTIP award in 2009 was set at 70% of base salary versus the prior year's 65% and was granted by our board of directors on March 29, 2010.
114
Compensation of John J. Hulburt
Prior to December 31, 2009, John Hulburt was the Corporate Controller of the Manager. Beginning in 2010, Mr. Hulburt became our Corporate Controller. For the financial year ended December 31, 2009, Mr. Hulburt received a base salary of $180,000, an annual bonus of $80,000 ($40,000 of which was paid by the Manager and not reimbursed by us) and a grant of 8,391 notional units under the LTIP with an estimated total fair market value of $108,000 as at the date of grant.
Mr. Hulburt's base salary was historically established by the Manager, but reviewed by our independent directors based on his responsibilities, his role in execution of our strategic business plan and whether it is appropriate and competitive relative to compensation of similar positions with competitive peer firms and changes to local cost of living. His salary was increased by $5,000 in 2009 and $3,000 beginning in January 2010.
Mr. Hulburt's 2009 annual bonus was determined using approximately 44% of his salary, which was agreed upon among the Manager, the independent directors and our three senior executives based on an assessment of his contributions to achievement of our annual goals and objectives approved by our board of directors in January 2009.
LTIP awards to Mr. Hulburt are based on his contribution to achieving target levels of a cash flow measure that are approved each year by our independent directors, as well as progress in successfully executing our strategic plan and goals and objectives, which are also approved by our independent directors each year. Vesting of this award occurs ratably over the three-year period immediately following the LTIP award. Based on our actual cash flow compared to the project cash flow levels, and the board of directors' discretion, the LTIP award for the 2009 performance year was set at 60% of base salary versus the prior year's 50% and was granted by our board of directors on March 29, 2010.
Outstanding Share-Based Awards
The following table sets forth, for each named executive officer, all share-based awards outstanding under the terms of the LTIP as of December 31, 2009:
| |
Share-Based Awards | ||||||
|---|---|---|---|---|---|---|---|
Name
|
Number of shares or units of shares that have not vested(1)(2) |
Market or pay-out value of share-based awards that have not vested (US$)(2) |
|||||
Barry E. Welch |
178,317 | 1,945,442 | |||||
Patrick J. Welch |
85,592 | 933,812 | |||||
Paul H. Rapisarda |
50,943 | 555,793 | |||||
William B. Daniels |
30,543 | 333,222 | |||||
John J. Hulburt |
16,576 | 180,839 | |||||
- (1)
- Notional
units granted under the LTIP vest over a three-year period in accordance with the terms of the LTIP, subject to performance-based
forfeiture.
- (2)
- This amount includes notional units credited under the LTIP to the Notional Unit Account of the Named Executive Officer at the time of the monthly distributions made on the IPSs during the fiscal year ended December 31, 2009.
115
Stock Vested
The following table sets forth, for each named executive officer, the value of all share-based incentive plan awards vested during the year ended December 31, 2009:
Name
|
Number of Shares Acquired on Vesting (US$) |
Value Realized on Vesting (US$) |
|||||
|---|---|---|---|---|---|---|---|
Barry E. Welch |
38,055 | 416,196 | |||||
Patrick J. Welch |
18,266 | 199,775 | |||||
Paul H. Rapisarda |
2,529 | 27,665 | |||||
William B. Daniels |
— | 31,936 | |||||
John J. Hulburt |
— | — | |||||
Employment Contracts
Each of Barry Welch (President and Chief Executive Officer), Patrick Welch (Chief Financial Officer and Corporate Secretary) and Paul Rapisarda (Managing Director, Asset Management and Acquisitions) were employees of the Manager, which managed our business under the management agreement through its termination date of December 31, 2009. In connection with the termination of the management agreement on December 31, 2009, we hired all of the employees of the Manager. As a result, the employment agreements with our senior executives were terminated and were replaced with new employment agreements. To assist in the structuring and negotiation of the employment agreements, our independent directors employed Hugessen to review and advise on their terms to ensure that the agreements were consistent with best practices in the marketplace. The most significant change in the new employment agreements are the removal of the Manager as a party to the agreements and the assumption by our independent directors of all compensation decisions related to our senior executives. Each of the employment agreements provides the respective officer with the following: (i) an initial annual base salary, which is subject to annual review; (ii) eligibility for a performance-based annual cash bonus; (iii) eligibility to participate in the LTIP; and (iv) certain other customary employee benefits. Under the employment agreements, the annual base salary for 2010 for Barry Welch, Patrick Welch and Paul Rapisarda is $535,000, $259,500 and $257,500, respectively.
Termination and Change of Control Benefits
Each named senior executive officer's employment agreement provides that if the respective officer is terminated without cause, or within 90 days preceding or one year after a change in control or if he resigns within that time period because certain further triggering events have occurred including a constructive dismissal, reduction in salary or benefits, relocation, change in position of employment or reporting relationships, or breach of the employment agreement, then the following are paid or provided under the employment agreement: (i) his salary and bonus pro-rated through the termination date; (ii) a termination payment equal to three times the average (in the case of Barry Welch) or one times the average (in the case of Patrick Welch and Paul Rapisarda), during the last two years, of the sum of the respective officer's: (a) base salary, (b) annual cash bonus, and (c) the most recent matching contribution to his 401(k) plan; (iii) immediate vesting of all previous awards under the LTIP which had not yet vested; (iv) continuation of all employee benefits for a period of two years (in the case of Barry Welch) or one year (in the case of Patrick Welch and Paul Rapisarda) following termination; and (v) costs of outplacement services customary for senior executives at the respective officer's level for a period of 12 months following termination with the cost capped at $25,000. The employment agreements also contain non-competition and non-solicitation limitations on each of the officers following certain termination events. The non-competition restrictions apply for a period of one year or one month (in the case of Barry Welch) or a period of one month or six months (in the case of Patrick Welch and Paul Rapisarda) following termination depending on the circumstances of the termination
116
and the non-solicitation restrictions apply for a period of two years (in the case of Barry Welch) or one year (in the case of Patrick Welch and Paul Rapisarda) following the date of termination.
In each senior executive officer's employment agreement, the term "Change in Control" means the occurrence of any of the following events: (i) the sale, lease or transfer to any person or group, in one or a series of related transactions, of our assets, directly or indirectly, which assets generated more than 50% of our cash flow in a 12-month period ended on the last day of the most recent fiscal quarter to any person or group; (ii) the adoption of a plan related to our liquidation or dissolution; (iii) the acquisition by any person or group of a direct or indirect interest in more than 50% of our common shares or voting power; (iv) our merger or consolidation with another person with the effect that immediately after such transaction our shareholders immediately prior to such transaction hold, directly or indirectly, less than 50% of the voting control over the person surviving such merger or consolidation; or (v) we enter into any agreement providing for any of the foregoing; or the date which is 90 days prior to a definitive announcement of any of the foregoing whichever is earlier, and the transaction contemplated thereby is ultimately consummated.
If Barry Welch, Patrick Welch or Paul Rapisarda is terminated for cause, then he will be entitled to all vested benefits under all incentive compensation or other plans in accordance with the terms and conditions of such plan, however he will not be entitled to the payments or benefits listed in items (i) through (v) in the second preceding paragraph above, except as may be required by applicable law. "Cause" is defined in each employment agreement as "a termination by reason of the Company's good faith determination that the Executive (i) engaged in willful misconduct in the performance of his duties, (ii) breached a fiduciary duty to the Company for personal profit to himself, (iii) after determination by a court of competent jurisdiction, willfully violated any law, rule or regulation of a governmental authority with jurisdiction over the Executive or the Company at the time and place of such violation (other than traffic violation or similar offenses) or any final cease and desist order of a court or other tribunal of competent jurisdiction, or (iv) materially and willfully breached this Agreement. No act, or failure to act, on the Executive's part shall be considered "willful" unless he has acted, or failed to act, with an absence of good faith and without a reasonable belief that this action or failure to act was in the best interest of the Company."
The following table provides, for each of the foregoing senior executive officers, an estimate of the payments payable by us, assuming a termination for any reason other than cause, including the occurrence of the triggering events described above, took place on December 31, 2009:
Name
|
Type of Payment | Termination Payment(1) (US$) |
2009 Pro-Rata Bonus (US$) |
Vesting of Stock Based Compensation (US$) |
Employee Benefits (US$) |
Total (US$) |
||||||||||||
|---|---|---|---|---|---|---|---|---|---|---|---|---|---|---|---|---|---|---|
Barry E. Welch |
Termination without Cause or in connection with Change of Control |
3,643,500 | 790,000 | 1,992,216 | 85,576 | 6,511,293 | ||||||||||||
Patrick J. Welch |
Termination without Cause or in |
492,250 |
299,000 |
956,264 |
55,288 |
1,802,802 |
||||||||||||
Paul H. Rapisarda |
Termination without Cause or in |
500,750 |
299,000 |
569,156 |
55,288 |
1,424,194 |
||||||||||||
- (1)
- Includes three times the average (in the case of Barry Welch) or one times the average (in the case of Patrick Welch and Paul Rapisarda), during the last two years, of the sum of the respective officer's: (a) base salary, (b) annual Bonus, and (c) the most recent matching contribution to his 401(k) plan.
Compensation Risk Assessment
We have reviewed our compensation policies and practices for all employees and concluded that any risks arising from our policies and programs are not reasonably likely to have a material adverse
117
effect on our company. We believe that the mix and design of the elements of executive compensation do not encourage management to assume excessive risks. We reviewed the elements of executive compensation to determine whether any portion of executive compensation encouraged excessive risk taking and concluded:
- •
- our allocation of compensation between cash compensation and long-term equity compensation, combined with the
vesting schedule under our LTIP, discourages short-term risk taking;
- •
- our approach of goal setting, setting of targets with payouts at multiple levels of performance, capping the amount of our
incentive payouts, and evaluation of performance results assist in mitigating excessive risk-taking;
- •
- our compensation decisions include subjective considerations, which limit the influence of formulae or objective factors
on excessive risk taking; and
- •
- our business does not face the same level of risks associated with compensation for employees at financial services firms (traders and instruments with a high degree of risk).
118
CERTAIN RELATIONSHIPS AND RELATED PARTY TRANSACTIONS
See the information regarding our executive officers' prior employment relationship with the Manager set forth in "Management—Compensation Discussion and Analysis." We have also entered into indemnity agreements with our directors and executive officers, whereby we have agreed to indemnify the directors and officers to the extent permitted by our organizational documents and applicable law. Our articles of continuance permit us, subject to the limitations contained in applicable law, to purchase and maintain insurance on behalf of any person, as our board of directors may from time to time determine. Our directors and officers liability insurance coverage consists of three policies with aggregate limits of $30 million.
Our board of directors will review and approve all relationships and transactions in which we and any of our directors, director nominees and executive officers and their immediate family members, as well as holders of more than 5% of any class of its voting securities and their family members, have a direct or indirect material interest. In approving or rejecting such proposed relationships and transactions, our board of directors shall consider the relevant facts and circumstances available and deemed relevant to this determination. The Nominating and Governance Committee of our board of directors is responsible under its charter for monitoring compliance with the Code of Business Conduct and Ethics.
119
SECURITY OWNERSHIP OF CERTAIN BENEFICIAL OWNERS AND MANAGEMENT
The following table sets forth information regarding the beneficial ownership of our common shares as of August 12, 2010 with respect to:
- •
- each person (including any "group" of persons as that term is used in Section 13(d)(3) of the Exchange Act) who is
known to us to be the beneficial owner of more than 5% of our outstanding common shares;
- •
- each of our directors;
- •
- each of our executive officers named in the Summary Compensation Table on page 111 of this prospectus; and
- •
- all of our directors and executive officers as a group.
Unless otherwise indicated below, the address of each beneficial owner listed in the following table is c/o Atlantic Power Corporation, 200 Clarendon Street, Floor 25, Boston, MA 02116.
Except as otherwise indicated in the footnotes to the following table, we believe, based on the information provided to us, that the persons named in the following table have sole voting and investment power with respect to the shares they beneficially own, subject to applicable community property laws.
Name of Beneficial Owner
|
Number of Common Shares Beneficially Owned |
Percentage of Common Shares Beneficially Owned (%)(1) |
|||||
|---|---|---|---|---|---|---|---|
Directors and Named Executive Officers |
|||||||
Irving R. Gerstein |
10,400 | * | |||||
Kenneth M. Hartwick |
46,033 | (3) | * | ||||
John A. McNeil |
12,500 | * | |||||
Richard Foster Duncan |
— | * | |||||
Holli Nichols |
31 | (3) | * | ||||
Barry E. Welch |
380,399 | (2) | * | ||||
Patrick J. Welch |
166,542 | (2) | * | ||||
Paul H. Rapisarda |
114,177 | (2) | * | ||||
William B. Daniels |
30,333 | (2) | * | ||||
John J. Hulburt |
20,458 | (2) | * | ||||
All directors and named executive officers as a group (10 persons) |
773,607 | 1.3 | |||||
- *
- Less
than 1%
- (1)
- The
applicable percentage ownership is based on 60,510,070 common shares issued and outstanding as of August 12, 2010.
- (2)
- Common shares beneficially owned include the following unvested notional units in our long-term incentive plan.
Barry E. Welch |
222,203 | |||
Patrick J. Welch |
108,609 | |||
Paul H. Rapisarda |
99,128 | |||
William B. Daniels |
30,333 | |||
John J. Hulburt |
20,458 |
- (3)
- Common shares beneficially owned include units held in our Directors' Deferred Share Unit Plan of 46,033 for Ken Hartwick and 31 for Holli Nichols.
See "Management—Compensation Discussion and Analysis" for more information.
120
The following summary description sets forth some of the general terms and provisions of our common shares. Because this is a summary description, it does not contain all of the information that may be important to you. For a more detailed description of our common shares, you should refer to the provisions of our Articles of Continuance, which we refer to as our "Articles."
The last reported sale price of our common shares on the TSX on August 12, 2010 was Cdn$13.25 per common share, and the last reported sale price of our common shares on the NYSE on August 12, 2010 was $12.69 per common share.
Common Shares
Our Articles authorize an unlimited number of common shares. At the close of business on August 12, 2010, 60,510,070 of our common shares were issued and outstanding.
Our common shares are listed on the TSX under the symbol "ATP" and began trading on the NYSE under the symbol "AT" on July 23, 2010. Holders of our common shares are entitled to receive dividends as and when declared by our board of directors and are entitled to one vote per common share on all matters to be voted on at meetings of shareholders. We are limited in our ability to pay dividends on our common shares by restrictions under the Business Corporations Act (British Columbia), which we refer to as the "BC Act," relating to our solvency before and after the payment of a dividend. Holders of our common shares have no preemptive, conversion or redemption rights and are not subject to further assessment by us.
Upon our voluntary or involuntary liquidation, dissolution or winding up, the holders of common shares are entitled to share ratably in the remaining assets available for distribution, after payment of liabilities.
Holders of our common shares will have one vote for each common share held at meetings of our common shareholders.
Pursuant to our Articles and the provisions of the BC Act, certain actions that may be proposed by us require the approval of our shareholders. We may, by special resolution and subject to our Articles, increase our authorized capital by such means as creating shares with or without par value or increasing the number of shares with or without par value. We may, by special resolution, alter our Articles to subdivide, consolidate, change from shares with par value to shares without par value or from shares without par value to shares with par value or change the designation of all or any of our shares. We may also, by special resolution, alter our Articles to create, define, attach, vary, or abrogate special rights or restrictions to any shares. Under the BC Act and our Articles, a special resolution is a resolution passed at a duly-convened meeting of shareholders by not less than two-thirds of the votes cast in person or by proxy at the meeting, or a written resolution consented to by all shareholders who would have been entitled to vote at the meeting of shareholders.
Certain Provisions of our Articles and the BC Act
We are governed by the BC Act. Our Articles contain provisions that could have the effect of delaying, deferring or discouraging another party from acquiring control of our company by means of a tender offer, a proxy contest or otherwise.
Advance Notice Procedures
Our Articles establish an advance notice procedure for "special business" and shareholder proposals to be brought before a meeting of shareholders. For special business, advance notice describing the special business to be discussed at the meeting must be provided and that notice must
121
include any documents to be approved or ratified as an addendum or state that such document will be available for inspection at our records office or other reasonably accessible location. Shareholders at an annual meeting may not consider proposals or nominations that are not specified in the notice of meeting or brought before the meeting by or at the direction of the board of directors or by a shareholder of record on the record date for the meeting, who is entitled to vote at the meeting.
Advance Notice Procedures
Under the BC Act, shareholders may make proposals for matters to be considered at the annual general meeting of shareholders. Such proposals must be sent to us in advance of any proposed meeting by delivering a timely written notice in proper form to our registered office. The notice must include information on the business the shareholder intends to bring before the meeting. These provisions could have the effect of delaying until the next shareholder meeting shareholder actions that are favored by the holders of a majority of our outstanding voting securities.
Shareholder Requisitioned Meeting
Under the BC Act, shareholders holding 1/20 of our outstanding common shares may request the directors to call a general meeting of shareholders to deal with matters that may be dealt with at a general meeting, including election of directors. If the directors do not call the meeting within the timeframes specified in the Act, the shareholder can call the meeting and we must reimburse the costs.
Removal of Directors and Increasing Board Size
Under our Articles, directors may be removed by shareholders by passing an ordinary resolution of a simple majority of shareholders with the right to vote on such resolution. Further, under our Articles, the directors may appoint additional directors up to one-third of the directors elected by the shareholders.
Canadian Securities Laws
We are a reporting issuer in Canada and therefore subject to the securities laws in each province and territory in which we are reporting. Canadian securities laws require reporting of share purchases and sales by shareholders holding more than 10% of our common shares, including certain prescribed public disclosure of their intentions for their holdings. Canadian securities laws also govern how any offer to acquire more than 20% of our equity or voting shares must be conducted.
Transfer Agent and Registrar
Computershare Investor Services Inc. and Computershare Trust Company, N.A. serve as our transfer agents and registrars for our common shares.
122
DESCRIPTION OF CONCURRENT OFFERING OF CONVERTIBLE DEBENTURES
The following description is a summary of the material provisions of the convertible debentures we are offering in a concurrent offering and the indenture that governs the convertible debentures. It does not purport to be complete. This summary is subject to and is qualified by reference to the provisions of the indenture, including the definitions of the terms used in the indenture.
Concurrently with this offering, we are offering Cdn$ in aggregate principal amount of our % Series B convertible unsecured subordinated debentures due in a public offering in Canada. We have also granted the underwriters of the convertible debentures a 30-day option to purchase up to Cdn$ in aggregate principal amount of the convertible debentures to cover over-allotments, if any. The convertible debentures and our common shares issuable upon conversion of the convertible debentures are being registered in the United States under the Securities Act and qualified for distribution in certain Canadian provinces and territories under the Canadian securities laws. The debentures will rank subordinate to all of our existing and future senior secured and senior unsecured indebtedness, including trade creditors, and will rank pari passu to any future subordinated unsecured indebtedness.
The debentures will be convertible into our common shares at the option of the holder at any time prior to the close of business on the earlier of and the business day immediately preceding the date specified by us for redemption of the debentures, at a conversion price of Cdn$ per common share, being a ratio of approximately common shares per Cdn$1,000 principal amount of debentures, subject to adjustment upon the occurrence of certain events. Under certain circumstances, the Company may, at its option, elect to satisfy its obligation to repay the principal amount of the debentures by issuing and delivering common shares to the holders of the convertible debentures.
The debentures are being offered by means of a separate prospectus, and not this prospectus. The completion of this offering of common shares is not subject to the completion of the concurrent offering of convertible debentures and the completion of the concurrent offering of convertible debentures is not subject to the completion of this offering.
123
CERTAIN UNITED STATES FEDERAL INCOME TAX CONSIDERATIONS
The following general summary describes certain U.S. federal income tax considerations for U.S. Holders (as defined below) of our common shares. This summary does not address all of the tax considerations that may be relevant to certain types of U.S. Holders subject to special treatment under U.S. federal income tax laws, such as:
- •
- persons who do not hold common shares as capital assets;
- •
- dealers in securities or currencies;
- •
- financial institutions;
- •
- regulated investment companies;
- •
- real estate investment trusts;
- •
- tax-exempt entities (including private foundations);
- •
- qualified retirement plans, individual retirement accounts, and other tax-deferred accounts;
- •
- insurance companies;
- •
- persons holding common shares as a part of a hedging, integrated, conversion or constructive sale transaction or a
straddle;
- •
- persons that own, directly, indirectly or as a result of certain constructive ownership rules, common shares representing
10% or more of the voting power in Atlantic Power;
- •
- traders in securities that elect to use a mark-to-market method of accounting;
- •
- persons liable for alternative minimum tax;
- •
- U.S. Holders whose "functional currency" is not the U.S. dollar; or
- •
- U.S. tax expatriates and certain former citizens and long-term residents of the United States.
This summary is based upon the provisions of the United States Internal Revenue Code of 1986 (as amended, the "Code"), the United States Treasury Regulations promulgated thereunder, and administrative and judicial interpretations of the Code and the United States Treasury Regulations, all as currently in effect, and all subject to differing interpretations or change, possibly on a retroactive basis. This summary does not address any estate, gift, state, local, non-U.S. or other tax consequences, except as specifically provided herein.
For purposes of this summary, a "U.S. Holder" means a person that holds common shares that is, for U.S. federal income tax purposes:
- •
- an individual who is a citizen or resident of the U.S. (as determined under U.S. federal income tax rules);
- •
- a corporation (or other entity taxable as a corporation for U.S. federal income tax purposes) created or organized in or
under the laws of the United States or of any political subdivision thereof;
- •
- an estate, the income of which is subject to U.S. federal income taxation regardless of its source; or
- •
- a trust if it (i) is subject to the primary supervision of a court within the United States and one or more U.S. persons have the authority to control all substantial decisions of the trust or (ii) has in effect a valid election under applicable United States Treasury Regulations to be treated as a U.S. person.
124
If a partnership or an entity treated as a partnership for U.S. federal income tax purposes holds common shares, the U.S. federal income tax treatment of a partner in the partnership will generally depend on the status of the partner and the activities of the partnership. Partnerships or a partner in a partnership holding common shares should consult their own tax advisor regarding the consequences of the ownership and disposition of common shares by the partnership.
The following summary is of a general nature only and is not a substitute for careful tax planning and advice. U.S. Holders of common shares are urged to consult their own tax advisors concerning the U.S. federal income tax consequences of the issues discussed herein, in light of their particular circumstances, as well as any considerations arising under the laws of any foreign, state, local or other taxing jurisdiction.
Taxation of Distributions on Common Shares
The gross amount (i.e., before Canadian withholding tax) of distributions to a U.S. Holder on our common shares (other than distributions in liquidation or in redemption of stock that are treated as exchanges) will be treated as a dividend, to the extent paid out of our current or accumulated earnings and profits (as determined under U.S. federal income tax principles). Such dividend will be includible in a U.S. Holder's gross income on the day actually or constructively received. Distributions to a U.S. Holder in excess of earnings and profits will be treated first as a return of capital that reduces a U.S. Holder's tax basis in such common shares (thereby increasing the amount of gain or decreasing the amount of loss that a U.S. Holder would recognize on a subsequent disposition of our common shares), and then as gain from the sale or exchange of such common shares.
Non-corporate U.S. Holders will generally be eligible for the preferential U.S. federal rate on qualified dividend income for tax years beginning on or before December 31, 2010, provided that we are a "qualified foreign corporation," the stock on which the dividend is paid is held for a minimum holding period, and other requirements are satisfied.
A qualified foreign corporation includes a foreign corporation that is not a PFIC (as defined below) in the year of the distribution or in the prior tax year and that is eligible for the benefits of an income tax treaty with the United States, if such treaty contains an exchange of information provision and the United States Treasury Department has determined that the treaty is satisfactory for purposes of the legislation. Based on current law and applicable administrative guidance, our dividends paid before December 31, 2010 should be eligible for treatment as qualified dividend income, provided the holding period and other requirements are satisfied. In the absence of intervening legislation, dividends received by a U.S. Holder after tax years beginning on or after December 31, 2010 will be taxed to such Holder at ordinary income rates.
Distributions to U.S. Holders generally will not be eligible for the dividends received deduction generally allowed to U.S. corporations in respect of dividends received from other U.S. corporations.
A U.S. Holder will be taxed on the U.S. dollar value of any Canadian dollars received as dividends, generally determined at the spot rate as of the date the payment is actually or constructively received. No currency exchange gain or loss will be recognized by a U.S. Holder on such dividend payments if the Canadian dollars are converted into U.S. dollars on the date received at that spot rate. Any gain or loss on a subsequent conversion or other disposition of Canadian dollars generally will be treated as U.S.-source ordinary income or loss.
Taxation of Sale, Exchange or Other Taxable Disposition of Common Shares
Upon the sale, exchange or other taxable disposition of a common share, a U.S. Holder generally will recognize gain or loss equal to the difference between the amount realized upon the sale, exchange or other disposition and such U.S. Holder's tax basis in the common share. The amount realized on the
125
sale, exchange or other taxable disposition of the common shares will be the U.S. dollar value of any Canadian dollars received in the transaction, which is determined for cash basis taxpayers on the settlement date for the transaction and for accrual basis taxpayers on the trade date (although accrual basis taxpayers can also elect the settlement date). Any such gain or loss will generally be capital gain or loss and will generally be long-term capital gain or loss if the U.S. Holder's holding period for the common shares transferred exceeds one year on the date of the sale or disposition. Long-term capital gains of non-corporate U.S. Holders derived with respect to the disposition of common shares are currently subject to tax at reduced rates. The deductibility of capital losses is subject to several limitations. Any gain or loss realized on a subsequent conversion or other disposition of Canadian dollars will be ordinary gain or loss.
Disclosure of Reportable Transactions
If a U.S. Holder sells or disposes of the common shares at a loss or otherwise incurs certain losses that meet certain thresholds, such U.S. Holder may be required to file a disclosure statement with the IRS. For U.S. Holders that are individuals or trusts, there is a special reporting requirement threshold for foreign currency losses, which is US$50,000. Failure to comply with these and other reporting requirements could result in the imposition of significant penalties.
Foreign Tax Credit Limitations
U.S. Holders may be subject to Canadian withholding tax on payments made with respect to the common shares. Subject to certain conditions and limitations, such withholding taxes may be treated as foreign taxes eligible for credit against a U.S. Holder's U.S. federal income tax liability. Such credit may not be available to U.S. holders owning the common shares in a non-taxable account. Additionally, foreign taxes may not be eligible to the extent they could have been reduced pursuant to an income tax treaty.
It is possible that we are, or at some future time will be, at least 50% owned by U.S. persons. Dividends paid by a foreign corporation that is at least 50% owned by U.S. persons may be treated as U.S.-source income (rather than foreign-source income) for foreign tax credit purposes to the extent the foreign corporation has more than an insignificant amount of U.S.-source income. The effect of this rule may be to treat a portion of any dividends we pay as U.S.-source income. Treatment of the dividends as U.S.-source income in whole or in part may limit a U.S. Holder's ability to claim a foreign tax credit for the Canadian withholding taxes payable in respect of the dividends. Subject to certain limitations, the Code permits a U.S. Holder entitled to benefits under the U.S.-Canadian income tax treaty to elect to treat any Company dividends as foreign-source income for foreign tax credit purposes. U.S. Holders should consult their own tax advisors about the desirability of making, and the method of making, such an election.
The rules governing foreign tax credits are complex. U.S. Holders are urged to consult their own tax advisors regarding the availability of foreign tax credits in their particular circumstances.
Passive Foreign Investment Company
A foreign corporation is a passive foreign investment company ("PFIC") within the meaning of Section 1297 of the Code if, during any taxable year, (i) 75% or more of its gross income consists of certain types of passive income, or (ii) the average value (or basis in certain cases) of its passive assets (generally assets that generate passive income) is 50% or more of the average value (or basis in certain cases) of all of its assets. If we were a PFIC while a taxable U.S. Holder held common shares, the PFIC rules could have the effect of subjecting such U.S. Holder to an interest charge on any deferred taxation and taxing gain upon the sale of our common shares as ordinary income. In addition, under recently enacted legislation each U.S. Holder of a PFIC is required to file an annual report containing
126
such information as the U.S. Department of the Treasury may require. If we were classified as a PFIC in any year with respect to which a U.S. Holder owns common shares, we would continue to be treated as a PFIC with respect to the U.S. Holder in all succeeding years during which the U.S. Holder owns common shares, regardless of whether we continue to meet the tests described above. However, if we ceased to be a PFIC, a U.S. Holder of our common shares could avoid some of the adverse effects of the PFIC regime by making a deemed sale election with respect to our common shares.
We do not believe we are a PFIC, and we do not expect to become a PFIC. If our income or asset composition were to become more passive (including through the acquisition of assets that generate passive income, or minority investments in stock of corporations), we could potentially become a PFIC. Our PFIC status for any taxable year may also depend upon the extent to which our revenue is subject to special PFIC rules with respect to "commodities," an analysis that raises uncertainties in application and interpretation. Additionally, if we were a PFIC and were to form or acquire non-U.S. subsidiaries that are treated as corporations for U.S. tax purposes, such subsidiaries could potentially be PFICs. If we owned a subsidiary that is a PFIC, then taxable U.S. Holders could be adversely affected as a result of their indirect ownership of stock in any subsidiary of ours that is a PFIC.
Information Reporting and Backup Withholding
In general, information reporting requirements will apply to payments with respect to common shares paid to a U.S. Holder other than certain exempt recipients (such as corporations). Backup withholding will apply to such payments if such U.S. Holder fails to provide a taxpayer identification number or certification of other exempt status or fails to comply with the applicable requirements of the backup withholding rules. Any amounts withheld under the backup withholding rules will be allowed as a refund or a credit against such U.S. Holder's U.S. federal income tax liability provided the required information is furnished by such U.S. Holder to the IRS. A U.S. Holder who does not provide a correct taxpayer identification number may be subject to penalties imposed by the IRS.
Recent Legislative Developments
Newly enacted legislation requires certain U.S. Holders that are individuals, estates or trusts to pay up to an additional 3.8% tax on, among other things, dividends and capital gains for taxable years beginning after December 31, 2012. In addition, for taxable years beginning after March 18, 2010, new legislation requires certain U.S. Holders who are individuals that hold certain foreign financial assets (which may include common shares) to report information relating to such assets, subject to certain exceptions. U.S. Holders should consult their own tax advisors regarding the effect, if any, of this legislation on their ownership and disposition of common shares.
127
CERTAIN CANADIAN FEDERAL INCOME TAX CONSIDERATIONS
The following is a summary of the principal Canadian federal income tax considerations generally applicable under the Income Tax Act (Canada) and the regulations thereunder (the "Tax Act") to a holder who acquires Common Shares pursuant to the offering and who, for the purposes of the Tax Act and the Canada-United States Income Tax Convention (the "Canadian Treaty"), at all relevant times (a) is a resident of the United States and not resident, or deemed to be resident, in Canada, (b) holds the Common Shares as capital property, (c) deals at arm's length with the Company, (d) is not affiliated with the Company, and (e) does not use or hold and is not deemed to use or hold the Common Shares in connection with a trade or business that the prospective purchaser carries on, or is deemed to carry on, in Canada at any time (a "U.S. Holder"). For the purpose of the Tax Act, related persons (as defined therein) are deemed not to deal at arm's length, and it is a question of fact whether persons not related to each other deal at arm's length. Special rules which are not discussed in this summary may apply to "financial institutions" (as defined in the Tax Act), to a U.S. Holder that is an insurer carrying on an insurance business in Canada and elsewhere and to an "authorized foreign bank" (as defined in the Tax Act) and, accordingly, such persons should consult their own tax advisors.
Limited liability companies ("LLCs") that are not taxed as corporations pursuant to the provisions of the Code do not qualify as resident in the U.S. for purposes of the Canadian Treaty. Under the Canadian Treaty, a resident of the U.S. who is a member of such an LLC and is otherwise eligible for benefits under the Canadian Treaty may generally be entitled to claim benefits under the Canadian Treaty in respect of income, profits or gains derived through the LLC.
The Canadian Treaty includes limitation on benefits rules that restrict the ability of certain persons who are resident in the U.S. for purposes of the Canadian Treaty to claim any or all benefits under the Canadian Treaty. U.S. Holders should consult their own tax advisors with respect to their eligibility for benefits under the Canadian Treaty, having regard to these rules.
This summary is of a general nature only and is based upon the facts set out herein, the provisions of the Tax Act, the Canadian Treaty and the current published administrative policies and assessing practices of the CRA, all in effect as of the date hereof. This summary is based on the assumption that the Common Shares issuable will at all relevant times be listed on the Toronto Stock Exchange. This summary takes into account all specific proposals to amend the Tax Act publicly announced by or on behalf of the Minister of Finance (Canada) prior to the date hereof. There can be no assurance that any such proposals will be implemented in their current form or at all. This summary does not otherwise take into account or anticipate any changes in law or in the administrative policies and assessing practices of the CRA, whether by legislative, governmental or judicial decision or action, and does not take into account provincial, territorial or foreign tax legislation or considerations, which may differ significantly from those discussed herein.
This summary is not exhaustive of all possible Canadian federal tax considerations applicable to an investment in Common Shares. Moreover, the Canadian tax consequences of acquiring, holding or disposing of Common Shares will vary depending on the U.S. Holder's particular circumstances. Accordingly, this summary is of a general nature only and is not intended to be, and should not be interpreted as, legal or tax advice to any prospective purchaser and no representation with respect to the tax consequence to any particular U.S. Holder is made. Prospective investors should consult their own tax advisor with respect to the Canadian tax consequences of an investment in Common Shares based on their particular circumstances.
Prospective investors may also be subject to certain Canadian provincial or territorial tax consequences as a result of acquiring, holding or disposing of Common Shares. Accordingly, prospective investors are urged to consult with their tax advisors for advice with respect to Canadian provincial or territorial tax consequences of an investment in Common Shares based on their particular circumstances.
128
For purposes of the Tax Act, all amounts relating to the acquisition, holding or disposition of Common Shares, including income, gain or profit, adjusted cost base and proceeds of disposition, must be converted into Canadian dollars based on the prevailing United States dollar exchange rate at the time such amounts arise in accordance with the detailed rules in the Tax Act.
Dividends on Common Shares
Dividends paid or credited on the Common Shares, or deemed under the Tax Act to be paid or credited on the Common Shares, to a U.S. Holder will generally be subject to Canadian withholding tax at the rate of 25%, unless the rate is reduced under the provisions of an applicable tax treaty. Under the Canadian Treaty, the withholding tax rate in respect of a dividend paid to a U.S. Holder who is the beneficial owner of the dividend and entitled to full benefits under the Canadian Treaty, is generally reduced to 15%.
Disposition of Common Shares
A U.S. Holder will not be subject to tax under the Tax Act in respect of any capital gain realized by such U.S. Holder on a disposition of Common Shares unless the Common Shares constitute "taxable Canadian property" (as defined in the Tax Act) of the U.S. Holder at the time of disposition and the U.S. Holder is not entitled to relief under an applicable tax treaty. Where the Common Shares are listed on a designated stock exchange (for purposes of the Tax Act) at a particular time the Common Shares will not constitute taxable Canadian property to a U.S. Holder at such time provided that at any time during the sixty-month period that ends at that time, either: (a) the U.S. Holder, persons with whom the U.S. Holder does not deal at arm's length, or the U.S. Holder together with all such persons, have not owned 25% or more of any class or series of shares of the capital stock of the Company; or (b) such Common Shares did not derive, directly or indirectly, more than 50% of their fair market value from one or any combination of (i) real or immovable property situated in Canada, (ii) "Canadian resource properties" (as defined in the Tax Act), (iii) "timber resource properties" (as defined in the Tax Act), and (iv) options or interests in respect of property described in (i), (ii) and (iii).
In the event that the Common Shares constitute or are deemed to constitute taxable Canadian property to any U.S. Holder, the Canadian Treaty (or other applicable tax treaty or convention) may exempt the U.S. Holder from tax under the Tax Act in respect of the disposition thereof. U.S. Holders whose Common Shares may be taxable Canadian property should consult with their own tax advisors for advice having regard to their particular circumstances.
129
We are offering the common shares described in this prospectus through the underwriters named below. UBS Securities LLC is the sole book-running manager of this offering and the representative of the underwriters. We have entered into an underwriting agreement with the representative. Subject to the terms and conditions of the underwriting agreement, each of the underwriters has severally agreed to purchase, and we have agreed to sell to the underwriters, the number of common shares listed next to its name in the following table.
Underwriters
|
Number of shares |
||
|---|---|---|---|
UBS Securities LLC |
|||
|
|||
|
|||
|
|||
Total |
|||
The underwriting agreement provides that the underwriters must buy all of the shares if they buy any of them. However, the underwriters are not required to take or pay for the shares covered by the underwriters' over-allotment option described below.
Our common shares are offered subject to a number of conditions, including:
- •
- receipt and acceptance of our common shares by the underwriters, and
- •
- the underwriters' right to reject orders in whole or in part.
In connection with this offering, certain of the underwriters or securities dealers may distribute prospectuses electronically.
Over-Allotment Option
We have granted the underwriters an option to buy up to an aggregate of of additional common shares. The underwriters may exercise this option solely for the purpose of covering over-allotments, if any, made in connection with this offering. The underwriters have 30 days from the date of this prospectus to exercise this option. If the underwriters exercise this option, they will each purchase additional shares approximately in proportion to the amounts specified in the table above.
Commissions and Discounts
Shares sold by the underwriters to the public will initially be offered at the public offering price set forth on the cover of this prospectus. Any shares sold by the underwriters to securities dealers may be sold at a discount of up to $ per share from the public offering price. Sales of shares made outside the US may be made by affiliates of the underwriters. If all the shares are not sold at the public offering price, the representative may change the offering price and the other selling terms. Upon execution of the underwriting agreement, the underwriters will be obligated to purchase the shares at the prices and upon the terms stated therein.
The following table shows the per share and total underwriting discounts and commissions we will pay to the underwriters assuming both no exercise and full exercise of the underwriters' option to purchase additional common shares.
| |
No exercise | Full exercise | ||||||
|---|---|---|---|---|---|---|---|---|
Per share |
$ | $ | ||||||
Total |
$ | $ | ||||||
130
We estimate that the total expenses of this offering payable by us, not including the underwriting discounts and commissions, will be approximately $ . The underwriters have agreed to reimburse the Company for certain of the expenses incurred by it with respect to this offering.
No Sales of Similar Securities
We and our executive officers and directors have entered into lock-up agreements with the underwriters. Under these agreements, subject to certain exceptions, we and each of these persons may not, without the prior written approval of UBS Securities LLC, offer, sell, contract to sell or otherwise dispose of, directly or indirectly, or hedge our common shares or securities convertible into or exchangeable or exercisable for our common shares. These restrictions will be in effect for a period of 90 days after the date of this prospectus. At any time and without public notice, UBS Securities LLC, may, in its sole discretion, release some or all of the securities from these lock-up agreements.
Indemnification
We have agreed to indemnify the underwriters against certain liabilities, including certain liabilities under the Securities Act. If we are unable to provide this indemnification, we have agreed to contribute to payments the underwriters may be required to make in respect of those liabilities.
NYSE and TSX Stock Market Listings
Our common shares are listed on the NYSE under the symbol "AT" and on the TSX under the symbol "ATP."
Price Stabilizations, Short Positions
In connection with this offering, the underwriters may engage in activities that stabilize, maintain or otherwise affect the price of our common shares, including:
- •
- stabilizing transactions;
- •
- short sales;
- •
- purchases to cover positions created by short sales;
- •
- imposition of penalty bids; and
- •
- syndicate covering transactions.
Stabilizing transactions consist of bids or purchases made for the purpose of preventing or retarding a decline in the market price of our common shares while this offering is in progress. These transactions may also include making short sales of our common shares, which involve the sale by the underwriters of a greater number of common shares than they are required to purchase in this offering, and purchasing common shares on the open market to cover positions created by short sales. Short sales may be "covered short sales," which are short positions in an amount not greater than the underwriters' over-allotment option referred to above, or may be "naked short sales," which are short positions in excess of that amount.
The underwriters may close out any covered short position by either exercising their over-allotment option, in whole or in part, or by purchasing shares in the open market. In making this determination, the underwriters will consider, among other things, the price of shares available for purchase in the open market as compared to the price at which they may purchase shares through the over-allotment option.
Naked short sales are short sales made in excess of the over-allotment option. The underwriters must close out any naked short position by purchasing shares in the open market. A naked short
131
position is more likely to be created if the underwriters are concerned that there may be downward pressure on the price of the common shares in the open market that could adversely affect investors who purchased in this offering.
The underwriters also may impose a penalty bid. This occurs when a particular underwriter repays to the underwriters a portion of the underwriting discount received by it because the representative has repurchased shares sold by or for the account of that underwriter in stabilizing or short covering transactions.
As a result of these activities, the price of our common shares may be higher than the price that otherwise might exist in the open market. If these activities are commenced, they may be discontinued by the underwriters at any time. The underwriters may carry out these transactions on the NYSE, the TSX, in the over-the-counter market or otherwise.
Affiliations
Certain of the underwriters and their affiliates have in the past provided, are currently providing and may in the future from time to time provide, investment banking and other financing, trading, banking, research, transfer agent and trustee services to the Company or its subsidiaries, for which they have in the past received, and may currently or in the future receive, customary fees and expenses.
132
Notice to Prospective Investors in the European Economic Area
In relation to each Member State of the European Economic Area, or EEA, which has implemented the Prospectus Directive (each, a "Relevant Member State"), with effect from, and including, the date on which the Prospectus Directive is implemented in that Relevant Member State (the "Relevant Implementation Date"), an offer to the public of our securities which are the subject of the offering contemplated by this prospectus may not be made in that Relevant Member State, except that, with effect from, and including, the Relevant Implementation Date, an offer to the public in that Relevant Member State of our securities may be made at any time under the following exemptions under the Prospectus Directive, if they have been implemented in that Relevant Member State:
a) to legal entities which are authorized or regulated to operate in the financial markets, or, if not so authorized or regulated, whose corporate purpose is solely to invest in our securities;
b) to any legal entity which has two or more of: (1) an average of at least 250 employees during the last (or, in Sweden, the last two) financial year(s); (2) a total balance sheet of more than €43,000,000 and (3) an annual net turnover of more than €50,000,000, as shown in its last (or, in Sweden, the last two) annual or consolidated accounts; or
c) to fewer than 100 natural or legal persons (other than qualified investors as defined in the Prospectus Directive) subject to obtaining the prior consent of the representative for any such offer; or
d) in any other circumstances falling within Article 3(2) of the Prospectus Directive provided that no such offer of our securities shall result in a requirement for the publication by us or any underwriter or agent of a prospectus pursuant to Article 3 of the Prospectus Directive.
As used above, the expression "offered to the public" in relation to any of our securities in any Relevant Member State means the communication in any form and by any means of sufficient information on the terms of the offer and our securities to be offered so as to enable an investor to decide to purchase or subscribe for our securities, as the same may be varied in that Member State by any measure implementing the Prospectus Directive in that Member State and the expression "Prospectus Directive" means Directive 2003/71/EC and includes any relevant implementing measure in each Relevant Member State.
The EEA selling restriction is in addition to any other selling restrictions set out in this prospectus.
Notice to Prospective Investors in the United Kingdom
This prospectus is only being distributed to and is only directed at: (1) persons who are outside the United Kingdom; (2) investment professionals falling within Article 19(5) of the Financial Services and Markets Act 2000 (Financial Promotion) Order 2005 (the "Order"); or (3) high net worth companies, and other persons to whom it may lawfully be communicated, falling within Article 49(2)(a) to (d) of the Order (all such persons falling within (1)-(3) together being referred to as "relevant persons"). The shares are only available to, and any invitation, offer or agreement to subscribe, purchase or otherwise acquire such shares will be engaged in only with, relevant persons. Any person who is not a relevant person should not act or rely on this prospectus or any of its contents.
Notice to Prospective Investors in Switzerland
The Prospectus does not constitute an issue prospectus pursuant to Article 652a or Article 1156 of the Swiss Code of Obligations ("CO") and the shares will not be listed on the SIX Swiss Exchange. Therefore, the Prospectus may not comply with the disclosure standards of the CO and/or the listing rules (including any prospectus schemes) of the SIX Swiss Exchange. Accordingly, the shares may not
133
be offered to the public in or from Switzerland, but only to a selected and limited circle of investors, which do not subscribe to the shares with a view to distribution.
Notice to Prospective Investors in Australia
This prospectus is not a formal disclosure document and has not been, nor will be, lodged with the Australian Securities and Investments Commission. It does not purport to contain all information that an investor or their professional advisers would expect to find in a prospectus or other disclosure document (as defined in the Corporations Act 2001 (Australia)) for the purposes of Part 6D.2 of the Corporations Act 2001 (Australia) or in a product disclosure statement for the purposes of Part 7.9 of the Corporations Act 2001 (Australia), in either case, in relation to the securities.
The securities are not being offered in Australia to "retail clients" as defined in sections 761G and 761GA of the Corporations Act 2001 (Australia). This offering is being made in Australia solely to "wholesale clients" for the purposes of section 761G of the Corporations Act 2001 (Australia) and, as such, no prospectus, product disclosure statement or other disclosure document in relation to the securities has been, or will be, prepared.
This prospectus does not constitute an offer in Australia other than to wholesale clients. By submitting an application for our securities, you represent and warrant to us that you are a wholesale client for the purposes of section 761G of the Corporations Act 2001 (Australia). If any recipient of this prospectus is not a wholesale client, no offer of, or invitation to apply for, our securities shall be deemed to be made to such recipient and no applications for our securities will be accepted from such recipient. Any offer to a recipient in Australia, and any agreement arising from acceptance of such offer, is personal and may only be accepted by the recipient. In addition, by applying for our securities you undertake to us that, for a period of 12 months from the date of issue of the securities, you will not transfer any interest in the securities to any person in Australia other than to a wholesale client.
Notice to Prospective Investors in Hong Kong
Our securities may not be offered or sold in Hong Kong, by means of this prospectus or any document other than (i) to "professional investors" within the meaning of the Securities and Futures Ordinance (Cap.571, Laws of Hong Kong) and any rules made thereunder, or (ii) in circumstances which do not constitute an offer to the public within the meaning of the Companies Ordinance (Cap.32, Laws of Hong Kong), or (iii) in other circumstances which do not result in the document being a "prospectus" within the meaning of the Companies Ordinance (Cap.32, Laws of Hong Kong). No advertisement, invitation or document relating to our securities may be issued or may be in the possession of any person for the purpose of issue (in each case whether in Hong Kong or elsewhere) which is directed at, or the contents of which are likely to be accessed or read by, the public in Hong Kong (except if permitted to do so under the securities laws of Hong Kong) other than with respect to the securities which are or are intended to be disposed of only to persons outside Hong Kong or only to "professional investors" within the meaning of the Securities and Futures Ordinance (Cap. 571, Laws of Hong Kong) and any rules made thereunder.
Notice to Prospective Investors in Japan
Our securities have not been and will not be registered under the Financial Instruments and Exchange Law of Japan (the Financial Instruments and Exchange Law) and our securities will not be offered or sold, directly or indirectly, in Japan, or to, or for the benefit of, any resident of Japan (which term as used herein means any person resident in Japan, including any corporation or other entity organized under the laws of Japan), or to others for re-offering or resale, directly or indirectly, in Japan, or to a resident of Japan, except pursuant to an exemption from the registration requirements
134
of, and otherwise in compliance with, the Financial Instruments and Exchange Law and any other applicable laws, regulations and ministerial guidelines of Japan.
Notice to Prospective Investors in Singapore
This document has not been registered as a prospectus with the Monetary Authority of Singapore and in Singapore, the offer and sale of our securities is made pursuant to exemptions provided in sections 274 and 275 of the Securities and Futures Act, Chapter 289 of Singapore ("SFA"). Accordingly, this prospectus and any other document or material in connection with the offer or sale, or invitation for subscription or purchase, of our securities may not be circulated or distributed, nor may our securities be offered or sold, or be made the subject of an invitation for subscription or purchase, whether directly or indirectly, to persons in Singapore other than (i) to an institutional investor as defined in Section 4A of the SFA pursuant to Section 274 of the SFA, (ii) to a relevant person as defined in section 275(2) of the SFA pursuant to Section 275(1) of the SFA, or any person pursuant to Section 275(1A) of the SFA, and in accordance with the conditions specified in Section 275 of the SFA or (iii) otherwise pursuant to, and in accordance with the conditions of, any other applicable provision of the SFA, in each case subject to compliance with the conditions (if any) set forth in the SFA. Moreover, this document is not a prospectus as defined in the SFA. Accordingly, statutory liability under the SFA in relation to the content of prospectuses would not apply. Prospective investors in Singapore should consider carefully whether an investment in our securities is suitable for them.
Where our securities are subscribed or purchased under Section 275 of the SFA by a relevant person which is:
(a) by a corporation (which is not an accredited investor as defined in Section 4A of the SFA) the sole business of which is to hold investments and the entire share capital of which is owned by one or more individuals, each of whom is an accredited investor; or
(b) for a trust (where the trustee is not an accredited investor) whose sole purpose is to hold investments and each beneficiary of the trust is an individual who is an accredited investor, shares of that corporation or the beneficiaries' rights and interest (howsoever described) in that trust shall not be transferable for six months after that corporation or that trust has acquired the shares under Section 275 of the SFA, except:
(1) to an institutional investor (for corporations under Section 274 of the SFA) or to a relevant person defined in Section 275(2) of the SFA, or any person pursuant to an offer that is made on terms that such shares of that corporation or such rights and interest in that trust are acquired at a consideration of not less than S$200,000 (or its equivalent in a foreign currency) for each transaction, whether such amount is to be paid for in cash or by exchange of securities or other assets, and further for corporations, in accordance with the conditions, specified in Section 275 of the SFA;
(2) where no consideration is given for the transfer; or
(3) where the transfer is by operation of law.
In addition, investors in Singapore should note that the securities acquired by them are subject to resale and transfer restrictions specified under Section 276 of the SFA, and they, therefore, should seek their own legal advice before effecting any resale or transfer of their securities.
135
Certain legal matters relating to the issue and sale of the common shares offered hereby will be passed upon by Goodmans LLP on behalf of Atlantic Power and by Blake, Cassels & Graydon LLP on behalf of the underwriters. Goodwin Procter LLP, Boston, Massachusetts, is acting as U.S. counsel to Atlantic Power in this offering and Shearman & Sterling LLP, Toronto, Ontario, Canada, is acting as U.S. counsel for the underwriters.
The consolidated financial statements of Atlantic Power Corporation and its subsidiaries as of December 31, 2009 and 2008, and for each of the years in the three-year period ended December 31, 2009, have been included herein in reliance upon the report of KPMG LLP, independent registered public accounting firm, appearing elsewhere herein, and upon the authority of said firm as experts in accounting and auditing.
The consolidated financial statements of Selkirk Cogen Partners, L.P. and subsidiary as of December 31, 2007 and for the year then ended included in this Registration Statement on Form S-1 have been so included in reliance on the report of PricewaterhouseCoopers LLP, independent accountants, given on the authority of said firm as experts in auditing and accounting.
The consolidated financial statements of Chambers Cogeneration Limited Partnership and its subsidiaries as of December 31, 2008 and 2007, and for the years then ended included in this Registration Statement on Form S-1 have been so included in reliance on the report of PricewaterhouseCoopers LLP, independent accountants, given on the authority of said firm as experts in auditing and accounting.
The combined financial statements of Gregory Partners, LLC and Gregory Power Partners, L.P. as of December 31, 2007 and for the year then ended included in this Registration Statement on Form S-1 have been so included in reliance on the report of PricewaterhouseCoopers LLP, independent accountants, given on the authority of said firm as experts in auditing and accounting.
The financial statements of Pasco Cogen, Ltd. as of December 31, 2007 and for the year then ended, have been included herein in reliance upon the report of KPMG LLP, independent accountants, appearing elsewhere herein, and upon the authority of said firm as experts in accounting and auditing.
WHERE YOU CAN FIND MORE INFORMATION
We have filed with the SEC a registration statement under the Securities Act that registers the offer and sale of the securities offered by this prospectus. This prospectus is part of the registration statement, but the registration statement, including the accompanying exhibits included or incorporated by reference therein, contains additional relevant information about us. We have also filed a registration statement under the Securities Act that registers the offer and sale of common shares.
We are required to file annual, quarterly and current reports, proxy statements and other information with the SEC. You may read and copy any document we file, including the registration statement containing this prospectus and the registration statement with respect to the registration of the common shares, at the SEC's Public Reference Room at 100 F Street, N.E., Washington, D.C. 20549. You may call the SEC at 1-800-SEC-0330 for further information on the operation of the Public Reference Room. Our SEC filings are also available to the public from the SEC's website at http://www.sec.gov and on our website at http://www.atlanticpower.com. We have included the SEC's web address and our web address as inactive textual references only. Our website is not incorporated into, and does not constitute a part of, this prospectus or any other report or documents we file with or furnish to the SEC.
136
You may request a copy of these filings, and any exhibits we have specifically incorporated by reference as an exhibit in this prospectus, at no cost by writing or telephoning us at the following: Atlantic Power Corporation, 200 Clarendon Street, Floor 25, Boston, Massachusetts 02116, Attention: Patrick Welch. Our telephone number is (617) 977-2400.
137
Atlantic Power Corporation
Index to Consolidated Financial Statements
F-1
Report of Independent Registered Public Accounting Firm
The
Board of Directors
Atlantic Power Corporation:
We have audited the accompanying consolidated balance sheets of Atlantic Power Corporation as of December 31, 2009 and 2008, and the related consolidated statements of operations, shareholders' equity and cash flows for each of the years in the three-year period ended December 31, 2009. In connection with our audits of the consolidated financial statements, we also have audited financial statement schedule "Schedule II. Valuation and Qualifying Accounts." These consolidated financial statements and financial statement schedule are the responsibility of the Company's management. Our responsibility is to express an opinion on these consolidated financial statements and financial statement schedule based on our audits.
We conducted our audits in accordance with the standards of the Public Company Accounting Oversight Board (United States). Those standards require that we plan and perform the audit to obtain reasonable assurance about whether the financial statements are free of material misstatement. An audit includes examining, on a test basis, evidence supporting the amounts and disclosures in the financial statements. An audit also includes assessing the accounting principles used and significant estimates made by management, as well as evaluating the overall financial statement presentation. We believe that our audits provide a reasonable basis for our opinion.
As discussed in note 2 to the consolidated financial statements, on January 1, 2009, Atlantic Power Corporation adopted FASB's ASC 805 Business Combinations, on January 1, 2008, Atlantic Power Corporation changed its method of accounting for fair value measurements in accordance with FASB ASC 820 Fair Value Measurements; and on January 1, 2007, Atlantic Power Corporation changed its method of accounting for income tax uncertainties in accordance with guidance provided in FASB ASC 740 Income Taxes.
In our opinion, the consolidated financial statements referred to above present fairly, in all material respects, the financial position of Atlantic Power Corporation as of December 31, 2009 and 2008, and the results of its operations and its cash flows for each of the years in the three-year period ended December 31, 2009, in conformity with U.S. generally accepted accounting principles. Also in our opinion, the related financial statement schedule, when considered in relation to the basic consolidated financial statements taken as a whole, present fairly, in all material respects, the information set forth therein.
/s/ KPMG LLP
Chartered
Accountants, Licensed Public Accountants
Toronto,
Canada
April 12, 2010 except as to notes 4, 9, and 19 which are as of May 26, 2010 and as to Notes 2(a), 18 and 21 which are as of June 16, 2010.
F-2
CONSOLIDATED BALANCE SHEETS
(In thousands of U.S. dollars)
| |
December 31, | |||||||
|---|---|---|---|---|---|---|---|---|
| |
2009 | 2008 | ||||||
Assets |
||||||||
Current assets: |
||||||||
Cash and cash equivalents |
$ | 49,850 | $ | 37,327 | ||||
Restricted cash |
14,859 | 15,434 | ||||||
Accounts receivable |
17,480 | 28,000 | ||||||
Current portion of derivative instruments asset (Notes 12 and 13) |
5,619 | — | ||||||
Prepayments, supplies and other |
3,019 | 3,349 | ||||||
Deferred income taxes (Note 14) |
17,887 | 11,121 | ||||||
Refundable income taxes (Note 14) |
10,552 | 997 | ||||||
Total current assets |
119,266 | 96,228 | ||||||
Property, plant and equipment (Note 5) |
193,822 |
204,171 |
||||||
Transmission system rights (Note 6) |
195,984 | 203,833 | ||||||
Equity investments in affiliates (Note 4) |
259,230 | 287,775 | ||||||
Other intangible assets (Note 6) |
71,770 | 93,644 | ||||||
Goodwill (Note 2) |
8,918 | 8,918 | ||||||
Derivative instruments asset (Notes 12 and 13) |
14,289 | 224 | ||||||
Other assets |
6,297 | 13,202 | ||||||
Total assets |
$ | 869,576 | $ | 907,995 | ||||
Liabilities and Shareholders' Equity |
||||||||
Current liabilities: |
||||||||
Accounts payable and accrued liabilities |
$ | 21,661 | $ | 19,342 | ||||
Current portion of long-term debt (Note 9) |
18,280 | 12,008 | ||||||
Revolving credit facility (Note 8) |
— | 55,000 | ||||||
Current portion of derivative instruments liability (Notes 12 and 13) |
6,512 | 6,206 | ||||||
Interest payable on subordinated notes and debentures |
800 | 3,455 | ||||||
Dividends payable |
5,242 | 1,918 | ||||||
Other current liabilities |
752 | 3,941 | ||||||
Total current liabilities |
53,247 | 101,870 | ||||||
Long-term debt (Note 9) |
224,081 |
243,097 |
||||||
Subordinated notes (Note 10) |
— | 319,984 | ||||||
Convertible debentures (Note 11) |
139,153 | 49,261 | ||||||
Derivative instruments liability (Notes 12 and 13) |
5,513 | 14,211 | ||||||
Deferred income taxes (Note 14) |
28,619 | 26,779 | ||||||
Other non-current liabilities |
4,846 | 1,167 | ||||||
Shareholders' equity: |
||||||||
Common shares, No par value, unlimited authorized shares; |
541,917 | 215,163 | ||||||
Accumulated other comprehensive loss |
(859 | ) | (3,136 | ) | ||||
Retained deficit |
(126,941 | ) | (60,401 | ) | ||||
Total shareholders' equity |
414,117 | 151,626 | ||||||
Commitments and contingencies (Note 20) |
||||||||
Subsequent events (Note 21) |
||||||||
Total liabilities and shareholders' equity |
$ | 869,576 | $ | 907,995 | ||||
See accompanying notes to consolidated financial statements.
F-3
CONSOLIDATED STATEMENTS OF OPERATIONS
(In thousands of U.S. dollars, except per share amounts)
| |
Years ended December 31, | ||||||||||
|---|---|---|---|---|---|---|---|---|---|---|---|
| |
2009 | 2008 | 2007 | ||||||||
Project revenue: |
|||||||||||
Energy sales |
$ | 58,953 | $ | 64,237 | $ | 42,799 | |||||
Energy capacity revenue |
88,449 | 77,691 | 35,625 | ||||||||
Transmission services |
31,000 | 31,528 | 34,524 | ||||||||
Other |
1,115 | 356 | 309 | ||||||||
|
179,517 | 173,812 | 113,257 | ||||||||
Project expenses: |
|||||||||||
Fuel |
59,522 | 55,366 | 18,537 | ||||||||
Operations and maintenance |
24,038 | 17,711 | 10,718 | ||||||||
Project operator fees and expenses |
4,115 | 3,727 | 1,854 | ||||||||
Depreciation and amortization |
41,374 | 29,528 | 19,725 | ||||||||
|
129,049 | 106,332 | 50,834 | ||||||||
Project other income (expense): |
|||||||||||
Change in fair value of derivative instruments (Note 12 and 13) |
(6,813 | ) | (16,026 | ) | (22,264 | ) | |||||
Equity in earnings of unconsolidated affiliates (Note 4) |
8,514 | 1,895 | 44,368 | ||||||||
Gain (loss) on sales of equity investments, net (Note 3) |
13,780 | — | (5,115 | ) | |||||||
Interest, net |
(18,800 | ) | (17,709 | ) | (13,216 | ) | |||||
Other project expense |
1,266 | 5,366 | 3,922 | ||||||||
|
(2,053 | ) | (26,474 | ) | 7,695 | ||||||
Project income |
48,415 | 41,006 | 70,118 | ||||||||
Administrative and other expenses (income): |
|||||||||||
Management fees and administration |
26,028 | 10,012 | 8,185 | ||||||||
Interest, net |
55,698 | 43,275 | 44,307 | ||||||||
Foreign exchange loss (gain) (Note 13) |
20,506 | (47,247 | ) | 30,142 | |||||||
Other expense, net |
362 | 425 | 975 | ||||||||
|
102,594 | 6,465 | 83,609 | ||||||||
Income (loss) from operations before income taxes |
(54,179 | ) | 34,541 | (13,491 | ) | ||||||
Income tax expense (benefit) (Note 14) |
(15,693 | ) | (13,560 | ) | 17,105 | ||||||
Net income (loss) |
$ | (38,486 | ) | $ | 48,101 | $ | (30,596 | ) | |||
Net income (loss) per share—basic (Note 17) |
$ |
(0.63 |
) |
$ |
0.78 |
$ |
(0.50 |
) |
|||
Net income (loss) per share—diluted (Note 17) |
$ |
(0.63 |
) |
$ |
0.73 |
$ |
(0.50 |
) |
|||
See accompanying notes to consolidated financial statements.
F-4
CONSOLIDATED STATEMENTS OF CHANGES IN SHAREHOLDERS' EQUITY
(In thousands of U.S. dollars)
| |
Common Stock (Shares) |
Common Stock (Amount) |
Retained Deficit |
Accumulated Other Comprehensive Income |
Total Shareholders' Equity |
||||||||||||
|---|---|---|---|---|---|---|---|---|---|---|---|---|---|---|---|---|---|
December 31, 2006 |
61,470 | $ | 216,636 | $ | (53,571 | ) | $ | — | $ | 163,065 | |||||||
Dividends declared |
— |
— |
(24,665 |
) |
— |
(24,665 |
) |
||||||||||
Comprehensive Income: |
|||||||||||||||||
Net loss |
— | — | (30,596 | ) | — | (30,596 | ) | ||||||||||
Net comprehensive income |
— | — | — | — | (30,596 | ) | |||||||||||
December 31, 2007 |
61,470 | 216,636 | (108,832 | ) | — | 107,804 | |||||||||||
Common shares issued for LTIP |
30 |
127 |
— |
— |
127 |
||||||||||||
Common stock repurchases |
(559 | ) | (1,600 | ) | — | — | (1,600 | ) | |||||||||
Adoption of accounting standard for Fair Value Measurement |
— | — | 25,179 | — | 25,179 | ||||||||||||
Dividends declared |
— | — | (24,849 | ) | — | (24,849 | ) | ||||||||||
Comprehensive loss: |
|||||||||||||||||
Net income |
— | — | 48,101 | — | 48,101 | ||||||||||||
Unrealized losses on hedging activities, net of tax of $2,091 |
— | — | — | (3,136 | ) | (3,136 | ) | ||||||||||
Net comprehensive income |
— | — | — | — | 44,965 | ||||||||||||
December 31, 2008 |
60,941 | 215,163 | (60,401 | ) | (3,136 | ) | 151,626 | ||||||||||
Subordinated notes conversion |
(114 |
) |
327,691 |
— |
— |
327,691 |
|||||||||||
Common shares issued for LTIP |
59 | 151 | — | — | 151 | ||||||||||||
Common stock repurchases |
(482 | ) | (1,088 | ) | — | — | (1,088 | ) | |||||||||
Dividends declared |
— | — | (28,054 | ) | — | (28,054 | ) | ||||||||||
Comprehensive Income: |
|||||||||||||||||
Net loss |
— | — | (38,486 | ) | — | (38,486 | ) | ||||||||||
Unrealized gains on hedging activities, net of tax of ($1,518) |
— | — | — | 2,277 | 2,277 | ||||||||||||
Net comprehensive loss |
— | — | — | — | (36,209 | ) | |||||||||||
December 31, 2009 |
60,404 | $ | 541,917 | $ | (126,941 | ) | $ | (859 | ) | $ | 414,117 | ||||||
See accompanying notes to consolidated financial statements.
F-5
CONSOLIDATED STATEMENTS OF CASH FLOWS
(In thousands of U.S. dollars)
| |
Years ended December 31, | ||||||||||
|---|---|---|---|---|---|---|---|---|---|---|---|
| |
2009 | 2008 | 2007 | ||||||||
Cash flows from operating activities: |
|||||||||||
Net (loss) income |
$ | (38,486 | ) | $ | 48,101 | $ | (30,596 | ) | |||
Adjustments to reconcile to net cash provided by operating activities: |
|||||||||||
Depreciation and amortization |
41,374 | 29,528 | 19,725 | ||||||||
Impairment of equity investment (Note 3) |
5,500 | — | — | ||||||||
Common share conversion costs recorded in interest expense |
4,508 | — | — | ||||||||
Subordinated note redemption premium recorded in interest expense (Note 10) |
1,935 | — | — | ||||||||
Loss (gain) on sale of property, plant and equipment |
933 | (5,163 | ) | 8,627 | |||||||
Earnings from unconsolidated affiliates |
(14,213 | ) | (1,895 | ) | (44,368 | ) | |||||
(Gain) loss on sales of equity investments, net (Note 3) |
(13,780 | ) | — | 5,115 | |||||||
Distributions from unconsolidated affiliates |
27,884 | 41,031 | 46,653 | ||||||||
Change in gas transportation contract liability (Note 7) |
— | — | (13,019 | ) | |||||||
Gain on extinguishment of gas transportation contract (Note 7) |
— | — | (10,554 | ) | |||||||
Unrealized foreign exchange (gain) loss (Note 13) |
24,370 | (39,203 | ) | 37,716 | |||||||
Change in fair value of subordinated note prepayment option |
106 | 27 | — | ||||||||
Change in fair value of derivative instruments (Note 13) |
6,813 | 16,026 | 22,264 | ||||||||
Change in deferred income taxes (Note 14) |
(6,436 | ) | (14,009 | ) | 12,289 | ||||||
Change in other operating balances, net of acquisitions and disposition effects: |
|||||||||||
Accounts receivable |
10,520 | 216 | 2,523 | ||||||||
Prepayments, refundable income taxes and other assets |
(3,454 | ) | 12,229 | 6,222 | |||||||
Accounts payable and accrued liabilities |
2,959 | (20 | ) | 1,166 | |||||||
Other liabilities |
(84 | ) | (9,080 | ) | (5,675 | ) | |||||
Cash provided by operating activities |
50,449 | 77,788 | 58,088 | ||||||||
Cash flows provided by (used in) investing activities: |
|||||||||||
Acquisitions, net of cash acquired (Note 3) |
(3,068 | ) | (141,688 | ) | (23,213 | ) | |||||
Change in restricted cash (Note 2a) |
575 | 6,335 | 11,386 | ||||||||
Proceeds from sale of property, plant and equipment |
167 | 7,889 | 3,073 | ||||||||
Purchases of property, plant and equipment |
(2,016 | ) | (1,102 | ) | (15,695 | ) | |||||
Proceeds from sale of equity investments (Note 3) |
29,300 | — | 6,195 | ||||||||
Purchases of auction rate securities (Note 12) |
— | (75,518 | ) | (120,153 | ) | ||||||
Sales of auction rate securities (Note 12) |
— | 75,518 | 120,153 | ||||||||
Cash provided by (used in) investing activities |
24,958 | (128,566 | ) | (18,254 | ) | ||||||
Cash flows provided by (used in) financing activities: |
|||||||||||
Redemption of IPSs |
(3,369 | ) | (1,612 | ) | — | ||||||
Redemption of subordinated notes (Note 10) |
(40,638 | ) | (3,064 | ) | — | ||||||
Costs associated with common share conversion |
(4,508 | ) | — | — | |||||||
Dividends paid |
(24,955 | ) | (24,612 | ) | (24,342 | ) | |||||
Proceeds from convertible debentures, net of offering costs |
78,330 | — | — | ||||||||
Proceeds from issuance of project level debt |
— | 35,000 | 48,056 | ||||||||
Repayment of project-level debt |
(12,744 | ) | (22,275 | ) | (71,117 | ) | |||||
Repayment of revolving credit facility borrowings (Note 8) |
(55,000 | ) | — | (31,000 | ) | ||||||
Proceeds from revolving credit facility borrowings |
— | 55,000 | 31,000 | ||||||||
Proceeds from escrow used for redemption of non-controlling interest (Note 19) |
— | — | 74,433 | ||||||||
Repayment of obligation to non-controlling interest (Note 19) |
— | — | (76,888 | ) | |||||||
Cash (used in) provided by financing activities |
(62,884 | ) | 38,437 | (49,858 | ) | ||||||
Increase (decrease) in cash and cash equivalents |
12,523 |
(12,341 |
) |
(10,024 |
) |
||||||
Cash and cash equivalents, beginning of year |
37,327 | 49,668 | 59,692 | ||||||||
Cash and cash equivalents, end of year |
$ |
49,850 |
$ |
37,327 |
$ |
49,668 |
|||||
Supplemental cash flow information: |
|||||||||||
Interest paid |
$ | 69,186 | $ | 72,129 | $ | 62,366 | |||||
Income taxes (paid) refunded |
$ | (216 | ) | $ | 2,418 | $ | (10,483 | ) | |||
See accompanying notes to consolidated financial statements.
F-6
NOTES TO CONSOLIDATED AUDITED FINANCIAL STATEMENTS
1. Nature of business
Atlantic Power Corporation ("Atlantic Power") is a corporation established under the laws of the Province of Ontario on June 18, 2004 and continued to the Province of British Columbia on July 8, 2005. We issued income participating securities ("IPSs") for cash pursuant to an initial public offering on November 18, 2004. Each IPS was comprised of one common share and Cdn$5.767 principal value of 11% subordinated notes due 2016 . On November 27, 2009 the shareholders approved a conversion from the IPS structure to a traditional common share structure. Each IPS has been exchanged for one new common share and each old common share that did not form a part of an IPS was exchanged for approximately 0.44 of a new common share. See Notes 10 and 15 for additional information.
We currently own, through our wholly-owned subsidiaries Atlantic Power Transmission, Inc. and Atlantic Power Generation, Inc. indirect interests in 12 power generation projects and one transmission line located in the United States. Four of our Projects are wholly-owned subsidiaries: Lake Cogen Ltd., Pasco Cogen, Ltd., Auburndale Power Partners, L.P. and Atlantic Path 15, LLC.
Our registered office is located at 355 Burrard Street, Suite 1900, Vancouver, British Columbia V6C 2G8 and our headquarters is located at 200 Clarendon Street, Floor 25, Boston, Massachusetts, USA 02116. The telephone number is (617) 977-2400. The address of our website is atlanticpower.com. Our recent Canadian securities filings are available through our website.
2. Summary of significant accounting policies
(a) Basis of consolidation and accounting:
The accompanying consolidated financial statements are prepared in accordance with accounting principles generally accepted in the United States of America and include the consolidated accounts and operations of our subsidiaries in which we have a controlling interest. The usual condition for a controlling financial interest is ownership of the majority of the voting interest of an entity. However, a controlling financial interest may also exist in entities, such as a variable interest entity, through arrangements that do not involve controlling voting interests.
As such, we apply the standard that requires consolidation of variable interest entities, or VIEs, for which we are the primary beneficiary. The guidance requires a variable interest holder to consolidate a VIE if that party will absorb a majority of the expected losses of the VIE, receive the majority of the expected residual returns of the VIE, or both. We have determined that our investments are not VIEs by evaluating their design and capital structure. Accordingly, we record all of our investments in less than 100% owned entities under the equity method of accounting. See Note 4, for further information.
We eliminate all intercompany accounts and transactions in consolidation.
Beginning in the first quarter of 2010, changes in restricted cash in the consolidated statement of cash flows has been reported as an investing activity to reflect the use of the restricted cash in the current period. In previous periods, changes in restricted cash were reported as cash flow from operating activities. The prior period amounts have been reclassified to conform with the current year presentation. This reclassification does not impact the consolidated balance sheet or the consolidated statements of operations. We have changed the classification of restricted cash because the revised presentation is more widely used by companies in our industry.
These financial statements and notes reflect our evaluation of events occurring subsequent to the balance sheet date through June 16, 2010, the date the financial statements were issued.
F-7
NOTES TO CONSOLIDATED AUDITED FINANCIAL STATEMENTS (Continued)
2. Summary of significant accounting policies (Continued)
(b) Use of estimates:
The preparation of financial statements requires us to make estimates and assumptions that affect the reported amounts of assets and liabilities and disclosure of contingent assets and liabilities at the date of the financial statements and the reported amounts of revenue and expenses during the year. Actual results could differ from those estimates. During the periods presented, we have made a number of estimates and valuation assumptions, including the fair values of acquired assets, the useful lives and recoverability of property, plant and equipment and power purchase agreements, the recoverability of equity investments, the recoverability of deferred tax assets, tax provisions, and the fair value of financial instruments and derivatives. In addition, estimates are used to test long-lived assets and goodwill for impairment and to determine the fair value of impaired assets. These estimates and valuation assumptions are based on present conditions and our planned course of action, as well as assumptions about future business and economic conditions. As better information becomes available or actual amounts are determinable, the recorded estimates are revised. Should the underlying valuation assumptions and estimates change, the recorded amounts could change by a material amount.
(c) Regulatory accounting:
Path 15 accounts for certain income and expense items in accordance with a standard where certain costs are deferred, which would otherwise be charged to expense, as regulatory assets based on Path 15's ability to recover these costs in future rates.
(d) Revenue:
We recognize energy sales revenue on a gross basis when electricity and steam are delivered under the terms of the related contracts. Revenue associated with capacity payments under the PPAs are recognized as the lesser of (1) the amount billable under the PPA or (2) an amount determined by the kilowatt hours made available during the period multiplied by the estimated average revenue per kilowatt hour over the term of the PPA.
Transmission services revenue is recognized as transmission services are provided. The annual revenue requirement for transmission services is regulated by the Federal Energy Regulatory Commission ("FERC") and is established through a rate-making process that occurs every three years. When actual cash receipts from transmission services revenue are different than the regulated revenue requirement because of timing differences, the over or under collections are deferred until the timing differences reverse in future periods.
(e) Cash and cash equivalents:
Cash and cash equivalents include cash deposited at banks and highly liquid investments with original maturities of 90 days or less when purchased.
(f) Restricted cash:
Restricted cash represents cash and cash equivalents that are maintained by the Projects to support payments for major maintenance costs and meet project-level contractual debt obligations.
(g) Use of fair value:
We utilize a fair value hierarchy that gives the highest priority to quoted prices in active markets and is applicable to fair value measurements of derivative contracts and other instruments that are subject to mark-to-market accounting. Refer to Note 12, for more information.
F-8
NOTES TO CONSOLIDATED AUDITED FINANCIAL STATEMENTS (Continued)
2. Summary of significant accounting policies (Continued)
(h) Derivative financial instruments:
We use derivative financial instruments in the form of interest rate swaps, indexed swap hedges and foreign exchange forward contracts to manage our current and anticipated exposure to fluctuations in interest rates and foreign currency exchange rates. On occasion, we have also entered into natural gas supply contracts and natural gas forwards or swaps to minimize the effects of the price volatility of natural gas which is a major production cost. We do not enter into derivative financial instruments for trading or speculative purposes; however, not all derivatives qualify for hedge accounting.
Derivative financial instruments not designated as a hedge are measured at fair value with changes in fair value recorded in the consolidated statements of operations.
The following table summarizes derivative financial instruments that are not designated as hedges and the accounting treatment in the consolidated statements of operations of the changes in fair value of such derivative financial instrument:
Derivative financial instrument
|
Location of changes in fair value | |
|---|---|---|
Foreign currency forward contracts |
Foreign exchange loss (gain) | |
Lake natural gas swaps |
Change in fair value of derivative instruments | |
Auburndale natural gas swaps |
Change in fair value of derivative instruments | |
Interest rate swap |
Change in fair value of derivative instruments | |
Onondaga Indexed swap and indexed swap hedges |
Change in fair value of derivative instruments |
Certain derivative instruments qualify for a scope exception to fair value accounting, as they are considered normal purchases or normal sales. The availability of this exception is based upon the assumption that we have the ability and it is probable to deliver or take delivery of the underlying physical commodity. Derivatives that are considered to be normal purchases and normal sales are exempt from derivative accounting treatment and are recorded as executory contracts.
We have designated one of our interest rate swaps as a hedge of cash flows for accounting purposes. Tests are performed to evaluate hedge effectiveness and ineffectiveness at inception and on an ongoing basis, both retroactively and prospectively. Unrealized gains or losses on the interest rate swap designated within a designated hedging relationship are deferred and recorded as a component of accumulated other comprehensive income until the hedged transactions occur and are recognized in earnings. The ineffective portion of the cash flow hedge, if any, is immediately recognized in earnings.
(i) Property, plant and equipment:
Property, plant and equipment are stated at cost, net of accumulated depreciation. Depreciation is provided on a straight-line basis over the estimated useful life of the related asset. As major maintenance occurs, and as parts are replaced on the plant's combustion and steam turbines, these maintenance costs are either expensed or transferred to property, plant and equipment if the maintenance extends the useful lives of the major parts. These costs are depreciated over the parts' estimated useful lives, which is generally three to six years, depending on the nature of maintenance activity performed.
(j) Transmission system rights:
Transmission system rights are an intangible asset that represents the long-term right to approximately 72% of the capacity of the Path 15 transmission line in California. Transmission system rights are amortized on a straight-line basis over 30 years, the regulatory life of Path 15.
F-9
NOTES TO CONSOLIDATED AUDITED FINANCIAL STATEMENTS (Continued)
2. Summary of significant accounting policies (Continued)
(k) Asset retirement obligations:
The fair value for an asset retirement obligation is recorded in the period in which it is incurred. Retirement obligations associated with long-lived assets are those for which a legal obligation exists under enacted laws, statutes, and written or oral contracts, including obligations arising under the doctrine of promissory estoppel, and for which the timing and/or method of settlement may be conditional on a future event. When the liability is initially recorded, we capitalize the cost by increasing the carrying amount of the related long-lived asset. Over time, the liability is accreted to its present value each period and the capitalized cost is depreciated over the useful life of the related asset. Upon settlement of the liability, an entity either settles the obligation for its recorded amount or incurs a gain or loss.
(l) Impairment of long-lived assets, non-amortizing intangible assets and equity method investments:
Long-lived assets, such as property, plant and equipment, transmission system rights and other intangible assets subject to depreciation and amortization, are reviewed for impairment whenever events or changes in circumstances indicate that the carrying amount of an asset may not be recoverable. Recoverability of assets to be held and used is measured by a comparison of the carrying amount of an asset to estimated undiscounted future cash flows expected to be generated by the asset. If the carrying amount of an asset exceeds its estimated future cash flows, an impairment charge is recognized in the amount by which the carrying amount of the asset exceeds its fair value.
Investments in and the operating results of 50%-or-less owned entities not required to be consolidated are included in the consolidated financial statements on the basis of the equity method of accounting. We review our investments in such unconsolidated entities for impairment whenever events or changes in business circumstances indicate that the carrying amount of the investments may not be fully recoverable. Evidence of a loss in value that is other than temporary might include the absence of an ability to recover the carrying amount of the investment, the inability of the investee to sustain an earnings capacity which would justify the carrying amount of the investment, failure of cash flow coverage ratio tests included in project-level, non-recourse debt or, where applicable, estimated sales proceeds which are insufficient to recover the carrying amount of the investment. Our assessment as to whether any decline in value is other than temporary is based on our ability and intent to hold the investment and whether evidence indicating the carrying value of the investment is recoverable within a reasonable period of time outweighs evidence to the contrary. We generally consider our investments in our equity method investees to be strategic long-term investments. Therefore, we complete our assessments with a long-term view. If the fair value of the investment is determined to be less than the carrying value and the decline in value is considered to be other than temporary, an appropriate write-down is recorded based on the excess of the carrying value over the best estimate of fair value of the investment.
(m) Distributions from equity method investments:
We make investments in entities that own independent power producing assets with the objective of generating accretive cash flow that is available to be distributed to our shareholders. The cash flows that are distributed to us from these unconsolidated affiliates are directly related to the operations of the affiliates' power producing assets and are classified as cash flows from operating activities in the consolidated statements of cash flows.
We record the return of our investments in equity investees as cash flows from investing activities. Cash flows from equity investees are considered a return of capital when distributions are generated
F-10
NOTES TO CONSOLIDATED AUDITED FINANCIAL STATEMENTS (Continued)
2. Summary of significant accounting policies (Continued)
from proceeds of either the sale of our investment in its entirety or a sale by the investee of all or a portion of its capital assets.
(n) Goodwill:
Goodwill is the residual amount that results when the purchase price of an acquired business exceeds the sum of the amounts allocated to the assets acquired, less liabilities assumed, based on their fair values. Goodwill is allocated, as of the date of the business combination, to our reporting units that are expected to benefit from the synergies of the business combination.
Goodwill is not amortized and is tested for impairment, annually in the fourth quarter, or more frequently if events or changes in circumstances indicate that the asset might be impaired. The impairment test is carried out in two steps. In the first step, the carrying amount of the reporting unit is compared with its fair value. When the fair value of a reporting unit exceeds its carrying amount, goodwill of the reporting unit is considered not to be impaired and the second step of the impairment test is unnecessary.
The second step is carried out when the carrying amount of a reporting unit exceeds its fair value, in which case, the implied fair value of the reporting unit's goodwill is compared with its carrying amount to measure the amount of the impairment loss, if any. The implied fair value of goodwill is determined in the same manner as the value of goodwill is determined in a business combination described in the preceding paragraph, using the fair value of the reporting unit as if it were the purchase price. When the carrying amount of reporting unit goodwill exceeds the implied fair value of the goodwill, an impairment loss is recognized in an amount equal to the excess and is recorded in the consolidated statements of operations.
Goodwill at December 31, 2009 and 2008 relates to the Path 15 segment.
(o) Other intangible assets:
Other intangible assets include PPAs and fuel supply agreements at our projects.
Power purchase agreements are valued at the time of acquisition based on the prices received under the PPAs compared to projected market prices. The balances are presented net of accumulated amortization in the consolidated balance sheets. Amortization is recorded on a straight-line basis over the remaining term of the PPA. The weighted average period of remaining amortization is 4 years.
Fuel supply agreements are valued at the time of acquisition based on the prices projected to be paid under the fuel supply agreement relative to projected market prices. The weighted average period of remaining amortization is 3 years.
(p) Income taxes:
Income tax expense includes the current tax obligation or benefit and change in deferred income tax asset or liability for the period. We use the asset and liability method of accounting for deferred income taxes and provide deferred income taxes for all significant temporary differences. Income tax benefits associated with uncertain tax positions are recognized when we determine that it is more-likely-than-not that the tax position will be ultimately sustained. Refer to Note 14, for more information.
F-11
NOTES TO CONSOLIDATED AUDITED FINANCIAL STATEMENTS (Continued)
2. Summary of significant accounting policies (Continued)
(q) Foreign currency translation:
Our functional currency and reporting currency is the United States dollar. The functional currency of our subsidiaries and other investments is the United States dollar. Monetary assets and liabilities denominated in Canadian dollars are translated into United States dollars using the rate of exchange in effect at the end of the year. All transactions denominated in Canadian dollars are translated into United States dollars at average exchange rates.
(r) Long-term incentive plan:
The officers and other employees of Atlantic Power are eligible to participate in the Long-Term Incentive Plan ("LTIP") that was implemented in 2007 and continued in effect until the end of 2009. On an annual basis, the Board of Directors of Atlantic Power establishes awards that are based on the cash flow performance of Atlantic Power in the most recently completed year, each participant's base salary and the market price of the shares at the award date. Awards are granted in the form of notional units that have similar economic characteristics to our common shares. Notional units vest ratably over a three-year period and are redeemed in a combination of cash and shares upon vesting.
Unvested notional awards are entitled to receive dividends equal to the dividends per common share during the vesting period in the form of additional notional units. Unvested awards are subject to forfeiture if the participant is not an employee at the vesting date or if we do not meet certain ongoing cash flow performance targets.
Compensation expense related to awards granted to participants in the LTIP is recorded over the vesting period based on the estimated fair value of the award at each balance sheet date. Fair value of the awards is determined by projecting the total number of notional units that will vest in future periods, including dividends received on notional units during the vesting period, and applying the current market price per share to the projected number of notional units that will vest. Forfeitures are recorded as they occur and are not included in the estimated fair value of the awards. The aggregate number of shares which may be issued from treasury under the LTIP is limited to one million. All awards are accounted for as liability awards.
In early 2010, the Board of Directors approved an amendment to the LTIP. The amended LTIP will be effective for grants beginning with the 2010 performance year. Under the amended LTIP, the notional units granted to plan participants will have the same characteristics as notional units under the old LTIP. However, the number of notional units granted will be based, in part, on the total shareholder return of Atlantic Power compared to a group of peer companies in Canada. In addition, vesting of the notional units for officers of Atlantic Power will occur on a 3-year cliff basis as opposed to ratable vesting over three years for grants made prior to the amendments.
(s) Deferred financing costs:
Deferred financing costs represent costs to obtain long-term financing and are amortized using the effective interest method over the term of the related debt which range from five to 28 years. The net carrying amount of deferred financing costs recorded in other assets on the consolidated balance sheets was $5.5 million and $11.7 million at December 31, 2009 and 2008, respectively. Amortization expense for the years ended December 31, 2009, 2008 and 2007 was $14.6 million, $1.1, and $0.6 million, respectively.
F-12
NOTES TO CONSOLIDATED AUDITED FINANCIAL STATEMENTS (Continued)
2. Summary of significant accounting policies (Continued)
(t) Concentration of credit risk:
The financial instruments that potentially expose us to credit risk consist primarily of cash, restricted cash, derivatives and accounts receivable. Cash and restricted cash are held by major financial institutions that are also counterparties to our derivative contracts. We have long-term agreements to sell electricity, gas and steam to public utilities and corporations. We have exposure to trends within the energy industry, including declines in the creditworthiness of our customers. We do not normally require collateral or other security to support energy-related accounts receivable. We do not believe there is significant credit risk associated with accounts receivable due to payment history. See Note 18, Segment and related information, for a further discussion of customer concentrations.
(u) Segments:
We have six reportable segments: Path 15, Auburndale, Lake, Pasco, Chambers and Other Project Assets. Each of our projects is an operating segment. Based on similar economic and other characteristics, we aggregated several of the projects into the Other Project Assets reportable segment.
(v) Recently issued accounting standards:
In June 2009, the FASB approved the "FASB Accounting Standards Codification" ("Codification") as the single source of authoritative, nongovernmental, U.S. Generally Accepted Accounting Principles ("GAAP") as of July 1, 2009. The Codification does not change current U.S. GAAP or how we account for our transactions or nature of related disclosures made; instead it is intended to simplify user access to all authoritative literature related to a particular topic in one place. All existing accounting standard documents will be superseded, and all other accounting literature not included in the Codification will be considered non-authoritative. The Codification is effective for interim and annual periods ending after September 15, 2009. The Codification became effective for Atlantic Power beginning the quarter ending September 30, 2009 and did not have an impact in our balance sheet or results of operations for the year ended December 31, 2009.
In 2009, the FASB amended the consolidation guidance applied to VIEs. This standard replaces the quantitative approach previously required to determine which entity has a controlling financial interest in a VIE with a qualitative approach. Under the new approach, the primary beneficiary of a VIE is the entity that has both (a) the power to direct the activities of the VIE that most significantly impact the entity's economic performance, and (b) the obligation to absorb losses of the entity, or the right to receive benefits from the entity, that could be significant to the VIE. This standard also requires ongoing reassessments of whether an entity is the primary beneficiary of a VIE and enhanced disclosures about an entity's involvement in VIEs. The standard is effective for fiscal years beginning after November 15, 2009. We do not expect this standard to have a material effect upon our financial statements.
In 2010, the FASB amended the Fair Value Measurements and Disclosures Topic of the FASB Accounting Standards Codification to require additional disclosures about 1) transfers of Level 1 and Level 2 fair value measurements, including the reason for transfers, 2) purchases, sales, issuances and settlements in the roll forward of activity in Level 3 fair value measurements, 3) additional disaggregation to include fair value measurement disclosures for each class of assets and liabilities and 4) disclosure of inputs and valuation techniques used to measure fair value for both recurring and nonrecurring fair value measurements. The amendment is effective for fiscal years beginning after December 15, 2009, except for the disclosures about purchases, sales, issuances and settlements in the roll forward of activity in Level 3 fair value measurements, which is effective for fiscal years beginning
F-13
NOTES TO CONSOLIDATED AUDITED FINANCIAL STATEMENTS (Continued)
2. Summary of significant accounting policies (Continued)
after December 15, 2010. We do not expect this standard to have a material effect upon our financial statements.
We adopted the FASB's revised standard for business combinations on January 1, 2009. The provisions of the standard are applied prospectively to business combinations for which the acquisition date occurs after January 1, 2009. The statement requires an acquirer to recognize and measure in its financial statements the identifiable assets acquired, the liabilities assumed, and any noncontrolling interest in the acquiree at fair value at the acquisition date. It also recognizes and measures the goodwill acquired or a gain from a bargain purchase in the business combination and determines what information to disclose to enable users of an entity's financial statements to evaluate the nature and financial effects of the business combination. In addition, transaction costs are required to be expensed as incurred. This standard was further amended and clarified with regards to application issues on initial recognition and measurement, subsequent measurement and accounting, and disclosure of assets and liabilities arising from contingencies in a business combination. Our adoption of the standard did not have an impact on the results of operations, financial position, or cash flows.
In May 2009, the FASB issued a standard that incorporates the accounting and disclosure requirements related to subsequent events found in auditing standards into U.S. GAAP, effectively making management directly responsible for subsequent events accounting and disclosures. The standard also requires disclosure of the date through which subsequent events have been evaluated. The standard is effective for interim and annual reporting periods ending after June 15, 2009, and shall be applied prospectively. Our adoption of the standard did not have an impact on the results of operations, financial position, or cash flows.
In 2008, the FASB amended the disclosure requirements to improve financial reporting about derivatives and hedging activities. This standard became effective on January 1, 2009. We have adopted this standard as of January 1, 2009 and have adjusted our current disclosures accordingly.
In September 2006, the FASB issued a standard which provides enhanced guidance for using fair value measurements in financial reporting. While the standard does not expand the use of fair value in any new circumstance, it has applicability to several current accounting standards that require or permit entities to measure assets and liabilities at fair value. The standard defines fair value, establishes a framework for measuring fair value in GAAP and expands disclosures about fair value measurements. The impact of our adoption of this standard on January 1, 2008 resulted in a $25.2 million decrease to retained deficit.
In July 2006, the FASB issued an interpretation that requires a new evaluation process for all tax positions taken, recognizing tax benefits when it is more-likely-than-not that a tax position will be sustained upon examination by the authorities. The benefit from a position that has surpassed the more-likely-than-not threshold is the largest amount of benefit that is more than 50% likely to be realized upon settlement. Differences between the amounts recognized in the statement of financial position prior to the adoption of the interpretation and the amounts reported after adoption are to be accounted for as an adjustment to the beginning balance of retained earnings. Our adoption of the standard on January 1, 2007 did not have an impact on the results of operations, financial position, or cash flows.
F-14
NOTES TO CONSOLIDATED AUDITED FINANCIAL STATEMENTS (Continued)
3. Acquisitions and divestments
On November 30, 2009, we sold our 50% interest in the assets of Stockton Cogen Company LP for a nominal cash payment. Stockton is a 55 MW coal/biomass cogeneration facility located in Stockton, California. During the year ended December 31, 2009, we recorded a loss on the sale of $2.0 million. The loss on sale was recorded in gain (loss) on sales of equity investments in the in the accompanying consolidated statements operations.
On November 24, 2009, we sold our 50% interest in the assets of Mid-Georgia Cogen LP for $29.1 million. Mid-Georgia is a 308 MW dual-fueled, combined-cycle, cogeneration plant located in Kathleen, Georgia. We recorded a gain on sale of asset of $15.8 million. The gain on sale was recorded in gain (loss) on sales of equity investments in the in the accompanying consolidated statements of operations.
In December 2007, we acquired substantially all of the remaining 50.1% interest in the Pasco Project from our existing partners. During 2008, we finalized the allocation of purchase price to the net assets acquired with no significant changes from the preliminary allocation in the following table:
Working capital |
$ | 4,466 | |||
Other long-term assets |
20,518 | ||||
Total purchase price |
24,984 | ||||
Less cash acquired |
(1,771 | ) | |||
Cash paid, net of cash acquired |
$ | 23,213 | |||
On March 31, 2009, we acquired a 40% equity interest in Rollcast Energy, Inc., a North Carolina Corporation. Rollcast is a developer of biomass power plants in the southeastern U.S. with five, 50 MW projects in various stages of development. The investment in Rollcast gives us the option but not the obligation to invest equity in Rollcast's biomass power plants. Two of the development projects have secured 20-year power purchase agreements with terms that allow for fuel cost pass-through to the utility customer. Total cash paid for the investment was $3.0 million and is accounted for under the equity method of accounting.
In March 2010, we agreed to invest an additional $2.0 million to increase our ownership interest in Rollcast to 60%. Under the terms of the agreement, $1.2 million of the investment was made in March 2010 and the remaining $0.8 million will be payable if Rollcast achieves certain milestones on its first biomass development project. As a result of this additional investment, we will begin to consolidate our investment in Rollcast beginning in the first quarter of 2010. See Note 21 for additional information.
In the first quarter of 2009, we transferred our remaining net assets of Onondaga Cogeneration Limited Partnership at net book value, into a 50% owned joint venture, Onondaga Renewables, LLC,
F-15
NOTES TO CONSOLIDATED AUDITED FINANCIAL STATEMENTS (Continued)
3. Acquisitions and divestments (Continued)
which is redeveloping the Project into a 35-40 MW biomass power plant. Our investment in Onondaga Renewables is accounted for under the equity method of accounting.
During the three months ended September 30, 2009, we reviewed the recoverability of our 23.5% equity investment in the Rumford project. The review was undertaken as a result of not receiving distributions from the Project through the first nine months of 2009 and our view about the long-term economic viability of the plant upon expiration of the Project's PPA on December 31, 2009.
Based on this review, we determined that the carrying value of the Rumford project was impaired and recorded a pre-tax long-lived asset impairment of $5.5 million during 2009. The Rumford project is accounted for under the equity method of accounting and the impairment charge is included in equity in earnings of unconsolidated affiliates in the consolidated statements of operations.
In the fourth quarter of 2009, Atlantic Power and the other limited partners in the Rumford Project settled a dispute with the general partner related to the general partner's failure to pay distributions to the limited partners in 2009. Under the terms of the settlement, we received $2.9 million in distributions from Rumford in the fourth quarter of 2009. In addition, the general partner has agreed to purchase the interests of all the limited partners in 2010. However, the general partner is relieved of this obligation if certain conditions are met before June 30, 2010. If the general partner does purchase the limited partners interests, our share of the proceeds will be approximately $2.5 million. The carrying value of our investment in Rumford as of December 31, 2009 is $0.8 million.
On November 21, 2008, we acquired 100% of Auburndale Power Partners, L.P., which owns and operates a 155 MW natural gas-fired combined cycle cogeneration facility located in Polk County, Florida. The purchase price was funded by cash on hand, a borrowing under our credit facility and $35 million of acquisition debt. The cash payment for the acquisition, including acquisition costs, has been allocated to the net assets acquired based on our preliminary estimate of the fair value.
Total cash paid for the acquisition, less cash acquired, during 2008 was $141.7 million. In 2009, we received a working capital adjustment from the sellers in the amount of $1.8 million, resulting in final purchase price of $139.9 million.
The allocation of the purchase price to the net assets acquired is as follows:
Working capital |
$ | 11,589 | |||
Property, plant and equipment |
56,301 | ||||
Power purchase agreements |
45,980 | ||||
Fuel supply agreements |
33,846 | ||||
Other long-term assets |
663 | ||||
Total purchase price |
148,379 | ||||
Less cash acquired |
(8,471 | ) | |||
Cash paid, net of cash acquired |
$ | 139,908 | |||
F-16
NOTES TO CONSOLIDATED AUDITED FINANCIAL STATEMENTS (Continued)
3. Acquisitions and divestments (Continued)
(h) Jamaica Private Power Company Ltd. Divestment
In 2007, we sold our equity investment in the Jamaica Project for $6.2 million. The carrying value of the equity investment exceeded the sales price and, accordingly, a loss of $5.1 million was recorded in gain (loss) on sales of equity investments in the consolidated statement of operations for the year ended December 31, 2007.
4. Equity method investments
The following table summarizes our equity method investments:
| |
|
Carrying value as December 31, |
||||||||
|---|---|---|---|---|---|---|---|---|---|---|
| |
Percentage of Ownership as of December 31, 2009 |
|||||||||
Entity name
|
2009 | 2008 | ||||||||
Badger Creek Limited |
50.0% | $ | 9,949 | $ | 11,677 | |||||
Chambers Cogen, LP |
40.0% | 129,501 | 124,032 | |||||||
Delta-Person, LP |
40.0% | — | 644 | |||||||
Gregory Power Partners, LP |
17.1% | 2,931 | 3,381 | |||||||
Koma Kulshan Associates |
49.8% | 7,003 | 6,736 | |||||||
Mid-Georgia Cogen, LP |
0.0% | — | 15,340 | |||||||
Onondaga Renewables, LLC |
50.0% | 1,757 | — | |||||||
Orlando Cogen, LP |
50.0% | 36,387 | 45,910 | |||||||
Rollcast Energy, Inc |
40.0% | 2,801 | — | |||||||
Rumford Cogeneration, LP |
26.2% | 845 | 5,649 | |||||||
Selkirk Cogen Partners, LP |
18.5% | 57,030 | 60,307 | |||||||
Topsham Hydro Assets |
50.0% | 10,825 | 11,151 | |||||||
Other |
— | 201 | 2,948 | |||||||
Total |
$ | 259,230 | $ | 287,775 | ||||||
F-17
NOTES TO CONSOLIDATED AUDITED FINANCIAL STATEMENTS (Continued)
4. Equity method investments (Continued)
Equity in earnings of unconsolidated affiliates was as follows:
| |
Year Ended December 31, | |||||||||
|---|---|---|---|---|---|---|---|---|---|---|
Entity name
|
2009 | 2008 | 2007 | |||||||
Badger Creek Limited |
$ | 1,948 | $ | 2,477 | $ | 2,619 | ||||
Chambers Cogen, LP |
6,599 | 16,250 | 16,601 | |||||||
Delta-Person LP |
(644 | ) | (1,076 | ) | (1,111 | ) | ||||
Gregory Power Partners, LP |
1,791 | 4,621 | 3,886 | |||||||
Koma Kulshan Associates |
458 | 580 | 827 | |||||||
Mid-Georgia Cogen, LP |
(2,686 | ) | (2,068 | ) | (1,051 | ) | ||||
Onondaga Renewables, LLC |
(600 | ) | — | — | ||||||
Orlando Cogen Limited LP |
3,152 | 2,920 | 2,410 | |||||||
Rollcast Energy, Inc |
(267 | ) | — | — | ||||||
Rumford Cogeneration LP |
(1,904 | ) | 2,922 | 3,081 | ||||||
Selkirk Cogen Partners, LP |
(280 | ) | (6,958 | ) | 8,696 | |||||
Topsham Hydro Assets |
1,506 | 2,064 | 1,321 | |||||||
Other |
(559 | ) | (19,837 | ) | 7,089 | |||||
Total |
8,514 | 1,895 | 44,368 | |||||||
Distributions from equity method investments |
(27,884 |
) |
(41,031 |
) |
(46,653 |
) |
||||
Equity in earnings (loss) of unconsolidated affiliates, net of distributions |
$ | (19,370 | ) | $ | (39,136 | ) | $ | (2,285 | ) | |
F-18
NOTES TO CONSOLIDATED AUDITED FINANCIAL STATEMENTS (Continued)
4. Equity method investments (Continued)
The following summarizes the balance sheets at December 31, 2009, 2008 and 2007, and operating results for each of the years in the three-year period ended December 31, 2009, for our equity method investments:
| |
2009 | 2008 | 2007 | |||||||||
|---|---|---|---|---|---|---|---|---|---|---|---|---|
Assets |
||||||||||||
Current assets |
||||||||||||
Chambers |
$ | 10,356 | $ | 14,418 | $ | 12,696 | ||||||
Mid-Georgia |
— | 13,967 | 13,950 | |||||||||
Orlando |
6,725 | 9,366 | 8,370 | |||||||||
Other |
25,198 | 29,152 | 34,217 | |||||||||
Non-current assets |
||||||||||||
Chambers |
259,989 | 266,686 | 272,815 | |||||||||
Mid-Georgia |
— | 53,706 | 56,414 | |||||||||
Orlando |
34,975 | 40,026 | 45,382 | |||||||||
Other |
134,908 | 158,143 | 203,611 | |||||||||
|
$ | 472,151 | $ | 585,464 | $ | 647,455 | ||||||
Liabilities |
||||||||||||
Current liabilities |
||||||||||||
Chambers |
$ | 16,898 | $ | 16,692 | $ | 12,354 | ||||||
Mid-Georgia |
— | 3,938 | 11,487 | |||||||||
Orlando |
5,313 | 3,482 | 7,362 | |||||||||
Other |
21,112 | 22,675 | 24,637 | |||||||||
Non-current liabilities |
||||||||||||
Chambers |
123,946 | 140,381 | 153,574 | |||||||||
Mid-Georgia |
— | 48,394 | 41,469 | |||||||||
Orlando |
— | — | — | |||||||||
Other |
45,852 | 62,127 | 94,881 | |||||||||
|
$ | 213,121 | $ | 297,689 | $ | 345,764 | ||||||
Operating results |
||||||||||||
Revenue |
||||||||||||
Chambers |
$ | 50,745 | $ | 68,893 | $ | 66,629 | ||||||
Mid-Georgia |
6,521 | 14,992 | 19,000 | |||||||||
Orlando |
41,911 | 34,372 | 37,392 | |||||||||
Other |
112,242 | 177,143 | 187,936 | |||||||||
Project expenses |
||||||||||||
Chambers |
40,540 | 44,264 | 41,652 | |||||||||
Mid-Georgia |
6,519 | 13,509 | 16,147 | |||||||||
Orlando |
38,694 | 31,819 | 34,662 | |||||||||
Other |
99,483 | 158,587 | 155,810 | |||||||||
Project other income (expense) |
||||||||||||
Chambers |
(3,606 | ) | (8,379 | ) | (8,376 | ) | ||||||
Mid-Georgia |
13,137 | (3,551 | ) | (3,904 | ) | |||||||
Orlando |
(65 | ) | 367 | (319 | ) | |||||||
Other |
(13,355 | ) | (33,763 | ) | (10,834 | ) | ||||||
Project income (loss) |
||||||||||||
Chambers |
$ | 6,599 | $ | 16,250 | $ | 16,601 | ||||||
Mid-Georgia |
13,139 | (2,068 | ) | (1,051 | ) | |||||||
Orlando |
3,152 | 2,920 | 2,411 | |||||||||
Other |
(596 | ) | (15,207 | ) | 21,292 | |||||||
F-19
NOTES TO CONSOLIDATED AUDITED FINANCIAL STATEMENTS (Continued)