Attached files
| file | filename |
|---|---|
| 8-K - FORM 8-K - NAVISTAR INTERNATIONAL CORP | d8k.htm |
 Jefferies 6
th
Annual Global Industrials
and A&D Conference
August 10th, 2010
Exhibit 99.1
1
NYSE:
NAV |
 2
NYSE:
NAV
Safe Harbor
Statement &
Other Cautionary Notes
Information provided and statements contained in this presentation that are not
purely historical are forward-looking statements within the meaning of
Section 27A of the Securities Act of 1933, as amended, Section
21E of the Securities Exchange Act of
1934, as amended, and the Private Securities Litigation Reform Act of 1995. Such
forward-looking statements only speak as of the date of this
presentation and the Company assumes no obligation to update the information included in this presentation.
Such forward-looking statements include information concerning our possible or
assumed future results of operations, including descriptions
of
our
business
strategy.
These
statements
often
include
words
such
as
“believe,”
“expect,”
“anticipate,”
“intend,”
“plan,”
“estimate,”
or similar expressions. These statements are not guarantees of performance or
results and they involve risks, uncertainties,
and
assumptions.
For
a
further
description
of
these
factors,
see
Item
1A,
Risk
Factors,
included
within
our
Form
10-K
for
the
year
ended
October
31,
2009,
which
was
filed
on
December
21,
2009.
Although
we
believe
that
these
forward-
looking statements are based on reasonable assumptions, there are many factors that
could affect our actual financial results or results of operations and could
cause actual results to differ materially from those in the forward-looking statements. All future
written and oral forward-looking statements by us or persons acting on our
behalf are expressly qualified in their entirety by the cautionary
statements
contained
or
referred
to
above.
Except
for
our
ongoing
obligations
to
disclose
material
information
as
required by the federal securities laws, we do not have any obligations or
intention to release publicly any revisions to any forward-looking
statements to reflect events or circumstances in the future or to reflect the occurrence of unanticipated events.
The financial information herein contains audited and unaudited information and has
been prepared by management in good faith and based on data currently
available to the Company. Certain
Non-GAAP
measures
are
used
in
this
presentation
to
assist
the
reader
in
understanding
our
core
manufacturing
business.
We
believe
this
information
is
useful
and
relevant
to
assess
and
measure
the
performance
of
our
core
manufacturing
business as it illustrates manufacturing performance without regard to selected
historical legacy costs (i.e. pension and other postretirement costs). It
also excludes financial services and other expenses that may not be related to the core manufacturing
business.
Management
often
uses
this
information
to
assess
and
measure
the
performance
of
our
operating
segments.
A
reconciliation to the most appropriate GAAP number is included in the appendix of
this presentation. |
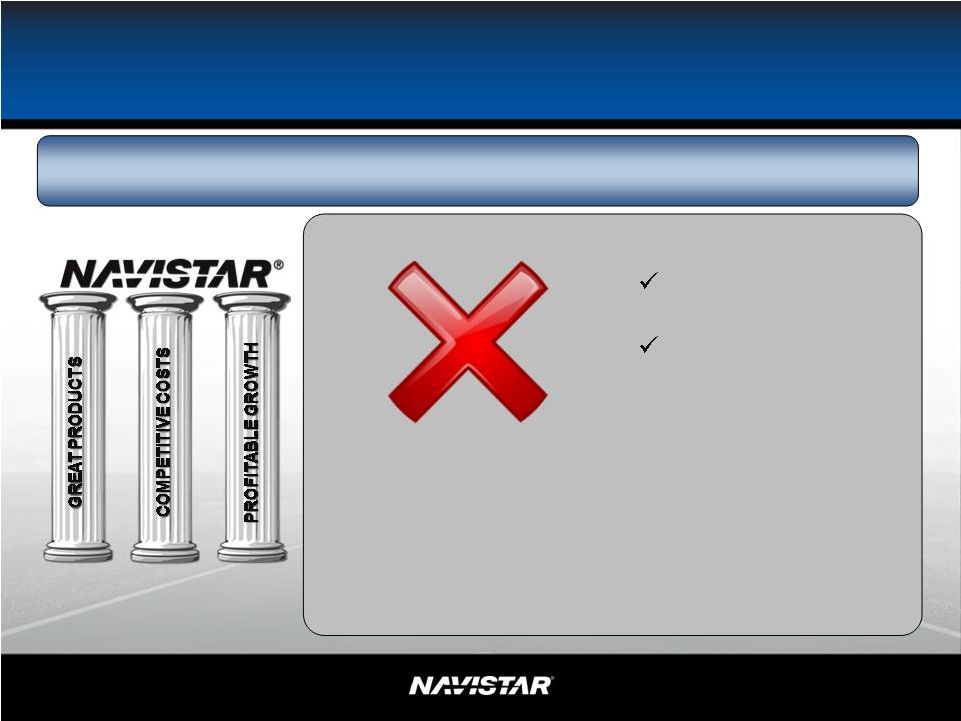 Actions Taken in 2010 That Impact
Our Strategy
Strategy: Leveraging What We Have and What Others Have Built
•
Focus is on reducing impact of cyclicality
•
Improve cost structure while developing
synergistic niche businesses
•
Controlling our Destiny
•
Goal of:
-
$15 billion in
revenue
-
$1.6 billion in
segment profit at
peak of cycle
•
•
Revised goal of:
Revised goal of:
$20 billion in
$20 billion in
revenue
revenue
$1.8 billion in
$1.8 billion in
segment profit at
segment profit at
average of cycle
average of cycle
3
NYSE:
NAV
Note: This slide contains both GAAP and non-GAAP information, please see the Reg G in
appendix for detailed reconciliation. |
 4
NYSE:
NAV
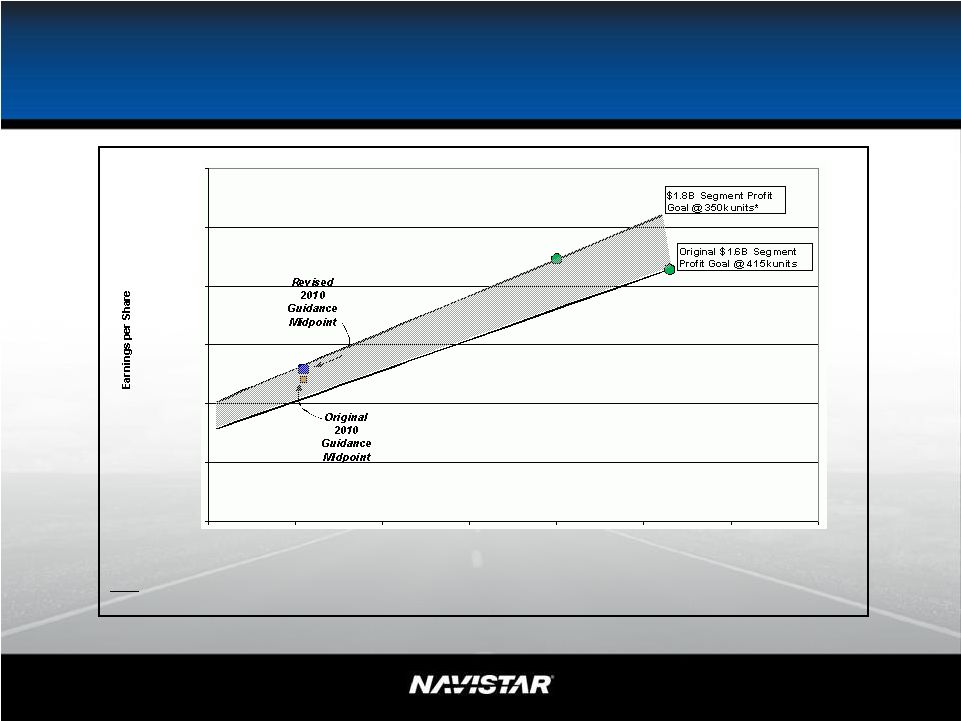
4
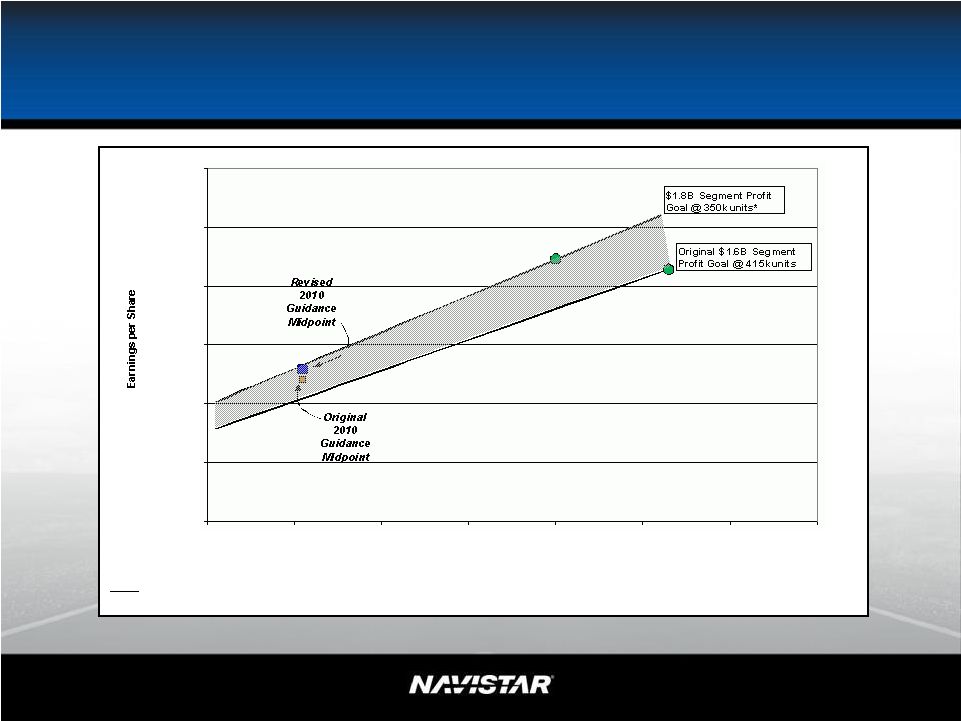
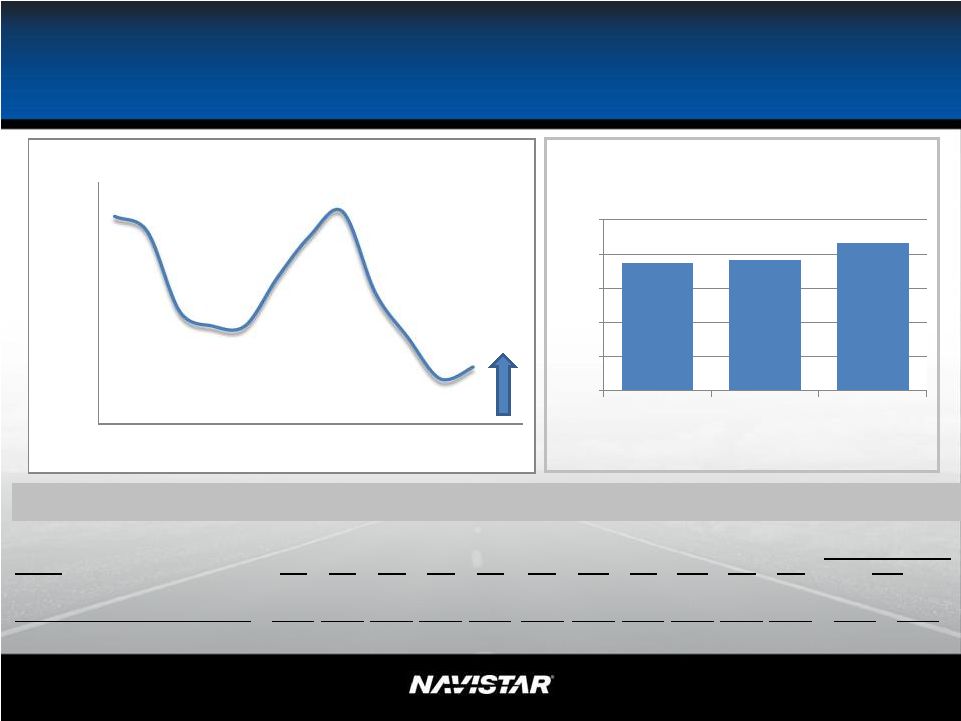
Profitable Growth
Earnings Per Share vs. Industry Volume
Note:
This
is
not
to
illustrate
updated
guidance.
Any
updated
guidance
will
be
provided
during
our
3
Quarter
Earnings
Call.
$(10.00)
$(5.00)
$-
$5.00
$10.00
$15.00
$20.00
150
200
250
300
350
400
450
500
Traditional Industry Volume (Thousands of Units)
Notes:
*
Assumes
attainment
of
mature
global
growth
by
end
of
calendar
year
2013
rd
Note: This slide contains both GAAP and non-GAAP information, please see the Reg G in
appendix for detailed reconciliation. |
 NYSE: NAV
5
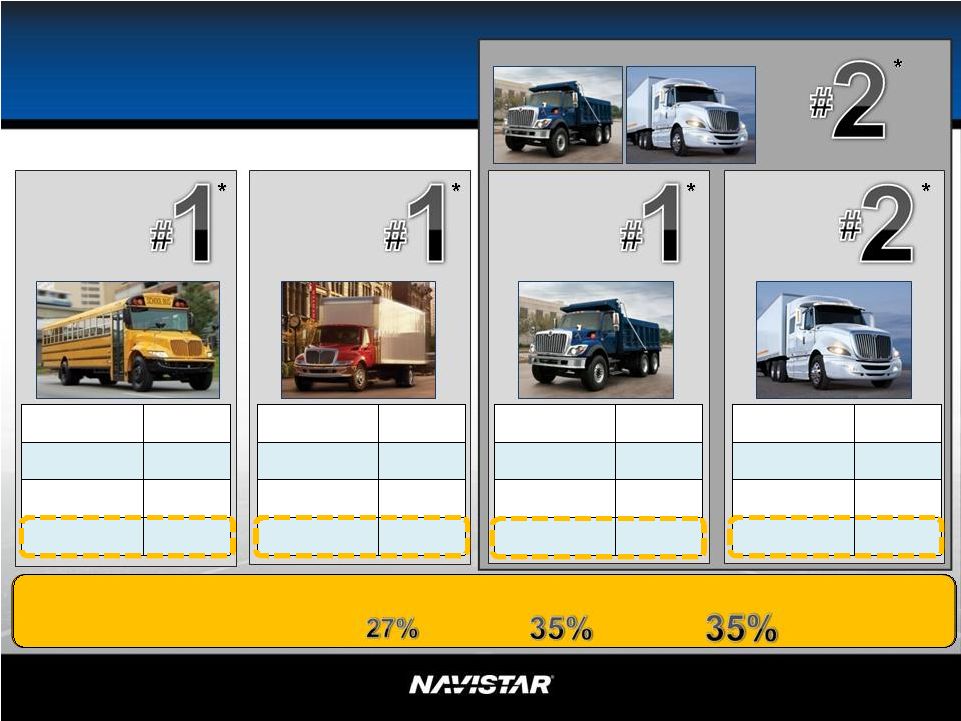
5
Medium
Truck
Great Products –
Market Share
Severe
Service
Truck**
Heavy
Truck
FY07
60%
FY08
55%
FY09
61%
June YTD10
60%
**Excludes U.S. Military shipments
FY07
36%
FY08
36%
FY09
35%
June YTD10
40%
FY07
25%
FY08
27%
FY09
34%
June YTD10
35%
FY07
15%
FY08
19%
FY09
25%
June YTD10
25%
Class 8**
School
Bus
(U.S. & Canada)
School Bus & Combined Class 6-8 Market Share –
2Q
FY08:
;
2Q
FY09:
;
2Q
FY10:
*Market Share based on brand |
 6
NYSE:
NAV
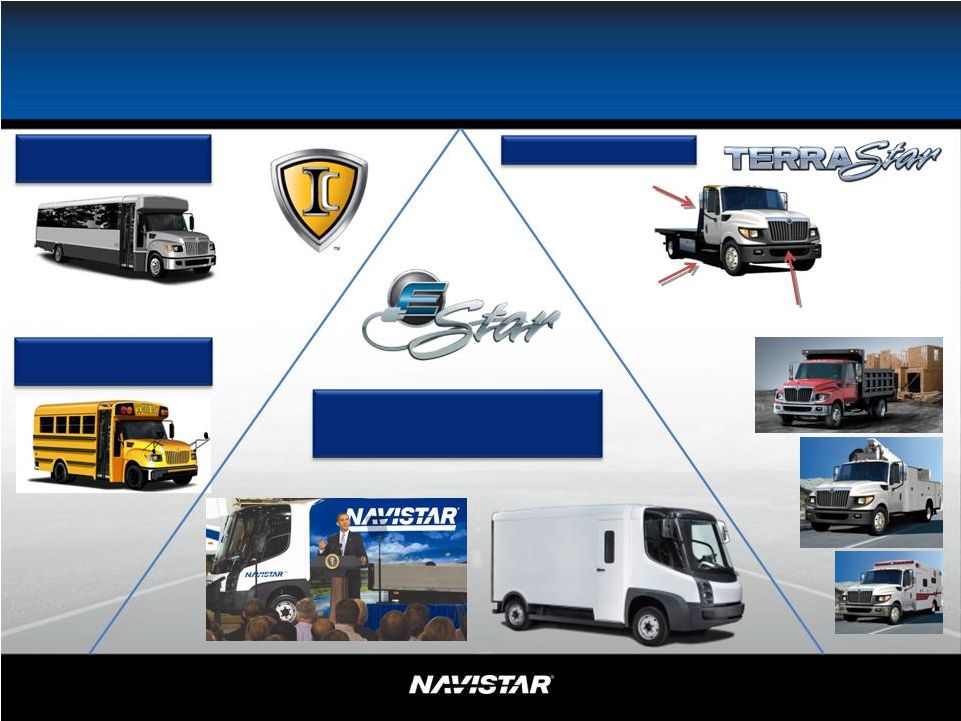
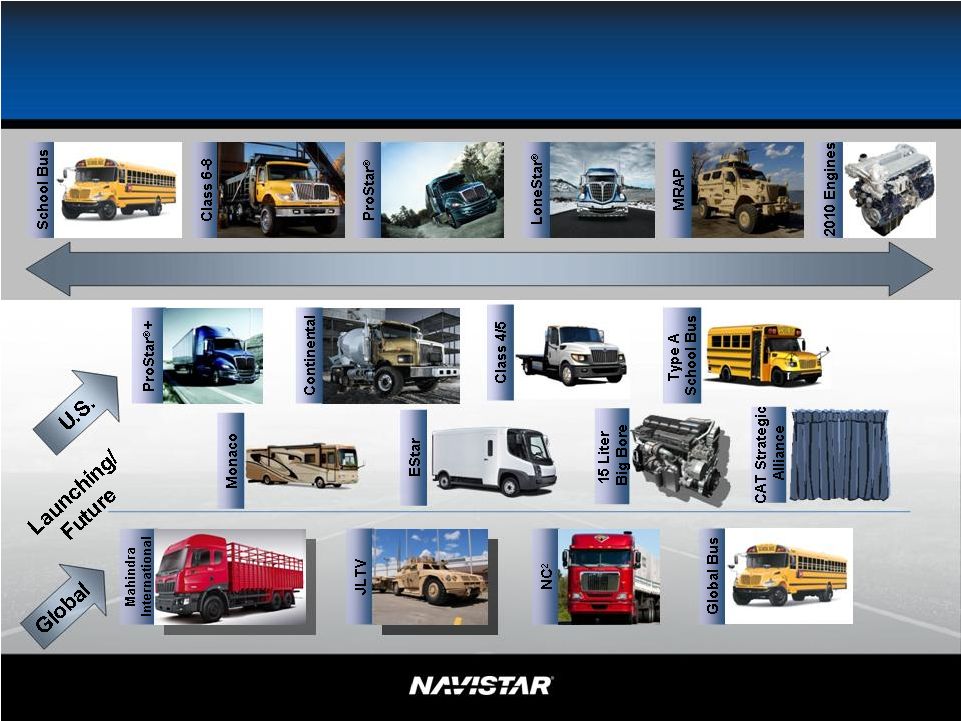
Launches of New Product
•
2010 emission lineup
•
ProStar+
®
•
15L engine
•
EStar
®
•
Mahindra
•
TerraStar
®
Class 4-5
•
Military
-
MaxxPro
DXM™
•
Continental Mixer
•
NC
2
® |
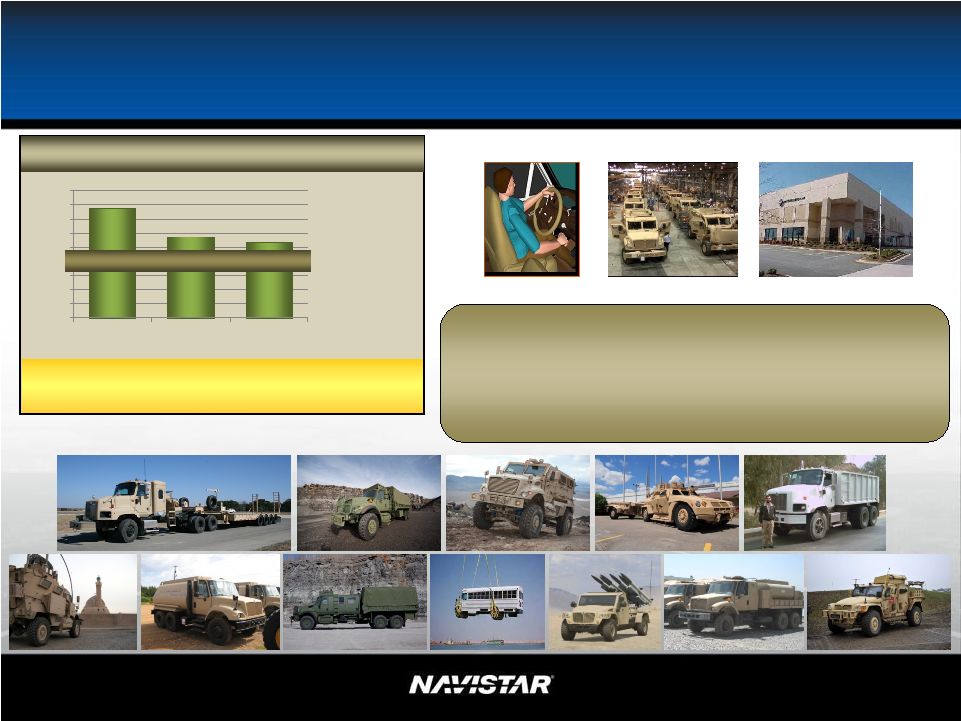
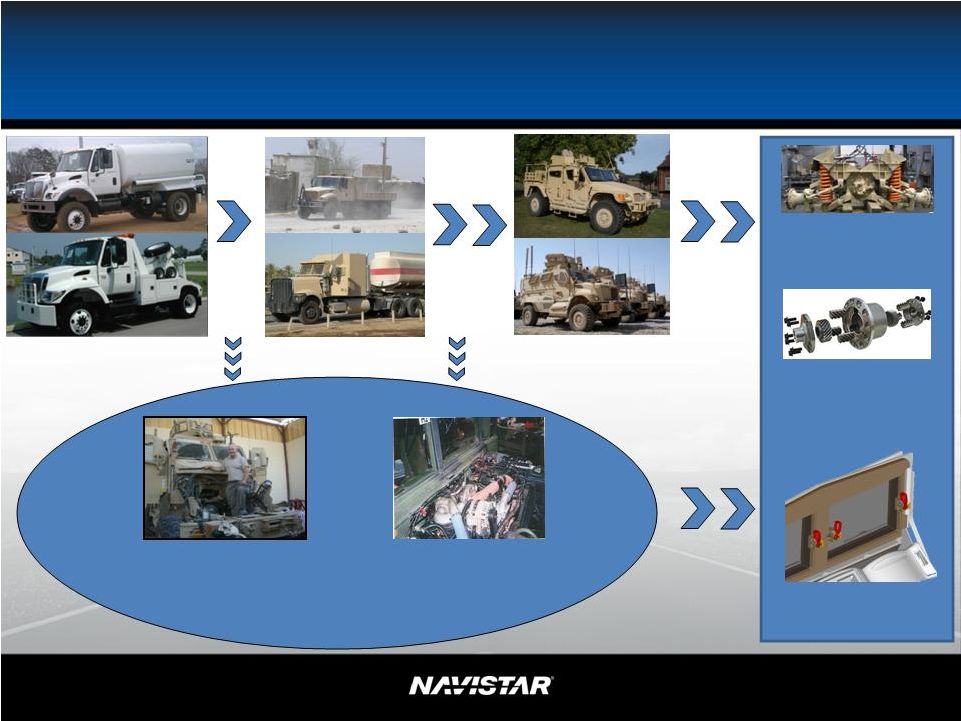 Navistar Defense Business
Model “Leveraging what we have and what others have built.”
COTS
True Tactical Vehicles
Field Service Reps
Integrated Logistics
Services
Parts Support Reset,
Refurbish, Repower
Independent
Suspension
Emergency
Egress Windows
MXT Limited Slip
Differential
Upgrade
7
7
MilCOTS
NYSE:
NAV |
 8
NYSE:
NAV
$2 Billion Sustainable
Navistar Defense
•
Leverages
base
business
•
Continued
strength
Augment
Sustainable
base
with
Selective
Opportunities
Engineering
Manufacturing
Sustainment
Enablers
What’s happened since we talked to you last:
•
May 4 -
$89 million for TACOM vehicles for the Afghan
National Army
•
May
4
-
$102
million
for
MaxxPro
Dash
MRAP
capability
insertion
•
May 26 -
$61 million to support Foreign Military Sales (FMS)
$0
$500
$1,000
$1,500
$2,000
$2,500
$3,000
$3,500
$4,000
$4,500
FY 2008
FY 2009
FY 2010
Guidance
$2 billion sustainable
Note: This is not to illustrate updated guidance. Any updated guidance
will be provided
during
our
3
Quarter
Earnings
Call.
rd
® |
 Customer friendly
solutions
Manage timing
transition
Improved fuel
economy
Improved
performance
Torque and weight
Improved margins
2010 Engines Hit the Mark!
Evolution of
technology
Improved durability
Lead conversion
from 15L to 13L
Earn credits early
Leading used truck
values
9
NYSE:
NAV |
 10
NYSE:
NAV
North America Vehicle Strategy
•
Profitable growth
•
Product
differentiation
–
leadership
•
Continuous growth
–
North America
–
Global
•
Engineering and product development/keep
investing
•
Position us for when market returns |
 11
NYSE:
NAV
11
Profitable Growth
Earnings Per Share vs. Industry Volume
Note:
This
is
not
to
illustrate
updated
guidance.
Any
updated
guidance
will
be
provided
during
our
3
rd
Quarter
Earnings
Call.
$(10.00)
$(5.00)
$-
$5.00
$10.00
$15.00
$20.00
150
200
250
300
350
400
450
500
Traditional Industry Volume (Thousands of Units)
Notes:
*
Assumes
attainment
of
mature
global
growth
by
end
of
calendar
year
2013
Note: This slide contains both GAAP and non-GAAP information, please see the Reg G in
appendix for detailed reconciliation. |
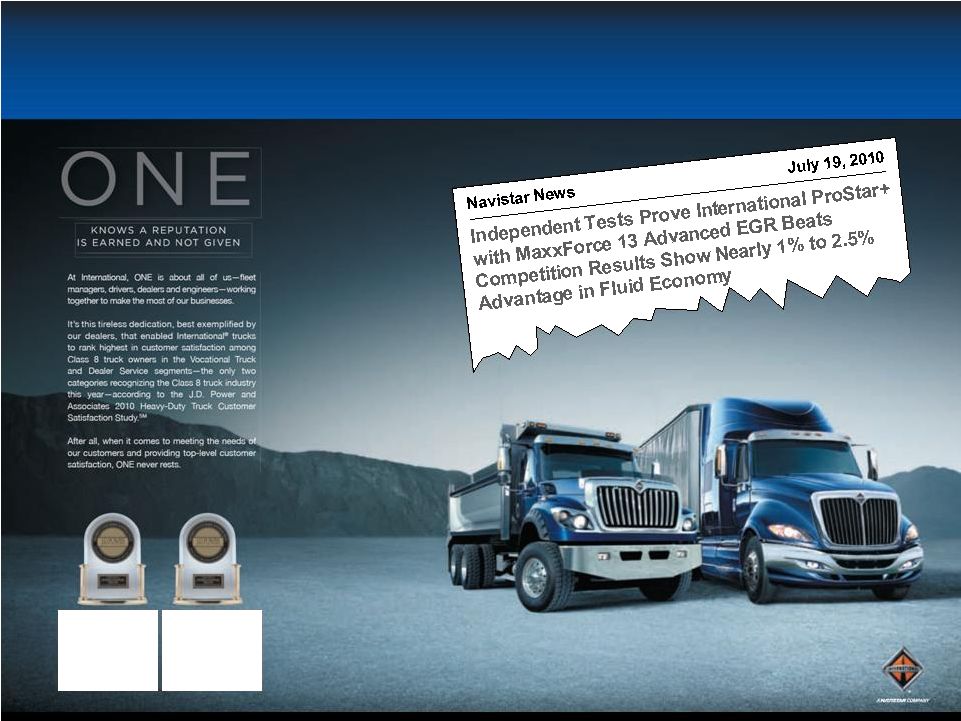 Product Differentiation –
Leadership
“Highest in
Customer
Satisfaction
among Vocational
Segment Class 8
Trucks”
“Highest in
Customer
Satisfaction with
Heavy-Duty Truck
Dealer Service” |
 DuraStar
Cab
Cab
Day, Extended & Crew
CF Chassis
CF Chassis
Drop Rails
Drop Rails
MaxxForce
MaxxForce
7
7
®
Engine
Engine
Continuous Growth:
North American Niche Market Launches
Type A School
Launch: May 2011
Cutaway Commercial
Launch: January 2011
Class 2c-3 All-Electric Truck
Announced: August 2009
Launch: May 2011
Class 4/5
13
NYSE:
NAV |
 14
NYSE:
NAV
Continuous Growth:
2011 Monaco Vesta |
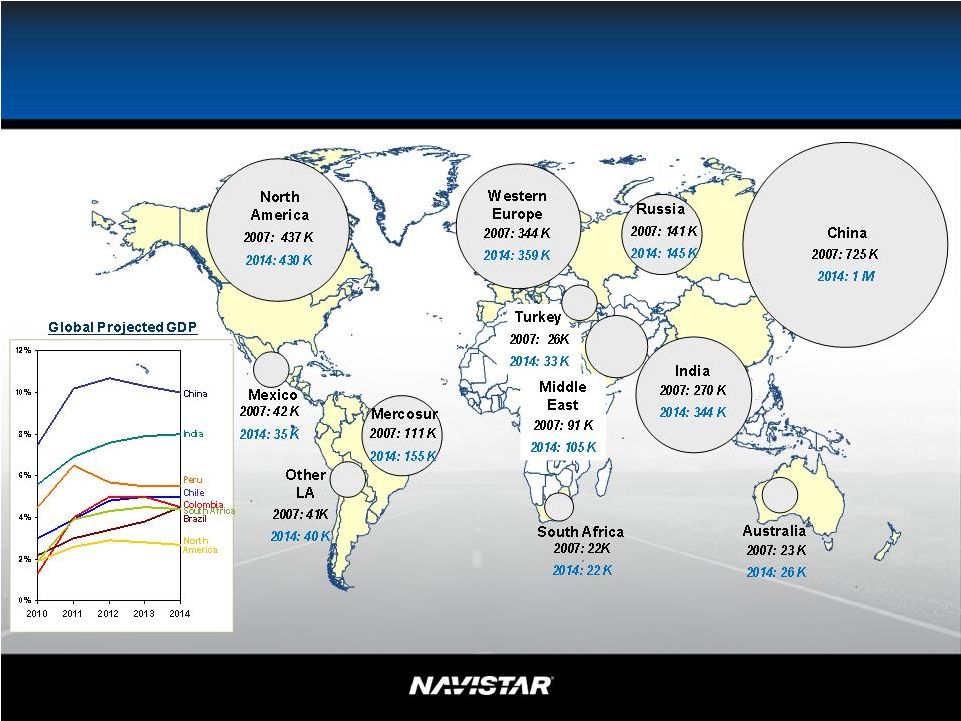 15
Continuous Growth:
2014 Global Truck Market Overview
Note: Includes Medium and Heavy Trucks >6T only Source: JD Power; Monitor
Analysis, Regional Analysis, Econometrix, ERG, and World Truck manufacturer’s Report
NYSE:
NAV
15 |
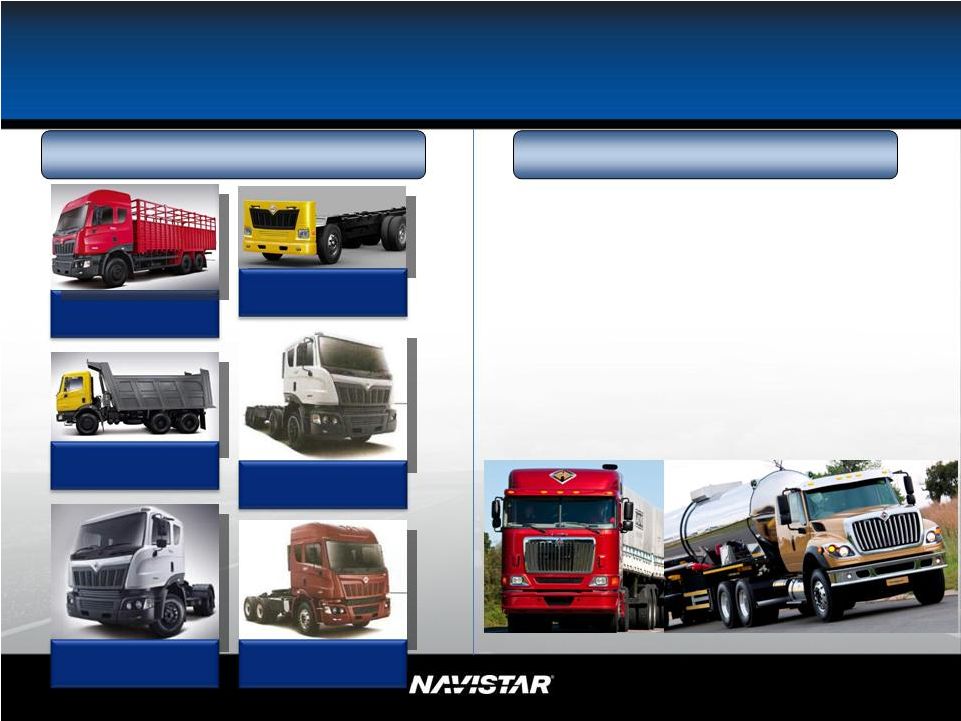 Continuous Growth:
Global Truck Market
31 T
Launch: July 2010
25 T Tipper
Launch: June 2010
40 T
Launch: July 2010
49T
Launch: Sept 2010
25 T
Launch: May 2010
25 T Cowl
Launch: June 2010
•
2010 invest in the future
•
Launch
–
Leverage our strengths
–
Select countries that have
largest opportunities: South
America, China, Australia
•
Goal –
10% segment margins
Mahindra
NC
16
2
NYSE:
NAV |
 Engineering and Product
Development
Finished
NYSE:
NAV
17 |
 18
NYSE:
NAV
100,000
200,000
300,000
400,000
500,000
1999
2000
2001
2002
2003
2004
2005
2006
2007
2008
2009
2010
Fcst
2011
Fcst
U.S.
and
Canada
Class
6
-
8
Retail
Industry
Position Us For When Market Returns:
Industry Landscape –
Investing in Our Future
R&D ($ millions)
$375
$384
$433
$0
$100
$200
$300
$400
$500
FY2007
FY2008
FY2009
Note: This
is
not
to
illustrate
updated
guidance.
Any
updated
guidance
will
be
provided
during
our
3
rd
Quarter Earnings Call.
Industry
FY99
FY00
FY01
FY02
FY03
FY04
FY 05
FY06
FY 07
FY08
FY09
School Bus
33,800
33,900
27,900
27,400
29,200
26,200
26,800
28,200
24,500
24,400
22,600
20,000
22,000
Class 6-7
-
Medium
126,000
129,600
96,000
72,700
74,900
99,200
104,600
110,400
88,500
59,600
39,800
45,000
50,000
Combined Class 8 (Heavy & Severe Service)
286,000
258,300
163,700
163,300
159,300
219,300
282,900
316,100
206,000
160,100
119,400
130,000
143,000
Total Industry Demand
445,800
421,800
287,600
263,400
263,400
344,700
414,300
454,700
319,000
244,100
181,800
195,000
215,000
FY 10
Forecast
Current 2010
Actual
United
States
and
Canadian
Class
6-8
Truck
Industry
-
Retail
Sales Volume
Historical Information |
 19
NYSE:
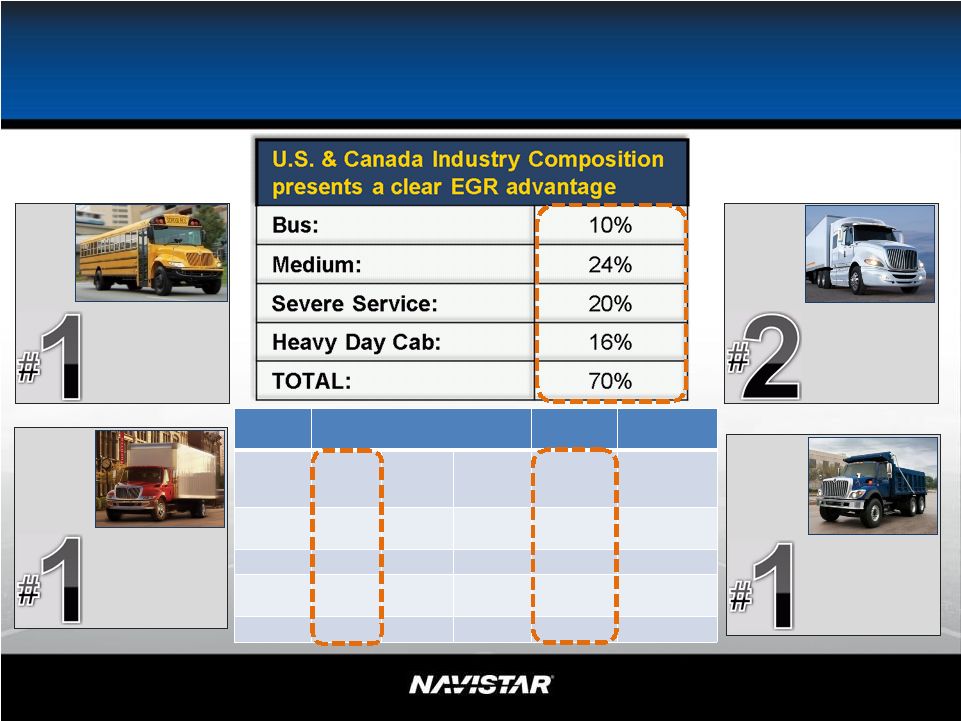
NAV
Our Emission Strategy Gives Us a
Competitive Advantage
60% Market Share
June YTD2010
School
Bus
40% Market Share
June YTD2010
35% Market Share
June YTD2010
Severe
Service
Truck**
Heavy
Truck
25% Market share
June YTD2010
Medium
Truck
*Market share based on brand
**Excludes U.S. Military deliveries
Heavy
Sleeper
–
30%
Market Share
YTD Order
Receipts
Market
Share
Full
Year
2009
2Q 2010
YTD
June
2010
YTD
June
Full Year
2010 Goal
School
Bus
61%
63%
60%
51%
60% +
Medium
35%
44%
40%
49%
40% +
Severe
Service
34%
35%
35%
40%
35% +
Heavy
25%
22%
25%
28%
25% _
*
*
*
*
*
*
*
* |
 20
NYSE:
NAV
Status -
Next Steps
•
Build and hold strategy
–
Delivering 2010 compliant products
•
15L to 13L transition
–
JB Hunt
–
Boyd Bros.
–
Heartland Express
•
Post-retirement
–
OPEB
–
Pension
•
MaxxForce
®
15L currently in
several customers’
hands
accumulating real world miles
•
Distribution channel
Status
What’s next?
•
Increase customer penetration
of 13L with Jake brake
•
15L to 13L transition
•
Post-retirement
•
Financing -
customer financing
still in progress
•
MaxxForce
®
15L –
seed
additional customers
•
Improving our already robust
distribution channel |
 21
NYSE:
NAV
SEC Regulation G –
Fiscal Year Comparison
Future
2009
*Includes net income attributable to non-controlling interests
U.S. and Canada Industry
414,500
350,000
($billions)
Sales and revenues, net
$ 15 +
$ 20 +
($millions)
Manufacturing segment profit*
$ 1,600
Below the line items
Income excluding income tax
Income tax expense
(298)
Net Income attributable to Navistar International Corporation (NIC)
Diluted earnings per share ($'s) attributable to NIC
$12.31
Weighted average shares outstanding: diluted (millions)
Original Target
@ 414.5k Industry
Revised Target
@ 350k Industry
$ 1,780
(590)
~ 72.5
$892
~ 72.5
(500)
1,100
(275)
$825
$11.46
1,190
This presentation is not in accordance with, or an alternative for, U.S. generally accepted
accounting principles (GAAP). The non-GAAP financial information presented herein should be considered
supplemental to, and not as a substitute for, or superior to, financial measures calculated in
accordance with GAAP. However, we believe that non-GAAP reporting, giving effect to the adjustments shown in
the reconciliation above, provides meaningful information and therefore we use it to supplement our
GAAP reporting by identifying items that may not be related to the core manufacturing business.
Management often uses this information to assess and measure the performance of our operating segments.
We have chosen to provide this supplemental information to investors, analysts and other
interested parties to enable them to perform additional analyses of operating results, to illustrate
the results of operations giving effect to the non-GAAP adjustments shown in the above reconciliations and to
provide an additional measure of performance. |