Attached files
| file | filename |
|---|---|
| 8-K - JOINT FORM 8-K - KANSAS CITY POWER & LIGHT CO | f8kirdeck.htm |

August 2010 Investor Presentation
Exhibit 99.1
Great Plains Energy
Investor Presentation
August 2010
Investor Presentation
August 2010

2
Jim Shay
Senior Vice President
Finance & Strategic Development
and Chief Financial Officer
Michael Cline
Vice President Investor Relations,
Treasurer and Corporate Secretary
Treasurer and Corporate Secretary
816-556-2622
michael.cline@kcpl.com
Mike Chesser
Chairman and
Chief Executive Officer
August 2010 Investor Presentation
Company Representatives

Statements made in this presentation that are not based on historical facts are forward-looking, may involve risks and uncertainties, and are intended to be as
of the date when made. Forward-looking statements include, but are not limited to, the outcome of regulatory proceedings, cost estimates of the
Comprehensive Energy Plan and other matters affecting future operations. In connection with the safe harbor provisions of the Private Securities Litigation
Reform Act of 1995, Great Plains Energy and KCP&L are providing a number of important factors that could cause actual results to differ materially from the
provided forward-looking information. These important factors include: future economic conditions in regional, national and international markets and their
effects on sales, prices and costs, including but not limited to possible further deterioration in economic conditions and the timing and extent of any economic
recovery; prices and availability of electricity in regional and national wholesale markets; market perception of the energy industry, Great Plains Energy and
KCP&L; changes in business strategy, operations or development plans; effects of current or proposed state and federal legislative and regulatory actions or
developments, including, but not limited to, deregulation, re-regulation and restructuring of the electric utility industry; decisions of regulators regarding rates
the companies can charge for electricity; adverse changes in applicable laws, regulations, rules, principles or practices governing tax, accounting and
environmental matters including, but not limited to, air and water quality; financial market conditions and performance including, but not limited to, changes
in interest rates and credit spreads and in availability and cost of capital and the effects on nuclear decommissioning trust and pension plan assets and costs;
impairments of long-lived assets or goodwill; credit ratings; inflation rates; effectiveness of risk management policies and procedures and the ability of
counterparties to satisfy their contractual commitments; impact of terrorist acts; increased competition including, but not limited to, retail choice in the
electric utility industry and the entry of new competitors; ability to carry out marketing and sales plans; weather conditions including, but not limited to,
weather-related damage and their effects on sales, prices and costs; cost, availability, quality and deliverability of fuel; ability to achieve generation goals and
the occurrence and duration of planned and unplanned generation outages; delays in the anticipated in-service dates and cost increases of additional
generating capacity and environmental projects; nuclear operations; workforce risks, including, but not limited to, increased costs of retirement, healthcare
and other benefits; the timing and amount of resulting synergy savings from the GMO acquisition; and other risks and uncertainties.
This list of factors is not all-inclusive because it is not possible to predict all factors. Other risk factors are detailed from time to time in Great Plains Energy’s
and KCP&L’s most recent quarterly report on Form 10-Q and annual report on Form 10-K filed with the Securities and Exchange Commission. Each forward-
looking statement speaks only as of the date of the particular statement. Great Plains Energy and KCP&L undertake no obligation to publicly update or revise
any forward-looking statement, whether as a result of new information, future events or otherwise.
August 2010 Investor Presentation
Forward Looking Statement
4
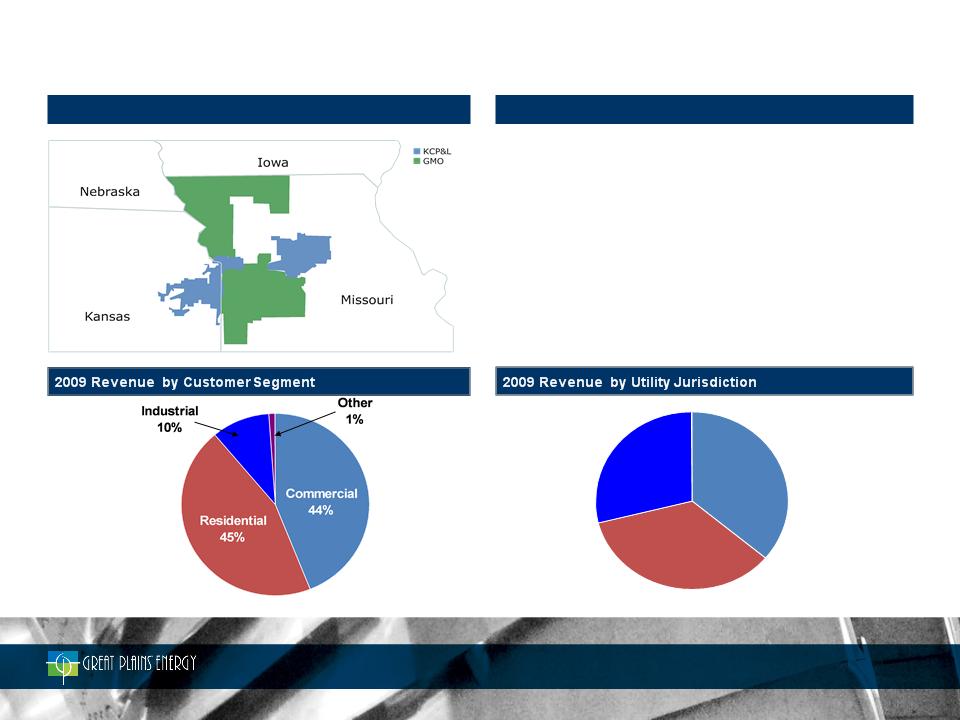
Service Territories: KCP&L and GMO
Business Highlights
• Solid Midwest electric utility - KCP&L brand
• Transformational events in 2008 to focus business model on fully regulated
utility operations
utility operations
– Sale of Strategic Energy
– Acquisition of Aquila
• Company attributes post-acquisition
• ~822,000 customers / 3,200+ employees
• ~6,000 MW of primarily low-cost baseload generation
• 5-year projected synergies of ~$740 million
• ~$8.5bn in assets and $4.4bn in rate base at 2009YE
Total: ~ $2.0bn
Total: ~ $2.0bn
Kansas
29%
Missouri
(KCP&L)
36%
Missouri
(GMO)
35%
August 2010 Investor Presentation
Solid Vertically Integrated Midwest Utility
5
• Strong Midwest electric utilities focused on regulated operations in Missouri and Kansas
• Diversified customer base includes ~822,000 residential, commercial, and industrial customers
• ~6,000 Megawatts of generation capacity
• Low-cost generation mix: 80% coal, 17% nuclear (Wolf Creek), 2% natural gas/oil and 1% wind in 2009
100% Regulated
Electric Utility
Operations Focus
• Growth and stability in earnings driven by sizable regulated investments as part of the Comprehensive Energy Plan
(“CEP”)
(“CEP”)
• Wind and environmental retrofit components of CEP in place; Iatan 2 baseload coal plant targeted for
completion later this year
completion later this year
• Anticipated growth beyond 2010 driven by additional environmental capex, transmission opportunities and wind
Attractive Platform for
Long-Term Earnings
Growth
Long-Term Earnings
Growth
• Successful outcomes in 2006, 2007 and 2008 rate cases in Missouri and Kansas
• Combined annual rate increases from 2008 cases of $59mm in Kansas and $159mm in Missouri; new rates
effective August 1st in Kansas and September 1st in Missouri
• $55mm rate increase for KCP&L Kansas filed in 12/09; $190 million rate increase for KCP&L MO and GMO filed 6/10
Focused Regulatory
Approach
Approach
• Cash flow and earnings heavily driven by regulated operations and cost recovery mechanisms
• Ample liquidity currently available under $1.25bn credit facilities
• Sustainable dividend and pay-out, right-sized to fund growth and to preserve liquidity
• Recent shift in outlook from Negative to Stable at Moody’s and S&P
Stable and Improving
Financial Position
Financial Position
August 2010 Investor Presentation
Strong Platform for Long-Term Growth
6
Executing the Plan
August 2010 Investor Presentation

7
|
|
Project description
|
Comments
|
|
• 100 MW plant in Spearville, KS
• Began construction in 2005
|
ü Completed in Q3 2006
ü In rate base from 1/1/2007
ü No regulatory disallowance
|
|
|
• Selective Catalytic Reduction (SCR) unit at LaCygne 1
|
ü Completed in Q2 2007
ü In rate base from 1/1/2008
ü No regulatory disallowance
|
|
|
• Air Quality Control System at Iatan 1
|
ü Completed in Q2 2009
ü In rate base starting 3Q 2009 (KS 08/1 & MO 9/1)
ü No regulatory disallowance in 2009 MO and KS cases; capped
exposure in 2010 cases |
|
|
• Construction of Iatan 2 super-critical coal plant (850 MW; 73%
GXP ownership share)1 |
ü On track for completion Q4 2010
ü Expected in Kansas rates in 4Q 2010; Missouri rates in Q2 2011
|
Iatan 2
Iatan 1
Environmental
LaCygne
Environmental
Wind
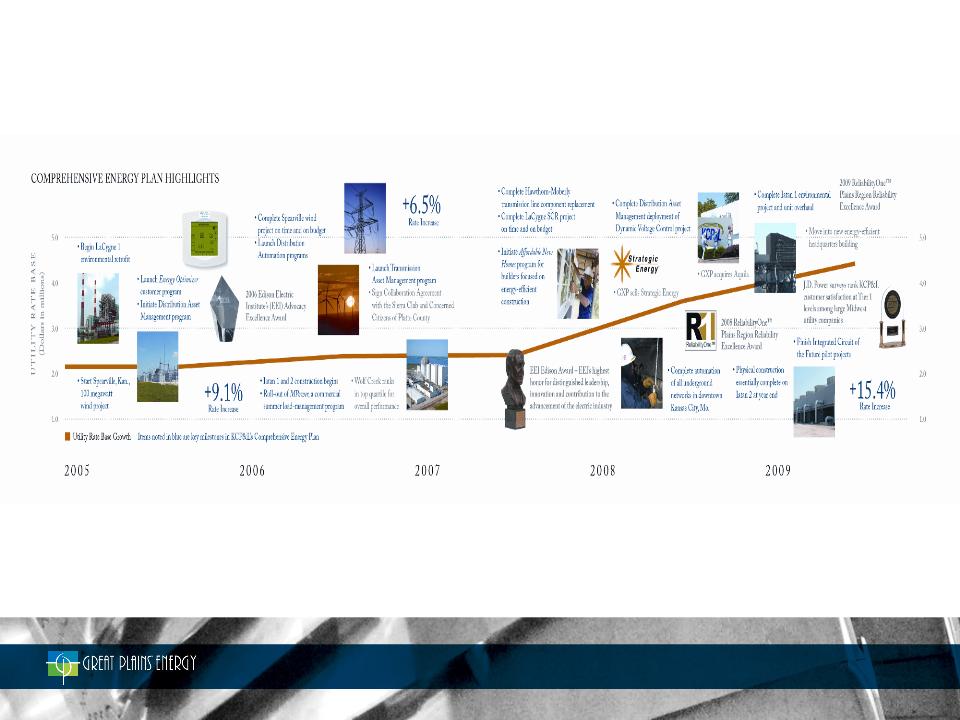
Great Plains Energy has effectively executed all elements of its Comprehensive Energy Plan to date and has
received constructive regulatory treatment
received constructive regulatory treatment
Comprehensive Energy Plan
1 Includes post-combustion environmental technologies including an SCR system, wet flue gas desulphurization system and fabric filter to control emissions
August 2010 Investor Presentation
Strong Track Record of Execution

8
|
Rate Case Outcomes
|
||||||
|
Rate Jurisdiction
|
Amount
Requested |
Amount
Approved |
Effective Date
|
Rate Base
|
Return on Equity
|
Rate-making
Equity Ratio |
|
KCP&L - Missouri
|
$55.8
|
$50.6
|
1/1/2007
|
$1,270
|
11.25%
|
53.69%
|
|
KCP&L - Missouri
|
$45.4
|
$35.3
|
1/1/2008
|
$1,298
|
10.75%
|
57.62%
|
|
KCP&L - Missouri
|
$101.5
|
$95.0
|
9/1/2009
|
$1,4961
|
n/a4
|
46.63%
|
|
KCP&L - Kansas
|
$42.3
|
$29.0
|
1/1/2007
|
$1,0001
|
n/a2
|
n/a
|
|
KCP&L - Kansas
|
$47.1
|
$28.0
|
1/1/2008
|
$1,1001
|
n/a3
|
n/a
|
|
KCP&L - Kansas
|
$71.6
|
$59.0
|
8/1/2009
|
$1,2701
|
n/a4
|
50.75%
|
|
GMO - MPS
|
$94.5
|
$45.2
|
6/1/2007
|
$918
|
10.25%
|
48.17%
|
|
GMO - MPS
|
$66.0
|
$48.0
|
9/1/2009
|
$1,1881
|
n/a5
|
45.95%
|
|
GMO - L&P
|
$24.4
|
$13.6
|
6/1/2007
|
$186
|
10.25%
|
48.17%
|
|
GMO - L&P
|
$17.1
|
$15.0
|
9/1/2009
|
$2861
|
n/a5
|
45.95%
|
1 Rate Base amounts are approximate amounts since the cases were black box settlements
2 Iatan 2 AFUDC calculation was set at 8.5%
3 Iatan 2 AFUDC calculation was set at 8.3%
4 Iatan 2 AFUDC calculation was set at 8.25%
5 Iatan 2 AFUDC calculation was set at 10.2%
August 2010 Investor Presentation
Focused Regulatory Approach

9
August 2010 Investor Presentation
2Q Operational and Financial Highlights
• Solid Financial Results
– Weather a key factor, weather-normalized demand growth mixed across customer segments
• Steady Progress on Iatan 2 Start-up
– On target for 4Q10 in-service date
• Rate Cases
– MO cases filed; ~$245 million of requested annual rate relief now pending in MO and KS
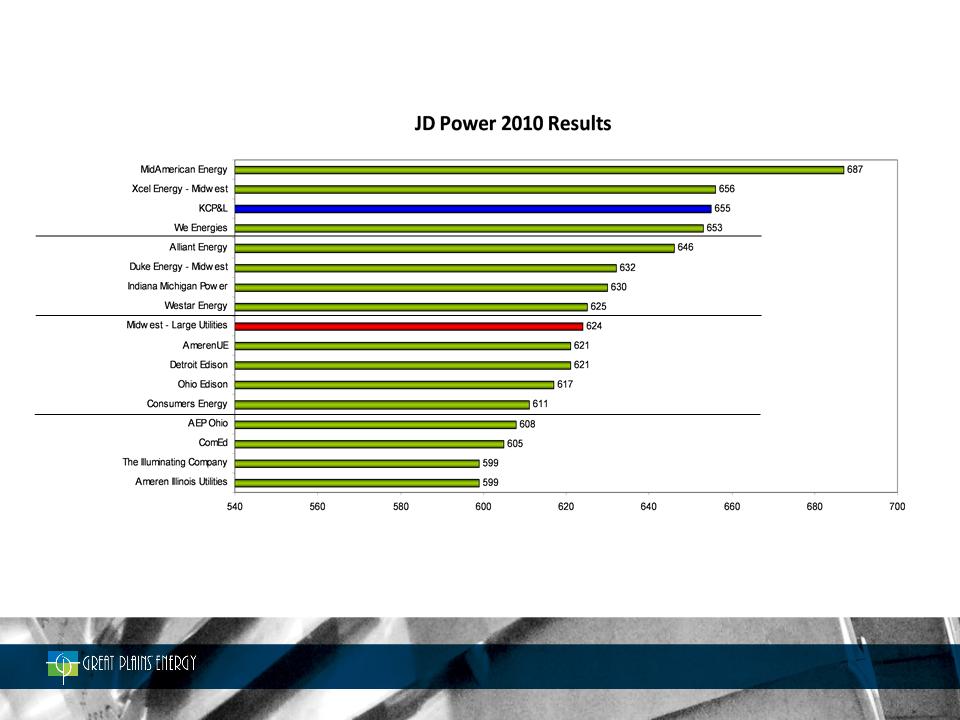
• Outstanding Customer Service
– Tier 1 in JD Power residential survey
• Environmental Outlook
– Climate bill unlikely in 2010; uncertainty remains
• Transmission Update
– Received Notice To Construct from SPP for new 345 kV line; intend to accept

10
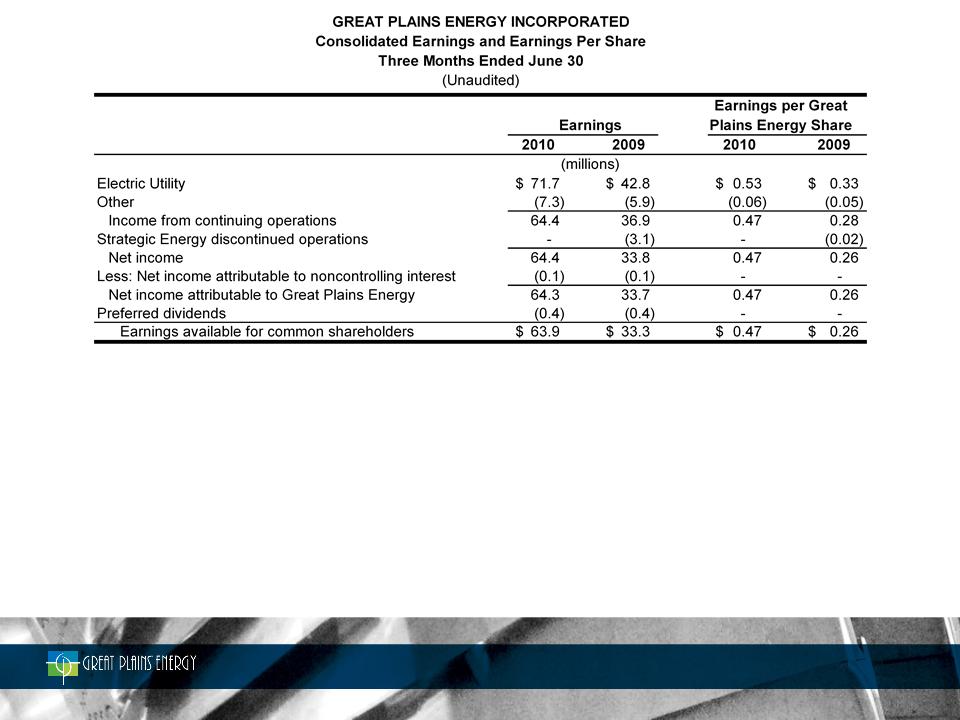
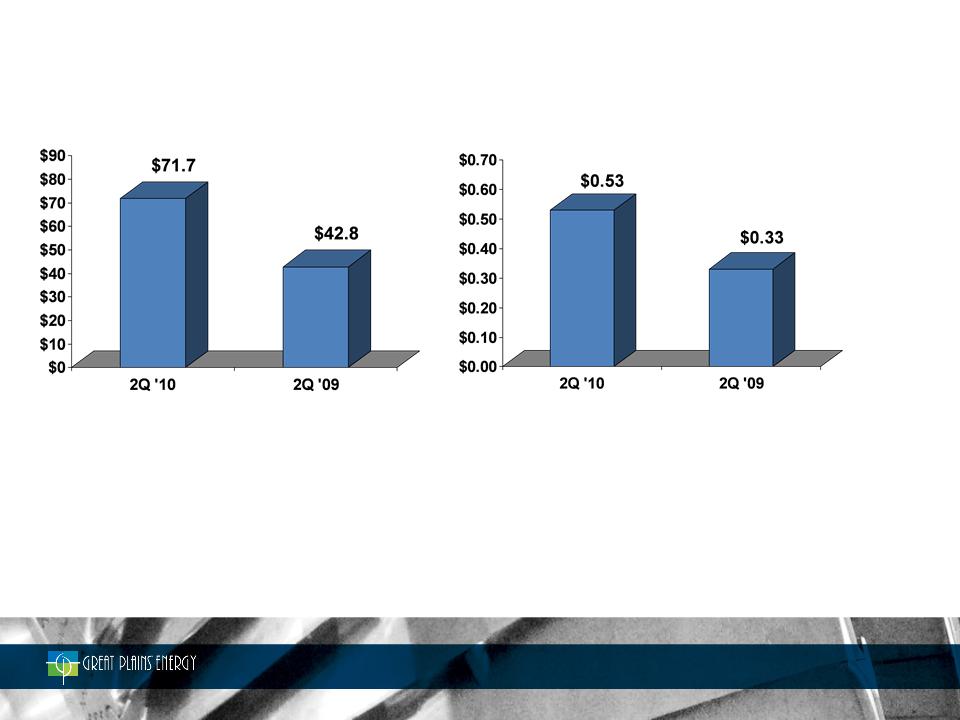
Electric Utility’s net income increased $28.9 million primarily driven by a $64.0 million increase in gross margin*
due to new retail rates and favorable impacts from weather
due to new retail rates and favorable impacts from weather
Increased number of shares outstanding primarily from the May 2009 equity offering resulted in dilution of
$0.03 per share
$0.03 per share
*Gross margin is defined and reconciled to operating revenues at the end of the presentation
August 2010 Investor Presentation

11
Electric Utility Second Quarter
(millions except
where indicated)
Key Earnings Drivers:
+ Increased gross margin of $64.0 million primarily due to new retail rates which took effect in the third
quarter of 2009; weather also a factor
quarter of 2009; weather also a factor
– Increased operating expense of $14.8 million primarily driven by planned plant outages and general taxes;
and
and
– Increased depreciation and amortization of $7.6 million; including $7 million of additional amortization
pursuant to KCP&L’s 2009 rate cases
pursuant to KCP&L’s 2009 rate cases
Earnings
Earnings Per Share
August 2010 Investor Presentation
12
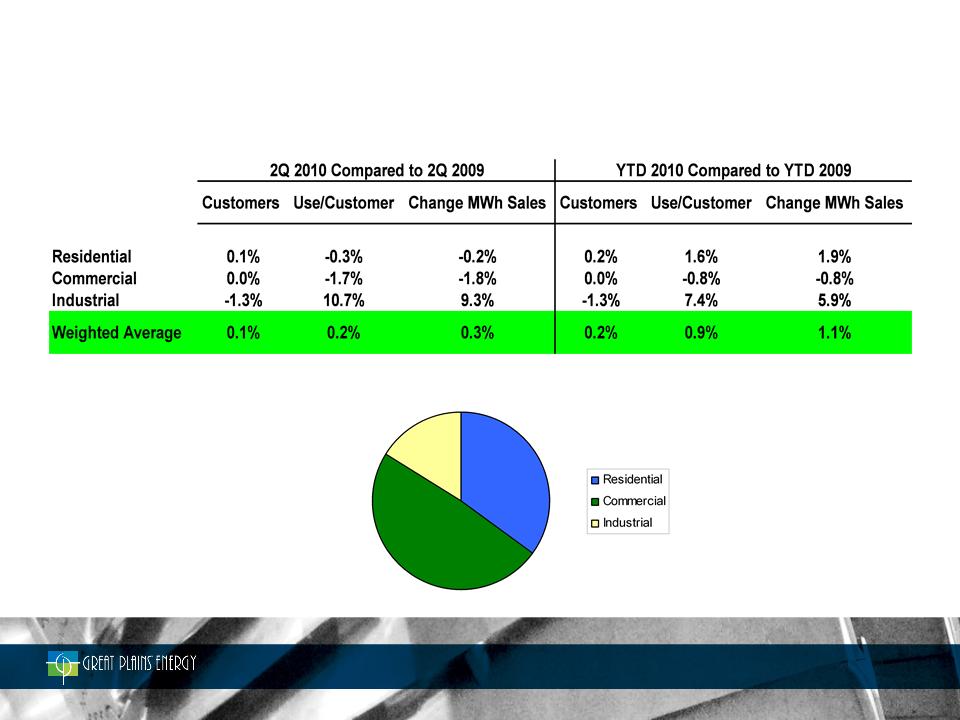
Electric Utility Segment
Weather Normalized Retail MWh Sales and Customer Growth Rates
Retail MWh Sales by Customer Class - Second Quarter 2010
35%
16%
49%
August 2010 Investor Presentation
13
August 2010 Investor Presentation
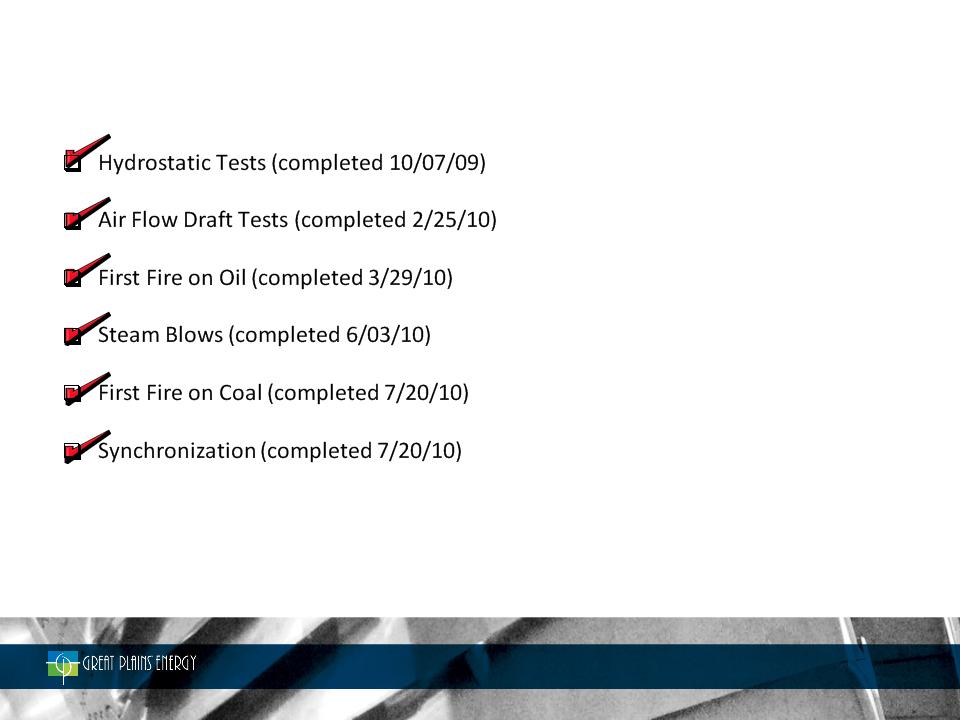
Steps to In-Service Date for Iatan 2
q Provisional Acceptance
14
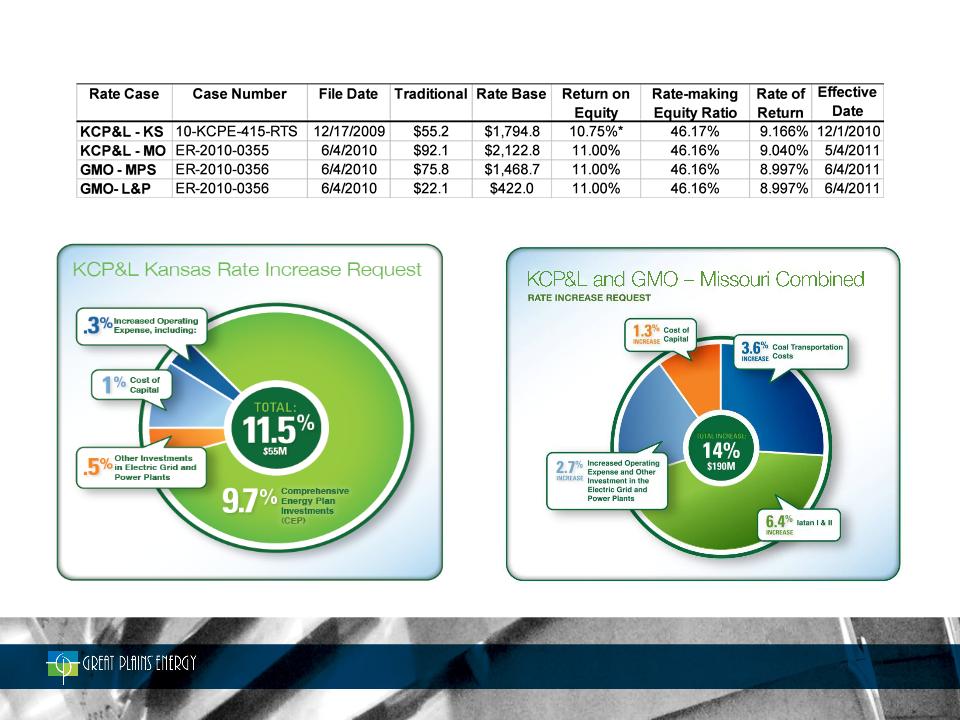
* As filed in Rebuttal Testimony; reduced from 11.25% in initial filing. Company requested 0.25% adder (to 11.00% ROE) if rate design proposal by KCC
Staff / CURB is adopted
Staff / CURB is adopted
August 2010 Investor Presentation
2010 Rate Case Summary
15
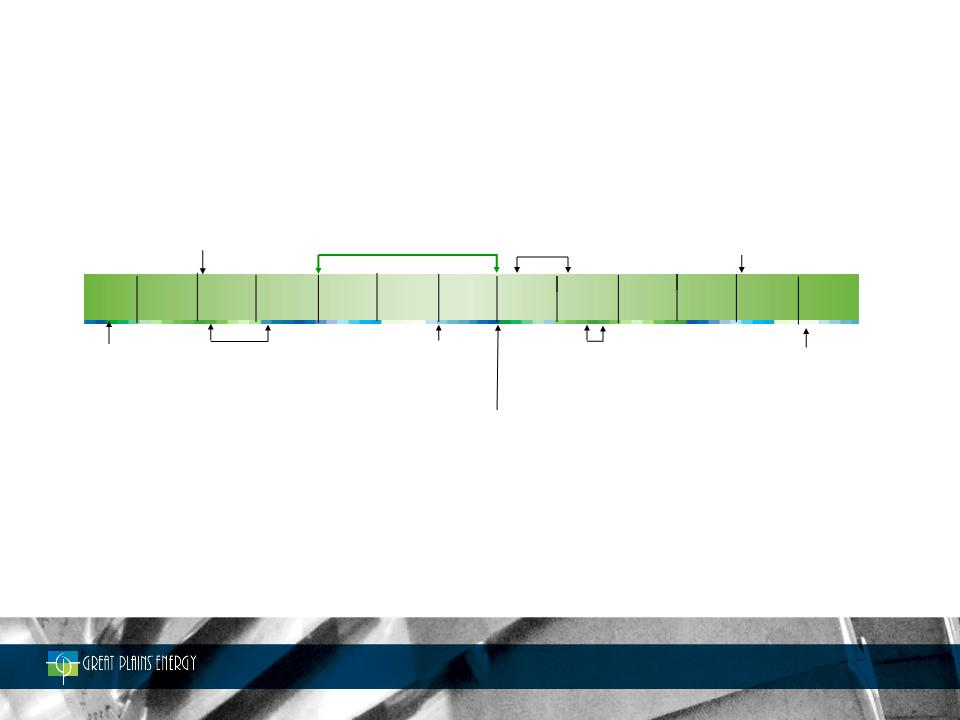
Filed MO
Rate Cases
06/4/10
In-service Testing
Started 8/1/10
Started 8/1/10
New Tariffs
Effective
KCP&L MO
5/4/11
Projected
Provisional
Acceptance
Fourth Quarter
KCP&L KS
Hearings
8/16/10 - 9/3/10
KCP&L MO
Hearings
Hearings
1/18/11- 2/4/11
JUN
Anticipated
New KS Tariffs
12/1/10
August 2010 Investor Presentation
New Tariffs
Effective GMO
6/4/11
JULY
AUG
SEPT
OCT
NOV
DEC
JAN
MAR
FEB
MAY
APR
JUN
MO True-up
Date for Both
KCP&L MO
and GMO
12/31/10
GMO Hearings
2/14/11- 2/18/11
Note: The Missouri procedural schedule has been agreed to by the parties to the cases, but has not yet been approved by the Missouri Public Service
Commission. It is expected that a Commission order approving the schedule will be issued in the next few weeks.
Commission. It is expected that a Commission order approving the schedule will be issued in the next few weeks.
Rate Case Timeline
16
Strength at the Core
Tier 1
1st Quartile
Tier 2
2nd Quartile
Tier 3
3rd Quartile
Tier 4
4th Quartile
Source: 2010 JD Power Residential Study Results (3Q09 to 2Q10)
August 2010 Investor Presentation
17
Drivers of Change
Environmental
Rules
Natural Gas
Prices
Load Growth
Energy
Legislation
Financing
Emergent
Technologies
August 2010 Investor Presentation

18
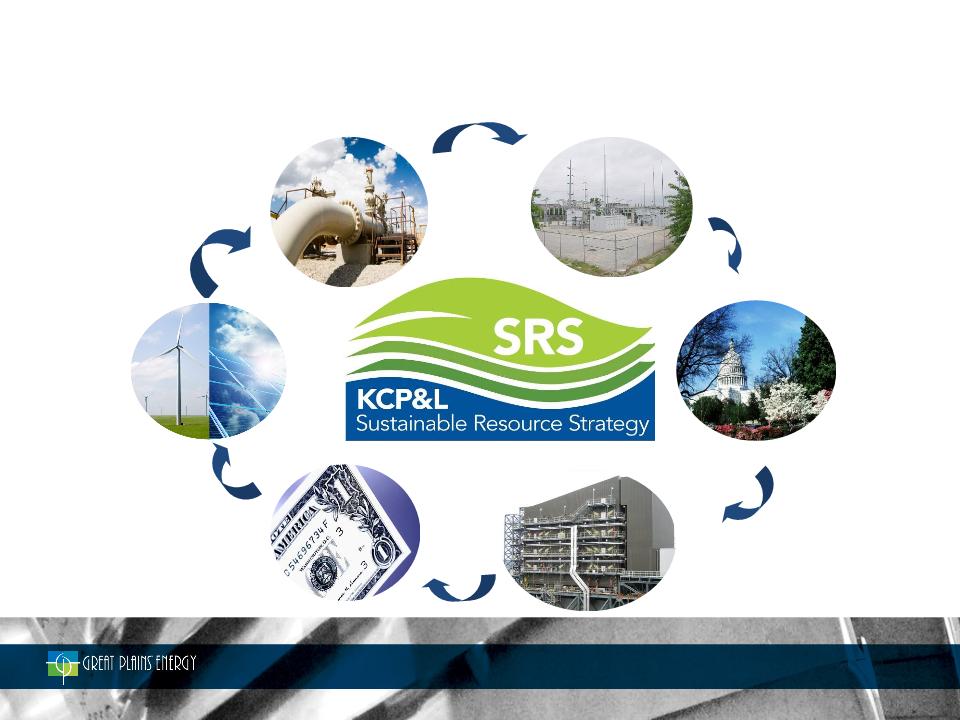
Sustainable Resource Strategy
Change Creates Opportunity
Change Creates Opportunity
Transmission &
Distribution
Opportunities
Distribution
Opportunities
Opportunities
Resulting from
SmartGrid
Technologies
Resulting from
SmartGrid
Technologies
Generation Fleet
Optimization
Opportunities
Optimization
Opportunities
August 2010 Investor Presentation
19
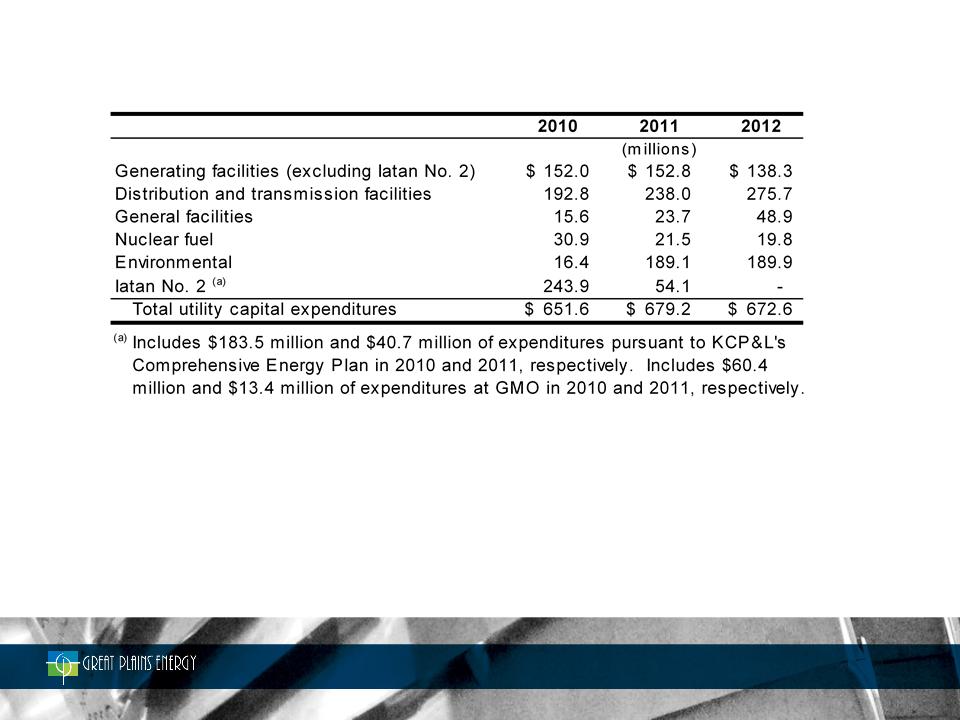
2010 - 2012 Capital Expenditures
The majority of our expected environmental spend is related to our LaCygne units for a scrubber and baghouse on Unit 1
(already has an SCR, installed in 2007), as well as an SCR, scrubber, baghouse, and low NOx burners for Unit 2.
(already has an SCR, installed in 2007), as well as an SCR, scrubber, baghouse, and low NOx burners for Unit 2.
We continue to monitor and evaluate the impact of potential environmental mandates on our other generating facilities,
but have not included any potential costs in our capital expenditures table at this time.
but have not included any potential costs in our capital expenditures table at this time.
No capital for wind is included in the 2010 to 2012 period. Our current view over the next three years
is that any wind projects would be completed as purchase power agreements, or “PPAs”.
August 2010 Investor Presentation

20
Positioned for Long-term Earnings Growth
• Complete Iatan 2
• Navigate rate case process with constructive outcomes
• Continue to deliver on GMO synergies and movement toward Tier 1
costs across the organization
costs across the organization
• Evaluate future opportunities through Sustainable Resource Strategy
and continue to advocate on behalf of our shareholders, customers,
and communities
and continue to advocate on behalf of our shareholders, customers,
and communities
August 2010 Investor Presentation

21
Appendix
2Q 2010
Financial Overview
August 2010 Investor Presentation
22
Electric Utility’s net income increased $28.9 million primarily driven by a $64.0 million increase in gross margin*
due to new retail rates and favorable impacts from weather
due to new retail rates and favorable impacts from weather
Increased number of shares outstanding primarily from the May 2009 equity offering resulted in dilution of
$0.03 per share
$0.03 per share
*Gross margin is defined and reconciled to operating revenues at the end of the presentation
August 2010 Investor Presentation
23
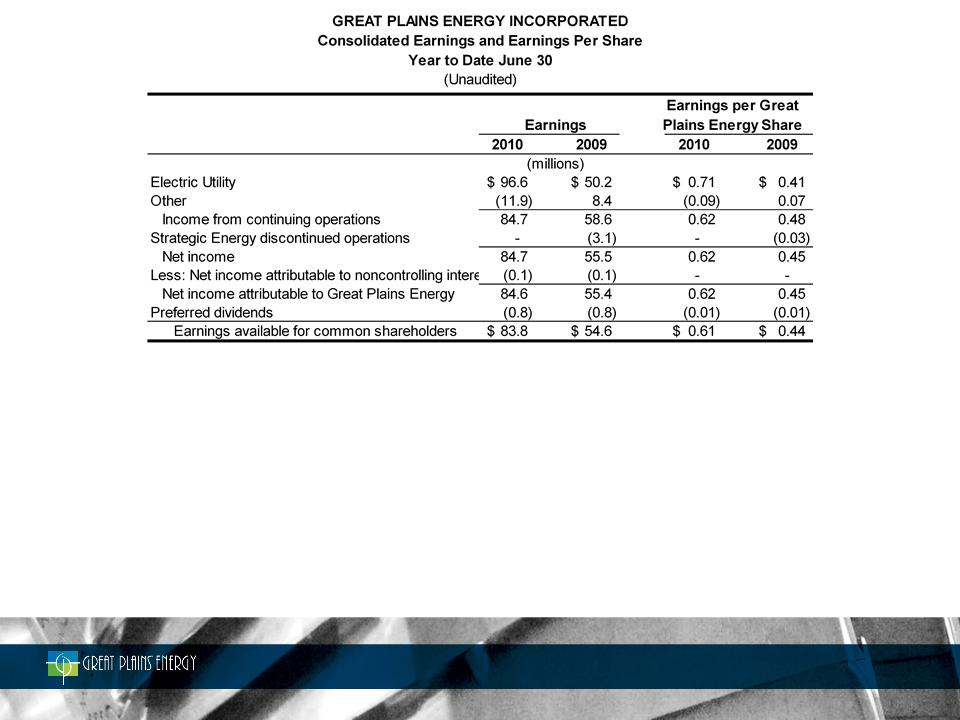
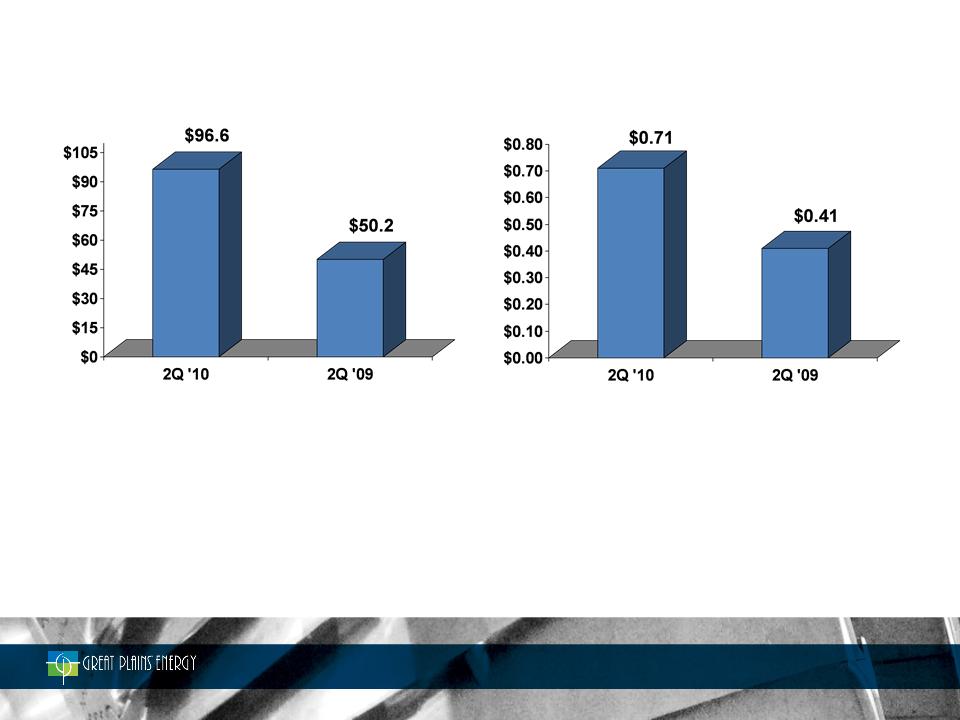
Electric Utility’s net income increased $46.4 million primarily driven by a $129.6 million increase in gross margin* due to
new retail rates, favorable impacts from weather and improved weather-normalized retail demand
new retail rates, favorable impacts from weather and improved weather-normalized retail demand
Other segment earnings decreased $20.3 million primarily as a result of increased interest from the Equity Units issued in
2009 and a $16 million benefit in 2009 related to the settlement of GMO’s 2003 - 2004 federal tax audit
2009 and a $16 million benefit in 2009 related to the settlement of GMO’s 2003 - 2004 federal tax audit
Increased number of shares outstanding primarily from the May 2009 equity offering resulted in dilution of $0.07 per
share
share
*Gross margin is defined and reconciled to operating revenues at the end of the presentation
August 2010 Investor Presentation
24
Electric Utility Second Quarter
(millions except
where indicated)
Key Earnings Drivers:
+ Increased gross margin of $64.0 million primarily due to new retail rates which took effect in the third
quarter of 2009; weather also a factor
quarter of 2009; weather also a factor
– Increased operating expense of $14.8 million primarily driven by planned plant outages and general taxes;
and
and
– Increased depreciation and amortization of $7.6 million; including $7 million of additional amortization
pursuant to KCP&L’s 2009 rate cases
pursuant to KCP&L’s 2009 rate cases
Earnings
Earnings Per Share
August 2010 Investor Presentation
25
Key Earnings Drivers:
+ Increased gross margin of $129.6 million primarily due to new retail rates, favorable weather and improved
weather-normalized retail demand
weather-normalized retail demand
– Increased operating expense of $28.6 million primarily due to planned plant outages and general taxes; and
– Increased depreciation and amortization of $20.8 million; including $14 million of additional amortization
pursuant to KCP&L’s 2009 rate cases
pursuant to KCP&L’s 2009 rate cases
Earnings
Earnings Per Share
(millions except
where indicated)
August 2010 Investor Presentation
Electric Utility Year-to-Date

26
Electric Utility Segment
Weather Normalized Retail MWh Sales and Customer Growth Rates
Retail MWh Sales by Customer Class - Second Quarter 2010
35%
16%
49%
August 2010 Investor Presentation
27
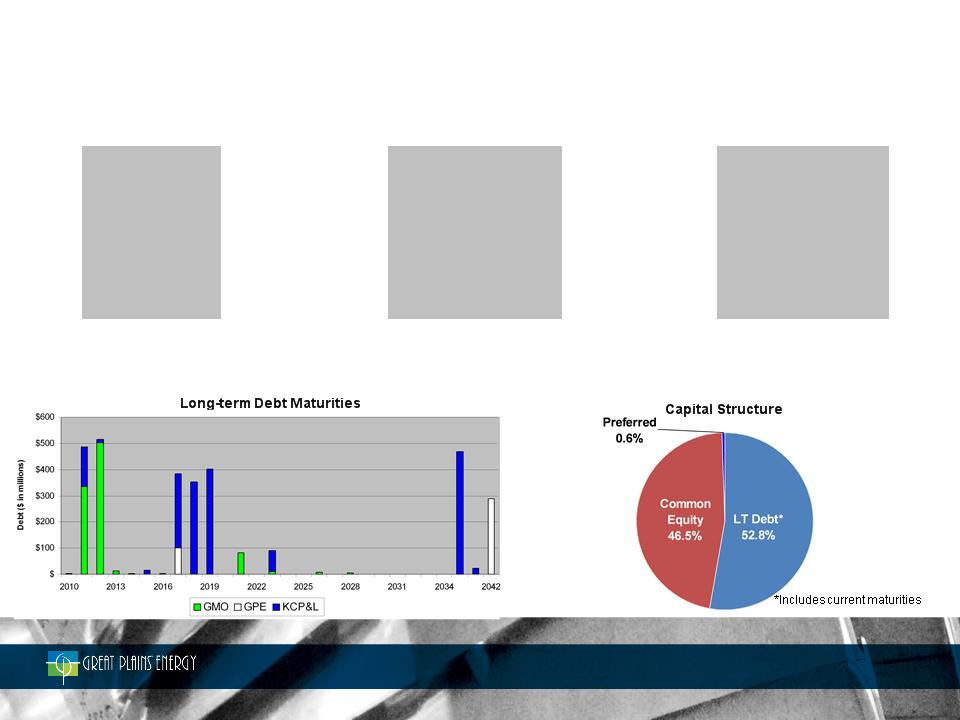
Debt and Capital Structure
as of June 30, 2010
as of June 30, 2010
Great Plains Energy Debt ($ in millions)
|
|
|
|
|
|||||
|
|
KCP&L
|
GMO (1)
|
GPE
|
Consolidated
|
||||
|
|
Amount
|
Rate (2)
|
Amount
|
Rate (2)
|
Amount
|
Rate (2)
|
Amount
|
Rate (2)
|
|
Short-term Debt
|
$392.0 |
0.73%
|
$267.0
|
1.88%
|
$24.0
|
0.95%
|
$683.0
|
1.18%
|
|
Long-term Debt(3)
|
$1,780.2
|
6.15%
|
1028.7
|
9.88%
|
$387.1
|
10.68%
|
$3,196.0
|
7.85%
|
|
Total
|
$2,172.2
|
5.17%
|
$1,295.7
|
8.14%
|
$411.1
|
10.11%
|
$3,879.0
|
6.66%
|
Secured debt = $862.7 (22%), Unsecured debt = $3016.3 (78%)
(1) GPE guarantees substantially all of GMO’s debt
(2) Weighted Average Rates - excludes premium/discounts and fair market value adjustments; includes full equity units coupon (12%)
(3) Includes current maturities of long-term debt
August 2010 Investor Presentation

28
August 2010 Investor Presentation
2010 EPS Guidance
• Increased to $1.30 - $1.50 from $1.20 - $1.40
• Increase reflects estimated YTD weather impact vs. normal
• Guidance assumes no regulatory disallowance

29
Rate Case True-up and Effective Date Implications
• Full-year impact from new KS rates (expected to be effective early December 2010)
• True-up date in MO rate cases at end of 2010; new rates expected to be effective early May 2011
(KCP&L) / early June 2011 (GMO)
(KCP&L) / early June 2011 (GMO)
• Regulatory lag from new KCP&L rail contract for KCP&L in Missouri (no FAC)
Construction Accounting - Missouri
• AFUDC on CWIP related to Iatan 2 continues until effective date of new rates in MO
– AFUDC expected to be significantly lower following effectiveness of new rates
• Depreciation begins when new rates are effective and will reflect lower rate base from additional
amortization granted during the CEP to maintain credit metrics
amortization granted during the CEP to maintain credit metrics
• Iatan-related O&M and property taxes capitalized until effectiveness of new rates
Interest Expense
• Interest expense impacted by lower AFUDC and new long-term debt anticipated in 2010 and 2011
August 2010 Investor Presentation
Considerations for 2011
30
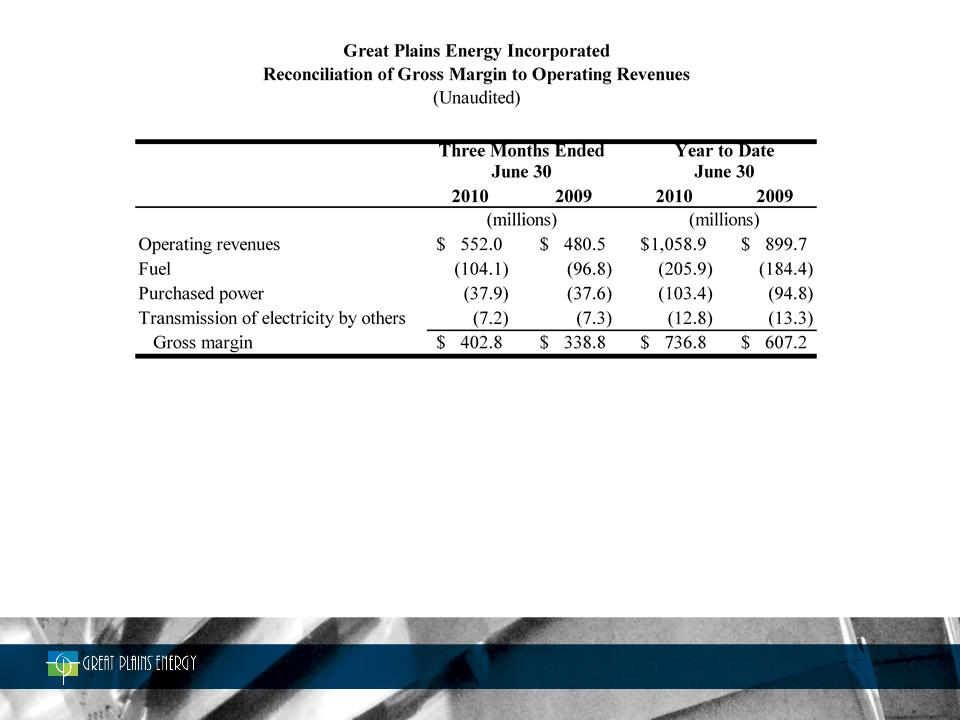
Gross margin is a financial measure that is not calculated in accordance with generally accepted accounting principles (GAAP). Gross
margin, as used by Great Plains Energy, is defined as operating revenues less fuel, purchased power and transmission of electricity by
others. The Company’s expense for fuel, purchased power and transmission of electricity by others, offset by wholesale sales margin, is
subject to recovery through cost adjustment mechanisms, except for KCP&L’s Missouri retail operations. As a result, operating revenues
increase or decrease in relation to a significant portion of these expenses. Management believes that gross margin provides a more
meaningful basis for evaluating the Electric Utility segment’s operations across periods than operating revenues because gross margin
excludes the revenue effect of fluctuations in these expenses. Gross margin is used internally to measure performance against budget and
in reports for management and the Board of Directors. The Company’s definition of gross margin may differ from similar terms used by
other companies. A reconciliation to GAAP operating revenues is provided in the table above.
August 2010 Investor Presentation

31
Great Plains Energy
August 2010 Investor Presentation