Attached files
| file | filename |
|---|---|
| 8-K - FORM 8-K 080510 - CPG INTERNATIONAL INC. | form8-k_080510.htm |
| EX-99.1 - EXHIBIT 99.1 PRESS RELEASE - CPG INTERNATIONAL INC. | exhibit_99-1.htm |

2010
Second Quarter Earnings Call
August
6, 2010
Exhibit
99.2

2
Safe
Harbor Statement and Use of Non-GAAP and Pro Forma Information
FORWARD
LOOKING STATEMENTS
This
presentation contains forward-looking statements within the meaning of the
Private Securities Litigation Reform Act of 1995. Statements made in
this
presentation that relate to future events or the Company’s expectations, guidance, projections, estimates, intentions, goals, targets and strategies are forward-
looking statements. You are cautioned that all forward-looking statements are based upon current expectations and estimates and the Company assumes no
obligation to update this information. Because actual results may differ materially from those expressed or implied by the forward-looking statements, the
Company cautions you not to place undue reliance on these statements. For a detailed discussion of the important factors that affect the Company and that
could cause actual results to differ from those expressed or implied by the Company’s forward-looking statements, please see “Management’s Discussion and
Analysis of Financial Condition and Results of Operations” and “Risk Factors” in the Company’s current and future Annual Reports on Form 10-K and Quarterly
Reports on Form 10-Q.
ADJUSTED
EBITDA STATEMENT
We refer
to the term “Adjusted EBITDA” in various places throughout this
presentation. Adjusted
EBITDA, or earnings (adjusted as described below) before
interest, taxes, depreciation and amortization calculated on a pro forma basis as provided herein, is a material component of the significant covenants
contained in our credit agreements and the indenture governing the notes and accordingly, is important to the Company’s liquidity and ability to borrow under
its debt instruments. Adjusted EBITDA is calculated similarly under both the credit agreements and the indenture by adding consolidated net income, income
taxes, interest expense, depreciation and amortization and other non-cash expenses, income or loss attributable to discontinued operations, amounts payable
pursuant to the management agreement with AEA Investors and the impairment charge for goodwill and other intangibles. In addition, consolidated net income
is adjusted to exclude certain items, including certain nonrecurring or unusual charges. Please see the Company’s December 31, 2009 10-K, which contains a
detailed description of our covenants and a thorough description of our use of Adjusted EBITDA, and the use of Adjusted EBITDA in connection with certain
calculations under the covenants, under our credit agreements and indenture.
While
the determination of appropriate adjustments in the calculation of Adjusted
EBITDA is subject to interpretation under our debt agreements,
management
believes the adjustments are in accordance with the covenants in our credit agreements and indenture, as discussed above. Adjusted EBITDA should not be
considered in isolation or construed as an alternative to our net income or other measures as determined in accordance with GAAP. In addition, other
companies in our industry or across different industries may calculate Adjusted EBITDA differently than we do, limiting its usefulness as a comparative
measure. In future SEC filings, we may be required to change our presentation of Adjusted EBITDA in order to comply with the SEC’s rules regarding the use
of non-GAAP financial measures. In addition, you are cautioned not to place undue reliance on Adjusted EBITDA. For a reconciliation of Adjusted EBITDA to
net income, please see the Appendix to this presentation.

3
About
CPG International
Headquartered in
Scranton, Pennsylvania, CPG International is a leading supplier of premium,
low-maintenance building products designed to
replace wood, metal and other materials in the residential, commercial and industrial markets. With a focus on manufacturing excellence,
proprietary technologies and quality, CPG has introduced products through distribution networks to sizable markets increasingly converting to low
maintenance materials. The Company has developed and acquired a number of branded products including AZEK® Trim, AZEK® Deck, AZEK®
Moulding, AZEK® Rail, AZEK® Porch, Comtec and Hiny Hiders® bathroom partition systems, and TuffTec™ locker systems. For additional
information on CPG please visit our web site at http:// www.cpgint.com.
Please
note:
To
access the conference call, please dial (866) 863-6818, and use conference ID
code 80981126. An
encore presentation will be available for
one week after the completion of the call. In order to access the encore presentation, please dial (800) 642-1687 or (706) 645-9291, and use the
conference ID code 80981126.
one week after the completion of the call. In order to access the encore presentation, please dial (800) 642-1687 or (706) 645-9291, and use the
conference ID code 80981126.

4
2010
Second Quarter Financial Highlights
• Market
Conditions: Stabilizing
residential and industrial construction markets
Commercial
markets continue to decline versus prior year
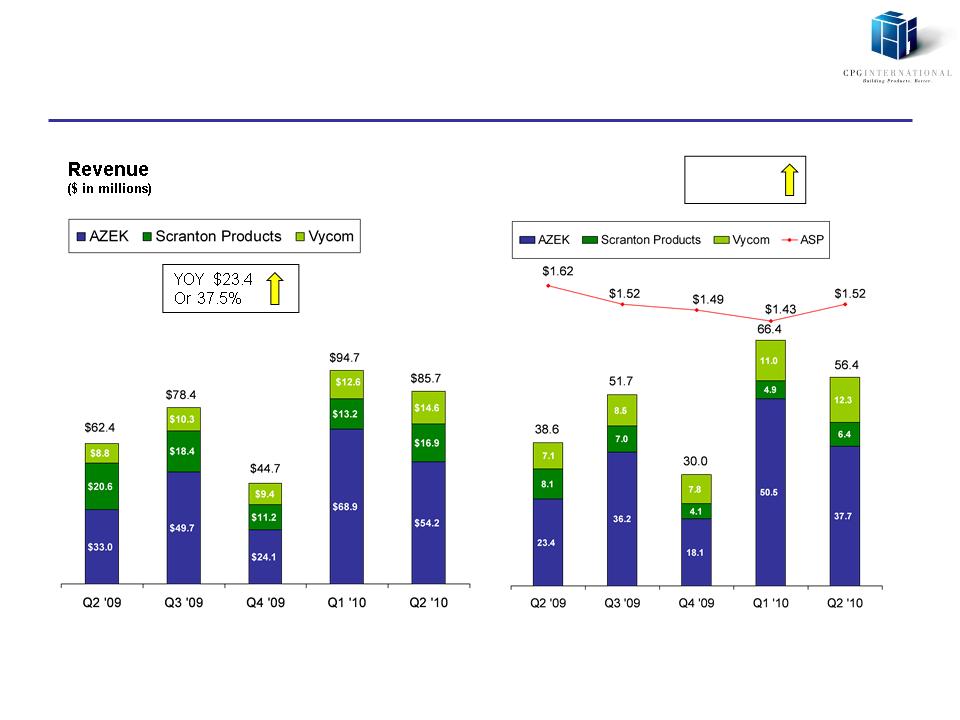
• Revenue: $85.7mm
Q2 2010 vs. $62.4mm in Q2 2009, up 37.5%
– AZEK Deck, AZEK
Trim, AZEK Rail and Vycom growth
offset decline in commercial market
offset decline in commercial market
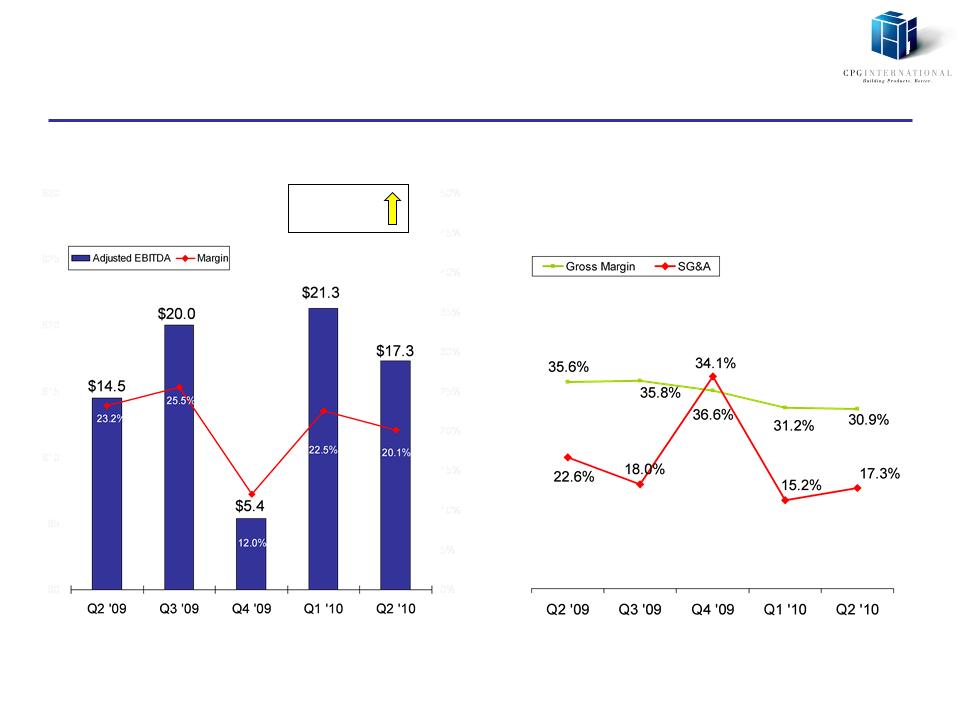
• Gross
Margin: 30.9%
Q2 2010 vs. 35.6% in Q2 2009
– Material cost
increases versus 2009 impacting gross
margin
margin
• SG&A: $14.9mm
Q2 2010 vs. $14.1mm in Q2 2009
– Increased
marketing and selling expenses
• Adjusted
EBITDA: Up
19.2% to $17.3mm
– 20.1% Adjusted
EBITDA margin
• Net
Income/Loss: $2.8mm
net income in Q2 2010, compared to $0.1mm
in Q2 2009
in Q2 2009
Quarter
Highlights
5
Quarterly
Revenue
Financial
Overview
Volume
& ASP
(lbs
in millions)
YOY
17.8
Or
46.1%
6
Quarterly
Earnings
Financial
Overview
Adjusted
EBITDA
($
in millions)
Gross
Margin and SG&A
(%
of revenue)
YOY
$2.8
or
19.2%
7
7
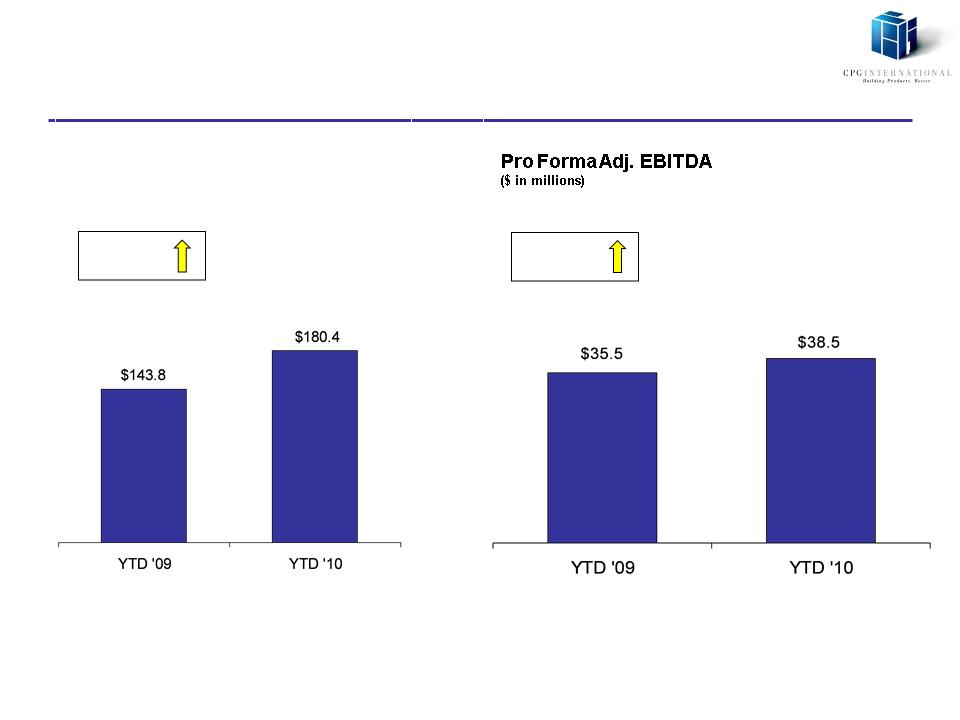
Year to
Date Performance
Financial
Overview
Revenue
/ Pro Forma
($
in millions)
YOY
$3.0
Or
8.6%
YOY
$36.6
Or
25.5%
8
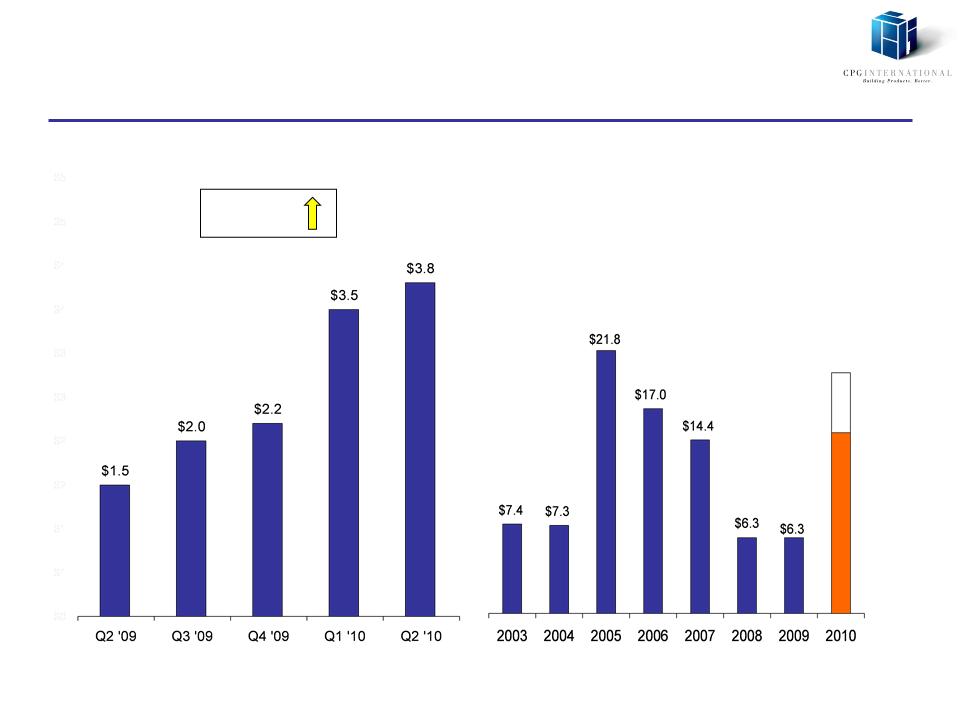
Capital
Expenditures
Financial
Overview
YOY
$2.3
Or
153.3%
Quarter
Cap Ex
($
in millions)
Historical
Cap Ex
($
in millions)
$15-$20
9
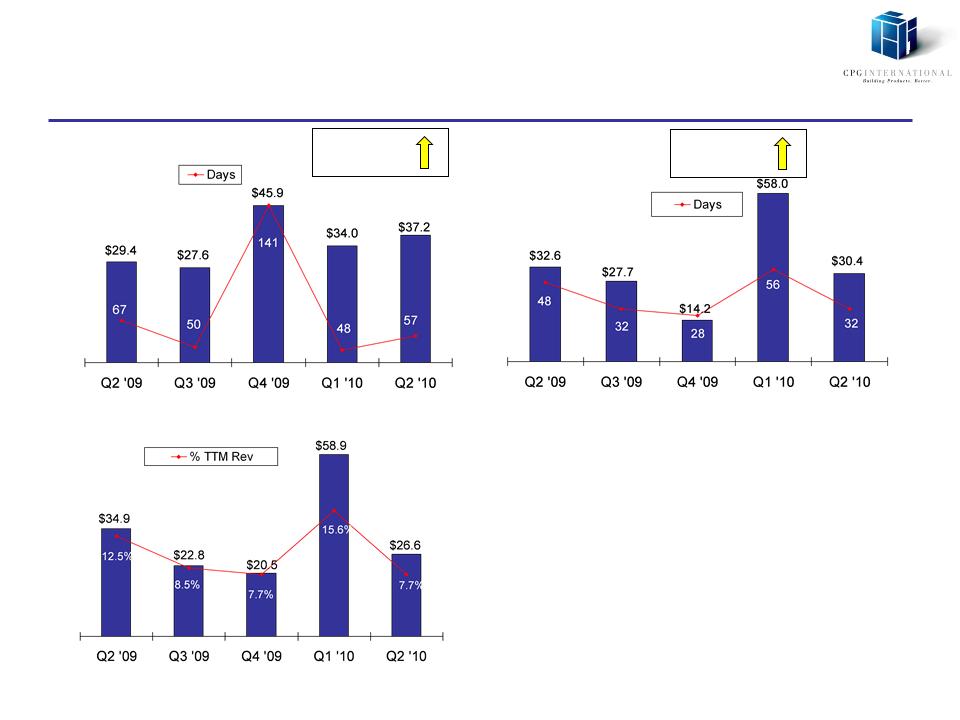
Working
Capital Management
Financial
Overview
YOY
$7.9
Or
26.8%
Inventory
and Inv Days(1)
($
in millions)
AR
and AR Days(1)
($
in millions)
YOY
$(2.2)
or
(6.8)%
Inv/AR/Prepaid
less AP/Accrued
($
in millions)
Footnote:
(1) Based on trailing
three months annualized
10
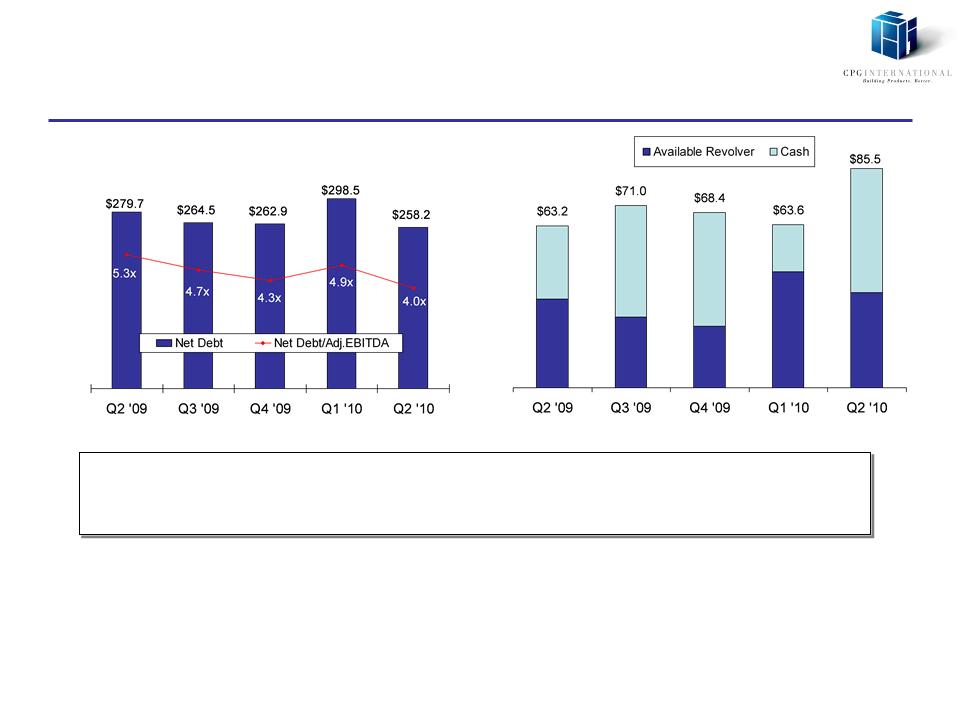
Liquidity
Position
Financial
Overview
Net
Debt(1) & Net
Debt/Adj. EBITDA(2)
($
in millions)
Liquidity(3)
($
in millions)
• Liquidity position
at $85.5mm
• Trailing Twelve
Month June 30, 2010 Adjusted EBITDA of $63.9mm
Footnotes:
(1) Net debt defined as
total debt and capital lease obligations less cash
(2) Trailing twelve month
adjusted EBITDA as defined in Credit Agreements
(3) Liquidity defined as
cash as of 6/30/10 plus availability under our revolver
11
Low
High
$57mm
$67mm
2010
Guidance
2010
Adjusted EBITDA Guidance(1)
Downside:
• Slow economic
recovery
– Residential repair
& remodel activity
– New home
construction
– Industrial
markets
– Commercial
markets/tax revenue
• Resin prices
escalate beyond
expectations
expectations
• Increased
competition
Upside:
• Higher than
anticipated economic
activity
activity
• Increased market
penetration for
AZEK products
AZEK products
• Lower material
costs
• Operational
efficiencies
(1) In
preparation of our Adjusted EBITDA, we used a basis similar to actual interest,
depreciation, amortization and taxes reported in 2009.

12
APPENDIX
13
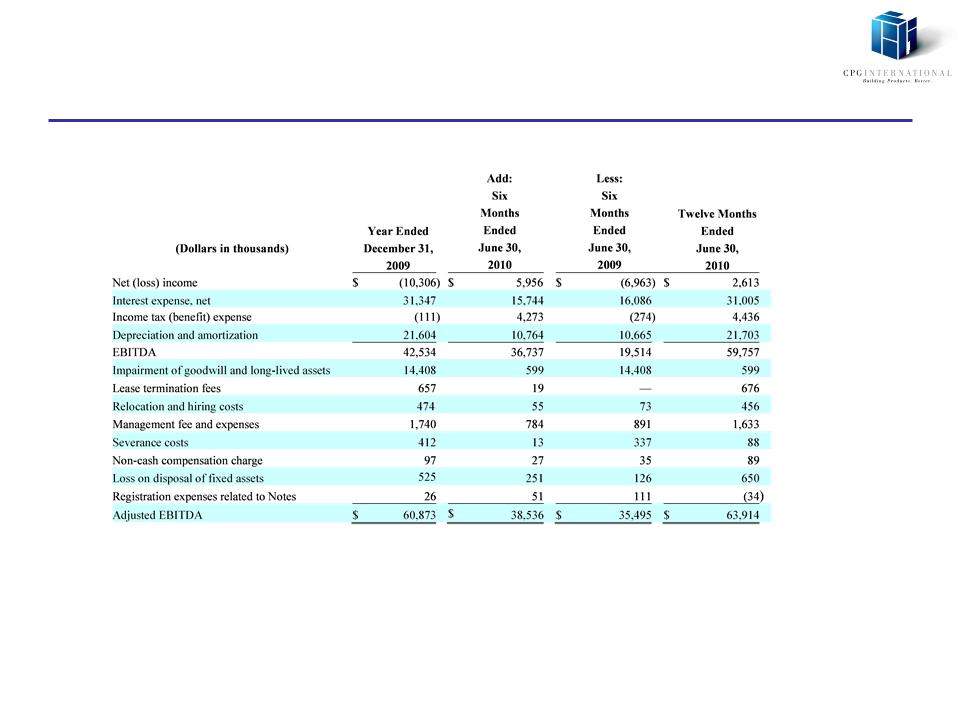
Net
Income to Adjusted EBITDA Reconciliation
Appendix

14
Quarterly Volume
Information
Appendix
|
|
|
|
|
|
|
|
|
(lbs in
thousands)
|
|
Q1
2010
|
|
Q2
2010
|
|
YTD
|
|
AZEK Building
Products
|
50,502
|
|
37,728
|
|
88,230
|
|
|
Scranton
Products
|
|
4,948
|
|
6,368
|
|
11,316
|
|
Vycom
Industrial
|
|
10,973
|
|
12,281
|
|
23,254
|
|
Total
|
|
66,423
|
|
56,377
|
|
122,800
|
|
|
|
|
|
|
|
|
|
|
|
|
|
|
|
|
|
(lbs in
thousands)
|
|
Q1
2009
|
|
Q2
2009
|
|
YTD
|
|
AZEK Building
Products
|
44,938
|
|
23,433
|
|
68,371
|
|
|
Scranton
Products
|
|
6,581
|
|
8,121
|
|
14,702
|
|
Vycom
Industrial
|
|
6,662
|
|
7,047
|
|
13,709
|
|
Total
|
|
58,181
|
|
38,601
|
|
96,782
|
|
|
|
|
|
|
|
|
|
|
|
|
|
|
|
|
|
|
|
%
Change to prior year
|
|
|||
|
|
|
Q1
2010
|
|
Q2
2010
|
|
YTD
|
|
AZEK Building
Products
|
12.4%
|
|
61.0%
|
|
29.0%
|
|
|
Scranton
Products
|
|
-24.8%
|
|
-21.6%
|
|
-23.0%
|
|
Vycom
Industrial
|
|
64.7%
|
|
74.3%
|
|
69.6%
|
|
|
|
|
|
|
|
|
|
Total
|
|
14.2%
|
|
46.1%
|
|
26.9%
|
15
CPG