Attached files
| file | filename |
|---|---|
| 8-K - UIL FORM 8-K DATED AUGUST 4, 2010 - UIL HOLDINGS CORP | uil_form8kdated08042010.htm |
| EX-99 - UIL EXHIBIT 99 - EARNINGS RELEASE - UIL HOLDINGS CORP | uil_exh99.htm |

1
2Q 2010 Earnings Conference Call
August 5, 2010
EXHIBIT 99.1

2
Safe Harbor Provision
Certain statements contained herein, regarding matters that are not historical facts, are forward-looking statements (as defined in the Private
Securities Litigation Reform Act of 1995). These include statements regarding management’s intentions, plans, beliefs, expectations or forecasts
for the future including, without limitation, UIL’s expectations with respect to the benefits, costs and other anticipated financial impacts of the
proposed transaction; future financial and operating results of the company; the company’s plans, objectives, expectations and intentions with
respect to future operations and services; approval of the proposed transaction by governmental regulatory authorities; the availability of
financing; the satisfaction of the closing conditions to the proposed transaction; and the timing of the completion of the proposed transaction.
Such forward-looking statements are based on the Corporation’s expectations and involve risks and uncertainties; consequently, actual results
may differ materially from those expressed or implied in the statements. Such risks and uncertainties include, but are not limited to, general
economic conditions, legislative and regulatory changes, changes in demand for electricity and other products and services, changes in
financial markets, unanticipated weather conditions, changes in accounting principles, policies or guidelines, and other economic, competitive,
governmental, and technological factors affecting the operations, timing, markets, products, services and prices of the Corporation’s
subsidiaries. Examples of such risks and uncertainties specific to the transaction include, but are not limited to: the possibility that the
proposed transaction is delayed or does not close, including due to the failure to receive required regulatory approvals, the taking of
governmental action (including the passage of legislation) to block the transaction, or the failure of other closing conditions; the possibility that
the expected benefits will not be realized, or will not be realized within the expected time period; and the ability to issue equity and debt
securities upon terms and conditions UIL believes are appropriate. The foregoing and other factors are discussed and should be reviewed in
the Corporation’s most recent Annual Report on Form 10-K and other subsequent periodic filings with the Securities and Exchange
Commission. Forward-looking statements included herein speak only as of the date hereof and the Corporation undertakes no obligation to
revise or update such statements to reflect events or circumstances after the date hereof or to reflect the occurrence of unanticipated events or
circumstances.
Reconciliation of Non-GAAP Financial Measures
Financial measures highlighted in this presentation may be considered non-GAAP financial measures such as Earnings Before Interest
Expense, Income Tax, Depreciation and Amortization (“EBITDA”), Adjusted EBITDA and Adjusted Net Income. Comparable GAAP financial
measures and a reconciliation of GAAP financial measures to non-GAAP financial measures are available in the Appendix to this presentation.
Expense, Income Tax, Depreciation and Amortization (“EBITDA”), Adjusted EBITDA and Adjusted Net Income. Comparable GAAP financial
measures and a reconciliation of GAAP financial measures to non-GAAP financial measures are available in the Appendix to this presentation.
Notices
James P. Torgerson
President and Chief Executive Officer, UIL Holdings Corporation
Richard J. Nicholas
Executive Vice President and Chief Financial Officer, UIL Holdings Corporation

3
Agenda
› 2Q 2010 Major Events
» Earnings Summary
» Gas Companies Acquisition Update
» New England East West Solution (NEEWS) Agreement
» GenConn Update
› Capital Expenditure Program
» Refreshed T&D 10-Year Capital Expenditure Program
» Average Rate Base Growth
› State Regulatory Update
› 2Q 2010 Financial Results Detail
› Debt Maturity & Liquidity
› 2010 Earnings Guidance

4
2Q 2010 Financial Results - Summary
2Q 2010
» 2Q ’10 consolidated earnings of $10.1 million, or $0.34 per basic share, compared to
$13.8 million, or $0.51 per basic share, in 2Q ’09
$13.8 million, or $0.51 per basic share, in 2Q ’09
» After-tax acquisition-related costs in the amount of $4.3 million, or $0.14 per share
included in the 2Q and YTD ’10 results
included in the 2Q and YTD ’10 results
» Excluding acquisition-related costs, consolidated net income was $14.4 million, or $0.48
per share for the 2Q ’10
per share for the 2Q ’10
YTD 2010
» YTD ’10 consolidated earnings of $26.2 million, or $0.87 per basic share, compared to
$25.8 million, or $0.99 per basic share
$25.8 million, or $0.99 per basic share
» Excluding acquisition-related costs, consolidated net income was $30.5 million, or $1.01
per share
per share
» Distribution expected to earn above its allowed return of 8.75%
» Transmission expected to earn its allowed weighted average ROE of 12.3%-12.5%

5
Description
› Acquisition of three regulated gas LDCs owned by Iberdrola with approximately
369,000 customers
369,000 customers
» Southern Connecticut Gas (“SCG”) - 176,000 customers
» Connecticut Natural Gas (“CNG”) - 157,000 customers
» Berkshire Gas Company (“BGC”) - 36,000 customers
› Adjusted EBITDA for 12 months ended 3/31/10 of three gas LDCs of approx. $138 million1
Purchase Price
› $1,296 million less net debt of approximately $411 million for an expected cash payment at
closing of approximately $885 million, subject to post closing adjustments
closing of approximately $885 million, subject to post closing adjustments
Tax Treatment
› UIL expects to realize transaction related tax benefits of approximately $135 million on a net
present value basis
present value basis
Timing
› Expected closing in the first quarter of 2011
Approvals
› Connecticut Department of Public Utility Control (DPUC) à filed 7/16; hearings 8/16 & 8/25
› Massachusetts Department of Public Utilities (DPU) à filed 7/23
› HSR (Hart-Scott-Rodino) à filed 7/14
› No shareowner vote required
Financing Plan
› Approximately $400 million UIL Holdings unsecured debt
› Approximately $500 million equity
(1) Source: Adjustments based on notes in audited financial statements and estimates from discussions with Iberdrola USA management.
May 25, 2010 Announcement
Gas Companies Acquisition
Gas Companies Acquisition

6
Pending Acquisition
Strategic Rationale
Strategic Rationale
› Transformative transaction nearly doubling the size of UIL’s regulated investments
› Expected enhanced cash flow and earnings per share accretion provide continued support of UIL’s
dividend
dividend
» Cash flow accretive immediately
» EPS accretive beginning in the first full year following closing (2012)
› Consistent with core business - regulated energy delivery
» UI’s electric utility has a proven ability to earn its allowed return in Connecticut
» Berkshire operating under a constructive rate plan in Massachusetts
› Scale benefits
» Acquisition creates a larger, diversified energy delivery company
› Asset diversification and growth opportunities
» Diversifies UIL’s revenue mix
» Diverse peaking seasons help levelize earnings and cash flow
4 Adds gas winter peak to electric summer peak
» Growth opportunities through efficient expansion of customer gas utilization
› Cost savings potential
» 2009 allocated corporate overheads, support costs and shared services totaled approximately $23
million at the gas LDCs
million at the gas LDCs
» Opportunity to realize expected savings of roughly half of the allocated amount, which is expected
to contribute to the gas LDCs’ ability to earn their allowed return beginning in the first full year
following closing
to contribute to the gas LDCs’ ability to earn their allowed return beginning in the first full year
following closing

7
Combined Service Territory
|
2009
|
|
UIL
Holdings Contribution |
Gas
Companies Contribution |
|
Adjusted
EBITDA(1) |
$349 Million
|
63%
|
37%
|
|
Adjusted
Net Income(1) |
$93 Million
|
59%
|
41%
|
|
Avg Rate Base
|
$1,909 Million
|
55%
|
45%
|
|
Electric Customers
|
325,000
|
100%
|
0%
|
|
Gas Customers
|
369,000
|
0%
|
100%
|
|
Regulated States
|
CT, MA
|
CT
|
CT, MA
|
Combined Statistics
Combined dollar amounts may not add due to rounding.
Note: (1) UIL and Berkshire Gas amounts are unadjusted.
Pending Acquisition
Combined Business Snapshot
Combined Business Snapshot
8
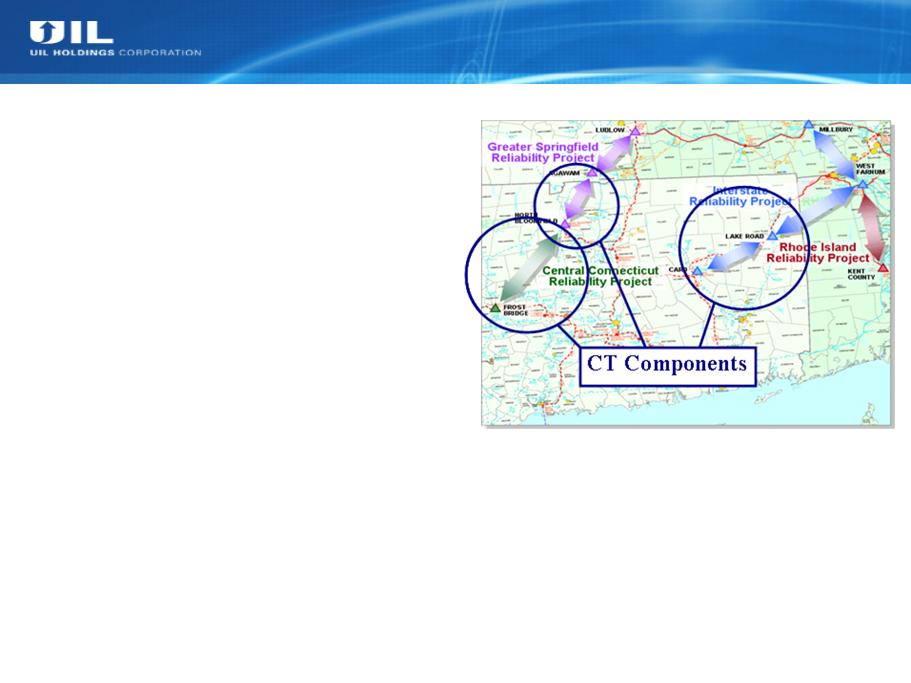
Agreement builds off of successful
partnership between UI and CL&P
on the recently completed
Middletown-to-Norwalk Project.
partnership between UI and CL&P
on the recently completed
Middletown-to-Norwalk Project.
July 15, 2010 Announcement
NEEWS Agreement
NEEWS Agreement
› On July 14, 2010 UI entered into an agreement
with CL&P under which UI will have the right
to invest in and own transmission assets
associated with the CT portion of CL&P’s
NEEWS projects
with CL&P under which UI will have the right
to invest in and own transmission assets
associated with the CT portion of CL&P’s
NEEWS projects
› Total expected CT portion project cost - $711
million
million
» UI has the right to invest up to the greater of $60
million or an amount equal to 8.4 percent of
CL&P’s costs for the CT portions
million or an amount equal to 8.4 percent of
CL&P’s costs for the CT portions
› Upon commercial operation, assets will be
transferred to UI in proportion to its
investments
transferred to UI in proportion to its
investments
» UI investments expected to be made over the next
three or more years depending on the project in
service dates
three or more years depending on the project in
service dates
› Regulatory approvals:
» Joint application filed with the DPUC on 7/15
» FERC filing following DPUC approval

9
Financing
GenConn Energy LLC
› 50/50 debt/equity
Status
› On July 30, 2010 filed with the DPUC the 2011
revenue requirement application for both the
Devon and Middletown facilities
revenue requirement application for both the
Devon and Middletown facilities

10
Total
2010-2019P
Distribution
147
$
187
$
129
$
111
$
114
$
577
$
1,265
$
Transmission
74
$
75
$
70
$
56
$
58
$
204
$
537
$
GenConn*
$
63
$
$
-
$
-
$
-
$
117
$
Total Base Capital Exp.**
* Equity investment - Devon plant now operating, Middletown expected operation 6/1/11. ** Amounts may not add due to rounding.
($ in millions)
Base 10-yr CapEx Forecast
› High probability of occurrence (90+%)
» Identified projects with clear need and
regulatory support
regulatory support
› Represents 12.6% or $214 million increase
over prior 10-year CapEx Plan
over prior 10-year CapEx Plan
» Distribution up 7.4% or $87 million
42 new substations
4Capacity expansions at existing substations
» Transmission up 32.6% or $132 million
42 new substations
4Greater Bridgeport area compliance
expenditures
expenditures
» GenConn down 4.4% or ($5 million)
4Lower projected capitalized costs & interest
Growth Opportunities Beyond Base Forecast
› Transmission investment within the
region
region
» Renewable Portfolio Standards driving
new transmission
new transmission
» Policy support from New England
Governors’ Energy Blueprint
Governors’ Energy Blueprint
› Generation Opportunities
» Potential opportunity for ownership of
base-load generation
base-load generation
54
-
UI T&D Base 10-yr Capital Expenditure Program

11
Aging Infrastructure
Cable & Pole Replacement
Distribution Transformer
Replacement
Replacement
Splice Chambers
Substation Rebuilds (5)
Substation Removals
Capacity
Shelton Substation
Bus Additions
Feeder Transfers
Core Support
Central Facility
System Operations
Customer Projects
* Amounts may not add due to rounding.
Total
Aging Infrastructure
59.0
$
47.1
$
53.4
$
49.1
$
50.6
$
231.1
$
490.1
$
Capacity
25.8
$
26.0
$
25.6
$
26.3
$
35.8
$
184.3
$
323.9
$
System Operations
17.4
$
18.3
$
12.3
$
12.0
$
10.9
$
60.6
$
131.5
$
Core Support
44.9
$
95.8
$
37.8
$
23.6
$
17.0
$
100.7
$
319.8
$
Total Base Distribution*
($ in millions)
UI Base Plan - Distribution Investments

12
Grand Ave Switching Station Rebuild
Other Substation Rebuilds (5)
Line/Cable Replacement
Capacity
Standards Compliance /
Other
Other
*Amounts may not add due to rounding.
Total
Aging Infrastructure
42.1
$
35.3
$
15.3
$
14.9
$
12.8
$
107.1
$
227.5
$
Capacity
13.4
$
13.6
$
4.4
$
2.1
$
11.5
$
49.3
$
94.2
$
Standards Compliance/Other
18.4
$
25.7
$
50.4
$
39.3
$
33.8
$
47.8
$
215.3
$
Total Base Transmission*
($ in millions)
Aging Infrastructure
Greater Bridgeport Area
Compliance Expenditures
Compliance Expenditures
NERC/Cyber Security/IT related
NEEWS
UI Base Plan - Transmission Investments

13
47%
38%
15%
49%
39%
12%
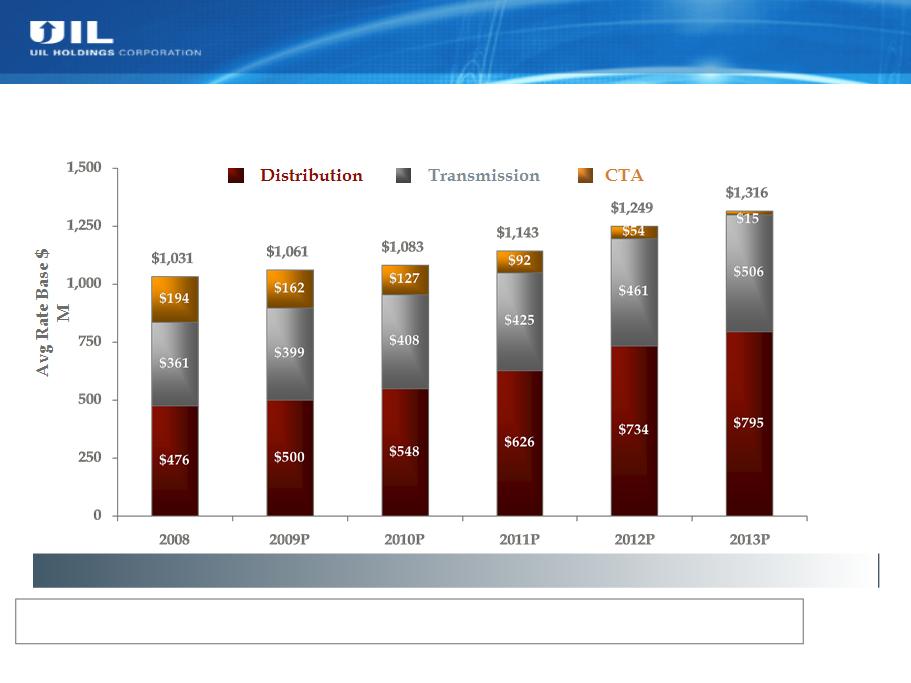
Rate base growth even with a declining CTA balance
54%
38%
8%
58%
38%
4%
60%
39%
1%
61%
39%
Avg. GenConn RB Equivalent
UI CAGR 7.4%
$153m
$199m
$188m
$177m
Avg. GenConn Equity “Rate Base”
$77m
$94m
$89m
$99m
UI’s 50% Share:
$52m
$26m
UI + GenConn CAGR 9.8%
UI 2010 - 2014 Average Rate Base Forecast
(Excluding GenConn Equity Investments)
(Excluding GenConn Equity Investments)

14
State Regulatory Update
› Decoupling Draft Decision (DN 08-07-04RE02)
» Would defer ruling on extension of decoupling pilot to the early part of 2011
» Would approve decoupling charge of approx. $1.6 million, which includes approx. $3.8
million already recovered in rates from the previously approved rate increase
acceleration to 1/1/10
million already recovered in rates from the previously approved rate increase
acceleration to 1/1/10
4 Offset by approx. $3.9 million credit for pension tracker and earnings sharing surcredit
4 Net credit of approx. $2.3 million to be returned over the 12 month period starting in September
› Generic ROE proceeding (DN 09-10-06)
» Hearings set for mid-September
» Final decision expected late December

15
* Competitive Transition Assessment
Quarter Ended June 30,
6 Months Ended June 30,
2010
2009
Difference
2010
2009
Difference
UI
Distribution, CTA* and Other
8.0
$
8.1
$
(0.1)
$
17.9
$
14.9
$
3.0
$
Transmission
7.1
6.2
0.9
13.8
12.3
1.5
Total UI Net Income
15.1
$
14.3
$
0.8
$
31.7
$
27.2
$
4.5
$
UIL Corporate, excl. acquisition-related costs
(0.7)
(0.5)
(0.2)
(1.2)
(1.4)
0.2
Subtotal
14.4
$
13.8
$
0.6
$
30.5
$
25.8
$
4.7
$
UIL Corporate acquisition-related costs
(4.3)
-
(4.3)
(4.3)
-
(4.3)
Total Net Income
10.1
$
13.8
$
(3.7)
$
26.2
$
25.8
$
0.4
$
Average Shares Outstanding - Basic
30.1
27.0
3.1
30.0
26.1
3.9
EPS - basic, excl. acquisition-related costs
0.48
$
0.51
$
(0.03)
$
1.01
$
0.99
$
0.02
$
EPS - basic, incl. acquisition-related costs (GAAP)
0.34
$
0.51
$
(0.17)
$
0.87
$
0.99
$
(0.12)
$
The dilutive effect of the May 2009 issuance of 4,600,000 shares of common stock was $0.03 per share and
$0.12 per share for the second quarter and the first six months of 2010, respectively.
2Q 2010 Financial Results - Details

16
2Q 2010 Financial Results - Details (cont.)
2Q 2010
Distribution, CTA and Other
» 2Q ’10 earnings of $8.0 million compared to $8.1 million in 2Q ’09
» Favorable variance in revenues due to the approved rate increase effective January 1,
2010 was more than offset by the unfavorable variance from the equity investment in
GenConn
2010 was more than offset by the unfavorable variance from the equity investment in
GenConn
4 GenConn equity investment generated an after-tax loss of $0.5 million due to the delay (from
June 1, 2010) in commencing operations. All four units at GenConn’s Devon site are now
operating.
June 1, 2010) in commencing operations. All four units at GenConn’s Devon site are now
operating.
Transmission
» 2Q ’10 earnings of $7.1 million compared to $6.2 million in 2Q ’09
» Increase in AFUDC coupled with higher rate base and equity capitalization
YTD 2010
Distribution, CTA and Other
» YTD ’10 earnings of $17.9 million compared to $14.9 million in first six months of ‘09
» Favorable variance in rates and pricing offset slightly by unfavorable variance from the
equity investment in GenConn
equity investment in GenConn
Transmission
» YTD ’10 earnings of $13.8 million compared to $12.3 million in first six months of ’09
» Increase in AFUDC coupled with higher rate base and equity capitalization

17
Liquidity outlook
› Short-term borrowings outstanding of $30M as of
6/30/10 under UIL & UI $175M joint credit facility
due 12/22/11 ($50M of limit available for UIL)
6/30/10 under UIL & UI $175M joint credit facility
due 12/22/11 ($50M of limit available for UIL)
› No outstanding balance as of 6/30/10 under UIL
uncommitted money market loan facility
uncommitted money market loan facility
› $115.9M borrowed under $121.5M equity bridge
loan at UI acquired to fund its portion of the
contribution to GenConn. UI must pay off the
outstanding balance on the commercial operation
date for each facility, Devon Q3 ’10, Middletown
Q2 ‘11
loan at UI acquired to fund its portion of the
contribution to GenConn. UI must pay off the
outstanding balance on the commercial operation
date for each facility, Devon Q3 ’10, Middletown
Q2 ‘11
› UIL had $49.3M of long-term debt at the holding
company as of 6/30/10, maturing in 2/11
company as of 6/30/10, maturing in 2/11
› UI closed on $100M 30-year 6.09% Private
Placement Debt on 7/27/10
Placement Debt on 7/27/10
› In parallel with the pending gas companies
acquisition, UIL revolver to be negotiated
acquisition, UIL revolver to be negotiated
Debt maturity schedule as of 6/30/10 ($M)
Solid liquidity position enabling future CapEx plans
$27.5M refunded 2/1/10
$4.3M sinking fund payment 2/16/10
* To be remarketed
*
NONE
Debt Maturity and Liquidity Profile

18
|
|
Approximate 2010 Net
Income * |
2010 EPS - Basic
|
|
The United Illuminating Company
|
|
|
|
Distribution, CTA & Other
|
$32 - $34
|
$1.06 - $1.13
|
|
Transmission
|
26 - 28
|
0.87 - 0.93
|
|
GenConn
|
1 - 2
|
0.05 - 0.07
|
|
Total UI
|
$59 - $63
|
$1.98 - $2.10
|
|
Corporate, excl. acquisition-related costs
and events |
(3) - (2)
|
(0.09) - (0.05)
|
|
Total UIL, excl. acquisition-related costs
and events |
$57 - $62
|
$1.92 - $2.07
|
|
2009 Actual
|
$54.3
|
$1.94
|
Expectations are not intended to be additive
* Rounded to the nearest million
2010 Earnings Guidance as of 8/5/10 - Consolidated Affirmed
Excluding Acquisition-Related Costs and Events
Excluding Acquisition-Related Costs and Events
Guidance Assumptions
› 2010 EPS estimates include $0.15 per share dilution from May 2009 equity issuance, when compared to 2009
› Earnings from CTA are expected to decline $0.06-$0.08 per share in 2010
› Sustainable O&M cost savings in the Distribution business
› Combination of Distribution & CTA is expected to earn above its allowed ROE of 8.75% in 2010
› Transmission is expected to earn a weighted average return on equity of 12.3% to 12.5%
› GenConn Devon is now operating

19
Q&A

20
Appendix

21
Total
2009-2018P
Distribution
95
$
141
$
147
$
141
$
122
$
534
$
1,178
$
Transmission
29
$
47
$
63
$
80
$
96
$
91
$
405
$
GenConn*
-
$
57
$
65
$
-
$
-
$
-
$
122
$
Total Base Capital Exp.**
* Equity investment - Devon plant in-service 6/1/10, Middletown plant in-service 6/1/11.
** Amounts may not add due to rounding.
($ in millions)
Base 10-yr CapEx Forecast
› High probability of occurrence (90+%)
»Identified projects with clear need and
regulatory support
regulatory support
› Reflects decline in future peak load
forecasts
forecasts
»Pushing out some capacity projects and
dollars beyond prior 10-yr plan
dollars beyond prior 10-yr plan
Growth Opportunities Beyond Base Forecast
› Transmission investment within the
region
region
»Renewable Portfolio Standards driving
new transmission
new transmission
»Policy support from New England
Governors’ Energy Blueprint
Governors’ Energy Blueprint
› Generation Opportunities
»Potential opportunity for ownership of
base-load generation
base-load generation
Previous UI T&D Base 10-yr Capital Expenditure Program
as of November 2009
as of November 2009
22
46%
35%
19%
47%
38%
15%
Rate base growth even with a declining CTA balance
51%
38%
11%
55%
37%
8%
59%
37%
4%
60%
39%
Avg. GenConn Rate Base Equivalent (UI’s share)
CAGR 5%
1%
$56m
$174m
$232m
$224m
Avg. GenConn Equity Investment (UI’s share)
$28m
$116m
$112m
$87m
Previous UI Average Rate Base Forecast
(Excl. GenConn Equity Investments) as of November 2009
(Excl. GenConn Equity Investments) as of November 2009

23
Amounts may not add due to rounding.
Source: SEC filings and audited financial statements.
(1) Last twelve months ended 03/31/2010. Quarterly data is unaudited.
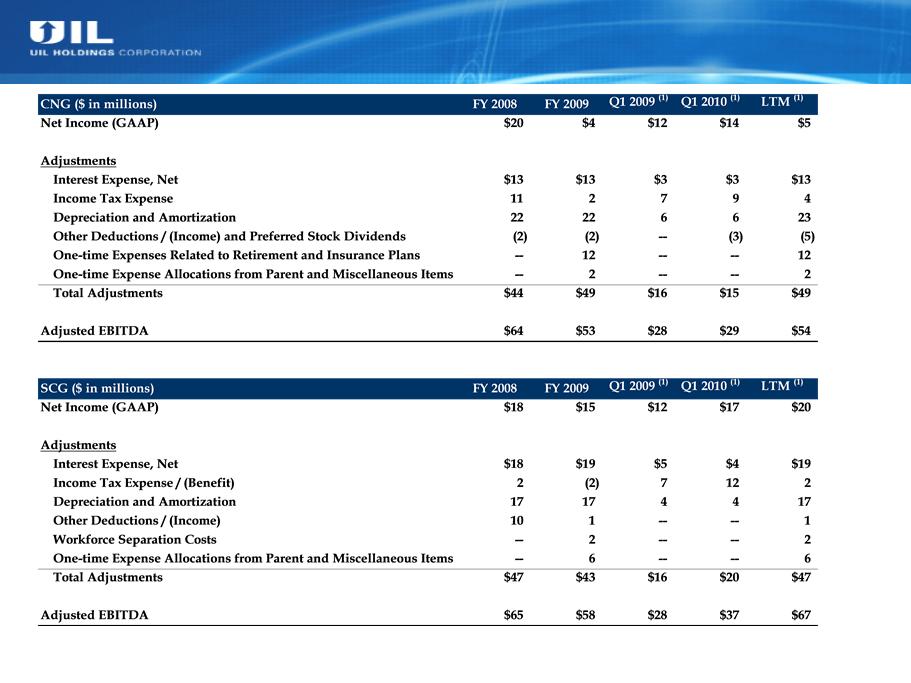
Acquisition Net Income to EBITDA Reconciliation
24
Amounts may not add due to rounding.
Source: Adjustments based on notes in audited financial statements and estimates from discussions with Iberdrola USA management.
(1) Last twelve months ended 03/31/2010. Quarterly data is unaudited.
Acquisition Net Income to Adjusted EBITDA Reconciliation
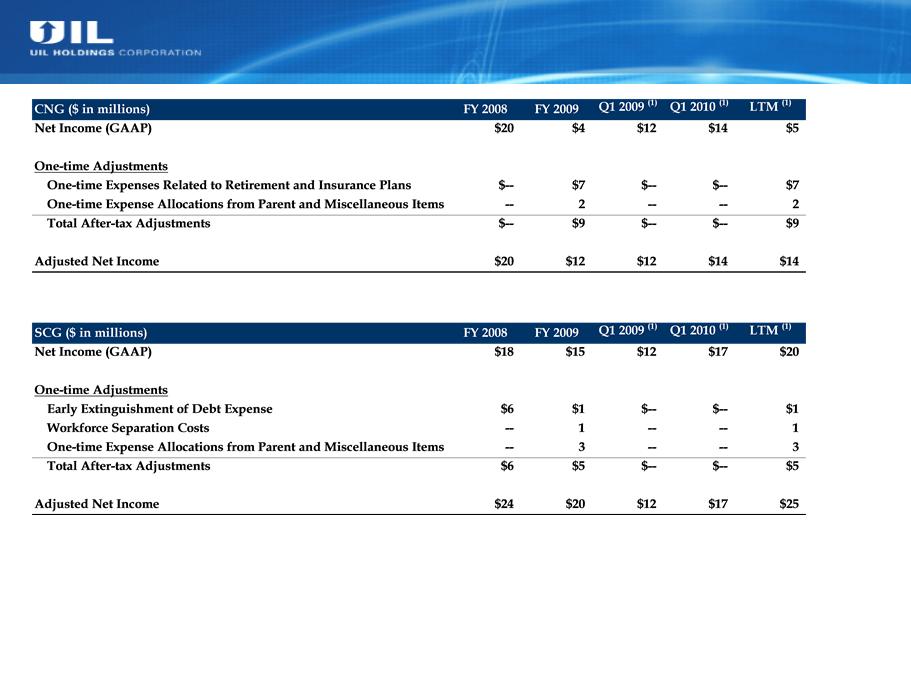
25
Amounts may not add due to rounding.
Source: Adjustments based on notes in audited financial statements and estimates from discussions with Iberdrola USA management.
(1) Last twelve months ended 03/31/2010. Quarterly data is unaudited.
Acquisition Adjusted Net Income Reconciliation