Attached files
| file | filename |
|---|---|
| 8-K - CINCINNATI BELL INC. 8-K - CINCINNATI BELL INC | a6379523.htm |
| EX-99.1 - EXHIBIT 99.1 - CINCINNATI BELL INC | a6379523ex99_1.htm |
Exhibit 99.2

Cincinnati Bell 2nd Quarter 2010 Review August 4, 2010
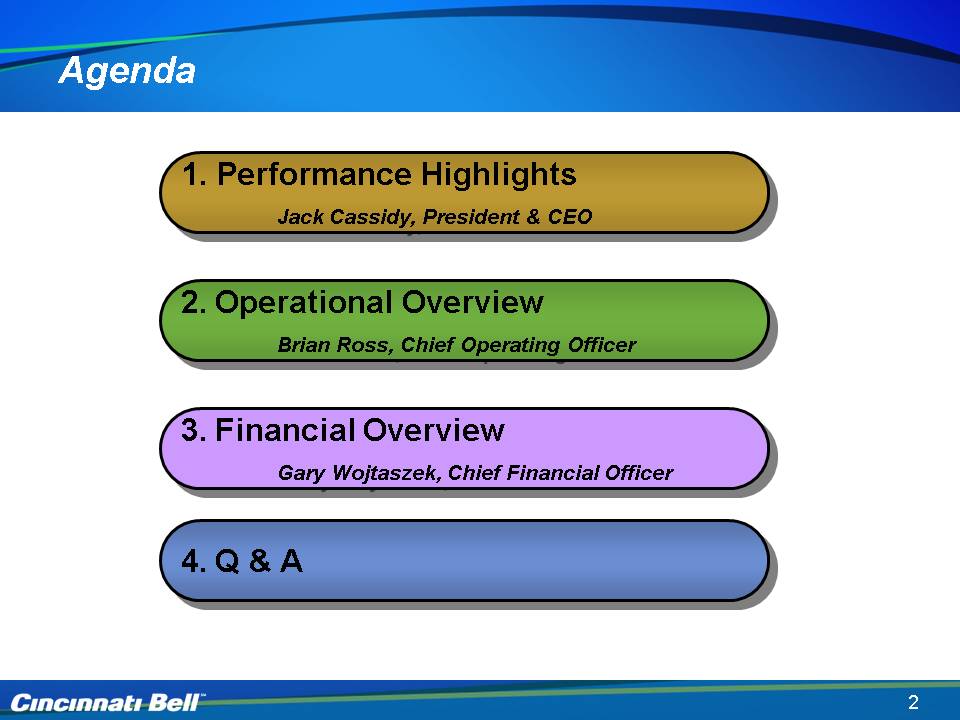
Agenda Performance Highlights Jack Cassidy, President & CEO 2. Operational Overview Brian Ross, Chief Operating Officer 4. Q & A 3. Financial Overview Gary Wojtaszek, Chief Financial Officer

Safe Harbor Certain of the statements and predictions contained in this presentation constitute forward-looking statements within the meaning of the Private Securities Litigation Reform Act. In particular, statements, projections or estimates that include or reference the words “believes,” “anticipates,” “plans,” “intends,” “expects,” “will,” or any similar expression fall within the safe harbor for forward-looking statements contained in the Reform Act. Actual results or outcomes may differ materially from those indicated or suggested by any such forward-looking statement for a variety of reasons, including, but not limited to: changing market conditions and growth rates within the telecommunications industry or generally within the overall economy; changes in competition in markets in which the company operates; pressures on the pricing of company products and services; advances in telecommunications technology; the ability to generate sufficient cash flow to fund the company’s business plan, repay the company’s debt and interest obligations, and maintain its networks; the ability to successfully integrate acquisitions and realize the expected revenue, profitability, and cash flows from those acquisitions, the ability to refinance indebtedness when required on commercially reasonable terms; changes in the telecommunications regulatory environment; changes in the demand for the company’s services and products; the demand for particular products and services within the overall mix of products sold, as the company’s products and services have varying profit margins; the company’s ability to introduce new service and product offerings on a timely and cost effective basis; work stoppage caused by labor disputes; restrictions imposed under various credit facilities and debt instruments; the company’s ability to attract and retain highly qualified employees; the company’s ability to access capital markets and the successful execution of restructuring initiatives; changes in the funded status of the company’s retiree pension and healthcare plans; disruption in operations caused by a health pandemic, such as the H1N1 influenza virus; changes in the company’s relationships with current large customers, a small number of whom account for a significant portion of company revenue; and disruption in the company’s back-office information technology systems, including its billing system. More information on potential risks and uncertainties is available in recent filings with the Securities and Exchange Commission, including Cincinnati Bell’s Form 10-K report, Form 10-Q reports and Form 8-K reports. The forward-looking statements included in this presentation represent company estimates as of August 4, 2010. Cincinnati Bell anticipates that subsequent events and developments will cause its estimates to change.
Performance Highlights Jack Cassidy President & CEO
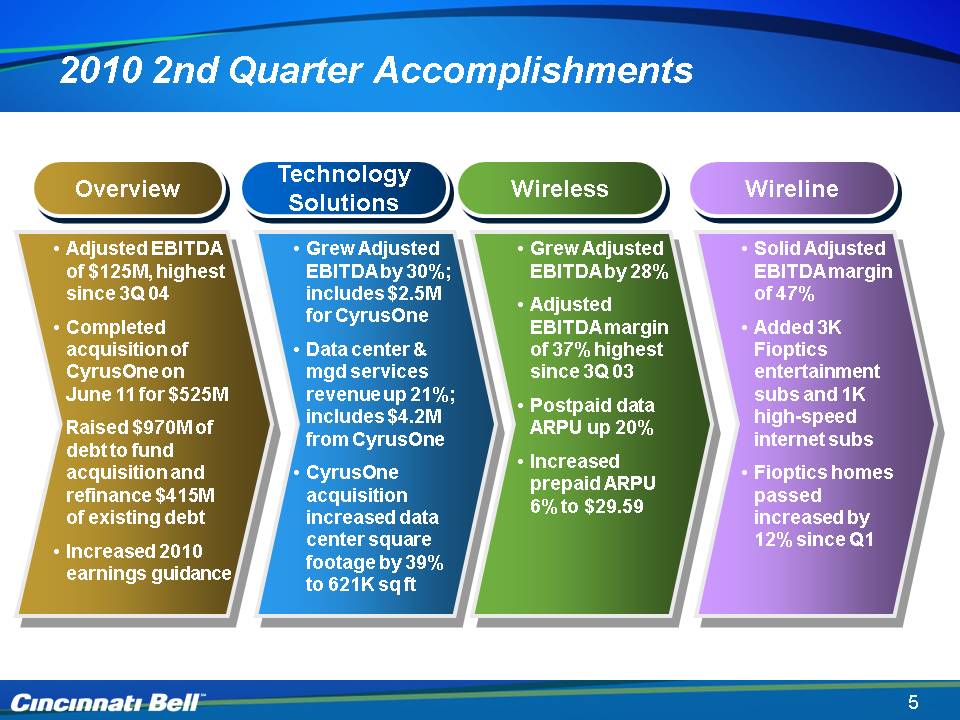
2010 2nd Quarter Accomplishments Overview Technology Solutions Wireless Wireline Adjusted EBITDA of $125M, highest since 3Q 04 Completed acquisition of CyrusOne on June 11 for $525M Raised $970M of debt to fund acquisition and refinance $415M of existing debt Increased 2010 earnings guidance Grew Adjusted EBITDA by 30%; includes $2.5M for CyrusOne Data center & mgd services revenue up 21%; includes $4.2M from CyrusOne CyrusOne acquisition increased data center square footage by 39% to 621K sq ft Grew Adjusted EBITDA by 28% Adjusted EBITDA margin of 37% highest since 3Q 03 Postpaid data ARPU up 20% Increased prepaid ARPU 6% to $29.59 Solid Adjusted EBITDA margin of 47% Added 3K Fioptics entertainment subs and 1K high-speed internet subs Fioptics homes passed increased by 12% since Q1
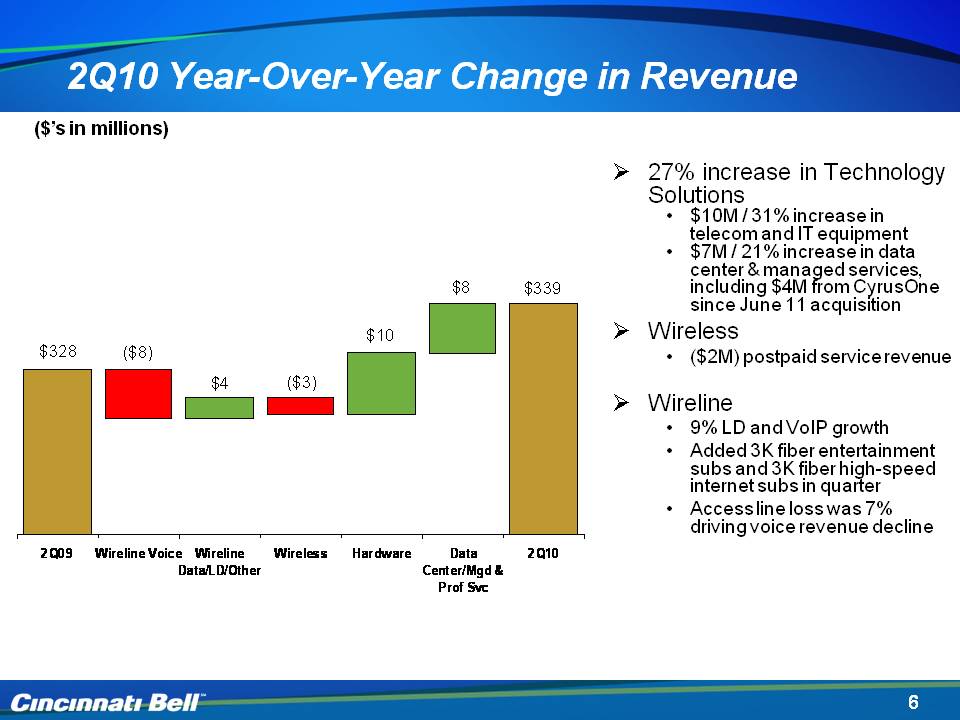
2Q10 Year-Over-Year Change in Revenue 27% increase in Technology Solutions $10M / 31% increase in telecom and IT equipment $7M / 21% increase in data center & managed services, including $4M from CyrusOne since June 11 acquisition Wireless ($2M) postpaid service revenue Wireline9% LD and VoIP growth Added 3K fiber entertainment subs and 3K fiber high-speed internet subs in quarter Access line loss was 7% driving voice revenue decline ($’s in millions)
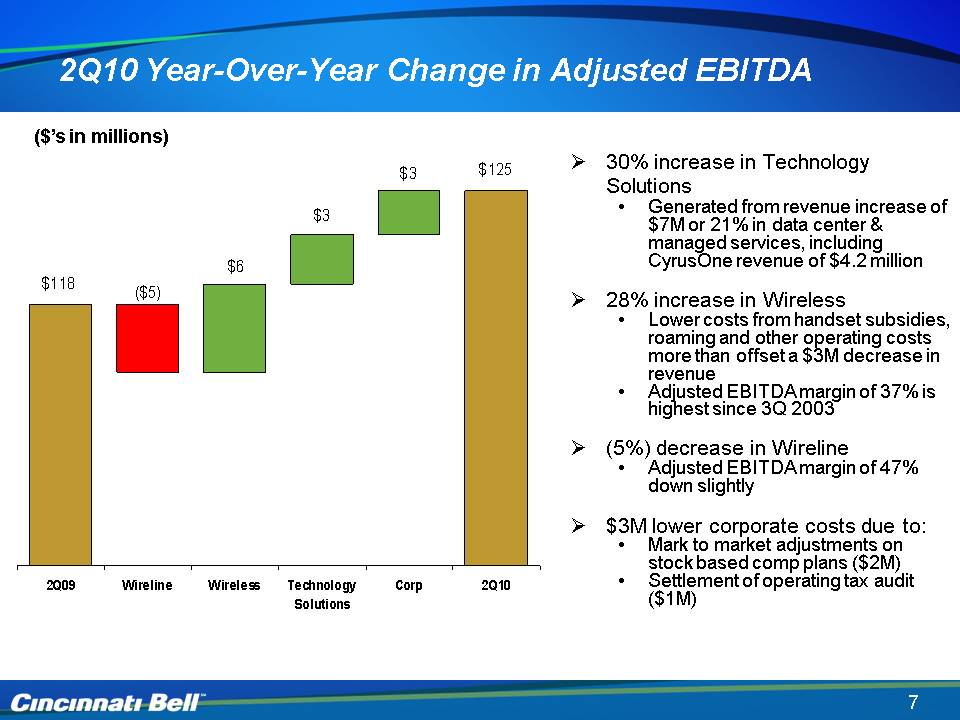
2Q10 Year-Over-Year Change in Adjusted EBITDA 30% increase in Technology Solutions Generated from revenue increase of $7M or 21% in data center & managed services, including CyrusOne revenue of $4.2 million28% increase in WirelessLower costs from handset subsidies, roaming and other operating costs more than offset a $3M decrease in revenueAdjusted EBITDA margin of 37% is highest since 3Q 2003(5%) decrease in Wireline Adjusted EBITDA margin of 47% down slightly$3M lower corporate costs due to:Mark to market adjustments on stock based comp plans ($2M)Settlement of operating tax audit ($1M) ($’s in millions)
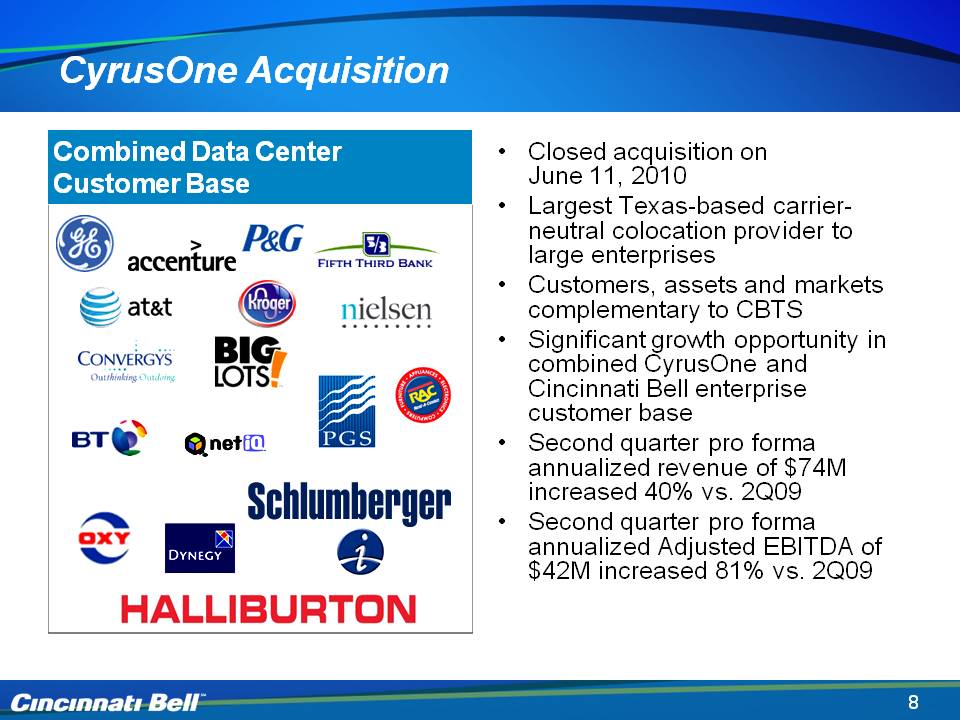
CyrusOne Acquisition Closed acquisition on June 11, 2010 Largest and most prominent Texas-based carrier-neutral colocation provider to large enterprises Customers, assets and markets complementary to CBTS Significant growth opportunity in combined CyrusOne and Cincinnati Bell enterprise customer base Second quarter pro forma annualized revenue increase of 40% vs. 2Q09 Second quarter pro forma annualized Adjusted EBITDA increase of 69% vs. 2Q09 Combined Date Center Customer Baseof $74M increased of $42M increased 81%
Operational Overview Brian Ross Chief Operating Officer
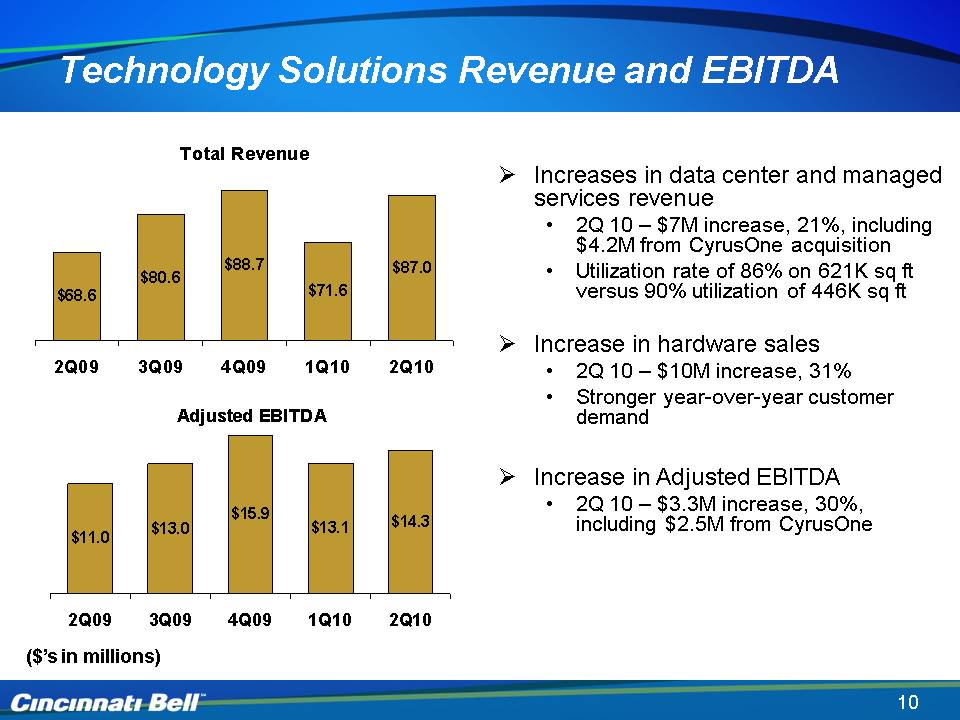
Technology Solutions Revenue and EBITDA ($’s in millions) Increases in data center and managed services revenue 2Q 10 – $7M increase, 21%, including $4.2M from CyrusOne acquisition Utilization rate of 86% on 621K sq ft versus 90% utilization of 446K sq ft Increase in hardware sales2Q 10 – $10M increase, 31% Stronger year-over-year customer demand Increase in Adjusted EBITDA2Q 10 – $3.3M increase, 30%, including $2.5M from CyrusOne
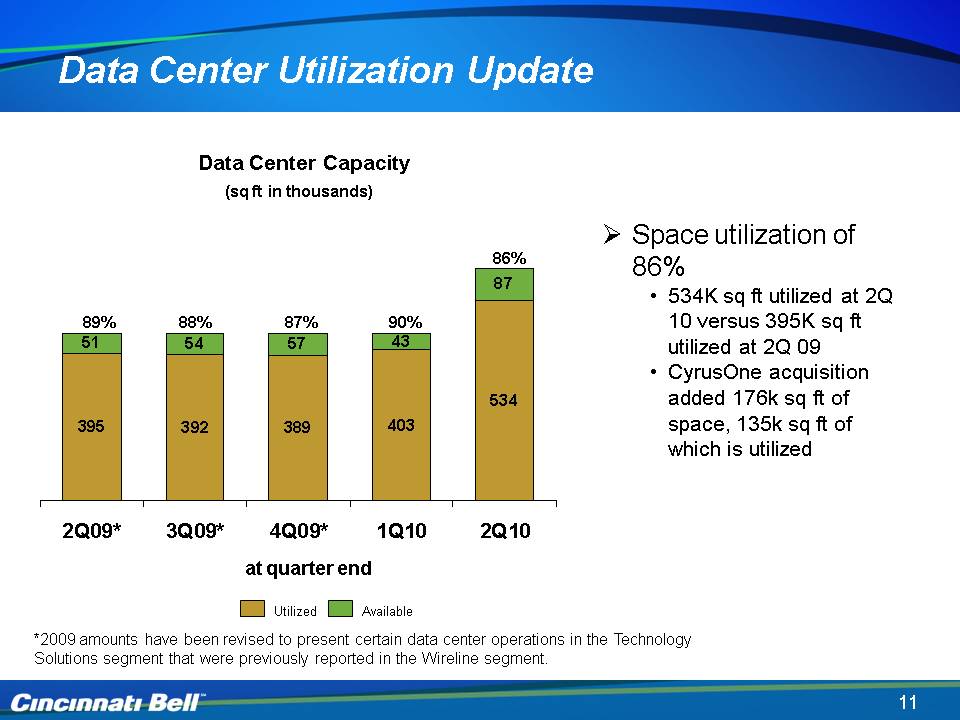
Data Center Utilization Update Data Center Capacity at quarter end Space utilization of 86% 534K sq ft utilized at 2Q 10 versus 395K sq ft utilized at 2Q 09 CyrusOne acquisition added 176k sq ft of space, 135k sq ft of which is utilized (sq ft in thousands) Utilized Available *2009 amounts have been revised to present certain data center operations in the Technology Solutions segment that were previously reported in the Wireline segment. 90% 89% 87% 88% 86%
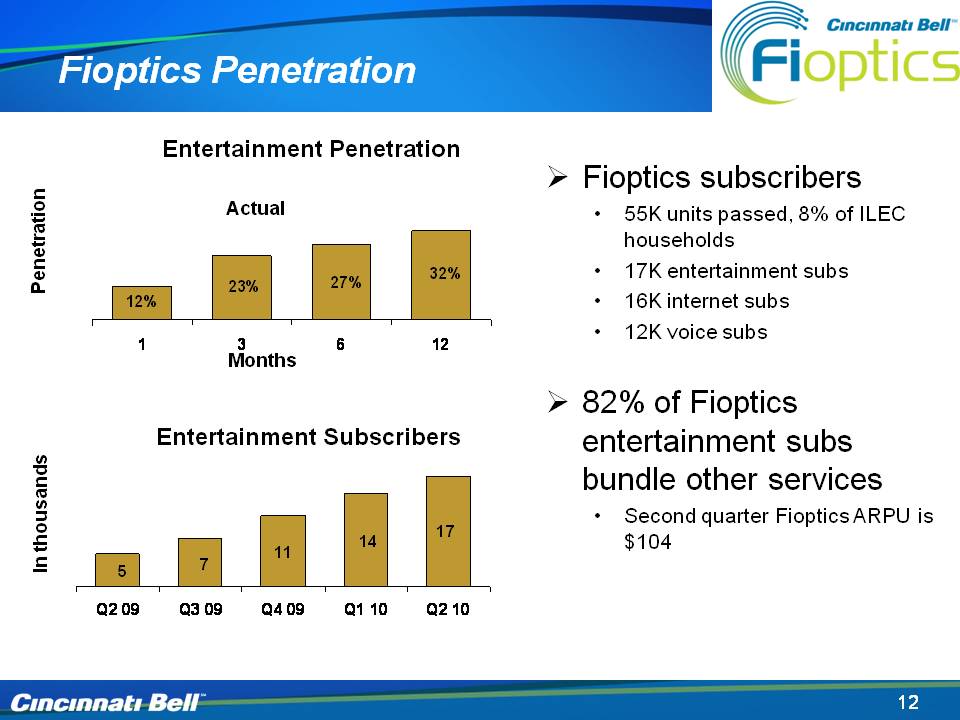
Fioptics Penetration Video Penetration Multiple Dwelling Unit (MDU) build strategy targets entire ILEC footprint MDU build avoids cannibalizing our base and makes competitive response more difficult Fioptics passes 8% of ILEC households Fioptics subscribers 55K units passed 17K video subs 16K internet subs 12K voice subs Months Penetration Actual Video Subscribers In thousands
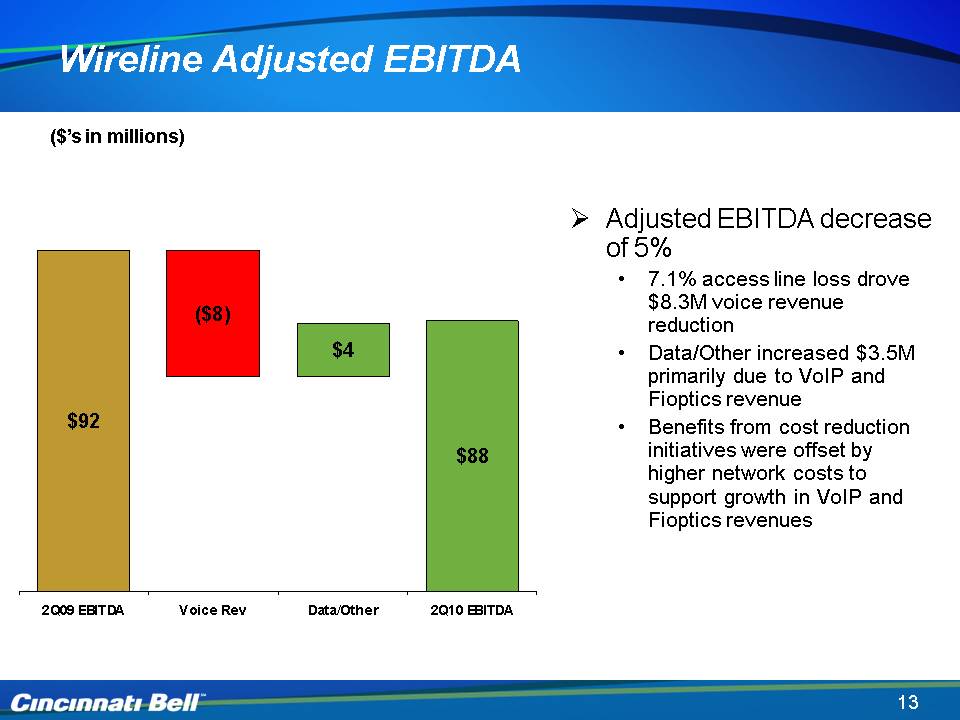
Wireline Adjusted EBITDA Adjusted EBITDA decrease of 5%7.1% access line loss drove $8.3M voice revenue reductionData/Other increased $3.5M primarily due to VoIP and Fioptics revenueBenefits from cost reduction initiatives were offset by higher network costs to support growth in VoIP and Fioptics revenues ($’s in millions)
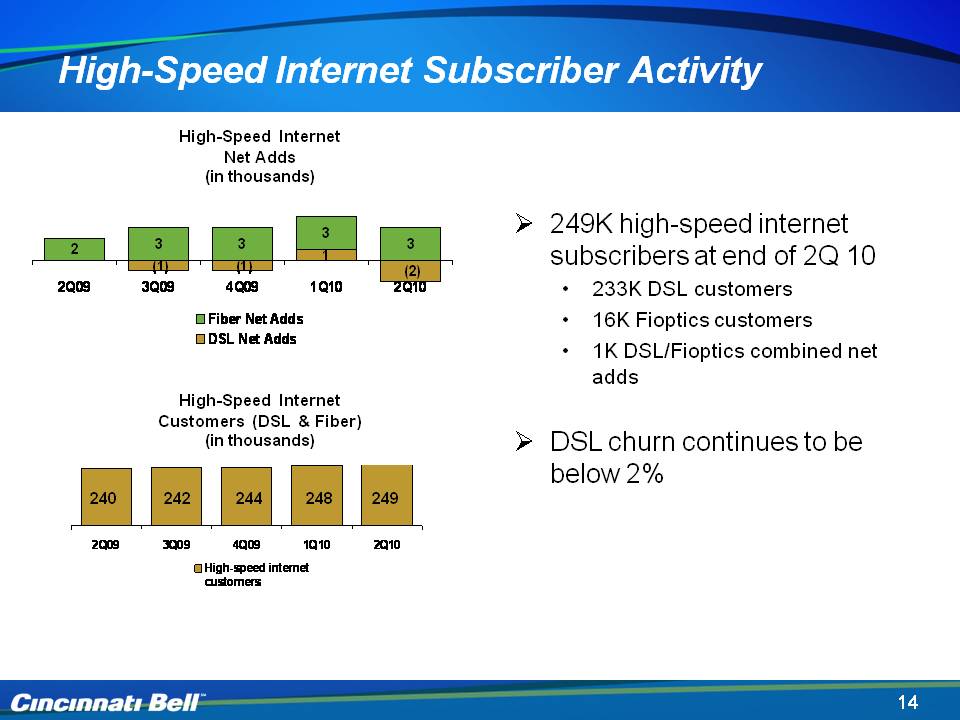
High-Speed Internet Subscriber Activity 249K high-speed internet subscribers at end of 2Q 10 233K DSL customers 17K Fioptics customers 1K combined net adds DSL churn continues to be below 2% High-Speed Internet Net Adds (in thousands) 240 242 244 248 249 High-Speed Internet Customers (DSL & Fiber) (in thousands)
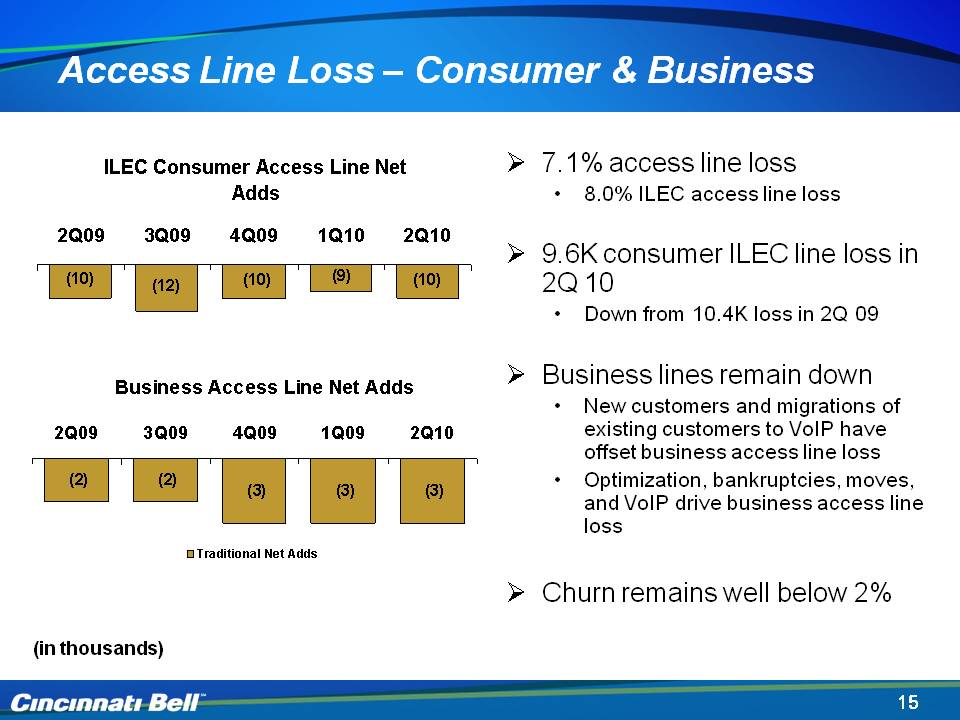
Access Line Loss – Consumer & Business 7.1% access line loss8.0% ILEC access line loss 9.6K consumer ILEC line loss in 2Q 10 Down from 10.4K loss in 2Q 09Business lines remain down Optimization, bankruptcies, moves, and VoIP drive line lossWell positioned for VoIP with eVolve T1 and IP CentrexChurn remains well below 2% (in thousands)New customers and migrations of existing customers to VoIP have offset business access line loss business access
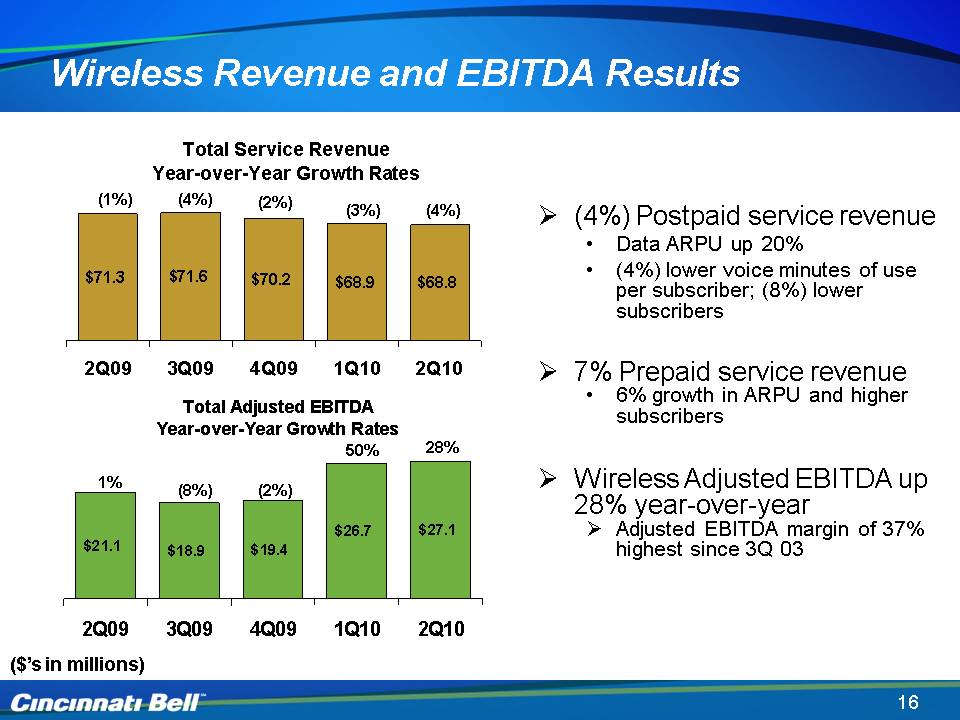
Wireless Revenue and EBITDA Results Body: (4%) Postpaid service revenue Data ARPU up 20% (4%) lower voice minutes of use per subscriber; (8%) lower subscribers 7% Prepaid service revenue 6% growth in ARPU and higher subscribers Wireless Adjusted EBITDA up 28% year-over-year Adjusted EBITDA margin of 37% highest since 3Q 03 ($’s in millions) (4%) (4%) (1%) (2%) (3%) 1% (8%) (2%) 50% 28%
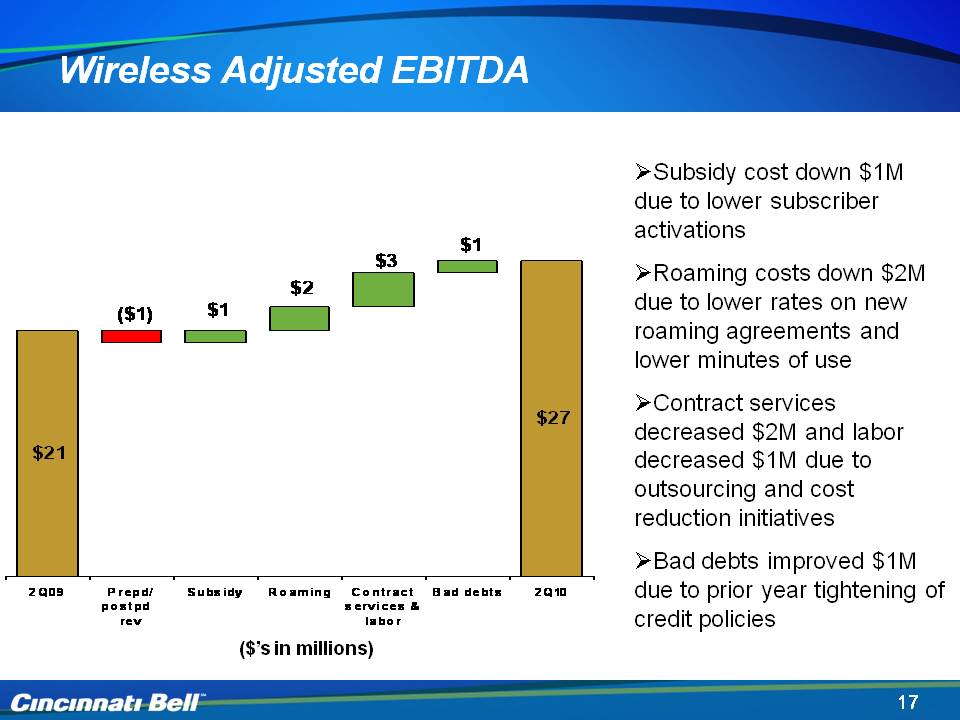
Wireless Adjusted EBITDA ($’s in millions) Subsidy cost down $2M due to lower subscriber activationsRoaming costs down $2M due to new roaming agreements and lower minutes of useContract services decreased $2M due to outsourcing initiatives Bad debts improved $1M due to prior year tightening of credit policies
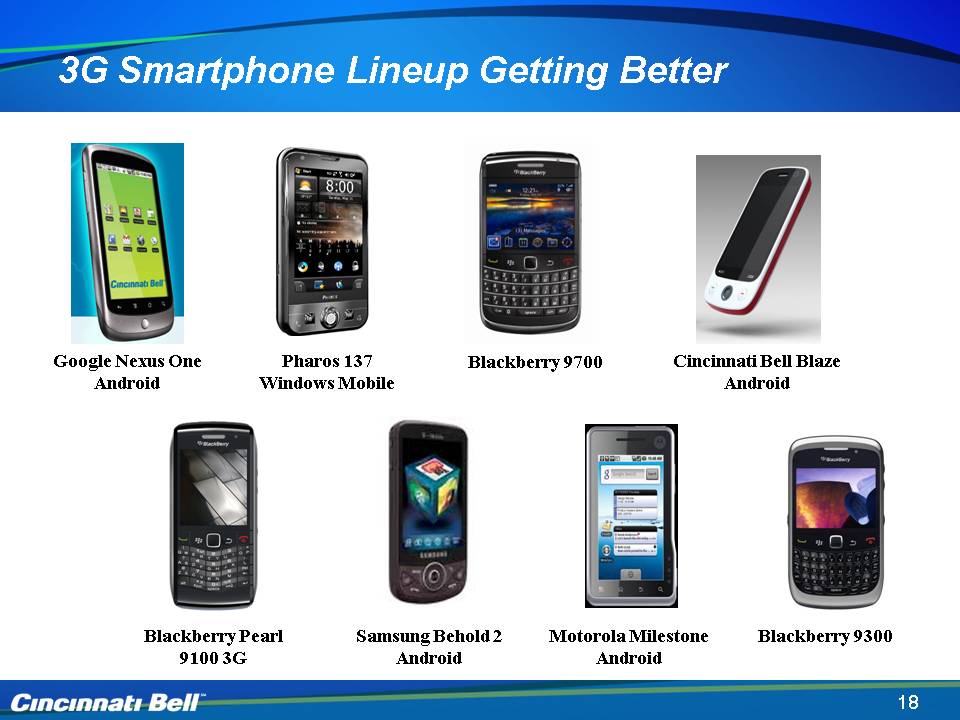
3G Smartphone Lineup Getting Better Google Nexus One Android Blackberry 9700 Cincinnati Bell Blaze Android Samsung Behold 2 Android Blackberry Pearl 9100 3G Pharos 137 Windows Mobile Motorola Milestone Android Blackberry 9300
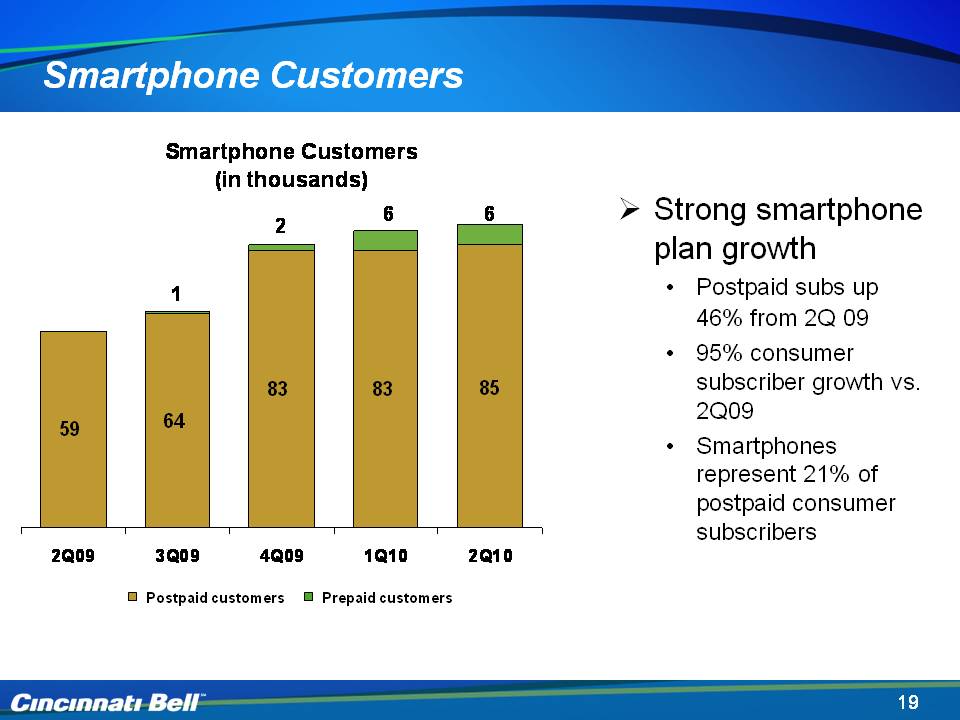
Smartphone Customers (in thousands) Strong smartphone plan growth Postpaid subs up 46% from 2Q 09 95% consumer subscriber growth vs. 2Q09 Smartphones represent 21% of postpaid consumer subscribers Postpaid customers Prepaid customers
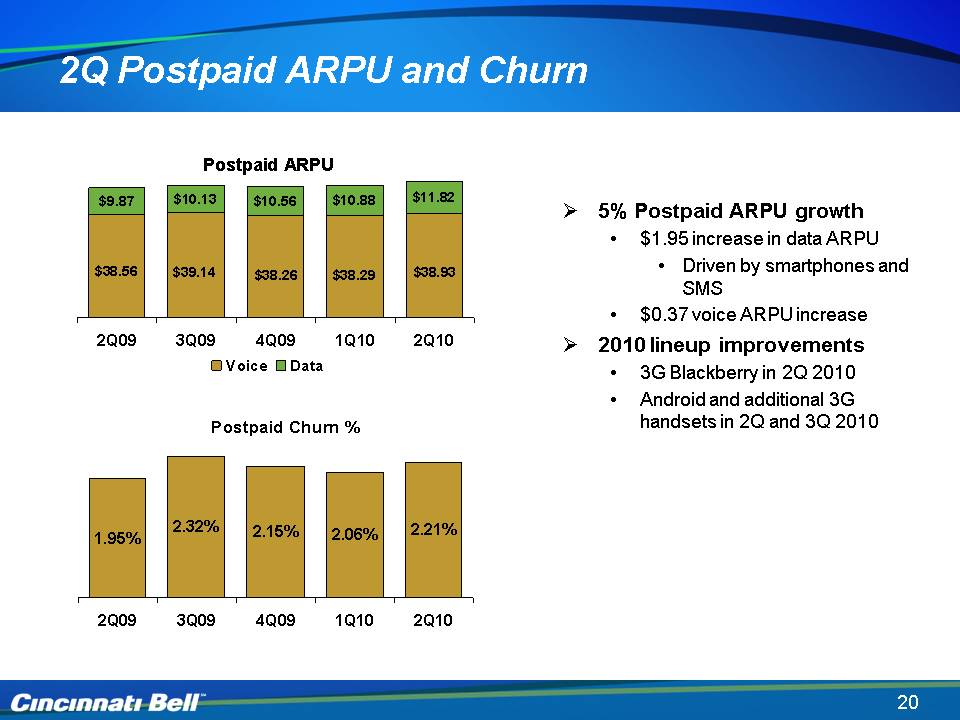
2Q Postpaid ARPU and Churn 5% Postpaid ARPU growth $1.95 increase in data ARPU Driven by smartphones and SMS $0.37 voice ARPU increase 2010 lineup improvements 3G Blackberry in 2Q 2010 Android and additional 3G handsets in 2Q and 3Q 2010
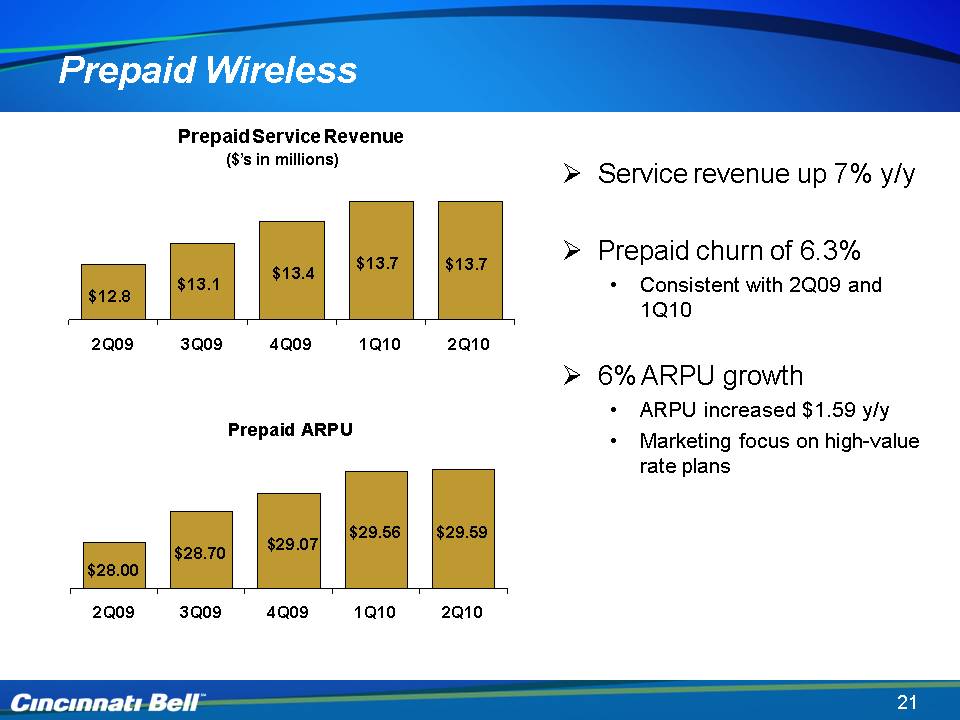
Prepaid Wireless Prepaid Service Revenue ($’s in millions) Service revenue up 7% y/y Prepaid churn of 6.3% Consistent with 2Q09 and 1Q10 6% ARPU growth ARPU increased $1.59 y/y Marketing focus on high-value rate plans
Financial Overview Gary Wojtaszek Chief Financial Officer
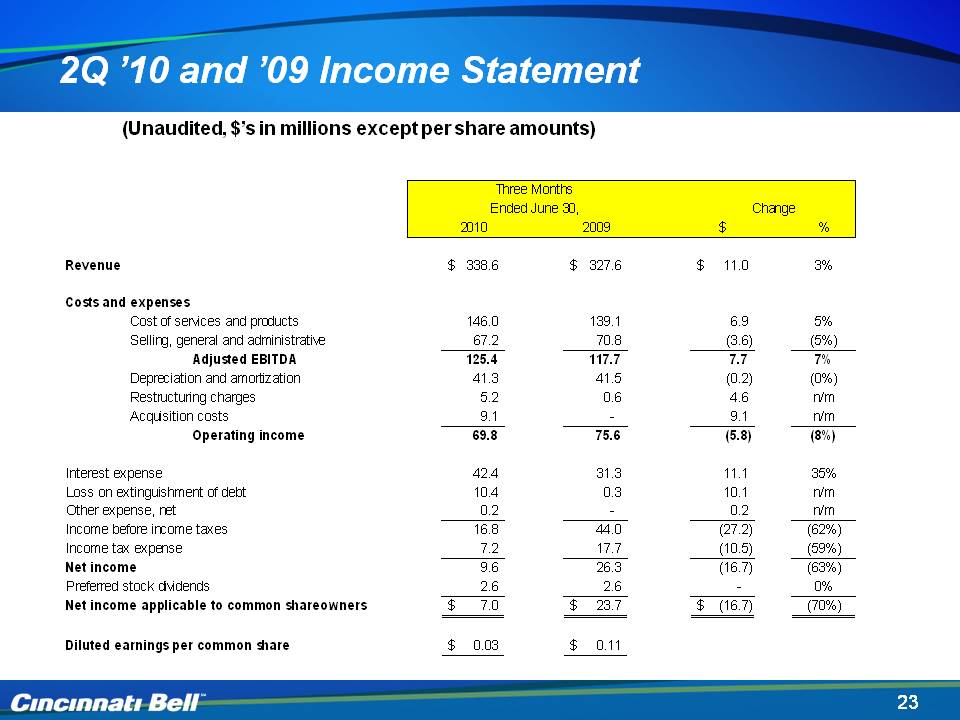
2Q ’10 and ’09 Income Statement (Unaudited, $’s in millions except per share amounts)
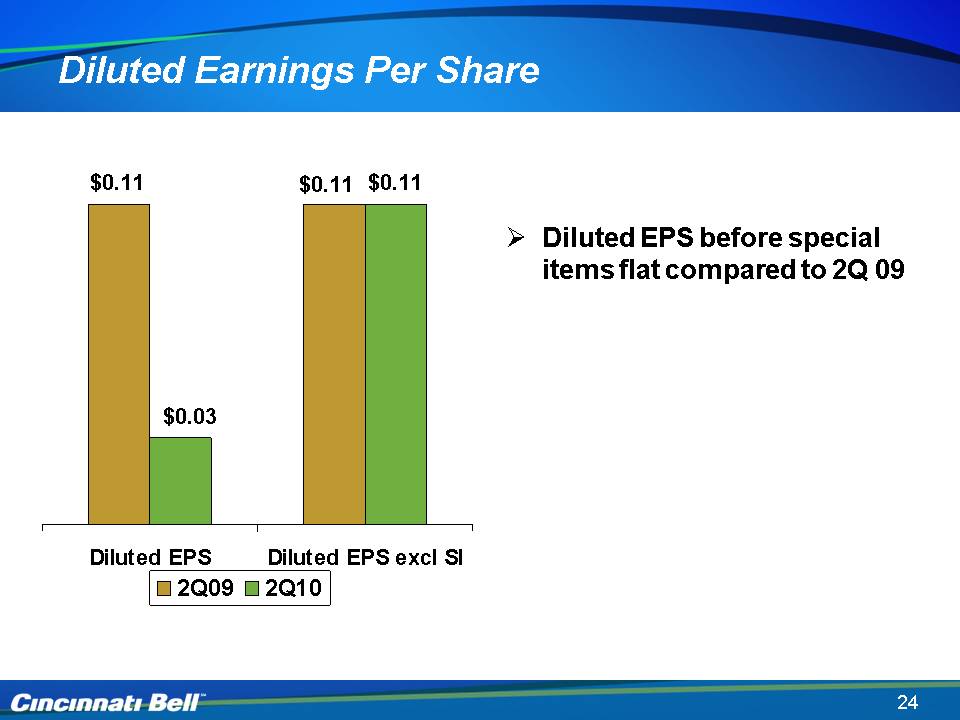
Diluted Earnings Per Share Diluted EPS before special items flat compared to 2Q 09
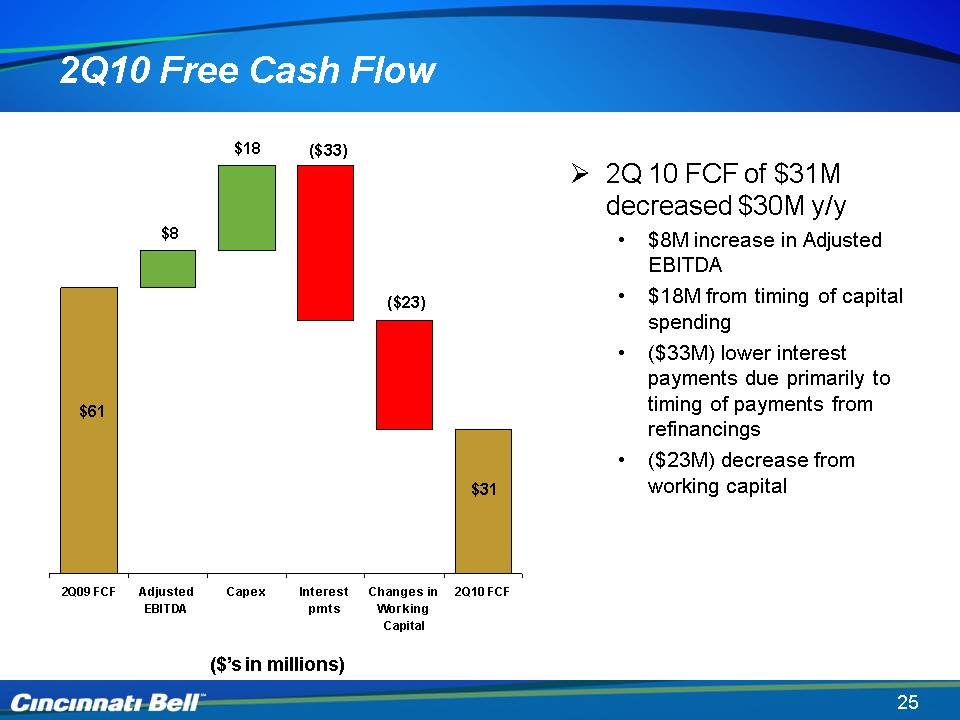
2Q 10 FCF of $31M decreased $30M y/y $8M increase in Adjusted EBITDA $18M from timing of capital spending ($33M) lower interest payments due primarily to timing of payments from refinancing ($23M) decrease from working capital
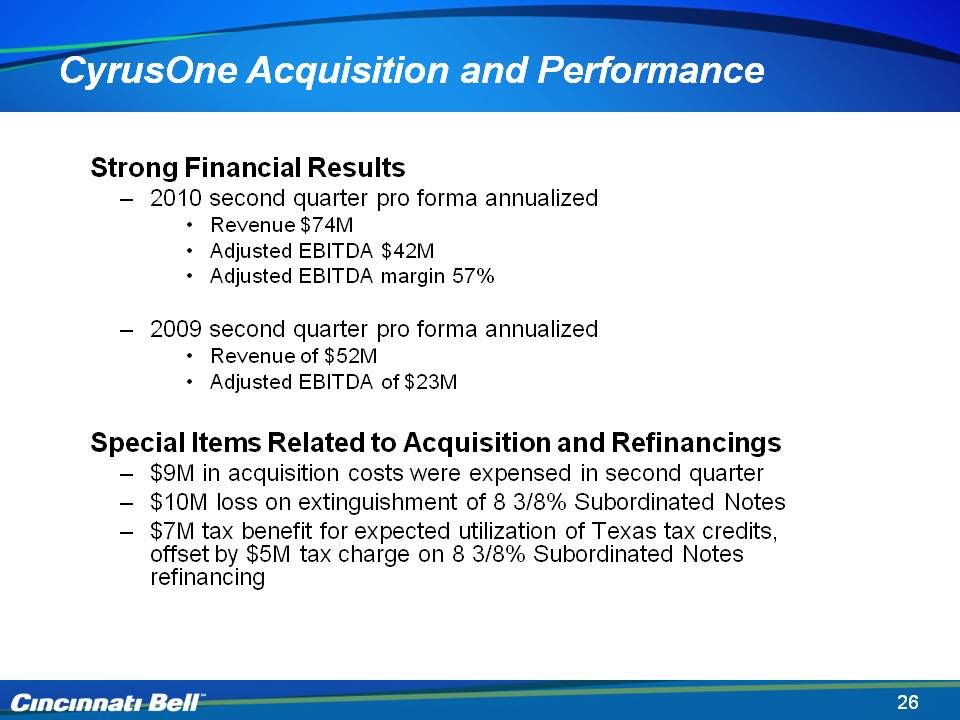
Strong Financial ResultsLast Quarter Pro Forma Annualized (unaudited)(1): Revenue $74M Adjusted EBITDA $42M Adjusted EBITDA margin 57% 2009 second quarter pro forma annualized Revenue of $52M Adjusted EBITDA of $25MAnnual revenue growth rate during past 4 years of approximately 60% CyrusOne Performance (1) For the quarter ended June 30, 2010tax credits $23M
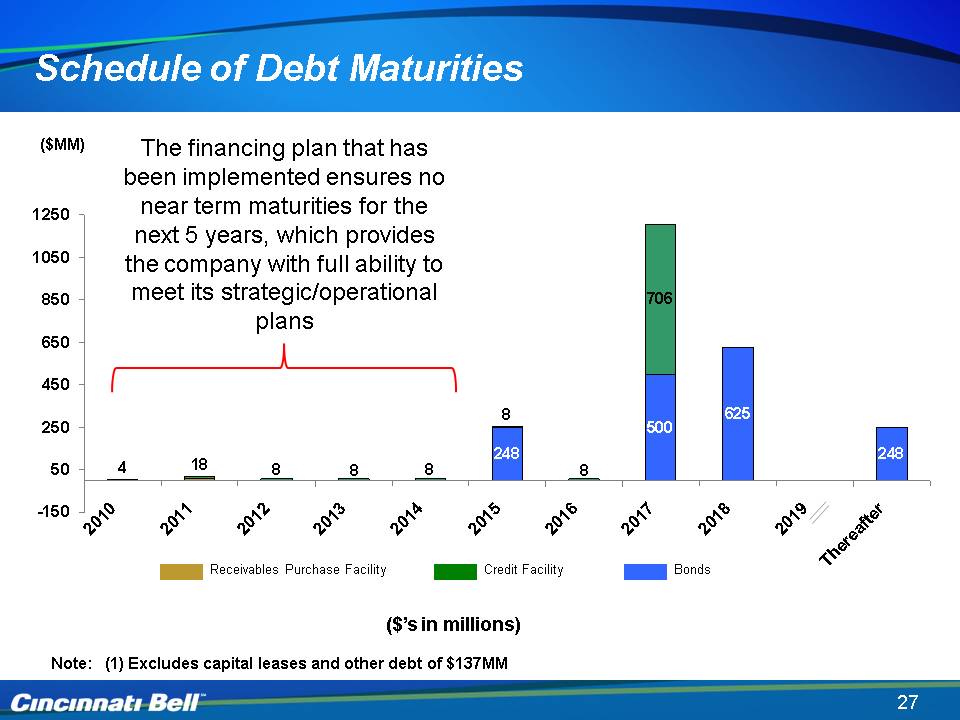
($MM) Schedule of Debt Maturities ($’s in millions) (Gp:) Receivables Purchase Facility (Gp:) Bonds (Gp:) Credit Facility Note: (1) Excludes capital leases and other debt of $137MM The financing plan that has been implemented ensures no near term maturities for the next 5 years, which provides the company with full ability to meet its strategic/operational plans
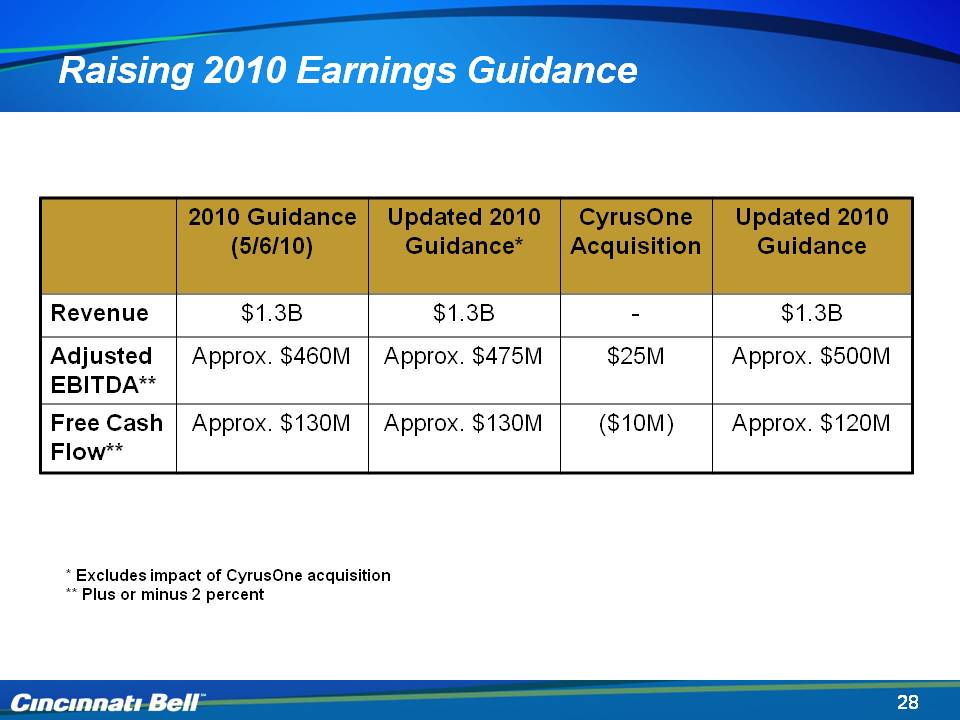
Raising 2010 Earnings Guidance * Excludes impact of CyrusOne acquisition ** Plus or minus 2 percent ***Does not include up to $70M of success-based capital expendituresApprox. $130M ($10M)

Cincinnati Bell 2nd Quarter 2010 Review August 4, 2010

Non-GAAP Reconciliations (please refer to the Earnings Financials)