Attached files
| file | filename |
|---|---|
| EX-23.1 - CONSENT OF KPMG LLP, INDEPENDENT REGISTERED PUBLIC ACCOUNTING FIRM - TRIPWIRE INC | dex231.htm |
Table of Contents
As filed with the Securities and Exchange Commission on July 30, 2010
Registration No. 333-167184
UNITED STATES
SECURITIES AND EXCHANGE COMMISSION
Washington, D.C. 20549
Amendment No. 2
to
Form S-1
REGISTRATION STATEMENT
Under
The Securities Act of 1933
TRIPWIRE, INC.
(Exact name of Registrant as specified in its charter)
| Delaware | 7372 | 91-1826027 | ||
| (State or other jurisdiction of incorporation or organization) |
(Primary Standard Industrial Classification Code Number) |
(I.R.S. Employer Identification Number) |
101 SW Main Street, Suite 1500
Portland, Oregon 97204
(503) 276-7500
(Address, including zip code, and telephone number, including area code, of Registrant’s principal executive offices)
James B. Johnson
President and Chief Executive Officer
Tripwire, Inc.
101 SW Main Street, Suite 1500
Portland, Oregon 97204
(503) 276-7500
(Name, address, including zip code, and telephone number, including area code, of agent for service)
Copies to:
| Roy W. Tucker, Esq. David S. Matheson, Esq. Perkins Coie LLP 1120 NW Couch Street, Tenth Floor Portland, Oregon 97209-4128 (503) 727-2000 |
Patrick J. Schultheis, Esq. Nathaniel P. Gallon, Esq. Wilson Sonsini Goodrich & Rosati Professional Corporation 701 Fifth Avenue, Suite 5100 Seattle, Washington 98104 (206) 883-2500 |
Approximate date of commencement of proposed sale to the public: As soon as practicable after this Registration Statement becomes effective.
If any of the securities being registered on this Form are to be offered on a delayed or continuous basis pursuant to Rule 415 under the Securities Act of 1933, check the following box. ¨
If this Form is filed to register additional securities for an offering pursuant to Rule 462(b) under the Securities Act of 1933, check the following box and list the Securities Act registration statement number of the earlier effective registration statement for the same offering. ¨
If this Form is a post-effective amendment filed pursuant to Rule 462(c) under the Securities Act of 1933, check the following box and list the Securities Act registration statement number of the earlier effective registration statement for the same offering. ¨
If this Form is a post-effective amendment filed pursuant to Rule 462(d) under the Securities Act of 1933, check the following box and list the Securities Act registration statement number of the earlier effective registration statement for the same offering. ¨
Indicate by check mark whether the registrant is a large accelerated filer, an accelerated filer, a non-accelerated filer, or a smaller reporting company. See the definitions of “large accelerated filer,” “accelerated filer” and “smaller reporting company” in Rule 12b-2 of the Exchange Act. (Check one):
| Large accelerated filer ¨ | Accelerated filer ¨ | Non-accelerated filer x | Smaller reporting company ¨ |
(Do not check if a smaller reporting company)
The registrant hereby amends this Registration Statement on such date or dates as may be necessary to delay its effective date until the registrant shall file a further amendment which specifically states that this Registration Statement shall thereafter become effective in accordance with Section 8(a) of the Securities Act of 1933 or until the Registration Statement shall become effective on such date as the Securities and Exchange Commission, acting pursuant to said Section 8(a), may determine.
Table of Contents
The information in this prospectus is not complete and may be changed. We and the selling stockholders may not sell these securities until the registration statement filed with the Securities and Exchange Commission is effective. This prospectus is not an offer to sell these securities, and we and the selling stockholders are not soliciting an offer to buy these securities in any jurisdiction where the offer or sale is not permitted.
SUBJECT TO COMPLETION, DATED JULY 30, 2010
Preliminary Prospectus
shares

Common Stock
This is the initial public offering of shares of common stock of Tripwire, Inc. Prior to this offering, there has been no public market for our common stock. We are offering shares, and the selling stockholders identified in this prospectus are offering shares of our common stock. We will not receive any proceeds from the sale of shares of common stock by the selling stockholders. The initial public offering price is expected to be between $ and $ per share.
We have applied to list our common stock on the Nasdaq Global Market under the symbol “TPWR.”
Investing in our common stock involves a high degree of risk. Please read “Risk Factors” beginning on page 10.
| Per Share | Total | |||||
| Initial public offering price |
$ | $ | ||||
| Underwriting discounts and commissions |
$ | $ | ||||
| Proceeds to Tripwire, Inc., before expenses |
$ | $ | ||||
| Proceeds to selling stockholders, before expenses |
$ | $ | ||||
To the extent the underwriters sell more than shares of common stock, we and the selling stockholders have granted the underwriters an option to purchase up to additional shares of common stock, at the initial public offering price less the underwriting discounts and commissions, to cover any over-allotments. The underwriters may exercise this option at any time within 30 days of the date of this prospectus.
Neither the Securities and Exchange Commission nor any state securities commission has approved or disapproved of these securities or determined if this prospectus is truthful or complete. Any representation to the contrary is a criminal offense.
The underwriters expect to deliver the shares of common stock to purchasers on , 2010.
| J. P . Morgan | Stifel Nicolaus Weisel | |
| Needham & Company, LLC | RBC Capital Markets | |
, 2010
Table of Contents

Table of Contents
|
|

Table of Contents
| Page | ||
| 1 | ||
| 10 | ||
| Special Note Regarding Forward-Looking Statements and Industry Data |
32 | |
| 33 | ||
| 33 | ||
| 34 | ||
| 36 | ||
| 38 | ||
| Management’s Discussion and Analysis of Financial Condition and Results of Operations |
42 | |
| 73 | ||
| 93 | ||
| 99 | ||
| 109 | ||
| 112 | ||
| 114 | ||
| 117 | ||
| 121 | ||
| Material U.S. Federal Income and Estate Tax Consequences to Non-U.S. Holders |
123 | |
| 126 | ||
| 130 | ||
| 130 | ||
| 130 | ||
| F-1 |
You should rely only on the information contained in this prospectus or in any free writing prospectus prepared by or on behalf of us and delivered or made available to you. Neither we, the selling stockholders nor the underwriters have authorized anyone to provide you with information that is different from that contained in this prospectus or any such free writing prospectus. We and the selling stockholders are offering to sell, and seeking offers to buy, shares of common stock only in jurisdictions where offers and sales are permitted. The information in this prospectus is accurate only as of the date of this prospectus, regardless of the time of delivery of this prospectus or of any sale of our common stock. Our business, financial condition, results of operations and prospects may have changed since that date.
No action is being taken in any jurisdiction outside the United States to permit a public offering of our common stock or possession or distribution of this prospectus in that jurisdiction. Persons who come into possession of this prospectus in a jurisdiction outside the United States are required to inform themselves about and to observe any restrictions as to this offering and the distribution of this prospectus applicable to that jurisdiction.
Until , 2010, all dealers that buy, sell or trade in our common stock, whether or not participating in this offering, may be required to deliver a prospectus. This is in addition to the dealers’ obligation to deliver a prospectus when acting as underwriters and with respect to their unsold allotment or subscriptions.
Table of Contents
The following summary highlights information contained elsewhere in this prospectus. It does not contain all of the information you should consider before investing in our common stock. You should also read the more detailed information set out in this prospectus, including our financial statements and related notes and the discussion of risks of investing in our common stock set forth in the section entitled “Risk Factors.”
Tripwire, Inc.
Tripwire is a leading provider of IT security and compliance automation software solutions that help protect physical and virtual IT infrastructure, prove compliance and prevent outages for enterprises and government agencies worldwide. Our software intelligently identifies on a real-time basis security threats and compliance breaches, often otherwise undetected for months, by tracking high volumes of changes and events across an organization’s IT infrastructure, automatically analyzing this data to identify security threats and compliance breaches, and helping remediate these issues. Our software provides a cost-effective alternative to more narrowly focused “point” solutions that typically require manual and resource-intensive efforts to keep pace with growing security and compliance requirements. Our customers span a broad range of industries, including retail and hospitality, financial services, energy, media and communications, transportation and government and defense. Our customers include organizations such as AXA Financial, bwin Interactive Entertainment AG, Federal National Mortgage Association (Fannie Mae), Federal Express Corporation, PepsiCo and The Walt Disney Company. These customers are among our top 30 active accounts based on cumulative sales to the customer since our inception. As of June 30, 2010, we had sold our products and services to over 5,500 customers in 88 countries worldwide, including 45% of the Fortune 500, 27 of 30 U.S. federal government executive branch agencies, and many other domestic and foreign governments.
Our Tripwire VIA software suite, which integrates our Tripwire Enterprise and Tripwire Log Center product families, facilitates continuous protection against security threats and ongoing compliance with regulatory requirements. Our flagship product, Tripwire Enterprise, helps organizations achieve and maintain a secure and compliant IT infrastructure by immediately detecting, assessing and reporting file and configuration changes. Tripwire Log Center, our recently-introduced log and security event management solution, helps organizations detect security breaches and compliance violations by performing real-time correlation analysis on high volumes of disparate log and security data and efficiently stores the data for reporting and compliance purposes. In addition, we believe we offer the largest IT policy library, addressing over 250 regulations, standards and best practices that can be applied to more than 150 different technology platforms and providing over 89,000 compliance tests.
IT infrastructure is critical to almost every function within enterprises and government agencies. Security threats to IT infrastructure continue to increase in number and severity, and evolve with greater sophistication in parallel to the growing complexity of IT infrastructure. Threats come from cyber-criminals, foreign governments, malicious internal users and inadvertent internal errors. These attacks and errors can cause significant economic loss, impairment of critical infrastructure, the loss of valuable data and reputational damage. Current trends that move digital assets and data to virtual environments increase the difficulty of securing IT infrastructure. Governments, businesses and industry organizations have responded with a growing number of laws, regulations and policies, many of which impose burdensome compliance requirements on companies and, in particular, their IT personnel. Audit failures or findings of non-compliance can lead to significant fines or an inability to engage in core business activities. As IT infrastructures become more complex, distributed and dynamic, maintaining security and compliance is increasingly challenging and expensive.
We believe that the need for IT security and compliance automation solutions presents a significant and growing market opportunity. In October 2009, International Data Corporation (IDC), an independent technology research firm, estimated that worldwide revenue for the security and vulnerability management (SVM) market, our primary target market, exceeded $2.6 billion in 2008 and is projected to grow to nearly $4.4 billion in 2013,
1
Table of Contents
representing a compound annual growth rate of 10.8% from 2008. In addition, we believe that our products address certain needs of the change and configuration management software market and the software segment of the governance, risk and compliance (GRC) infrastructure market. We also believe that our opportunities with enterprises and government agencies will be enhanced by the growing adoption of virtualization, the emergence of cloud computing and other technology trends that increase demand for broad and integrated IT infrastructure protection and automation, and by regulatory trends requiring more transparency and information in order to prove compliance.
We have had six consecutive years of revenue growth and positive operating cash flows. For the six months ended June 30, 2010, we recorded operating income of $0.6 million and generated $2.4 million of cash from our operating activities. For 2007, 2008, 2009 and the six months ended June 30, 2010, we generated revenue of $49.2 million, $62.4 million, $74.0 million and $40.1 million, respectively, of which approximately 22%, 29%, 24% and 26%, respectively, was generated from customers outside of the United States. For the same periods, our Adjusted EBITDA was $0.5 million, $5.3 million, $10.0 million and $1.7 million, respectively. For a discussion of Adjusted EBITDA, which is a non-GAAP financial measure, and a reconciliation of net income to Adjusted EBITDA, please read note 3 to the tables included in “Selected Consolidated Financial Data.”
Organizations Continue to Face Significant Security and Compliance Challenges
The approaches organizations use to address the complex security risks of IT infrastructure and growing compliance requirements have significant limitations and present organizations with challenges, including:
| • | Attacks and Breaches Can Go Undetected for Months. Many organizations are exposed to unknown threats because they lack the ability and personnel to collect and evaluate threat, event and change information. Even when all the data can be collected, there is often too much of it for an organization to effectively and timely analyze and interpret using existing point solutions and manual methods. |
| • | Existing Approaches to Security and Compliance Automation are Not Cost-Effective. Approaches using available point solutions are slow, relatively ineffective and labor-intensive. The time and effort required to audit an organization’s IT infrastructure, separate real threats from non-threatening changes, and remediate identified problems can impose substantial burdens on IT personnel and infrastructure and can result in high recurring costs. Some organizations engage expensive outside service providers and IT consultants to address these challenges. |
| • | Applying Regulations and Compliance Policies to IT Infrastructure Requires Expertise. The translation of regulations into actionable IT procedures and rules is costly, complex and time consuming, and significant expertise is required to understand these regulations, standards and policies and their impact on the IT infrastructure. |
| • | Achieving and Maintaining Compliance is Difficult. The solutions used by organizations to achieve compliance generally offer relatively limited functionality and fail to address continuous compliance requirements. This may result in continued security breaches, compliance violations and fines despite an organization’s belief that it is compliant. |
Our Solution
We have designed our products and services to provide a broad, integrated and automated solution that helps enterprises and government agencies meet the challenges of making IT infrastructure secure and compliant. Our Tripwire VIA software suite provides visibility across the IT infrastructure, intelligently identifies security threats and compliance breaches, and automates security and compliance processes to reduce risk and cost. The Tripwire VIA software suite helps customers cost-effectively reduce the security breach-to-detection time gap and address the issue of siloed data residing in disparate security and systems management tools.
2
Table of Contents
Our solution addresses organizations’ IT security and compliance challenges by enabling them to:
| • | Intelligently Identify Threats and Changes that Matter Most in a Timely Manner. Our solution continuously analyzes relationships among large amounts of data from disparate IT systems to significantly reduce the time between breach and discovery. Our solution uses numerous methods to automatically distinguish between “good” and “bad” changes or events and identify real threats. |
| • | Cost-effectively Address Key IT Security and Compliance Needs by Providing an Integrated Solution. We enable our customers to use fewer solutions and services and eliminate significant manual efforts to achieve compliance in a cost-effective manner. We provide an integrated solution that identifies and helps correct security vulnerabilities and non-compliant configurations, speeds the investigation of security incidents, and reduces the costs associated with demonstrating compliance. |
| • | Accelerate Implementation of IT Compliance Processes through an Extensive Security and Compliance Policy Library. We believe we offer the largest IT policy library, addressing over 250 regulations, standards and best practices across more than 150 different technology platforms and providing over 89,000 compliance tests. |
| • | Achieve and Maintain Continuous Compliance through Real-time Technology. Our solution immediately detects threats and vulnerabilities in the IT infrastructure, assesses compliance with known standards and best practices and proactively helps customers achieve and maintain a known and trusted state. Our real-time technology is event-based and provides continuous visibility into security and compliance as changes occur. |
| • | Implement Enterprise-class Technology that is Easy-to-use, Scalable and Flexible. We design our solution to serve organizations of all sizes, including large, global organizations that have complex, dynamic, geographically-dispersed and heterogeneous IT infrastructures, as well as those that rely heavily on cloud-based and virtual infrastructures. Our solution is downloadable and designed to simplify installation and implementation by IT personnel. |
Our Growth Strategy
Our objective is to be the leading provider of enterprise-class IT security and compliance automation software solutions. Key elements of our strategy to achieve this objective include:
| • | Continue to Innovate and Expand Our Product Offerings. We intend to add new product functionality, expand our library of compliance policies, and enhance our solutions to provide additional virtualization-related functionality and support cloud computing environments. |
| • | Grow Our Customer Base. We plan to pursue new customers in industry verticals where we have significant expertise, as well as in new verticals where growing security threats and regulatory requirements create demand for our solutions. |
| • | Increase Sales to Our Existing Customer Base. We believe we have a significant opportunity to increase our sales to existing customers by automating compliance of more of their IT systems, pursuing product upgrades and sales of new offerings, and targeting additional business units and broad enterprise deployments within these customers’ organizations. |
| • | Strengthen and Expand our International Presence. We plan to selectively target geographic regions where the number and scope of security risks and compliance regulations continue to increase. We intend to rely primarily on channel partners to expand our international presence. |
| • | Increase Sales to Governments. We plan to increase our sales to U.S. and foreign public sector organizations by continuing to build additional functionality into our products and invest in certifications necessary to do business with some government agencies. |
3
Table of Contents
| • | Selectively Pursue Acquisitions. We plan to selectively pursue acquisitions of businesses and technologies that complement our integrated IT security and compliance automation offerings. |
Risk Factors
Our business is subject to numerous risks, which are described in the “Risk Factors” section of this prospectus, beginning on page 10.
Corporate Information
Tripwire, Inc. was incorporated in Delaware in September 1997. Our principal executive offices are located at 101 SW Main Street, Suite 1500, Portland, Oregon 97204, and our telephone number is (503) 276-7500. Our website address is www.tripwire.com. Information contained on, or that can be accessed through, our website does not constitute part of this prospectus.
In this prospectus, unless indicated otherwise, references to “Tripwire,” “the company,” “we,” “us” and “our” refer to Tripwire, Inc. and its subsidiaries.
“Tripwire,” “ChangeIQ,” “Tripwire VIA” and the Tripwire logo are trademarks of Tripwire. Other trademarks and trade names referred to in this prospectus are the property of their respective owners.
4
Table of Contents
The Offering
| Common stock offered by us |
shares | |
| Common stock offered by selling stockholders |
shares | |
| Over-allotment option |
We and the selling stockholders have granted the underwriters an option to purchase up to an additional shares of common stock to cover any over-allotments. The underwriters may exercise this option at any time within 30 days of the date of this prospectus. | |
| Common stock to be outstanding after this offering |
shares | |
| Use of proceeds |
We plan to use the net proceeds from this offering for general corporate purposes, including working capital. We may also use a portion of our net proceeds to acquire or make investments in complimentary products, technologies or businesses. We will not receive any of the proceeds from the sale of shares of common stock by the selling stockholders. Please read “Use of Proceeds.” | |
| Proposed Nasdaq Global Market symbol |
“TPWR” | |
| Risk Factors |
Please read “Risk Factors” beginning on page 10 of this prospectus and the other information in this prospectus for a discussion of the risks you should consider before deciding to invest. | |
The number of shares outstanding after this offering is based on 52,565,725 shares of our common stock outstanding as of July 26, 2010 after giving effect to the conversion of our convertible preferred stock into an aggregate of 36,484,920 shares of our common stock and, unless otherwise indicated, excludes as of that date:
| • | 834,373 shares of common stock available for issuance under our 2000 Stock Option/Stock Issuance Plan, which shares, to the extent they remain available for issuance, will cease to be available for issuance under our 2000 Stock Option/Stock Issuance Plan and become available for issuance under our 2010 Incentive Plan effective upon the closing of this offering; |
| • | 16,113,231 shares of common stock issuable upon exercise of outstanding stock options at a weighted- average exercise price of $0.91 per share granted under our 2000 Stock Option/Stock Issuance Plan or our 1998 Stock Option Plan (including shares we expect to be sold in this offering by certain selling stockholders upon the exercise of vested stock options prior to the closing of this offering), which shares, to the extent such stock options expire unexercised following this offering, will again become available for issuance under our 2010 Incentive Plan; |
| • | 200,000 shares of common stock issuable upon exercise of outstanding stock options at an exercise price of $0.50 per share granted outside of our equity compensation plans as a charitable donation; |
| • | 4,340,250 shares of common stock, subject to increase on an annual basis, reserved for issuance under our 2010 Incentive Plan, which will become effective upon the closing of this offering; and |
5
Table of Contents
| • | 308,559 shares of common stock issuable upon exercise of outstanding warrants at a weighted-average exercise price of $2.07 per share, giving effect to the conversion of warrants to purchase shares of our preferred stock into warrants to purchase shares of our common stock, which conversion will occur prior to the closing of this offering. |
Unless otherwise indicated, all information in this prospectus reflects or assumes the following:
| • | a -for- reverse split of our common stock and preferred stock to be effected prior to the effectiveness of the registration statement of which this prospectus forms a part; |
| • | the conversion of all outstanding shares of our convertible preferred stock into an aggregate of 36,484,920 shares of our common stock effective immediately prior to the closing of this offering; |
| • | the conversion of all outstanding warrants to purchase shares of our convertible preferred stock into warrants to purchase an aggregate of 108,559 shares of our common stock prior to the closing of this offering; |
| • | no exercise by the underwriters of their over-allotment option; |
| • | no exercise of stock options or warrants outstanding as of July 26, 2010; and |
| • | the filing of our amended and restated certificate of incorporation in connection with the closing of this offering. |
6
Table of Contents
Summary Consolidated Financial Data
The following tables summarize consolidated financial data for the periods indicated. We have derived the following consolidated statement of operations data for the years ended December 31, 2007, 2008 and 2009 from our audited consolidated financial statements included elsewhere in this prospectus. We have derived the following consolidated statement of operations data for the six months ended June 30, 2009 and 2010 and the consolidated balance sheet data as of June 30, 2010 from our unaudited consolidated financial statements included elsewhere in this prospectus. The unaudited interim consolidated financial statements have been prepared on the same basis as the audited annual consolidated financial statements, and in the opinion of management, reflect all adjustments, which include only normally recurring adjustments, necessary to present fairly our financial position as of June 30, 2010 and the results of operations and cash flows for the six months ended June 30, 2009 and June 30, 2010. The results of the six months ended June 30, 2010 are not necessarily indicative of the results to be expected for the year ending December 31, 2010 or for any other interim period or for any other future year. You should read this information together with our consolidated financial statements and related notes and the information under “Selected Consolidated Financial Data” and “Management’s Discussion and Analysis of Financial Condition and Results of Operations” contained elsewhere in this prospectus. Our historical results are not necessarily indicative of our results to be expected in any future period.
7
Table of Contents
Consolidated Statements of Operations
| Year Ended December 31, | Six Months Ended June 30, | |||||||||||||||||||
| 2007 | 2008 | 2009 | 2009 | 2010 | ||||||||||||||||
| (unaudited) | ||||||||||||||||||||
| (in thousands, except per share data) | ||||||||||||||||||||
| Revenue: |
||||||||||||||||||||
| Software licenses |
$ | 25,976 | $ | 32,480 | $ | 37,289 | $ | 15,580 | $ | 18,261 | ||||||||||
| Maintenance and professional services |
23,207 | 29,899 | 36,717 | 16,874 | 21,824 | |||||||||||||||
| Total revenue |
49,183 | 62,379 | 74,006 | 32,454 | 40,085 | |||||||||||||||
| Cost of revenue: |
||||||||||||||||||||
| Software licenses |
167 | 172 | 109 | 52 | 37 | |||||||||||||||
| Maintenance and professional services |
5,857 | 6,917 | 7,991 | 3,768 | 5,318 | |||||||||||||||
| Total cost of revenue (1) |
6,024 | 7,089 | 8,100 | 3,820 | 5,355 | |||||||||||||||
| Gross profit |
43,159 | 55,290 | 65,906 | 28,634 | 34,730 | |||||||||||||||
| Operating expenses: |
||||||||||||||||||||
| Research and development (1) |
9,868 | 12,618 | 12,550 | 6,433 | 7,100 | |||||||||||||||
| Sales and marketing (1) |
28,640 | 32,391 | 39,130 | 17,262 | 22,796 | |||||||||||||||
| General and administrative (1) |
5,016 | 6,062 | 5,627 | 2,392 | 4,229 | |||||||||||||||
| Total operating expenses |
43,524 | 51,071 | 57,307 | 26,087 | 34,125 | |||||||||||||||
| Income (loss) from operations |
(365 | ) | 4,219 | 8,599 | 2,547 | 605 | ||||||||||||||
| Other income (expense), net |
493 | 307 | 7 | 74 | 1 | |||||||||||||||
| Income (loss) before income taxes |
128 | 4,526 | 8,606 | 2,621 | 606 | |||||||||||||||
| Income tax benefit (expense) |
(147 | ) | 1,330 | 10,977 | (651 | ) | (126 | ) | ||||||||||||
| Net income |
(19 | ) | 5,856 | 19,583 | 1,970 | 480 | ||||||||||||||
| Accretion and allocation to participating preferred stock |
(485 | ) | (4,197 | ) | (13,868 | ) | (1,396 | ) | (337 | ) | ||||||||||
| Net income (loss) attributable to common stockholders |
$ | (504 | ) | $ | 1,659 | $ | 5,715 | $ | 574 | $ | 143 | |||||||||
| Net income (loss) per common share—basic |
$ | (0.03 | ) | $ | 0.11 | $ | 0.39 | $ | 0.04 | $ | 0.01 | |||||||||
| Net income (loss) per common share—diluted |
$ | (0.03 | ) | $ | 0.11 | $ | 0.32 | $ | 0.04 | $ | 0.01 | |||||||||
| Shares used in computation of net income (loss) per common share: |
||||||||||||||||||||
| Basic |
14,434 | 14,516 | 14,762 | 14,726 | 15,449 | |||||||||||||||
| Diluted |
14,434 | 14,963 | 18,119 | 15,101 | 22,422 | |||||||||||||||
| Pro forma net income (loss) per common share (unaudited): (2) |
||||||||||||||||||||
| Basic |
$ | 0.39 | $ | 0.01 | ||||||||||||||||
| Diluted |
$ | 0.36 | $ | 0.01 | ||||||||||||||||
| Shares used in computation of pro forma net income (loss) per common share (unaudited): (2) |
||||||||||||||||||||
| Basic |
50,580 | 51,934 | ||||||||||||||||||
| Diluted |
53,937 | 58,907 | ||||||||||||||||||
| Other data (unaudited): |
||||||||||||||||||||
| Adjusted EBITDA (3) |
$ | 513 | $ | 5,277 | $ | 9,991 | $ | 3,165 | $ | 1,747 | ||||||||||
8
Table of Contents
Consolidated Balance Sheet Data
| As of June 30, 2010 | |||||||||
| Actual | Pro Forma (2) | Pro Forma as Adjusted (4) | |||||||
| (unaudited) | |||||||||
| (in thousands) | |||||||||
| Cash and cash equivalents |
$ | 34,491 | $ | 34,491 | $ | ||||
| Working capital (5) |
24,052 | 24,052 | |||||||
| Total assets |
72,854 | 72,854 | |||||||
| Deferred revenue (current and non-current) |
28,183 | 28,183 | |||||||
| Long-term debt |
— | — | |||||||
| Total stockholders’ equity |
35,472 | 35,472 | |||||||
| (1) | Includes stock-based compensation as follows: |
| Year Ended December 31, | Six Months Ended June 30, | ||||||||||||||
| 2007 | 2008 | 2009 | 2009 | 2010 | |||||||||||
| (unaudited) | |||||||||||||||
| (in thousands) | |||||||||||||||
| Cost of revenue |
$ | 6 | $ | 8 | $ | 13 | $ | 6 | $ | 12 | |||||
| Research and development |
7 | 15 | 30 | 12 | 34 | ||||||||||
| Sales and marketing |
56 | 58 | 72 | 32 | 92 | ||||||||||
| General and administrative |
74 | 73 | 36 | 21 | 135 | ||||||||||
| Total stock-based compensation |
$ | 143 | $ | 154 | $ | 151 | $ | 71 | $ | 273 | |||||
| (2) | Reflects on a pro forma basis the conversion of all outstanding shares of our convertible preferred stock as of June 30, 2010 into 36,484,920 shares of our common stock immediately prior to the closing of this offering. |
| (3) | We define Adjusted EBITDA as net income plus other income (expense), net, income tax expense (benefit), depreciation and amortization, and stock-based compensation expense. Adjusted EBITDA is a financial measure that is not calculated in accordance with generally accepted accounting principles (GAAP). Adjusted EBITDA should not be considered as an alternative to net income, operating income or any other measure of financial performance calculated and presented in accordance with GAAP. Our Adjusted EBITDA may not be comparable to similarly titled measures of other organizations because other organizations may not calculate Adjusted EBITDA in the same manner as we do. For additional information about our use of Adjusted EBITDA, please read note 3 to the tables included in “Selected Consolidated Financial Data” in this prospectus. |
| (4) | Reflects on a pro forma basis the conversion described in note 3 above and, on an adjusted basis, the receipt by us of the estimated net proceeds from the sale of shares of common stock by us in this offering at an assumed initial public offering price of $ per share (the midpoint of the range listed on the cover page of this prospectus), after deducting the underwriting discounts and commissions and estimated offering expenses payable by us. |
| (5) | Working capital represents current assets minus current liabilities. |
9
Table of Contents
An investment in our common stock involves a high degree of risk. You should carefully consider the following risk factors and all other information contained in this prospectus before purchasing our common stock. Any of these risks could harm our business, operating results, financial condition and prospects. In addition, the trading price of our common stock could decline and you may lose some or all of your investment. Please read “Special Note Regarding Forward-Looking Statements and Industry Data.”
Risks Related to Our Business and Industry
In recent periods our revenue has depended upon sales of our Tripwire Enterprise product family, and a decrease in sales, or in the growth rate of sales, of this product would harm our business.
Sales of our Tripwire Enterprise product family and related maintenance and professional services generated approximately 90% and 86% of our revenue in 2009 and the six months ended June 30, 2010, respectively, and we expect that we will continue to depend substantially on revenue from sales of Tripwire Enterprise for the foreseeable future. Demand for Tripwire Enterprise is affected by a number of factors, many of which are beyond our control, including the timing of development and release of new products by us and our competitors, technological change and other risks described in this section. Key factors that have fostered demand for our Tripwire Enterprise products and services and that we consider to be key factors for our future growth include increasing security threats to, and breaches of, IT systems and related data and increasing volumes of, and obligations under, laws, regulations and policies applicable to market segments in which many of our customers operate for which IT systems are required to demonstrate compliance. Any decrease in the level or magnitude of such threats, breaches or legal or regulatory actions and compliance requirements, including any changes in laws or regulations that simplify, consolidate or eliminate legal or regulatory compliance requirements, or any decrease in the pace of such increases, could lead to a decrease in demand for our Tripwire Enterprise products. Any decrease in the sales or growth rate of sales of our Tripwire Enterprise products for these or any other reasons could be contrary to our, analysts’ or investors’ expectations, and would result in harm to our business, operating results and financial condition, and a decline in our stock price.
If our recently-introduced Tripwire Log Center product does not achieve broad market acceptance or perform to market expectations, our revenue growth may be limited and our business may be harmed.
In January 2010, we formally launched our Tripwire Log Center product for log and security event management, which, together with our Tripwire Enterprise product, constitutes our Tripwire VIA software suite. We are devoting significant effort and resources in further developing and marketing Tripwire Log Center and our Tripwire VIA software suite. If Tripwire Log Center does not achieve broad market acceptance and its sales and those of our Tripwire VIA software suite are limited, our business will continue to depend primarily on sales of our Tripwire Enterprise product in the near-term, limiting our total revenue growth. In addition, if Tripwire Log Center does not perform to market expectations, it could harm our brand and reputation.
We face intense competition in our markets, especially from larger, better-known companies, and we may lack sufficient financial or other resources to maintain or improve our competitive position.
The market for IT security and compliance software products is rapidly evolving and intensely competitive, and we expect competition to increase in the future. A significant number of companies have developed, or are developing, products and increased functionalities that currently, or are expected to, compete with some or all of our products and services. For example, competitors are increasingly including compliance functionality within their solutions. Our recent entry into the log and security event management market with our Tripwire Log Center product has expanded the number of companies with which we compete and increased our profile in our markets, which may result in greater or more targeted competition against us.
10
Table of Contents
We currently face competition in several broad categories, including file integrity monitoring, policy compliance, log management and security event management. Within these categories, we compete with suppliers such as HP, IBM, McAfee, RSA (the security division of EMC Corporation), BMC Software and Symantec, that offer broad product offerings covering these and other categories, as well as with smaller vendors such as ArcSight, LogLogic and Q1 Labs, that focus on specific functionalities by offering point solutions. Many of our historical competitors have been acquired by larger, publicly-traded companies trying to expand their solution suites, resulting in more direct competition from McAfee, BMC Software, EMC Corporation and its majority-owned, publicly-held subsidiary, VMware. We may not compete successfully against our current or future competitors, many of which have:
| • | significantly greater financial, technical, research and development and other resources; |
| • | greater brand recognition, domestically and internationally; |
| • | more customers and closer or broader relationships with customers, including with large enterprises, the federal government or foreign governments; and |
| • | broader product lines and sales channels. |
Competition may intensify as our existing competitors enter into business combinations or alliances and established companies in other market segments enter into our markets. In addition, competitors may introduce products that are more competitively priced, have greater performance or functionality or incorporate technological advances that we have not yet developed or implemented. Our existing and prospective customers may develop their own solutions, purchase competitive products, or engage third-party providers rather than purchase our products or services. Increased competition may reduce our market share, impair our growth prospects, require us to lower pricing for our products and services or otherwise harm our business and operating results.
We may not compete effectively with companies that integrate functionality or bundle products similar to ours with other product offerings.
Several large, integrated software companies and hardware vendors that sell software products that our customers and potential customers have broadly adopted may have a substantial advantage when they market and sell products to these customers that perform functions substantially similar to our products. Competitors that offer a large array of security or software products may be able to offer products or functionality similar to ours at a more attractive price than we can by integrating or bundling them with their other product offerings. The trend toward consolidation in our industry increases the likelihood of competition based on integration or bundling. Customers may also increasingly seek to consolidate their enterprise-level software purchases with a small number of larger vendors that purport to satisfy a broad range of their requirements. If we are unable to sufficiently differentiate our products from the integrated or bundled products of our competitors, such as by offering enhanced functionality, performance or value, demand for our products may decline, which would harm our business, operating results and financial condition.
Although we were profitable in 2008 and 2009, we had a net loss in 2007 and in the first quarter of 2010, and we may not be profitable in the future.
Because the market for our products and services is rapidly evolving, it is difficult for us to predict our operating results and the ultimate size of the markets for our products and services. We expect our operating expenses to increase over the next several years as we hire additional sales and marketing personnel, expand our channel sales program and develop our technology and new products. Our results of operations for the first quarter of 2010 reflect such increased expenses. In addition, as a public company, we will incur significant legal, accounting and other expenses that we do not incur as a private company. If our revenue does not increase sufficiently to offset increases in our operating expenses, we may not continue to be profitable and may suffer a net loss, as we did in 2007 and the first quarter of 2010. Even if we do maintain profitability, we may be unable to increase profitability on a consistent basis, which may result in a decline in our common stock price.
11
Table of Contents
Our revenue and growth can be difficult to accurately forecast and, if sales are less than expected, we may be unable to adjust our expense levels to avoid harm to our operating results.
Our sales cycle can be lengthy and often covers several months, particularly for larger transactions. Many customers evaluate our software at multiple levels within an organization, which often have different requirements and considerations that go beyond the functionality of our products and the quality and scope of our services, such as internal projections of business growth, capital budgets and anticipated costs. As a result, we devote substantial time and effort and incur significant upfront expense in our sales efforts without any assurance that our efforts will result in a customer purchase. Therefore, it often is difficult to predict when, or even if, we will make a sale with a potential customer. This difficulty may grow to the extent the size of our potential sales or the complexity of our solutions increases, which may lead to more intensive customer evaluations or may affect the accuracy of our historical forecasting methods. We have limited experience with selling our recently-introduced Tripwire Log Center product. The additions of the new Tripwire Log Center and our Tripwire VIA software suite to our product offerings may increase the sales cycle and otherwise adversely affect our ability to forecast our sales accurately.
Additionally, we make investment decisions and budget our expense levels based primarily on sales forecasts. Because a substantial portion of our expenses are relatively fixed in the short term, our operating results will be harmed if revenue falls below our expectations in a particular quarter, which could cause the price of our common stock to decline significantly.
Reliance on a concentration of sales at the end of the quarter could cause our revenue to fall below expected levels, resulting in a decline in our stock price.
Due largely to our focus on enterprise customers, historically we have often generated a substantial portion of a quarter’s license revenue during the last few weeks or days of the quarter. As the proportion of our total sales from larger transactions has grown and may continue to grow, so has the impact that such larger sales can have on our quarterly results. If expected revenue at the end of any given quarter is delayed until a subsequent quarter for any reason, including the failure of anticipated purchases to materialize, our revenue and results of operations for that quarter could fall below our expectations or those of securities analysts and investors, resulting in a decline in our stock price.
Our quarterly revenue and operating results have fluctuated in the past and may fluctuate and be difficult to predict in the future, and such fluctuations could adversely affect our stock price.
Our quarterly revenue and operating results have fluctuated significantly in the past and we believe they may continue to do so. As a result, you should not rely on the results of any one quarter or fiscal period as an indication of future performance and period-to-period comparisons of our revenue and operating results may not be meaningful.
Our quarterly operating results may fluctuate as a result of a variety of factors, including, among others, those described elsewhere in this section and those listed below, many of which are outside of our control:
| • | the timing and amount of customer and channel partner sales, particularly of large transactions; |
| • | our ability to retain existing customers, increase sales to existing customers and attract new customers; |
| • | our ability to retain and expand our network of channel partners, and to sell our products and services through these channel partners; |
| • | the timing and implementation of our growth strategy, including product improvements and new product introductions; |
| • | any pricing changes to our products or services; |
| • | actions by our competitors, including product introductions, pricing and other competitive factors; |
12
Table of Contents
| • | the level of demand for our products and services; |
| • | changes in the level (or perceived level) of security threats to or breaches of IT systems or the pace of new regulations for which IT systems are required to demonstrate compliance; |
| • | the mix of our direct and indirect sales and of the products and services we sell; |
| • | the historical seasonality of our operating results, with quarterly sales generally weakest for the first fiscal quarter and then increasing through the remaining three quarters; |
| • | the amount and timing of operating expenses and capital expenditures related to the expansion of our operations and infrastructure; |
| • | the timing of revenue and expenses related to the development or acquisition of technologies, products or businesses; |
| • | potential goodwill and intangible asset impairment charges and amortization associated with any acquired businesses; |
| • | potential foreign exchange gains and losses related to expenses and sales denominated in foreign currencies; |
| • | the outcome of any legal proceedings or claims; |
| • | insolvency or credit difficulties confronting our customers, affecting their ability to pay for our products and services; and |
| • | general economic, industry and market conditions that impact expenditures for IT security and compliance software in the United States and other countries where we sell our products and services. |
Fluctuations in our quarterly operating results could result in decreases in our stock price.
Failure to effectively expand and manage our sales operations and train our sales personnel could harm our ability to maintain and grow our customer base, achieve broader market acceptance of our products and services and enter new markets successfully.
Maintaining and increasing our customer base, achieving broader market acceptance of our products and services and successfully entering new markets will depend on our ability to effectively expand and manage our sales operations and train our sales personnel. To obtain new customers and sales, we rely on our inside and field direct sales forces and, to a lesser extent, channel partners such as resellers and system integrators. We have significantly expanded our direct sales force in recent years and plan to continue to do so domestically and internationally. In addition to training new sales personnel generally, we are continuing to train our entire sales force to effectively sell our recently-introduced Tripwire Log Center product. Our ability to achieve significant growth in revenue in the future, including growth from sales of new products, will depend in part on our success in recruiting, training and retaining sufficient numbers of direct sales personnel, and on the productivity of those personnel. Recent and planned personnel additions may not become as productive as we would like. Failure to expand and manage our sales operations effectively or in a cost-effective manner could harm our business, operating results and financial condition.
If we fail to maintain, further develop and manage our distribution channels, our revenue and growth prospects could be harmed, particularly in the United States public sector and international markets.
We derive a significant portion of our revenue from sales of our products and related services through channel partners, such as resellers and systems integrators. Resellers are an important source of sales for us in the United States public sector, as government agencies often rely on resellers to meet IT needs. A significant percentage of our sales to United States government agencies are made through two particular resellers. We also use resellers to augment our internal resources elsewhere, primarily in international markets. We expect that
13
Table of Contents
channel sales will represent a growing portion of our future revenue as we seek to expand our United States and international sales. The loss of any important channel partners, and our potential inability to promptly replace them could harm our business, operating results and financial condition. Our channel partners may cease marketing our products and services at any time and may do so with limited or no notice and with little or no penalty. We plan to continue to expand the number of our channel partners domestically and internationally. We may be unable to recruit additional channel partners and successfully and cost-effectively expand our distribution channel. Failure to successfully expand our distribution channel could harm our business and growth prospects, particularly in the United States public sector and international markets.
Our agreements with our channel partners generally are non-exclusive and many of our channel partners have established relationships with our competitors. If our channel partners do not effectively market and sell our products and services, if they put greater emphasis on their own products and services or those of our competitors, or if they fail to meet the needs of our customers, our ability to grow our business and sell our products and services may be harmed, particularly in the United States public sector and international markets. Similarly, any reduction or delay in our channel partners’ sales of our products and services or conflicts between channel sales and our direct sales and marketing activities could harm our business, operating results and financial condition. In addition, changes in the proportion of our revenue attributable to channel sales, which are more likely than direct sales to present collection concerns at the time of contract execution and product delivery, may cause our operating results to fluctuate from period to period.
We may be unsuccessful in our efforts to expand our international operations and sales.
In 2007, 2008, 2009 and the six months ended June 30, 2010, we derived approximately 22%, 29%, 24% and 26%, respectively, of our revenue from sales to customers outside the United States. We are seeking to expand our international sales and operations as part of our growth strategy. In certain international markets we have little or no operating experience, and the competitive environment in our existing markets may differ significantly from that in these new markets. Local companies or other competitors may have a substantial advantage because of their greater understanding of the local markets and brands that are more established locally. In addition, operating in international markets requires significant management attention and financial resources. The investment and additional resources required to establish, develop and maintain operations in other countries may not produce desired levels of revenue and profitability. As a result, we may not be successful in entering or competing in new markets, gaining customer acceptance there or operating profitably on a sustained basis. If we are unable to successfully expand our sales and operations internationally, it could harm our business, operating results and financial condition.
International sales and operations subject us to additional risks that can harm our business and operating results.
In addition to risks described elsewhere in this section, our international sales and operations may subject us to a variety of risks, including:
| • | difficulties and costs of staffing, developing and managing foreign operations as a result of distance, language and cultural differences; |
| • | increased management, travel, infrastructure and legal compliance costs associated with having multiple international operations; |
| • | differing regulatory requirements, and U.S. or foreign tariffs, export or import restrictions, trade barriers and other regulatory or contractual limitations on our ability to sell, distribute or develop our products in certain foreign markets, including restrictions on the use, import or export of encryption technologies, which could delay or prevent the sale or use of our products in some jurisdictions; |
| • | restrictions on foreign ownership and business licensing and certification requirements; |
| • | shorter payable and longer receivable cycles and difficulties in enforcing contracts and collecting accounts receivable, especially in emerging markets; |
14
Table of Contents
| • | the need to localize our products, services and licensing programs for international customers, including translation into foreign languages and adaptation for local practices and regulatory requirements; |
| • | different employee/employer relationships and the existence of workers’ councils and labor unions in some jurisdictions; |
| • | fluctuations in currency exchange rates; |
| • | dependence on certain third parties to increase customer acquisition and sales, including dependence on channel partners with which we may not have extensive experience; |
| • | increased financial accounting and reporting burdens and complexities; |
| • | reduced protection for intellectual property rights, including reduced protection from software piracy, in some countries; |
| • | local political and economic conditions, including any instability caused by war and terrorism or the threat of war and terrorism; and |
| • | overlapping of different tax regimes, and potentially adverse tax consequences, including the complexities of foreign value added or other tax systems and restrictions on the repatriation of earnings and the investment of funds. |
Any of these risks could harm our international operations and reduce our international sales, adversely affecting our business, operating results, financial condition and growth prospects.
We generate a significant portion of our revenue from sales to government entities, which pose a number of challenges and risks.
In 2008, 2009 and the six months ended June 30, 2010, we derived approximately 15%, 17% and 17%, respectively, of our license and professional services revenue from sales directly and indirectly to departments and agencies of the United States federal government. We also derive revenue from sales to departments and agencies of other domestic and foreign governments. Our growth strategy includes seeking to increase sales to U.S. and other domestic and foreign government entities. Sales into government entities are subject to a number of challenges and risks, including, among others, generally longer sales cycles and related upfront time and cost without the assurance of purchases, and more complicated contracting requirements than with commercial sales. In addition, funding freezes, reductions or delays may adversely affect public sector demand for our products and services or timely payment of invoices. Government demand may also be reduced due to changes in government programs. Government entities may have contractual or other legal rights to terminate contracts with our distributors and resellers for convenience or due to a default, and any such termination may harm our business and operating results.
Most of our sales to the United States federal government have been made indirectly through our distribution channel. We must comply with laws and regulations relating to the formation, administration and performance of United States government contracts, which affect how we and our channel partners do business in connection with United States federal agencies and may impose added costs on our business. In addition, governments also routinely investigate and audit government contractors’ administrative processes. Failure to comply with applicable laws, regulations and requirements, including non-compliance in the past, or any unfavorable audit, could lead to penalties, civil or criminal liability, claims for damages from our channel partners, termination of contracts and suspension from government contracting. Any such penalties, liability, disruption or limitation in our ability to do business with the United States government could harm our business, operating results and financial condition.
In addition, the United States government may require that certain products it purchases be manufactured in the United States and other higher-cost manufacturing locations. For example, some contracts with United States government agencies require that at least 50% of the components of each of our products be of United States origin. Consequently, our ability to optimize our software development by conducting it outside of the United
15
Table of Contents
States may be limited. Some of our competitors do not rely on contracts with the United States government to the same degree as we do and may develop software off-shore. If we are unable to develop software as cost-effectively as our competitors, our ability to compete for our non-government customers may be reduced and our customer sales may decline.
If we are unable to continue to offer high quality maintenance and professional services and maintain strong customer relationships, our sales, renewals of maintenance contracts and operating results could be harmed.
We offer our customers assistance in installing, customizing, maintaining or managing the functions of our software products. Our maintenance and professional services provide us an opportunity to introduce existing customers to our new products or product enhancements and to expand the use of a particular product to a customer’s other operating or geographic divisions. As a result, if we are unable, directly or through our channel partners, to provide effective and high-quality maintenance and professional services and help our customers quickly resolve any post-deployment issues, our ability to expand our business with existing customers and our reputation with potential customers could be harmed.
We sell each of our products pursuant to a perpetual license, which is typically sold with a one year maintenance contract. Our customers have no obligation to renew their maintenance contract after the expiration of the initial period, and the percentage of contracts renewed during a given period may decline as a result of a number of factors, including customers’ level of satisfaction with our services or our products, the prices of our products relative to competitive products, or reductions in our customers’ spending levels. If our customers do not renew their maintenance arrangements or if they renew them on less favorable terms, our revenue may decline and our operating results may be harmed.
We rely significantly on revenue from maintenance contracts which may decline, and because we recognize revenue from maintenance contracts over the term of the relevant service period, downturns in sales are not immediately reflected in full in our operating results.
Our maintenance revenue accounted for 36%, 37%, 40% and 43% of our total revenue for 2007, 2008, 2009 and the six months ended June 30, 2010, respectively. Sales of maintenance contracts may decline or fluctuate as a result of a number of factors, including customers’ level of satisfaction with our products and services, the prices of our products and services, the prices of products and services offered by our competitors or reductions in our customers’ spending levels. If our sales of maintenance contracts decline, our revenue and revenue growth may decline and our business will suffer. In addition, we recognize service revenue monthly over the term of the relevant service period, which is typically one year. As a result, much of the revenue we report each quarter is the recognition of deferred revenue from maintenance contracts entered into during previous quarters. Consequently, a decline in maintenance contracts in any one quarter will not be fully reflected in revenue in that quarter, but will negatively affect our revenue in future quarters. Accordingly, the effect of significant downturns in sales of our maintenance support is not reflected in full in our results of operations until future periods. GAAP revenue recognition requirements for service revenue also makes it difficult for us to rapidly increase our revenue through additional maintenance support sales in any period, as revenue from maintenance contracts must be recognized over the applicable service period.
We have experienced significant growth in recent years, which has increased demands upon our management, systems, operational, financial and other resources, and our inability to successfully manage or accommodate this or any future growth could harm our business.
We have experienced significant growth in recent years and we seek to continue to expand our operations. Our growth has increased the complexity of our business and placed significantly increased demands on our management, personnel, operations, systems, processes, financial resources and our internal control and reporting functions and any future growth will continue to do so. Growth in recent years has included, among other things:
| • | our becoming a multiple-product company through the formal introduction in January 2010 of our Tripwire Log Center product and Tripwire VIA software suite; |
16
Table of Contents
| • | expansion of our international operations; |
| • | significant increases in the numbers of our customers and employees, including the recent hiring of several members of our management team; and |
| • | use of research and development contractors, including in foreign markets. |
We may be unable to manage our expanding operations effectively, successfully integrate new members of our management team and employees, achieve planned growth on a timely or profitable basis or cost-effectively scale our systems to accommodate any growth. Any inability to manage our growth effectively could adversely affect our revenue and profitability, the quality of our products and services, the timeliness and effectiveness of our product development efforts and our ability to retain key personnel. These factors could harm our business, operating results and financial conditions.
The loss of key personnel or an inability to attract and retain additional key personnel may harm our business and impair our ability to grow.
We depend on the service and performance of our senior management team and other key personnel, including experienced sales personnel that have developed close relationships with existing customers. The loss of any of these individuals may significantly delay or prevent the achievement of our business objectives or result in customer losses. Our success will depend upon our ability to identify, attract and retain highly skilled technical, managerial, finance, sales and other personnel. We face intense competition for qualified individuals from numerous software and other technology companies. There is a limited pool of such qualified individuals in Portland, Oregon, where our primary operations are based, and it may be difficult to hire such individuals in, or recruit them to Portland. We may devote significant time and expense to attract and retain qualified personnel, and we may lose employees to our competitors or other companies before we realize the benefit of our investment in recruiting and training them. We may be unable to attract and retain suitably qualified individuals who are capable of meeting our growing technical, operational and managerial requirements, on a timely basis or at all, and we may be required to pay increased compensation in order to do so. If we are unable to attract and retain the qualified personnel we need to succeed, our business would be harmed.
Real or perceived errors, failures or bugs in our products could harm our reputation, business and operating results.
Because we offer complex products, undetected errors, failures or bugs may exist or occur, especially when products are first introduced, such as our recently-introduced Tripwire Log Center product and our Tripwire VIA software suite, or when new versions are released, as with our Tripwire Enterprise product. Our products are often installed and used in large-scale computing environments with different operating systems, system management software and equipment and networking configurations, which may cause errors or failures in our products or may expose undetected errors, failures or bugs in our products. Despite our testing, we may not identify all errors, failures or bugs in new products or releases until after commencement of commercial sales or installation. In the past, we have discovered software errors, failures, and bugs in some of our product offerings after their introduction.
Real or perceived errors, failures or bugs in our products, including our recently-introduced Tripwire Log Center product and new versions or releases of our Tripwire Enterprise product, could result in negative publicity, loss of or delay in market acceptance of our products, loss of competitive position, or claims by customers for losses sustained by them. Many of our customers use our products in applications that are critical to their businesses, and our products routinely process large amounts of data, including sensitive and personally-identifiable information. Accordingly, our customers may have a greater sensitivity to real or perceived defects in our products than to defects in other, less critical, software products. They also use our products to minimize security vulnerabilities and to demonstrate compliance with laws, regulations and industry standards. Noncompliance could result, for example, if we were to incorrectly map requirements of an applicable regulation
17
Table of Contents
or standard to our compliance policy library and related product features. In such an event, we may be required, or may choose, for customer relations or other reasons, to expend additional resources in order to help correct the problem. Helping to alleviate any of these problems could require significant expenditures of capital and other resources and could cause interruptions, delays or cessation of our product licensing, which could harm our business, operating results and financial condition. Noncompliance or a breach could also damage our reputation. Our product liability insurance may not be adequate to cover related claims. In addition, provisions in our customer, reseller and license agreements that limit our exposure to liabilities arising from such claims may not fully protect us against such claims and related liabilities and costs. Defending a lawsuit, regardless of its merit, could be costly and distract management from running our business.
Perceived failure of our solutions to provide expected results may result in negative publicity and harm our business and operating results.
Our customers use our products and services in a wide variety of IT systems and application environments in order to help to reduce security vulnerabilities and to demonstrate compliance. Despite our efforts to make clear in our marketing materials and customer agreements the capabilities and limitations of our products, some customers may view the deployment of our products in their IT infrastructure as a guarantee that there will be no security breach or policy non-compliance event. As a result, the occurrence of a high profile security breach, or a failure by one of our customers to pass a regulatory compliance IT audit could result in public and customer perception that our products are not effective, even if the occurrence is unrelated to the use of our products or services or if the failure is the result of actions or inactions on the part of the customer. If our software products are not used correctly or as intended, inaccurate results may be produced. Our customers may incorrectly implement or use our products. For example, our products permit a customer to identify and select the applicable compliance policies and features that are relevant for its security needs. Failure by the customer to properly identify and select the applicable policies and features could lead to unexpected results. The incorrect or improper use of our software solutions and the actual or perceived failure of our solutions to provide expected results may result in negative publicity and harm to our business and operating results.
If we fail to develop and maintain our brand cost-effectively, or if we are unable to successfully extend our brand into other markets, our business, operating results and financial condition could be harmed.
We believe that developing and maintaining awareness and integrity of our brand in a cost-effective manner are important to achieving widespread acceptance of our existing and future products and services and are important elements in attracting new customers. We believe that the importance of brand recognition will increase as competition in our market further intensifies and as we seek to enter new markets. Successful promotion of our brand will depend upon the effectiveness of our marketing efforts and on our ability to provide reliable and useful products and services at competitive prices. While we believe that our Tripwire Enterprise product has strong brand recognition in the file integrity monitoring and configuration management markets, extension of our brand to new products and markets—including our recently-introduced Tripwire Log Center product and our new Tripwire VIA software suite—may dilute this brand. We rely significantly on marketing to build our sales pipeline. Brand promotion activities, including current or new marketing initiatives we may undertake in the future, may be expensive and not yield any increased revenue or sufficient revenue to offset the expenses. We also rely on our customer base in a variety of ways, including to give us feedback on our products and services and to help validate our products and services to the market. If we fail to promote, maintain and expand our brand successfully or to maintain loyalty among our customers, or if we incur substantial expenses in an unsuccessful attempt to promote, maintain and expand our brand, we may fail to attract new customers or retain our existing customers and our business, operating results and financial condition could be harmed.
18
Table of Contents
If our internal IT infrastructure is compromised by security breaches, public perception of our brand and business may be harmed.
Because we provide IT security and compliance products and services, we may be a more attractive target for attacks by computer hackers. We manage and store proprietary information and sensitive or confidential data relating to our business. If an actual or perceived breach of network security occurs in our internal systems it could expose us to a risk of unauthorized use or disclosure of such information. In addition, any such actual or perceived breach could harm the market perception of our products and services and could lead some customers to return products, to reduce or delay future purchases or use competitive products. In addition, such a security breach could impair our ability to operate our business, including our ability to provide maintenance and professional services to our customers. Any or all of these events could cause our business and operating results.
We are exposed to fluctuations in currency exchange rates, which could harm our ability to expand into international markets and our financial condition and operating results.
Our sales contracts are primarily denominated in U.S. dollars. A strengthening of the U.S. dollar could increase the real cost of our products and services to our customers outside of the United States, which could result in reduced sales of our products and services to these customers and hinder our ability to expand internationally. In addition, certain of our revenue is generated, and certain of our operating expenses are incurred, in foreign currencies and are subject to fluctuations due to changes in foreign currency exchange rates, which could affect our operating results. We do not currently hedge currency exposures, but we may do so in the future. If any attempts by us to hedge against these risks are unsuccessful, our financial condition and operating results could be harmed.
If we are unable to enhance existing products or develop or acquire new products that respond to technological advances, rapidly changing regulatory and customer requirements or evolving industry standards, or to obtain required certifications, our long-term revenue growth will be harmed.
The markets for our products and services are characterized by rapid technological advances, changes in regulatory and customer requirements, changes in protocols and evolving industry standards. Our long-term growth depends in part on our ability to enhance and improve our existing products and services and to develop or acquire new products that respond to these changes and demands, including those created by virtualization, cloud computing and other technology trends. The success of any enhancement or new product depends on a number of factors, including its timely completion, commercial launch and market acceptance. We may not introduce new or enhanced products in a timely or cost-effective manner and may not generate significant revenue from product expansions and improvements. We may not expand our compliance policy library as new regulatory or industry standards are introduced or existing standards are modified. Maintaining adequate research and development resources, such as quality personnel and development technology, is essential to meet market demands for new and improved products. Our failure to maintain adequate research and development resources or to compete effectively with the research and development programs of our competitors would present an advantage to such competitors. If we are unable to develop or acquire enhancements to, and new features for, our existing products or acceptable new products that keep pace with rapid technological developments and customer and market requirements, our products may become obsolete or less competitive, which would harm our business, operating results and financial condition.
In addition, we must obtain certain certifications for some products and sales. We must meet specific technological certifications to sell our products to governmental entities. Also, each new whole release of our products must be certified by the Center for Internet Security (CIS) if we cover CIS policies in the release, which may be desired by existing and potential customers. Our failure to obtain required certifications could limit our sales to governmental entities or reduce demand for our products, which could harm our business and operating results.
19
Table of Contents
We have limited experience with acquiring or investing in other technologies, products or businesses and any future acquisitions or investments may be unsuccessful.
Our growth strategy includes our potential acquisition of, or making investments in, complementary technologies, products or businesses, although no acquisitions or investments are currently pending or planned. We have had little experience negotiating or completing acquisitions or investments or managing the integration of acquisitions. Accordingly, we may be unable to successfully complete or integrate any such transactions we may pursue, and our failure to do so could harm our business, operating results and financial condition. The success of any future acquisitions or investments will depend upon our ability to identify, negotiate, complete and integrate these transactions and, if necessary, to obtain satisfactory debt or equity financing to fund them. Any acquisitions or investments we undertake will involve numerous risks, which may include any of the following:
| • | disruption of our ongoing business, including diversion of management’s attention during negotiation of the transaction and during post-transaction integration; |
| • | costs, delays and difficulties of integrating any acquired company’s operations, products, technologies and personnel into our existing operations and organization; |
| • | difficulties in maintaining uniform and applicable standards, controls, procedures and policies; |
| • | adverse impact on earnings as a result of amortizing the acquired company’s intangible assets or impairment charges related to write-downs of goodwill related to acquisition; |
| • | issuances of equity securities or the incurrence of debt to pay for acquisitions or investments, which may be dilutive to existing stockholders or increase our financial leverage and interest expense; |
| • | potential loss of customers or key employees; |
| • | impact on our operating results or financial condition due to the timing of the acquisition or investment or failure to meet operating expectations for acquired businesses or investments; |
| • | assumption of unknown liabilities of the acquired company or becoming subject to adverse tax consequences; and |
| • | the entry into geographic or business markets in which we have little or no prior experience. |
Any acquisitions of or investments in technologies, products or businesses may not generate sufficient revenue to offset the associated costs of the acquisition or may result in other adverse effects that would harm our business, operating results and financial condition.
We rely on software licensed from other parties. Defects in such software or the loss of these licenses could harm our business, increase our costs and delay sales of affected products.
We use software licensed from unaffiliated third parties in certain of our products, including for our search capacity in our Tripwire Log Center product, and may license additional third-party software in the future. Any errors or defects in this third-party software could result in errors that could harm our brand and business. In addition, licensed software may not continue to be available on commercially reasonable terms, or at all. While we believe that there are currently adequate replacements for the third-party software we presently use, the loss of our right to use any of this software could result in delays in producing or delivering affected products until equivalent technology is identified, licensed or otherwise procured and integrated. Our business would be disrupted if any software we license from others or functional equivalents of this software were either no longer available to us or no longer offered to us on commercially reasonable terms. In either case, we would be required either to attempt to redesign our products to function with software available from other parties or to develop these components ourselves, which would result in increased costs and could result in delays in product sales and the release of new product offerings. Alternatively, we might be forced to limit the features available in affected products. Any of these results could harm our business, operating results and financial condition.
20
Table of Contents
Failure to retain the services of our supplemental product development resources could harm our ability to timely and cost-effectively release new products and our revenue and operating results.
Our success depends on our ability to enhance current products and to develop new products timely and cost effectively. We currently supplement our research and development capabilities with non-employee contractors in Vietnam, Mexico and Colorado. If we are unable to maintain our relationship with these or other contractors, or if they are unable or unwilling to provide services to us, we may be required to develop our products in an alternative and less efficient and cost-effective manner and our product release schedules may be delayed while we hire software developers or find alternative contract development resources. This could harm our business and operating results.
If customers demand that our products be provided via a “software-as-a-service” business model, our business could be harmed.
Software-as-a-service (SaaS) is a model of software deployment where a software provider typically licenses an application to customers for use as a service on demand through web browser technologies. A SaaS business model can require a vendor to adapt its applications for SaaS deployment, to undertake substantial capital investments and to hire additional related sales and support resources and personnel. If we were to provide our products via a SaaS deployment, we would need to undertake these investments to implement this alternative business model. In addition, we may need to apply different revenue recognition policies. Even if we undertook these investments, we may be unsuccessful in implementing a SaaS business model. These factors could harm our business, operating results and financial condition.
We will incur increased costs and demands upon management as a result of being a public company, which will harm our operating results.
As we have prepared to become, and following our becoming, a public company, we have incurred, and will continue to incur, significant legal, accounting and other expenses that we did not incur previously, including costs associated with public company reporting requirements following this offering. We also will incur increased costs associated with corporate governance requirements, including requirements under Section 404 and other provisions of the Sarbanes-Oxley Act, as well as rules implemented by the Securities and Exchange Commission (SEC), and the Nasdaq Stock Market LLC (NASDAQ). Compliance with these laws and rules also will increase the demands upon our management team. We also expect that, as a public company, it will be more expensive for us to obtain director and officer liability insurance. The increased cost of being a public company will adversely affect our operating results.
If we fail to maintain proper and effective internal controls, our ability to produce accurate and timely financial statements could be impaired, which could harm our operating results, our ability to operate our business and investor views of us.
Ensuring that we have adequate internal financial and accounting controls and procedures in place so that we can produce accurate financial statements on a timely basis is a costly and time-consuming effort requiring frequent re-evaluation. Our internal control over financial reporting is a process designed to provide reasonable assurance regarding the reliability of financial reporting and the preparation of financial statements in accordance with GAAP. We are in the process of documenting, reviewing and improving our internal controls and procedures for compliance with Section 404 of the Sarbanes-Oxley Act of 2002, which requires annual management assessment of the effectiveness of our internal control over financial reporting and a report by our independent registered public accounting firm addressing this assessment. Both we and our independent registered public accounting firm will be testing our internal controls in connection with the audit of our financial statements for the year ending December 31, 2011 and, as part of that testing, identifying areas for further attention and improvement.
21
Table of Contents
Implementing any appropriate changes to our internal controls may distract our officers and employees and entail significant time and costs to modify our existing processes. If we fail to maintain proper and effective internal controls, our ability to produce accurate and timely financial statements could be impaired, which could lead to our need to restate financial results or otherwise harm our business, operating results, investor perceptions or stock price.
Accounting rules governing revenue recognition for software products and services are complex and may change.
The accounting rules governing software revenue recognition are complex and have been subject to authoritative interpretations that only provide for recognition of software revenue at the beginning of the license period in specific circumstances. For example, the bundling of products and services may require deferral of revenue recognition until vendor-specific objective evidence (VSOE) of fair value exists for all elements included in the bundled package or, if earlier, the completion of delivery of all the elements in the package, including any included services. We have established VSOE of the fair value of maintenance for our recently-introduced Tripwire Log Center product and Tripwire VIA software suite, and we use the residual method to recognize license revenue for these products. We may experience trends that result in an inability to establish VSOE for the undelivered elements in an arrangement. As a result of this and any new or revised revenue recognition standards or interpretations, our ability to meet near-term revenue expectations could be harmed.
If our estimates or judgments relating to our critical accounting policies are based on assumptions that change or prove to be incorrect, our operating results could fall below expectations of securities analysts and investors, resulting in a decline in our stock price.
The preparation of financial statements in conformity with GAAP requires management to make estimates and assumptions that affect amounts reported in financial statements and accompanying notes. We base our estimates on our experience and on assumptions we believe to be reasonable under the circumstances, the results of which form the basis for making judgments about the carrying values of assets and liabilities that are not readily apparent from other sources. Our operating results may be harmed if our assumptions change or if actual circumstances differ from those in our assumptions, which could cause our operating results to fall below the expectations of securities analysts and investors, resulting in a decline in our stock price. Significant assumptions and estimates used in preparing our financial statements include those related to revenue recognition, the allowance for doubtful accounts, goodwill and intangible assets, stock-based compensation and accounting for income taxes.
Some of our products contain “open source” software, and any failure to comply with the terms of one or more of these open source licenses could harm our business.
Some of our products are distributed with software licensed by its authors or other third parties under “open source” licenses. Some of these licenses contain requirements that we make available source code for modifications or derivative works we create based upon the open source software, and that we license these modifications or derivative works under the terms of a particular open source license or other license granting third parties certain rights of further use. If we combine our proprietary software with open source software in a certain manner, we could, under provisions of the open source licenses, be required to release the source code of our proprietary software. In addition to risks related to license requirements, usage of open source software can lead to greater risks than use of third-party commercial software, as open source licensors generally do not provide warranties or controls on origin of the software. We have established processes to help alleviate these risks, and we plan to implement the use of software tools to review our source code for potential inclusion of open source software. However, we cannot be sure that any open source software has been, or will be, submitted for approval prior to use, if any, in our products or that any such software tools will be effective. We also rely upon third-party, non-employee contractors to perform certain development services on our behalf, and cannot be certain that such contractors will comply with our review process or not incorporate software code made
22
Table of Contents
available under open source licenses into our proprietary code base. In addition, open source license terms may be ambiguous. If we were found to have inappropriately used open source software, we may be required to re-engineer affected products, release proprietary source code, discontinue the sale of our products if re-engineering could not be accomplished on a timely basis, or take other remedial action that may divert resources from our development efforts, any of which could harm our business, operating results and financial condition.
We may be unable to adequately protect our intellectual property rights, which could harm our business.
We regard our patents, trademarks, copyrights, trade secrets, proprietary technology and similar intellectual property as important to our success, and we rely on patent, trademark and copyright law, trade secret protection and confidentiality agreements with our employees, customers and others to protect our proprietary rights. There is no guarantee that such parties will abide by the terms of such agreements or that we will be able to adequately enforce our rights, in part because we rely on “click-wrap” and “shrink-wrap” licenses in some instances. We may not be able to discover or determine the extent of any infringement or misappropriation of our intellectual property or proprietary rights, or unauthorized use of our proprietary software and technology. The protection of our intellectual property may require the expenditure of significant financial and managerial resources. Any of our patents, copyrights, trademarks or other intellectual property rights may be challenged by others or invalidated through administrative process or litigation. Our issued patents may not provide us with any competitive advantages or may be challenged by third parties, and our patent applications may never be granted. In addition, the process of obtaining patent protection is expensive and time-consuming, and we may not be able to prosecute all necessary or desirable patent applications at a reasonable cost or in a timely manner. Even if issued, there can be no assurance that these patents will adequately protect our intellectual property, as the legal standards relating to the validity, enforceability and scope of protection of patent and other intellectual property rights are uncertain. Effective intellectual property protection may not be available in every country in which we offer our products and services. The laws of some foreign countries may not be as protective of intellectual property rights as those in the United States, and mechanisms for enforcement of intellectual property rights may be inadequate. Accordingly, despite our efforts, we may be unable to prevent third parties from infringing upon or misappropriating our intellectual property. We also cannot be certain that others will not independently develop or otherwise acquire equivalent or superior technology or intellectual property rights. We might be required to spend significant resources to monitor and protect our intellectual property rights. We may initiate claims or litigation against third parties for infringement of our proprietary rights or to establish the validity of our proprietary rights. Any litigation, whether or not it is resolved in our favor, could result in significant expense to us and divert the efforts of our technical and management personnel, which may harm our business, operating results and financial condition.
Confidentiality agreements with employees and others may not adequately prevent disclosure of trade secrets and other proprietary information.
In order to protect our proprietary technology, processes and methods, we rely in part on agreements containing confidentiality provisions with our resellers, employees, consultants, advisors and others. These agreements may not effectively prevent disclosure of confidential information and may not provide an adequate remedy in the event of unauthorized disclosure of confidential information. In addition, others may independently discover trade secrets and proprietary information, and in these cases we would not be able to assert any trade secret rights against those parties. Costly and time-consuming litigation could be necessary to enforce and determine the scope of our proprietary rights, and failure to obtain or maintain trade secret protection could harm our competitive business position.
We may be accused of infringing intellectual property rights of third parties.
Third parties also may claim that we infringe their proprietary rights. Companies in the software, networking and technology industries, including some of our current and potential competitors, own large
23
Table of Contents
numbers of patents, copyrights, trademarks and trade secrets and frequently enter into litigation based on allegations of infringement or other violations of intellectual property rights. In addition, many of these companies have the capability to dedicate substantially greater resources to enforce their intellectual property rights, initial legal proceedings and to defend claims that may be brought against them. Litigation may involve patent holding companies or other adverse patent owners who have no relevant product revenue and against whom our actual and potential patents may provide little or no deterrence.
We have been subject to, and expect to continue to be subject to, notices that claim we have infringed or misappropriated third-party intellectual property rights, and we expect that we may be subject to claims and legal proceedings regarding alleged infringement by us of the intellectual property rights of third parties. To the extent we gain greater visibility, we face a higher risk of being the subject of intellectual property infringement claims, which is not uncommon for companies offering software and related services in general and security and vulnerability management technology in particular. Such claims, whether or not meritorious, may result in the expenditure of significant financial and managerial resources, injunctions against us or the payment of damages. We may need to obtain licenses from third parties who allege that we have infringed their rights, but such licenses may not be available on terms acceptable to us or at all, or we may be required to develop alternative non-infringing technology or rebrand certain products or features, which could require significant effort and expense. If we cannot license or develop technology for any infringing aspect of our business, we would be forced to limit or stop sales of one or more of our products or product features or, in the case of trademark disputes, rebrand certain product offerings, and we may be unable to compete effectively. Our exposure to risks associated with the use of intellectual property may be increased as a result of acquisitions, as we have a lower level of visibility into the development process with respect to acquired technology or the care taken to safeguard against infringement risks. Third parties may make infringement and similar or related claims after we have acquired technology that had not been asserted prior to our acquisition. Any of these results would harm our business, operating results and financial condition. These risks have been amplified by the increase in third parties whose sole or primary business is to assert such claims.
Indemnity provisions in various agreements potentially expose us to substantial liability for intellectual property infringement and other losses.
Our agreements with customers and channel partners include indemnification provisions under which we agree to indemnify them for losses suffered or incurred as a result of claims of intellectual property infringement and, in some cases, for other damages, such as damages caused by us to property or persons. For customers who purchase perpetual licenses, the terms of these indemnity provisions are perpetual. In other agreements, the indemnity provision may survive termination of the agreement. Large indemnity payments could harm our business, operating results and financial condition.
Governmental export or import or other controls could subject us to liability or limit our ability to compete in foreign markets.
Our products incorporate encryption technology and may be exported outside the United States only if we obtain an export license or qualify for an export license exception. Compliance with applicable regulatory requirements regarding the export of our products, including with respect to new releases of our products, may create delays in the introduction of our products in international markets, prevent our customers with international operations from deploying our products throughout their global systems or, in some cases, prevent the export of our products to some countries altogether. Any new export or import restrictions, new legislation or shifting approaches in the enforcement or scope of existing regulations, or in the countries or affecting the persons or technologies targeted by such regulations, could result in decreased use of our products by existing customers with international operations, declining adoption of our products by new customers with international operations and decreased revenue. If we fail to comply with export and import regulations, we may be denied export privileges, be subjected to fines or other penalties and our products may be denied entry into other countries. If our channel partners fail to comply with these regulations, we may be adversely affected through reputational harm and penalties.
24
Table of Contents
In addition, United States export control laws and economic sanctions prohibit the shipment of certain products to United States embargoed or sanctioned countries, governments and persons. Even though we take precautions to prevent our products from being shipped to U.S.-sanctioned targets, our products could be shipped to those targets inadvertently or by our channel partners, despite such precautions. Any such shipment could result in government investigations and penalties or reputational harm.
Conducting business in countries with a history of corruption and transactions with foreign governments increase the risks associated with our international activities.
As we operate and sell products and services internationally and seek to expand our international presence, we are subject to the United States Foreign Corrupt Practices Act (FCPA), and other laws that prohibit improper payments or offers of payments to foreign governments and their officials and political parties by United States and other business entities for the purpose of obtaining or retaining business. As we operate and seek to expand internationally, we may have operations, deal with and make sales to governmental customers in, countries known to experience corruption, particularly certain emerging countries. Our activities in these countries may create the risk of unauthorized payments or offers of payments by one of our employees, sales agents or channel partners that could be in violation of various laws, including the FCPA, even though these parties are not always subject to our control. Violations of the FCPA may result in severe criminal or civil sanctions, including suspension from United States government contracting, and we may be subject to other liabilities, which could harm our reputation, business, operating results and financial condition.
Debt covenants may restrict our business.
We have a credit facility that we may use from time to time for working capital purposes. As of June 30, 2010, we had no outstanding indebtedness under the facility. Our existing credit facility contains restrictive covenants and we may enter into other credit facilities that contain similar or more extensive restrictive covenants. The covenants under our existing credit facility limit our ability to, among other things:
| • | incur additional indebtedness or guarantee indebtedness of others; |
| • | create additional liens on our assets; |
| • | pay dividends and make other distributions on our capital stock; |
| • | make acquisitions or investments, enter into mergers or sell our assets; or |
| • | engage in any business unrelated to our current business. |
Our credit facility also contains various financial covenants. Covenants in any current or future credit facilities could harm our business by limiting our operations or our ability to take advantage of financings, mergers, acquisitions and other corporate opportunities that may be beneficial to our business and stockholders.
Our failure to generate sufficient capital or raise additional capital to expand our operations and invest in new products and services could reduce our ability to compete and harm our business.
We expect that our existing cash and cash equivalents, together with our net proceeds from this offering, will be sufficient to meet our cash needs for at least the next twelve months. In the future, we may need to raise additional funds, and we may be unable to obtain additional debt or equity financing on favorable terms, if at all. If we raise additional equity financing, our stockholders may experience significant dilution of their ownership interests and our common stock price could decline. If we obtain debt financing, the holders of debt would have priority over the holders of our common stock and we may be required to accept terms that restrict our operational or financial flexibility, including our ability to take certain actions that otherwise would be in the interests of the stockholders, any of which could harm our business, operating results and financial condition. If we need additional capital and cannot raise it on acceptable terms, we may not be able to, among other things:
| • | develop or enhance our products and services; |
| • | continue to expand our sales and marketing and research and development organizations; |
25
Table of Contents
| • | acquire complementary technologies, products or businesses; |
| • | expand operations in the United States or internationally; |
| • | hire, train and retain employees; or |
| • | respond to competitive pressures or unanticipated working capital requirements. |
Our failure to do any of these things could harm our business, financial condition and results of operations.
Changes in our provision for income taxes or adverse outcomes resulting from examination of our income tax returns could harm our financial condition and operating results.
Our provision for income taxes is subject to volatility and could be adversely affected by:
| • | our earnings being lower than anticipated in countries that have lower tax rates and higher than anticipated in countries that have higher tax rates; |
| • | changes in the valuation of our deferred tax assets and liabilities; |
| • | expiration of or lapses in research and development tax credit laws; |
| • | transfer pricing adjustments; |
| • | tax effects of nondeductible compensation; |
| • | changes in accounting principles; or |
| • | changes in tax laws and regulations, including possible changes to U.S. taxation of earnings of our foreign subsidiary, and the deductibility of expenses attributable to foreign income, or the foreign tax credit rules. |
In addition, we are subject to potential examination of our income tax returns by the U.S. Internal Revenue Service and other tax authorities. We regularly assess the likelihood of adverse outcomes resulting from these examinations to determine the adequacy of our provision for income taxes. There can be no assurance that the outcomes from any of these potential examinations will not harm our operating results or financial condition.
Forecasting our estimated annual effective tax rate is complex and subject to uncertainty, and there may be material differences between our forecasted and actual tax rates.
Forecasts of our income tax position and effective tax rate are complex and subject to uncertainty because our income tax position for each year combines the effects of a mix of profits earned and losses incurred by us in various tax jurisdictions with a broad range of income tax rates, as well as changes in the valuation of deferred tax assets and liabilities, the impact of various accounting rules and changes to these rules and tax laws, the results of examinations by various tax authorities, and the impact of any acquisition, business combination or other reorganization or financing transaction. To forecast our global tax rate, we estimate our pre-tax profits and losses by jurisdiction and forecast our tax expense by jurisdiction. If the mix of profits and losses, our ability to use tax credits, or effective tax rates by jurisdiction are different than those estimated, our actual tax rate could be materially different than forecasted, which could harm our operating results or financial condition.
As an international corporation, we conduct our business in many countries and are subject to taxation in various jurisdictions. The taxation of our business is subject to the application of multiple and sometimes conflicting tax laws and regulations as well as multinational tax conventions. Our effective tax rate depends upon the geographic distribution of our worldwide earnings or losses, the tax regulations in each geographic region, the availability of tax credits and carryforwards, and the effectiveness of our tax planning strategies. The application of tax laws and regulations is subject to legal and factual interpretation, judgment and uncertainty. Tax laws themselves are subject to change as a result of changes in fiscal policy, changes in legislation, and the
26
Table of Contents
evolution of regulations and court rulings. Consequently, taxing authorities may impose tax assessments or judgments against us that could increase our tax liability and our effective income tax rate.
In addition, if tax authorities challenge the relative mix of our U.S. and international income, our future effective income tax rates could increase. While we regularly assess the likelihood of adverse outcomes from such examinations and the adequacy of our provision for income taxes, such provision may not be sufficient and a determination by a tax authority may harm our operating results and financial condition.
Our ability to utilize our net operating losses to offset future taxable income may be subject to certain limitations.
As of December 31, 2009, we had net operating losses of $22.9 million that were potentially eligible to offset future taxable income. In general, under Section 382 of the Internal Revenue Code of 1986, as amended (the Internal Revenue Code), a corporation that undergoes an “ownership change” is subject to limitations on its ability to utilize its pre-change net operating losses to offset future taxable income. Our existing net operating losses may be subject to limitations arising from previous ownership changes, and if we undergo an ownership change in connection with or after this offering, our ability to utilize net operating losses could be further limited by Section 382 of the Internal Revenue Code. We have not yet determined the amount of the cumulative change in our ownership resulting from this offering. In addition, transactions in our stock that may not be within our control could result in an ownership change under Section 382 of the Internal Revenue Code and may impose a limitation on the utilization of our net operating losses in the future. If our use of our net operating losses is limited and we are profitable, our related ability to reduce our tax liability likewise will be limited.
Prolonged economic uncertainties or downturns could harm our business.
Economic downturns, particularly in the United States, where we generate the majority of our revenue, could harm our business, operating results and financial condition. The recent global economic downturn and financial crisis made it more difficult for our customers and potential customers to forecast and plan business activities, and obtain credit. We believe this resulted in some customers and potential customers decreasing their IT spending, foregoing or deferring purchases of our products and services and increasing their negotiations for additional discounts from us. We derive a significant portion of our revenue from customers in the retail, financial services and communications industries. A substantial downturn in these industries in particular may result in lower or slower sales of our products and services.
Our business is subject to the risks of earthquakes, volcanic eruptions, fire, power outages, telecommunications and network failures, floods and other catastrophic events, and to interruption by manmade problems such as terrorism.
A significant natural disaster, such as an earthquake, volcanic eruption, fire or a flood, medical epidemic or pandemic, or a significant power outage or IT system or telecommunications failure could harm our business, operating results and financial condition. Our corporate headquarters and principal operating office is located in Portland, Oregon, a region subject to seismic and volcanic activity. Any such natural disaster or other event could hinder our operations and ability to develop and sell products and services, which could lead to decreased revenue, increased expenses and customer losses. In addition, acts of terrorism could cause disruptions in our business or the business of our channel partners and customers or the economy as a whole. We currently do not have a business continuity plan in place.
27
Table of Contents
Risks Related to this Offering and Ownership of Our Common Stock
Our stock price may be volatile or may decline and you could lose some or all of your investment.
The trading prices of the securities of technology companies have been highly volatile. The market price of our common stock may fluctuate significantly in response to numerous factors, many of which are beyond our control, including those described above under “Risks Related to Our Business and Industry” (such as fluctuations in our operating results or announcements by us or our competitors of significant technical innovations, acquisitions, strategic partnerships, capital commitments or other developments) and the following:
| • | any financial projections we may provide to the public, any changes in these projections or our failure to meet these projections; |
| • | failure of securities analysts to initiate or maintain coverage of us, changes in financial estimates by any securities analysts who follow us or our failure to meet these estimates or the expectations of investors; |
| • | ratings changes by any securities analysts who follow us; |
| • | changes in operating performance and stock market valuations of other technology companies generally, or those in our industry in particular; and |
| • | price and volume fluctuations in the overall stock market, including as a result of trends in the economy as a whole. |
In addition, the stock markets have experienced significant price and volume fluctuations that have affected and continue to affect the market prices of equity securities of many technology companies. Stock prices of many technology companies have fluctuated in a manner unrelated or disproportionate to the operating performance of those companies. In the past, stockholders have instituted securities class action litigation following periods of market volatility. If we were to become involved in securities litigation, it could subject us to substantial costs, divert resources and the attention of management from our business and harm our business, operating results and financial condition.
A significant portion of our total outstanding shares may be sold into the public market in the near future. If substantial sales of shares of our common stock are sold into the public market, the price of our common stock could decline.
The price of our common stock could decline if there are substantial sales of our common stock into the public market, particularly sales by our directors, officers and significant stockholders, or if there is a large number of shares of our common stock available for sale or the perception in the market that the holders of a large number of our shares intend to sell their shares. Immediately after this offering, we will have outstanding approximately shares of our common stock, based on the number of shares outstanding as of , 2010. This includes the shares that we and the selling stockholders are selling in this offering, which may be resold in the public market immediately. Of the remaining shares outstanding immediately after this offering, or approximately %, are currently restricted as a result of contractual agreements with the underwriters or securities law restrictions but may be sold in the near future as set forth below.
| Date Available for Sale into Public Market |
Number of Shares and % of Total Outstanding | |
| Immediately upon completion of this offering |
||
| 180 days after the date of this prospectus |
In addition, as of July 26, 2010, there were 16,621,790 shares of our common stock subject to outstanding stock options and warrants that will become eligible for sale in the public market to the extent permitted by any applicable vesting requirements, contractual agreements with the underwriters or securities law restrictions. After this offering, the holders of an aggregate of approximately 45,995,284 shares of our common stock will have rights, subject to certain conditions, to require us to file registration statements covering their shares or to include
28
Table of Contents
their shares in registration statements that we may file for ourselves or other stockholders. We also intend to register under the Securities Act of 1933 shares of common stock that we have issued and may issue under our employee equity incentive plans. Once we register these shares, they may be sold freely into the public market upon issuance, subject to existing contractual restrictions. The lead underwriters for this offering may, in their sole discretion, permit our directors, officers and stockholders who are subject to the 180-day contractual lock-up to sell shares prior to the expiration of the lock-up agreements. The 180-day period is subject to extension in some circumstances.
If securities or industry analysts do not publish or cease publishing research or reports about us, our business or our market, or if they adversely change their recommendations regarding our stock, our stock price and trading volume could decline.
The trading market for our common stock is influenced by the research and reports that industry or securities analysts publish about us, our business, our market or our competitors. If any of the analysts who cover us or may cover us in the future change their recommendation regarding our stock adversely, or provide more favorable relative recommendations about our competitors, our stock price would likely decline. If any analyst who covers us or may cover us in the future were to cease coverage of our company or fail to regularly publish reports on us, we could lose visibility in the financial markets, which in turn could cause our stock price or trading volume to decline.
No public market for our common stock currently exists and an active trading market may not develop or be sustained following this offering and the market price may decline below the initial public offering price.
Prior to this offering, there has been no public market for our common stock. The initial public offering price for our common stock will be determined through negotiations between the underwriters and us and may vary from the market price of our common stock following this offering. If you purchase shares of our common stock in this offering, you may be unable to resell those shares at or above the initial public offering price. An active or liquid trading market may not develop following this offering or, if developed, may not be sustained. The lack of an active market may impair your ability to sell your shares at the time you wish or at a price that you consider reasonable. The lack of an active market may also reduce the trading price of our shares. In addition, an inactive market may impair our ability to raise capital by selling shares or increase dilution to existing stockholders if we do so and may also impair our ability to acquire other companies or technologies by using our shares as consideration.
Concentration of ownership among our existing executive officers and directors and their affiliates may prevent new investors from influencing significant corporate decisions.
Immediately after this offering, our executive officers and directors and their respective affiliates will beneficially own, in the aggregate, approximately % of our outstanding common stock. As a result, these stockholders will be able to exercise a significant level of control over all matters requiring stockholder approval, including the election of directors, amendment of our certificate of incorporation and approval of significant corporate transactions. This control could have the effect of delaying or preventing a change of control of our company or changes in management and will make the approval of certain transactions difficult or impossible without the support of these stockholders. Please read “Principal and Selling Stockholders” for additional detail about the shareholdings of these persons.
Because our initial public offering price is substantially higher than net tangible book value per share of our outstanding common stock, new investors will incur immediate and substantial dilution.
The initial public offering price of $ per share (based on the midpoint of the assumed price range for this offering) is substantially higher than the pro forma net tangible book value per share of our common stock immediately following this offering. Based on this initial offering price, you will experience immediate and
29
Table of Contents
substantial dilution of approximately $ per share, the difference between the price you pay for our common stock and its net tangible book value after completion of the offering. In addition, investors purchasing common stock in this offering will own only approximately % of our shares outstanding after the offering even though they will have contributed % of the total consideration received by us in connection with our sales of common stock. To the extent outstanding options to purchase common stock are exercised, there will be further dilution to investors in the offering.
We have broad discretion in the use of the net proceeds from this offering and may not use them effectively.
We cannot specify with certainty the particular uses of the net proceeds that we will receive from this offering. Our management will have broad discretion in the application of the net proceeds, including for working capital, possible acquisitions and other general corporate purposes, and we may spend or invest these proceeds in a way with which our stockholders disagree. The failure by our management to apply these funds effectively could harm our business, operating results and financial condition. Pending their use, we may invest the net proceeds from this offering in a manner that does not produce income or that loses value.
Anti-takeover provisions contained in our certificate of incorporation and by-laws, as well as provisions of Delaware law, could impair a takeover attempt.
We are a Delaware corporation and the anti-takeover provisions of the Delaware General Corporation Law may discourage, delay or prevent a change in control by prohibiting us from engaging in a business combination with an “interested stockholder” for a period of three years after the person becomes an interested stockholder, even if a change of control would be beneficial to our existing stockholders. In addition, our certificate of incorporation and by-laws that will be in effect immediately following the completion of this offering contain provisions that may make the acquisition of us more difficult without the approval of our board of directors, including the following:
| • | our board of directors will be classified into three classes of directors with staggered three-year terms; |
| • | our stockholders will only be able to take action at a meeting of stockholders and not by written consent; |
| • | only our chairman of the board, our chief executive officer or president or a majority of our board of directors will be authorized to call a special meeting of stockholders; |
| • | vacancies on our board of directors will be able to be filled only by our board of directors and not by stockholders; |
| • | directors may be removed from office only for cause; |
| • | our certificate of incorporation will authorize undesignated preferred stock, the terms of which may be established, and shares of which may be issued, without stockholder approval; and |
| • | advance notice procedures will apply for stockholders to nominate candidates for election as directors or to bring matters before an annual meeting of stockholders. |
These provisions, alone or together, could delay hostile takeovers and changes in control or changes in our management. Any provision of our restated certificate of incorporation or by-laws or of Delaware law that has the effect of delaying or deterring a change in control could limit the opportunity for our stockholders to receive a premium for their shares of our common stock, and could also affect the price that some investors are willing to pay for our common stock.
We may issue additional shares of our common stock or other securities without your approval, which would dilute your ownership interests and may depress the market price of our common stock.
Subject to the rules of NASDAQ, we may issue additional shares of our common stock, and other equity securities of equal or senior rank, without stockholder approval in a number of circumstances.
30
Table of Contents
The issuance by us of additional shares of our common stock or other equity securities of equal or senior rank will have the following effects:
| • | our existing stockholders’ proportionate ownership interest in us will decrease; |
| • | the amount of cash available for dividends payable on our common stock may decrease; |
| • | the relative voting strength of each previously outstanding share may be diluted; and |
| • | the market price of our common stock may decline. |
We do not intend to pay dividends on our common stock.
We have never declared or paid any dividends on our capital stock. We currently intend to retain any future earnings and do not expect to pay any dividends in the foreseeable future.
31
Table of Contents
SPECIAL NOTE REGARDING FORWARD-LOOKING STATEMENTS AND INDUSTRY DATA
This prospectus contains forward-looking statements that are based on our management’s beliefs and assumptions and on information currently available to our management. The forward-looking statements are contained principally in the sections of this prospectus entitled “Prospectus Summary,” “Risk Factors,” “Management’s Discussion and Analysis of Financial Condition and Results of Operations,” “Business” and “Compensation Discussion and Analysis.” Forward-looking statements include information concerning our possible or assumed future results of operations, business strategies, financing plans, competitive position, industry environment, potential growth and market opportunities and the effects of competition. Forward-looking statements include all statements that are not historical facts and generally may be identified by terms such as “anticipates,” “believes,” “could,” “estimates,” “expects,” “intends,” “may,” “plans,” “potential,” “predicts,” “projects,” “seeks,” “should,” “would” or similar expressions and the negatives of those terms.
Forward-looking statements contained in this prospectus reflect our views about future events and are subject to risks, uncertainties, assumptions and changes in circumstances that may cause events or our actual activities or results to differ significantly from those expressed in any forward-looking statement. Although we believe that the expectations reflected in the forward-looking statements are reasonable, we cannot guarantee future events, results, actions, levels of activity, performance or achievements. Readers are cautioned not to place undue reliance on these forward-looking statements. A number of important factors could cause actual results to differ materially from those indicated by the forward-looking statements, including, among others, those factors described in “Risk Factors” and “Management’s Discussion and Analysis of Financial Condition and Results of Operations.”
All forward-looking statements included in this prospectus are based on information available to us on the date of this prospectus. We undertake no obligation to publicly update or revise any forward-looking statement, whether as a result of new information, future events or otherwise.
This prospectus contains various estimates related to our industry, including market size and growth rates. These estimates have been included in studies published or produced by market researchers and other firms, including International Data Corporation (IDC) and INPUT. These estimates have been produced by industry analysts and consultants based on trends to date, their knowledge of technologies and markets and customer research, but these estimates are forecasts only and are subject to inherent uncertainty. Although we believe these sources are reliable, we have not independently verified the information.
32
Table of Contents
We estimate that our net proceeds from the sale of the common stock that we are offering will be approximately $ million, after deducting estimated underwriting discounts and commissions and estimated offering expenses payable by us and assuming an initial public offering price of $ per share (the midpoint of the range listed on the cover page of this prospectus). A $1.00 increase (decrease) in the assumed initial public offering price would increase (decrease) the net proceeds to us from this offering by $ million, assuming the number of shares offered by us, as set forth on the cover page of this prospectus, remains the same, and after deducting estimated underwriting discounts and commissions and estimated offering expenses payable by us. We will not receive any proceeds from the sale of shares of common stock by the selling stockholders.
The principal purposes of this offering are to create a public market for our common stock, obtain additional capital and facilitate our future access to the public equity markets. We intend to use the net proceeds that we receive in this offering for general corporate purposes, including working capital. If appropriate opportunities arise, we may use a portion of our net proceeds from this offering to acquire or invest in products, technologies or businesses that are complementary to our own. We currently have no plans, proposals or arrangements with respect to any specific acquisition or investment.
We cannot specify with certainty the particular uses of our net proceeds from this offering. Accordingly, our management will have broad discretion in using our net proceeds from this offering. Pending use of our net proceeds from this offering, we intend to invest the net proceeds in short-term, investment-grade, interest-bearing instruments.
We have never paid dividends on our common stock and we intend to retain all available funds and any future earnings to fund the development and growth of our business. We therefore do not anticipate paying any dividends on our common stock in the foreseeable future. Any future determinations to pay dividends on our common stock would depend upon our operating results, our financial condition and liquidity requirements, restrictions that may be imposed by applicable law or our contracts, and any other factors that our board of directors may consider relevant.
33
Table of Contents
The following table sets forth our cash and cash equivalents and capitalization as of June 30, 2010:
| • | on an actual basis; |
| • | on a pro forma basis to give effect to the conversion of all outstanding shares of our convertible preferred stock into an aggregate of 36,484,920 shares of our common stock effective immediately prior to the closing of this offering; and |
| • | on a pro forma as adjusted basis to give effect to (1) the issuance and sale by us of shares of common stock in this offering, and our receipt of our net proceeds from the sale of such shares at an assumed initial public offering price of $ per share (the midpoint of the range listed on the cover page of this prospectus), after deducting estimated underwriting discounts and commissions and estimated offering expenses payable by us, (2) the conversion of all outstanding shares of our convertible preferred stock into common stock immediately prior to the closing of this offering and (3) the amendment and restatement of our certificate of incorporation immediately prior to the closing of this offering. |
The information below is illustrative only. Our cash and cash equivalents and capitalization following this offering will depend upon the actual initial public offering price and other terms of this offering determined at pricing. You should read this table in conjunction with the sections entitled “Selected Consolidated Financial Data” and “Management’s Discussion and Analysis of Financial Condition and Results of Operations” and our consolidated financial statements and related notes included elsewhere in this prospectus.
| As of June 30, 2010 | |||||||||||
| Actual | Pro Forma | Pro Forma as Adjusted | |||||||||
| (unaudited) | |||||||||||
| (in thousands) | |||||||||||
| Cash and cash equivalents |
$ | 34,491 | $ | 34,491 | $ | ||||||
| Long-term obligations, including current portion (excluding deferred revenue) |
$ | 459 | $ | 459 | $ | ||||||
| Stockholders’ equity (deficit): |
|||||||||||
| Convertible preferred stock, $0.001 par value: 37,367 shares authorized, 35,836 shares issued and outstanding, actual; 37,367 shares authorized, no shares issued or outstanding, pro forma; 10,000 shares authorized, no shares issued or outstanding, pro forma as adjusted |
35 | — | |||||||||
| Common stock, $0.001 par value, 70,000 shares authorized, 16,081 shares issued and outstanding, actual; 70,000 shares authorized, 52,566 shares issued and outstanding, pro forma; 125,000 shares authorized, shares issued and outstanding, pro forma as adjusted |
16 | 53 | |||||||||
| Additional paid-in capital |
60,773 | 60,771 | |||||||||
| Additional paid-in capital—warrants |
222 | 222 | |||||||||
| Accumulated deficit |
(25,574 | ) | (25,574 | ) | |||||||
| Total stockholders’ equity |
35,472 | 35,472 | |||||||||
| Total capitalization |
$ | 70,422 | $ | 70,422 | $ | ||||||
The number of shares in the table above excludes, as of June 30, 2010:
| • | 1,296,485 shares of common stock available for issuance under our 2000 Stock Option/Stock Issuance Plan, which shares, to the extent they remain available for issuance, will cease to be available for issuance under our 2000 Stock Option/Stock Issuance Plan and become available for issuance under our 2010 Incentive Plan effective upon the closing of this offering; |
34
Table of Contents
| • | 15,651,119 shares of common stock issuable upon exercise of outstanding stock options at a weighted average exercise price of $0.87 per share granted under our 2000 Stock Option/Stock Issuance Plan or our 1998 Stock Option Plan (including shares we expect to be sold in this offering by certain selling stockholders upon the exercise of vested stock options prior to the closing of this offering), which shares, to the extent such stock options expire unexercised following this offering, will again become available for issuance under our 2010 Incentive Plan; |
| • | 200,000 shares of common stock issuable upon exercise of outstanding stock options at an exercise price of $0.50 per share granted outside of our equity compensation plans as a charitable donation; |
| • | 4,340,250 shares of common stock, subject to increase on an annual basis, reserved for issuance under our 2010 Incentive Plan, which will become effective upon the closing of this offering; and |
| • | 308,559 shares of common stock issuable upon exercise of outstanding warrants at a weighted-average exercise price of $2.07 per share, giving effect to the conversion of warrants to purchase shares of our preferred stock, into warrants to purchase shares of our common stock, which conversion will occur prior to the closing of this offering. |
35
Table of Contents
If you invest in our common stock, you will experience dilution to the extent of the difference between the initial public offering price per share of our common stock in this offering and the pro forma, as adjusted net tangible book value per share of our common stock immediately after this offering.
As of June 30, 2010, our net tangible book value was $32.8 million, or $2.04 per share of common stock. Our pro forma net tangible book value as of June 30, 2010 was $32.8 million, or $0.62 per share of common stock. Pro forma net tangible book value per share represents total tangible assets less total liabilities, divided by the number of shares of common stock outstanding after giving effect to the conversion of all outstanding shares of our convertible preferred stock into an aggregate of 36,484,920 shares of our common stock effective immediately prior to the closing of this offering. After giving further effect to the issuance and sale by us of shares of our common stock in this offering at an assumed initial public offering price of $ per share (the midpoint of the estimated price range set forth on the cover page of this prospectus), and after deducting the underwriting discounts and commissions and our estimated offering expenses payable by us, our pro forma, as adjusted net tangible book value as of June 30, 2010 would have been $ million, or $ per share. This represents an immediate increase in net tangible book value of $ per share to our existing stockholders and an immediate dilution of $ per share to our new investors purchasing shares of common stock in this offering.
The following table illustrates this dilution on a per share basis:
| Assumed initial public offering price |
$ | $ | ||||
| Pro forma net tangible book value per share as of June 30, 2010 |
||||||
| Increase per share attributable to sale of shares of our common stock in this offering |
||||||
| Pro forma, as adjusted net tangible book value per share immediately after this offering |
||||||
| Dilution per share to new investors |
$ | $ | ||||
The following table sets forth as of June 30, 2010, on the pro forma as adjusted basis described above, the difference between the number of shares of common stock purchased from us, the total consideration paid and the average price per share paid by existing stockholders, and the number of shares of common stock purchased from us, the total consideration paid and the average price per share paid by investors purchasing shares in this offering, based on an assumed initial public offering price of $ per share and before deducting underwriting discounts and commissions and estimated offering expenses payable by us:
| Total Shares | Total Consideration | Average Price Per Share | ||||||||||||
| Number | Percent | Amount | Percent | |||||||||||
| Existing stockholders |
52,565,725 | % | $ | 57,292,199 | % | $ | 1.09 | |||||||
| New investors |
||||||||||||||
| Total |
% | $ | % | |||||||||||
If the underwriters exercise their over-allotment option in full, the number of shares purchased by the new investors will be increased to , or approximately % of the total number of shares of our common stock outstanding after this offering. A $1.00 increase (decrease) in the assumed initial public offering price of $ per share would increase (decrease) total consideration paid by new stockholders by $ million, assuming the number of shares offered by us, as set forth on the cover page of this prospectus, remains the same and after deducting estimated underwriting discounts and commissions and estimated offering expenses payable by us.
36
Table of Contents
The tables and calculations above are based on 52,565,725 shares of common stock issued and outstanding as of June 30, 2010, and exclude, as of that date:
| • | 1,296,485 shares of common stock available for issuance under our 2000 Stock Option/Stock Issuance Plan, which shares, to the extent they remain available for issuance, will cease to be available for issuance under our 2000 Stock Option/Stock Issuance Plan and become available for issuance under our 2010 Incentive Plan effective upon the closing of this offering; |
| • | 15,651,119 shares of common stock reserved for issuance upon exercise of outstanding stock options at a weighted average price of $0.87 per share granted under our 2000 Stock Option/Stock Issuance Plan or our 1998 Stock Option Plan (including shares we expect to be sold in this offering by certain selling stockholders upon the exercise of vested stock options prior to the closing of this offering), which shares, to the extent such stock options expire unexercised following this offering, will again become available for issuance under our 2010 Incentive Plan; |
| • | 200,000 shares of common stock issuable upon exercise of outstanding stock options at an exercise price of $0.50 per share granted outside of our equity compensation plans as a charitable donation; |
| • | 4,340,250 shares of common stock, subject to increase on an annual basis, reserved for issuance under our 2010 Incentive Plan, which will become effective upon the closing of this offering; and |
| • | 308,559 shares of common stock issuable upon exercise of outstanding warrants at a weighted-average exercise price of $2.07 per share, giving effect to the conversion of warrants to purchase shares of our preferred stock into warrants to purchase shares of our common stock, which conversion will occur prior to the closing of this offering. |
37
Table of Contents
SELECTED CONSOLIDATED FINANCIAL DATA
We have derived the following consolidated statement of operations data for 2007, 2008 and 2009 and consolidated balance sheet data as of December 31, 2008 and 2009 from our audited consolidated financial statements included elsewhere in this prospectus. We have derived the following consolidated statement of operations data for 2005 and 2006 and consolidated balance sheet data as of December 31, 2005, 2006 and 2007 from our audited consolidated financial statements not included in this prospectus. We have derived the following consolidated statement of operations data for the six months ended June 30, 2009 and 2010 and consolidated balance sheet data as of June 30, 2010 from our unaudited consolidated financial statements included elsewhere in this prospectus. The unaudited interim consolidated financial statements have been prepared on the same basis as the annual audited consolidated financial statements, and in the opinion of management, reflect all adjustments, which include only normally recurring adjustments, necessary to present fairly our financial position at June 30, 2010 and results of operations and cash flows for the six months ended June 30, 2009 and June 30, 2010. The results of the six months ended June 30, 2010 are not necessarily indicative of the results to be expected for the year ending December 31, 2010 or for any other interim period or for any other future year. You should read the consolidated financial data set forth below in conjunction with our consolidated financial statements and related notes and the information under “Management’s Discussion and Analysis of Financial Condition and Results of Operations” including elsewhere in this prospectus. Our historical results are not necessarily indicative of our results to be expected in any future period.
38
Table of Contents
| Year Ended December 31, | Six Months Ended June 30, |
|||||||||||||||||||||||||||
| 2005 | 2006 | 2007 | 2008 | 2009 | 2009 | 2010 | ||||||||||||||||||||||
| (unaudited) | ||||||||||||||||||||||||||||
| (in thousands, except per share data) | ||||||||||||||||||||||||||||
| Consolidated Statements of Operations Data: |
||||||||||||||||||||||||||||
| Revenue: |
||||||||||||||||||||||||||||
| Software license fees |
$ | 18,131 | $ | 20,740 | $ | 25,976 | $ | 32,480 | $ | 37,289 | $ | 15,580 | $ | 18,261 | ||||||||||||||
| Maintenance and professional services |
13,894 | 20,485 | 23,207 | 29,899 | 36,717 | 16,874 | 21,824 | |||||||||||||||||||||
| Total revenue |
32,025 | 41,225 | 49,183 | 62,379 | 74,006 | 32,454 | 40,085 | |||||||||||||||||||||
| Cost of revenue: |
||||||||||||||||||||||||||||
| Software license fees |
53 | 111 | 167 | 172 | 109 | 52 | 37 | |||||||||||||||||||||
| Maintenance and professional services |
3,008 | 5,867 | 5,857 | 6,917 | 7,991 | 3,768 | 5,318 | |||||||||||||||||||||
| Total cost of revenue (1) |
3,061 | 5,978 | 6,024 | 7,089 | 8,100 | 3,820 | 5,355 | |||||||||||||||||||||
| Gross profit |
28,964 | 35,247 | 43,159 | 55,290 | 65,906 | 28,634 | 34,730 | |||||||||||||||||||||
| Operating expenses: |
||||||||||||||||||||||||||||
| Research and development (1) |
5,303 | 7,536 | 9,868 | 12,618 | 12,550 | 6,433 | 7,100 | |||||||||||||||||||||
| Sales and marketing (1) |
16,658 | 20,802 | 28,640 | 32,391 | 39,130 | 17,262 | 22,796 | |||||||||||||||||||||
| General and administrative (1) |
3,282 | 4,193 | 5,016 | 6,062 | 5,627 | 2,392 | 4,229 | |||||||||||||||||||||
| Total operating expenses |
25,243 | 32,531 | 43,524 | 51,071 | 57,307 | 26,087 | 34,125 | |||||||||||||||||||||
| Income (loss) from operations |
3,721 | 2,716 | (365 | ) | 4,219 | 8,599 | 2,547 | 605 | ||||||||||||||||||||
| Other income (expense), net |
31 | 358 | 493 | 307 | 7 | 74 | 1 | |||||||||||||||||||||
| Income (loss) before income taxes |
3,752 | 3,074 | 128 | 4,526 | 8,606 | 2,621 | 606 | |||||||||||||||||||||
| Income tax benefit (expense) |
(140 | ) | (108 | ) | (147 | ) | 1,330 | 10,977 | (651 | ) | (126 | ) | ||||||||||||||||
| Net income (loss) |
3,612 | 2,966 | (19 | ) | 5,856 | 19,583 | 1,970 | 480 | ||||||||||||||||||||
| Accretion and allocation to participating preferred stock |
(2,884 | ) | (2,277 | ) | (485 | ) | (4,197 | ) | (13,868 | ) | (1,396 | ) | (337 | ) | ||||||||||||||
| Net income (loss) attributable to common shareholders |
$ | 728 | $ | 689 | $ | (504 | ) | $ | 1,659 | $ | 5,715 | $ | 574 | $ | 143 | |||||||||||||
| Net income (loss) per common share—basic |
$ | 0.07 | $ | 0.05 | $ | (0.03 | ) | $ | 0.11 | $ | 0.39 | $ | 0.04 | $ | 0.01 | |||||||||||||
| Net income (loss) per common share—diluted |
$ | 0.05 | $ | 0.05 | $ | (0.03 | ) | $ | 0.11 | $ | 0.32 | $ | 0.04 | $ | 0.01 | |||||||||||||
| Net income shares used in computation of net income (loss) per common share: |
||||||||||||||||||||||||||||
| Basic |
10,862 | 13,775 | 14,434 | 14,516 | 14,762 | 14,726 | 15,449 | |||||||||||||||||||||
| Diluted |
14,144 | 14,120 | 14,434 | 14,963 | 18,119 | 15,101 | 22,422 | |||||||||||||||||||||
| Pro forma net income (loss) per common share (unaudited): (2) |
||||||||||||||||||||||||||||
| Basic |
$ | 0.39 | $ | 0.01 | ||||||||||||||||||||||||
| Diluted |
$ | 0.36 | $ | 0.01 | ||||||||||||||||||||||||
| Shares used in computation of pro forma net income (loss) per common share |
||||||||||||||||||||||||||||
| Basic |
50,580 | 51,934 | ||||||||||||||||||||||||||
| Diluted |
53,937 | 58,907 | ||||||||||||||||||||||||||
| Other Data (unaudited): |
||||||||||||||||||||||||||||
| Adjusted EBITDA (3) |
$ | 4,255 | $ | 3,354 | $ | 513 | $ | 5,277 | $ | 9,991 | $ | 3,165 | $ | 1,747 | ||||||||||||||
39
Table of Contents
| December 31, | June 30, | |||||||||||||||||||||
| 2005 | 2006 | 2007 | 2008 | 2009 | 2010 | |||||||||||||||||
| (unaudited) | ||||||||||||||||||||||
| (in thousands) | ||||||||||||||||||||||
| Consolidated Balance Sheet Data: |
||||||||||||||||||||||
| Cash and cash equivalents |
$ | 9,355 | $ | 10,152 | $ | 11,017 | $ | 21,204 | $ | 31,986 | $ | 34,491 | ||||||||||
| Working capital (4) |
3,601 | 6,422 | 6,932 | 11,974 | 20,518 | 24,052 | ||||||||||||||||
| Total assets |
18,080 | 22,588 | 27,120 | 41,947 | 70,252 | 72,854 | ||||||||||||||||
| Deferred revenue (current and non-current) |
8,582 | 11,298 | 14,149 | 20,800 | 26,765 | 28,183 | ||||||||||||||||
| Long-term debt |
— | 225 | 225 | — | — | — | ||||||||||||||||
| Convertible redeemable preferred stock (5) |
52,781 | 53,270 | 53,755 | 52,905 | — | — | ||||||||||||||||
| Total stockholders’ equity (deficit) (5) |
(48,934 | ) | (46,224 | ) | (46,524 | ) | (40,527 | ) | 33,084 | 35,472 | ||||||||||||
| (1) | Includes stock-based compensation expense as follows: |
| December 31, | June 30, | |||||||||||||||||
| 2006 | 2007 | 2008 | 2009 | 2009 | 2010 | |||||||||||||
| Cost of revenue |
$ | 5 | $ | 6 | $ | 8 | $ | 13 | $ | 6 | $ | 12 | ||||||
| Research and development |
12 | 7 | 15 | 30 | 12 | 34 | ||||||||||||
| Sales and marketing |
45 | 56 | 58 | 72 | 32 | 92 | ||||||||||||
| General and administrative |
65 | 74 | 73 | 36 | 21 | 135 | ||||||||||||
| Total stock-based compensation |
$ | 127 | $ | 143 | $ | 154 | $ | 151 | $ | 71 | $ | 273 | ||||||
| (2) | Reflects on a pro forma basis the conversion of all outstanding shares of our convertible preferred stock as of June 30, 2010 into 36,484,920 shares of our common stock immediately prior to the closing of this offering. |
| (3) | We define Adjusted EBITDA as net income plus other income (expense), net, income tax expense (benefit), depreciation and amortization, and stock-based compensation expense. Adjusted EBITDA is a financial measure that is not calculated in accordance with GAAP. The table below provides a reconciliation of this non-GAAP financial measure to the most directly comparable financial measure calculated and presented in accordance with GAAP. Adjusted EBITDA should not be considered as an alternative to net income, operating income or any other measure of financial performance calculated and presented in accordance with GAAP. Our Adjusted EBITDA may not be comparable to similarly titled measures of other organizations because other organizations may not calculate Adjusted EBITDA in the same manner as we do. |
Our management believes that Adjusted EBITDA is a more indicative measure than GAAP financial measures of our core operating performance (the performance of our operations that are directly related to the development, licensing and sale of IT security and compliance automation software and related services) because it eliminates items that either are not part of our core operations, such as investment gains and losses and net interest expense, or do not require cash outlays, such as stock-based compensation. Adjusted EBITDA also excludes depreciation and amortization expense, which is based on a company’s estimate of the useful life of tangible and intangible assets. These estimates can vary relative to the actual performance and actual value of the asset itself, are based on historical costs and may not be indicative of current or future capital expenditures. Adjusted EBITDA assists management in: planning, including the preparation of our annual operating budget; allocating resources to enhance the financial performance of our business; evaluating the effectiveness of our business strategies; and certain communications with our board of directors about our financial performance.
40
Table of Contents
We believe Adjusted EBITDA is useful to investors in evaluating our operating performance for the following reasons:
| • | Adjusted EBITDA is widely used by investors to measure a company’s operating performance without regard to items such as those described above, which can vary substantially from company to company and from period to period depending upon the company’s financing and accounting methods, the book value of the company’s assets, the company’s capital structure, the methods by which the company’s assets were acquired and the timing and amount of stock-based awards; and |
| • | securities analysts frequently use Adjusted EBITDA as a supplemental measure to evaluate the overall operating performance of companies. |
Although Adjusted EBITDA is frequently used by investors and securities analysts in their evaluations of companies, Adjusted EBITDA has limitations as an analytical tool, and you should not consider it in isolation or as a substitute for analysis of our results of operations as reported under GAAP. Some of these limitations are that Adjusted EBITDA does not reflect: our cash expenditures or future requirements for capital expenditures or other contractual commitments; changes in, or cash requirements for, our working capital needs; interest expense or interest income; or cash requirements for income taxes. In addition, other companies in our industry may calculate Adjusted EBITDA differently than we do, limiting its usefulness as a comparative measure.
The following table presents a reconciliation of Adjusted EBITDA to net income, the most comparable GAAP measure, for each of the periods indicated.
| Year Ended December 31, | Six Months Ended June 30, |
|||||||||||||||||||||||||||
| 2005 | 2006 | 2007 | 2008 | 2009 | 2009 | 2010 | ||||||||||||||||||||||
| (in thousands) | ||||||||||||||||||||||||||||
| Reconciliation of Adjusted EBITDA to Net Income |
||||||||||||||||||||||||||||
| Net income (loss) |
$ | 3,612 | $ | 2,966 | $ | (19 | ) | $ | 5,856 | $ | 19,583 | $ | 1,970 | $ | 480 | |||||||||||||
| Other income (expense), net |
(31 | ) | (358 | ) | (493 | ) | (307 | ) | (7 | ) | (74 | ) | (1 | ) | ||||||||||||||
| Income tax expense (benefit) |
140 | 108 | 147 | (1,330 | ) | (10,977 | ) | 651 | 126 | |||||||||||||||||||
| Depreciation |
534 | 511 | 735 | 904 | 1,091 | 547 | 660 | |||||||||||||||||||||
| Amortization |
— | — | — | — | 150 | — | 209 | |||||||||||||||||||||
| Stock-based compensation expense |
— | 127 | 143 | 154 | 151 | 71 | 273 | |||||||||||||||||||||
| Adjusted EBITDA |
$ | 4,255 | $ | 3,354 | $ | 513 | $ | 5,277 | $ | 9,991 | $ | 3,165 | $ | 1,747 | ||||||||||||||
| (4) | Working capital represents current assets minus current liabilities. |
| (5) | The redemption provision for our outstanding shares of convertible preferred stock expired in June 2009. Upon this expiration, we reclassified $53.8 million in related par value and additional paid-in capital to stockholders’ equity. |
41
Table of Contents
MANAGEMENT’S DISCUSSION AND ANALYSIS OF
FINANCIAL CONDITION AND RESULTS OF OPERATIONS
The following discussion and analysis of our financial condition and results of operations should be read in conjunction with our audited and unaudited consolidated financial statements and related notes included elsewhere in this prospectus. In addition to historical consolidated financial information, the following discussion contains forward-looking statements that reflect our plans, estimates and beliefs. Our actual results may differ materially from those contained in or implied by any forward-looking statements. Please read “Special Note Regarding Forward-Looking Statements and Industry Data.” Factors that could cause or contribute to these differences include those discussed below and elsewhere in this prospectus, particularly in “Risk Factors.”
Overview
We are a leading provider of IT security and compliance automation software solutions that help protect physical and virtual IT infrastructure, prove compliance and prevent outages for enterprises and government agencies. Our software intelligently identifies on a real-time basis security threats and compliance breaches, often otherwise undetected for months, by tracking high volumes of changes and events across an organization’s IT infrastructure, automatically analyzing this data to identify security threats and compliance breaches, and helping remediate these issues. As of June 30, 2010, we had sold our products and services to over 5,500 customers in 88 countries worldwide, including 45% of the Fortune 500, 27 of 30 U.S. federal government executive branch agencies, and many other domestic and foreign governments.
We were founded in 1997 and launched our initial product, Tripwire for Servers, in 1998, and our current flagship product, Tripwire Enterprise, in 2004. In January 2010, we formally launched Tripwire Log Center, which is based on technology we acquired in August 2009. Substantially all of our revenue through 2009 has been generated from sales of our Tripwire Enterprise and Tripwire for Servers products and related maintenance and professional services. For the six months ended June 30, 2010, revenue for Tripwire Enterprise, Tripwire for Servers and Tripwire Log Center accounted for 86%, 9% and 5%, respectively, of our total revenue. Our future operating results will be affected by, among other things, the extent to which our Tripwire Log Center gains market acceptance.
In 2007, 2008, 2009 and the six months ended June 30, 2010, we derived approximately 22%, 29%, 24% and 26%, respectively, of our revenue from sales to customers outside the United States. As part of our growth strategy, we are seeking to expand our international sales and operations, in part due to opportunities provided in global markets where the scope of compliance regulations continues to increase. In 2008, 2009 and the six months ended June 30, 2010, we derived approximately 15%, 17% and 17%, respectively, of our license and professional services revenue from sales directly and indirectly to departments and agencies of the United States federal government. Our growth strategy also includes efforts to expand our sales to the public sector. Our future operating results will be affected by, among other things, our success in expanding our international sales and our sales to the public sector.
We have had six consecutive years of revenue growth and positive operating cash flows. Our revenue has grown from $32.0 million in 2005 to $74.0 million in 2009. Revenue for the six months ended June 30, 2010 was $40.1 million. Our revenue follows a typical enterprise sales cycle, where revenue in the first half of the year is generally lower than revenue in the second half of the year. For 2008 and 2009, our operating income was $4.2 million and $8.6 million, respectively, and our operating cash flow for the same periods was $12.1 million and $15.2 million, respectively. For the six months ended June 30, 2010, we recorded operating income of $0.6 million, and we generated $2.4 million of cash from our operating activities. The operating margin for the six months ended June 30, 2010 was 1.5% of revenue, compared to operating margins of 6.8% and 11.6% in 2008 and 2009, respectively. Although some of the decrease in the 2010 operating margin is attributable to the seasonality of our business, the decrease in operating margin primarily reflects an increased cost structure as we
42
Table of Contents
have invested in sales and marketing initiatives designed to increase revenue in future periods. Additionally, we have invested in our administrative functions to support the growth of our business and prepare for our becoming a public company.
We initially funded our operations through convertible preferred stock financings that raised a total of $55.1 million through June 2003. Subsequently we have funded our operations primarily through cash from operations. As of June 30, 2010, we had cash and cash equivalents of $34.5 million, accounts receivable of $15.3 million, $28.2 million in deferred revenue, primarily related to maintenance contracts, and an aggregate of $8.7 million in accounts payable and accrued liabilities. We currently have no debt.
Key Components of Results of Operations
Our sales transactions typically include a perpetual software license and a contract for first-year maintenance which is renewable annually at the customer’s option. Maintenance includes unspecified software updates and upgrades and access to customer support. At the customer’s request, we also provide professional services for installation, remote management, implementation and training. We sell our products and services primarily through our direct sales force. To a lesser extent we also use resellers and systems integrators, particularly in sales to government agencies and international customers. Our sales cycle can be lengthy and often covers several months, particularly for larger transactions. Our customers’ initial orders are often followed by one or more additional orders as our solutions are deployed onto additional IT infrastructure elements and into other business units within the customer’s organization.
We recognize revenue pursuant to Accounting Standards Codification (ASC) Topic 985-605 regarding software revenue recognition, which specifies that software license revenue may be recognized upon product delivery provided that certain requirements are met, including establishment of vendor-specific objective evidence of fair value (VSOE), for each undelivered element of multiple element customer contracts.
Software Licenses
We price our software licenses for our Tripwire Enterprise and Tripwire for Servers products based on a number of factors, including the type and number of devices that our customers intend to monitor using our software. Tripwire Log Center product licenses are priced based primarily on specified levels of IT infrastructure activity. Software licenses are invoiced at the time of delivery. As a result of the increase in the number of larger orders, we expect that our revenue may become more volatile as the timing of delivery of licenses for these larger orders near the end of a reporting period may cause a significant variance in revenue from quarter to quarter.
Maintenance and Professional Services
Maintenance Contracts. Maintenance contracts provide rights to unspecified software product updates and upgrades, maintenance releases and patches, if and when released, and Internet and telephone access to support personnel and content during the term of the maintenance contract. For new product sales, maintenance contract terms begin upon receipt of the product. Maintenance revenue is generated both from the one-year maintenance contracts that are purchased with software licenses and from maintenance contract renewals. Maintenance contracts are generally sold on an annual term, invoiced in advance and recorded as deferred revenue that is recognized ratably over the duration of the agreed upon service period. To the extent our customer base expands, we expect maintenance revenue to continue to grow. For 2007, 2008 and 2009, our maintenance renewal rates were approximately 82%, 90% and 90%, respectively.
Professional Services. Although most of our customers are able to install our software unassisted and are often able to resolve technical issues without the need to contact our support representatives, we offer professional services for those customers desiring expert assistance.
43
Table of Contents
We offer the following professional services designed to help our customers maximize the value they receive from our products:
| • | basic services, consisting of installation and configuration services to help customers quickly implement the core capabilities of our products; |
| • | advanced services, including project management, integration, and custom policy development to accommodate unique situations or special needs; and |
| • | training, including instructor-led public and onsite training to prepare our customers to install, configure, operate, and maintain their Tripwire products. |
Basic services engagements, which represent the majority of our professional services revenue, generally last no longer than ten days. Professional services are generally priced on a time-and-materials basis and invoiced and recognized as the work is performed.
In 2009, we formally introduced two managed services offerings, remote implementation and on-going operational services, for our customers that choose to have our staff manage their Tripwire software deployment. Revenue for remote implementation services is recognized as the services are performed. On-going operational services are generally invoiced on an annual basis and recognized ratably over the term of service.
Cost of Revenue
Cost of software license revenue consists of third-party royalties and payments to a fulfillment provider for delivery of our products to the small percentage of customers that request physical delivery. Since our products are primarily delivered via the Internet, we do not incur significant product delivery costs.
Cost of maintenance and professional services revenue consists primarily of salaries and benefits for support and services personnel, cost of services provided by subcontractors for professional services, travel and other out-of-pocket expenses, facilities costs and other direct and allocated overhead. We allocate overhead costs for general expenses such as office supplies, computer supplies, utilities, rent, and depreciation for furniture and equipment to functional departments based on the relative headcount of the respective departments. While we expect that cost of revenue will grow in absolute dollars consistent with expected growth in revenue, we expect gross profit as a percentage of revenue to remain relatively consistent for the foreseeable future.
Operating Expenses
Research and Development Expenses. Research and development expenses consist primarily of salaries and benefits for employees and costs of contract personnel engaged in the development of new products, the enhancement of existing products and quality assurance activities and, to a lesser extent, facilities costs and other direct and allocated overhead. To date, we have not capitalized any of our software development costs because the timing of the commercial release of our products has substantially coincided with the attainment of technological feasibility. We expect that research and development expenses will increase in absolute dollars as we continue to invest in research and development activities to develop new products and expand the functionality of our existing products. Additionally, we expect that increased valuations for our common stock resulting from our initial public offering will result in increased stock-based compensation expense. We do not expect the rate of increases in research and development to exceed expected rates of increases in future revenue, and as such, we believe that research and development expenses will decrease as a percentage of revenue.
Sales and Marketing Expenses. Sales and marketing expenses consist primarily of salaries, commissions and benefits for sales and marketing employees and consultants; travel and related out-of-pocket expenses; expenses for marketing programs, such as trade shows and user conferences, lead-generation programs, marketing materials and corporate communications; and facilities costs and other direct and allocated overhead. Commissions on sales of software licenses and initial and renewal maintenance agreements are typically earned
44
Table of Contents
and expensed when revenue recognition for the respective revenue elements commences and for professional services when the service is accepted and the customer is invoiced. Commission rates for sales employees are based on annual quotas, and when quotas are exceeded, commission rates accelerate. We intend to hire additional sales and marketing personnel, initiate additional marketing programs and build additional relationships with resellers, system integrators and other channel partners on a global basis. Additionally, we expect increased stock-based compensation expense in future periods. Accordingly, we expect that our sales and marketing expenses will continue to increase for the foreseeable future in absolute dollars. We expect sales and marketing expense to remain relatively stable in the near term, as a percentage of revenue. As we leverage our sales and marketing personnel and our distribution partnerships in future years, we expect our sales and marketing expense to decrease as a percentage of total revenue.
General and Administrative Expenses. General and administrative expenses consist primarily of salaries and benefits for certain members of the management team, finance, information systems and human resources personnel and consultants; accounting and legal fees, insurance costs, bad debt expense and other direct and allocated overhead. We have incurred and expect to incur significant costs related to our initial public offering. Following the closing of this offering, certain costs will increase, including, among other things, those for SEC reporting compliance, investor relations, directors’ compensation and indemnity insurance. Additionally, we expect increased stock-based compensation expense. As a result, general and administrative expenses are expected to increase both in absolute dollars and as a percentage of revenue compared to historical levels.
Other Income (Expense), Net
Other income (expense), net consists of interest earned on our cash and cash equivalents and foreign currency transaction gains and losses, net of any interest accrued on borrowed funds. Our interest income varies in each reporting period depending on our average cash balances during the period and the current level of interest rates. Similarly, our foreign currency transaction gains and losses will also vary depending upon the volume of transactions denominated in foreign currency and movements in underlying exchange rates.
Provision for Income Taxes
We are subject to income tax in U.S. and foreign jurisdictions and account for income taxes using the asset and liability method. Under this approach, deferred tax assets and liabilities are recognized for the future tax consequences attributable to differences between financial statement carrying amounts of existing assets and liabilities and their respective tax bases. Deferred tax assets and liabilities are measured using enacted tax rates expected to apply to taxable income in the years in which those temporary differences are expected to be recovered or settled. The effect on deferred tax assets and liabilities of a change in tax rates is recognized in income in the period that includes the enactment date. We have historically maintained a valuation allowance against deferred tax assets; however, in 2008 and 2009, we reversed substantially all of the valuation allowance against deferred tax assets as our historical operating results and forecasted financial performance indicated that our deferred tax assets were more likely than not to be realized.
45
Table of Contents
Results of Operations
The following table presents selected items in our consolidated statements of operations in dollars for 2007, 2008 and 2009 and the six months ended June 30, 2009 and 2010.
| Year Ended December 31, |
Six Months Ended June 30, |
|||||||||||||||||
| 2007 | 2008 | 2009 | 2009 | 2010 | ||||||||||||||
| (unaudited) | ||||||||||||||||||
| (dollars in thousands) | ||||||||||||||||||
| Revenue: |
||||||||||||||||||
| Software licenses |
$ | 25,976 | $ | 32,480 | $ | 37,289 | $ | 15,580 | $ | 18,261 | ||||||||
| Maintenance and professional services |
23,207 | 29,899 | 36,717 | 16,874 | 21,824 | |||||||||||||
| Total revenue |
49,183 | 62,379 | 74,006 | 32,454 | 40,085 | |||||||||||||
| Cost of revenue (1) |
6,024 | 7,089 | 8,100 | 3,820 | 5,355 | |||||||||||||
| Gross profit |
43,159 | 55,290 | 65,906 | 28,634 | 34,730 | |||||||||||||
| Operating expenses: |
||||||||||||||||||
| Research and development (1) |
9,868 | 12,618 | 12,550 | 6,433 | 7,100 | |||||||||||||
| Sales and marketing (1) |
28,640 | 32,391 | 39,130 | 17,262 | 22,796 | |||||||||||||
| General and administrative (1) |
5,016 | 6,062 | 5,627 | 2,392 | 4,229 | |||||||||||||
| Operating income (loss) |
(365 | ) | 4,219 | 8,599 | 2,547 | 605 | ||||||||||||
| Other income (expense), net |
493 | 307 | 7 | 74 | 1 | |||||||||||||
| Income tax benefit (expense) |
(147 | ) | 1,330 | 10,977 | (651 | ) | (126 | ) | ||||||||||
| Net income (loss) |
$ | (19 | ) | $ | 5,856 | $ | 19,583 | $ | 1,970 | $ | 480 | |||||||
|
(1) Includes stock-based compensation expense as follows: |
| |||||||||||||||||
| Cost of revenue |
$ | 6 | $ | 8 | $ | 13 | $ | 6 | $ | 12 | ||||||||
| Research and development |
7 | 15 | 30 | 12 | 34 | |||||||||||||
| Sales and marketing |
56 | 58 | 72 | 32 | 92 | |||||||||||||
| General and administrative |
74 | 73 | 36 | 21 | 135 | |||||||||||||
| Total stock compensation |
$ | 143 | $ | 154 | $ | 151 | $ | 71 | $ | 273 | ||||||||
Comparison of Six Months Ended June 30, 2009 and 2010
Revenue in the six months ended June 30, 2010 reflects a 24% increase compared to revenue for the six months ended June 30, 2009, primarily attributable to successful execution of our growth strategy. Our operating margin for the six months ended June 30, 2010 was 1.5% of revenue, compared to an operating margin 7.8% of revenue for the six months ended June 30, 2009. In the current year, we have invested more significantly in sales and marketing initiatives to support growth in revenue in future periods. Additionally, we have invested in our administrative functions to support the growth of our business and prepare for our being a public company.
Revenue
| Six Months Ended June 30, | ||||||||||||||||||
| 2009 | 2010 | Change | ||||||||||||||||
| Amount | Percentage of Revenue |
Amount | Percentage of Revenue |
$ | % | |||||||||||||
| Revenue | ||||||||||||||||||
| (dollars in thousands, unaudited) |
||||||||||||||||||
| Software licenses |
$ | 15,580 | 48.0 | % | $ | 18,261 | 45.6 | % | $ | 2,681 | 17.2 | % | ||||||
| Maintenance and professional services |
16,874 | 52.0 | 21,824 | 54.4 | 4,950 | 29.3 | ||||||||||||
| Total revenue |
$ | 32,454 | 100.0 | % | $ | 40,085 | 100.0 | % | $ | 7,631 | 23.5 | % | ||||||
46
Table of Contents
Revenue was $40.1 million for the six months ended June 30, 2010, compared to $32.5 million for the six months ended June 30, 2009, an increase of $7.6 million, or 24%.
Software license revenue was $18.3 million for the six months ended June 30, 2010, compared to $15.6 million for the six months ended June 30, 2009, an increase of $2.7 million, or 17%. Of the increase in software license revenue, $2.4 million was attributable to a 122% increase in international license revenue for the six months ended June 30, 2010 compared to the six months ended June 30, 2009. Software license revenue for the six months ended June 30, 2010 also benefited from revenue from the formal introduction of our Tripwire Log Center product.
Maintenance and professional services revenue was $21.8 million for the six months ended June 30, 2010 compared to $16.9 million for the six months ended June 30, 2009, an increase of $4.9 million, or 29%. The following table presents detail of our maintenance and professional services revenue:
| Six Months Ended June 30, | ||||||||||||||||||
| 2009 | 2010 | Change | ||||||||||||||||
| Amount | Percentage of total Revenue |
Amount | Percentage of total Revenue |
$ | % | |||||||||||||
| Revenue | ||||||||||||||||||
| (dollars in thousands, unaudited) |
||||||||||||||||||
| Maintenance |
$ | 14,049 | 43.6 | % | $ | 17,217 | 43.0 | % | $ | 3,168 | 22.5 | % | ||||||
| Professional services |
2,825 | 8.7 | 4,607 | 11.5 | 1,782 | 63.1 | ||||||||||||
| $ | 16,874 | 52.0 | % | $ | 21,824 | 54.4 | % | $ | 4,950 | 29.3 | % | |||||||
The $3.2 million, or 23%, increase in maintenance contract revenue resulted from a larger installed base due to sales of licenses to new customers and renewals of maintenance contracts. The $1.8 million, or 63%, increase in professional services revenue primarily reflects increased sales to customers and our introduction of managed services offerings.
Cost of Revenue and Gross Profit
| Six Months Ended June 30, | |||||||||||||||||||
| 2009 | 2010 | Change | |||||||||||||||||
| Amount | Percentage of Revenue |
Amount | Percentage of Revenue |
$ | % | ||||||||||||||
| Cost of Revenue and Gross Profit | |||||||||||||||||||
| (dollars in thousands, unaudited) |
|||||||||||||||||||
| Software licenses |
$ | 52 | 0.2 | % | $ | 37 | 0.1 | % | $ | (15 | ) | (28.8 | )% | ||||||
| Maintenance and professional services |
3,768 | 11.6 | 5,318 | 13.3 | 1,550 | 41.1 | |||||||||||||
| Total cost of revenue |
$ | 3,820 | 11.8 | % | $ | 5,355 | 13.4 | % | $ | 1,535 | 40.2 | % | |||||||
| Gross profit |
$ | 28,634 | 88.2 | % | $ | 34,730 | 86.6 | % | $ | 6,096 | 21.3 | % | |||||||
Gross profit was $34.7 million for the six months ended June 30, 2010, compared to $28.6 million for the six months ended June 30, 2009, an increase of $6.1 million, or 21%. Gross profit as a percentage of revenue decreased to 86.6% for the six months ended June 30, 2010 compared to 88.2% for the six months ended June 30, 2009. The decrease in gross profit as a percentage of revenue was primarily related to a $1.5 million, or 41%, increase in cost of revenue for maintenance and professional services due primarily to an increase of $0.7 million in payroll and related costs resulting from a 30% increase in headcount to support our growing installed base, as well as an increase of $0.5 million in contracted support technicians. Additionally, we recorded $0.2 million in non-cash amortization of purchased intangibles related to the acquisition in August 2009 of technology upon which the Tripwire Log Center product is based.
47
Table of Contents
Operating Expenses
| Six Months Ended June 30, | ||||||||||||||||||
| 2009 | 2010 | Change | ||||||||||||||||
| Amount | Percentage of Revenue |
Amount | Percentage of Revenue |
$ | % | |||||||||||||
| Operating Expenses | ||||||||||||||||||
| (dollars in thousands, unaudited) |
||||||||||||||||||
| Research and development |
$ | 6,433 | 19.8 | % | $ | 7,100 | 17.7 | % | $ | 667 | 10.4 | % | ||||||
| Sales and marketing |
17,262 | 53.2 | 22,796 | 56.9 | 5,534 | 32.1 | ||||||||||||
| General and administrative |
2,392 | 7.4 | 4,229 | 10.6 | 1,837 | 76.8 | ||||||||||||
| Total operating expenses |
$ | 26,087 | 80.4 | % | $ | 34,125 | 85.1 | % | $ | 8,038 | 30.8 | % | ||||||
Research and Development. Research and development expenses were $7.1 million for the six months ended June 30, 2010, compared to $6.4 million for the six months ended June 30, 2009, an increase of $0.7 million, or 10%. The increase was primarily due to a $0.5 million increase in payroll and related expenses due to a 9% increase in headcount to support Tripwire Log Center and other product development. Research and development expenses decreased as a percentage of revenue for the six months ended June 30, 2010 compared to the six months ended June 30, 2009, reflecting operating leverage and improved efficiencies in our research and development organization.
Sales and Marketing. Sales and marketing expenses were $22.8 million for the six months ended June 30, 2010, compared to $17.3 million for the six months ended June 30, 2009, an increase of $5.5 million, or 32%. The increase was primarily due to costs incurred to support revenue growth initiatives, including a $2.2 million increase in payroll and related expenses due to a 32% increase in headcount, primarily junior sales personnel hired to support senior sales executives. Marketing expenses increased by $1.7 million to support international and domestic sales initiatives. Commissions expense increased by $0.6 million due to revenue growth compared to the six months ended June 30, 2009.
General and Administrative. General and administrative expenses were $4.2 million for the six months ended June 30, 2010, compared to $2.4 million for the six months ended June 30, 2009, an increase of $1.8 million, or 77%. The increase was primarily due to increased costs to support the growth of our business, including increased payroll and related costs. During the six months ended June 30, 2009 we benefited from a reduction in bad debt expense related to the collection of previously reserved receivables.
Income Taxes
Our income tax expense for the six months ended June 30, 2010 was $0.1 million compared to an income tax expense of $0.7 million for the six months ended June 30, 2009. The six months ended June 30, 2010 reflected a $2.0 million decrease in income (loss) before income taxes and benefited from a discrete charge as a result of a change in state tax rates.
48
Table of Contents
Comparison of Years Ended December 31, 2008 and 2009
Revenue
| Year Ended December 31, | ||||||||||||||||||
| 2008 | 2009 | Change | ||||||||||||||||
| Amount | Percentage of Revenue |
Amount | Percentage of Revenue |
$ | % | |||||||||||||
| Revenue | ||||||||||||||||||
| (dollars in thousands) | ||||||||||||||||||
| Software licenses |
$ | 32,480 | 52.1 | % | $ | 37,289 | 50.4 | % | $ | 4,809 | 14.8 | % | ||||||
| Maintenance and professional services |
29,899 | 47.9 | 36,717 | 49.6 | 6,818 | 22.8 | ||||||||||||
| Total revenue |
$ | 62,379 | 100.0 | % | $ | 74,006 | 100.0 | % | $ | 11,627 | 18.6 | % | ||||||
Revenue was $74.0 million for 2009, compared to $62.4 million for 2008, an increase of $11.6 million, or 19%.
Software license revenue was $37.3 million for 2009, compared to $32.5 million for 2008, an increase of $4.8 million, or 15%. A $6.7 million, or 27%, increase in license revenue from customers in the Americas, substantially all in the U.S. and Canada, was partially offset by a decrease in international revenue of $1.9 million, or 23%. In 2008, our international sales benefited from a significant sale to a foreign government agency.
Maintenance and professional services revenue was $36.7 million for 2009, compared to $29.9 million for 2008, an increase of $6.8 million, or 23%. The following table presents detail of our maintenance and professional services revenue:
| Year Ended December 31, | |||||||||||||||||||
| 2008 | 2009 | Change | |||||||||||||||||
| Amount | Percentage of Revenue |
Amount | Percentage of Revenue |
$ | % | ||||||||||||||
| Revenue | |||||||||||||||||||
| (dollars in thousands) | |||||||||||||||||||
| Maintenance |
$ | 22,926 | 36.7 | % | $ | 29,765 | 40.2 | % | $ | 6,839 | 29.8 | % | |||||||
| Professional services |
6,973 | 11.2 | 6,952 | 9.4 | (21 | ) | (0.3 | ) | |||||||||||
| $ | 29,899 | 47.9 | % | $ | 36,717 | 49.6 | % | $ | 6,818 | 22.8 | % | ||||||||
The $6.8 million, or 30%, increase in maintenance contract revenue resulted from a larger installed base and renewals of maintenance contracts. Despite a 15% growth in software license revenue in 2009 compared to 2008, professional services revenue remained flat primarily because customers that purchased licenses in 2009 required less deployment support than those that purchased licenses in 2008.
49
Table of Contents
Cost of Revenue and Gross Profit
| Year Ended December 31, | |||||||||||||||||||
| 2008 | 2009 | Change | |||||||||||||||||
| Amount | Percentage of Revenue |
Amount | Percentage of Revenue |
$ | % | ||||||||||||||
| Cost of Revenue and Gross Profit | |||||||||||||||||||
| (dollars in thousands) |
|||||||||||||||||||
| Software licenses |
$ | 172 | 0.3 | % | $ | 109 | 0.1 | % | $ | (63 | ) | (36.6 | )% | ||||||
| Maintenance and professional services |
6,917 | 11.1 | 7,991 | 10.8 | 1,074 | 15.5 | |||||||||||||
| Total cost of revenue |
$ | 7,089 | 11.4 | % | $ | 8,100 | 10.9 | % | $ | 1,011 | 14.3 | % | |||||||
| Gross profit |
$ | 55,290 | 88.6 | % | $ | 65,906 | 89.1 | % | $ | 10,616 | 19.2 | % | |||||||
Gross profit was $65.9 million for 2009, compared to $55.3 million for 2008, an increase of $10.6 million, or 19%. The increase in gross profit was due principally to higher sales volumes, as gross profit as a percentage of revenue remained relatively stable. Cost of revenue for maintenance and professional services increased by $1.1 million, primarily due to increased payroll and related charges resulting from a 22% increase in headcount necessary to support the growth of our business.
Operating Expenses
| Year Ended December 31, | |||||||||||||||||||
| 2008 | 2009 | Change | |||||||||||||||||
| Amount | Percentage of Revenue |
Amount | Percentage of Revenue |
$ | % | ||||||||||||||
| Operating Expenses | |||||||||||||||||||
| (dollars in thousands) |
|||||||||||||||||||
| Research and development |
$ | 12,618 | 20.2 | % | $ | 12,550 | 17.0 | % | $ | (68 | ) | (0.5 | )% | ||||||
| Sales and marketing |
32,391 | 51.9 | 39,130 | 52.9 | 6,739 | 20.8 | |||||||||||||
| General and administrative |
6,062 | 9.7 | 5,627 | 7.6 | (435 | ) | (7.2 | ) | |||||||||||
| Total operating expenses |
$ | 51,071 | 81.9 | % | $ | 57,307 | 77.4 | % | $ | 6,236 | 12.2 | % | |||||||
Research and Development Expense. Research and development expenses remained relatively stable at $12.6 million for both 2009 and 2008. An increase of $0.5 million in payroll and related costs was substantially offset by reduced costs for offshore contract personnel as a result of a favorable contract renegotiation with a major sub-contractor. Research and development expense decreased as a percentage of revenue for 2009 compared to 2008, reflecting operating leverage and improved efficiencies in our research and development organization.
Sales and Marketing Expense. Sales and marketing expenses were $39.1 million for 2009, compared to $32.4 million for 2008, an increase of $6.7 million, or 21%. The increase was primarily due to a $2.0 million increase in commission costs resulting from higher revenue and favorable achievement against sales targets and a $2.0 million increase in marketing costs to support international and domestic sales initiatives. The increase also included a $1.6 million increase in payroll and related charges resulting from a 14% increase in headcount and an additional $0.6 million in contract personnel expenses to support business requirements while minimizing headcount increases.
General and Administrative Expense. General and administrative expenses were $5.6 million for 2009, compared to $6.1 million for 2008, a decrease of $0.4 million, or 7%. The decrease was primarily due to a $1.1 million change in bad debt expense as items that were previously reserved were collected in 2009. This decrease
50
Table of Contents
was partially offset by an increase of $0.3 million in legal and accounting fees, primarily due to our acquisition of the technology upon which our Tripwire Log Center product is based, and a $0.3 million increase in contract employee expense.
Other Income (Expense), Net
| Year Ended December 31, | |||||||||||||||
| 2008 | 2009 | Change | |||||||||||||
| Amount | Amount | $ | % | ||||||||||||
| Other Income | |||||||||||||||
| (dollars in thousands) | |||||||||||||||
| Interest income |
$ | 341 | $ | 87 | $ | (254 | ) | (74.5 | )% | ||||||
| Interest expense |
— | (4 | ) | (4 | ) | n/a | |||||||||
| Other income (expense), net |
(34 | ) | (76 | ) | (42 | ) | 123.5 | ||||||||
| $ | 307 | $ | 7 | $ | (300 | ) | (97.7 | )% | |||||||
Other income (expense) decreased by $0.3 million for 2009 compared to 2008 primarily due to decreased investment income as a result of a significant decline in market interest rates.
Income Taxes
Our income tax benefit for 2009 was $11.0 million, an increase of $9.7 million compared to an income tax benefit of $1.3 million for 2008. Despite an increase of $4.1 million in income before income taxes, the application of prior year net operating losses and the net reversal of approximately $11.8 million of our valuation allowance on deferred tax assets resulted in a significant benefit from income taxes in 2009. We reversed substantially all of the valuation allowance against deferred tax assets in 2009 as our historical operating results and forecast financial performance indicated that our deferred tax assets were more likely than not to be realized.
We adopted FASB Interpretation No. 48, Accounting for Uncertainty in Income Taxes, included in ASC Subtopic 740-10, Income Taxes—Overall, as of January 1, 2009. Prior to adoption, we recognized the effect of income tax positions only if such positions were probable of being sustained. In accordance with the interpretation, we now recognize the effect of income tax positions only if those positions are more likely than not of being sustained. Recognized income tax positions are measured at the largest amount that is greater than 50% likely of being realized. Changes in recognition or measurement are reflected in the period in which the change in judgment occurs. There was no impact of adopting this interpretation on our consolidated financial statements.
Comparison of Years Ended December 31, 2007 and 2008
Revenue
| Year Ended December 31, | ||||||||||||||||||
| 2007 | 2008 | Change | ||||||||||||||||
| Amount | Percentage of Revenue |
Amount | Percentage of Revenue |
$ | % | |||||||||||||
| Revenue | ||||||||||||||||||
| (dollars in thousands) | ||||||||||||||||||
| Software licenses |
$ | 25,976 | 52.8 | % | $ | 32,480 | 52.1 | % | $ | 6,504 | 25.0 | % | ||||||
| Maintenance and professional services |
23,207 | 47.2 | 29,899 | 47.9 | 6,692 | 28.8 | ||||||||||||
| Total revenue |
$ | 49,183 | 100.0 | % | $ | 62,379 | 100.0 | % | $ | 13,196 | 26.8 | % | ||||||
51
Table of Contents
Revenue was $62.4 million for 2008, compared to $49.2 million for 2007, an increase of $13.2 million, or 27%.
Software license revenue was $32.5 million for 2008, compared to $26.0 million for 2007, an increase of $6.5 million, or 25%. In 2008, we significantly increased the list price for our Tripwire Enterprise product to monetize our policy library, which resulted in higher per-license revenue in 2008. In addition, $3.4 million of the increase in license revenue was attributable to a 60% increase in international sales in 2008 compared to 2007, due in large part to a significant sale to a foreign government agency.
Maintenance and professional services revenue was $29.9 million for 2008, compared to $23.2 million for 2007, an increase of $6.7 million, or 29%. The following table presents detail of our maintenance and professional services revenue:
| Year Ended December 31, | ||||||||||||||||||
| 2007 | 2008 | Change | ||||||||||||||||
| Amount | Percentage of Total Revenue |
Amount | Percentage of Total Revenue |
$ | % | |||||||||||||
| Revenue | ||||||||||||||||||
| (dollars in thousands) | ||||||||||||||||||
| Maintenance |
$ | 17,903 | 36.4 | % | $ | 22,926 | 36.7 | % | $ | 5,023 | 28.1 | % | ||||||
| Professional services |
5,304 | 10.8 | 6,973 | 11.2 | 1,669 | 31.5 | ||||||||||||
| $ | 23,207 | 47.2 | % | $ | 29,899 | 47.9 | % | $ | 6,692 | 28.8 | % | |||||||
The $5.0 million, or 28%, increase in maintenance contract revenue resulted from a larger installed base. Additionally, there was an increase in professional services revenue of $1.7 million, or 32% which benefited from the overall growth in software license revenue.
Cost of Revenue and Gross Profit
| Year Ended December 31, | ||||||||||||||||||
| 2007 | 2008 | Change | ||||||||||||||||
| Amount | Percentage of Revenue |
Amount | Percentage of Revenue |
$ | % | |||||||||||||
| Cost of Revenue and Gross Profit | ||||||||||||||||||
| (dollars in thousands) | ||||||||||||||||||
| Software licenses |
$ | 167 | 0.3 | % | $ | 172 | 0.3 | % | $ | 5 | 3.0 | % | ||||||
| Maintenance and professional services |
5,857 | 11.9 | 6,917 | 11.1 | 1,060 | 18.1 | ||||||||||||
| Total cost of revenue |
$ | 6,024 | 12.2 | % | $ | 7,089 | 11.4 | % | $ | 1,065 | 17.7 | % | ||||||
| Gross profit |
$ | 43,159 | 87.8 | % | $ | 55,290 | 88.6 | % | $ | 12,131 | 28.1 | % | ||||||
Gross profit was $55.3 million for 2008, compared to $43.2 million for 2007, an increase of $12.1 million, or 28%. The increase in gross profit was primarily due to higher sales volumes and a price increase for our Tripwire Enterprise product. Cost of revenue for maintenance and professional services increased by $1.1 million, primarily due to increased payroll and related charges resulting from a 30% increase in headcount to support our growing base.
52
Table of Contents
Operating Expenses
| Year Ended December 31, | ||||||||||||||||||
| 2007 | 2008 | Change | ||||||||||||||||
| Amount | Percentage of Revenue |
Amount | Percentage of Revenue |
$ | % | |||||||||||||
| Operating Expenses | ||||||||||||||||||
| (dollars in thousands) | ||||||||||||||||||
| Research and development |
$ | 9,868 | 20.1 | % | $ | 12,618 | 20.2 | % | $ | 2,750 | 27.9 | % | ||||||
| Sales and marketing |
28,640 | 58.2 | 32,391 | 51.9 | 3,751 | 13.1 | ||||||||||||
| General and administrative |
5,016 | 10.2 | 6,062 | 9.7 | $ | 1,046 | 20.9 | |||||||||||
| Total operating expenses |
$ | 43,524 | 88.5 | % | $ | 51,071 | 81.9 | % | $ | 7,547 | 17.3 | % | ||||||
Research and Development Expense. Research and development expenses were $12.6 million for 2008, compared to $9.9 million for 2007, an increase of $2.7 million, or 28%. The increase was primarily due to a 13% increase in headcount and the related payroll and benefit costs and expansion of our offshore contract personnel program.
Sales and Marketing Expense. Sales and marketing expenses were $32.4 million for 2008, compared to $28.6 million for 2007, an increase of $3.8 million, or 13%. The increase was primarily due to a $1.6 million increase in payroll and related costs resulting from an 11% increase in headcount and an increase of $1.3 million in commissions expense based on the growth in revenue. Other sales and marketing expenses increased by a total of $0.9 million, including travel, tradeshow and consulting costs, related to sales and marketing initiatives to expand our market presence.
General and Administrative Expense. General and administrative expenses were $6.1 million for 2008, compared to $5.0 million for 2007, an increase of $1.0 million, or 21%. The increase was primarily attributable to a $0.4 million increase in bad debt expense and a $0.5 million increase in salaries, wages and benefits due to merit increases and higher variable incentive compensation.
Other Income (Expense), Net
| Year Ended December 31, | |||||||||||||||
| 2007 | 2008 | Change | |||||||||||||
| Other Income |
Amount | Amount | $ | % | |||||||||||
| (dollars in thousands) |
|||||||||||||||
| Interest income |
$ | 461 | $ | 341 | $ | (120 | ) | (26.0 | )% | ||||||
| Interest expense |
(1 | ) | — | 1 | n/a | ||||||||||
| Other income (expense), net |
33 | (34 | ) | (67 | ) | n/a | |||||||||
| $ | 493 | $ | 307 | $ | (186 | ) | (37.7 | )% | |||||||
Other income (expense) decreased by $0.2 million for 2008 compared to 2007 primarily due to decreased investment yields as a result of the fall in market interest rates, which resulted in a decrease of $0.1 million in interest income.
Income Taxes
Our income tax benefit for 2008 was $1.3 million, compared to income tax expense of $0.1 million 2007. Despite an increase of $4.4 million in income before income taxes, the application of prior year net operating losses and the reversal of approximately $1.5 million of our valuation allowance on deferred tax assets resulted in
53
Table of Contents
a net benefit from income taxes in 2008. We reversed a portion of the valuation allowance against deferred tax assets in 2008 as our historical operating results and forecast financial performance for the year ended December 31, 2009 indicated that a portion of our deferred tax assets were more likely than not to be realized. However, due to the global economic uncertainty that existed during late 2008 and early 2009 and the pre-tax operating loss in 2007, we determined that the remaining portion of our deferred tax assets were not more likely than not to be realizable as of December 31, 2008.
54
Table of Contents
Selected Quarterly Results of Operations
The following table sets forth unaudited quarterly consolidated statements of operations data for 2008, 2009 and the three months ended March 31, 2010 and June 30, 2010. We derived this information from our unaudited consolidated financial statements, which we prepared on the same basis as our audited consolidated financial statements contained in this prospectus. In our opinion, these unaudited statements include all adjustments, consisting only of normal recurring adjustments, that we consider necessary for a fair statement of that information when read in conjunction with the consolidated financial statements and related notes included elsewhere in this prospectus. The operating results for any quarter should not be considered indicative of results for any future period.
| Three Months Ended | ||||||||||||||||||||||||||||||||||||||||
| Mar. 31, 2008 |
Jun. 30, 2008 |
Sep. 30, 2008 |
Dec. 31, 2008 |
Mar. 31, 2009 |
Jun. 30, 2009 |
Sep. 30, 2009 |
Dec. 31, 2009 |
Mar. 31, 2010 |
June 30, 2010 |
|||||||||||||||||||||||||||||||
| (unaudited) | ||||||||||||||||||||||||||||||||||||||||
| (in thousands, except for per share data) | ||||||||||||||||||||||||||||||||||||||||
| Consolidated Statements of Operations: |
||||||||||||||||||||||||||||||||||||||||
| Revenue: |
||||||||||||||||||||||||||||||||||||||||
| Software licenses |
$ | 7,970 | $ | 7,607 | $ | 7,041 | $ | 9,862 | $ | 7,378 | $ | 8,202 | $ | 10,384 | $ | 11,325 | $ | 8,283 | $ | 9,978 | ||||||||||||||||||||
| Maintenance and professional services |
6,528 | 7,170 | 8,146 | 8,055 | 8,156 | 8,718 | 9,625 | 10,218 | 10,356 | 11,468 | ||||||||||||||||||||||||||||||
| Total revenue |
14,498 | 14,777 | 15,187 | 17,917 | 15,534 | 16,920 | 20,009 | 21,543 | 18,639 | 21,446 | ||||||||||||||||||||||||||||||
| Cost of revenue: |
||||||||||||||||||||||||||||||||||||||||
| Software licenses |
38 | 42 | 53 | 39 | 22 | 30 | 22 | 35 | 19 | 18 | ||||||||||||||||||||||||||||||
| Maintenance and professional services |
1,637 | 1,671 | 1,714 | 1,895 | 1,910 | 1,858 | 1,950 | 2,273 | 2,542 | 2,776 | ||||||||||||||||||||||||||||||
| Total cost of revenue (1) |
1,675 | 1,713 | 1,767 | 1,934 | 1,932 | 1,888 | 1,972 | 2,308 | 2,561 | 2,794 | ||||||||||||||||||||||||||||||
| Gross profit |
12,823 | 13,064 | 13,420 | 15,983 | 13,602 | 15,032 | 18,037 | 19,235 | 16,078 | 18,652 | ||||||||||||||||||||||||||||||
| Operating expenses: |
||||||||||||||||||||||||||||||||||||||||
| Research and development (1) |
3,021 | 3,012 | 3,185 | 3,400 | 3,291 | 3,142 | 3,051 | 3,066 | 3,475 | 3,625 | ||||||||||||||||||||||||||||||
| Sales and marketing (1) |
7,924 | 7,294 | 7,648 | 9,525 | 8,367 | 8,895 | 9,402 | 12,466 | 11,199 | 11,597 | ||||||||||||||||||||||||||||||
| General and administrative (1) |
1,584 | 1,267 | 1,189 | 2,022 | 1,181 | 1,211 | 1,567 | 1,668 | 2,076 | 2,153 | ||||||||||||||||||||||||||||||
| Total operating expenses |
12,529 | 11,573 | 12,022 | 14,947 | 12,839 | 13,248 | 14,020 | 17,200 | 16,750 | 17,375 | ||||||||||||||||||||||||||||||
| Income (loss) from operations |
294 | 1,491 | 1,398 | 1,036 | 763 | 1,784 | 4,017 | 2,035 | (672 | ) | 1,277 | |||||||||||||||||||||||||||||
| Other income (expense), net |
39 | 73 | 68 | 127 | 21 | 53 | (21 | ) | (46 | ) | (3 | ) | 4 | |||||||||||||||||||||||||||
| Income (loss) before income taxes |
333 | 1,564 | 1,466 | 1,163 | 784 | 1,837 | 3,996 | 1,989 | (675 | ) | 1,281 | |||||||||||||||||||||||||||||
| Income tax benefit (expense) (2) |
(29 | ) | (67 | ) | (60 | ) | 1,486 | (205 | ) | (446 | ) | 11,711 | (83 | ) | 388 | (514 | ) | |||||||||||||||||||||||
| Net income (loss) |
304 | 1,497 | 1,406 | 2,649 | 579 | 1,391 | 15,707 | 1,906 | (287 | ) | 767 | |||||||||||||||||||||||||||||
| Accretion and allocation to participating preferred stock |
(242 | ) | (1,067 | ) | (1,002 | ) | (1,886 | ) | (410 | ) | (986 | ) | (11,124 | ) | (1,348 | ) | — | (535 | ) | |||||||||||||||||||||
| Net income (loss) attributable to common shareholders |
$ | 62 | $ | 430 | $ | 404 | $ | 763 | $ | 169 | $ | 405 | $ | 4,583 | $ | 558 | $ | (287 | ) | $ | 232 | |||||||||||||||||||
| Net income (loss) per common share—basic |
$ | 0.00 | $ | 0.03 | $ | 0.03 | $ | 0.05 | $ | 0.01 | $ | 0.03 | $ | 0.31 | $ | 0.04 | $ | (0.02 | ) | $ | 0.01 | |||||||||||||||||||
| Net income (loss) per common share— diluted |
$ | 0.00 | $ | 0.03 | $ | 0.03 | $ | 0.05 | $ | 0.01 | $ | 0.03 | $ | 0.26 | $ | 0.02 | $ | (0.02 | ) | $ | 0.01 | |||||||||||||||||||
| Other Data: |
||||||||||||||||||||||||||||||||||||||||
| Adjusted EBITDA (3) |
$ | 535 | $ | 1,744 | $ | 1,653 | $ | 1,345 | $ | 1,068 | $ | 2,097 | $ | 4,312 | $ | 2,514 | $ | (172 | ) | $ | 1,918 | |||||||||||||||||||
|
(1) Includes stock-based compensation expense as follows: |
||||||||||||||||||||||||||||||||||||||||
| Cost of revenue |
$ | 1 | $ | 2 | $ | 2 | $ | 3 | $ | 3 | $ | 3 | $ | 4 | $ | 3 | $ | 4 | $ | 8 | ||||||||||||||||||||
| Research and development |
2 | 2 | 2 | 9 | 4 | 8 | 7 | 11 | 10 | 24 | ||||||||||||||||||||||||||||||
| Sales and marketing |
13 | 13 | 13 | 19 | 14 | 18 | 20 | 20 | 36 | 56 | ||||||||||||||||||||||||||||||
| General and administrative |
16 | 16 | 16 | 25 | 11 | 10 | 8 | 7 | 20 | 115 | ||||||||||||||||||||||||||||||
| Total stock-based compensation expense |
$ | 32 | $ | 33 | $ | 33 | $ | 56 | $ | 32 | $ | 39 | $ | 39 | $ | 41 | $ | 70 | $ | 203 | ||||||||||||||||||||
55
Table of Contents
| (2) | During the three months ended September 30, 2009, we reversed $11.8 million of our allowance on deferred tax assets, as we determined the deferred tax assets were more likely than not to be realized. |
| (3) | We define Adjusted EBITDA as net income plus other income (expense), net, income tax expense (benefit), depreciation and amortization, and stock-based compensation expense. Adjusted EBITDA is a financial measure that is not calculated in accordance with GAAP. Adjusted EBITDA should not be considered as an alternative to net income, operating income, or any other measure of financial performance calculated and presented in accordance with GAAP. Our Adjusted EBITDA may not be comparable to similarly titled measures of other organizations because other organizations may not calculate Adjusted EBITDA in the same manner as we do. The following table presents a reconciliation of Adjusted EBITDA to net income, the most comparable GAAP measure, for each of the periods indicated. For additional information about our use of Adjusted EBITDA, please read note 3 to the tables included in “Selected Consolidated Financial Data” in this prospectus. |
| Three Months Ended | |||||||||||||||||||||||||||||||||||||||
| Mar. 31, 2008 |
Jun. 30, 2008 |
Sep. 30, 2008 |
Dec. 31, 2008 |
Mar. 31, 2009 |
Jun. 30, 2009 |
Sep. 30, 2009 |
Dec. 31, 2009 |
Mar. 31, 2010 |
June
30, 2010 |
||||||||||||||||||||||||||||||
| (unaudited) | |||||||||||||||||||||||||||||||||||||||
| (in thousands, except for per share data) | |||||||||||||||||||||||||||||||||||||||
| Reconciliation of Adjusted EBITDA to Net Income (Loss) |
|||||||||||||||||||||||||||||||||||||||
| Net income (loss) |
$ | 304 | $ | 1,497 | $ | 1,406 | $ | 2,649 | $ | 579 | $ | 1,391 | $ | 15,707 | $ | 1,906 | $ | (287 | ) | $ | 767 | ||||||||||||||||||
| Other (income) expense, net |
(39 | ) | (73 | ) | (68 | ) | (127 | ) | (21 | ) | (53 | ) | 21 | 46 | 3 | (4 | ) | ||||||||||||||||||||||
| Income tax expense (benefit) |
29 | 67 | 60 | (1,486 | ) | 205 | 446 | (11,711 | ) | 83 | (388 | ) | 514 | ||||||||||||||||||||||||||
| Depreciation |
209 | 220 | 222 | 253 | 273 | 274 | 256 | 288 | 325 | 335 | |||||||||||||||||||||||||||||
| Amortization |
— | — | — | — | — | — | — | 150 | 105 | 104 | |||||||||||||||||||||||||||||
| Stock-based compensation expense |
32 | 33 | 33 | 56 | 32 | 39 | 39 | 41 | 70 | 203 | |||||||||||||||||||||||||||||
| Adjusted EBITDA |
$ | 535 | $ | 1,744 | $ | 1,653 | $ | 1,345 | $ | 1,068 | $ | 2,097 | $ | 4,312 | $ | 2,514 | $ | (172 | ) | $ | 1,919 | ||||||||||||||||||
56
Table of Contents
The following table sets forth our historical results, for the periods indicated, as a percentage of our revenue.
| Three Months Ended | ||||||||||||||||||||||||||||||
| Mar. 31, 2008 |
Jun. 30, 2008 |
Sep. 30, 2008 |
Dec. 31, 2008 |
Mar. 31, 2009 |
Jun. 30, 2009 |
Sep. 30, 2009 |
Dec. 31, 2009 |
Mar. 31, 2010 |
June 30, 2010 |
|||||||||||||||||||||
| (unaudited) | ||||||||||||||||||||||||||||||
| Consolidated Statements of Operations: |
||||||||||||||||||||||||||||||
| Revenue: |
||||||||||||||||||||||||||||||
| Software licenses |
55.0 | % | 51.5 | % | 46.4 | % | 55.0 | % | 47.5 | % | 48.5 | % | 51.9 | % | 52.6 | % | 44.4 | % | 46.5 | % | ||||||||||
| Maintenance and professional services |
45.0 | 48.5 | 53.6 | 45.0 | 52.5 | 51.1 | 48.1 | 47.4 | 55.6 | 53.5 | ||||||||||||||||||||
| Total revenue |
100.0 | 100.0 | 100.0 | 100.0 | 100.0 | 100.0 | 100.0 | 100.0 | 100.0 | 100.0 | ||||||||||||||||||||
| Cost of Revenue: |
||||||||||||||||||||||||||||||
| Software licenses |
0.3 | 0.3 | 0.3 | 0.2 | 0.1 | 0.2 | 0.1 | 0.2 | 0.1 | 0.1 | ||||||||||||||||||||
| Maintenance and professional services |
11.3 | 11.3 | 11.3 | 10.6 | 12.3 | 11.0 | 9.7 | 10.6 | 13.6 | 12.9 | ||||||||||||||||||||
| Total cost of revenue |
11.6 | 11.6 | 11.6 | 10.8 | 12.4 | 11.2 | 9.9 | 10.7 | 13.7 | 13.0 | ||||||||||||||||||||
| Gross profit |
88.4 | 88.4 | 88.4 | 89.2 | 87.6 | 88.8 | 90.1 | 89.3 | 86.3 | 87.0 | ||||||||||||||||||||
| Operating expenses: |
||||||||||||||||||||||||||||||
| Research and development |
20.8 | 20.4 | 21.0 | 19.0 | 21.2 | 18.6 | 15.2 | 14.2 | 18.6 | 16.9 | ||||||||||||||||||||
| Sales and marketing |
54.7 | 49.4 | 50.4 | 53.2 | 53.9 | 52.6 | 47.0 | 57.9 | 60.1 | 54.1 | ||||||||||||||||||||
| General and administrative |
10.9 | 8.6 | 7.8 | 11.3 | 7.6 | 7.2 | 7.8 | 7.7 | 11.1 | 10.0 | ||||||||||||||||||||
| Total operating expenses |
86.4 | 78.3 | 79.2 | 83.4 | 82.7 | 78.3 | 70.1 | 79.8 | 89.9 | 81.0 | ||||||||||||||||||||
| Income (loss) from operations |
2.0 | 10.1 | 9.2 | 5.8 | 4.9 | 10.5 | 20.1 | 9.4 | (3.6 | ) | 6.0 | |||||||||||||||||||
| Other income (expense), net |
0.3 | 0.5 | 0.4 | 0.7 | 0.1 | 0.3 | (0.1 | ) | (0.2 | ) | 0.0 | 0.0 | ||||||||||||||||||
| Income (loss) before income taxes |
2.3 | 10.6 | 9.7 | 6.5 | 5.0 | 10.9 | 20.0 | 9.2 | (3.6 | ) | 6.0 | |||||||||||||||||||
| Income tax benefit (expense) |
(0.2 | ) | (0.5 | ) | (0.4 | ) | 8.3 | (1.3 | ) | (2.6 | ) | 58.5 | (0.4 | ) | 2.1 | (2.4 | ) | |||||||||||||
| Net income (loss) |
2.1 | 10.1 | 9.3 | 14.8 | 3.7 | 8.2 | 78.5 | 8.8 | (1.5 | ) | 3.6 | |||||||||||||||||||
| Accretion and allocation to participating preferred stock |
(1.7 | ) | (7.2 | ) | (6.6 | ) | (10.5 | ) | (2.6 | ) | (5.8 | ) | (55.6 | ) | (6.3 | ) | 0.0 | (2.5 | ) | |||||||||||
| Net income (loss) attributable to common shareholders |
0.4 | % | 2.9 | % | 2.7 | % | 4.3 | % | 1.1 | % | 2.4 | % | 22.9 | % | 2.6 | % | (1.5 | )% | 1.1 | % | ||||||||||
| Other Data: |
||||||||||||||||||||||||||||||
| Adjusted EBITDA |
3.7 | % | 11.8 | % | 10.9 | % | 7.5 | % | 6.9 | % | 12.4 | % | 21.6 | % | 11.7 | % | (0.9 | )% | 8.9 | % | ||||||||||
On an annual basis, we have historically generated our lowest quarterly revenue amounts in the first quarter and our highest quarterly revenue amounts in the fourth quarter of each year. Many of our customers do not finalize their budgets for spending on our products until after the first quarter of a given year and often spend the largest portion of their budgets in the fourth quarter. Seasonal purchasing patterns of international customers and the U.S. government can also materially impact our quarter to quarter operating results. Additionally, our sales and marketing expenses may be weighted heavily in the fourth quarter of a year as accelerated commission rates on sales that exceed annual quotas, if applicable, tend to occur in the final quarter of a year.
Our revenue within a particular quarter is often significantly affected by the unpredictable procurement patterns of our prospective customers. Many of our prospective customers do not finalize their purchasing decisions until the last few weeks or days of a quarter. As a result, we have historically generated the majority of our software license revenue in the final month of each quarter. We expect these purchasing patterns to continue in the future. Therefore, a delay in even one large order beyond the end of the quarter could materially reduce our anticipated revenue for a quarter. Because many of our expenses must be incurred before we expect to generate revenue, delayed orders could negatively impact our results of operations for the period.
57
Table of Contents
Liquidity and Capital Resources
Our sources of liquidity and capital resources as of June 30, 2010 consisted of $34.5 million of cash and cash equivalents and $5.0 million unused availability under our revolving bank credit agreement, described below.
We initially funded our operations through convertible preferred stock financings that raised a total of $55.1 million through June 2003. Subsequently, we have funded our operations primarily through cash from operations. Historically, our principal uses of cash have consisted of payroll and other operating expenses and purchases of property and equipment to support our growth. In 2009, we acquired certain technology, upon which our Tripwire Log Center product is based, for $2.9 million paid primarily in cash.
We have a revolving credit facility in the amount of $5.0 million that is currently scheduled to expire on August 20, 2010. Amounts outstanding under the facility accrue interest at a per annum rate equal to the greater of 4% and the lender’s prime rate, which was 4.0% as of June 30, 2010. The credit facility is secured by a lien on substantially all of our assets and is subject to customary covenants for facilities of this type, including covenants limiting debt incurrence, liens, investments, asset sales and mergers. The revolving credit facility also includes financial covenants requiring an adjusted quick ratio (as defined) of 1.5 to 1.0 and tangible net worth (as defined) of $3.0 million plus 50% of our quarterly positive net income recorded subsequent to June 30, 2009. As of June 30, 2010, we were in compliance with all covenants, and there was no principal amount outstanding under the credit facility.
The following table shows our cash flows from operating activities, investing activities and financing activities for the stated periods:
| Year Ended December 31, | Six Months Ended June 30, | |||||||||||||||||||
| 2007 | 2008 | 2009 | 2009 | 2010 | ||||||||||||||||
| (unaudited) | ||||||||||||||||||||
| (in thousands) | ||||||||||||||||||||
| Cash provided by operating activities |
$ | 1,550 | $ | 12,141 | $ | 15,229 | $ | 5,134 | $ | 2,385 | ||||||||||
| Cash used in investing activities |
(746 | ) | (2,022 | ) | (4,482 | ) | (557 | ) | (989 | ) | ||||||||||
| Cash provided by financing activities |
61 | 68 | 35 | 11 | 1,109 | |||||||||||||||
| Cash generated |
$ | 865 | $ | 10,187 | $ | 10,782 | $ | 4,588 | $ | 2,505 | ||||||||||
Operating Activities
Our operating activities have provided our primary source of funding since 2005. The primary sources of operating cash flows are net income (losses) adjusted for non-cash items, primarily depreciation and amortization and deferred tax adjustments, and from advance payments on maintenance contracts. Our collection of receivables for software licenses and advance payments of maintenance contracts has generally exceeded our investment in working capital assets in a given period.
Future cash flow from operations will depend primarily on our profitability and changes in working capital items, including deferred revenue, accounts receivable and the timing of payment of tax liabilities.
Cash flow from operating activities in the six months ended June 30, 2010 totaled $2.4 million. Changes in net working capital generated $0.8 million, primarily from a $2.2 million reduction in accounts receivable resulting from the seasonal decrease in quarterly sales activity and an increase of $1.4 million in deferred revenue from advance payments on maintenance contracts, partially offset by a decrease of $2.6 million in accrued liabilities primarily related to the payment of management’s variable compensation and sales commissions for 2009.
58
Table of Contents
Cash flow from operating activities in 2009 totaled $15.2 million. Cash totaling $8.8 million was provided by net income of $19.6 million, offset by $10.8 million in net non-cash items. Non-cash items were comprised primarily of $11.8 million in non-cash adjustments to deferred tax assets resulting from reversal of a portion of the valuation allowance maintained against deferred tax assets based on improved profitability, partially offset by $1.2 million in depreciation and amortization charges. Changes in net working capital provided cash in-flows totaling $6.5 million, primarily resulting from a $6.0 million increase in deferred revenue and increases in other items partially offset by an increase of $1.8 million in accounts receivable associated with the growth in our revenue.
Cash flow from operating activities in 2008 totaled $12.1 million primarily from net income of $5.9 million and changes in net working capital. Changes in net working capital provided cash in-flows totaling $6.3 million, primarily resulting from a $6.7 million increase in deferred revenue and increases in other items partially offset by an increase of $2.1 million in accounts receivable associated with the growth in our revenue.
Cash flow from operating activities in 2007 totaled $1.6 million primarily as a result of $0.9 million provided by an immaterial net loss adjusted for $0.9 million in non-cash charges, a $2.9 million increase in deferred revenue, a total of $1.5 million increases in cash from other items, partially offset by $3.7 million in cash used to fund increased accounts receivable associated with the growth in our revenue.
Investing Activities
Cash used in investing activities is primarily comprised of capital expenditures associated with information systems and facilities and fixtures required to support our business activities and employee base. Net cash used in investing activities was $0.7 million, $2.0 million, $4.5 million and $1.0 million in 2007, 2008, 2009 and the six months ended June 30, 2010, respectively. In addition to the capital expenditures described above, in 2009 we purchased certain technology upon which our Tripwire Log Center product is based for $2.9 million, paid primarily in cash. We expect our capital expenditures to slightly increase to support expansion of our customer base and revenue.
Financing Activities
As cash flow from operations has been sufficient to sustain our business in the past three years, there were no significant cash flows from financing activities in 2007, 2008 and 2009. In the six months ended June 30, 2010, warrants and stock options were exercised, generating cash in-flows of $1.6 million. We expect stock option exercise activity to increase subsequent to this offering. As stock options are exercised in the future, we will experience additional cash in-flows. We also paid costs related to our proposed public offering totaling $0.5 million during the six months ended June 30, 2010.
Other Factors Affecting Liquidity and Capital Resources
We believe that our cash and cash equivalents and cash flow from operations together with the cash proceeds from this offering will be sufficient to meet our anticipated cash needs, including cash requirements for working capital, capital expenditures and various contractual obligations, for at least the next 12 months. We may, however, require additional cash resources due to changed business conditions or other future developments, including any investments or acquisitions we may decide to pursue. If these sources are insufficient to satisfy our cash requirements, we may seek additional sources of funding, including borrowing on our Credit Agreement or issuance of debt securities or additional equity securities. The sale of any such securities could result in additional dilution to our stockholders. The incurrence of indebtedness would result in debt service obligations and could result in operating and financial covenants that could restrict our operations. In addition, there can be no assurance that any additional financing will be available on acceptable terms, if at all. We anticipate that, from time to time, we may evaluate acquisitions of complementary businesses, technologies or assets. However, there are no current plans, proposals or arrangements with respect to any specific acquisition.
59
Table of Contents
Off-Balance Sheet Arrangements
As of June 30, 2010, we had no off-balance sheet arrangements.
Contractual Obligations and Commitments
We lease our administrative offices in Portland, Oregon under a non-cancelable operating lease agreement that expires in April 2014. We also lease sales offices in Europe and Asia under non-cancelable operating lease agreements with terms expiring through 2011.
The following table is a summary of our contractual obligations as of December 31, 2009:
| Payments Due by Period | ||||||||||||||
| Total | 2010 | 2011 to 2012 |
2013 to 2014 |
More than 5 years | ||||||||||
| (in thousands) | ||||||||||||||
| Operating leases |
$ | 6,186 | $ | 1,632 | $ | 2,756 | $ | 1,798 | — | |||||
Critical Accounting Policies, Significant Judgments and Estimates
Our consolidated financial statements have been prepared in accordance with accounting principles generally accepted in the United States, which require us to make estimates and judgments that affect the reported amounts of assets and liabilities and the disclosure of contingent assets and liabilities at the date of the financial statements as well as the reported amounts of revenue and expenses during the reporting period. We base our estimates and judgments on our historical experience, knowledge of current conditions and our beliefs regarding likely occurrences in the future, given available information. Estimates are used for, but are not limited to, revenue recognition, determination of fair value of stock awards, valuation of goodwill and intangible assets acquired in business combinations, impairment of goodwill and other intangible assets, amortization of intangible assets, accounting for uncertainties in income taxes, contingencies and litigation and allowances for doubtful accounts. Actual results may differ from those estimates, and any differences may be material to our financial statements. Further, if we apply different factors, or change the method by which we apply the various factors that are used, in making our critical estimates and judgments, our reported operating results and financial condition could be materially affected. This information should be read in conjunction with our consolidated financial statements and related notes included elsewhere in this prospectus.
Revenue Recognition and Deferred Revenue
We recognize revenue according to the provisions of the FASB guidance on software revenue recognition. Accordingly, we exercise judgment and use estimates in connection with the determination of the amount of software licenses and maintenance and professional service revenue to be recognized in each accounting period. We derive revenue primarily from two sources: (i) sales of software licenses, and (ii) maintenance contracts. Additionally, a small portion of our revenue is earned from providing professional services.
Software license revenue is recognized when persuasive evidence of an arrangement exists, delivery of the product has occurred, the fee is fixed or determinable, collection is probable and VSOE of the fair value of undelivered elements exists. As substantially all of our software licenses are sold in multiple-element arrangements that include either maintenance or both maintenance and professional services, we use the residual method to determine the amount of license revenue to be recognized. Under the residual method, consideration is allocated to undelivered elements based upon VSOE of the fair value of those elements, with the residual of the arrangement fee allocated to and recognized as license revenue. We have established VSOE of the fair value of maintenance based on the contractually stated maintenance renewal rates, provided such rates are substantive. These demonstrate a consistent relationship of pricing maintenance as a percentage of the license fee. VSOE of the fair value of professional services is established based on daily rates when sold on a stand-alone basis.
60
Table of Contents
Software licenses revenue is generally recognized upon the delivery of the software if all revenue recognition criteria are met. Estimated sales returns and allowances are recorded upon shipment of the product. We generally accept returns within 90 days of original sale. To date, we have not experienced significant sales returns.
We sell a portion of our products and services through a limited number of distributors and resellers. Distributor agreements may offer expanded rights of return, including stock rotation rights, price protection, etc., beyond our normal agreements and as such we recognize revenue upon sale from the distributor to the end user in these arrangements.
Revenue allocated to maintenance contracts, which gives the subscriber the rights to obtain unspecified updates and enhancements, on a when and if available basis, is generally paid in advance and is recognized ratably over the term of the service.
Deferred revenue generally consists of amounts received or receivable from customers for maintenance for which the earnings process is incomplete.
Professional services generally consist of installation and training services and are not essential to the functionality of the software. Revenue allocated to professional services is recognized as the services are performed.
Stock-Based Compensation
We have a 2000 Stock Option/Stock Issuance Plan (2000 Plan) and a 1998 Stock Option Plan (1998 Plan) which provide for the granting of stock options to employees, directors and consultants within the meaning of Section 422 of the Internal Revenue Code and nonstatutory stock options. The 1998 Plan is no longer in effect, but continues to govern stock options granted pursuant to the 1998 Plan. We have reserved a total of 18,341,915 shares of our common stock for issuance under the 2000 Plan. At July 26, 2010, we had approximately 834,373 shares of common stock available for issuance under the 2000 Stock Option Plan. Stock options under the 2000 Plan and the 1998 Plan generally vest over a four-year period and expire in 10 years. We currently use authorized and unissued shares to satisfy stock option exercises. Upon termination of service all unvested stock options are forfeited and option holders must exercise vested stock options generally within three months or they are forfeited.
On May 7, 2010, the board of directors adopted our 2010 Incentive Plan, or 2010 Plan, which will become effective upon closing of this offering. The board has authorized 4,340,250 shares of common stock for issuance under the 2010 Plan. In addition, any shares that are available for issuance under the 2000 Plan or that are subject to outstanding awards under the 2000 Plan and the 1998 Plan as of the effective date of the 2010 Plan that cease to be subject to these awards (other than from exercise or settlement of the awards in shares) will automatically become available for issuance under the 2010 Plan, up to an aggregate maximum of 17,125,102 shares. The board may increase the authorized shares each January starting in 2011 pursuant to an evergreen provision by adding an amount equal to the least of (i) 4,875,000 shares, (ii) 5% of our outstanding common stock as of the end of our immediately preceding fiscal year, and (iii) a lesser amount determined by the board.
We apply FASB ASC Topic 718, Compensation—Stock Compensation, in accounting for stock options granted, modified or canceled after January 1, 2006 to employees under the Plans, which requires that the fair value of stock-based compensation be expensed over the vesting period. The fair value of each stock option is estimated on the date of grant using the Black-Scholes option pricing model. Since our shares are not currently publicly traded and as a result there is a lack of consistent historical experience on which to base the assumptions, the simplified method is used to estimate the expected term of the stock option and expected volatility is computed based on the average historical volatility of similar entities with publicly traded shares. The risk free rate for the expected term of the stock option is based on the U.S. Treasury yield curve in effect at the time of grant.
61
Table of Contents
Valuation of Common Stock
The following table summarizes by grant date the number of shares of our common stock subject to stock options granted since January 1, 2008, and the associated per share exercise price. As discussed below, we have determined for each grant that the exercise price equaled or exceeded the fair value per share of our common stock as of the date of the grant.
| Grant Date |
Options Granted | Exercise Price Per Share | Fair Value Per Share | |||||
| 2008 |
||||||||
| April 23 |
1,318,721 | $ | 0.60 | $ | 0.34 | |||
| June 18 |
122,500 | $ | 0.60 | $ | 0.34 | |||
| July 24 |
33,100 | $ | 0.60 | $ | 0.34 | |||
| October 1 |
162,100 | $ | 0.65 | $ | 0.44 | |||
| October 28 |
128,500 | $ | 0.65 | $ | 0.44 | |||
| December 10 (1) |
39,100 | $ | 0.65 | — | ||||
| 2009 |
||||||||
| April 15 |
1,312,065 | $ | 0.65 | $ | 0.44 | |||
| June 17 |
16,500 | $ | 0.65 | $ | 0.44 | |||
| July 23 |
253,980 | $ | 0.65 | $ | 0.44 | |||
| September 23 |
227,600 | $ | 0.70 | $ | 0.60 | |||
| October 30 (1) |
52,000 | $ | 0.70 | — | ||||
| December 16 |
65,500 | $ | 0.80 | $ | 0.60 | |||
| 2010 |
||||||||
| March 31 |
1,357,900 | $ | 1.98 | $ | 1.98 | |||
| April 21 |
84,000 | $ | 2.09 | $ | 2.09 | |||
| May 7 |
936,999 | $ | 2.09 | $ | 2.09 | |||
| May 25 |
93,215 | $ | 2.08 | $ | 2.08 | |||
| May 26 |
20,000 | $ | 2.08 | $ | 2.08 | |||
| June 25 |
685,247 | $ | 2.08 | $ | 1.96 | |||
| July 22 |
481,999 | $ | 2.08 | $ | 1.95 | |||
| (1) | For these stock option grants, the board of directors did not determine a specific fair value per share but concluded that the fair value per share was less than the exercise price. |
Since December 2005, we have obtained valuation analyses prepared by an independent third-party valuation firm to assist us in determining the fair market value of our common stock. In obtaining third-party valuations of our common stock, our management provided the third-party valuation firm with information about our performance, markets and prospects, which the valuation firm used, along with other information, to perform its valuation calculations. These valuations were reviewed by management and provided to our board of directors. In determining the fair market value of our common stock up to December 31, 2009, when we revised our approach of obtaining semi-annual valuations and began obtaining third-party valuations for each option grant, our board of directors considered these valuation reports together with subsequent market conditions, company performance and any significant events or developments related to us. After December 31, 2009, the board considered the common stock valuation provided by the third-party valuation firm for a specific grant, and took into account certain significant transactions between stockholders that involved our common stock. We have also used these third-party valuations for purposes of determining the Black-Scholes fair value of our stock option awards and related stock-based compensation expense. Because the board of directors had concerns about consistency and internal fairness among employees receiving stock options, the exercise price for stock options granted after the December 2005 initiation of the third-party valuation process took the exercise price of previous grants into consideration as well as the fair market value determined by the valuation firm, resulting in stock options granted through 2009 and in June and July 2010 having an exercise price higher than the fair market value per share on their date of grant, as determined by the valuation firm.
The third-party valuations described below used the “Income Approach” and the “Market Approach” (each discussed below) to calculate a total equity value from which the estimated fair market value of our common
62
Table of Contents
stock was derived. We prepared financial forecasts used in the computation of our equity value for both the Income Approach and the Market Approach. The financial forecasts were based on a number of assumptions, including, assumptions regarding revenue growth rates and expenses, that took into account our past experience and future expectations.
Under the Income Approach, estimated future returns are discounted to present value at an appropriate rate of return for the investment, where the discount reflects the degree of risk associated with the future returns and returns available from alternative investments. Higher risk leads to a higher discount rate, which produces a lower value for the investment. Under the Income Approach, discrete cash flows were determined over several years, and estimated in a residual period. The analysis was based on a number of assumptions, including:
| • | our expected sales growth, cost of sales, operating expenses, depreciation expense, required working capital, capital expenditures and other income for the current and future years, which assumptions were based on management’s estimates as of the effective date of the valuation; |
| • | a discount rate, which was applied to the forecasted discrete period cash flows; and |
| • | a capitalization rate, which was used to capitalize the forecasted residual cash flows projected beyond the discrete period. |
The valuations applied two valuation methods under the Market Approach, the Public Company method and the Merger and Acquisition, or M&A, Transactions method.
The Public Company method determines total equity value of a company by applying valuation multiples derived from publicly-traded companies that are similar to the company being valued. When choosing the guideline companies for the Public Company method, a peer group of comparable publicly-traded companies in the computer programming, data processing and other computer services industries that provide software for security or integrity purposes were identified. As part of the Market Approach—M&A Transactions method, mergers and acquisitions involving companies in the computer programming, data processing and other computer services industry with similar size and products were analyzed.
One or more of the following total equity multiples and market value of invested capital multiples were used in the Public Company and M&A Transactions methods because they are considered to provide meaningful indications of value:
| • | Total Equity Multiples. Total Equity Value to: projected earnings for the following fiscal year, determined as of the valuation date based on our estimates, and pre-tax income, net income and gross cash flow for the latest twelve months prior to the valuation date; and |
| • | Market Value of Invested Capital Multiples. Market Value of Invested Capital to: revenue, earnings before interest, taxes, depreciation and amortization, or EBITDA, earnings before interest and taxes, or EBIT, for the latest twelve months prior to the valuation date, and projected revenue and projected EBITDA each for the following fiscal year, determined as of the valuation date based on our estimates. |
The specific multiples used in each valuation are listed in the discussion of grants made on each date below.
Under the Public Company method, these valuation multiples were adjusted to account for growth, size and unique risks that would influence the financial data of the guideline companies. Each adjusted valuation multiple was then applied to the relevant financial measure to produce an indication of value, either equity value or total capital value depending on the multiple used, and necessary adjustments for converting capital values to equity values were made. The total equity values for the various valuation multiples were then weighted, a control premium applied and any non-operating assets added to the value to arrive at a reconciled total equity value under the Public Company method.
63
Table of Contents
Under the M&A Transactions method, certain discounts were applied to the multiples to account for transactions that include additional investment value to strategic and publicly-traded buyers and unique risks related to the subject company. Each adjusted valuation multiple was then applied to our adjusted earnings or cash flows to produce an indication of total equity value. The total equity values for the various valuation multiples were then weighted, based on the number of transactions, comparability of the companies, and quality of the data included in the valuation multiple to arrive at a reconciled total equity value under the M&A Transactions method. More weight was assigned to the revenue multiple than to the other multiples, because this multiple is believed to provide a more consistent value in each period and reflects the values seen in the market. While merger and acquisition data provides valuable information, the data also has certain limitations, including that: the financial data cannot be independently verified; it is sometimes unclear whether reported results conform to United States generally accepted accounting principles; different data sources use varying definitions of “earnings” and “cash flow;” and, in the case of small-to-medium sized transactions, the deal price may include payments related to employment agreements and be affected by the type of consideration paid.
After total equity value was calculated based on the Income Approach and Market Approach, the total equity value determined under each approach was weighted to reach a reconciled total equity value.
The valuations used methodologies, approaches and assumptions consistent with the American Institute of Certified Public Accountants Practice Guide, Valuation of Privately-Held-Company Equity Securities Issued as Compensation, or the AICPA Practice Guide. As disclosed in the notes to our Consolidated Financial Statements included elsewhere in this prospectus, we have issued and outstanding Series A, Series B, Series C, Series C-1 and Series D preferred stock, stock options and warrants over which to allocate the total value of equity. Consistent with the AICPA Practice Guide, the value of each share of preferred and common stock can then be inferred by analyzing various option-pricing methodologies.
Under the option-pricing methodology used by the third-party valuation firm, the equity value was allocated to the preferred stock, common stock, warrants and stock options using the Black-Scholes model. To determine the Black-Scholes assumptions, the time to a liquidity event is estimated, the risk-free rate is determined (typically based on the rate available on a government security whose term matches the assumed time to liquidity) and the volatility assumption is determined. For a private company, volatility is based on the historical stock performance for comparable public companies.
April 23, June 18 and July 24, 2008
The stock options granted on these dates had an exercise price of $0.60 per share. Our board of directors determined this price taking into account the third-party valuation of our common stock performed as of December 31, 2007, which estimated that the fair value of our common stock at that time was $0.34 per share. To establish the exercise price, our board adjusted this number upward to increase the exercise price over the exercise price of the most recent prior grants by an amount roughly proportionate to the increase in the fair market value of the common stock from the previous third party valuation. In the December 2007 valuation, under the Income Approach, a discount rate of 19.8% and a capitalization rate of 12.3% were applied. Under the Market Approach-Public Company method, adjusted multiples of total equity to projected earnings, pre-tax income, net income and gross cash flow of 11.31, 27.81, 40.71 and 40.01, respectively, were applied. Adjusted multiples of market value of invested capital to revenue, EBITDA and EBIT of 2.08, 41.12 and 32.01, respectively, were also applied. Under the Market Approach—M&A Transactions method, adjusted multiples of total equity value to revenue, pre-tax income, net income and gross cash flow of 1.75, 14.18, 20.04 and 10.89, respectively, were applied. As part of its application of the Market Approach — M&A Transactions method for determining total equity value, the December 31, 2007 valuation separately considered the acquisition of Embarcadero Technologies Inc. by a private equity firm in June 2007. Embarcadero was a business of similar nature and size to us, and had been used as a guideline company in previous appraisals. In evaluating the Embarcadero M&A transaction, an adjusted multiple of total equity value to gross cash flow of 20.79 was applied. Adjusted multiples of market value of invested capital to revenue, EBITDA and EBIT of 3.19, 22.45 and 32.01, respectively, were also applied.
64
Table of Contents
In the December 2007 valuation, the various valuation approaches were given the following weight: Income Approach 55%, Market Approach—Public Company 25%, Market Approach—M&A Transactions 10% and Market Approach—Embarcadero Technologies Acquisition 10%. The Income Approach was given significant weight because it represented the amount a prudent investor would pay for our expected future cash flows based on the then current market rates of return and our specific risks. The Market Approach—Public Company method was given some weight because it represented the value investors were then paying for reasonably similar public companies that represented alternative investment opportunities. The Market Approach—M&A Transactions method was given little weight because the limited available data was determined to be a less reliable source of value. After arriving at a total equity value, a portion of that equity value was allocated to our common stock. Next, the valuation applied a minority discount of 10%, to account for the lack of control in a minority ownership interest, and a marketability discount of 30%, to account for the lack of liquidity found in a public market. Finally, the dilutive impact of outstanding options and warrants that were “in the money” were taken into consideration in arriving at the final fair market value per share.
For purposes of the June 2008 and July 2008 stock option grants, our board of directors determined that there had been no significant change in our business or industry that would warrant a higher valuation than the fair value of our common stock determined in April 2008, and continued to grant stock options with an exercise price significantly higher than the fair value as reflected in the December 31, 2007 valuation.
October 1, October 28 and December 10, 2008
The stock options granted on these dates had an exercise price of $0.65 per share. For the grant on October 1, 2008, our board of directors determined this price taking into account the third-party valuation of our common stock performed as of June 30, 2008, which estimated that the fair value of our common stock at that time was $0.44 per share. To establish the exercise price, our board of directors adjusted this number upward to increase the exercise price over the exercise price of the most recent prior grants by an amount roughly proportionate to the increase in the fair market value of the common stock from the previous third party valuation. In the June 2008 valuation, under the Income Approach, a discount rate of 18.8% and a capitalization rate of 11.3% were applied. Under the Market Approach-Public Company method, an adjusted multiple of total equity to projected earnings of 17.67 was applied. Adjusted multiples of market value of invested capital to revenue, projected revenue and projected EBITDA of 1.52, 1.42 and 6.10, respectively, were also applied. Under the Market Approach—M&A Transactions method, an adjusted multiple of total equity value to gross cash flow of 11.79 was applied. Adjusted multiples of market value of invested capital to revenue, EBITDA and EBIT of 2.59, 12.70 and 18.39, respectively, were also applied. In evaluating the Embarcadero M&A transaction, an adjusted multiple of total equity value to gross cash flow of 23.60 was applied. Adjusted multiples of market value of invested capital to revenue, EBITDA and EBIT of 3.24, 25.47 and 36.31, respectively, were also applied.
In the June 2008 valuation, the various valuation approaches were given the following weight: Income Approach 55%, Market Approach—Publicly Traded Companies 25%, Market Approach—M&A Transactions 15% and Market Approach—Embarcadero Technologies Acquisition 5%. The total equity value was then allocated to the preferred stock, common stock, warrants and stock options using the option-pricing methodology and a marketability discount of 28.3% was applied. The allocation of more than a majority of the weight to the Income Approach reflects an assumption that the potential for a liquidity event was more than several years away. The fair market value increased, however, primarily as a result of the increase in our revenue.
For purposes of the stock option grants made on October 28, 2008 and the stock option grants made on December 10, 2008 (on which latter date the board of directors did not specify fair market value but determined that the fair market value was no greater than $0.65 per share), our board of directors did not identify any significant change in our business or industry that would warrant a higher valuation than the fair value of our common stock as of June 30, 2008, and continued to grant stock options with an exercise price significantly higher than the fair value as reflected in the June 30, 2008 valuation.
65
Table of Contents
April 15, June 17 and July 23, 2009
The stock options granted on these dates had an exercise price of $0.65 per share. Our board of directors determined this price taking into account the third-party valuation of our common stock performed as of December 31, 2008, which estimated that the fair value of our common stock at that time was $0.44 per share, approximately equal to the valuation as of June 30, 2008. In the December 2008 valuation, under the Income Approach, a discount rate of 16.7% and a capitalization rate of 10.2% were applied. Under the Market Approach-Public Company method, multiples of total equity to projected earnings and gross cash flow of 14.67 and 23.48, respectively, were applied. Adjusted multiples of market value of invested capital to revenue, projected revenue and projected EBITDA of 1.84, 1.62 and 12.23, respectively, were also applied. Under the Market Approach—M&A Transactions method, an adjusted multiple of total equity value to gross cash flow of 11.19 was applied. Adjusted multiples of market value of invested capital to revenue, EBITDA and EBIT of 2.55, 13.42 and 17.79, respectively, were also applied. In addition to considering the Embarcadero acquisition referenced in prior valuations, the December 31, 2008 third-party valuation also considered the November 2008 acquisition of Secure Computing Corp. by McAfee, Inc. Secure Computing Corp. operated a business similar to our business and had been used as a guideline company in previous valuations of our company. In evaluating the specified M&A transactions, an adjusted multiple of total equity value to gross cash flow of 24.09 was applied. Adjusted multiples of market value of invested capital to revenue, EBITDA and EBIT of 2.41, 25.99 and 37.06, respectively, were also applied.
In the December 2008 valuation, the various valuation approaches were given the following weight: Income Approach 55%, Market Approach—Publicly Traded Companies 25%, Market Approach—M&A Transactions 15% and Market Approach—Embarcadero and Secure Computing Acquisitions 5%. The total equity value was then allocated to the preferred stock, common stock, warrants and stock options using the option-pricing methodology and a marketability discount of 29.8% was applied. For purposes of the April, June and July 2009 stock option grants, our board of directors determined there had been no significant change in our business or industry that would warrant a higher valuation than the fair value of our common stock as of December 31, 2008, and continued to grant stock options with an exercise price significantly higher than the fair value as reflected in the December 31, 2008 valuation.
September 23 and October 30, 2009
The stock options granted on these dates had an exercise price of $0.70 per share. For the grants on September 23, 2009, our board of directors determined the exercise price taking into account the third-party valuation of our common stock performed as of June 30, 2009, which estimated that the fair value of our common stock at that time was $0.60 per share. To establish the exercise price, our board adjusted this number upward to increase the exercise price over the exercise price of the most recent prior grants to partially reflect the increase in the fair market value of the common stock from the previous third party valuation. The June 2009 valuation took into account both the Income Approach and the Market Approach, as well as pricing of a proposed privately negotiated transaction between stockholders. In the June 2009 valuation, under the Income Approach, a discount rate of 18.2% and a capitalization rate of 11.7% were applied. Under the Market Approach-Public Company method, multiples of total equity to projected earnings and gross cash flow of 17.96 and 19.30, respectively, were applied. Adjusted multiples of market value of invested capital to revenue, EBITDA, projected revenue and projected EBITDA of 1.60, 19.77, 1.68 and 14.34, respectively, were also applied. Under the Market Approach—M&A Transactions method, an adjusted multiple of total equity value to gross cash flow of 20.68 was applied. Adjusted multiples of market value of invested capital to revenue, EBITDA and EBIT of 2.50, 13.91 and 15.83, respectively, were also applied. In evaluating the McAfee/Secure Computing Corp. M&A transaction, an adjusted multiple of market value of invested capital to revenue of 1.59 was applied.
In the June 2009 valuation, the various valuation approaches were given the following weight: Income Approach 55%, Market Approach—Publicly Traded Companies 25%, Market Approach—M&A Transactions 15% and Market Approach—Embarcadero and Secure Computing Acquisitions 5%. The total equity value was then allocated to the preferred stock, common stock, warrants and stock options using the option-pricing
66
Table of Contents
methodology and a marketability discount of 33.4% was applied, resulting in a fair market value of $0.52 per share. The valuation firm further considered the impact of the privately-negotiated share transaction, in which a venture fund offered to purchase approximately 2,000,000 shares of our common stock from a stockholder for a purchase price of $0.91 per share, subject to reduction in specified circumstances to an amount not less than $0.61 per share. The third-party valuation firm considered the two valuations, weighing the $0.52 per share valuation at 80% and the $0.61 valuation for the private share sale (the least amount of consideration per share that could be received) at 20%, to arrive at the fair market value estimate of $0.60 per share stated above.
For purposes of the stock option grants made on October 30, 2009 (at which time the board of directors did not specify fair market value but determined that the fair market value was no greater than $0.70 per share), our board of directors did not identify any significant change in our business or industry that would warrant a higher valuation than the fair value of our common stock as of June 30, 2009, and continued to grant stock options with an exercise price significantly higher than the fair value as reflected in the June 2009 valuation.
December 16, 2009
The stock options granted on December 16, 2009 had an exercise price of $0.80 per share. Our board of directors determined that the fair market value was $0.60 per share, taking into account the third-party valuation of our common stock performed as of June 30, 2009, but adjusted the exercise price upward due to the favorable preliminary financial results for the fourth quarter of 2009 and the anticipated launch of Tripwire Log Center and our Tripwire VIA software suite in the first quarter of 2010.
March 31, 2010
The stock options granted on this date had an exercise price of $1.98 per share. Our board of directors determined this price taking into account the third-party valuation of our common stock performed as of March 17, 2010, which estimated that the fair value of our common stock at that time was $1.98 per share. Between the December 16, 2009 and March 31, 2010 grant dates, our board of directors determined to commence the initial public offering, or IPO, process. We interviewed various investment banking firms for this offering in January and February 2010, and selected our lead underwriters in March 2010. In the third-party valuation firm’s March 17, 2010 valuation, two alternative scenarios were primarily considered: (a) the continued operation of the company as a private company with an IPO or sale of the company likely after 2010; and (b) an IPO during 2010. In the March 17, 2010 valuation, under the Income Approach, a discount rate of 17.8% and a capitalization rate of 11.3% were applied. Under the Market Approach-Public Company method, multiples of total equity to projected earnings and gross cash flow of 26.77 and 33.79, respectively, were applied. Adjusted multiples of market value of invested capital to revenue, EBITDA, projected revenue and projected EBITDA of 3.16, 28.38, 2.86 and 14.36, respectively, were also applied. Under the Market Approach—M&A Transactions method, an adjusted multiple of total equity value to gross cash flow of 22.71 was applied. Adjusted multiples of market value of invested capital to revenue, EBITDA and EBIT of 2.33, 15.14 and 17.58, respectively, were also applied.
In determining our equity value assuming our continued operation as a private company, the various valuation approaches were given the following weight: Income Approach 45%, Market Approach—Publicly Traded Companies 50% and Market Approach—M&A Transactions 5%. The total equity value assuming our continued operation as a private company was then allocated to the preferred stock, common stock, warrants and stock options using the option-pricing methodology and a marketability discount of 22.9% was applied. In determining our equity value assuming an IPO during 2010, the valuation considered our implied pre-money equity value as estimated by potential lead underwriters in connection with the firms’ analyses of our prospects for an IPO. Based on the estimated pre-money equity values provided by the investment banking firms, the valuation converted the projected future IPO value to a present value and allocated that value to the preferred stock, common stock, warrants, and stock options using the option-pricing methodology, applying marketability
67
Table of Contents
discount of 19.1%. The valuation applied equal weight to the common equity value per share assuming our continued operation as a private company and the common equity value per share based on an IPO in reaching the final fair market value of $1.98 per share.
April 21, 2010
The stock options granted on April 21, 2010 had an exercise price of $2.09 per share. Our board of directors determined this price taking into account the third-party valuation of our common stock performed as of April 15, 2010, which estimated that the fair value of our common stock at that time was $2.09 per share. The April 15, 2010 valuation considered the two alternative scenarios described in the March 17, 2010 valuation. In the April 15, 2010 valuation, under the Income Approach, a discount rate of 17.8% and a capitalization rate of 11.3% were applied. Under the Market Approach-Public Company method, multiples of total equity to projected earnings and gross cash flow of 27.24 and 24.99, respectively, were applied. Adjusted multiples of market value of invested capital to revenue, EBITDA, projected revenue and projected EBITDA of 3.09, 24.41, 2.23 and 13.11, respectively, were also applied. Under the Market Approach—M&A Transactions method, an adjusted multiple of total equity value to gross cash flow of 22.43 was applied. Adjusted multiples of market value of invested capital to revenue, EBITDA and EBIT of 2.34, 14.95 and 17.36, respectively, were also applied.
In determining our equity value assuming our continued operation as a private company, the various valuation approaches were given the following weight: Income Approach 45%, Market Approach—Publicly Traded Companies 50% and Market Approach—M&A Transactions 5%. The total equity value assuming our continued operation as a private company was then allocated to the preferred stock, common stock, warrants and stock options using the option-pricing methodology and a marketability discount of 18.1% was applied. In determining our equity value assuming an IPO during 2010, the valuation used the same approach as in the third-party valuation as of March 17, 2010 and allocated the resulting value to the preferred stock, common stock, warrants, and stock options using the option-pricing methodology, applying a marketability discount of 15.9%. The weighting of the common equity value per share assumed our continued operation as a private company at 33% and the common equity value per share based on an IPO at 67% in reaching the final fair market value of $2.09 per share. The total grant date fair value of these stock options on April 21, 2010 was $78,278, $13,163 of which is expected to be recognized as stock-based compensation expense in 2010.
May 7, 2010
The stock options granted on May 7, 2010 had an exercise price of $2.09 per share. Our board of directors determined this price taking into account the third-party valuation of our common stock performed as of May 3, 2010, which estimated that the fair value of our common stock at that time was $2.09 per share. The May 3, 2010 valuation considered the two alternative scenarios described in the March 17, 2010 valuation. In the May 3, 2010 valuation, under the Income Approach, a discount rate of 17.6% and a capitalization rate of 11.1% were applied. Under the Market Approach-Public Company method, multiples of total equity to projected earnings and gross cash flow of 24.57 and 24.43, respectively, were applied. Adjusted multiples of market value of invested capital to revenue, EBITDA, projected revenue and projected EBITDA of 2.89, 23.28, 2.21 and 10.60, respectively, were also applied. Under the Market Approach—M&A Transactions method, an adjusted multiple of total equity value to gross cash flow of 22.41 was applied. Adjusted multiples of market value of invested capital to revenue, EBITDA and EBIT of 2.34, 14.93 and 17.34, respectively, were also applied.
In determining our equity value assuming our continued operation as a private company, the various valuation approaches were given the following weight: Income Approach 45%, Market Approach— Publicly Traded Companies 50% and Market Approach—M&A Transactions 5%. The total equity value assuming our continued operation as a private company was then allocated to the preferred stock, common stock, warrants and stock options using the option-pricing methodology and a marketability discount of 18.7% was applied. In determining our equity value assuming an IPO during 2010, the valuation used the same approach as in the third-
68
Table of Contents
party valuation as of March 17, 2010 and allocated the resulting value to the preferred stock, common stock, warrants, and stock options using the option-pricing methodology, applying a marketability discount of 15.6%. The weighting of the common equity value per share assumed our continued operation as a private company at 33% and the common equity value per share based on an IPO at 67% in reaching the final fair market value of $2.09 per share. The total grant date fair value of these stock options on May 7, 2010 was $874,732, $128,199 of which is expected to be recognized as stock-based compensation expense in 2010.
May 25 and 26, 2010
The stock options granted on May 25 and 26, 2010 had an exercise price of $2.08 per share. Our board of directors determined this price taking into account the third-party valuation of our common stock performed as of May 24, 2010, which estimated that the fair value of our common stock at that time was $2.08 per share. The May 24, 2010 valuation considered the two alternative scenarios described in the March 17, 2010 valuation. In the May 24, 2010 valuation, under the Income Approach, a discount rate of 17.3% and a capitalization rate of 10.8% were applied. Under the Market Approach-Public Company method, multiples of total equity to projected earnings and gross cash flow of 22.68 and 22.44, respectively, were applied. Adjusted multiples of market value of invested capital to revenue, EBITDA, projected revenue and projected EBITDA of 2.73, 21.49, 2.03 and 9.66, respectively, were also applied. Under the Market Approach—M&A Transactions method, an adjusted multiple of total equity value to gross cash flow of 21.26 was applied. Adjusted multiples of market value of invested capital to revenue, EBITDA and EBIT of 2.33, 14.58 and 16.27, respectively, were also applied.
In determining our equity value assuming our continued operation as a private company, the various valuation approaches were given the following weight: Income Approach 45%, Market Approach—Publicly Traded Companies 50% and Market Approach—M&A Transactions 5%. The total equity value assuming our continued operation as a private company was then allocated to the preferred stock, common stock, warrants and stock options using the option-pricing methodology and a marketability discount of 18.4% was applied. In determining our equity value assuming an IPO during 2010, the valuation used the same approach as in the third-party valuation as of March 17, 2010 and allocated the resulting value to the preferred stock, common stock, warrants, and stock options using the option-pricing methodology, applying a marketability discount of 15.1%. The weighting of the common equity value per share assumed our continued operation as a private company at 33% and the common equity value per share based on an IPO at 67% in reaching the final fair market value of $2.08 per share. The stock options granted on May 25, 2010 had a total grant date fair value of $41,895, $6,110 of which will be recognized as stock-based compensation expense in 2010. The stock options granted on May 26, 2010 had a total grant date fair value of $18,118, $5,284 of which is expected to be recognized as stock-based compensation expense in 2010.
June 25, 2010
The stock options granted on June 25, 2010 had an exercise price of $2.08 per share. Our board of directors determined this exercise price taking into account the third-party valuation of our common stock performed as of June 23, 2010, which estimated that the fair value of our common stock at that time was $1.96 per share, but also considering the exercise price of the May 2010 option grants for purposes of internal fairness among grantees. The June 23, 2010 valuation considered the two alternative scenarios described in the March 17, 2010 valuation. In the June 23, 2010 valuation, under the Income Approach, a discount rate of 16.9% and a capitalization rate of 10.4% were applied. Under the Market Approach-Public Company method, multiples of total equity to projected earnings and gross cash flow of 21.58 and 23.26, respectively, were applied. Adjusted multiples of market value of invested capital to revenue, EBITDA, projected revenue and projected EBITDA of 2.95, 19.01, 2.30 and 10.19, respectively, were also applied. Under the Market Approach—M&A Transactions method, an adjusted multiple of total equity value to gross cash flow of 21.03 was applied. Adjusted multiples of market value of invested capital to revenue, EBITDA and EBIT of 2.34, 14.42 and 16.09, respectively, were also applied.
69
Table of Contents
In determining our equity value assuming our continued operation as a private company, the various valuation approaches were given the following weight: Income Approach 45%, Market Approach—Public Company method 50% and Market Approach—M&A Transactions 5%. The total equity value assuming our continued operation as a private company was then allocated to the preferred stock, common stock, warrants and stock options using the option-pricing methodology and a marketability discount of 17.3% was applied. In determining our equity value assuming an IPO during 2010, the valuation used the same approach as in the third-party valuation as of March 17, 2010 and allocated the resulting value to the preferred stock, common stock, warrants, and stock options using the option-pricing methodology, applying a marketability discount of 14.0%. The weighting of the common equity value per share assumed our continued operation as a private company at 33% and the common equity value per share based on an IPO at 67% in reaching the final fair market value of $1.96 per share. The stock options granted on June 25, 2010 had a total grant date fair value of $561,840, $71,084 of which is expected to be recognized as stock-based compensation expense in 2010.
In determining the fair value of our common stock as of June 25, 2010, in addition to the third-party valuation, our board of directors considered the impact of a privately-negotiated share transaction in which a venture fund offered to purchase approximately 1,000,000 shares of our common stock from a stockholder for a purchase price of $2.08 per share. The privately-negotiated transaction closed on June 28, 2010.
July 22, 2010
The stock options granted on July 22, 2010 had an exercise price of $2.08 per share. Our board of directors determined this exercise price taking into account the third-party valuation of our common stock performed as of July 19, 2010, which estimated that the fair value of our common stock at that time was $1.95 per share, but also considering the exercise price of the May and June 2010 grants for purposes of internal fairness among grantees. The July 19, 2010 valuation considered the two alternative scenarios described in the March 17, 2010 valuation. In the July 19, 2010 valuation, under the Income Approach, a discount rate of 16.9% and a capitalization rate of 10.4% were applied. Under the Market Approach-Public Company method, multiples of total equity to projected earnings and gross cash flow of 21.23 and 21.09, respectively, were applied. Adjusted multiples of market value of invested capital to revenue, EBITDA, projected revenue and projected EBITDA of 2.74, 17.11, 2.23 and 9.59, respectively, were also applied. Under the Market Approach—M&A Transactions method, an adjusted multiple of total equity value to gross cash flow of 17.19 was applied. Adjusted multiples of market value of invested capital to revenue, EBITDA and EBIT of 2.07, 14.71 and 22.05, respectively, were also applied.
In determining our equity value assuming our continued operation as a private company, the various valuation approaches were given the following weight: Income Approach 45%, Market Approach—Public Company method 50% and Market Approach—M&A Transactions 5%. The total equity value assuming our continued operation as a private company was then allocated to the preferred stock, common stock, warrants and stock options using the option-pricing methodology and a marketability discount of 17.4% was applied. In determining our equity value assuming an IPO during 2010, the valuation used the same approach as in the third-party valuation as of March 17, 2010 and allocated the resulting value to the preferred stock, common stock, warrants, and stock options using the option-pricing methodology, applying a marketability discount of 14.5%. The weighting of the common equity value per share assumed our continued operation as a private company at 33% and the common equity value per share based on an IPO at 67% in reaching the final fair market value of $1.95 per share. The stock options granted on July 22, 2010 had a total grant date fair value of $376,621, up to $178,287 of which may be recognized as stock-based compensation expense in 2010. Of this amount, $175,274 will be recognized only if certain performance goals are achieved in 2010.
In determining the fair value of our common stock as of July 22, 2010, in addition to the third-party valuation, our board of directors considered the impact of the privately-negotiated share transaction described in connection with the June 25, 2010 grants above.
70
Table of Contents
Assuming the sale of shares contemplated by this offering is completed at $ per share, which is the midpoint of the range set forth on the cover page of this prospectus, the aggregate intrinsic value of vested and unvested options to purchase shares of our common stock outstanding as of , 2010 would be $ million and $ million, respectively.
Goodwill and Intangible Assets
In August 2009, we purchased certain assets and assumed certain liabilities related to our Tripwire Log Center product for total consideration of $2.9 million. We account for business combinations using the purchase method of accounting for business combinations. We allocate the purchase price of our business combinations to the tangible assets, intangible assets and liabilities acquired based on their estimated fair values. We record the excess of the purchase price over the total of those fair values as goodwill.
Our valuations require significant estimates, especially with respect to intangible assets. Critical estimates in valuing certain intangible assets include, but are not limited to, future expected cash flows from the assets acquired and the discount rates used in calculating the present value of those cash flows. We estimate fair value based upon assumptions we believe to be reasonable, but which are inherently uncertain and unpredictable and, as such, actual results may differ from our estimates.
Goodwill is reviewed for impairment at least annually. The goodwill impairment test is a two step test. Under the first step, the fair value of the reporting unit is compared with its carrying value including goodwill. If the fair value of the reporting unit is less than its carrying value, an indication of goodwill impairment exists for the reporting unit and the enterprise must perform step two of the impairment test (measurement). Under step two, an impairment loss is recognized for any excess of the carrying amount of the reporting unit’s goodwill over the implied fair value of that goodwill. The implied fair value of goodwill is determined by allocating the fair value of the reporting unit in a manner similar to a purchase price allocation and the residual fair value after this allocation is the implied fair value of the reporting unit goodwill. Fair value of the reporting unit is determined using a discounted cash flow analysis.
Intangible and other long-lived assets are reviewed for impairment whenever events or changes in circumstances indicate that the carrying amount of an asset may not be recoverable. If circumstances require a long-lived asset be tested for possible impairment, we first compare undiscounted cash flows expected to be generated by an asset to the carrying value of the asset. If the carrying value of the intangible asset is not recoverable on an undiscounted cash flow basis, an impairment is recognized to the extent that the carrying value exceeds its fair value, as determined through various valuation techniques, including discounted cash flow models, quoted market values and independent third-party appraisals, depending on the nature of the asset.
Significant management judgment is required in the forecasting of future operating results that are used in the preparation of projected discounted cash flow analyses, and should different conditions prevail, material write-downs of net intangible assets or goodwill could occur. We periodically review the estimated remaining useful lives of our acquired intangible assets. A reduction in our estimate of remaining useful lives, if any, could result in increased amortization expense in future periods. Future impairment tests of goodwill or intangible assets could result in a charge to earnings.
Allowance for Doubtful Accounts
We maintain an allowance for doubtful accounts based on historical write off experience and the current composition and aging of receivables. We regularly review the allowance for doubtful accounts, including an individual review of significant past due balances to identify collectibility issues. The estimate of the required allowance for doubtful accounts requires significant management judgment and actual write-offs for doubtful accounts may differ materially from the estimated amount.
71
Table of Contents
Accounting for Income Taxes
As part of the process of preparing our consolidated financial statements, we are required to estimate our taxes in each of the jurisdictions in which we operate. We estimate actual current tax exposure and assess temporary differences between our financial reporting and our tax filings resulting from differing treatment of items, such as accruals and allowances not currently deductible for tax purposes. These differences result in deferred tax assets and liabilities. In general, deferred tax assets represent future tax benefits to be received when certain expenses previously recognized in our consolidated statements of operations become deductible expenses under applicable income tax laws or loss or credit carry-forwards are utilized. Accordingly, realization of our deferred tax assets is dependent on future taxable income against which these deductions, losses and credits can be utilized. We must assess the likelihood that our deferred tax assets will be recovered from future taxable income, and to the extent we believe that recovery is not likely, we must establish a valuation allowance. We have historically maintained a valuation reserve against deferred tax assets; however, in 2008 and 2009, we reversed substantially all of the cumulative valuation allowance against deferred tax assets as our operating results and forecast financial performance indicated that deferred tax assets would be realizable as an offset to future taxable earnings.
The income tax expense (benefit) recorded on our consolidated statements of operations is based on our estimated annual effective tax rate. We update our estimate of our annual effective tax rate at the end of each quarterly period. We make estimates and judgments in the calculation of income tax expense (benefit) and certain tax assets and liabilities which arise from differences in the timing of recognition of revenue and expense for tax and financial statement purposes. Changes in these estimates may result in significant increases or decreases to our tax provision in a subsequent period, which in turn would affect net income.
We have recorded tax reserves to address potential exposures involving positions that could be challenged by taxing authorities. The amount of uncertain tax positions totaled $0.8 million at December 31, 2009 and $0.8 million at June 30, 2010 (unaudited). No interest or penalties are accrued related to these uncertain positions to date as the amount has been recorded as a reduction of the related deferred tax asset. We do not expect any material changes to the estimated amount of liability associated with our uncertain tax positions within the next 12 months.
We are not currently subject to, nor have we received any notice of, income tax examinations as of June 30, 2010. Due to our net operating loss carryforwards, we are subject to potential tax examinations for all years. We do not anticipate that any potential tax adjustments will have a significant impact on our financial position or results of operations.
72
Table of Contents
Overview
We are a leading provider of IT security and compliance automation software solutions that help protect physical and virtual IT infrastructure, prove compliance and prevent outages for enterprises and government agencies. Our software intelligently identifies on a real-time basis security threats and compliance breaches, often otherwise undetected for months, by tracking high volumes of changes and events across an organization’s IT infrastructure, automatically analyzing this data to identify security threats and compliance breaches, and helping remediate these issues. Our software provides a cost-effective alternative to more narrowly focused “point” solutions that typically require manual and resource-intensive efforts to keep pace with growing security and compliance requirements. As of June 30, 2010, we had sold our products and services to over 5,500 customers in 88 countries worldwide, including 45% of the Fortune 500, 27 of 30 U.S. federal government executive branch agencies, and many other domestic and foreign governments.
Our Tripwire VIA software suite, which integrates our Tripwire Enterprise and Tripwire Log Center product families, facilitates continuous protection against security threats and ongoing compliance with regulatory requirements. Our flagship product, Tripwire Enterprise, helps organizations achieve and maintain a secure and compliant IT infrastructure by protecting, detecting and correcting files and configurations. Tripwire Log Center, our recently-introduced log and security event management solution, helps organizations detect security breaches and compliance violations by performing real-time correlation analysis on high volumes of disparate log and security data and efficiently stores the data for reporting and compliance purposes. In addition, we believe we offer the largest IT policy library, addressing over 250 regulations, standards and best practices that can be applied to more than 150 different technology platforms and providing over 89,000 compliance tests.
Enterprise and government agency IT infrastructures are vulnerable to increasingly frequent, sophisticated, organized and severe threats. Threats come from cyber-criminals, foreign governments, malicious internal users and inadvertent internal errors. These attacks and errors can cause significant economic loss, impairment of critical infrastructure, the loss of valuable data and reputational damage. Current trends that move digital assets and data to virtual environments increase the difficulty of securing IT infrastructure. Governments, businesses and industry organizations have responded with a growing number of laws, regulations and policies, many of which impose burdensome compliance requirements on companies and, in particular, their IT personnel. Audit failures or findings of non-compliance can lead to significant fines or an inability to engage in core business activities. As IT infrastructures become more complex, distributed and dynamic, maintaining security and compliance is increasingly challenging and expensive.
We help a wide range of enterprises and government agencies worldwide reduce risk and cost by automating critical security and compliance processes and by providing visibility across the entire IT infrastructure to configurations, changes, logs and events, and intelligence into threats, breaches and compliance controls. Our customers span a broad range of industries including retail and hospitality, financial services, energy, media and communications, transportation and government and defense. Our customers include organizations such as AXA Financial, bwin Interactive Entertainment AG, Fannie Mae, Federal Express Corporation, PepsiCo and The Walt Disney Company. These customers are among our top 30 active accounts based on cumulative sales to the customer since our inception.
We believe that the need for IT security and compliance automation software solutions presents a significant and growing market opportunity. In October 2009, International Data Corporation (IDC), an independent technology research firm, estimated that worldwide revenue for the security and vulnerability management (SVM) market, our primary target market, exceeded $2.6 billion in 2008 and is projected to grow to nearly $4.4 billion in 2013, representing a compound annual growth rate of 10.8% from 2008. The two largest segments of the SVM market, the policy and compliance segment and the security information and event management segment, are addressed by our solutions. IDC reports that worldwide revenue for these segments was $1.2 billion in the aggregate in 2008 and is expected to grow to $2.4 billion in the aggregate in 2013, representing a compound annual growth rate of 15.3% from 2008 to 2013. In addition, we believe that our products address
73
Table of Contents
certain needs of the change and configuration management software market and the software segment of the governance, risk and compliance (GRC), infrastructure market. We also believe that our opportunities with enterprises and government customers will be enhanced by the growing adoption of virtualization, the emergence of cloud computing and other technology trends that increase demand for broad and integrated IT infrastructure protection and automation, and by regulatory trends requiring more transparency and information in order to demonstrate compliance.
We have had six consecutive years of revenue growth and positive operating cash flows. For the years ended December 31, 2007, 2008 and 2009 and the six months ended June 30, 2010, we generated revenue of $49.2 million, $62.4 million, $74.0 million and $40.1 million, respectively, of which approximately 22%, 29%, 24% and 26%, respectively, was generated from customers outside of the United States. For the same periods, our Adjusted EBITDA was $0.5 million, $5.3 million, $10.0 million and $1.7 million, respectively. For a discussion of Adjusted EBITDA and a reconciliation of net income to Adjusted EBITDA, please read note 3 to “Selected Consolidated Financial and Other Data.” We were founded in 1997, are headquartered in Portland, Oregon, and had 336 employees worldwide as of June 30, 2010.
Industry Background
IT Infrastructure and Electronically Stored Information are Integral to Organizations’ Operations
Businesses, government agencies and other organizations rely on IT infrastructure and electronically stored information. IT infrastructure is critical to almost every function of an organization, including operations, research, development, sales, marketing, accounting, human resources and administration. An organization’s IT infrastructure stores proprietary information, intellectual property, personal employee records and sensitive customer information, such as credit card data and social security numbers. IT infrastructure and digital information are valuable and their vulnerability to security threats represents one of the most significant risks for any organization.
External and Internal Threats are Becoming More Frequent, Sophisticated and Severe
Security threats to IT infrastructure continue to increase in number and severity, and evolve with greater sophistication in parallel to the growing complexity of IT infrastructure. These threats range from attacks that are financially motivated—such as identity theft, credit card fraud, money laundering, extortion, and intellectual property theft—to those designed to disrupt critically important infrastructure such as power grids and utilities. Attackers have become increasingly organized and are using sophisticated tools and methods. Many recent attacks have been carried out by organized crime groups, some of which have well-funded backers and are capable of complex attacks. Foreign governments are also believed to have carried out attacks on IT infrastructure.
IT infrastructure is becoming more vulnerable to attacks as organizations extend network access beyond the traditional corporate perimeter, with operations becoming more global and interconnected, infrastructure often being shared, workers becoming more mobile and organizations’ information being transmitted or stored anywhere in the world. As organizations expand access to IT resources to more users, IT infrastructure becomes exposed to an increased risk of malfeasance and errors from employees, customers and partners. In some instances, a malicious internal user or an unintentional change by a well-meaning employee can have a greater negative impact on an organization than external attacks.
The growth in the frequency, scope and types of security risks and attacks has also affected national and local governments. The scope of government security concerns is even broader than that of a typical business organization, as government organizations must focus on protecting a larger set of assets and data, including critical infrastructure such as power grids and military systems, from threats posed by criminals, terrorist organizations and foreign governments.
74
Table of Contents
Expanding Regulatory, Compliance and Corporate Policy Requirements
In response to the threat of security breaches, governments, businesses and industry organizations continue to introduce and modify laws, regulations and policies that contain complex rules and requirements for protecting sensitive data, consumer privacy and vital national interests by securing the IT infrastructure. For example, the United States government has promulgated regulations subject to authority provided through the enactment of a number of laws, such as the Health Insurance Portability and Accountability Act of 1996 (HIPAA), the Sarbanes-Oxley Act of 2002 (SOX), the Federal Information Security Management Act of 2002 (FISMA) and the Energy Policy Act of 2005, which require many organizations to control the security of, access to and configuration of their IT systems. A number of states have also enacted laws and regulations that require covered entities to implement and maintain security measures to protect certain types of information, such as Social Security numbers, payment card information, and other types of data, from unauthorized use and disclosure. In addition, industry organizations have adopted and implemented various security and compliance policies. For example, the Payment Card Industry Security Standards Council has issued its mandatory Payment Card Industry Data Security Standard (PCI DSS) which is applicable to all organizations processing payment card transactions.
Audit failure or findings of non-compliance can lead to significant fines or decertification from engaging in certain activities. In the energy industry, for example, violations of the North American Electric Reliability Corporation (NERC) standards can lead to fines of up to $1 million per day per violation. In the retail industry, failure to demonstrate compliance in an annual PCI DSS audit may result in fines and exclusion from payment card networks. The failure to meet the requirements of these laws and regulations can also serve as a basis for private litigation.
Independent of external regulatory requirements, many businesses develop and enforce corporate IT security policies to protect their IT assets. These security policies are frequently modified and refined to address expanding IT infrastructure, take advantage of new technologies and meet evolving business objectives. Compliance with internal policies can be just as important as compliance with externally mandated requirements, given the importance of the data assets at risk and many organizations’ reliance on their IT infrastructure for critical functions.
IT Environments are Increasingly Complex, Distributed and Dynamic
As a result of evolving business needs, IT environments are becoming more complex, distributed and dynamic.
| • | Growing Complexity of IT Environments. Modern IT environments are powered by a growing variety of heterogeneous IT assets, including network equipment, storage systems, web servers, email servers, application servers, mainframes, personal computers, security appliances and mobile devices. These IT assets often run a wide range of software, including disparate operating systems, databases and applications. In addition, many organizations are adopting new technologies such as virtualization solutions, which abstract software from the underlying hardware, and cloud computing, which enables delivery of IT resources, applications and data as a service accessible over a public or private network. Although organizations try to effectively integrate and manage all IT resources together, most of them operate and manage many modern and legacy IT assets separately, which significantly adds to the complexity and management costs of the IT environments. |
| • | Highly Distributed IT Environments. Managing this complexity has become more difficult as many IT environments have become highly distributed. IT environments often connect multiple operations and data centers from different regions across the globe, while also providing access to a large number of individuals, employees, partners and customers, connecting from internal and external locations through a variety of systems or application interfaces. |
75
Table of Contents
| • | Increasingly Dynamic IT Environments. IT systems are constantly changing in response to the needs of the operations they support and the introduction of new technologies. Changes in IT systems can be triggered by a range of simple to complex tasks, including the addition of a new physical server, the installation of security patches to thousands of personal computers across the enterprise or the deployment of a new data center. In addition, new technologies such as virtualization are accelerating the rate of change by decoupling software from the underlying specific physical IT systems and by enabling rapid implementation and automation of many changes. These changes can introduce new and poorly understood or hidden security vulnerabilities and potentially lead to security breaches or non-compliance with IT or regulatory policies. As a whole, these changes can produce a large number of events that IT administrators must monitor and track for security and compliance purposes. |
Organizations Continue to Face Significant Security and Compliance Challenges
To address the complex security risks of IT infrastructure and growing compliance requirements, organizations have continued to invest in a variety of point solutions targeted at a specific aspect or component of the IT infrastructure, hired additional IT personnel and engaged expensive outside service providers and IT consultants. However, these approaches have significant limitations and present organizations with challenges, including:
| • | Attacks and Breaches Can Go Undetected for Months. Many organizations are exposed to unknown threats because they lack the ability and personnel to collect and evaluate threat, event, log and change information sufficient to detect all breaches in a timely manner. Even when all the data can be collected, there is often too much of it for an organization to effectively and timely analyze and interpret the data utilizing existing point solutions. In addition, the data typically resides across different and disparate IT systems, or IT silos, making threatening patterns and actual breaches even more difficult and time-consuming to detect. Without integrated and automated solutions, IT personnel have to try to link relevant information such as change, configuration and vulnerability data manually, making it difficult and time consuming to identify and prioritize the real or most serious threats. In many organizations without a real-time, continuous and integrated security and compliance solution for the entire IT infrastructure, several months often elapse before some breaches are detected. We believe, based on industry sources, that security breaches in 2009 went undetected for an average of more than 150 days. In some instances, organizations become aware of a breach only as a result of being alerted by a customer that had been adversely affected by the breach. |
| • | Existing Approaches to Security and Compliance Automation are Not Cost-Effective. In an effort to secure their IT infrastructure and achieve compliance, organizations have historically invested significant amounts in point solutions that have limited functionality, address only a part of the overall compliance challenge and are slow, relatively ineffective and labor-intensive. The time and effort required to audit an organization’s IT infrastructure, separate real threats from non-threatening changes, and remediate identified problems can impose substantial burdens on IT personnel and on the infrastructure itself. This process often demands the time of an organization’s highly skilled IT personnel, limiting their ability to work on more strategic IT projects. Many organizations require external help and spend significant amounts on outside consultants. Since IT infrastructures continue to evolve, and the needs to secure the infrastructure and establish compliance are ongoing, these costs are recurring and growing. |
| • | Applying Regulations and Compliance Policies to IT Infrastructure Requires Expertise. When regulators or industry organizations promulgate new regulations or policies impacting IT environments, IT personnel must translate the general, high-level language of the regulations, security standards and policies into specific, actionable procedures and rules that can be implemented within an organization’s IT infrastructure. This translation is costly, complex and time consuming, and requires significant expertise to understand these regulations, standards and policies and their impact on the IT infrastructure. Many organizations do not have sufficient internal expertise to even start the compliance initiatives and must rely on outside consultants. |
76
Table of Contents
| • | Achieving and Maintaining Compliance is Difficult. The solutions used by organizations to achieve compliance generally offer relatively limited functionality and fail to address continuous compliance requirements. Organizations testing for non-compliance with highly-manual processes or periodic “megascans,” massive file and configuration scans across the entire IT infrastructure in a compressed time period, can experience significant deviations from the organization’s desired compliance state between these scans, exposing the organization to unexpected threats. In addition, constant changes to the IT infrastructure in support of business objectives create new vulnerabilities. In many cases, the approaches used by organizations to achieve compliance at a single point in time are not effective in maintaining compliance, resulting in continued security breaches and compliance violations despite an organization’s belief that it is compliant. A recent study by a global consulting firm found that although nearly two-thirds of organizations surveyed believe they regularly monitor regulatory and compliance requirements aimed at protecting personal and other sensitive information, more than half of the organizations had suffered at least one security breach in the preceding two years. As IT infrastructures evolve and regulatory requirements continue to expand, maintaining continuous security monitoring and compliance can be especially difficult. |
The following diagram illustrates the processes for organizations using manual assessments or periodic megascans to test for non-compliance:
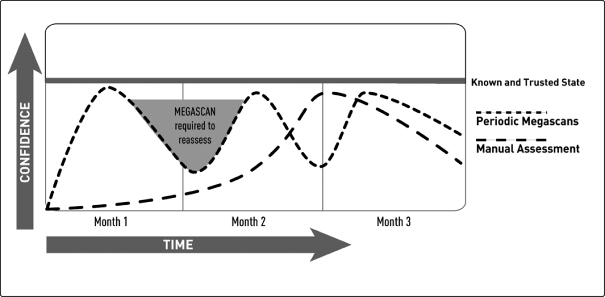
Market Opportunity
Our products target the high and recurring costs of complying with regulations and protecting organizations against security threats.
In October 2009, IDC estimated that worldwide revenue for the security and vulnerability management market (SVM), our primary target market, exceeded $2.6 billion in 2008 and is projected to grow to nearly $4.4 billion in 2013, representing a compound annual growth rate of 10.8% from 2008 to 2013(1). Our solutions address primarily the two largest segments of the SVM market as reported by IDC, the policy and compliance segment and the security information and event management segment. IDC reports that worldwide revenue for these segments was $1.2 billion in the aggregate in 2008 and is expected to grow to $2.4 billion in the aggregate in 2013, representing a compound annual growth rate of 15.3% from 2008 to 2013.
| (1) | “Worldwide Security and Vulnerability Management 2009-2013 Forecast and 2008 Vendor Shares,” Doc #220283, October 2009. |
77
Table of Contents
In addition, we believe that our products address certain needs of the change and configuration management software market and the software segment of the governance, risk and compliance (GRC) infrastructure market. IDC estimated in March 2010 that the worldwide change and configuration management software market, which is addressed by some functionality included in our flagship Tripwire Enterprise product, totaled $3.5 billion in 2009 and is projected to grow to $5.0 billion in 2014, representing a compound annual growth rate of 7.2% from 2009 to 2014(2). Virtualization of IT systems and cloud computing are key reasons for the forecasted growth in the change and configuration management software market, as increasing reliance on these technologies requires new ways to remotely and safely manage both change and configurations. IDC estimated in May 2010 that worldwide virtualized server shipments would grow from 1.1 million in 2009 to nearly 2.0 million in 2014, representing a compound annual growth rate of 13.0% and that worldwide shipment server virtualization penetration rates would grow from 16.4% in 2009 to 21.8% in 2014(3). IDC found that almost 30% of organizations were using or planning to use private clouds within the next twelve months and that an additional 40% of organizations were considering using private clouds, but that for all respondents, security was the top organizational challenge in moving to a cloud environment. In a March 2010 report, IDC estimated that the software segment of the worldwide GRC infrastructure market was $17.3 billion in 2009 and is expected to grow to $34.5 billion in 2014, representing a compound annual growth rate of 14.8% from 2009(4).
Public sector officials recognize the importance of IT security and compliance within their own agencies and other government organizations as well, and are devoting significant resources towards protecting their networks from increasingly sophisticated and organized technological threats. According to INPUT, a market intelligence provider, United States federal government demand for vendor-furnished information security products and services is expected to increase from $7.9 billion in 2009 to $11.7 billion in 2014. This compound annual growth rate of 8.1% is more than twice the growth rate of expected total U.S. federal IT spending during that period.
We believe that our opportunities with organizations of all types will be enhanced by the growing adoption of virtualization, the emergence of cloud computing and other technology trends that increase demand for broad and integrated IT infrastructure protection and automation, as well as regulatory trends requiring more transparency and information for enterprises and government agencies in order to prove compliance.
Our Solution
We have designed our products and services to provide a broad, integrated and automated solution that helps enterprises and government agencies meet the challenges of making IT infrastructure secure and compliant. Our solution provides visibility across the IT infrastructure, intelligently identifies security threats and compliance breaches, and automates security and compliance processes to reduce risk and cost. Our solution is based on our Tripwire VIA software suite, which is composed of our Tripwire Enterprise and Tripwire Log Center products, and helps customers cost-effectively reduce the security breach-to-detection time gap and address the issue of siloed data residing in disparate security and systems management tools.
Tripwire VIA addresses customers’ challenges based on the following key capabilities:
| • | Visibility. Visibility refers to our ability to view risk, compliance and security status through in-depth, real-time analysis of configurations, changes, events and logs for both physical and virtual IT infrastructures. |
| (2) | “Worldwide Change and Configuration Management Software 2010-2014 Forecast,” Doc #222330, March 2010. |
| (3) | “Worldwide Enterprise Server Cloud Computing 2010-1014 Forecast,” Doc #223118, May 2010. |
| (4) | “Worldwide Governance, Risk, and Compliance Infrastructure 2010-1014 Forecast: Increased Regulatory Oversight, Privacy, Cloud Computing, and Smart Cities Drive Emerging GRC Obligations,” Doc #222214, March 2010. |
78
Table of Contents
| • | Intelligence. Intelligence refers to our ability to efficiently correlate large amounts of siloed security and compliance data and assess this data with reference to established policies or customized settings to highlight vulnerabilities or non-compliance and to help organizations understand their security and compliance posture. |
| • | Automation. Automation refers to our ability to systematically and efficiently control a large number of policies, configurations, changes, logs and events, become aware of threats as they occur and proactively repair configuration errors. |
Our solution addresses organizations’ IT security and compliance challenges by enabling them to:
| • | Intelligently Identify Threats and Changes That Matter Most in a Timely Manner. Our solution continuously analyzes relationships among large amounts of data to significantly reduce the time between breach and discovery. We provide a software suite of products that detects, records, and sorts through millions of changes and events in real-time across the IT infrastructure, identifying and helping to address those that are critical. Our solution uses numerous methods to automatically distinguish between “good” and “bad” changes or events and identify real threats. These methods include features such as: simultaneously correlating detected changes to security event data as a means of differentiating between innocuous activity and deliberate, coordinated attacks; policy-based filtering that automatically compares detected changes to established security policies or customer-based settings; automated conditional actions that accept certain changes if they meet predefined criteria; and tight integration with other vendors’ change management systems. |
| • | Cost-effectively Address Key IT Security and Compliance Needs by Providing an Integrated Solution. Our solution eliminates significant manual efforts and costs that otherwise may be required to become secure and compliant. We provide an integrated solution that helps automate the correction of security vulnerabilities and non-compliant configurations, speeds the investigation of security incidents, and reduces the costs associated with demonstrating compliance. We enable our customers to use fewer solutions and services to achieve and maintain compliance in a cost-effective manner. For example, by using our solution one customer reduced the time required to audit its IT processes by approximately 80% and avoided increasing its IT staff by approximately 50 people. |
| • | Accelerate Implementation of IT Compliance Processes through an Extensive Security and Compliance Policy Library. Our library of security and compliance policies is an essential part of our solution. We believe we offer the largest IT policy library, addressing over 250 regulations, standards and best practices across more than 150 different technology platforms and providing over 89,000 compliance tests. We update our policy library as existing policies and regulations change and as applicable new standards are introduced. We believe the depth and breadth of our policy library, including our extensive experience in mapping regulations to IT-related policies, differentiates us from our competitors and creates a significant barrier to entry given the cost, time and expertise required to develop and maintain a large policy library. As of March 31, 2010, we have received over 40 product certifications from the Center for Internet Security (CIS), the leading authority on consensus best practice IT security standards. |
| • | Achieve and Maintain Continuous Compliance through Real-time Technology. Our solution immediately detects threats and vulnerabilities in the IT infrastructure, assesses compliance with known standards and best practices and proactively helps customers achieve and maintain a known and trusted state. Our real-time technology is event-based and provides continuous visibility into security and compliance as changes occur. In contrast, scan-based approaches offered by many of our competitors are time consuming to run and network bandwidth intensive, and only provide periodic “snapshots” of the security and compliance state, resulting in interim exposure to undetected breaches. The following diagram illustrates the continuous monitoring provided by our solution relative to periodic “megascans” and manual assessments and demonstrates Tripwire Enterprise’s differentiated capability to help maintain a known and trusted state. |
79
Table of Contents
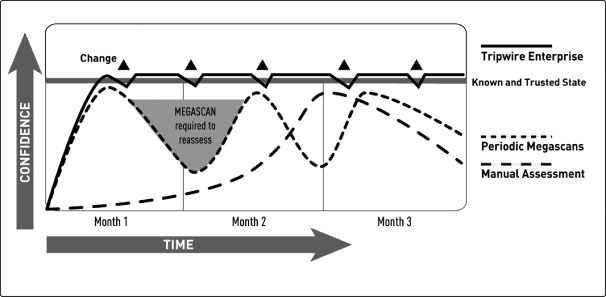
| • | Implement Enterprise-class Technology that is Easy-to-use, Scalable and Flexible. We design our solution to serve organizations of all sizes, including large, global organizations that have complex, dynamic, geographically-dispersed and heterogeneous IT infrastructures, as well as those that rely heavily on cloud-based and virtual infrastructures. Our solution does not require intrusive system audits or extensive system bandwidth. In addition, our solution is downloadable and designed for ease of installation and implementation by IT personnel. For example, once our Tripwire Log Center product is installed, our customers can use a visual approach to quickly develop and customize their correlation rules without needing to learn proprietary languages or complex algorithms. |
Our Growth Strategy
Our objective is to be the leading provider of enterprise-class IT security and compliance automation software solutions. Key elements of our strategy to achieve this objective include:
| • | Continue to Innovate and Expand Our Product Offerings. We intend to continue to innovate and expand our product offerings to provide organizations even better visibility into the security and compliance status of their IT infrastructure, more intelligence to identify the most critical audit, security and forensic information, and better automation tools to enhance their ability to respond and remediate in a timely and cost-effective manner. We believe we can take advantage of our integrated, real-time Tripwire VIA software suite and widely deployed common agent on our customers’ servers to add new product functionality that can be easily and efficiently implemented by our customers. We also plan to expand what we believe to be our industry-leading library of compliance policies. In addition, we intend to enhance our solutions to provide additional virtualization-related functionality and support cloud computing environments. |
| • | Grow Our Customer Base. We believe that increasing security threats and regulatory compliance requirements will generate demand for our solutions from new customers. We plan to continue to acquire new customers by addressing their unmet security and compliance needs with our existing and new solutions. We plan to pursue new customers in industry verticals where we have broad name recognition, significant expertise and a strong existing customer base, as well as in new verticals where growing regulatory requirements and security threats create demand for our solutions. To target new customers with limited IT resources and compliance expertise, we also plan to promote our remote management services and to offer alternative solution delivery methods. |
80
Table of Contents
| • | Increase Sales to Our Existing Customer Base. We have sold our products and services to over 5,500 customers, including 45% of the Fortune 500. We believe that our close relationships with customers give us insight into their additional unmet security and compliance needs. We believe we have a significant opportunity to increase our sales to existing customers by automating compliance of more of their IT systems, pursuing product upgrades and sales of new offerings, and targeting additional business units and broad enterprise deployments within these customers’ organizations. Customers often purchase our products initially to address only a subset of their IT infrastructure, typically only that portion in need of a near-term compliance solution. As customers realize the value of our solutions to help provide security and compliance, they often purchase more products to cover a broader portion of their IT infrastructure. We also plan to increase sales to our existing customers by providing greater compliance expertise and expanded offerings. We believe the recent addition of Tripwire Log Center, our log management product, to our Tripwire VIA software suite enhances our ability to pursue this strategy. |
| • | Strengthen and Expand our International Presence. We believe there is significant opportunity to increase our sales internationally. We generated revenue of approximately $12.6 million during 2009 from outside North America, and we believe we can increase this amount since our solutions address security threats and compliance challenges that organizations face globally. We plan to selectively target geographic regions where the number and scope of security risks and compliance regulations continue to increase. During 2009, approximately half of our sales in Europe, the Middle East and Asia and all of our sales in Japan were through channel partners. We intend to rely primarily on channel partners to expand our international presence. We also plan to continue to enhance our internal expertise in global and foreign regulations and our compliance content to better address needs of international organizations. |
| • | Increase Sales to Governments. We have sold our products and services to 27 of 30 U.S. federal government executive branch agencies, and many other domestic and foreign governments. We believe that demand for our solutions in the public sector will grow as governments and related organizations continue to increase their focus on cyber-security concerns and the integrity and security of their critical IT infrastructure. To increase our sales to U.S. federal, state and local government agencies and related organizations, we plan to continue to build additional functionality into our products and invest in certifications necessary to do business with some government agencies. For example, new security initiatives such as the National Institute of Standard and Technology’s security automation agenda and Security Content Automation Protocol (SCAP) will require specific functionality, which we intend to support in seeking additional public sector business. In addition, we plan to continue to increase our sales to foreign governments that have or may adopt security and compliance requirements similar to those of more highly regulated jurisdictions, such as the United States. |
| • | Selectively Pursue Acquisitions. We plan to selectively pursue acquisitions of businesses and technologies that complement our integrated IT security and compliance automation offerings. We believe our strategy enables us to deliver additional integrated solutions for IT security and compliance automation. We currently have no plans, proposals, or arrangements with respect to any specific acquisition. |
81
Table of Contents
Our Products
Our Tripwire VIA software suite combines our flagship Tripwire Enterprise product and our recently-introduced Tripwire Log Center product. Tripwire VIA provides a set of unified file integrity monitoring, compliance policy management, log management and security event management capabilities. Tripwire VIA integrates the data from these previously siloed capabilities to provide visibility, intelligence and automation across the IT infrastructure. We offer Tripwire VIA as an integrated suite to our customers and we also offer Tripwire Enterprise and Tripwire Log Center as individual offerings.
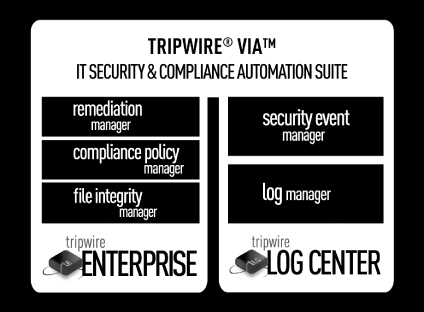
Tripwire Enterprise
Tripwire Enterprise is a software-based solution designed to help enterprises and government agencies protect sensitive data, maintain and demonstrate compliance and prevent outages by managing changes and configurations across IT systems. It protects, detects, and corrects files and configurations across the customer’s IT infrastructure. Tripwire Enterprise is comprised of three products, File Integrity Manager, Compliance Policy Manager and Remediation Manager, managed through a single console that provides reporting, notification and change reconciliation functionality.
File Integrity Manager. The Tripwire Enterprise File Integrity Manager provides real-time visibility and control over changes in the physical and virtual IT infrastructure. File Integrity Manager first establishes a configuration baseline (the customer’s known and trusted state of its IT infrastructure), and then continuously monitors the configuration for changes such as open ports or user permission changes that introduce vulnerabilities or bring the IT infrastructure into a noncompliant state. File Integrity Manager determines whether file or configuration integrity exists by capturing raw file contents, assesses integrity in real-time across the IT infrastructure, including servers, applications, databases, virtual environments, network devices, and immediately alerts IT professionals of potential vulnerabilities and unauthorized changes. File Integrity Manager integrates with the Compliance Policy Manager to determine system integrity by checking changes against internal and external policies to intelligently identify changes that take the IT infrastructure out of its known and trusted state.
82
Table of Contents
Compliance Policy Manager. As of June 30, 2010, our Tripwire Enterprise Compliance Policy Manager provided 256 policies to help demonstrate compliance with:
| • | laws and regulations such as PCI, NERC, SOX, HIPAA, FISMA, Gramm-Leach-Bliley Act (GLBA), Federal Financial Institutions Examination Council (FFIEC), Massachusetts Privacy Law and Federal Desktop Core Configuration (FDCC); |
| • | security standards such as National Institute of Standards and Technology (NIST) guidelines, Center for Internet Security (CIS) benchmarks, Defense Information Systems (DISA) standards, National Security Agency security standard, ISO 27001 and COBIT standards, Monetary Authority of Singapore (MAS) Internet Banking and Technology Risk Management Guidelines; |
| • | best practices for system configurations for solutions offered by vendors such as Cisco, Oracle, VMware and Microsoft; and |
| • | user-defined custom policies. |
Compliance Policy Manager helps automate compliance by proactively assessing and validating a customer’s IT configurations against these policies and best practices. As changes are detected by the File Integrity Manager, Compliance Policy Manager automatically compares them to a known and trusted state to provide real-time compliance information. Compliance Policy Manager also integrates with our recently-introduced Remediation Manager, providing policy information required to make conforming corrections.
Remediation Manager. Prior versions of Tripwire Enterprise provide prescriptive, step-by-step guidance to remediate misconfigured or non-compliant file configurations. The newest version of Tripwire Enterprise introduces Remediation Manager, an automated solution that proactively repairs the configuration errors discovered in Tripwire Enterprise’s compliance policy scans. This add-on module for Tripwire Enterprise permits customers to automatically correct failed configuration tests, significantly reducing the time spent on manual remediation tasks. Remediation Manager presents a streamlined management interface that allows IT stakeholders from security, compliance and IT operation teams to approve, deny, defer and execute remediation work orders, assuring visibility and traceability throughout the remediation process. Remediation Manager comes with a complete library of remediation scripts that align Windows, Red Hat Enterprise Linux, SUSE Linux and Solaris servers with security requirements from 20 distinct policy sources.
Tripwire Enterprise Management Console. Customers also purchase our Tripwire Enterprise Console, which provides the following functionality:
| • | Reporting and Notification. Tripwire Enterprise provides nearly 40 actionable report templates and a set of configurable user-specific dashboards, alerts and actions that provide current and historical security and compliance scoring and trends for administrators, managers and executives. Reports can be generated in several different formats and users can be notified in real-time. |
| • | Change Reconciliation. Tripwire Enterprise intelligently reconciles changes, filters authorized and unauthorized changes and provides visibility of planned and unplanned changes. A variety of methods can be customized to work within the user’s workflow and policies. |
Tripwire Enterprise License Modules
Our Tripwire Enterprise File Integrity Manager, Compliance Policy Manager and Remediation Manager solutions are licensed for individual IT infrastructure assets such as file systems, databases, network devices, virtual environments, directory services and applications. Customers purchase File Integrity Manager, Compliance Policy Manager and Remediation Manager licenses based on the number and type of assets that must be controlled in order to support their overall security and compliance objectives. Customers also purchase our Tripwire Enterprise Console.
83
Table of Contents
The following diagram illustrates the scope of application of our Tripwire Enterprise product family:
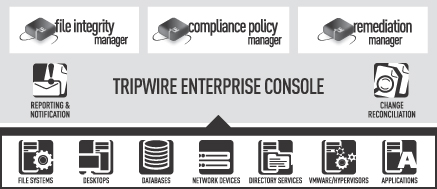
Our Tripwire Enterprise solution provides configuration control of the following IT assets:
| • | File Systems and Desktops. Assesses changes and configurations of physical and virtual server and desktop file systems, including security settings, configuration parameters and permissions. Examples of supported environments include Windows, Linux and Solaris. |
| • | Databases. Assesses changes and configurations of schema objects, application and configuration files, security and configuration parameters, access settings and user roles and permissions. Examples of supported environments include Oracle, Microsoft SQL Server and IBM DB2. |
| • | Network Devices. Assesses changes and configurations of communication protocols, user settings, and port settings on hundreds of network devices, such as those made by Cisco, Alcatel and Juniper. |
| • | Directory Services. Assesses changes and configurations of group policy objects, user identity and access rights for Lightweight Directory Access Protocol (LDAP)-compliant directory servers. Examples of supported servers include Microsoft Active Directory, Sun Java System Directory Server and Novell eDirectory. |
| • | VMware/Hypervisors. Assesses changes and configurations of virtual infrastructures environments including hypervisors, virtual containers and vSwitches. Policies are based on CIS security policies, DISA Security Technical Implementation Guides (STIGs) and VMware’s Infrastructure 3 Security Hardening guide. Our VMware vCenter integration automatically discovers and populates clusters, data centers, hypervisors, resource pools and folders from VMware’s vCenter into Tripwire Enterprise. |
| • | Applications. Assesses changes and configurations of security settings, configuration parameters and permissions for supported applications such as Microsoft Exchange and Internet Information Services servers to ensure security, compliance, availability and optimal performance. Also enables IT professionals to easily create policies for non-supported applications, including custom applications. |
Tripwire Enterprise Pre-packaged Solutions
We also offer pre-packaged solutions with customized configurations designed to meet the unique needs of selected customers in certain industries, including:
PCI for Retailers. PCI for Retailers is a pre-configured, automated solution that helps individual stores demonstrate PCI compliance and includes coverage from point-of-sale systems to back-end payment processing as well as of the data center. We provide two configurations of this solution: Tripwire for Small Stores, for up to five file systems and one database, and Tripwire for Large Stores, for up to 75 file systems and one database.
84
Table of Contents
PCI for Hospitality. PCI for Hospitality is a pre-configured, automated solution that helps the hospitality industry demonstrate PCI compliance. This solution provides a comprehensive compliance policy management and file integrity monitoring solution that detects and helps reconcile any changes made to IT configurations. We provide two configurations of this solution: Tripwire for Hospitality—Small, for up to five file systems, one database, and one network device; and Tripwire for Hospitality—Large, for up to 75 file systems, one database, and five network devices.
Tripwire Express for PCI. Tripwire Express enables customers to implement our Tripwire Enterprise solution on their own, one server at a time, providing smaller local and Internet retailers with an affordable, pay-as-you-grow PCI compliance solution.
Tripwire Log Center
Tripwire Log Center is a software-based solution that provides fast, efficient, and scalable log and event management. It is designed for enterprises and government agencies that need to protect data from security threats, and demonstrate compliance with specific regulatory requirements. Tripwire Log Center is composed of two integrated components: Log Manager and Security Event Manager.
Log Manager. Log Manager is an enterprise-class log management solution that efficiently collects, retains and reports on event data from network devices, firewalls, servers, databases and applications across the IT infrastructure for compliance and security requirements. As Log Manager collects log data, it compresses and encrypts the data and then tests it for integrity before storing it as a “flat file.” Our flat file approach delivers an inexpensive, simple and scalable means for storing large amounts of data relative to many competitive products that use a relational database to store data. In addition, Log Manager provides high-speed search, query and reporting functions directly from the flat file for efficient information retrieval, compliance reporting and forensic analysis. Log Manager also includes real-time alerting to notify customers of suspicious activities. Included with Log Manager is Log Concentrator, which collects and stores local log data and transfers it to a central repository. Data can be uploaded to the Log Manager immediately or uploads can be scheduled to occur when network traffic is low. All features and functionality of Tripwire Log Manager are accessed through the Log Center Console.
Security Event Manager. Security Event Manager correlates events to identify suspicious activity, also known as “events of interest.” This solution includes a dashboard that displays current security events, trends, vulnerabilities and threats and enables customers to perform deep forensic analysis of anomalous or suspicious activity. Security Event Manager utilizes a relational database and includes a library of correlation rules that correlate events to identify events of interest. It also offers a correlation rule builder based on simple pictures and diagrams that enables customers to quickly customize and develop security rules without the need to learn complex proprietary languages, as required by some competitive products. Security Event Manager imports data from vulnerability scanners and correlates them with events of interest to better identify potential risks in the IT infrastructure. Security Event Manager also includes a security event ticketing system that prioritizes, assigns and tracks the resolution of high-priority security events.
Solution packs for Tripwire Log Center. We also offer pre-packaged software solutions to help customers prove compliance with laws, regulations and standards such as PCI, SOX, GLBA and HIPAA. A Solution Pack includes dashboard views, correlation rules and reports that map regulatory requirements to the IT infrastructure. Solution Packs are designed, created and maintained by Tripwire’s policy team and are licensed separately from Tripwire Log Center.
Tripwire for Servers
Tripwire for Servers is designed for enterprises and government agencies with IT environments that do not have an active network connection—such as the IT environments found on submarines and super-secure intelligence infrastructures—but still need comprehensive file integrity monitoring. Tripwire for Servers helps
85
Table of Contents
identify the source of improper change by correlating event logs to Tripwire for Servers’ continuous integrity monitoring, supporting proper change management processes, routine and emergency audits, and forensic investigation of data. This solution provides high-level reports and dashboards and detailed guidance to help technical staff promptly remediate integrity and compliance issues. Tripwire for Servers can also automatically restore improperly changed files to their last known and trusted state, to help provide ongoing integrity of mission-critical systems. Tripwire for Servers is one of our original products which we continue to support but no longer actively market.
Our Technology
Certain elements of our solutions help us differentiate our products and offer customers an integrated security and compliance automation solution. Our primary differentiating technologies include our VIA technology, our ChangeIQ technology, our Tripwire Enterprise agent, our in-depth change detection technology and our log collection technology.
VIA Technology. Our VIA technology provides visibility into and context regarding disparate security data such as events and changes, intelligence in identifying threats and compliance failures by analyzing these disparate data types, and automation to help lower the overall cost of making IT infrastructures secure and compliant. For example, our technology allows IT personnel to view all events that occurred around a particular change in order to understand whether the change matters. In addition, the high-speed event search capability of the VIA technology available inside Tripwire Enterprise allows the user to reconcile changes based on whether it occurred in relation to other suspicious activity. Tripwire Log Center can also correlate Tripwire Enterprise change events with events from other sources to help investigate suspicious activity.
ChangeIQ Technology. Our ChangeIQ technology provides automated intelligence to our customers to efficiently identify adverse changes and automate change reconciliation. Our in-depth change detection is partnered with our ChangeIQ technology, which automatically distinguishes between “good” and “bad” changes based on policy-filtering and other methods customers may select. Customers use different approaches to analyze changes in their IT infrastructure. For example, they may want to identify changes made by unauthorized users, or changes made outside of specified change time windows. Alternatively, customers may characterize as adverse changes those that put the system out of policy compliance, changes of a specific type or changes to a specific file.
Tripwire Enterprise Agent. Our Tripwire Enterprise agent is an efficient and reliable software solution that is deployed with minimal intrusion on servers and desktops across most operating systems including Windows, Red Hat Linux, Solaris, AIX, HP-UX, iSeries and SUSE Linux. Our agent collects detailed information from heterogeneous IT infrastructure that cannot be automatically captured by other means. Since the Tripwire Enterprise agent supports a wide array of platforms, it provides a uniform and effective solution for the majority of our customers’ mission-critical systems in their datacenter. We believe our agent has the potential to solve additional security and compliance problems for our customers in the future.
In-Depth Change Detection Technology. Our technology detects small changes in IT configuration and files across heterogeneous environments (such as UNIX, Linux, Windows, databases, hypervisors, network devices and Active Directory) and displays the changes in a single console in a uniform way. Changes can be detected, at the customers’ option, through scheduled scans or in real time. Unlike other solutions that may only detect that a change occurred, our technology provides a detailed audit trail about changes and critical information about who made the change. Our solutions permit customers to detect detailed change data across a wide array of IT platforms with minimal intrusion on system performance. This capability is agent-based on servers, databases, directory services, desktops and applications and agentless on network devices.
We have built and continue to build additional capabilities of this technology to support our product families. For example, we developed our continuous policy compliance monitoring capability using our in-depth
86
Table of Contents
change detection technology. Typical policy compliance technologies perform megascans that may require significant network bandwidth and are typically performed infrequently and during off hours. With our technology, policy compliance is continuously tested and demonstrated every time a change is made, with no additional network impact beyond the already low change detection footprint.
Log Collection Technology. Our log collection technology integrates log management and security event management capabilities into one product. Our flat-file structure for the high-speed collection and storage of log data scales better than a typical relational database, providing reduced storage costs. Our technology also provides rapid search and reporting from raw logs in the flat file, a capability that usually requires highly optimized databases. We also provide advanced correlation, reporting and dashboards, and we designed a visual approach to correlation that allows our customers to quickly develop and customize their correlation rules without needing to learn proprietary languages or complex algorithms.
Maintenance and Professional Services
Maintenance. Our customers typically purchase one year of software maintenance and support as part of their purchase of our products and have the option to renew their maintenance contracts on an annual basis. Under the maintenance contracts customers are entitled to receive unspecified product updates and upgrades, maintenance releases and patches, if and when released, and Internet and telephone access to support personnel and content during the term of the contract.
We devote significant resources to simplify the installation, configuration and use of our software products, which are downloadable. We offer detailed instruction manuals and online tutorials for our products in multiple languages. We also offer a community website as a forum for customers to share information, tips, tools and other valuable resources. Through this online community of over 3,500 registered members, customers may interact, share solutions for technical problems, discuss new applications for our software and provide suggestions or feedback to us. As a result, most of our customers are able to install our software unassisted, and resolve most technical issues without the need to contact our support representatives. We offer standard technical support to our customers during normal business hours. For customers that desire support that is available 24 hours a day, seven days a week, we provide premium maintenance contracts. We provide support services by telephone, or email through our Customer Center online portal.
Professional Services. For customers desiring expert assistance, we offer the following professional services designed to help our customers maximize the value they receive from our products.
| • | Basic Services. We offer installation and configuration services through a secure network connection and phone-based meetings to help customers quickly implement the core capabilities of our products. We also offer specialized assistance for our PCI for Retail and PCI for Hospitality solutions, tailored implementations for customers with unique requirements and upgrade service packages. |
| • | Advanced Services. Once our products are installed, we offer advanced services to optimize their performance. Our advanced services include project management, integration, and custom policy development services to integrate our products into our customers’ existing IT infrastructure and to accommodate unique situations or special needs. |
| • | Training. We offer instructor-led public and onsite training for our products in major markets where we do business. We also offer online training and several training materials on our website. Our courses are designed to prepare our customers to install, configure, operate, and maintain their Tripwire investment. |
| • | Managed Services. We offer remote implementation and operational services for our Tripwire Enterprise and Tripwire Log Center products for customers who choose to have our staff manage their Tripwire software deployment. The ability to outsource these functions helps some customers to ensure optimal use of our products and enables them to focus on their core operations. |
87
Table of Contents
Sales and Marketing
Sales. We sell our products and services through our sales organization directly to our customers and, to a lesser extent, through channel partners for some of our sales to government and international customers.
Our sales organization is structured primarily by region, although we have dedicated sales teams for a few specified industries and the U.S. federal government. Our regions include: the Americas; Europe, the Middle East and Africa (EMEA); and Asia-Pacific (APAC). Our sales teams are typically comprised of a combination of a field account manager, an inside sales representative, a systems engineer and a sales associate.
The selling process for our products and services follows a typical enterprise software sales cycle and usually involves one or more of our direct sales representatives, even when a channel partner is involved. The sales cycle from the time of initial prospect qualification to completion of an initial sale may take a few days or several months. Our field sales teams focus on larger transactions involving initial license, first-year maintenance and professional services sales. A significant number of smaller transactions for initial license sales to new customers and the sale of add-on licenses and maintenance renewals to existing customers are handled by our inside sales team over the phone. After initial deployment, our sales personnel focus on ongoing account management and follow-on sales.
Sales of our products and services to the U.S. federal government and a significant portion of our international sales are transacted through channel partners, such as value-added resellers and systems integrators. Resellers are an important source of sales for us in the United States public sector, because government agencies often rely on resellers to meet IT needs. To facilitate the sale of our products to the United States federal government, we have entered into non-exclusive reseller agreements with two companies that hold General Services Administration schedules. We also use resellers to augment our internal resources elsewhere, primarily in international markets.
Our agreements with our channel partners are generally non-exclusive and our channel partners may cease marketing our products and services at any time and may do so with limited or no notice and with little or no penalty. We are developing relationships with channel partners in geographic regions where we do not have a direct presence, and we recently created a focused channel sales and marketing team responsible for increasing sales in specific regions in EMEA through channel partnerships.
Marketing. We focus our marketing efforts on identifying key regional and industry market dynamics that influence IT security and compliance spending, and then seek to build thought leadership on these trends and themes to promote inquiry generation. Our primary marketing efforts include hosting or participating in online and in-person events (such as podcasts, webcasts or live presentations on current issues in security and compliance), email campaigns, public relations activities and advertising. We also seek to build our brand and increase brand awareness by contributing articles to various trade magazines, increasing our visibility with industry analysts, sponsoring public speaking engagements and participating in international, national and regional trade shows. We seek to reinforce our brand and loyalty among our customer base by participating in customer advisory meetings with regional user groups and holding an annual user conference.
We believe that we have developed a strong brand and reputation as a pioneer and leader in the IT security and compliance markets. We have been recognized by leading third-party research firms and publications for our industry leadership and the strength of our technology. For example, in 2006, Tripwire Enterprise received the Gold Award and was named Product of the Year by Information Security magazine for Network Security Management. In 2008, Enterprise Management Associates named Tripwire to the first-ever All-Stars in Enterprise Systems Management in the category of Change Management.
As of June 30, 2010, we had 169 employees in our sales and marketing operations.
88
Table of Contents
Research and Development
Our research and development (R&D) efforts are focused primarily on improving and enhancing our existing products and developing new features and functions for our Tripwire VIA software suite. We work closely with our customers to understand their current and future needs and have designed a product development process in which we take their feedback into account. Members of our Security and Compliance Solutions department hold certifications in the fields of information security and information systems auditing and provide the basis for our knowledge in CIS policies and expertise in PCI DSS, NERC, NIST, SCAP, Control Objectives for Information and Related Technology (COBIT), and other compliance frameworks and benchmarks.
As of June 30, 2010 our R&D team consisted of 70 employees, all headquartered in Portland, Oregon, with additional work performed by 71 outside contractors in Vietnam, Mexico and Colorado. For 2007, 2008 and 2009 and the six months ended June 30, 2010, R&D expense was $9.9 million, $12.6 million, $12.6 million and $7.1 million, respectively.
Intellectual Property
Our intellectual property is an essential element of our business. We rely on a combination of copyright, trademark, trade dress and trade secret laws, as well as confidentiality procedures and contractual restrictions, to establish and protect our proprietary rights both domestically and abroad. These laws, procedures and restrictions provide only limited protection. We currently have five issued patents and sixteen patent applications pending in the United States, and have two international issued patents. Our issued patents expire in 2023, 2024 and 2025.
TRIPWIRE is a registered trademark for use in connection with the Tripwire products in the United States, Canada, China, the European Union, Japan, South Korea, Singapore and Taiwan. We also own trademarks for names associated with certain of our products or product features, and have certain registrations and pending applications for these marks. We generally enter into agreements with our employees and contractors and with parties with whom we do business in order to limit access to and disclosure of our proprietary information. We enter into license and other agreements with our customers with respect to our software and other proprietary information.
Despite our efforts, the steps we have taken to protect our intellectual property and proprietary rights may not be adequate to preclude misappropriation of our proprietary information or infringement of our intellectual property rights, and our ability to monitor such misappropriation or infringement is uncertain, particularly in countries outside of the United States. United States patent filings are intended to provide the holder with a right to exclude others from making, using, selling or importing in the United States the inventions covered by the claims of granted patents. Our granted United States patents, and any future patents (to the extent they are issued), may be contested, circumvented or invalidated in the future. In addition, the rights granted under any issued patents may not provide us with proprietary protection or competitive advantages, and we may not be able to prevent third parties from infringing these patents. As a result, the exact effect of our patents and the other steps we have taken to protect our intellectual property cannot be predicted with certainty.
Customers
We help a wide range of enterprises and government agencies worldwide reduce risk and cost by automating critical security and compliance and by providing visibility across the entire IT infrastructure to configurations, changes, logs and events, and intelligence into threats, breaches and compliance controls. As of June 30, 2010, we had sold our products and services to over 5,500 customers in 88 countries worldwide, including 45% of the Fortune 500, 27 of 30 U.S. federal government executive branch agencies, and many other domestic and foreign governments. Our customers span a broad range of industries including retail and hospitality, financial services, energy, media and communications, transportation and government and defense. Our customers include organizations such as AXA Financial, bwin Interactive Entertainment AG, Fannie Mae, Federal Express Corporation, PepsiCo and The Walt Disney Company. These customers are among our top 30 active accounts based on cumulative sales to the customer since our inception.
89
Table of Contents
A customer deployment may involve the implementation of a few nodes or thousands, depending on the customer’s size and security and compliance objectives. Customers may order additional licenses or features as their IT environments or compliance objectives expand and as we introduce new products or features. No customer accounted for more than 10% of our revenue in 2007, 2008 or 2009. For 2007, 2008 and 2009, and the six months ended June 30, 2010, we generated approximately 78%, 71%, 76% and 74%, respectively, of our revenue from customers in the United States, and approximately 22%, 29%, 24% and 26%, respectively, from customers outside of the United States. In 2008, 2009 and the six months ended June 30, 2010, we derived approximately 15%, 17% and 17%, respectively, of our license and professional services revenue from sales, directly and indirectly, to departments and agencies of the United States federal government. Departments and agencies of the United States federal government make purchases of our products and services on an order-by-order basis and have not agreed to purchase any specific amount of products or services.
Case Studies
The following case studies illustrate how our customers use and benefit from our products, and reflect certain characteristics of our solution and growth strategy.
A Major Shipping and Logistics Company Proves Continuous Compliance and Improves Service Availability
A Fortune 100 shipping and logistics management company needed to demonstrate to its auditors compliance with the PCI DSS, which required centralized change and configuration management capabilities for its IT infrastructure. The company required a solution that would deliver a real-time view of changes across its entire IT infrastructure and provide forensic evidence relating to IT service outages. The company selected Tripwire Enterprise to help meet its file integrity monitoring compliance requirements. In part because of its deployment of our products, the company is now PCI DSS-compliant and has automated its compliance processes. Based in part upon adoption of our solution, the company’s internal IT Security & Compliance team received recognition within the company for its success.
A University Protects its Systems from External Threats
An American university suffered a security breach and disruption of many of the services maintained by the IT staff when a hacker broke into the university’s Windows systems. The university selected Tripwire Enterprise to help assure the integrity of the campus-wide IT infrastructure. Now implemented on the university’s servers, our solution provides the IT team with immediate visibility into IT infrastructure changes and automatically alerts the IT staff to changes that could disrupt the known and trusted IT state. As a result of implementing our solution, the university has improved security across all IT environments and increased the productivity of its staff, enabling its IT professionals to work on additional projects.
A Global Business Process Outsourcer Reduces its Cost of Compliance
A leading global provider of business process outsourcing needed a low-cost solution to help ensure compliance with multiple regulations and standards, such as the PCI DSS and SOX, for over 2,000 customers worldwide. The business process outsourcer selected Tripwire Enterprise to maintain and automate its compliance needs across its customer base and, as a result, reduced the time it spent on audit processes by approximately 80% and avoided the cost of increasing its IT staff by approximately 50 people.
Competition
The market for IT security and compliance software products is competitive, and we expect competition to increase. Currently we face competitors in several broad categories, including file integrity monitoring, policy compliance, log management and event management. Within these categories, we compete with suppliers such as
90
Table of Contents
HP, IBM, McAfee, RSA (the security division of EMC Corporation), BMC Software and Symantec, that offer broad product offerings covering these and other categories, as well as with smaller vendors such as ArcSight, LogLogic and Q1 Labs that focus on specific functionalities by offering point solutions. Many of our historical competitors have been acquired by larger, publicly-traded companies trying to expand their solution suites, resulting in more direct competition from McAfee, BMC Software, EMC Corporation and its majority-owned, publicly-held subsidiary, VMware.
We believe that the principal competitive factors in our markets include:
| • | product effectiveness, functionality, interoperability with other IT system components, scalability and reliability; |
| • | ease and speed of deployment, integration with the IT system and configuration; |
| • | technological expertise; |
| • | brand recognition; |
| • | customer service and support; |
| • | sales and distribution capabilities; |
| • | size and financial stability of operations; and |
| • | breadth of product capabilities. |
Although we face competition from a number of competitors with respect to various aspects of our software products, we believe that we compete favorably based on our Tripwire VIA software suite, our products’ performance, reliability, breadth of application, ease of use and simple pricing structure, and on our ability to add or integrate new features based on our technological expertise.
Many of our existing and potential competitors enjoy substantial competitive advantages, such as: broader product offerings and sales channels; greater brand recognition; a wider geographic presence; access to larger customer bases and the capacity to leverage sales efforts and marketing expenditures across a broader portfolio of products; more extensive relationships within larger enterprises, the federal government and foreign governments; and substantially greater financial, technical, research and development and other resources. As a result, they may be able to adapt more quickly and effectively to new or emerging technologies and changing opportunities, standards or customer requirements. Competitors that offer a large array of security or software products may be able to offer products or functionality similar to ours at a more attractive price than we can by integrating or bundling them with their other product offerings. The trend towards consolidation in our industry increases the likelihood of competition based on integration or bundling. If we are unable to sufficiently differentiate our products from the integrated or bundled products of our competitors, such as by offering enhanced functionality, performance or value, demand for our products may decline. Similarly, if customers seek to concentrate their software purchases in the product portfolios of a few large providers that can purport to satisfy a broad range of customer requirements, we may be at a competitive disadvantage notwithstanding the superior performance that we believe our products can deliver.
Backlog
Because our software licenses are generally delivered without delay upon receipt of an order, and our maintenance contracts are billed in advance, we generally carry minimal backlog.
Employees
As of June 30, 2010, we had 336 employees in offices worldwide. Of these employees, 169 are engaged in sales and marketing, 70 in research and development, 55 in support and services and 42 in finance, administration and operations. A total of 43 employees are located outside of the United States. We supplement
91
Table of Contents
our research and development capabilities with non-employee contractors in Vietnam, Mexico and Colorado. None of our employees are represented by labor unions or covered by a collective bargaining agreement. We consider current employee relations to be good and have never experienced a work stoppage.
Facilities
Our corporate headquarters and primary research and development facilities occupy approximately 47,000 square feet in Portland, Oregon, pursuant to a lease that expires in April 2014. In addition to our principal office space in Oregon, we lease sales and local support offices in Michigan, California, the United Kingdom and Japan. We believe that our existing facilities are generally suitable to meet our needs for the foreseeable future, but we expect to continue to seek additional space as needed to accommodate any future growth.
Legal Proceedings
From time to time, we may be subject to legal proceedings and claims in the ordinary course of business. In such cases it is our policy to defend against such claims, or if considered appropriate, negotiate a settlement on commercially reasonable terms. However, no assurance can be given that we will be able to negotiate settlements on commercially reasonable terms, or at all, or that any litigation resulting from such claims would not materially harm our business, operating results or financial position. We are not currently a party to any legal proceeding that we believe is material to us.
92
Table of Contents
Directors and Executive Officers
The following table sets forth certain information about our directors and executive officers as of July 26, 2010.
| Name |
Age | Position | ||
| Board of Directors |
||||
| William W. Lattin (1)(2) |
69 | Chairman of the Board of Directors | ||
| James B. Johnson |
59 | President and Chief Executive Officer, Director | ||
| Steven N. Baloff (1)(2) |
55 | Director | ||
| Robert J. Finocchio, Jr. (2)(3) |
59 | Director | ||
| Justin Label (2)(3) |
35 | Director | ||
| James T. Richardson (3) |
62 | Director | ||
| Executive Officers |
||||
| Daniel Schoenbaum |
39 | Chief Operations Officer of Products | ||
| Kelly E. Lang |
48 | Vice President and Chief Financial Officer | ||
| Robert F. Dunne |
56 | Vice President of Worldwide Sales |
| (1) | Member of the compensation committee. |
| (2) | Member of the nominating and governance committee. |
| (3) | Member of the audit committee. |
Board of Directors
William W. Lattin has served as a director since 2001 and is Chairman of the Board. Dr. Lattin spent his career in the semiconductor and electronic design automation industries. Since 2002, Dr. Lattin has served as the President of Lattin Enterprises, a firm that invests in development-stage technology companies. Prior to starting Lattin Enterprises, Dr. Lattin served in various executive roles at a number of technology companies, including as Executive Vice President and a director of Synopsys., Inc., a supplier of electronic design automation software to the global semiconductor industry, President and Chief Executive Officer of Logic Modeling Systems Inc., which was acquired by Synopsys in 1994, and as Vice President and General Manager of the Systems Group at Intel Corporation. Dr. Lattin began his career with Motorola Semiconductor Company. Dr. Lattin currently serves on the board of directors of RadiSys Corporation, a developer of embedded systems, and FEI Company, a diversified scientific instruments company. Dr. Lattin formerly served on the boards of Adexa, a supplier of business oriented computer software, and Merix Corporation, which was acquired by Viasystems Group, Inc. Dr. Lattin’s experience serving in senior positions at several software companies make him a valuable member of our board of directors, as he understands the company’s operations and the market. Further, Dr. Lattin’s service on the board of directors of several other public companies provides our board with the experience and perspective to guide our corporate governance and executive compensation practices. Dr. Lattin holds B.S. and M.S. degrees in Electrical Engineering from the University of California at Berkeley and a Ph.D. in Electrical Engineering from Arizona State University. In addition, Dr. Lattin holds seven patents, is a founding member of VHDL International, an organization that promotes VHDL hardware description language, and is a senior member of IEEE, a professional organization for the advancement of technology.
James B. Johnson has served as our President and Chief Executive Officer and as a director since he joined our company in 2004. Prior to joining us, Mr. Johnson spent 27 years at Intel Corporation, where he served as Vice President of the Internet Service Operation and Director of Marketing for the Internet and Communications Group. He also co-founded and served as General Manager of Intel’s PC Enhancement Division, its retail products group. Mr. Johnson’s extensive experience in technology company operations, combined with his extensive and in-depth knowledge of our business gained from his service as our president and chief executive officer makes Mr. Johnson a valuable member of our board of directors. Mr. Johnson holds a B.S. degree in
93
Table of Contents
Electrical Engineering from the University of California at Berkley and an M.S. degree in Computer Science from Stanford University.
Steven N. Baloff has served as a director since 2003. Mr. Baloff joined Advanced Technologies Ventures (ATV) as Managing Director in 1996 and focuses on investments in the software, infrastructure and Internet services markets. Prior to joining ATV, Mr. Baloff founded and served as Chief Executive Officer of Worldview Systems, a venture capital-backed start-up. Through a joint venture with Sabre Interactive, Worldwide Systems created and launched the Travelocity.com travel site. Mr. Baloff also held executive positions in sales, marketing and general management at Covalent Systems, a venture-backed computer systems vendor focused on the graphics arts industry. Mr. Baloff began his career in Booz-Allen & Hamilton’s San Francisco and London offices, where he focused on strategy engagements for a variety of technology companies in the U.S. and Europe. Mr. Baloff brings to our board of directors valuable experience in the Internet and software industries. The experience that he gained at Booz-Allen & Hamilton, combined with his extensive knowledge of our company and its history, allows Mr. Baloff to provide guidance to our board of directors and the company regarding our operations and growth strategies and opportunities. Mr. Baloff holds a B.A. in Economics from Harvard College and an M.B.A. from the Stanford Graduate School of Business.
Robert J. Finocchio, Jr. joined our board of directors in May 2010. Mr. Finocchio is a corporate director, private investor, part-time professor, and consultant. Since September 2000, Mr. Finocchio has been a Dean’s Executive Professor at Santa Clara University’s Leavey School of Business. He currently is a director at Altera Corporation and Echelon Corporation. He was previously a director of Palmsource Inc., Pinnacle Systems, Inc. and Sun Microsystems, Inc. From August 1997 to September 2000, he served as Chairman of the Board of Informix Corporation, an information management software company. From July 1997 until July 1999, Mr. Finocchio served as President and Chief Executive Officer of Informix. From December 1988 until May 1997, Mr. Finocchio was employed with 3Com Corporation where he held various positions, most recently serving as President, 3Com Systems. Prior to 3Com, he spent nine years at ROLM Corporation. Mr. Finocchio is Chair of the Board of Trustees at of Santa Clara University and a consultant to Advanced Technology Ventures. Mr. Finocchio brings to our board of directors extensive experience in the technology industry, financial sophistication and public company board experience. Mr. Finocchio holds a B.S. in Economics from Santa Clara University and an M.B.A. from Harvard Business School.
Justin Label has served as a director since 2004. Mr. Label is currently employed by Bessemer Venture Partners. Since joining Bessemer in 2001, Mr. Label has focused on investments in software and clean technology companies. He previously worked as an investor at Valent Group, an early stage venture capital firm, and a strategy consultant with Boston Consulting Group. Mr. Label’s extensive experience in working with Internet and software companies provides our board of directors with the benefit of Mr. Label’s knowledge and understanding of the industry and markets in which we operate. In addition, Mr. Label’s experience with and exposure to a wide range of companies, combined with his extensive knowledge of our company, allows Mr. Label to provide valuable guidance to the board of directors in the performance of its corporate strategy and risk oversight responsibilities. Mr. Label holds a B.A. in Applied Mathematics and Economics from Harvard College.
James T. Richardson has served as a director since 2002. Mr. Richardson is a corporate director, private investor and consultant to high-tech companies. Prior to joining our board, Mr. Richardson served in various executive positions at a number of technology companies, most recently as Senior Vice President and Chief Financial Officer of the website analytics software firm WebTrends Corporation, which merged with NetIQ Corporation in 2001. Mr. Richardson serves on the board of directors of FEI Company, a diversified scientific instruments company, and on the board of directors of Digimarc Corporation, a provider of digital watermarking, content identification and management, and media and object discovery technologies. He served on the board of directors of Epicor Software Corporation from 2008 until May 2010 and previously as a director of Plumtree Software, Inc. and AvantGo, Inc. Mr. Richardson brings public company operational, financial, legal and industry expertise to the board of directors, particularly in the high technology and financial areas. His significant experience in corporate governance and administration of the boards of other public software companies brings
94
Table of Contents
relevant experience and valuable leadership to our board of directors, as we become a newly-public company. Mr. Richardson holds a B.A. in Finance and Accounting from Lewis and Clark College, an M.B.A. from the University of Portland, and a J.D. from Lewis and Clark Law School.
Executive Officers
James B. Johnson (see above).
Daniel Schoenbaum is our Chief Operating Officer of Products. Prior to joining Tripwire in 2006, Mr. Schoenbaum served as Chairman of Mergers and Acquisitions and Vice President of Strategy at Compuware Corporation from 2002 to 2006. Prior to Compuware Corporation, Mr. Schoenbaum served as Vice President of Business Development at SeeRun Corporation, where he led sales and marketing, and as Senior Manager, Worldwide Alliances and Business Development of Mercury Interactive. Mr. Schoenbaum currently sits on the board of directors of the Software Association of Oregon. Mr. Schoenbaum holds a B.A. in Communications from The American University, and completed the University of California Berkeley’s Haas School of Business Entrepreneurship and Innovation Program.
Kelly E. Lang is our Vice President and Chief Financial Officer. Prior to joining Tripwire in 2010, Mr. Lang was Executive Vice President, Finance, and Chief Financial Officer of Merix Corporation, which was acquired by Viasystems Group, Inc., from July 2006 to February 2010. Prior to joining Merix, Mr. Lang was Vice President, Capital Investment and Business Integration at Schnitzer Steel Industries, Inc., a metals recycling and steel manufacturing company, from August 2005 to July 2006, and served as its Vice President, Corporate Controller from September 1999 to August 2005. Prior to his tenure at Schnitzer Steel Industries, Mr. Lang served in a number of senior financial capacities, the last of which was Vice President, Finance—Color Imaging and Printing Division, at Tektronix, Inc., a producer of electronic test, measurement and monitoring products and color printers, from September 1996 to September 1999, and as Treasurer and Director of Investor Relations for Crown Pacific Management L.P., a timber and wood products company, from November 1994 to September 1996, where his responsibilities also included treasury, SEC reporting and planning and budgeting responsibilities. Mr. Lang is a former Certified Public Accountant, having begun his career with PricewaterhouseCoopers (formerly Price Waterhouse LLP). Mr. Lang holds a B.A. in Business Administration, with an emphasis in Accounting, from Seattle University.
Robert F. Dunne has served as our Vice President of Worldwide Sales since 2004. Prior to joining Tripwire, from 2002 to 2004, Mr. Dunne led worldwide sales and worldwide services for Merant PLC, a software development company focused on enterprise IT asset configuration management. Prior to Merant, from 2001 to 2002, Mr. Dunne led worldwide sales for RadiSys Corporation, a developer of embedded systems, and, from 1998 to 2001, Webridge, an Internet software infrastructure company. Mr. Dunne also spent 12 years with Tektronix, Inc. in a variety of key management positions, including Vice President of Sales of its Video and Networking Division and General Manager of the Network Computing Group. Mr. Dunne began his career with IBM and held management positions at Mentor Graphics Corporation and Zycad Corporation.
Board Composition
Our board of directors is currently comprised of six directors, of whom all but Mr. Johnson, our President and Chief Executive Officer, qualify as “independent” under the rules and regulations of The Nasdaq Global Market.
In accordance with the certificate of incorporation and by-laws that will become effective immediately prior to the closing of this offering, our board of directors will be divided into three classes with staggered three-year terms as follows:
| • | Class I directors will be Mr. Label and Mr. Johnson, and their terms will expire at our first annual meeting of stockholders held after this offering; |
95
Table of Contents
| • | Class II directors will be Dr. Lattin and Mr. Baloff, and their terms will expire at our second annual meeting of stockholders held after this offering; and |
| • | Class III directors will be Mr. Richardson and Mr. Finocchio, and their terms will expire at our third annual meeting of stockholders held after this offering. |
At each annual meeting of our stockholders, the successors to directors whose terms then expire will be elected to serve from the time of election and qualification until the third annual meeting following election. Any additional directorships resulting from an increase in the number of directors will be distributed among the three classes so that, as nearly as possible, each class will consist of one third of the total number of directors. The authorized number of directors may be changed by resolution of the board of directors within a current range of one to fifteen. Vacancies on the board of directors can be filled by the board of directors.
Board Committees
Our board of directors has established an audit committee, a compensation committee and a nominating and corporate governance committee.
Audit Committee
Our audit committee consists of Messrs. Richardson, Finocchio and Label, with Mr. Richardson serving as Chair. Our audit committee oversees our corporate accounting and financial reporting process and internal controls over financial reporting. Our audit committee also evaluates the independent registered public accounting firm’s qualifications, independence and performance; engages and provides for the compensation of the independent registered public accounting firm; approves the retention of the independent registered public accounting firm to perform any proposed permissible non-audit services; reviews our consolidated financial statements; reviews our critical accounting policies and estimates and internal controls over financial reporting; and discusses with management and the independent registered public accounting firm the results of the annual audit and the reviews of our quarterly consolidated financial statements. The committee also reviews related party transactions. Our board of directors has determined that each of our audit committee members meets the requirements for independence and financial literacy under the applicable rules and regulations of the SEC and The Nasdaq Global Market. Our board of directors has determined that Mr. Richardson is an “audit committee financial expert” as defined under the applicable rules of the SEC and that he has the requisite financial sophistication under the applicable rules and regulations of The Nasdaq Global Market. Following the closing of this offering, the audit committee will operate under a written charter that satisfies the applicable rules of the SEC and The Nasdaq Global Market. The charter will be available on our website at www.tripwire.com.
Compensation Committee
Our compensation committee consists of Dr. Lattin and Mr. Baloff, with Mr. Baloff serving as Chair. Our compensation committee reviews and recommends policies relating to the compensation and benefits of our officers and employees, including reviewing and approving corporate goals and objectives relevant to compensation of our Chief Executive Officer and other senior officers, evaluating the performance of these officers in light of those goals and objectives and setting compensation of these officers based on such evaluations. The compensation committee also administers the issuance of stock options and other awards under our stock plans. Our board of directors has determined that each member of our compensation committee meets the requirements for independence under the applicable rules and regulations of the SEC, The Nasdaq Global Market and the Internal Revenue Code. Following the closing of this offering, the compensation committee will operate under a written charter that satisfies the applicable rules of The Nasdaq Global Market. The charter will be available on our website at www.tripwire.com.
96
Table of Contents
Nominating and Corporate Governance Committee
Our nominating committee and corporate governance committee consists of Dr. Lattin and Messrs. Baloff, Finocchio and Label, with Dr. Lattin serving as Chair. The nominating and corporate governance committee is responsible for making recommendations regarding candidates to serve on the board of directors and the size and composition of our board. In making such recommendations, the nominating and corporate governance committee considers the skills and experience of the directors or nominees in the context of the needs of our board of directors, as well as the directors’ or nominees’ skills and experience in areas that are relevant to our business and activities. In addition, the nominating and corporate governance committee is responsible for overseeing our corporate governance guidelines and reporting and making recommendations concerning governance matters. Our board of directors has determined that each member of our nominating and corporate governance committee meets the requirements for independence under the applicable rules and regulations of The Nasdaq Global Market. Following the closing of this offering, the nominating and corporate governance committee will operate under a written charter that satisfies the applicable rules of The Nasdaq Global Market. The charter will be available on our website at www.tripwire.com.
Director Compensation
Our non-employee directors did not earn or receive any cash or equity compensation for service on our board of directors in 2009. From time-to-time, we have granted stock options to our non-employee directors as compensation for their services, but we have not had a formal policy in place with respect to such awards. We do reimburse our directors for their expenses associated with attending meetings of our board of directors.
As of December 31, 2009, the total number of shares subject to outstanding stock options held by each non-employee director was as follows: Mr. Baloff, 0; Mr. Label, 0; Dr. Lattin, 584,000; and Mr. Richardson, 476,000.
We intend to adopt a formal policy to be effective following the closing of this offering pursuant to which our non-employee directors will be entitled to receive cash compensation and equity compensation awards as compensation for their service on our board of directors.
Compensation Committee Interlocks and Insider Participation
None of the members of our compensation committee is, or has at any time during the past year been, an officer or employee of ours. None of our executive officers currently serves, or in the past year has served, as a member of the board of directors or compensation committee of any entity that has one or more executive officers serving on our board or compensation committee.
Executive Officers
Our executive officers are appointed by, and serve at the discretion of, our board of directors. There are no familial relationships among our directors and officers.
Code of Business Conduct and Ethics
Prior to the closing of this offering, we will adopt a code of business conduct and ethics that applies to all of our employees, officers, and directors, including those officers responsible for financial reporting. Following the closing of this offering, the code of business conduct and ethics will be available on our website at www.tripwire.com. We intend to disclose on our website any amendments to the code, or any waivers of its requirements.
97
Table of Contents
Limitations on Director and Officer Liability and Indemnification
The following description references our certificate of incorporation and by-laws that will be in effect immediately prior to the closing of this offering. Our certificate of incorporation limits the liability of directors to the fullest extent permitted by Delaware law. Delaware law provides that directors of a corporation will not be personally liable for monetary damages for breach of their fiduciary duties as directors, except liability for:
| • | any breach of their duty of loyalty to the corporation or its stockholders; |
| • | acts or omissions not in good faith or which involve intentional misconduct or a knowing violation of law; |
| • | unlawful payments of dividends or unlawful stock repurchases or redemptions; or |
| • | any transaction from which the director derives an improper personal benefit. |
Our certificate of incorporation and by-laws provide that we will indemnify our directors and officers to the fullest extent permitted by law. Our by-laws also permit us to secure insurance on behalf of any officer or director for any liability arising out of his or her actions in connection with their services to us, regardless of whether our by-laws permit such indemnification.
We have also entered into agreements to indemnify our directors to the maximum extent allowed under Delaware law. These agreements, among other things, provide that we will indemnify our directors for certain expenses (including attorneys’ fees), judgments, fines and settlement amounts reasonably incurred by such person in any action or proceeding, including any action by or in our right, on account of any services undertaken by such person on our behalf or that person’s status as a director of Tripwire.
There is no pending litigation or proceeding involving any of our directors or officers as to which indemnification is required or requested, and we are not aware of any threatened litigation or proceeding that would reasonably be expected to result in a claim for indemnification.
98
Table of Contents
Compensation Discussion and Analysis
Objectives of Our Executive Compensation Programs
Pursuant to authority delegated by our board of directors, the compensation committee of our board of directors works with management to develop our executive compensation philosophy and the objectives of our compensation programs for our executive officers named in the tables below. We design our executive compensation programs primarily to:
| • | Motivate our executives to achieve our business and financial goals; |
| • | Reward performance by aligning executive incentives with our operational and strategic plans; |
| • | Attract and retain talented and experienced executives; and |
| • | Align the interests of our executives and our stockholders. |
To achieve these objectives, our executive compensation programs tie a portion of our executive compensation to the achievement of specific performance goals and offer total cash compensation opportunities that are competitive with those offered by companies with which we compete for executive talent.
How We Set Executive Compensation
Prior to this offering, the committee annually reviewed our Chief Executive Officer’s performance, and made recommendations to the board of directors with respect to the compensation for our Chief Executive Officer. The committee also annually reviewed with the Chief Executive Officer the performance of the other named executive officers, and made recommendations to the board of directors regarding compensation for the other named executive officers based on recommendations from our Chief Executive Officer. In 2009 our Chief Executive Officer and our former Chief Financial Officer attended committee meetings and participated in all discussions regarding salaries and incentive compensation for all of our executive officers, except during discussions regarding their own salaries and incentive compensation. While our Chief Executive Officer and our former Chief Financial Officer made suggestions or recommendations during these discussions, all decisions regarding the compensation of our executive officers were made solely by the compensation committee.
In reviewing our named executive officer compensation for 2008 and 2010, our Chief Executive Officer engaged a compensation consultant, William J. Erdle Compensation Consulting, LLC, who provided him with comparative information regarding total cash compensation from the published Radford Executive Compensation Survey for companies with annual revenue between $50 million and $199.9 million. Our Chief Executive Officer presented this information to the committee along with his recommendations regarding compensation for the other named executive officers. However, the committee determined our named executive officer compensation for 2009 and 2010 primarily based on the business judgment and experience of the committee members, who for 2010 used comparative information as a reference point, but not as a basis for their decisions.
In connection with preparing for this offering, our senior human resources officer engaged Radford to assist us with developing a strategy for our long-term equity compensation going forward. Our senior human resources officer met with Radford and presented this information to the committee along with management’s recommendations regarding long-term equity compensation for our named executive officers. However, the committee determined our named executive officer long-term equity incentives for 2010 primarily based on the business judgment and experience of the committee members, who used the comparative information provided by Radford as a reference point, but not as a basis for their decisions.
99
Table of Contents
Elements of Executive Compensation
For 2009 our executive compensation programs included the following types of compensation for our named executive officers:
| • | Base salary and benefits; |
| • | Annual cash incentive opportunity; and |
| • | Long-term equity incentives. |
The allocation of each element as a percentage of total compensation varies based on the named executive officer’s position and level of responsibility. Each element of compensation, and the committee’s recommendations regarding each element, affect the committee’s recommendations regarding other elements.
Base Salary and Benefits
We intend base salary to recognize an individual named executive officer’s contributions to our business and to attract and retain talented executives. We generally target base salaries for the named executive officers initially by evaluating the responsibilities of the position and the experience of the individual and considering the 25th percentile and median base salary for comparable positions. We generally consider and evaluate annual salary adjustments for the named executive officers by evaluating our performance and the performance of each named executive officer, and also take into account any new responsibilities and consider a range between the 25th percentile and median base salary for comparable positions. For 2009, the committee decided not to increase base salaries for the named executive officers in light of the state of the economy and based on the business judgment and experience of the committee members.
Our named executive officers generally receive health and welfare benefits under the same programs and subject to the same terms and conditions as our other salaried employees. This includes a range of health benefits, as well as coverage for life insurance. Our named executive officers also participate in our 401(k) plan. Our Chief Executive Officer also receives full reimbursement of his parking expenses.
Annual Cash Incentive Program
Our named executive officers participate in a cash incentive compensation program that provides an opportunity for named executive officers, including the Chief Executive Officer, to earn cash incentive payments based on the achievement of annual performance goals tied to company performance and based on the company’s achievement of our business plan and objectives approved by the board of directors.
Cash incentive awards under the cash incentive program are calculated as a percentage of base salary. We generally target the amount of each named executive officer’s target cash incentive award between the 25th percentile and median for comparable executive officers. When added to the named executive officer’s base salary, we generally intend to produce total annual cash compensation for target performance for each named executive officer that is between the median and 75th percentile for compensation paid to comparable executive officers. For 2009, we maintained the amount of each named executive officer’s target cash incentive award at 2008 levels in light of the state of the economy and based on the business judgment and experience of the committee members. If we achieve at least the threshold performance goal established for a given year, the amount paid with respect to a cash incentive award will generally be based on percentage achievement of the performance objectives approved by the committee, up to a maximum cap established by the committee.
In establishing 2009 performance goals for our annual cash incentive program, for our named executive officers other than our Vice President of Worldwide Sales, the total cash incentive award opportunity was comprised of three components: (i) 40% based on a company performance goal of achieving revenue of $69.6 million; (ii) 40% based on a company performance goal of achieving pre-tax income of $3.8 million; and (iii) the remaining 20% based on additional 2009 strategic goals established by the committee.
100
Table of Contents
The named executive officers subject to this cash incentive program would receive no payments with respect to the company performance components (revenue and pre-tax income) for performance at or below the threshold level established by the committee. For the revenue performance goal, the named executive officers would receive 100% of the target award amount for performance at 100% of the target performance goal level, 200% of the target award amount for performance at 130% of the target performance goal level and up to a maximum of 300% of the target amount for performance that met or exceeded 160% of the target performance goal level. For the pre-tax profit performance goal, the named executive officers would receive 50% of the target award amount for performance at 90% of the target performance goal and 100% of the target award amount for performance at 100% of the target performance goal. For performance between each of these specified levels, the named executive officers would receive a ratable portion of the payment based on how the performance compared to the specified levels. For pre-tax net income in excess of the target performance goal, 15% of the excess net income would be allocated to a pool for this portion of these awards, up to a maximum of 300% of the target amount.
The 2009 strategic goals established by the committee consisted of: (i) the achievement of specified goals with respect to the successful launch of additional functionality and services related to our Tripwire Enterprise product, (ii) the achievement of specified efficiency improvements in our research and development department, (iii) the successful launch of a specified new product and (iv) the identification or completion of a specified number of potential technology acquisitions. The committee expected the strategic goals that it established would be difficult to achieve because achievement of these goals depended in substantial part on factors outside the company’s or the named executive officers’ control, but believed that the named executive officers had a reasonable likelihood of achieving the majority of these goals. The named executive officers subject to this cash incentive program would receive no payments with respect to the strategic goal component for performance at or below the threshold levels established by the committee, and payments of up to 125% of the target amounts for the maximum achievement of the strategic goal components. For performance between each of these specified levels, the named executive officers would receive a ratable portion of the payment based on how the performance compared to the specified levels.
The annual cash incentive award for our Vice President of Worldwide Sales, Robert F. Dunne, provided an opportunity for him to receive payments for achieving revenue greater than the company revenue performance goal established for the other named executive officers. Under his annual cash incentive award, Mr. Dunne had the opportunity to earn 1.5 times his target annual cash incentive award if the company achieved revenue between 120% and 130% of the company revenue performance goal and 3.0 times his target award if the company achieved greater than 130% of the company revenue performance goal.
The 2009 Grants of Plan-Based Awards table below shows the threshold, target and maximum amounts that each named executive officer could have been paid with respect to these awards. The named executive officers had to be employed at year end to be eligible to receive a payment under our annual cash incentive program. Amounts in excess of 100% of the target award amounts would not be paid if the expense would result in negative net income.
For 2009, we exceeded our company performance goals, achieving 121% of our revenue goal and 300% of our net income goal. This level of achievement resulted in payments for the portion of the annual cash incentive awards based on these goals above the target levels. The additional 2009 strategic performance goals were not fully achieved, resulting in payments of approximately 77% of the target level for this portion of the annual cash incentive awards. The Non-equity Incentive Plan Compensation column of the 2009 Summary Compensation Table below shows the amounts paid to each of the named executive officers with respect to their respective annual cash incentive awards.
Long-Term Equity Incentives
All of our employees, including our named executive officers, are eligible to participate in our equity incentive programs. We intend our equity incentive awards to reward long-term performance, align the interests of our named executive officers with those of our stockholders, and provide an incentive for retaining our named
101
Table of Contents
executive officers. The committee determines the size of actual grants to our named executive officers based on each individual’s job performance and contribution to our strategic success.
As part of our commitment to tying executive compensation to company performance, the committee granted stock options to our named executive officers in 2009. These options vest and become exercisable based on the achievement of the same company revenue performance goals for 2009 established for our annual cash incentive programs, to provide an additional incentive to achieve these goals. The stock options also include service-based vesting to promote retention. If the 2009 company revenue performance goal is achieved, the stock options would vest with respect to 1/3 of the shares effective as of the end of 2009 and the remaining 2/3 would vest ratably over the next two years. These stock options can be earned at up to 200% of the target number of shares if 2009 revenue is at least 130% of the 2009 company revenue performance goal. For 2009, we achieved revenue of 121% of the company revenue performance goal, and these stock options were earned with respect to approximately that percentage of the target number of shares.
Severance Agreements
In addition to the other elements of compensation discussed above, we have entered into a severance agreement with each of our Vice President of Worldwide Sales, Mr. Dunne, and our former Chief Financial Officer, Mr. McCarthy, to assist in the retention of the services of these executives, pursuant to which each individual will receive certain severance benefits if his employment with us terminates under certain circumstances. In 2003 the board determined that it was in the best interest of the company to enter into severance and change in control agreement with Mr. McCarthy. We agreed to enter into the severance agreement with Mr. Dunne as an incentive for him to enter into an employment relationship with us.
2009 Summary Compensation Table
The following table provides information regarding the compensation earned by our principal executive officer, principal financial officer and our two other named executive officers in 2009. In March 2010, Kelly Lang joined the company as our Chief Financial Officer and principal financial officer.
| Name and Principal Position |
Year | Salary | Option Awards (1) |
Non-equity Incentive Plan Compensation |
All Other Compensation |
Total | ||||||||||||
| James B. Johnson President and Chief Executive Officer |
2009 | $ | 260,000 | $ | 14,218 | $ | 367,799 | $ | 22,061 | (2) | $ | 664,078 | ||||||
| Daniel Schoenbaum Chief Operating Officer, Products |
2009 | $ | 258,300 | $ | 5,465 | $ | 328,260 | $ | 9,816 | (3) | $ | 601,841 | ||||||
| Robert F. Dunne Vice President of Worldwide Sales |
2009 | $ | 248,700 | $ | 4,526 | $ | 215,755 | $ | 10,545 | (3) | $ | 479,526 | ||||||
| Robert C. McCarthy (4) Chief Financial Officer and Vice President of Finance and Treasurer |
2009 | $ | 183,700 | $ | 3,923 | $ | 156,682 | $ | 7,273 | (3) | $ | 351,578 | ||||||
| (1) | The amounts set forth in the “Option Awards” columns reflect the aggregate grant date fair value computed in accordance with the requirements of FASB ASC Topic 718—Stock Compensation. These amounts may not correspond to the actual value eventually realized by each named executive officer, which value depends on the extent to which performance conditions are ultimately met and the market value of our common stock in future periods. The grant date fair value for the performance-based stock option grants reported in the “Option Awards” column above were calculated based on target performance. The grant date fair values for these stock option grants based on maximum performance were as follows: Mr. Johnson, $28,437, Mr. Schoenbaum, $10,930, Mr. Dunne, $9,053 and Mr. McCarthy, $7,846. Assumptions used in the calculation of these amounts are described in the Notes to Consolidated Financial Statements for the year ended December 31, 2009, included elsewhere in this prospectus. |
| (2) | Consists of a company match of 401(k) contribution of $10,911, life insurance premiums, parking expense reimbursement and certain personal travel and entertainment expenses of $8,534 paid by us. |
| (3) | Consists of a company match of 401(k) contribution and life insurance premiums paid by us. |
| (4) | Mr. McCarthy served as our Chief Financial Officer and Vice President of Finance until March 2010. He currently serves as our Vice President of Finance and Treasurer. |
102
Table of Contents
2009 Grants of Plan-Based Awards Table
| Name |
Grant Date |
Estimated Possible
Payouts Under Non-equity Incentive Plan Awards |
Estimated
Possible Payouts Under Equity Incentive Plan Awards(#) (1) |
Exercise or Base Price of Option Awards |
Grant Date Fair Value of Stock and Option Awards (2) | ||||||||||||||||||
| Threshold | Target | Maximum | Threshold | Target | Maximum | ||||||||||||||||||
| James B. Johnson (3) |
7/23/2009 | $ | 0 | $ | 200,000 | $ | 530,000 | 0 | 118,740 | 237,480 | $ | 0.65 | $ | 17,194 | |||||||||
| Daniel Schoenbaum |
4/15/2009 | $ | 0 | $ | 178,500 | $ | 473,025 | 0 | 45,640 | 91,280 | $ | 0.65 | $ | 6,609 | |||||||||
| Robert F. Dunne (4) |
4/15/2009 | $ | 0 | $ | 151,600 | — | 0 | 37,800 | 75,600 | $ | 0.65 | $ | 5,474 | ||||||||||
| Robert C. McCarthy |
4/15/2009 | $ | 0 | $ | 85,200 | $ | 225,780 | 0 | 32,760 | 65,520 | $ | 0.65 | $ | 4,744 | |||||||||
| (1) | These stock options were issued under the 2000 Stock Option/Stock Issuance Plan. A portion of each of these stock options was not earned due to failure to achieve the applicable performance goals and was forfeited effective December 31, 2009 as follows: Mr. Johnson, 118,740 shares, Mr. Schoenbaum, 45,640 shares, Mr. Dunne, 37,800 shares and Mr. McCarthy, 32,760 shares. The remaining portion of these stock options was earned, vested with respect to one-third of the total number of shares effective December 31, 2009, and will vest with respect to the remaining shares monthly over the following two years. |
| (2) | The grant date fair value is computed in accordance with the requirements of FASB ASC Topic 718—Stock Compensation. These amounts may not correspond to the actual value eventually realized by each named executive officer, which value depends on the extent to which performance conditions are ultimately met and the market value of our common stock in future periods. Assumptions used in the calculation of these amounts are described in the Notes to Consolidated Financial Statements for the year ended December 31, 2009, included elsewhere in this prospectus. |
| (3) | Mr. Johnson disclaims beneficial ownership with respect to half of the shares subject to these stock options, the economic benefits of which belong to his former spouse. |
| (4) | Mr. Dunne’s 2009 non-equity incentive plan award structure did not include a maximum payout amount. |
Narrative Disclosure to Summary Compensation Table and Grants of Plan-Based Awards Table
Salary
For 2009, base salaries paid to our named executive officers accounted for the following percentages of each named executive officer’s total compensation, as reported in the “total” column of the 2009 Summary Compensation Table: Mr. Johnson (39%), Mr. Schoenbaum (43%), Mr. Dunne (52%) and Mr. McCarthy (52%).
Option Awards
The amounts set forth in the “Estimated possible payouts under equity incentive plan awards” column of the 2009 Grants of Plan-Based Awards Table represent the threshold, target, and maximum number of stock options issuable under the 2000 Stock Option/Stock Issuance Plan for achieving the corporate performance objectives set forth under Tripwire’s 2009 annual cash incentive program. The actual number of stock options earned by each named executive officer is set forth in the 2009 Outstanding Equity Awards at Fiscal Year-End Table. These options vested with respect to one-third of the total number of shares effective December 31, 2009, and vest with respect to the remaining shares monthly over the following two years.
Non-Equity Incentive Plan Compensation
The amounts set forth in the “Estimated possible payouts under non-equity incentive plan awards” column of the 2009 Grants of Plan-Based Awards Table represent the threshold, target, and maximum cash amounts payable for achieving the corporate and individual performance objectives under Tripwire’s 2009 annual cash incentive program. The compensation committee determined that the corporate performance objectives under this program were met, achieving 121% of the revenue performance goal and 300% of the pre-tax income performance goal. The compensation committee determined that only 77% of the strategic goals had been achieved. Payouts were made under these awards and the actual amount received by each named executive officer is set forth in the “Non-equity incentive plan compensation” column of the 2009 Summary Compensation Table. A discussion of the performance applicable to these awards is set forth under “Compensation Discussion and Analysis—Elements of Executive Compensation—Annual Cash Incentive Program” above. For 2009, the aggregate cash incentive awards paid under
103
Table of Contents
our 2009 annual cash incentive program to our named executive officers accounted for the following percentages of each named executive officer’s total compensation reported in the “Total” column of the 2009 Summary Compensation Table: Mr. Johnson (55%), Mr. Schoenbaum (55%), Mr. Dunne (45%) and Mr. McCarthy (45%).
All Other Compensation
All other compensation of our named executive officers is set forth in the 2009 Summary Compensation Table and described in greater detail in notes 3 and 4 to that table. These benefits are discussed under the caption “Compensation Discussion and Analysis—Elements of Executive Compensation—Base Salary and Benefits” above.
104
Table of Contents
2009 Outstanding Equity Awards at Fiscal Year-End Table
The following table presents certain information regarding outstanding equity awards held by each of our named executive officers at December 31, 2009.
| Option Awards | ||||||||||||||
| Name |
Grant Date | Number of Securities Underlying Unexercised Options (#) Exercisable (1) |
Number of Securities Underlying Unexercised Options (#) Unexercisable (2) |
Equity Incentive Plan Awards: Number of Securities Underlying Unexercised Unearned Options |
Option Exercise Price |
Option Expiration Date | ||||||||
| James B. Johnson |
7/23/2009 | (3) | 47,872 | 95,715 | $ | 0.65 | 7/23/2019 | |||||||
| 4/23/2008 | (3) | 144,562 | 72,270 | $ | 0.60 | 4/23/2018 | ||||||||
| 7/18/2007 | (3) | 114,504 | — | $ | 0.60 | 7/18/2017 | ||||||||
| 8/22/2006 | (3) | 1,094,000 | — | $ | 0.60 | 8/22/2016 | ||||||||
| 4/25/2006 | (3) (4) | 600,000 | — | $ | 0.60 | 4/24/2016 | ||||||||
| 4/19/2005 | (3) | 181,818 | — | $ | 0.55 | 4/18/2015 | ||||||||
| 4/19/2005 | (3) | 408,182 | — | $ | 0.55 | 4/18/2015 | ||||||||
| 5/14/2004 | (3) | 240,000 | — | $ | 0.50 | 5/14/2014 | ||||||||
| 2,830,938 | 167,985 | |||||||||||||
| Daniel Schoenbaum |
4/15/2009 | 18,401 | 36,789 | $ | 0.65 | 4/15/2019 | ||||||||
| 10/28/2008 | 27,083 | 72,917 | $ | 0.65 | 10/28/2018 | |||||||||
| 4/23/2008 | 47,539 | 23,765 | $ | 0.60 | 4/23/2018 | |||||||||
| 7/18/2007 | 51,000 | — | $ | 0.60 | 7/18/2017 | |||||||||
| 8/22/2006 | (5) | 726,042 | 123,958 | $ | 0.60 | 8/22/2016 | ||||||||
| 870,065 | 257,429 | |||||||||||||
| Robert F. Dunne |
4/15/2009 | 15,240 | 30,470 | $ | 0.65 | 4/15/2019 | ||||||||
| 4/23/2008 | 45,243 | 22,617 | $ | 0.60 | 4/23/2018 | |||||||||
| 7/18/2007 | 22,626 | — | $ | 0.60 | 7/18/2017 | |||||||||
| 4/25/2006 | 60,000 | — | $ | 0.60 | 4/25/2016 | |||||||||
| 6/29/2005 | 150,000 | — | $ | 0.60 | 6/29/2015 | |||||||||
| 9/15/2004 | 600,000 | — | $ | 0.50 | 9/15/2014 | |||||||||
| 893,109 | 53,087 | |||||||||||||
| Robert C. McCarthy |
4/15/2009 | 13,208 | 26,407 | $ | 0.65 | 4/15/2019 | ||||||||
| 4/23/2008 | 42,816 | 21,404 | $ | 0.60 | 4/23/2018 | |||||||||
| 7/18/2007 | 29,414 | — | $ | 0.60 | 7/18/2017 | |||||||||
| 4/25/2006 | 36,000 | — | $ | 0.60 | 4/25/2016 | |||||||||
| 4/25/2006 | (6) | 10,000 | — | $ | 0.45 | 3/17/2012 | ||||||||
| 4/25/2006 | (7) | 50,000 | — | $ | 0.45 | 7/23/2013 | ||||||||
| 6/29/2005 | 50,000 | — | $ | 0.60 | 6/29/2015 | |||||||||
| 9/15/2004 | 300,000 | — | $ | 0.50 | 9/14/2014 | |||||||||
| 7/29/2004 | 130,000 | — | $ | 0.50 | 7/29/2014 | |||||||||
| 11/8/2000 | 20,000 | — | $ | 0.22 | 11/7/2010 | |||||||||
| 681,438 | 47,811 | |||||||||||||
| (1) | Stock option grants to purchase shares of our common stock were made under the 2000 Stock Option/Stock Issuance Plan. The exercise price of these stock options is greater than or equal to the fair market value of our common stock on the date of grant. All stock options granted under the 2000 Stock Option/Stock Issuance Plan are subject to service-based vesting requirements. |
| (2) | Option Grant Date | Vesting Schedule, unless otherwise indicated by notes below | ||
| July 23, 2009 | 33% vested on December 31, 2009, and the remaining 67% vest monthly over the following 24 months | |||
| April 15, 2009 | 33% vested on December 31, 2009, and the remaining 67% vest monthly over the following 24 months | |||
| October 28, 2008 | 25% vested on October 28, 2009, and the remaining 75% vested monthly over the following 36 months | |||
| April 23, 2008 | 33% vested on December 31, 2008, and the remaining 67% vest monthly over the following 24 months | |||
| July 18, 2007 | Vested in full on December 31, 2007 | |||
| August 22, 2006 | 14,000 vested in 7 equal installments, and the remaining vested ratably over the following 24 months | |||
| April 25, 2006 | Vested in full on the date of grant | |||
| June 29, 2005 | Vested in full on June 29, 2009 | |||
| April 19, 2005 | Vested monthly over one year | |||
| September 14, 2004 | 25% vested on September 15, 2005, and the remaining 75% vested monthly over the following 36 months | |||
| July 29, 2004 | 25% vested on July 29, 2005, and the remaining 75% vested monthly over the following 36 months | |||
| May 14, 2004 | Vested monthly over one year | |||
| November 8, 2000 | 25% vested on November 8, 2001, and the remaining 75% vested monthly over the following 36 months |
| (3) | Mr. Johnson disclaims beneficial ownership with respect to half of the shares subject to these stock options, the economic benefits of which belong to his former spouse. |
| (4) | Vested monthly over one year. |
| (5) | 25% vested on July 28, 2007, and the remaining 75% vest monthly over the following 36 months. |
| (6) | 25% vested per year, for four years, beginning January 1, 2002. |
| (7) | 25% vested on July 1, 2005, an additional 50% vested on July 1, 2006 and the remaining 25% vested on July 1, 2007. |
105
Table of Contents
2009 Option Exercises Table
The following table presents, for each of the named executive officers, the aggregate value realized upon exercises of stock options during 2009. There were no shares of restricted stock outstanding during 2009. For purposes of the table, the value realized is based upon the fair market value of our common stock on the exercise date, as determined by our board of directors.
| Option Awards | Stock Awards | ||||||||
| Name |
Number of Shares Acquired on Exercise |
Value Realized on Exercise |
Number of Shares Acquired on Vesting |
Value Realized on Vesting | |||||
| James B. Johnson |
— | — | — | — | |||||
| Daniel Schoenbaum |
— | — | — | — | |||||
| Robert F. Dunne |
— | — | — | — | |||||
| Robert C. McCarthy (1) |
90,000 | $ | 44,739 | — | — | ||||
| (1) | The amount reported reflects the exercise of options to purchase 90,000 shares of our common stock on October 14, 2009, when the fair market value of our common stock was determined to be $0.60 per share. |
Pension Benefits
We did not sponsor any defined benefit pension or other actuarial plan for the named executive officers during 2009.
Nonqualified Deferred Compensation
We did not maintain any nonqualified defined contribution or other deferred compensation plans or arrangements for the named executive officers in 2009.
Potential Payments Upon Termination or Change-in-Control
Dunne Letter Agreement
In July 2004, we entered into an agreement with Mr. Dunne which provides that if Mr. Dunne is terminated by us without cause, he will be entitled to receive the following:
| • | continuation of total monthly compensation for a period of six months in an amount equal to one-twelfth the sum of (a) his annual base salary in effect immediately prior to the date of termination, and (b) any quarterly incentive award paid during the 12-month period immediately preceding the date of termination; |
| • | continuation of payment of health insurance premiums for a period of six months following termination; |
| • | acceleration of vesting of unvested shares and options to purchase shares of our common stock that would have vested had Mr. Dunne remained employed for six months following the date of termination; and |
| • | extension of the post-termination exercise period for vested stock options until the earlier of (a) the 6-month anniversary of the date of termination or (b) the expiration date. |
Mr. Dunne’s right to receive the foregoing benefits is conditioned upon his entering into a general release of claims. For purposes of Mr. Dunne’s agreement, “cause” is defined to include: (i) any act of fraud, dishonesty, embezzlement, misrepresentation or theft of company property by Mr. Dunne; (ii) conviction or plea of no contest to a felony or any crime involving moral turpitude; (iii) an unauthorized disclosure of company confidential information or breach of obligations under any confidentiality, invention assignment or proprietary information agreement entered into with the company; or (iv) a failure to meet performance expectations within 30 days following receipt of notice of such deficiency.
106
Table of Contents
McCarthy Letter Agreement
In January 2003, we entered into an agreement with Mr. McCarthy which provides that if Mr. McCarthy is involuntarily terminated within 12 months following a corporate transaction (as defined in the agreement), he will be entitled to receive the following:
| • | a lump sum cash payment in an amount equal to six times the sum of (a) his average monthly base salary during the 12-month period immediately preceding the month of termination, plus (b) one-twelfth of the amount of any incentive award received during the 12-month period immediately preceding the month of termination; |
| • | for Mr. McCarthy and his dependents, continued medical and dental benefits for a period of six months following termination; and |
| • | extension of the post-termination exercise period for specified stock options until the earlier of (a) the 12-month anniversary of the date of the involuntary termination or (b) the expiration date. |
In addition, if any benefit, including the acceleration of unvested stock options described below, is deemed to constitute an excess parachute payment under Section 280(G) of the Internal Revenue Code, Mr. McCarthy will be entitled to receive a tax gross-up with respect to the parachute tax liability.
Stock Options under the 2000 Stock Option/Stock Issuance Plan
In connection with the grant of stock options made to the named executive officers under the 2000 Stock Option/Stock Issuance Plan, the stock option agreement provides that, in the event of a corporate transaction (as defined in the stock option agreement) in which all of the named executive officer’s outstanding and unexercisable stock options are not either assumed by the successor corporation or replaced by a successor cash incentive program bestowing comparable benefits, all of the named executive officer’s outstanding, unexercisable stock options shall, immediately prior to the completion of the corporate transaction, become fully exercisable. Stock options not assumed by the successor corporation shall terminate in connection with a corporate transaction. If the stock options are assumed in connection with a corporate transaction, and the named executive officer’s employment is involuntarily terminated within 12 months following the corporate transaction, all unvested stock options shall become immediately exercisable and will remain exercisable until the earlier of (a) the one-year anniversary of the date of the involuntary termination or (b) the expiration date.
Involuntary Termination
For purposes of Mr. McCarthy’s agreement described above and the stock options issued under the 2000 Stock Option/Stock Issuance Plan, “involuntary termination” is defined to include:
| • | termination of employment for reasons other than misconduct (as defined below), or |
| • | termination of employment in connection with any of the following changes effected without the named executive officer’s consent: (a) a change in position which materially reduces the named executive officer’s duties and responsibilities or reporting structure; (b) a reduction in the named executive officer’s base salary by more than 15%; or (c) a relocation of the named executive officer’s place of employment by more than 50 miles. |
Under the agreement and the 2000 Stock Option/Stock Issuance Plan, “misconduct” includes (i) the commission of any act of fraud, embezzlement or dishonesty by the officer, (ii) any unauthorized use or disclosure of confidential information or trade secrets, or (iii) any other intentional misconduct adversely affecting the company in a material manner.
107
Table of Contents
The following table shows the estimated change in control benefits that would have been payable to Mr. Dunne (i) if we had terminated him without cause, (ii) if we completed a corporate transaction in which his stock options were not assumed or replaced, or (iii) if he were involuntarily terminated in connection with a corporate transaction, as of December 31, 2009:
| Executive Payment and Benefits (1) |
Termination Without Cause |
Change in Control
in Which Options are Not Assumed or Replaced |
Involuntary Termination of Employment in Connection with Change in Control | |||||||
| Severance payments |
$ | 232,228 | ||||||||
| Accelerated vesting of stock options (2) |
$ | $ | ||||||||
| COBRA premiums |
5,419 | |||||||||
| Total |
$ | $ | $ | |||||||
| (1) | For purposes of this analysis, Mr. Dunne’s compensation is assumed to be as follows: base salary in effect immediately prior to the date of termination, equal to $248,700, a quarterly incentive award in the amount of $215,755 received during the 12-month period preceding the date of termination, and outstanding unvested stock options for 18,926 shares of our common stock. |
| (2) | Assumes the date of termination of employment of Mr. Dunne occurred on December 31, 2009 and is the product of (a) the number of accelerated stock options and (b) the difference between the weighted average exercise price for the accelerated stock options and the fair market value of our common stock determined as the midpoint of the price range set forth on the cover page of this prospectus. |
The following table shows the estimated change in control benefits that would have been payable to Mr. McCarthy if we completed a corporate transaction in which his stock options were not assumed or replaced, or if he were involuntarily terminated in connection with a corporate transaction, as of December 31, 2009:
| Executive Payment and Benefits (1) |
Involuntary Termination of Employment in Connection with Change in Control |
Change in Control
in Which Options are Not Assumed or Replaced |
||||||
| Severance payments |
$ | 170,191 | $ | |||||
| Accelerated vesting of stock options (2) |
||||||||
| COBRA premiums |
5,419 | |||||||
| Total |
$ | $ | ||||||
| (1) | For purposes of this analysis, Mr. McCarthy’s compensation is assumed to be as follows: base salary for the 12-month period preceding the month in which the termination occurred, equal to $183,700, a cash incentive award in the amount of $156,682 received during the 12-month period preceding the month in which the termination occurred, and outstanding unvested stock options for 47,811 shares of our common stock. Payments and benefits exclude any tax gross-up under Section 280(G) of the Internal Revenue Code. |
| (2) | Assumes the date of termination of employment of Mr. McCarthy occurred on December 31, 2009 and is the product of (a) the number of accelerated stock options and (b) the difference between the weighted average exercise price for the accelerated stock options and the fair market value of our common stock (determined as the midpoint of the price range set forth on the cover page of this prospectus). |
The following table shows the estimated payment that each of the named executive officers, other than Messrs. Dunne and McCarthy, would have received if we completed a corporate transaction in which such named executive officers’ stock options were not assumed or replaced, or if the named executive officers were involuntarily terminated within 12 months following a corporate transaction, each as of December 31, 2009:
| Stock Option Acceleration (1) | |||
| James B. Johnson (2) |
$ | ||
| Daniel Schoenbaum (3) |
$ | ||
| (1) | Assumes the date of termination of employment, or completion of the corporate transaction, as applicable, occurred on December 31, 2009, and is the product of (a) the number of accelerated stock options and (b) the difference between the weighted average exercise price for the accelerated stock options and the fair market value of our common stock (determined as the midpoint of the price range set forth on the cover page of this prospectus). |
| (2) | Assumes outstanding unvested stock options for 167,985 shares of our common stock. Mr. Johnson disclaims beneficial ownership with respect to half of the shares subject to these options, the economic benefits of which belong to his former spouse. |
| (3) | Assumes outstanding unvested stock options for 257,429 shares of our common stock. |
108
Table of Contents
DESCRIPTION OF THE 2010 INCENTIVE PLAN
Our 2010 Incentive Plan, or 2010 Plan, was adopted by our board of directors on May 7, 2010, and was subsequently approved by our stockholders. The 2010 Plan will become effective upon the closing of this offering. No further grants will be made under our 2000 Stock Option/Stock Issuance Plan after this offering. However, the options outstanding under our 2000 Stock Option/Stock Issuance Plan or our 1998 Stock Option Plan will continue to be governed by their respective existing terms.
Purpose
The purpose of the 2010 Plan is to attract, retain and motivate our employees, officers and directors by providing them with the opportunity to acquire an equity interest in us and to align their interests and efforts to the long-term interests of our stockholders. The 2010 Plan would also allow us to provide the same opportunity to consultants, agents, advisors and independent contractors.
Administration
The compensation committee of our board of directors will administer the 2010 Plan. The board or the committee may delegate this authority in accordance with the terms of the 2010 Plan.
Eligibility
Awards may be granted under the 2010 Plan to employees, officers, directors, consultants, agents, advisors and independent contractors of us and our subsidiaries and affiliates.
Number of Shares
The board has authorized 4,340,250 shares of common stock for issuance under the 2010 Plan. In addition, any shares available for issuance under our 2000 Stock Option/Stock Issuance Plan, and any shares subject to outstanding awards under our 2000 Stock Option/Stock Issuance Plan or our 1998 Stock Option Plan as of the effective date of the 2010 Plan that cease to be subject to these awards (other than from exercise or settlement of the awards in shares), will automatically become available for issuance under the 2010 Plan, up to an aggregate maximum of 17,125,102 shares. The board may increase the authorized shares each January starting in 2011 pursuant to an evergreen provision by adding an amount equal to the least of (i) 4,875,000 shares, (ii) 5% of our outstanding common stock as of the end of our immediately preceding fiscal year, and (iii) a lesser amount determined by the board.
The following shares will be available again for issuance under the 2010 Plan:
| • | shares subject to awards that lapse, expire, terminate or are canceled prior to issuance of the underlying shares; |
| • | shares subject to awards that are subsequently forfeited to or otherwise reacquired by us; |
| • | shares related to an award that is settled in cash or in another manner where some or all of the shares covered by the award are not issued; and |
| • | shares subject to an award that are tendered or withheld in payment of purchase price or tax withholding obligations. |
Awards granted in assumption of or substitution for previously granted awards in acquisition transactions will not reduce the number of shares authorized for issuance under the 2010 Plan.
If any change in our stock occurs by reason of any stock dividend, stock split, spin-off, recapitalization, merger, consolidation, combination or exchange of shares, distribution to stockholders other than a normal cash dividend or other change in our corporate or capital structure, the committee will make proportional adjustments
109
Table of Contents
to the maximum number and kind of securities (a) available for issuance under the 2010 Plan, (b) issuable as incentive stock options, and (c) subject to any outstanding award, including the per share price of such securities.
Types of Awards
The 2010 Plan permits the grant of any or all of the following types of awards.
Stock Options. The committee may grant either incentive stock options, which must comply with the Internal Revenue Code Section 422, or nonqualified stock options. The committee sets stock option exercise prices and terms, except that the exercise price of stock options granted under the 2010 Incentive Plan must be at least 100% of the fair market value of the common stock on the date of grant, except in the case of stock options granted in connection with assuming or substituting stock options in acquisition transactions. At the time of grant, the committee determines when stock options are exercisable and when they expire, except that the term of a stock option cannot exceed ten years. Unless the committee otherwise determines, fair market value means, as of a given date, the closing price of our common stock.
Stock Appreciation Rights (SARs). The committee may grant SARs as a right in tandem with the number of shares underlying stock options granted under the 2010 Plan or on a stand-alone basis. SARs are the right to receive payment per share of an exercised SAR in stock or cash, or a combination of stock and cash, equal to the excess of the share’s fair market value on the date of exercise over its fair market value on the date the SAR was granted. Exercise of an SAR issued in tandem with stock options will result in the reduction of the number of shares underlying the related SAR to the extent of the SAR exercised. The term of a stand-alone SAR cannot be more than ten years, and the term of a tandem SAR will not exceed the term of the related option.
Stock Awards, Restricted Stock and Stock Units. The committee may grant awards of shares of common stock, or awards designated in units of common stock, under the 2010 Plan. These awards may be made subject to repurchase or forfeiture restrictions at the committee’s discretion. The restrictions may be based on continuous service with us or the achievement of specified performance criteria, as determined by the committee.
Performance Awards. The committee may grant performance awards in the form of performance shares or performance units. Performance shares are units valued by reference to a designated number of shares of common stock, and performance units are units valued by reference to a designated amount of cash. Either may be payable in stock or cash, or a combination of stock and cash, upon the attainment of performance criteria and other terms and conditions as established by the committee.
Other Stock or Cash-Based Awards. The committee may grant other incentives payable in cash or in shares of common stock, subject to the terms of the 2010 Plan and any other terms and conditions determined by the committee.
Repricing
The 2010 Plan permits the committee, without stockholder approval, to reduce the exercise price of an stock option after it is granted, take any other action that is treated as a repricing under generally accepted accounting principles, and cancel a stock option at a time when its exercise price exceeds the fair market value of the underlying stock, in exchange for another stock option, restricted stock or units, or other equity.
Change of Control
Under the 2010 Plan, unless otherwise provided in the instrument evidencing an award or in a written employment, services or other agreement between the participant and us, in the event of a change of control:
| • | Upon certain changes of control, such as specified reorganizations, mergers or consolidations, the awards will become fully and immediately exercisable, and all applicable deferral and restriction |
110
Table of Contents
| limitations or forfeiture provisions will lapse, only if and to the extent the awards are not converted, assumed or replaced by a successor company. Except for such specified types of changes of control, all outstanding awards, other than performance shares and performance units, will become fully and immediately exercisable and all applicable deferral and restriction limitations or forfeiture provisions will lapse, immediately prior to the change of control and the awards will terminate at the effective time of the change of control. |
| • | All performance shares and performance units will be payable based on targeted performance being attained as of the effective date of the change of control and will be paid in accordance with the payout schedule for the award. |
| • | In the event of certain reorganizations, mergers or consolidations, the committee may, in its discretion, instead provide that a participant’s outstanding awards will be cashed out. |
Definition of Change of Control. Unless the committee determines otherwise with respect to an award at the time it is granted or unless otherwise defined for purposes of an award in a written employment, services or other agreement between a participant and us, a change of control of us generally means the occurrence of any of the following events:
| • | an acquisition by any individual, entity or group of beneficial ownership more than 50% of either (a) the then outstanding shares of common stock or (b) the combined voting power of the then outstanding voting securities of us entitled to vote generally in the election of directors (excluding generally any acquisition directly from us, any acquisition by us, any acquisition by any employee benefit plan of us or an affiliate, or the completion of a reorganization, merger or consolidation or sale or other disposition of all or substantially all of our assets pursuant to which specific requirements are met); |
| • | a change in the composition of the board of directors in any two-year period with the result that the incumbent board members cease to constitute at least a majority of the board (not including directors whose election, or nomination for election by stockholders, was approved by a majority of the incumbent board); or |
| • | completion of specified reorganizations, mergers or consolidations or other disposition of all or substantially all of our assets. |
Amendment and Termination
The board of directors or the committee may amend the 2010 Plan, except that if any applicable statute, rule or regulation requires stockholder approval for an amendment to the 2010 Plan, then to the extent so required, stockholder approval will be obtained. The board or the committee may also suspend or terminate all or any portion of the 2010 Plan at any time, but any suspension or termination may not, without a participant’s consent, materially adversely affect any rights under any outstanding award. Unless sooner terminated by the board or committee, the 2010 Plan will terminate ten years after the date the 2010 Plan becomes effective.
111
Table of Contents
CERTAIN RELATIONSHIPS AND RELATED PARTY TRANSACTIONS
The following is a description of transactions since January 1, 2007, in which we have been a participant, in which the amount involved exceeded or will exceed $120,000, and in which any of our directors, executive officers, beneficial owners of more than 5% of our capital stock, or entities affiliated with them, had or will have a direct or indirect material interest.
Transactions with Our Principal Stockholders
Investors’ Rights Agreement
We are a party to an investors’ rights agreement, as amended, with certain of our stockholders, including holders of more than 5% of our capital stock and their affiliates. Pursuant to the investors’ rights agreement, the holders of our convertible preferred stock have the right to demand that we file a registration statement or request that their shares be covered by a registration statement that we are otherwise filing, subject to certain limitations. For a more detailed description of these rights, please read “Description of Capital Stock—Registration Rights.” The investors’ rights agreement also provides to certain holders of our preferred stock the right to receive financial and other information about the company and pre-emptive rights to participate on a pro rata basis in certain issuances of our securities. These information and pre-emptive rights will terminate prior to the closing of this offering.
Transactions with Our Directors and Executive Officers
Change of Control Arrangements with Our Directors and Named Executive Officers
We have entered into an agreement containing change of control provisions with each of Robert F. Dunne, our Vice President of Worldwide Sales, and Robert McCarthy, our Vice President of Finance and former Chief Financial Officer. In addition, stock options granted to our directors and executive officers under our 2000 Stock Option/Stock Incentive Plan contain change in control provisions. The provisions of Mr. Dunne’s agreement, Mr. McCarthy’s agreement and the stock options are described under “Executive Compensation—Potential Payments Upon Termination or Change-in-Control.”
Indemnification Agreements
Our certificate of incorporation and by-laws that will become effective immediately prior to the closing of this offering provide that we will limit the liability of each of our directors and indemnify each of our directors and officers to the fullest extent permitted by Delaware law. In addition, we have entered into separate indemnification agreements with each of our directors. Please read “Management—Limitations on Director and Officer Liability and Indemnification” for a general description of these provisions.
Equity Awards
Certain grants of stock options to our directors and executive officers and related option grant policies are described in this prospectus under the captions “Management—Director Compensation,” “Compensation Discussion and Analysis—Elements of Executive Compensation—Long-term Equity Incentives,” “Executive Compensation—2009 Grants of Plan-Based Awards Table,” “Executive Compensation—2009 Outstanding Equity Awards at Fiscal Year-End Table” and “Executive Compensation—Potential Payments Upon Termination or Change-in-Control.”
In addition to those option grants, on March 31, 2010, in connection with the hiring of our current Chief Financial Officer, our board of directors granted options to purchase 450,000 shares of common stock to Kelly Lang. Also on March 31, 2010, our board of directors granted options to purchase 43,350 and 23,800 shares of common stock to Messrs. Lattin and Richardson. These options have an exercise price of $1.98 per share and
112
Table of Contents
vest and become exercisable at a rate of 25% on the first anniversary of the vesting commencement date, with the remainder vesting and becoming exercisable ratably over the next 36 months, subject to continued service through each applicable date.
On May 7, 2010, our board of directors granted options to purchase 333,333, 116,667, 116,667, 116,667 and 13,333 shares of common stock to James B. Johnson (our President and Chief Executive Officer), Daniel Schoenbaum (our Chief Operating Officer, Products) and Messrs. Lang, Dunne and McCarthy, respectively, at an exercise price of $2.09 per share. These options vest and become exercisable at a rate of 25% per year, over four years.
On May 25 and 26, 2010, our board of directors granted options to purchase a total of 65,455 shares of common stock to Robert J. Finocchio, Jr., at an exercise price of $2.08 per share, in connection with the appointment of Mr. Finocchio to our board of directors. The options vest and become exercisable at a rate of 25% per year, over four years.
On July 22, 2010, our board of directors granted options to purchase 166,667, 58,333, 58,333, 58,333 and 6,667 shares of common stock to Messrs. Johnson, Schoenbaum, Lang, Dunne and McCarthy, respectively, at an exercise price of $2.08 per share. These performance-based options vest and become exercisable based on the achievement of specified revenue growth performance goals for 2010 and 2011.
Policies and Procedures for Related Party Transactions
We do not currently have a formal, written policy or procedure for the review and approval of related party transactions. However, all related party transactions are currently reviewed and approved by our audit committee.
Effective at the closing of this offering, our audit committee charter provides that our audit committee will have the authority to approve any related party transactions. All of our directors and officers will be required to report to the audit committee any related party transaction prior to entering into the transaction.
We believe that we have executed all of the transactions described above on terms no less favorable to us than we could have obtained from unaffiliated third parties. We intend that all future transactions between us and our directors and principal stockholders and their affiliates are approved by our audit committee, and are on terms no less favorable to us than those that we could obtain from unaffiliated third parties.
113
Table of Contents
PRINCIPAL AND SELLING STOCKHOLDERS
The following table sets forth the beneficial ownership of our common stock as of July 26, 2010, and as adjusted to give effect to the sale of shares of our common stock offered by this prospectus by:
| • | each person, or group of affiliated persons, known to us to beneficially own more than 5% of our common stock; |
| • | each of our directors; |
| • | each of our named executive officers; |
| • | all of our directors and executive officers as a group; and |
| • | each of the selling stockholders. |
The number of shares beneficially owned by each stockholder is determined under Rule 13d-3 as promulgated under the Securities Exchange Act of 1934, as amended, or the Exchange Act, and generally includes shares over which a holder has voting or investment power. The information does not necessarily indicate beneficial ownership for any other purpose. Under SEC rules, the number of shares of common stock deemed outstanding includes shares issuable upon exercise of options or warrants held by the respective person or group that may be exercised within 60 days after July 26, 2010. For purposes of calculating each person’s or group’s percentage ownership, shares of common stock issuable within 60 days after July 26, 2010 are included as outstanding and beneficially owned for that person or group, but are not treated as outstanding for the purpose of computing the percentage ownership of any other person or group. Percentage of ownership is based on 52,565,725 shares of common stock outstanding as of July 26, 2010, and shares outstanding after this offering, assuming no exercise of the underwriters’ over-allotment option. The table below assumes the conversion of all shares of our preferred stock into shares of our common stock immediately prior to the completion of this offering.
Unless otherwise indicated and subject to applicable community property laws, we believe, based on information furnished to us, that each stockholder named in the following table possesses sole voting and investment power over the shares listed, except for those jointly owned with that person’s spouse. Unless otherwise noted below, the address of each person listed on the table is c/o Tripwire, Inc., 101 SW Main Street, Suite 1500, Portland, Oregon 97204.
| Name of Beneficial Owner |
Shares Beneficially Owned Prior to this Offering |
Number of Shares Being Offered |
Shares Beneficially Owned After this Offering | ||||||||
| Number | Percentage | Number | Percentage | ||||||||
| 5% Stockholders: |
|||||||||||
| Entities affiliated with Advanced Technology Ventures (1) |
11,639,335 | 22.14 | % | ||||||||
| Entities affiliated with Bessemer Venture Partners (2) |
5,232,848 | 9.95 | % | ||||||||
| Entities affiliated with Institutional Venture Partners (3) |
5,272,404 | 10.03 | % | ||||||||
| Industry Ventures Fund V, L.P. (4) |
3,060,018 | 5.82 | % | ||||||||
114
Table of Contents
| Name of Beneficial Owner |
Shares Beneficially Owned Prior to this Offering |
Number of Shares Being Offered |
Shares Beneficially Owned After this Offering | ||||||||
| Number | Percentage | Number | Percentage | ||||||||
| Chong-Moon Lee |
2,892,908 | 5.50 | % | ||||||||
| Named Executive Officers and Directors: |
|||||||||||
| James B. Johnson (5) |
2,911,023 | 5.54 | % | ||||||||
| Dan Schoenbaum (6) |
1,040,879 | 1.98 | % | ||||||||
| Robert F. Dunne (7) |
918,344 | 1.75 | % | ||||||||
| Robert C. McCarthy (8) |
794,509 | 1.51 | % | ||||||||
| Steven N. Baloff (9) |
11,639,335 | 22.14 | % | ||||||||
| Robert J. Finocchio, Jr. |
— | — | |||||||||
| Justin Label |
— | — | |||||||||
| William W. Lattin (10) |
642,645 | 1.22 | % | ||||||||
| James T. Richardson |
448,000 | * | |||||||||
| All directors and executive officers as a group (9 persons) (11) |
17,700,226 | 33.67 | % | ||||||||
| Other Selling Stockholders: |
|||||||||||
| * | Indicates beneficial ownership of less than 1%. |
| (1) | Includes 380,080 shares held by ATV Entrepreneurs V, L.P., 10,537,177 shares held by Advanced Technology Ventures V, L.P., and 722,078 shares held by Advanced Technology Ventures VIII, L.P. (collectively, the “ATV Entities”). ATV Associates V, LLC is the general partner of Advanced Technology Ventures V, L.P., and ATV Entrepreneurs V, L.P., and exercises voting and investment power over the shares held by those entities. ATV Associates VIII, LLC is the general partner of Advanced Technology Ventures VIII, L.P., and exercises voting and investment power over the shares held by that entity. The ATV Entities collectively own an aggregate 11,639,335 shares of our common stock, and each has shared voting and dispositive power over such shares. Each individual ATV entity disclaims beneficial ownership of the shares owned by other ATV Entities. Steven N. Baloff, one of our directors, is one of five Managing Directors of ATV Associates VIII, LLC and one of two Managing Directors of ATV Associates V, LLC. Please read note 10 below. |
| (2) | Includes 1,963,621 shares held by Bessec Ventures V L.P., 2,530,296 shares held by Bessemer Venture Partners V L.P., 334,565 shares held by Bessemer Venture Investors II L.P., 184,763 shares held by BVE 2001(Q) LLC, 117,798 shares held by BVE LLC, 90,629 shares held by BIP 2001 L.P. and 11,176 shares held by BVE 2001 LLC (collectively, the BVP Entities). Deer V & Co. LLC is the general partner of each of the BVP Entities. Robert P. Goodman, Robin S. Chandra, J. Edmund Colloton and David J. Cowan are the managing members of Deer V & Co. LLC and share voting and dispositive power over the shares held by the BVP Entities. |
| (3) | Includes 4,318,802 shares held by Institutional Venture Partners X, L.P. (IVP X), 953,602 shares held by Institutional Venture Partners X GmbH & Co. Beteiligungs KG (IVP XKG). Institutional Venture Management X, LLC (IVM X) is the general partner of IVP X and managing limited partner of IVP XKG. Todd Chaffee, Reid Dennis, Mary Jane Elmore, Norm Fogelsong, Steve Harrick and Dennis Phelps are managing directors of IVM X and share voting and dispositive power over these shares. Each of these individuals disclaims beneficial ownership of these shares except to the extent of his or her actual respective pecuniary interest therein. |
| (4) | Consists of 3,060,018 shares held by Industry Ventures Fund V, L.P., over which Hans Swindlens, Mike Gridley and Justin Burden exercise voting and dispositive power. Each of Messrs. Swindlens, Gridley and Burden disclaims beneficial ownership of these shares except to the extent of any pecuniary interest therein. |
115
Table of Contents
| (5) | Includes options to purchase 2,729,205 shares of our common stock exercisable within 60 days of July 26, 2010. Mr. Johnson disclaims beneficial ownership of 1,445,502 of these shares and options to purchase shares of our common stock, the economic benefits of which are held by his former spouse. |
| (6) | Includes options to purchase 1,040,879 shares of our common stock exercisable within 60 days of July 26, 2010. |
| (7) | Includes options to purchase 918,344 shares of our common stock exercisable within 60 days of July 26, 2010. |
| (8) | Includes options to purchase 684,509 shares of our common stock exercisable within 60 days of July 26, 2010. |
| (9) | Includes 11,639,335 shares beneficially owned by the ATV Entities. Mr. Baloff disclaims beneficial ownership of the shares held by the ATV Entities, except to the extent of his pecuniary interest therein. Please read note 1 above. |
| (10) | Includes options to purchase 533,000 shares of our common stock exercisable within 60 days of July 26, 2010. Dr. Lattin holds 10,000 shares directly, and the remainder are held by Lattin Enterprises, an Oregon limited liability company, of which Mr. Lattin is a member. |
| (11) | Includes options to purchase 5,905,937 shares of our common stock exercisable within 60 days of July 26, 2010. |
116
Table of Contents
General
Upon the closing of this offering, our authorized capital stock will consist of 125,000,000 shares of common stock, $0.001 par value per share, and 10,000,000 shares of preferred stock, $0.001 par value per share.
The following summary of some of the terms relating to our common stock, preferred stock, certificate of incorporation and by-laws is not complete and may not contain all the information you should consider before investing in our common stock. You should read carefully our certificate of incorporation and by-laws that will be in effect upon the closing of this offering, which are included as exhibits to the registration statement of which this prospectus is a part. The descriptions below reflect changes that will occur on or prior to the closing of this offering.
Common Stock
The holders of common stock are entitled to one vote per share on all matters to be voted on by the common stockholders. The holders of our common stock are not entitled to cumulative voting in the election of our directors, which means that the holders of a majority of the outstanding shares of our common stock will be entitled to elect all of the directors standing for election. Subject to preferences of any outstanding shares of preferred stock, the holders of common stock are entitled to receive ratably any dividends our board of directors may declare out of funds legally available for the payment of dividends. If we are liquidated, dissolved or wound up, the holders of common stock are entitled to share pro rata in all assets remaining after payment of, or provision for, our liabilities and liquidation preferences of any outstanding shares of preferred stock. Holders of common stock have no pre-emptive rights or rights to convert their common stock into any other securities. There are no redemption or sinking fund provisions applicable to the common stock. All outstanding shares of common stock are fully paid and non-assessable, and the shares of common stock to be sold in this offering will be fully paid and non-assessable. As of July 26, 2010 and giving effect to the conversion of our preferred stock into common stock as if it had occurred as of such date, we would have had 52,565,725 shares of common stock outstanding held by approximately 244 record holders. Upon the closing of this offering, we will have shares of common stock outstanding, assuming no exercise of the underwriters’ over-allotment option and no exercise of outstanding stock options or warrants.
Preferred Stock
Immediately prior to the closing of this offering, our outstanding shares of convertible preferred stock will be converted into 36,092,260 shares of common stock. Thereafter, pursuant to our certificate of incorporation, our board of directors will have the authority, without further action by the stockholders, to issue up to 10,000,000 shares of preferred stock from time to time in one or more series. The board of directors also has the authority to fix the designations, voting powers, preferences, privileges and relative rights and the limitations of any series of preferred stock, including dividend rights, conversion rights, voting rights, terms of redemption and liquidation preferences, any or all of which may be greater than the rights of the common stock. The board of directors, without stockholder approval, can issue preferred stock with voting, conversion or other rights that could adversely affect the voting power and other rights of the holders of common stock. The issuance of preferred stock may decrease the market price of the common stock. We have no plans at this time to issue any preferred stock.
Warrants
The following table shows outstanding warrants to purchase shares of our capital stock as of July 26, 2010 and gives effect to adjustments of warrants to purchase shares of preferred stock that will convert into warrants to purchase shares of our common stock immediately prior to the closing of this offering. With the exception of the
117
Table of Contents
warrant granted on July 31, 2002, which will automatically exercise upon completion of the offering, after completion of this offering, these warrants will remain outstanding and may be exercised at any time prior to their respective termination dates.
| Date of Issuance | Date of Termination | Shares Subject to Warrant | ||
| 08/21/2009 | 08/21/2013 | 130,000 | ||
| 08/21/2009 | 08/21/2013 | 30,800 | ||
| 08/21/2009 | 08/21/2013 | 26,600 | ||
| 08/21/2009 | 08/21/2013 | 8,400 | ||
| 08/21/2009 | 08/21/2013 | 4,200 | ||
| 03/15/2004 | (1) | 80,000 | ||
| 07/31/2002 | (2) | 28,559 |
| (1) | The earlier of March 15, 2014 or five years from the date of our initial public offering. |
| (2) | The earlier of (i) a public merger (as defined in the warrant), (ii) an initial public offering or (iii) July 30, 2012. |
Registration Rights
Pursuant to an investors’ rights agreement between us and purchasers of our convertible preferred stock, which will be converted into shares of our common stock immediately prior to the closing of this offering), and certain warrants agreements, the holders of an aggregate of 45,468,424 shares of our common stock outstanding immediately after this offering are entitled to include their shares in any registration statement we file under the Securities Act to register any of our securities, subject to exceptions, and also to include those shares in any underwritten offering contemplated by that registration statement. In addition, beginning six months after the completion of this offering, the holders of at least 50% of the shares then outstanding subject to the investors’ rights agreement may require us to file a registration statement to register any or all of their shares of common stock under the Securities Act, subject to the investors’ rights agreement, on no more than two occasions, and the other holders of shares of common stock entitled to registration rights under that agreement will be entitled to include their shares in any such registration statement. Further, if and when we become eligible to file registration statements on SEC Form S-3, holders of shares subject to the investors’ rights agreement may require us to file additional registration statements on Form S-3 to register their shares of common stock on an unlimited number of occasions (provided that we do not have to effect more than one such registrations in any 12-month period), as long as the proposed aggregate offering amount is at least $1,000,000 for each such registration. Under the investors’ rights agreement, we are required to pay for all costs and expenses, other than underwriting discounts and commissions and stock transfer taxes, incurred in connection with the registration of shares. All shares registered may be resold in the public markets. Under the investors’ rights agreement, we have agreed to indemnify the holders of the common stock entitled to registration rights against certain liabilities, including liabilities under the Securities Act.
In connection with certain other purchases of our common stock, the holders of an aggregate of 526,860 shares of our common stock outstanding immediately after this offering are entitled to include their shares in any registration statement we file under the Securities Act to register any of our securities, subject to exceptions, and also to include those shares in any underwritten offering contemplated by that registration statement.
All of these registration rights are subject to conditions and limitations, including the right of the underwriters of an offering to limit the number of shares included in the offering. In addition, no stockholder will have any rights under the agreement to include shares in a registration statement if the following conditions exist: (1) our common stock trades on a national securities exchange or a national automatic quotation system; and (2) all shares held by such holder may be sold pursuant to Rule 144 under the Securities Act in any 90-day period.
118
Table of Contents
Anti-Takeover Effects of Certain Provisions of our Certificate of Incorporation, By-laws and Delaware Law
Provisions of our certificate of incorporation, our by-laws and Delaware law could have the effect of delaying or preventing a third party from acquiring us, even if the acquisition would benefit our stockholders. These provisions may delay, defer or prevent a tender offer or takeover attempt of our company that a stockholder might consider in the stockholder’s best interest, including those attempts that might result in a premium over the market price for the shares held by our stockholders. These provisions are intended to enhance the likelihood of continuity and stability in the composition of our board of directors and in the policies formulated by the board of directors and to discourage certain types of transactions that may involve our actual or threatened change of control. These provisions are designed to reduce our vulnerability to an unsolicited proposal for a takeover that does not contemplate the acquisition of all of our outstanding shares, or an unsolicited proposal for the restructuring or sale of all or part of us.
Authorized but Unissued Shares of Common Stock and Preferred Stock
Our authorized but unissued shares of common stock and preferred stock are available for our board of directors to issue without stockholder approval. As noted above, our board of directors, without stockholder approval, has the authority under our certificate of incorporation to issue preferred stock with rights superior to the rights of the holders of common stock. As a result, preferred stock could be issued quickly, could adversely affect the rights of holders of common stock and could be issued with terms calculated to delay or prevent a change of control or make removal of management more difficult. We may use the additional authorized shares of common or preferred stock for a variety of corporate purposes, including future public offerings to raise additional capital, corporate acquisitions and employee benefit plans. The existence of our authorized but unissued shares of common stock and preferred stock could render more difficult or discourage an attempt to obtain control of our company by means of a proxy contest, tender offer, merger or other transaction.
Classified Board of Directors; Election and Removal of Directors
Our certificate of incorporation provides for the division of our board of directors into three classes, as nearly as equal in number as possible, with the directors in each class serving for three-year terms, and one class being elected each year by our stockholders. In addition, our directors are removable only for cause by the holders of at least a majority of the shares entitled to vote at the election of directors. Further, any vacancies on the board of directors may be filled only by the affirmative vote of a majority of the directors then in office and only the board of directors may change the size of the board of directors. Because this system of electing, appointing and removing directors generally makes it more difficult for stockholders to replace a majority of the board of directors, it may discourage a third party from making a tender offer or otherwise attempting to gain control of us and may maintain the incumbency of the board of directors.
Stockholder Action; Special Meetings of Stockholders
Our certificate of incorporation eliminates the ability of stockholders to act by written consent. Our certificate of incorporation also provides that special meetings of our stockholders may be called only by the Chairman of the board of directors, our President or our Chief Executive Officer.
Advance Notice Requirements for Stockholders Proposals and Director Nominations
Our by-laws provide that stockholders seeking to bring business before an annual meeting of stockholders, or to nominate candidates for election as directors at an annual meeting of stockholders, must provide us with timely written notice of their proposal. Our by-laws also specify requirements as to the form and content of a stockholder’s notice. These provisions may preclude stockholders from bringing matters before an annual meeting of stockholders or from making nominations for directors at an annual meeting of stockholders.
119
Table of Contents
Amendment to our Certificate of Incorporation and By-laws
Our certificate of incorporation and by-laws generally may be amended by our board of directors or holders of at least 66-2/3% of our outstanding voting stock.
Delaware Anti-Takeover Statute
We are subject to the provisions of Section 203 of the Delaware General Corporation Law, an anti-takeover law. Subject to exceptions, the statute prohibits a publicly-held Delaware corporation from engaging in a “business combination” with an “interested stockholder” for a period of three years after the date of the transaction in which the person became an interested stockholder, unless:
| • | prior to such date, the board of directors of the corporation approved either the business combination or the transaction which resulted in the stockholder becoming an interested stockholder; |
| • | upon consummation of the transaction which resulted in the stockholder becoming an interested stockholder, the interested stockholder owned at least 85% of the voting stock of the corporation outstanding at the time the transaction commenced (excluding for purposes of determining the number of shares outstanding, those shares owned by (1) persons who are directors and also officers and (2) employee stock plans in which employee participants do not have the right to determine confidentially whether shares held subject to the plan will be tendered in a tender or exchange offer); or |
| • | on or after such date, the business combination is approved by the board of directors and authorized at an annual or special meeting of stockholders and not by written consent, by the affirmative vote of at least 66-2/3% of the outstanding voting stock which is not owned by the interested stockholder. |
For purposes of Section 203, a “business combination” includes a merger, asset sale or other transaction resulting in a financial benefit to the interested stockholder, with an “interested stockholder” being defined as a person who, together with affiliates and associates, owns, or within three years prior to the date of determination whether the person is an “interested stockholder,” did own, 15% or more of the corporation’s voting stock.
Pre-emptive Rights
Under Delaware law, a stockholder is not entitled to pre-emptive rights to subscribe for additional issuances of common stock or any other class of series of common stock or any security convertible into such stock in proportion to the shares that are owned unless there is a provision to the contrary in the certificate of incorporation. Our certificate of incorporation will not provide that our stockholders are entitled to pre-emptive rights.
Transfer Agent and Registrar
The transfer agent and registrar for the common stock is BNY Mellon Shareowner Services.
Nasdaq Global Market Listing
We have applied to list our common stock on The Nasdaq Global Market under the symbol “TPWR.”
120
Table of Contents
SHARES ELIGIBLE FOR FUTURE SALE
Prior to this offering, there has been no public market for our common stock, and although we expect that our common stock will be approved for listing on The Nasdaq Global Market, an active public market for our common stock may not develop following this offering. We cannot predict the effect, if any, that market sales by our existing stockholders of shares of common stock, or the availability of shares of common stock for sale, will have on the market price of our common stock prevailing from time to time. Sales by our existing stockholders of substantial amounts of common stock in the public market, or the perception that such sales could occur, could reduce the market price of our common stock and impair our future ability to raise capital through the sale of equity securities.
Upon completion of this offering, based on our shares outstanding as of , 2010, and after giving effect to the conversion of all shares of our outstanding preferred stock into shares of common stock, we will have shares of common stock outstanding. Of the outstanding shares, all of the shares sold in this offering, including any additional shares sold upon exercise of the underwriters’ over-allotment option to purchase additional shares, will be freely tradable, except that any shares held or acquired by our “affiliates,” as that term is defined in Rule 144 under the Securities Act, will be subject to the volume limitations and other restrictions of Rule 144 described below. The remaining shares of common stock held by our existing stockholders are “restricted securities” as defined under Rule 144. Restricted securities may be sold in the public market only if registered under the Securities Act or if they qualify for an exemption from registration, including, among others, the exemptions provided by Rule 144 and Rule 701 under the Securities Act, which are summarized below.
Rule 144
In general, a person who has beneficially owned restricted shares of our common stock for at least six months would be entitled to sell their securities provided that (1) such person is not deemed to have been one of our affiliates at the time of, or at any time during the 90 days preceding, a sale and (2) we have been subject to and satisfied the Exchange Act periodic reporting requirements for at least 90 days before the sale. If such a person has beneficially owned the shares proposed to be sold for at least one year, including the holding period of any prior owner other than our affiliates, then that person is entitled to sell the shares without complying with the requirements of Rule 144. Persons who have beneficially owned restricted shares of our common stock for at least six months, but who are our affiliates at the time of, or any time during the 90 days preceding, a sale, would be subject to additional restrictions, by which such person would be entitled to sell within any three-month period only a number of securities that does not exceed the greater of:
| • | 1% of the number of shares of our common stock then outstanding, which will equal approximately shares immediately after this offering (or shares assuming exercise by the underwriters of their over-allotment option in full), based on the number of shares of common stock outstanding as of , and after giving effect to the conversion of all shares of our outstanding preferred stock into shares of common stock; and |
| • | the average weekly trading volume of our common stock on The Nasdaq Global Market during the four calendar weeks preceding the filing of a notice on Form 144 with respect to the sale; |
provided, in each case, that we are subject to the Exchange Act periodic reporting requirements for at least 90 days before the sale. Such sales by affiliates must also comply with the manner of sale, current public information and notice provisions of Rule 144.
Rule 701
In general, under Rule 701 a person who purchased shares of our common stock pursuant to a written compensatory plan or contract and who is not deemed to have been one of our affiliates during the immediately preceding 90 days may sell these shares in reliance upon Rule 144, but without being required to comply with the notice, manner of sale, public information requirements or volume limitation provisions of Rule 144. Rule 701
121
Table of Contents
also permits affiliates to sell their Rule 701 shares under Rule 144 without complying with the holding period requirements of Rule 144. All holders of Rule 701 shares, however, are required to wait until 90 days after becoming subject to the Exchange Act periodic reporting requirements.
As of July 26, 2010, 3,903,756 shares of our outstanding common stock had been issued in reliance on Rule 701 as a result of exercises of stock options. All of these shares are subject to contractual lock-up agreements, and, as a result, these shares will only become eligible for sale at the earlier of the expiration of the lock-up period or upon obtaining the consent of the underwriters to release all or any portion of these shares from the lock-up agreements.
Lock-Up Agreements
We, our directors and officers and a substantial majority of the other holders of our equity securities have agreed, subject to certain exceptions, not to offer, sell or transfer any common stock or securities convertible into or exchangeable or exercisable for common stock, other than the shares which the selling stockholders may sell in this offering, for 180 days after the date of this prospectus without first obtaining the written consent of J.P. Morgan Securities Inc. and Stifel, Nicolaus & Company, Incorporated, subject to a possible extension beyond the end of such 180-day period as described under “Underwriting.”
J.P. Morgan Securities Inc. and Stifel, Nicolaus & Company, Incorporated have advised us that there is no present arrangement to release any shares subject to a lock-up agreement, and will consider the release of any lock-up on a case-by-case basis. Upon a request to release any shares subject to a lock-up agreement, J.P. Morgan Securities Inc. and Stifel, Nicolaus & Company, Incorporated would consider the particular circumstances surrounding the request, including, among other things, the length of time before the lock-up expires, the number of shares requested to be released, reasons for the request, the possible impact on the market or our common stock and whether the holder of our shares requesting the release is an officer, director or other affiliate of ours.
Registration Rights
On the date beginning 180 days after the date of this prospectus, the holders of approximately 45,995,284 shares of our common stock, or their transferees, will be entitled to certain rights with respect to the registration of the offer and sale of those shares under the Securities Act. For a description of these registration rights, please read “Description of Capital Stock—Registration Rights.” After the offer and sale of these shares are registered, they will be freely tradable without restriction under the Securities Act, and a large number of shares may be sold into the public market. If that occurs, the market price of our common stock could decline.
Stock Options
As of July 26, 2010, options to purchase a total of 16,113,231 shares of common stock pursuant to our 1998 Stock Option Plan and 2000 Stock Option/Stock Issuance Plan were outstanding, of which 10,543,543 were exercisable. In addition options to purchase a total of 200,000 shares of common stock pursuant to a stock option agreement issued outside of our equity compensation plans as a charitable donation are exercisable and subject to lock-up provisions. We intend to file a registration statement on Form S-8 under the Securities Act as promptly as possible after the completion of this offering to register shares that may be issued pursuant to the 1998 Stock Option Plan, the 2000 Stock Option/Stock Issuance Plan or our 2010 Incentive Plan. The registration statement is expected to become effective immediately upon filing, and shares covered by the registration statement will then become eligible for sale in the public markets. As a result, shares issued pursuant to such plans after the effectiveness of the registration statement will be freely tradable in the public market, subject to the Rule 144 limitations applicable to affiliates, vesting restrictions and expiration of any applicable lock-up agreements.
122
Table of Contents
MATERIAL U.S. FEDERAL INCOME AND ESTATE TAX CONSEQUENCES
TO NON-U.S. HOLDERS
The following is a summary of the material U.S. federal income and estate tax consequences to non-U.S. holders of the ownership and disposition of our common stock, but does not purport to be a complete analysis of all the potential tax considerations relating thereto. This summary is based upon the provisions of the U.S. Internal Revenue Code, U.S. Treasury Regulations promulgated thereunder, administrative rulings and judicial decisions, all as of the date hereof, all of which are subject to change, possibly with retroactive effect, which could result in U.S. federal income and estate tax consequences different than those summarized below. We have not sought a ruling from the Internal Revenue Service (IRS) with respect to the statements made and the conclusions reached in the following summary, and there can be no assurance that the IRS will agree with such statements and conclusions.
This summary does not address the tax considerations arising under the laws of any state, local or other jurisdiction and is limited to investors who will hold our common stock as a capital asset for tax purposes. This summary does not address all tax considerations that may be important to a particular investor in light of the investor’s circumstances or to certain categories of non-U.S. investors that may be subject to special rules, such as:
| • | banks, insurance companies or other financial institutions (except to the extent specifically set forth below); |
| • | persons subject to the alternative minimum tax; |
| • | tax-exempt organizations; |
| • | controlled foreign corporations, passive foreign investment companies and corporations that accumulate earnings to avoid U.S. federal income tax; |
| • | dealers in securities or currencies; traders in securities that elect to use a mark-to-market method of accounting for their securities holdings; |
| • | persons that own, or are deemed to own, more than 5% of our capital stock (except to the extent specifically set forth below); |
| • | certain former citizens or long-term residents of the United States; |
| • | persons who hold our common stock as a position in a hedging transaction, “straddle,” “conversion transaction” or other risk reduction transaction; or |
| • | persons deemed to sell our common stock under the constructive sale provisions of the Internal Revenue Code. |
In addition, if a partnership (including any entity classified as a partnership for U.S. federal income tax purposes) holds our common stock, the tax treatment of a partner generally will depend on the status of the partner and upon the activities of the partnership. Accordingly, partnerships that hold our common stock and partners in such partnerships should consult their tax advisors.
The following discussion of material U.S. federal income and estate tax consequences to non-U.S. holders is for general information only. You are urged to consult your tax advisor with respect to the application of the U.S. federal income tax laws to your particular situation, as well as any tax consequences of the purchase, ownership and disposition of our common stock arising under the U.S. federal estate or gift tax rules or under the laws of any state, local, non-U.S. or other taxing jurisdiction or under any applicable tax treaty.
123
Table of Contents
Non-U.S. Holder Defined
For purposes of this discussion, you are a non-U.S. holder if you are any holder other than a (i) U.S. citizen or U.S. resident alien, (ii) a corporation or other entity taxable as a corporation for U.S. federal income tax purposes, that was created or organized in or under the laws of the United States, any state thereof or the District of Columbia, (iii) an estate whose income is subject to U.S. federal income taxation regardless of its source, or (iv) a trust that either is subject to the supervision of a court within the United States and has one or more U.S. persons with authority to control all of its substantial decisions, or has a valid election in effect under applicable U.S. Treasury Regulations to be treated as a United States person.
Distributions on Common Stock
If we make distributions on our common stock, these distributions generally will constitute dividends for U.S. tax purposes to the extent paid from our current or accumulated earnings and profits, as determined under U.S. federal income tax principles. To the extent these distributions exceed both our current and our accumulated earnings and profits, they will constitute a return of capital and will first reduce your basis in our common stock, but not below zero, and then will be treated as gain from the sale of stock.
Any dividend paid to you generally will be subject to withholding either at a rate of 30% of the gross amount of the dividend or such lower rate as may be specified by an applicable income tax treaty. In order to receive a reduced treaty rate, you must provide us with an IRS Form W-8BEN or other appropriate version of IRS Form W-8 certifying qualification for the reduced rate. If you are eligible for a reduced rate of withholding pursuant to an income tax treaty, you may obtain a refund of any excess amounts withheld by filing an appropriate claim for refund with the IRS. If you hold our common stock through a financial institution or other agent acting on your behalf, you will be required to provide appropriate documentation to the agent, which then will be required to provide certification to us or our paying agent, either directly or through other intermediaries.
Dividends received by you that are effectively connected with your conduct of a U.S. trade or business (and, if an income tax treaty applies, such dividend is attributable to a permanent establishment maintained by you in the U.S.) are exempt from withholding. In order to claim this exemption, you must provide us with an IRS Form W-8ECI or other applicable IRS Form W-8 properly certifying exemption. Effectively connected dividends, although not subject to withholding, are taxed at the same graduated U.S. federal income tax rates applicable to U.S. persons, net of certain deductions and credits, subject to an applicable income tax treaty providing otherwise. In addition, if you are a corporate non-U.S. holder, dividends you receive that are effectively connected with your conduct of a U.S. trade or business may also be subject to a branch profits tax at a rate of 30% or such lower rate as may be specified by an applicable income tax treaty.
Gain on Disposition of Common Stock
Subject to the discussion below regarding recent legislative withholding developments, a non-U.S. holder generally will not be subject to U.S. federal income tax on any gain realized upon the sale or other disposition of our common stock unless:
| • | the gain is effectively connected with your conduct of a U.S. trade or business (and, if an income tax treaty applies, the gain is attributable to a permanent establishment maintained by you in the U.S.); |
| • | you are an individual who is present in the U.S. for a period or periods aggregating 183 days or more during the calendar year in which the sale or disposition occurs and certain other conditions are met; or |
| • | our common stock constitutes a U.S. real property interest by reason of our status as a “United States real property holding corporation” (USRPHC) for U.S. federal income tax purposes at any time within the shorter of the five-year period preceding the disposition or your holding period for our common stock. |
124
Table of Contents
If you are described in the first bullet above, you will be required to pay tax on the net gain derived from the sale at the same graduated U.S. federal income tax rates applicable to U.S. persons (net of certain deductions and credits), and if you are a corporate non-U.S. holder, you may be subject to the branch profits tax at a rate of 30% or such lower rate as may be specified by an applicable income tax treaty. If you are described in the second bullet above, you will be required to pay a flat 30% tax on the gain derived from the sale, which tax may be offset by U.S. source capital losses (even though you are not considered a resident of the United States).
We believe that we are not currently and will not become a USRPHC. However, because the determination of whether we are a USRPHC depends on the fair market value of our U.S. real property relative to the fair market value of our other business assets, there can be no assurance that we will not become a USRPHC in the future. Even if we become a USRPHC, however, as long as our common stock is regularly traded on an established securities market, our common stock will be treated as a U.S. real property interest only if you actually or constructively hold more than 5% of such regularly traded common stock at any time during the applicable period specified in the Internal Revenue Code.
Federal Estate Tax
Our common stock beneficially owned by an individual who is not a citizen or resident of the U.S. (as defined for U.S. federal estate tax purposes) at the time of death generally will be includable in the decedent’s gross estate for U.S. federal estate tax purposes, unless an applicable estate tax treaty provides otherwise. However, it is currently uncertain how the U.S. federal estate tax will be implemented and administered in 2010 and subsequent years.
Backup Withholding and Information Reporting
Generally, we must report annually to the IRS the amount of dividends paid to you, your name and address, and the amount of tax withheld, if any. A similar report is sent to you. Pursuant to applicable income tax treaties or other agreements, the IRS may make these reports available to tax authorities in your country of residence.
Payments of dividends on or the gross proceeds of disposition of our common stock may be subject to information reporting and backup withholding at a current rate of 28% unless you establish an exemption, for example by properly certifying your non-U.S. status on a Form W-8BEN or another appropriate version of IRS Form W-8. Notwithstanding the foregoing, backup withholding and information reporting may apply if either we or our paying agent has actual knowledge, or reason to know, that you are a U.S. person.
Backup withholding is not an additional tax. Any amounts withheld from a payment to you under the backup withholding rules will be allowed as a credit against your U.S. federal income tax liability and may entitle you to a refund, provided that the required information or returns are furnished to the IRS in a timely manner.
Recent Legislative Developments
Recent legislation generally imposes withholding at a rate of 30% on payments to certain foreign entities (including financial institutions, which include hedge funds, private equity funds, mutual funds, securitization vehicles and other investment vehicles regardless of size), after December 31, 2012, of dividends on and the gross proceeds of dispositions of U.S. common stock, unless various U.S. information reporting and due diligence requirements (that are different from, and in addition to, the beneficial owner certification requirements described above) have been satisfied that generally relate to ownership by U.S. persons of interests in or accounts with those entities. You should consult your tax advisor regarding the possible implications of this legislation on your investment in our common stock.
125
Table of Contents
We and the selling stockholders are offering the shares of common stock described in this prospectus through a number of underwriters. J.P. Morgan Securities Inc. and Stifel, Nicolaus & Company, Incorporated are acting as joint book-running managers of the offering and as representatives of the underwriters. We and the selling stockholders have entered into an underwriting agreement with the representatives on behalf of the underwriters. Subject to the terms and conditions of the underwriting agreement, we and the selling stockholders have agreed to sell to the underwriters, and each underwriter has severally agreed to purchase, at the public offering price less the underwriting discounts set forth on the cover page of this prospectus, the number of shares of common stock listed next to its name in the following table:
| Underwriters |
Number of Shares | |
| J.P. Morgan Securities Inc. |
||
| Stifel, Nicolaus & Company, Incorporated |
||
| Needham & Company, LLC |
||
| RBC Capital Markets Corporation |
||
| Total |
The underwriters are committed to purchase all the common shares offered by us and the selling stockholders if they purchase any shares. The underwriting agreement also provides that if an underwriter defaults, the purchase commitments of non-defaulting underwriters may also be increased or the offering may be terminated.
The underwriters propose to offer the common shares directly to the public at the initial public offering price set forth on the cover page of this prospectus and to certain dealers at that price less a concession not in excess of $ per share. Any such dealers may resell shares to certain other brokers or dealers at a discount of up to $ per share from the initial public offering price. After the initial public offering of the shares, the offering price and other selling terms may be changed by the underwriters. Sales of shares made outside of the United States may be made by affiliates of the underwriters. The representatives have advised us that the underwriters do not intend to confirm discretionary sales in excess of 5% of the common shares offered in this offering.
The underwriters have an option to purchase up to additional shares of common stock from us and the selling stockholders to cover sales of shares by the underwriters which exceed the number of shares specified in the table above. The underwriters have 30 days from the date of this prospectus to exercise this overallotment option. If any shares are purchased with this overallotment option, the underwriters will purchase shares in approximately the same proportion as shown in the table above. If any additional shares of common stock are purchased, the underwriters will offer the additional shares on the same terms as those on which the shares are being offered.
The underwriting discount is equal to the public offering price per share of common stock less the amount paid by the underwriters to us and the selling stockholders per share of common stock. The underwriting discount is $ per share. The following table shows the per share and total underwriting discounts assuming both no exercise and full exercise of the underwriters’ option to purchase additional shares.
| Paid by Us | Paid by Selling Stockholders |
Total | ||||||||||
| No Exercise |
Full Exercise |
No Exercise |
Full Exercise |
No Exercise |
Full Exercise | |||||||
| Per Share |
$ | $ | $ | $ | $ | $ | ||||||
| Total |
||||||||||||
We estimate that the total expenses of this offering, including registration, filing and listing fees, printing fees and legal, accounting and other expenses, but excluding the underwriting discounts, will be approximately $ .
126
Table of Contents
A prospectus in electronic format may be made available on the websites maintained by one or more underwriters, or selling group members, if any, participating in the offering. The underwriters may agree to allocate a number of shares to underwriters and selling group members for sale to their online brokerage account holders. Internet distributions will be allocated by the representatives to underwriters and selling group members that may make Internet distributions on the same basis as other allocations.
We, our officers and directors and a substantial majority of the other holders of our equity securities have agreed that, without the prior written consent of the representatives, for a period of 180 days after the date of this prospectus, we will not (1) offer, pledge, sell, contract to sell, sell any option or contract to purchase, purchase any option or contract to sell, grant any option, right or warrant to purchase, or otherwise transfer or dispose of, directly or indirectly, any shares of our common stock or any securities convertible into or exercisable or exchangeable for common stock (including, without limitation, common stock or such other securities which may be deemed to be beneficially owned by officers, directors and holders of equity securities in accordance with the rules and regulations of the SEC and securities which may be issued upon exercise of a stock option or warrant), publicly disclose the intention to make any offer, sale, pledge or disposition, or, in our case, file or publicly disclose the intention to file a registration statement relating to any such shares or securities, (2) enter into any swap or other agreement that transfers, in whole or in part, any of the economic consequences of ownership of the common stock or such other securities (regardless of whether any of these transactions are to be settled by the delivery of common stock or such other securities, in cash or otherwise), or (3) in the case of our officers, directors and holders of our equity securities, make any demand for or exercise any right with respect to the registration of any shares of common stock or any security convertible into or exercisable or exchangeable for common stock.
The foregoing restrictions shall not apply to (A) in each case, the shares to be sold pursuant to the underwriting agreement, (B) in our case, any shares of stock issued upon the exercise of stock options granted under our equity compensation plans, and (C) in the case of our officers, directors and holders of our equity securities, (i) shares acquired in the public market after the close of our initial public offering, (ii) shares transferred by bona fide gift, will or intestacy, (iii) shares transferred to an immediate family member or a trust formed for the benefit of an immediate family member, (iv) shares transferred to a trustor or beneficiary of any trust, (v) distributions to members, partners, stockholders or other equity owners or (vii) distributions to wholly-owned subsidiaries or affiliated funds, provided that in the case of any transaction pursuant to clause (i) no filing by any party under the Securities Exchange Act of 1934, as amended (the “Exchange Act”), or other public announcement shall be required or shall be made voluntarily in connection with subsequent sales of common stock or other securities acquired in such open market transactions, and in the case of any transfer or distribution pursuant to clauses (ii) through (vii), each donee, distributee or transferee, as the case may be, shall execute and deliver to the representatives a lock-up letter, and there shall be no disposition for value and no filing by any party under the Exchange Act reporting a reduction in beneficial ownership of shares of common stock or other public announcement shall be required or shall be made voluntarily in connection with such transfer or distribution (other than a filing on a Form 5 made after the expiration of the 180-day period referred to above).
Notwithstanding the foregoing, if (1) during the last 17 days of the 180-day restricted period, we issue an earnings release or material news or a material event relating to our company occurs or (2) prior to the expiration of the 180-day restricted period, we announce that we will release earnings results during the 16-day period beginning on the last day of the 180-day period, the restrictions described above shall continue to apply until the expiration of the 18-day period beginning on the issuance of the earnings release or the occurrence of the material news or material event.
We and the selling stockholders have agreed to indemnify the underwriters against certain liabilities, including liabilities under the Securities Act of 1933, as amended (the “Securities Act”).
We have applied to list our common stock on The Nasdaq Global Market under the symbol “TPWR.”
In connection with this offering, the underwriters may engage in stabilizing transactions, which involves making bids for, purchasing and selling shares of common stock in the open market for the purpose of preventing
127
Table of Contents
or retarding a decline in the market price of the common stock while this offering is in progress. These stabilizing transactions may include making short sales of the common stock, which involves the sale by the underwriters of a greater number of shares of common stock than they are required to purchase in this offering, and purchasing shares of common stock on the open market to cover positions created by short sales. Short sales may be “covered” shorts, which are short positions in an amount not greater than the underwriters’ overallotment option referred to above, or may be “naked” shorts, which are short positions in excess of that amount. The underwriters may close out any covered short position either by exercising their overallotment option, in whole or in part, or by purchasing shares in the open market. In making this determination, the underwriters will consider, among other things, the price of shares available for purchase in the open market compared to the price at which the underwriters may purchase shares through the overallotment option. A naked short position is more likely to be created if the underwriters are concerned that there may be downward pressure on the price of the common stock in the open market that could adversely affect investors who purchase in this offering. To the extent that the underwriters create a naked short position, they will purchase shares in the open market to cover the position.
The underwriters have advised us that, pursuant to Regulation M of the Securities Act, they may also engage in other activities that stabilize, maintain or otherwise affect the price of the common stock, including the imposition of penalty bids. This means that if the representatives of the underwriters purchase common stock in the open market in stabilizing transactions or to cover short sales, the representatives can require the underwriters that sold those shares as part of this offering to repay the underwriting discount received by them.
These activities may have the effect of raising or maintaining the market price of the common stock or preventing or retarding a decline in the market price of the common stock, and, as a result, the price of the common stock may be higher than the price that otherwise might exist in the open market. If the underwriters commence these activities, they may discontinue them at any time. The underwriters may carry out these transactions on The Nasdaq Global Market, in the over-the-counter market or otherwise.
Prior to this offering, there has been no public market for our common stock. The initial public offering price will be determined by negotiations between us and the representatives of the underwriters. In determining the initial public offering price, we and the representatives of the underwriters expect to consider a number of factors including:
| • | the information set forth in this prospectus and otherwise available to the representatives; |
| • | an assessment of our management; |
| • | our prospects for future earnings; |
| • | the general condition of the securities markets at the time of this offering; |
| • | the recent market prices of, and demand for, publicly traded common stock of generally comparable companies; |
| • | our prospects and the history and prospects for the industry in which we compete; and |
| • | other factors deemed relevant by the underwriters and us. |
Neither we nor the underwriters can assure investors that an active trading market will develop for our common shares, or that the shares will trade in the public market at or above the initial public offering price.
Other than in the United States, no action has been taken by us or the underwriters that would permit a public offering of the securities offered by this prospectus in any jurisdiction where action for that purpose is required. The securities offered by this prospectus may not be offered or sold, directly or indirectly, nor may this prospectus or any other offering material or advertisements in connection with the offer and sale of any such securities be distributed or published in any jurisdiction, except under circumstances that will result in compliance with the applicable rules and regulations of that jurisdiction. Persons into whose possession this prospectus comes are advised to inform themselves about and to observe any restrictions relating to the offering and the distribution of this prospectus. This prospectus does not constitute an offer to sell or a solicitation of an offer to buy any securities offered by this prospectus in any jurisdiction in which such an offer or a solicitation is unlawful.
128
Table of Contents
This document is only being distributed to and is only directed at (i) persons who are outside the United Kingdom or (ii) to investment professionals falling within Article 19(5) of the Financial Services and Markets Act 2000 (Financial Promotion) Order 2005 (the “Order”) or (iii) high net worth entities, and other persons to whom it may lawfully be communicated, falling within Article 49(2)(a) to (d) of the Order (all such persons together being referred to as “relevant persons”). The securities are only available to, and any invitation, offer or agreement to subscribe, purchase or otherwise acquire such securities will be engaged in only with, relevant persons. Any person who is not a relevant person should not act or rely on this document or any of its contents.
In relation to each Member State of the European Economic Area which has implemented the Prospectus Directive (each a “Relevant Member State”), from and including the date on which the European Union Prospectus Directive (the “EU Prospectus Directive”) is implemented in that Relevant Member State (the “Relevant Implementation Date”), an offer of securities described in this prospectus may not be made to the public in that Relevant Member State prior to the publication of a prospectus in relation to the shares which has been approved by the competent authority in that Relevant Member State or, where appropriate, approved in another Relevant Member State and notified to the competent authority in that Relevant Member State, all in accordance with the EU Prospectus Directive, except that it may, with effect from and including the Relevant Implementation Date, make an offer of shares to the public in that Relevant Member State at any time:
| • | to legal entities which are authorized or regulated to operate in the financial markets or, if not so authorized or regulated, whose corporate purpose is solely to invest in securities; |
| • | to any legal entity which has two or more of (1) an average of at least 250 employees during the last financial year, (2) a total balance sheet of more than €43,000,000 and (3) an annual net turnover of more than €50,000,000, as shown in its last annual or consolidated accounts; |
| • | to fewer than 100 natural or legal persons (other than qualified investors as defined in the EU Prospectus Directive) subject to obtaining the prior consent of the book-running managers for any such offer; or |
| • | in any other circumstances which do not require the publication by the Issuer of a prospectus pursuant to Article 3 of the Prospectus Directive. |
For the purposes of this provision, the expression an “offer of securities to the public” in relation to any securities in any Relevant Member State means the communication in any form and by any means of sufficient information on the terms of the offer and the securities to be offered so as to enable an investor to decide to purchase or subscribe for the securities, as the same may be varied in that Member State by any measure implementing the EU Prospectus Directive in that Member State and the expression EU Prospectus Directive means Directive 2003/71/EC and includes any relevant implementing measure in each Relevant Member State.
Certain of the underwriters and their affiliates may provide from time to time in the future certain commercial banking, financial advisory, investment banking and other services for us and such affiliates in the ordinary course of their business, for which they may receive customary fees and commissions. In addition, from time to time, certain of the underwriters and their affiliates may effect transactions for their own account or the account of customers, and hold on behalf of themselves or their customers, long or short positions in our debt or equity securities or loans, and may do so in the future.
In addition, on February 25, 2010, one of our stockholders, Advanced Technology Ventures VIII, L.P., or ATV, acquired 150,000 shares of our common stock pursuant to a privately-negotiated transaction for an aggregate purchase price of $157,500. Persons affiliated with Needham & Company LLC, one of the underwriters of this offering, is a limited partner of ATV. Please read the section of this prospectus captioned “Description of Capital Stock” for additional information regarding our common stock. These shares are deemed to be an “item of value” by FINRA pursuant to FINRA Rule 5110(g)(1) and ATV has entered into a lock-up letter with respect to such shares as described above.
129
Table of Contents
Perkins Coie LLP, Portland, Oregon, which has acted as our counsel in connection with this offering, will pass upon the validity of the shares of common stock being offered by this prospectus. The underwriters have been represented by Wilson Sonsini Goodrich & Rosati, Professional Corporation, Seattle, Washington.
The consolidated financial statements of Tripwire, Inc. as of December 31, 2008 and 2009, and for each of the years in the three-year period ended December 31, 2009, have been included herein in reliance upon the report of KPMG LLP, independent registered public accounting firm, appearing elsewhere herein, and upon the authority of said firm as experts in accounting and auditing.
WHERE YOU CAN FIND MORE INFORMATION
We have filed with the SEC a registration statement on Form S-1 under the Securities Act with respect to the shares of common stock offered hereby. This prospectus, which constitutes a part of the registration statement, does not contain all of the information set forth in the registration statement or the exhibits filed therewith. For further information about us and the common stock offered hereby, reference is made to the registration statement and the exhibits filed therewith.
Statements contained in this prospectus regarding the contents of any contract or any other document that is filed as an exhibit to the registration statement are not necessarily complete, and each such statement is qualified in all respects by reference to the full text of such contract or other document filed as an exhibit to the registration statement. When we complete this offering, we will be required to file annual, quarterly and current reports, proxy statements and other information with the SEC. For further information about us and our common stock, you may inspect a copy of the registration statement and the exhibits and schedule to the registration statement without charge at the offices of the SEC at 100 F Street, N.E., Washington, D.C. 20549. You may obtain copies of all or any part of the registration statement from the Public Reference Section of the SEC, 100 F Street, N.E., Washington, D.C. 20549 upon the payment of the prescribed fees. You may obtain information on the operation of the Public Reference Room by calling the SEC at 1-800-SEC-0330. The SEC maintains a website at www.sec.gov that contains reports, proxy and information statements and other information regarding registrants like us that file electronically with the SEC. You can also inspect our registration statement on this website.
130
Table of Contents
INDEX TO CONSOLIDATED FINANCIAL STATEMENTS
| Page | ||
| F-2 | ||
| F-3 | ||
| F-4 | ||
| F-5 | ||
| F-6 | ||
| F-7 |
F-1
Table of Contents
Report of Independent Registered Public Accounting Firm
The Board of Directors and Stockholders of Tripwire, Inc.:
We have audited the accompanying consolidated balance sheets of Tripwire, Inc. and subsidiary (the Company) as of December 31, 2008 and 2009, and the related consolidated statements of operations, stockholders’ equity (deficit), and cash flows for each of the years in the three-year period ended December 31, 2009. These consolidated financial statements are the responsibility of the Company’s management. Our responsibility is to express an opinion on these consolidated financial statements based on our audits.
We conducted our audits in accordance with the standards of the Public Company Accounting Oversight Board (United States). Those standards require that we plan and perform the audit to obtain reasonable assurance about whether the financial statements are free of material misstatement. An audit includes examining, on a test basis, evidence supporting the amounts and disclosures in the financial statements. An audit also includes assessing the accounting principles used and significant estimates made by management, as well as evaluating the overall financial statement presentation. We believe that our audits provide a reasonable basis for our opinion.
In our opinion, the consolidated financial statements referred to above present fairly, in all material respects, the financial position of Tripwire, Inc. and subsidiary as of December 31, 2008 and 2009, and the results of their operations and their cash flows for each of the years in the three-year period ended December 31, 2009, in conformity with U.S. generally accepted accounting principles.
/s/ KPMG LLP
Portland, Oregon
May 28, 2010
F-2
Table of Contents
Consolidated Balance Sheets
(In thousands, except per share amounts)
| December 31, | June
30, 2010 |
Pro Forma Stockholders’ Equity as of June 30, 2010 |
||||||||||||||
| Assets | 2008 | 2009 | ||||||||||||||
| (unaudited) | (See note 1(d)) | |||||||||||||||
| Current assets: |
||||||||||||||||
| Cash and cash equivalents |
$ | 21,204 | $ | 31,986 | $ | 34,491 | ||||||||||
| Accounts receivable, net |
15,347 | 17,561 | 15,318 | |||||||||||||
| Deferred tax assets, net |
92 | 2,278 | 2,301 | |||||||||||||
| Other current assets |
1,174 | 1,391 | 3,617 | |||||||||||||
| Total current assets |
37,817 | 53,216 | 55,727 | |||||||||||||
| Property and equipment, net |
2,369 | 2,825 | 3,149 | |||||||||||||
| Deferred tax assets, net |
1,389 | 10,968 | 10,962 | |||||||||||||
| Other assets, net |
372 | 392 | 375 | |||||||||||||
| Intangible assets, net |
— | 1,106 | 896 | |||||||||||||
| Goodwill |
— | 1,745 | 1,745 | |||||||||||||
| Total assets |
$ | 41,947 | $ | 70,252 | $ | 72,854 | ||||||||||
| Liabilities, Convertible Redeemable Preferred Stock, and Stockholders’ Equity (Deficit) |
||||||||||||||||
| Current liabilities: |
||||||||||||||||
| Accounts payable |
$ | 969 | $ | 702 | $ | 806 | ||||||||||
| Accrued payroll expenses |
4,930 | 6,762 | 3,749 | |||||||||||||
| Deferred revenue |
18,119 | 22,743 | 22,934 | |||||||||||||
| Other current liabilities |
1,825 | 2,491 | 4,186 | |||||||||||||
| Total current liabilities |
25,843 | 32,698 | 31,675 | |||||||||||||
| Long-term deferred revenue |
2,681 | 4,022 | 5,249 | |||||||||||||
| Other long-term liabilities |
1,045 | 448 | 459 | |||||||||||||
| Total liabilities |
29,569 | 37,168 | 37,383 | |||||||||||||
| Commitments and contingencies (note 6) |
||||||||||||||||
| Convertible redeemable preferred stock, $0.001 par value. Aggregate liquidation preference over common stock of $63,457 at December 31, 2008; Authorized, 37,367 shares; issued and outstanding, 35,171 shares at December 31, 2008 |
34 | — | — | |||||||||||||
| Additional paid-in capital |
52,871 | — | — | |||||||||||||
| Total convertible redeemable preferred stock |
52,905 | — | — | |||||||||||||
| Stockholders’ equity (deficit): |
||||||||||||||||
| Convertible preferred stock, $0.001 par value. Aggregate liquidation preference over common stock of $63,457 and $64,607 at December 31, 2009 and June 30, 2010 (unaudited), respectively; Authorized, 37,367 shares; issued and outstanding, 35,171 and 35,836 shares at December 31, 2009 and June 30, 2010 (unaudited), respectively |
|
— |
|
|
34 |
|
|
35 |
|
|||||||
| Common stock, $0.001 par value. Authorized, 70,000 shares; issued and outstanding, 14,684 and 14,888 shares at December 31, 2008 and 2009 respectively, 16,081 at June 30, 2010 (unaudited) and 52,566 at June 30, 2010 (unaudited) on a pro forma basis |
15 | 15 | 16 | $ | 53 | |||||||||||
| Additional paid-in capital |
4,836 | 57,893 | 60,773 | 60,771 | ||||||||||||
| Additional paid-in capital—warrants |
259 | 1,196 | 222 | 222 | ||||||||||||
| Accumulated deficit |
(45,637 | ) | (26,054 | ) | (25,574 | ) | (25,574 | ) | ||||||||
| Total stockholders’ equity (deficit) |
(40,527 | ) | 33,084 | 35,472 | $ | 35,472 | ||||||||||
| Total liabilities, convertible redeemable preferred stock and stockholders’ equity (deficit) |
$ | 41,947 | $ | 70,252 | $ | 72,854 | ||||||||||
See accompanying notes to consolidated financial statements.
F-3
Table of Contents
Consolidated Statements of Operations
(In thousands, except per share amounts)
| Year Ended December 31, | Six Months Ended June 30, |
|||||||||||||||||||
| 2007 | 2008 | 2009 | 2009 | 2010 | ||||||||||||||||
| (unaudited) | ||||||||||||||||||||
| Revenue: |
||||||||||||||||||||
| Software licenses |
$ | 25,976 | $ | 32,480 | $ | 37,289 | $ | 15,580 | $ | 18,261 | ||||||||||
| Maintenance and professional services |
23,207 | 29,899 | 36,717 | 16,874 | 21,824 | |||||||||||||||
| Total revenue |
49,183 | 62,379 | 74,006 | 32,454 | 40,085 | |||||||||||||||
| Cost of revenue: |
||||||||||||||||||||
| Software licenses |
167 | 172 | 109 | 52 | 37 | |||||||||||||||
| Maintenance and professional services |
5,857 | 6,917 | 7,991 | 3,768 | 5,318 | |||||||||||||||
| Total cost of revenue |
6,024 | 7,089 | 8,100 | 3,820 | 5,355 | |||||||||||||||
| Gross profit |
43,159 | 55,290 | 65,906 | 28,634 | 34,730 | |||||||||||||||
| Operating expenses: |
||||||||||||||||||||
| Research and development |
9,868 | 12,618 | 12,550 | 6,433 | 7,100 | |||||||||||||||
| Sales and marketing |
28,640 | 32,391 | 39,130 | 17,262 | 22,796 | |||||||||||||||
| General and administrative |
5,016 | 6,062 | 5,627 | 2,392 | 4,229 | |||||||||||||||
| Total operating expenses |
43,524 | 51,071 | 57,307 | 26,087 | 34,125 | |||||||||||||||
| Income (loss) from operations |
(365 | ) | 4,219 | 8,599 | 2,547 | 605 | ||||||||||||||
| Other income (expense): |
||||||||||||||||||||
| Interest income, net |
460 | 341 | 83 | 68 | 13 | |||||||||||||||
| Other, net |
33 | (34 | ) | (76 | ) | 6 | (12 | ) | ||||||||||||
| Total other income (expense), net |
493 | 307 | 7 | 74 | 1 | |||||||||||||||
| Income (loss) before income taxes |
128 | 4,526 | 8,606 | 2,621 | 606 | |||||||||||||||
| Income tax benefit (expense) |
(147 | ) | 1,330 | 10,977 | (651 | ) | (126 | ) | ||||||||||||
| Net income (loss) |
(19 | ) | 5,856 | 19,583 | 1,970 | 480 | ||||||||||||||
| Accretion and allocation to participating preferred stock |
(485 | ) | (4,197 | ) | (13,868 | ) | (1,396 | ) | (337 | ) | ||||||||||
| Net income (loss) attributed to common stockholders |
$ | (504 | ) | $ | 1,659 | $ | 5,715 | $ | 574 | $ | 143 | |||||||||
| Net income (loss) per common share—basic |
$ | (0.03 | ) | $ | 0.11 | $ | 0.39 | $ | 0.04 | $ | 0.01 | |||||||||
| Net income (loss) per common share—diluted |
$ | (0.03 | ) | $ | 0.11 | $ | 0.32 | $ | 0.04 | $ | 0.01 | |||||||||
| Shares used in computation of net income (loss) per common share—basic |
14,434 | 14,516 | 14,762 | 14,726 | 15,449 | |||||||||||||||
| Shares used in computation of net income (loss) per common share—diluted |
14,434 | 14,963 | 18,119 | 15,101 | 22,422 | |||||||||||||||
See accompanying notes to consolidated financial statements.
F-4
Table of Contents
Consolidated Statements of Stockholders’ Equity (Deficit)
(In thousands)
| Preferred stock | Common stock | Additional Paid-in Capital |
Additional Paid-in Capital— Warrants |
Accumulated Deficit |
Total Stockholders’ Equity (Deficit) |
||||||||||||||||||||
| Shares | Amount | Shares | Amount | ||||||||||||||||||||||
| Balance at December 31, 2006 |
— | — | 14,366 | $ | 14 | $ | 4,337 | $ | 333 | $ | (50,908 | ) | $ | (46,224 | ) | ||||||||||
| Issuance of common stock from exercise of warrants |
— | — | 30 | — | 40 | (17 | ) | — | 23 | ||||||||||||||||
| Issuance of common stock from exercise of stock options |
— | — | 82 | — | 38 | — | — | 38 | |||||||||||||||||
| Stock compensation expense |
— | — | — | — | 143 | — | — | 143 | |||||||||||||||||
| Accretion of preferred stock redemption preference |
— | — | — | — | — | — | (485 | ) | (485 | ) | |||||||||||||||
| Net loss |
— | — | — | — | — | — | (19 | ) | (19 | ) | |||||||||||||||
| Balance at December 31, 2007 |
— | — | 14,478 | 14 | 4,558 | 316 | (51,412 | ) | (46,524 | ) | |||||||||||||||
| Expiration of common stock warrants |
— | — | — | — | 57 | (57 | ) | — | — | ||||||||||||||||
| Issuance of common stock from exercise of stock options |
— | — | 206 | 1 | 67 | — | — | 68 | |||||||||||||||||
| Stock compensation expense |
— | — | — | — | 154 | — | — | 154 | |||||||||||||||||
| Accretion of preferred stock redemption preference |
— | — | — | — | — | — | (81 | ) | (81 | ) | |||||||||||||||
| Net income |
— | — | — | — | — | — | 5,856 | 5,856 | |||||||||||||||||
| Balance at December 31, 2008 |
— | — | 14,684 | 15 | 4,836 | 259 | (45,637 | ) | (40,527 | ) | |||||||||||||||
| Value of warrants issued in association with acquisition |
— | — | — | — | — | 7 | — | 7 | |||||||||||||||||
| Issuance of common stock from exercise of stock options |
— | — | 204 | — | 35 | — | — | 35 | |||||||||||||||||
| Stock compensation expense |
— | — | — | — | 151 | — | — | 151 | |||||||||||||||||
| Expiration of preferred stock redemption provision |
35,171 | $ | 34 | — | — | 52,871 | 930 | — | 53,835 | ||||||||||||||||
| Net income |
— | — | — | — | — | — | 19,583 | 19,583 | |||||||||||||||||
| Balance at December 31, 2009 |
35,171 | 34 | 14,888 | 15 | 57,893 | 1,196 | (26,054 | ) | 33,084 | ||||||||||||||||
| Issuance of common stock from exercise of warrants (unaudited) |
— | — | 267 | — | 259 | (257 | ) | — | 2 | ||||||||||||||||
| Issuance of preferred stock from exercise of warrants (unaudited) |
665 | 1 | — | — | 1,867 | (717 | ) | — | 1,151 | ||||||||||||||||
| Issuance of common stock from exercise of stock options (unaudited) |
— | — | 926 | 1 | 481 | — | — | 482 | |||||||||||||||||
| Stock compensation expense (unaudited) |
— | — | — | — | 273 | — | — | 273 | |||||||||||||||||
| Net income (unaudited) |
— | — | — | — | — | — | 480 | 480 | |||||||||||||||||
| Balance at June 30, 2010 (unaudited) |
35,836 | $ | 35 | 16,081 | $ | 16 | $ | 60,773 | $ | 222 | $ | (25,574 | ) | $ | 35,472 | ||||||||||
See accompanying notes to consolidated financial statements.
F-5
Table of Contents
Consolidated Statements of Cash Flows
(In thousands)
| Year Ended December 31, | Six Months Ended June 30, |
|||||||||||||||||||
| 2007 | 2008 | 2009 | 2009 | 2010 | ||||||||||||||||
| (unaudited) | ||||||||||||||||||||
| Cash flows from operating activities: |
||||||||||||||||||||
| Net income (loss) |
$ | (19 | ) | $ | 5,856 | $ | 19,583 | $ | 1,970 | $ | 480 | |||||||||
| Adjustments to reconcile net income (loss) to net cash provided from operating activities: |
||||||||||||||||||||
| Depreciation and amortization |
735 | 904 | 1,241 | 547 | 869 | |||||||||||||||
| Provision for (recovery of) bad debts |
13 | 600 | (431 | ) | (364 | ) | 22 | |||||||||||||
| (Gain) loss on disposal of property and equipment |
16 | 54 | (5 | ) | (5 | ) | 4 | |||||||||||||
| Stock-based compensation |
143 | 154 | 151 | 71 | 273 | |||||||||||||||
| Gain on forgiveness of debt |
— | (225 | ) | — | — | — | ||||||||||||||
| Deferred tax expense (benefit) |
— | (1,481 | ) | (11,765 | ) | 244 | (17 | ) | ||||||||||||
| Changes in operating assets and liabilities (net of the effects of acquired business): |
||||||||||||||||||||
| Accounts receivable |
(3,727 | ) | (2,120 | ) | (1,783 | ) | 3,229 | 2,221 | ||||||||||||
| Other current assets |
38 | (468 | ) | (217 | ) | (348 | ) | (420 | ) | |||||||||||
| Accounts payable |
262 | 375 | (267 | ) | (180 | ) | 104 | |||||||||||||
| Deferred revenue |
2,851 | 6,650 | 5,966 | 882 | 1,418 | |||||||||||||||
| Other current liabilities |
1,331 | 1,835 | 2,497 | (1,230 | ) | (2,586 | ) | |||||||||||||
| Other, net |
(93 | ) | 7 | 259 | 318 | 17 | ||||||||||||||
| Net cash provided by operating activities |
1,550 | 12,141 | 15,229 | 5,134 | 2,385 | |||||||||||||||
| Cash flows from investing activities: |
||||||||||||||||||||
| Acquisition of a business |
— | — | (2,940 | ) | — | — | ||||||||||||||
| Purchases of property and equipment |
(746 | ) | (2,023 | ) | (1,605 | ) | (614 | ) | (989 | ) | ||||||||||
| Proceeds from disposal of property and equipment |
— | 1 | 63 | 57 | — | |||||||||||||||
| Net cash used in investing activities |
(746 | ) | (2,022 | ) | (4,482 | ) | (557 | ) | (989 | ) | ||||||||||
| Cash flows from financing activities: |
||||||||||||||||||||
| Proceeds from issuance of preferred stock |
— | — | — | — | 1,151 | |||||||||||||||
| Initial public offering preparation costs |
— | — | — | — | (526 | ) | ||||||||||||||
| Proceeds from issuance of common stock |
61 | 68 | 35 | 11 | 484 | |||||||||||||||
| Net cash provided by financing activities |
61 | 68 | 35 | 11 | 1,109 | |||||||||||||||
| Increase in cash and cash equivalents |
865 | 10,187 | 10,782 | 4,588 | 2,505 | |||||||||||||||
| Cash and cash equivalents at beginning of period |
10,152 | 11,017 | 21,204 | 21,204 | 31,986 | |||||||||||||||
| Cash and cash equivalents at end of period |
$ | 11,017 | $ | 21,204 | $ | 31,986 | $ | 25,792 | $ | 34,491 | ||||||||||
| Supplemental disclosure of cash flow information: |
||||||||||||||||||||
| Cash paid for taxes |
$ | 113 | $ | 195 | $ | 536 | $ | 112 | $ | 150 | ||||||||||
| Supplemental disclosures of noncash financing and investing activities: |
||||||||||||||||||||
| Accretion of preferred stock redemption preference |
$ | 485 | $ | 81 | — | — | — | |||||||||||||
| Warrants issued in business combination |
— | — | $ | 7 | — | — | ||||||||||||||
| Initial public offering preparation costs |
— | — | — | — | $ | 1,279 | ||||||||||||||
See accompanying notes to consolidated financial statements.
F-6
Table of Contents
Notes to Consolidated Financial Statements
December 31, 2008 and 2009
and June 30, 2010 (unaudited)
(1) Basis of Presentation
(a) Description of the Company
Tripwire, Inc. (Tripwire or the Company) provides IT security and compliance automation software solutions that help protect physical and virtual IT infrastructure, prove compliance, and prevent outages for enterprises and government agencies. The Company’s Tripwire VIA software suite, which integrates the Tripwire Enterprise and Tripwire Log Center product families, facilitates continuous protection against security threats and ongoing compliance with growing regulatory requirements. The Company’s flagship product, Tripwire Enterprise, helps organizations to achieve and maintain a secure and compliant IT infrastructure by immediately detecting, assessing and reporting file and configuration changes. Tripwire Log Center, the Company’s recently-introduced log and security event management solution, helps organizations detect security breaches and compliance violations by performing real-time correlation analysis on high volumes of disparate log and security data and efficiently stores the data for reporting and compliance purposes. Tripwire is headquartered in Portland, Oregon.
(b) Consolidated Financial Statements
The consolidated financial statements include the accounts of Tripwire and its wholly owned subsidiary. All intercompany accounts and transactions have been eliminated. Certain reclassifications have been made in the accompanying consolidated financial statements for December 31, 2007 and 2008 to conform to the presentation at December 31, 2009.
(c) Unaudited Interim Financial Information
The accompanying interim consolidated balance sheet as of June 30, 2010, the interim consolidated statements of operations and cash flows for the six months ended June 30, 2009 and 2010 and the consolidated statement of stockholders’ equity (deficit) for the six months ended June 30, 2010 are unaudited. The unaudited interim consolidated financial statements have been prepared on the same basis as the annual consolidated financial statements and, in the opinion of management, reflect all adjustments, which include only normal recurring adjustments, necessary to present fairly the Company’s consolidated financial position as of June 30, 2010 and its consolidated results of operations and its consolidated cash flows for the six months ended June 30, 2009 and 2010. The consolidated results of operations for the six months ended June 30, 2010 are not necessarily indicative of the results to be expected for the year ended December 31, 2010 or for any other interim period or for any other future year.
(d) Unaudited Pro Forma Stockholders’ Equity (Deficit)
The Company has filed a registration statement with the U.S. Securities and Exchange Commission to sell shares of its common stock to the public. All of the convertible preferred stock outstanding will convert into approximately 36.5 million shares of common stock based on the shares of convertible preferred stock outstanding as of June 30, 2010, upon completion of the Company’s initial public offering (IPO). Unaudited pro forma stockholders’ equity (deficit) as adjusted for the assumed conversion of the convertible preferred stock is set forth in the accompanying unaudited consolidated balance sheets.
(e) Use of Estimates
The preparation of consolidated financial statements in conformity with U.S. generally accepted accounting principles (GAAP) requires management to make estimates and assumptions that affect the reported amounts of
F-7
Table of Contents
TRIPWIRE, INC.
Notes to Consolidated Financial Statements—(Continued)
December 31, 2008 and 2009
and June 30, 2010 (unaudited)
assets and liabilities and disclosure of contingent assets and liabilities at the date of the consolidated financial statements and the reported amounts of revenue and expenses during the reporting period. Significant items subject to such estimates and assumptions include revenue recognition, valuation of accounts receivable, stock-based compensation expense, and the valuation of deferred tax assets, as they require a higher degree of judgment in their application. The current economic environment has increased the degree of uncertainty inherent in those estimates and assumptions. Actual results could differ from those estimates.
(2) Summary of Significant Accounting Policies
(a) Cash and Cash Equivalents
Cash and cash equivalents consist of cash on hand, money market funds and other highly liquid investment with original maturities of three months or less.
(b) Accounts Receivable and Allowance for Doubtful Accounts
Accounts receivable are recorded at the invoiced amount and do not bear interest. The allowance for doubtful accounts is the Company’s best estimate of the amount of probable credit losses in the Company’s existing accounts receivable. The Company determines the allowance for doubtful accounts based on historical write-off experience and the current composition of receivables. The Company reviews its allowance for doubtful accounts regularly. Past due balances are reviewed individually for collectibility. Account balances are written off against the allowance for doubtful accounts after reasonable means of collection have been exhausted and the potential for recovery is considered remote. The Company does not have any off-balance sheet credit exposure related to its customers.
The following table reflects activity in the allowance for doubtful accounts for 2007, 2008, and 2009 and for the six months ended June 30, 2010 (in thousands):
| Period |
Balance at Beginning of Period |
Additions Charged / (Reductions Credited) |
Deductions (1) |
Balance at End of Period | ||||||||||
| 2007 |
$ | 157 | $ | (58 | ) | $ | 71 | $ | 170 | |||||
| 2008 |
$ | 170 | $ | 534 | $ | 66 | $ | 770 | ||||||
| 2009 |
$ | 770 | $ | (161 | ) | $ | (270 | ) | $ | 339 | ||||
| Six months ended June 30, 2010 (unaudited) |
$ | 339 | $ | 39 | (17 | ) | $ | 361 | ||||||
| (1) | Uncollectable amounts written-off, net of recoveries. |
(c) Fair Value of Financial Instruments
The fair value of financial instruments is the amount at which the instrument could be exchanged in a current transaction between willing parties, other than in a forced or liquidation sale. The carrying amounts reflected in the consolidated balance sheets for cash and cash equivalents, trade receivables and accounts payable approximate fair value because of the short maturity for these instruments.
On January 1, 2008, the Company adopted the provisions of Financial Accounting Standards Board (FASB) Statement No. 157, Fair Value Measurements (Statement 157), included in Accounting Standards Codification (ASC) Topic 820, Fair Value Measurements and Disclosures, for the fair value measurements of
F-8
Table of Contents
TRIPWIRE, INC.
Notes to Consolidated Financial Statements—(Continued)
December 31, 2008 and 2009
and June 30, 2010 (unaudited)
financial assets and liabilities. Statement 157 defines fair value as the price that would be received to sell an asset or paid to transfer a liability in an orderly transaction between market participants at the measurement date. Statement 157 also establishes a framework for measuring fair value and expands disclosures about fair value measurements.
The Company measures and reports its investments in money market funds at fair value on a recurring basis. The fair value of the Company’s investments in money market funds approximates their face value. Such instruments are classified as Level 1 and are included in cash and cash equivalents.
The following table summarizes the Company’s financial assets measured at fair value on a recurring basis (in thousands):
| Fair Value Measurements Using | ||||||||||
| Total Fair Value |
Quoted prices in Active Markets for Identical Assets (Level 1) (1) |
Significant Other Observable Inputs (Level 2) (2) |
Significant Other Unobservable Inputs (Level 3) (3) | |||||||
| Assets: |
||||||||||
| Money Market Funds: |
||||||||||
| December 31, 2008 |
$ | 10,796 | $ | 10,796 | — | — | ||||
| December 31, 2009 |
$ | 21,703 | $ | 21,703 | — | — | ||||
| June 30, 2010 (unaudited) |
$ | 27,714 | $ | 27,714 | — | — | ||||
| (1) | Level 1: Observable inputs that reflect quoted prices (unadjusted) for identical assets or liabilities in active markets. |
| (2) | Level 2: Inputs reflect quoted prices for identical assets or liabilities in markets that are not active; quoted prices for similar assets or liabilities in active markets; inputs other than quoted prices that are observable for assets or liabilities; or inputs that are derived principally from or corroborated by observable market data by correlation or other means. |
| (3) | Level 3: Unobservable inputs reflecting the Company’s own assumptions incorporated in valuation techniques used to determine fair value. These assumptions are required to be consistent with market participant assumptions that are reasonably available. |
On January 1, 2009, the Company adopted the provisions of Statement 157 related to fair value measurements of nonfinancial assets and liabilities that are recognized or disclosed at fair value in the financial statements on a nonrecurring basis.
(d) Concentrations of Credit Risk and Business Risk
Financial instruments, which potentially subject the Company to concentrations of credit risk, consist of cash and cash equivalents and accounts receivable. The Company holds its cash and cash equivalents with high credit quality financial institutions. The Company’s cash balances with these financial institutions may exceed deposit insurance limits. Accounts receivables are with customers in many industries dispersed across a wide geographic base. Credit losses, when realized, have been within the range of management’s expectations.
No customers accounted for more than 10% of Tripwire’s consolidated revenue for the years ended December 31, 2007, 2008 or 2009 or for the six months ended June 30, 2009 or 2010 (unaudited). No customers accounted for more than 10% of the accounts receivable balance at December 31, 2008 or 2009 or June 30, 2010 (unaudited).
F-9
Table of Contents
TRIPWIRE, INC.
Notes to Consolidated Financial Statements—(Continued)
December 31, 2008 and 2009
and June 30, 2010 (unaudited)
The majority of the Company’s revenue is derived from sales of the Tripwire Enterprise product and related services, and the Company expects this to continue for the foreseeable future. As a result, although the Company has recently introduced the Tripwire Log Center product, the Company expects that its revenue and operating results will continue to depend significantly on demand for the Tripwire Enterprise product. Demand for the Tripwire Enterprise product is affected by a number of factors, some of which are beyond the Company’s control, including the timing of development and release of new products by the Company and its competitors, technological change, lower-than-expected growth or a contraction in the worldwide market for IT security and compliance automation solutions and other risks. If the Company is unable to generate and respond to demand for its products or create products that meet changing customer needs, its consolidated financial condition, results of operations and liquidity could be adversely affected.
(e) Property and Equipment
Property and equipment are stated at cost, net of accumulated depreciation and amortization. Property and equipment under capital leases are stated at the present value of minimum lease payments.
Depreciation of property and equipment is calculated utilizing the straight-line method over the estimated useful lives of the assets, which is generally three to five years. Leasehold improvements and assets under lease arrangements are amortized over the shorter of the lease term or the estimated useful lives of the assets. Repairs and maintenance costs are expensed as incurred.
(f) Internal Use Software
Costs incurred for internal use software in the preliminary project stage are expensed as incurred and costs incurred in the application development stage, which meet the capitalization criteria, are capitalized, and amortized on a straight-line basis over the estimated useful life of the asset, typically three years. For the years ended December 31, 2007, 2008 and 2009, no internally developed software costs were capitalized.
(g) Software Development Costs
Software development costs are capitalized beginning when a product’s technological feasibility has been established by completion of a detailed program design or working model of the product and ending when a product is available for general release to customers. To date, the establishment of technological feasibility has substantially coincided with the timing of the product’s general release. As a result, the Company has not capitalized any software development costs and has charged all such costs to research and development expense in the period incurred.
(h) Impairment of Long-Lived Assets
Long-lived assets, such as property, plant, and equipment, and purchased intangible assets subject to amortization, are reviewed for impairment whenever events or changes in circumstances indicate that the carrying amount of an asset may not be recoverable. If circumstances require a long-lived asset be tested for possible impairment, the Company first compares undiscounted cash flows expected to be generated by an asset to the carrying value of the asset. If the carrying value of the long-lived asset is not recoverable on an undiscounted cash flow basis, an impairment is recognized to the extent that the carrying value exceeds its fair value. Fair value is determined through various valuation techniques, including discounted cash flow models, quoted market values and third-party independent appraisals, depending on the nature of the asset. No impairment losses were recorded in 2007, 2008 or 2009.
F-10
Table of Contents
TRIPWIRE, INC.
Notes to Consolidated Financial Statements—(Continued)
December 31, 2008 and 2009
and June 30, 2010 (unaudited)
(i) Goodwill
Goodwill is reviewed for impairment at least annually. The goodwill impairment test is a two-step test. Under the first step, the fair value of the reporting unit is compared with its carrying value including goodwill. If the fair value of the reporting unit is less than its carrying value, an indication of goodwill impairment exists for the reporting unit and the enterprise must perform step two of the impairment test (measurement). Under step two, an impairment loss is recognized for any excess of the carrying amount of the reporting unit’s goodwill over the implied fair value of that goodwill. The implied fair value of goodwill is determined by allocating the fair value of the reporting unit in a manner similar to a purchase price allocation and the residual fair value after this allocation is the implied fair value of the reporting unit goodwill. Fair value of the reporting unit is determined using a discounted cash flow analysis. If the fair value of the reporting unit exceeds its carrying value, step two does not need to be performed.
The Company performs its annual impairment review of goodwill during the fourth quarter of each year or when a triggering event occurs between annual impairment tests. No impairment loss was recorded in 2009.
(j) Income Taxes
The Company accounts for income taxes using the asset and liability method. Under this approach, deferred tax assets and liabilities are recognized for the future tax consequences attributable to differences between financial statement carrying amounts of existing assets and liabilities and their respective tax bases. Deferred tax assets and liabilities are measured using enacted tax rates expected to apply to taxable income in the years in which those temporary differences are expected to be recovered or settled. The effect on deferred tax assets and liabilities resulting from a change in tax rates is recognized in income in the period that includes the enactment date.
The Company adopted FASB Interpretation No. 48, Accounting for Uncertainty in Income Taxes, included in ASC Subtopic 740-10, Income Taxes—Overall, as of January 1, 2009. Prior to adoption, the Company recognized the effect of income tax positions only if such positions were probable of being sustained. In accordance with the interpretation, the Company now recognizes the effect of income tax positions only if those positions are more likely than not of being sustained. Recognized income tax positions are measured at the largest amount that is greater than 50% likely of being realized. Changes in recognition or measurement are reflected in the period in which the change in judgment occurs. There was no impact of adopting this interpretation on the Company’s consolidated financial statements.
(k) Revenue Recognition and Deferred Revenue
The Company recognizes revenue according to the provisions of the FASB’s guidance on software revenue recognition. Revenue is reported net of taxes collected and remitted to government authorities.
Software license revenue is recognized when persuasive evidence of an arrangement exists, delivery of the product has occurred, the fee is fixed or determinable, collection is probable and vendor-specific objective evidence (VSOE) of the fair value of undelivered elements exists. As substantially all of the software licenses are sold in multiple-element arrangements that include either maintenance or both maintenance and professional services, the Company uses the residual method to determine the amount of license revenue to be recognized. Under the residual method, consideration is allocated to undelivered elements based upon VSOE of the fair value of those elements, with the residual of the arrangement fee allocated to and recognized as license revenue. The
F-11
Table of Contents
TRIPWIRE, INC.
Notes to Consolidated Financial Statements—(Continued)
December 31, 2008 and 2009
and June 30, 2010 (unaudited)
Company has established VSOE of the fair value of maintenance and remote ongoing operational services based on contractually stated renewal rates, provided such rates are substantive. These demonstrate a consistent relationship of pricing maintenance as a percentage of the license fee. VSOE of the fair value of professional services is established based on daily rates when sold on a stand-alone basis.
Software license revenue is generally recognized upon the delivery of the software if all revenue recognition criteria are met. Estimated sales returns and allowances are recorded upon shipment of the product. The Company generally accepts returns within 90 days of original sale. The allowance for sales returns was $0.1 million at December 31, 2008 and 2009 and at June 30, 2010 (unaudited).
In addition to direct sales, the Company sells its products through distributors and resellers. Distributor agreements offer expanded rights of return, including stock rotation rights and price protection, beyond the Company’s normal agreements and, as such, the Company recognizes revenue upon sale from the distributor to the end user in these arrangements.
Revenue allocated to support services under our maintenance contracts, which gives the subscriber the rights to obtain unspecified updates and enhancements on a when- and if-available basis, as well as remote ongoing operational services, is paid in advance and is recognized ratably over the term of the service. Professional services generally consist of installation and training services and are not essential to the functionality of the software. Revenue allocated to professional services, including remote implementation services, is recognized as the services are performed.
Deferred revenue consists of amounts received or receivable from customers for maintenance and professional services for which the earnings process is incomplete.
(l) Segment Information
The Company operates exclusively in one segment. All revenue results from the sale of software product licenses and related maintenance and professional services within the security and compliance automation markets.
(m) Research and Development
Expenditures for research and development are expensed as incurred.
(n) Advertising Costs
Advertising costs are expensed as incurred and totaled $0.6 million, $0.6 million and $3.7 million for the years ended December 31, 2007, 2008 and 2009, respectively.
(o) Stock-Based Compensation
The Company sponsors stock incentive plans that allow for issuance of employee stock options. The Company recognizes expense for share-based awards based on the grant date fair value of stock option awards granted. The fair values of the Company stock option grants are estimated as of the grant date using the Black-Scholes option valuation model, which is affected by the Company’s estimates of the risk-free interest rate, the Company’s expected dividend yield, the expected term of the awards and the expected share price volatility of the Company’s common shares over the term of the awards. See Note 7.
F-12
Table of Contents
TRIPWIRE, INC.
Notes to Consolidated Financial Statements—(Continued)
December 31, 2008 and 2009
and June 30, 2010 (unaudited)
(p) Foreign Currency Transactions
The functional currency for the Company’s foreign subsidiary is the U.S. dollar. As a result, the Company remeasures its foreign subsidiary balance sheets and operating accounts into U.S. dollars. Nonmonetary balance sheet items are remeasured at historical rates and monetary balance sheet items are remeasured at current rates. Exchange gains and losses from remeasurement of monetary assets and liabilities are recognized in the consolidated statement of operations in other income (expense). Net exchange losses of $0.2 million, $0.1 million and $0.1 million were recognized for the years ended December 31, 2008 and 2009 and the six months ended June 30, 2010 (unaudited), respectively. There were no material net exchange gains or losses recorded in the year ended December 31, 2007. The Company has not purchased forward exchange contracts or other derivative instruments related to this foreign currency risk.
(q) Net Income (Loss) Per Share
The Company allocated net income (loss) available to common stockholders, after a deduction for preferred stock accretion, to common and convertible redeemable preferred stock based on their respective rights to receive dividends, whether or not distributed. For periods in which the Company has reported net losses, diluted net loss per common share is the same as basic net loss per common share, since the Company’s preferred stock does not participate in losses. The Company’s outstanding stock options and warrants are not considered participating securities as they do not participate in dividends until exercised. Net income (loss) per common share is computed using the weighted average number of shares of unrestricted common stock outstanding for the period. Diluted net income (loss) per common share also includes the weighted average number of shares of unrestricted common stock and dilutive potential common stock outstanding during the year. Potentially dilutive securities from stock options, warrants and other common stock equivalents are excluded from the computation when their effect is antidilutive. The following represents a reconciliation of basic earnings per share to diluted earnings per share for 2007, 2008 and 2009 and the six months ended June 30, 2009 and 2010 (in thousands, except per share amounts):
| Year Ended December 31, | Six Months Ended June 30, |
|||||||||||||||||||
| 2007 | 2008 | 2009 | 2009 | 2010 | ||||||||||||||||
| (unaudited) | ||||||||||||||||||||
| Net income (loss) |
$ | (19 | ) | $ | 5,856 | $ | 19,583 | $ | 1,970 | $ | 480 | |||||||||
| Accretion and allocation to participating preferred stock |
(485 | ) | (4,197 | ) | (13,868 | ) | (1,396 | ) | (337 | ) | ||||||||||
| Net income (loss) attributable to common stockholders |
$ | (504 | ) | $ | 1,659 | $ | 5,715 | $ | 574 | $ | 143 | |||||||||
| Weighted average common shares outstanding: |
||||||||||||||||||||
| Basic |
14,434 | 14,516 | 14,762 | 14,726 | 15,449 | |||||||||||||||
| Effect of dilutive securities: |
||||||||||||||||||||
| Options to purchase common stock |
— | 248 | 3,125 | 169 | 6,966 | |||||||||||||||
| Warrants to purchase common stock |
— | 199 | 232 | 206 | 7 | |||||||||||||||
| Diluted |
14,434 | 14,963 | 18,119 | 15,101 | 22,422 | |||||||||||||||
| Net income (loss) per common share: |
||||||||||||||||||||
| Basic |
$ | (0.03 | ) | $ | 0.11 | $ | 0.39 | $ | 0.04 | $ | 0.01 | |||||||||
| Diluted |
$ | (0.03 | ) | $ | 0.11 | $ | 0.32 | $ | 0.04 | $ | 0.01 | |||||||||
F-13
Table of Contents
TRIPWIRE, INC.
Notes to Consolidated Financial Statements—(Continued)
December 31, 2008 and 2009
and June 30, 2010 (unaudited)
Potentially dilutive securities that were not included in the diluted net income (loss) per common share calculations for 2007, 2008 and 2009 and for the six months ended June 30, 2009 and 2010 (unaudited) because they are antidilutive are as follows (in thousands):
| Year Ended December 31, | Six Months Ended | |||||||||
| 2007 | 2008 | 2009 | 2009 | 2010 | ||||||
| (unaudited) | ||||||||||
| Stock options |
12,068 | 12,413 | 937 | 12,579 | 1,042 | |||||
| Stock warrants |
896 | 843 | 974 | 774 | 280 | |||||
| Preferred stock common equivalents |
35,818 | 35,818 | 35,818 | 35,818 | 36,485 | |||||
| Total |
48,782 | 49,074 | 37,729 | 49,171 | 37,807 | |||||
(r) Comprehensive Income (Loss)
Comprehensive income (loss) is equal to net income for the years ended December 31, 2007, 2008 and 2009 and for the six months ended June 30, 2009 and 2010 (unaudited). As such, no separate statement of comprehensive income has been presented.
(3) Activeworx, Inc. Purchase Agreement
In August 2009, the Company purchased certain assets and assumed certain liabilities from certain parties, including Activeworx, Inc., for total consideration of $2.9 million consisting of $2.9 million cash and 200,000 common stock warrants with an immaterial fair value on the date of acquisition. The Company computed the value of the warrants using the Black-Scholes option valuation methodology and the following weighted-average assumptions:
| Risk-free interest rate |
1.65 | % | |
| Contractual life (years) |
3 | ||
| Volatility |
49 | % | |
| Expected dividend yield |
— |
The separate results of operations for the acquisition for the year ended December 31, 2009 were not material compared to the Company’s overall results of operations, and accordingly, pro forma financial statements have been omitted. Additionally, the costs of acquisition were immaterial and expensed as incurred.
The total purchase price of the acquisition has been allocated to the fair value of assets acquired and liabilities assumed, based on their estimated fair values at the acquisition date, with the amount in excess of the fair values recorded as goodwill. Goodwill relates primarily to acquired software, which in combination with the Company’s existing technology, creates a differentiated suite of security and compliance software.
F-14
Table of Contents
TRIPWIRE, INC.
Notes to Consolidated Financial Statements—(Continued)
December 31, 2008 and 2009
and June 30, 2010 (unaudited)
The following table summarizes the fair values of the Activeworx assets acquired and liabilities assumed as of the acquisition date (in thousands):
| Useful Life (months) |
Fair Value | ||||
| Assets acquired: |
|||||
| Purchased software |
36 | $ | 844 | ||
| Noncompete covenant |
36 | 412 | |||
| Goodwill |
n/a | 1,745 | |||
| 3,001 | |||||
| Liabilities assumed: |
|||||
| Deferred revenue |
54 | ||||
| Total purchase price |
$ | 2,947 | |||
Definite-lived intangible assets and the related accumulated amortization at December 31, 2009 were as follows:
| Useful Life (months) |
December 31, 2009 |
|||||
| Purchased software |
36 | $ | 844 | |||
| Noncompete covenant |
36 | 412 | ||||
| 1,256 | ||||||
| Accumulated amortization |
(150 | ) | ||||
| $ | 1,106 | |||||
Amortization of definite-lived intangible assets is being recorded on a straight-line basis. Amortization expense recorded in 2009 and for the six months ended June 30, 2010 (unaudited) totaled $0.2 million and $0.2 million, respectively. These assets are expected to amortize as follows (in thousands):
| Intangible Asset Amortization | |||
| Year ending December 31: |
|||
| 2010 |
$ | 419 | |
| 2011 |
419 | ||
| 2012 |
268 | ||
| $ | 1,106 | ||
Goodwill is not amortizable for book purposes, but is being amortized over 15 years for tax purposes due to the nature of the acquisition.
F-15
Table of Contents
TRIPWIRE, INC.
Notes to Consolidated Financial Statements—(Continued)
December 31, 2008 and 2009
and June 30, 2010 (unaudited)
(4) Property and Equipment
Property and equipment consist of the following (in thousands):
| December 31, | ||||||||
| 2008 | 2009 | |||||||
| Equipment |
$ | 3,432 | $ | 4,202 | ||||
| Furniture and fixtures |
840 | 929 | ||||||
| Software |
784 | 1,087 | ||||||
| Leasehold improvements |
494 | 579 | ||||||
| Capital projects in progress |
— | 190 | ||||||
| 5,550 | 6,987 | |||||||
| Less accumulated depreciation |
(3,181 | ) | (4,162 | ) | ||||
| Property and equipment, net |
$ | 2,369 | $ | 2,825 | ||||
Depreciation expense totaled $0.7 million, $0.8 million, $1.1 million and $0.7 million in 2007, 2008, 2009 and the six months ending June 30, 2010 (unaudited), respectively.
(5) Long-Term Obligations
Portland Development Commission Loan
On June 26, 2006, the Company entered into an agreement with the Economic Development Department of the Portland Development Commission pursuant to which the Company received a loan of $0.2 million. The purpose of the loan was to provide an incentive for employers to locate and hire employees in the central city. The loan was forgiven in full by the Portland Development Commission on December 31, 2008. The gain related to the forgiveness of this debt was recorded as a component of other income (expense).
Line of Credit
The Company has a revolving credit facility in the amount of $5.0 million that is currently scheduled to expire on August 20, 2010. Amounts outstanding under the facility accrue interest at a per annum rate equal to the greater of 4% and the lender’s prime rate, which was 4.0% as of December 31, 2009. The credit facility is secured by a lien on substantially all of the Company’s assets and is subject to customary covenants for facilities of this type, including covenants limiting debt incurrence, liens, investments, asset sales and mergers. The revolving credit facility also includes financial covenants requiring an adjusted quick ratio (as defined) of 1.5 to 1.0 and tangible net worth (as defined) of $3.0 million plus 50% of our quarterly positive net income recorded subsequent to June 30, 2009. As of December 31, 2009 and June 30, 2010 (unaudited), we were in compliance with all covenants, and there was no principal amount outstanding under the credit facility.
(6) Commitments and Contingencies
(a) Leases
In December 2008, the Company entered into a non-cancelable operating lease agreement for its principal executive offices in Portland, Oregon with an initial term ending April 2014. Under the terms of the lease agreement, lease payments began in May 2009 and escalate at specific points over the term of the lease. In December 2009, the lease agreement was amended to expand the leased square footage by approximately 30% and the Company expects to take possession of the expanded space at the end of July 2010. The Company also
F-16
Table of Contents
TRIPWIRE, INC.
Notes to Consolidated Financial Statements—(Continued)
December 31, 2008 and 2009
and June 30, 2010 (unaudited)
leases sales offices in the United States, Europe, and Asia under non-cancelable operating leases with terms expiring through 2011. Rent expense is recognized on a straight-line basis, including any rent abatement periods. Future minimum lease payments were as follows as of December 31, 2009 (in thousands):
| Operating Leases | |||
| Year ending December 31: |
|||
| 2010 |
$ | 1,632 | |
| 2011 |
1,446 | ||
| 2012 |
1,310 | ||
| 2013 |
1,349 | ||
| 2014 |
449 | ||
| Thereafter |
— | ||
| $ | 6,186 | ||
Total rent expense under these agreements was $0.8 million, $1.0 million and $1.2 million for the years ended December 31, 2007, 2008 and 2009, respectively.
(b) Legal Proceedings
From time to time, the Company may be subject to legal proceedings and claims in the ordinary course of business. In such cases it is the Company’s policy to defend against such claims, or if considered appropriate, negotiate a settlement on commercially reasonable terms. However, no assurance can be given that the Company will be able to negotiate settlements on commercially reasonable terms, or at all, or that any litigation resulting from such claims would not materially harm the Company’s business, operating results or financial position. The Company is not currently a party to any legal proceeding that it believes to be material.
(c) Deferred Contribution Plan
The Company sponsors a 401(k) deferred savings plan for all employees. Employees become eligible to participate in the plan upon employment. Employees may contribute up to 15% of their pay to the plan, subject to limitations established by the Internal Revenue Code. All employee contributions vest immediately. The Company may make discretionary contributions to the plan. The Company made contributions of $0.3 million, $0.4 million and $0.5 million to the plan in 2007, 2008 and 2009, respectively.
(d) Indemnification and Warranties
The Company’s product license and services agreements include a limited indemnification provision for claims from third parties relating to the Company’s intellectual property. The indemnification is limited to the amount paid by the customer. To date, claims under such indemnification provisions have not been significant.
The Company is required by its by-laws to indemnify directors and officers, and may indemnify other employees and agents, for liabilities arising out of their relationship with the Company and may enter into contracts under which it agrees to indemnify these persons for liabilities arising out such relationships.
In the event that an indemnification claim is made against the Company, an adverse outcome, including a judgment or settlement, may cause a material adverse effect on the Company’s future business, operating results or financial condition. It is not possible to determine the maximum potential amount under these indemnification
F-17
Table of Contents
TRIPWIRE, INC.
Notes to Consolidated Financial Statements—(Continued)
December 31, 2008 and 2009
and June 30, 2010 (unaudited)
agreements due to the limited history of prior indemnification claims and the unique facts and circumstances involved in each particular agreement.
The Company generally provides a warranty for its products and services. To date, the Company’s product warranty expense has not been significant, and accordingly, no warranty reserve is maintained.
(7) Stock Options
(a) Employee Stock Options
1998 Stock Option Plan—In 1998, the Company’s board of directors adopted the Company’s 1998 Stock Option Plan (1998 Plan). Under the 1998 Plan, the Company was authorized to grant options and make equity-based awards to employees, directors and other service providers. The 1998 Plan is no longer in effect, but continues to govern stock options granted pursuant to the 1998 Plan.
2000 Stock Option/Stock Issuance Plan—In 2000, the Company’s board of directors adopted the Company’s 2000 Stock Option/Stock Issuance Plan (2000 Plan). Under the 2000 Plan, the Company may grant options and make equity-based awards to employees, directors and other service providers. At December 31, 2009, the Company had reserved a total of 16,215,000 shares of its common stock for issuance under the 2000 Plan. At December 31, 2009, the Company had options covering approximately 2,168,000 shares of common stock available for grant under the 2000 Plan.
Under the 1998 Plan, the Company was authorized to grant, and under the 2000 Plan the Company may grant, options to purchase shares of common stock at prices not less than the fair market value on the grant date for incentive stock options and not less than 85% of the fair market value for nonstatutory options. Stock options granted to a person who, at the time of the grant, owns more than 10% of the voting power of all classes of the Company’s stock, must have an exercise price of at least 110% of the fair market value of the common stock on the grant date and expire five years from the grant date. All other stock options generally have a contractual term of 10 years. Outstanding stock options under the 1998 Plan and 2000 Plan (collectively, the Plans) generally vest over four years. The Company currently uses authorized and unissued shares to satisfy stock option exercises. Upon an employee’s termination of service with the Company, all unvested stock options for the terminated individual are forfeited, and any vested stock options generally must be exercised within three months of the termination date or be forfeited.
The Company applies FASB ASC Topic 718, Compensation—Stock Compensation, in accounting for stock options granted, modified, or canceled after January 1, 2006 to employees under the Plans. The fair value of each stock option is estimated on the date of grant using the Black-Scholes option-pricing model using the weighted average assumptions in the following table. Since the Company’s shares are not currently publicly traded and as a result there is a lack of consistent historical experience on which to base the assumptions, the simplified method is used to estimate the expected term of the option and expected volatility is computed based on the average historical volatility of similar entities with publicly traded shares. The risk-free rate for the expected term of the stock option is based on the U.S. Treasury yield curve in effect at the time of grant.
| Year Ended December 31, | |||||||||
| 2007 | 2008 | 2009 | |||||||
| Risk-free interest rate |
4.7 | % | 3.0 | % | 1.8 | % | |||
| Expected lives (years) |
5.82 | 6.13 | 6.29 | ||||||
| Volatility |
40 | % | 44 | % | 44 | % | |||
| Expected dividend yield |
— | — | — | ||||||
F-18
Table of Contents
TRIPWIRE, INC.
Notes to Consolidated Financial Statements—(Continued)
December 31, 2008 and 2009
and June 30, 2010 (unaudited)
Stock option activity under the Plans during the periods indicated is as follows (in thousands, except per share amounts):
| Outstanding Options | Weighted Average Remaining Contractual Term (years) |
Aggregate Intrinsic Value | |||||||||
| Options Outstanding |
Weighted Average Exercise Price (per share) |
||||||||||
| Options outstanding at December 31, 2006 |
11,176 | $ | 0.54 | ||||||||
| Granted |
2,077 | 0.60 | |||||||||
| Exercised |
(82 | ) | 0.47 | ||||||||
| Forfeited |
(1,103 | ) | 0.57 | ||||||||
| Options outstanding at December 31, 2007 |
12,068 | 0.55 | |||||||||
| Granted |
1,800 | 0.61 | |||||||||
| Exercised |
(206 | ) | 0.33 | ||||||||
| Forfeited |
(1,264 | ) | 0.55 | ||||||||
| Options outstanding at December 31, 2008 |
12,398 | 0.56 | |||||||||
| Granted |
1,918 | 0.66 | |||||||||
| Exercised |
(204 | ) | 0.17 | ||||||||
| Forfeited |
(551 | ) | 0.62 | ||||||||
| Options outstanding at December 31, 2009 |
13,561 | 0.58 | 6.26 | $ | 16,951 | ||||||
| Granted (unaudited) |
3,177 | 2.04 | |||||||||
| Exercised (unaudited) |
(925 | ) | 0.52 | ||||||||
| Forfeited (unaudited) |
(162 | ) | 0.89 | ||||||||
| Options outstanding at June 30, 2010 (unaudited) |
15,651 | $ | 0.87 | 6.67 | $ | 17,283 | |||||
| Vested and expected to vest as of December 31, 2009, net of anticipated forfeitures |
13,412 | $ | 0.58 | 6.26 | $ | 16,951 | |||||
| Vested and exercisable as of December 31, 2009 |
10,590 | $ | 0.56 | 5.89 | $ | 13,414 | |||||
| Vested and expected to vest as of June 30, 2010 (unaudited), net of anticipated forfeitures |
15,383 | $ | 0.86 | 6.67 | $ | 17,283 | |||||
| Vested and exercisable as of June 30, 2010 (unaudited) |
10,298 | $ | 0.58 | 5.40 | $ | 14,284 | |||||
The aggregate intrinsic values in the table above represent the total pretax intrinsic value (the aggregate difference between the fair value of the Company’s common stock on December 31, 2009 and June 30, 2010 (unaudited), of $1.86 and $1.96, respectively, and the exercise price of in-the-money stock options) that would have been received by the option holders had all option holders exercised their options as of that date. The total intrinsic value of stock options exercised during the year ended December 31, 2009 was $0.1 million and $1.2 million for the six months ended June 30, 2010 (unaudited). There was no material intrinsic value for stock options exercised during 2008. The weighted average fair value of the stock options granted during 2007, 2008 and 2009 was $0.10 per share, $0.10 per share and $0.14 per share, respectively. The total fair value of stock options granted during the years ended December 31, 2007, 2008 and 2009 was $0.2 million in each period.
F-19
Table of Contents
TRIPWIRE, INC.
Notes to Consolidated Financial Statements—(Continued)
December 31, 2008 and 2009
and June 30, 2010 (unaudited)
At December 31, 2009, there was $0.3 million of total unrecognized compensation cost related to nonvested share-based compensation arrangements granted under the Plan. The cost is expected to be recognized over a weighted average period of 1.8 years.
During the year ended December 31, 2009 and the six months ended June 30, 2010, the Company granted stock options with exercise prices as follows:
| Grant Dates |
Options Granted |
Exercise Price | |||
| April 15, 2009 – July 23, 2009 |
1,582,545 | $ | 0.65 | ||
| September 23, 2009 – October 30, 2009 |
279,600 | $ | 0.70 | ||
| December 16, 2009 |
65,500 | $ | 0.80 | ||
| March 31, 2010 (unaudited) |
1,357,900 | $ | 1.98 | ||
| April 21, 2010 – May 7, 2010 (unaudited) |
1,020,999 | $ | 2.09 | ||
| May 25, 2010 – June 25, 2010 (unaudited) |
798,462 | $ | 2.08 | ||
Since December 2005, the Company has obtained valuation analyses prepared by an independent third-party valuation firm to assist in determining the fair market value of its common stock. The board of directors of the Company considered these valuation reports when determining the fair market value of the Company’s common stock and the related option exercise price on the dates such awards were granted. The third-party valuations used both the income and market approaches to calculate a total equity value. The total equity value determined under each approach was then weighted to reach a reconciled total equity value. Between the December 16, 2009 and March 31, 2010 grant dates, the board of directors determined to commence the IPO process. Thereafter, the Company also considered an implied pre-money equity value as estimated by potential lead underwriters in connection with a potential IPO. The total equity value was then allocated to each share of preferred and common stock by analyzing various option-pricing methodologies. The valuations determined as of the dates below are as follows:
| Fair Market Value | |||
| December 31, 2008 |
$ | 0.44 | |
| June 30, 2009 |
$ | 0.60 | |
| December 31, 2009 |
$ | 1.86 | |
| March 17, 2010 (unaudited) |
$ | 1.98 | |
| April 15, 2010 (unaudited) |
$ | 2.09 | |
| May 3, 2010 (unaudited) |
$ | 2.09 | |
| May 21, 2010 (unaudited) |
$ | 2.08 | |
| June 23, 2010 (unaudited) |
$ | 1.96 | |
F-20
Table of Contents
TRIPWIRE, INC.
Notes to Consolidated Financial Statements—(Continued)
December 31, 2008 and 2009
and June 30, 2010 (unaudited)
(8) Convertible Preferred Stock
The Company has authorized 37,367,260 shares of $0.001 par value preferred stock to be issued from time to time with such designations and preferences and other special rights and qualifications, limitations and restrictions thereon, as permitted by law and as fixed from time to time by resolution of the board of directors. All outstanding shares of convertible preferred stock shall convert into shares of common stock in connection with the closing of the IPO, and all of the rights and privileges described in this Note 8 shall terminate at such time. The following shares of preferred stock were outstanding at December 31, 2009 (in thousands):
| Shares Authorized |
Shares Outstanding |
Amount (at Par) |
Aggregate Liquidation Preference | |||||||
| Series A |
10,337 | 10,262 | $ | 10 | $ | 4,428 | ||||
| Series B |
10,611 | 10,084 | 10 | 9,014 | ||||||
| Series C |
9,418 | 8,265 | 8 | 24,134 | ||||||
| Series C-1 |
3,485 | 3,174 | 3 | 9,268 | ||||||
| Series D |
3,516 | 3,386 | 3 | 16,613 | ||||||
| Total |
37,367 | 35,171 | $ | 63,457 | ||||||
Dividends
The holders of preferred stock are entitled to receive noncumulative cash dividends at the rate of 8% of the original preferred stock purchase price per annum, when and as declared by the board of directors. The holders of preferred stock are also entitled to participate pro rata in any dividends paid on the common stock on an “as-if” converted basis. No dividends have been declared through December 31, 2009.
Voting Rights
Generally, the holders of preferred stock vote together with the holders of common stock and not as a separate class, except in actions that directly affect their preferred rights and preferences or as otherwise required by law. Each share of preferred stock has a number of votes equal to the whole number of shares of common stock then issuable upon conversion of such shares of preferred stock.
As long as at least 500,000 shares of preferred stock remain outstanding, a two-thirds vote of holders of preferred stock, voting as a single class, is required for the Company to effect the following:
| • | Redeem, purchase, or acquire any common or preferred shares of the Company, except for common stock from employees, officers, directors or consultants. |
| • | Increases or decreases to the authorized size of the Company’s board of directors. |
| • | Actions that result in the payment or declaration of any dividend on any shares of Common Stock or any share of preferred stock. |
| • | Actions that result in indebtedness in excess of $7.5 million not already approved by the Company’s board of directors. |
As long as at least 500,000 shares of preferred stock remain outstanding, a majority vote of Series A, Series B, Series C-1, Series D, each voting as a separate class, and a two-thirds vote of holders of Series C preferred stock is required for the Company to sell, merge or consolidate with any other corporation that will
F-21
Table of Contents
TRIPWIRE, INC.
Notes to Consolidated Financial Statements—(Continued)
December 31, 2008 and 2009
and June 30, 2010 (unaudited)
affect existing voting power by more than 50% for a value less than the total number of shares of fully-diluted common stock multiplied by $2.00 per share.
Board of Directors
The holders of Series A, Series B and Series C preferred stock, each voting as a separate class, are each entitled to elect one member of the Company’s board of directors. Holders of common stock, voting as a separate class, are entitled to elect a member of the board of directors. Additionally, all holders of preferred and common stock, voting as a single class on an as-if converted basis, are entitled to elect any remaining members.
Liquidation Preference
In the event of any liquidation, dissolution or winding up of the Company, the holders of Series D preferred stock would be entitled to receive in preference to the holders of Series A, Series B, Series C, Series C-1 and common stock an amount per share equal to two times the Series D original issue price plus any declared but unpaid dividends (the Series D Liquidation Preference). After the payment of the Series D Liquidation Preference, holders of Series C and Series C-1 preferred stock, on a pari passu basis, would be entitled to receive in preference to the holders of Series A, Series B and common stock an amount equal to the original Series C purchase price plus any declared but unpaid dividends (the Series C Liquidation Preference). After the payment of the Series C Liquidation Preference the holders of Series A and Series B preferred stock, on a pari passu basis, would be entitled to receive, prior and in preference to the holders of common stock, the applicable original purchase price for such series of preferred stock plus any declared but unpaid dividends (the Series A and B Liquidation Preference). After the payment of the Series A and Series B Liquidation Preference, any remaining assets would be distributed ratably to the holders of common stock.
A merger, acquisition, sale of voting control, or sale of substantially all of the assets of the Company in which the stockholders of the Company do not own a majority of the voting control would be deemed to be a liquidation.
Conversion
The holders of preferred stock have the right to convert the preferred stock, at any time, into shares of common stock. The initial conversion rates for the series of preferred stock are approximately one-to-one, subject to adjustment as provided below. At December 31, 2009, the per-share conversion prices for Series A, Series B, Series C, Series C-1 and Series D were $0.4307, $0.8914, $2.74, $1.48 and $2.45, respectively. The conversion rate is subject to adjustment for certain dilutive issuances, splits and combinations.
Automatic Conversion
Each share of Series A, Series B, Series C, Series C-1 and Series D preferred stock would be automatically converted into common stock, at the then applicable conversion rate, in the event that the holders of at least two-thirds of the outstanding Series A, Series B, Series C, Series C-1 and Series D preferred stock, each voting as a separate class (except for Series C and Series C-1, which will vote as a single class on an “as-if” converted basis), consent to such conversion or (ii) immediately upon the closing of a firmly underwritten public offering of shares of common stock of the Company at a share price equal to or more than two times the then applicable Series C preferred stock conversion price with gross proceeds (before underwriting discounts, commissions and
F-22
Table of Contents
TRIPWIRE, INC.
Notes to Consolidated Financial Statements—(Continued)
December 31, 2008 and 2009
and June 30, 2010 (unaudited)
fees) of not less than $30.0 million. As of December 31, 2009, the Series C preferred stock conversion price was approximately $2.73.
Antidilution Protection
The conversion price of the Series A, Series B, Series C, Series C-1 and Series D preferred stock is proportionally adjusted in the event of a stock split, stock dividend or reverse stock split of the common stock. The conversion price is adjusted on a broad-based weighted-average formula basis if the Company issues certain securities at a price per share less than the conversion price.
Redemption at Option of Investors
At the election of the holders of a majority of the Series A, Series B, Series C, Series C-1 and Series D preferred stock, voting together as a single class, the Company would have been required to redeem the outstanding Series A, Series B, Series C, Series C-1 and Series D preferred stock upon notice given 60 days prior to June 18, 2009. As such, the preferred stock was reported outside of permanent equity prior to this date. Because the holders of the preferred stock did not provide such notice, the redemption provision expired. Accordingly, the preferred stock has been reclassified to stockholders’ equity (deficit).
(9) Warrants
The following table summarizes warrant transactions (in thousands, except per share amounts):
| Date Issued |
Underlying Security |
Shares Subject to Warrant |
Warrant Shares Outstanding at December 31, 2009 |
Expiration |
Weighted Average Exercise Price Per Share | ||||||
| 6/16/00 |
Preferred | 392 | 392 | 6/16/10 | $ | 0.89 | |||||
| 7/31/02 |
Preferred | 29 | 29 | 7/31/12 | 1.48 | ||||||
| 1/16/03 |
Preferred | 274 | 274 | 1/16/10 | 2.92 | ||||||
| 2/12/04 |
Preferred | 80 | 80 | 2/12/13 | 2.45 | ||||||
| 775 | |||||||||||
| 1/16/03 |
Common | 267 | 267 | 1/16/10 | 0.10 | ||||||
| 8/21/09 |
Common | 200 | 200 | 8/21/13 | 2.00 | ||||||
| 467 | |||||||||||
| Total | 1,242 | ||||||||||
The preferred stock warrants are presented at fair value in other long-term liabilities as of December 31, 2008. Due to the expiration of the preferred stock redemption provision during 2009, these warrants were reclassified to stockholders’ equity (deficit).
During the six months ended June 30, 2010, there were approximately 932,000 warrants exercised (unaudited).
F-23
Table of Contents
TRIPWIRE, INC.
Notes to Consolidated Financial Statements—(Continued)
December 31, 2008 and 2009
and June 30, 2010 (unaudited)
(10) Income Taxes
Domestic and foreign pretax income (loss) is as follows (in thousands):
| Year Ended December 31, | |||||||||||
| 2007 | 2008 | 2009 | |||||||||
| Domestic |
$ | 152 | $ | 4,537 | $ | 7,327 | |||||
| Foreign |
(24 | ) | (11 | ) | 1,279 | ||||||
| $ | 128 | $ | 4,526 | $ | 8,606 | ||||||
Income tax expense (benefit) attributable to continuing operations comprises the following (in thousands):
| Year Ended December 31, | |||||||||||
| 2007 | 2008 | 2009 | |||||||||
| Current: |
|||||||||||
| Federal |
$ | 51 | $ | 46 | $ | 261 | |||||
| State |
46 | 39 | 309 | ||||||||
| Foreign |
50 | 66 | 218 | ||||||||
| Total current |
147 | 151 | 788 | ||||||||
| Deferred: |
|||||||||||
| Federal |
— | (1,312 | ) | (9,597 | ) | ||||||
| State |
— | (169 | ) | (1,746 | ) | ||||||
| Foreign |
— | — | (422 | ) | |||||||
| Total deferred |
— | (1,481 | ) | (11,765 | ) | ||||||
| Income tax expense (benefit) |
$ | 147 | $ | (1,330 | ) | $ | (10,977 | ) | |||
The significant differences between the U.S. federal statutory tax rate and the Company’s effective tax rate for financial statement purposes are as follows (in thousands):
| Year Ended December 31, | |||||||||
| 2007 | 2008 | 2009 | |||||||
| Expected income tax rate |
34.0 | % | 34.0 | % | 34.0 | % | |||
| Increases (decreases) resulting from: |
|||||||||
| Non-deductible permanent items |
— | 1.9 | 6.8 | ||||||
| Change in valuation allowance |
222.0 | (74.2 | ) | (170.7 | ) | ||||
| Increase in federal and state R&D credits |
— | — | (3.4 | ) | |||||
| Other |
(27.8 | ) | 7.7 | 5.4 | |||||
| Actual tax rate |
228.2 | % | (30.6 | )% | (127.9 | )% | |||
F-24
Table of Contents
TRIPWIRE, INC.
Notes to Consolidated Financial Statements—(Continued)
December 31, 2008 and 2009
and June 30, 2010 (unaudited)
Deferred income taxes reflect the net tax effects of temporary differences between the carrying amount of assets and liabilities for financial reporting purposes and the respective bases for income tax purposes. Significant components of deferred tax assets and liabilities are as follows (in thousands):
| December 31, | ||||||||
| 2008 | 2009 | |||||||
| Deferred tax assets: |
||||||||
| Accrued expenses and allowances |
$ | 1,053 | $ | 2,321 | ||||
| Depreciation and amortization |
339 | 323 | ||||||
| Net operating loss carryforwards |
14,655 | 8,933 | ||||||
| Research and experimentation credit carryforwards |
1,396 | 1,705 | ||||||
| Other credit carryforward |
251 | 467 | ||||||
| Gross deferred tax assets |
17,694 | 13,749 | ||||||
| Less: valuation allowance |
(16,213 | ) | (353 | ) | ||||
| Deferred tax assets |
1,481 | 13,396 | ||||||
| Deferred tax liabilities |
— | (150 | ) | |||||
| Net deferred tax assets |
$ | 1,481 | $ | 13,246 | ||||
The Company maintained a valuation allowance against a portion of its U.S. net deferred tax assets at December 31, 2008 and 2009 and June 30, 2010 (unaudited), respectively, as it has concluded it is not more likely than not that it will realize a benefit from these assets in a future period. The Company has not provided a valuation allowance against any foreign net deferred tax assets as it has concluded it is more likely than not that a benefit from these assets will be realized in a future period due to the nature of the assets in these jurisdictions. The net valuation allowance increased $0.3 million for the year ended December 31, 2007 and decreased $4.3 million and $15.9 million for the years ended December 31, 2008 and 2009, respectively. The Company assessed its valuation allowance against deferred tax assets at December 31, 2008 and reversed approximately $1.5 million of the valuation allowance at that time based on its record of pre-tax operating income from 2005 through 2008 and its forecast financial performance for the year ended December 31, 2009. However, due to global economic uncertainty that existed during late 2008 and early 2009 and the pre-tax operating loss in 2007, management determined that the remaining portion of its deferred tax assets were not more likely than not to be realizable at December 31, 2008. At December 31, 2009, the Company assessed its valuation allowance, considering the pre-tax operating income achieved in 2009 and the improvement in global economic conditions and released substantially all of its valuation allowance against deferred tax assets.
As of December 31, 2009, the Company had federal and state net operating loss carryforwards of approximately $22.9 million and $27.2 million, respectively, available to reduce future income subject to income taxes. The federal net operating loss carryforwards expire through 2029 and the state net operating loss carryforwards expire through 2025. As of December 31, 2009, the Company had available federal and state research and experimentation tax credit carryforwards of approximately $2.1 million and $0.6 million, respectively, which begin expiring in 2010.
Net operating loss and credit carryforwards are reported net of an annual limitation due to the ownership change provisions of the Internal Revenue Code of 1986, as amended, and similar state provisions.
F-25
Table of Contents
TRIPWIRE, INC.
Notes to Consolidated Financial Statements—(Continued)
December 31, 2008 and 2009
and June 30, 2010 (unaudited)
The Company had undistributed net losses of its foreign subsidiary of approximately $3.5 million as of December 31, 2009, for which deferred taxes have not been provided. As there are no offshore earnings available for repatriation, no U.S. income tax provision is required to be provided.
Uncertain Tax Positions
The Company has recorded tax reserves to address potential exposures involving positions that could be challenged by taxing authorities. On January 1, 2009, it adopted the GAAP guidance related to uncertain tax positions. As of January 1, 2009, the amount of uncertain tax positions was a liability of $0.8 million and there was no change in the balance during the periods ended December 31, 2009 or June 30, 2010 (unaudited), respectively. No interest or penalties are accrued related to these uncertain positions to date as the amount has been recorded as a reduction of the related deferred tax asset.
The Company was not subject to, nor had it received any notice of, income tax examinations as of December 31, 2009.
Due to the Company’s net operating loss carryforwards, it is subject to state, U.S. federal and foreign jurisdiction tax examinations for all years. The Company does not anticipate that any potential tax adjustments will have a significant impact on its consolidated financial position or results of operations.
(11) Related-Party Transactions
During 2007, 2008 and 2009 and for the six months ended June 30, 2009 and 2010, respectively, the Company sold licenses, support and professional services to certain stockholders of the Company. Total revenue related to these stockholders was as follows (in thousands):
| Year Ended December 31, | June 30, | ||||||||||||||
| 2007 | 2008 | 2009 | 2009 | 2010 | |||||||||||
| (unaudited) | |||||||||||||||
| Company A |
$ | 379 | $ | 337 | $ | 311 | $ | 161 | $ | 106 | |||||
| Company B |
1,231 | 1,552 | 1,631 | 718 | 944 | ||||||||||
| Company C |
60 | 728 | 341 | 205 | 130 | ||||||||||
| Company D |
345 | 566 | 344 | 178 | 163 | ||||||||||
| $ | 2,015 | $ | 3,183 | $ | 2,627 | $ | 1,262 | $ | 1,343 | ||||||
Accounts receivable from these customers at December 31, 2008 and 2009 and at June 30, 2009 and 2010 were as follows (in thousands):
| Year Ended December 31, | June 30, | |||||||||||
| 2008 | 2009 | 2009 | 2010 | |||||||||
| (unaudited) | ||||||||||||
| Company A |
$ | 72 | — | — | — | |||||||
| Company B |
209 | $ | 281 | $ | 102 | $ | 81 | |||||
| Company C |
102 | — | — | — | ||||||||
| Company D |
— | — | — | — | ||||||||
| $ | 383 | $ | 281 | $ | 102 | $ | 81 | |||||
F-26
Table of Contents
TRIPWIRE, INC.
Notes to Consolidated Financial Statements—(Continued)
December 31, 2008 and 2009
and June 30, 2010 (unaudited)
(12) Geographic Revenue
Geographic revenue information is as follows (in thousands):
| Year Ended December 31, | Six Months Ended June 30, | ||||||||||||||
| 2007 | 2008 | 2009 | 2009 | 2010 | |||||||||||
| (unaudited) | |||||||||||||||
| The Americas |
$ | 41,563 | $ | 48,974 | $ | 61,381 | $ | 27,373 | $ | 31,275 | |||||
| Europe |
4,994 | 9,046 | 8,233 | 3,288 | 5,756 | ||||||||||
| Asia |
2,626 | 4,359 | 4,392 | 1,793 | 1,580 | ||||||||||
| $ | 49,183 | $ | 62,379 | $ | 74,006 | $ | 32,454 | $ | 40,085 | ||||||
Sales to customers based in the United States totaled 78%, 71% and 76% of total revenue in the years ended December 31, 2007, 2008 and 2009, respectively, and 23% and 26% of total revenue in the six months ended June 30, 2009 and 2010 (unaudited), respectively. No other countries comprised more than 10% of total revenue in the years ended December 31, 2007, 2008 or 2009 or in the six months ended June 30, 2009 or 2010 (unaudited).
(13) Subsequent Events
(a) Extension of Credit Facility Term
On May, 10, 2010, the Company amended its revolving credit facility to extend the expiration date to August 20, 2010. No other terms or conditions were changed.
(b) Stock Option Grants, Amendment of 2000 Plan and Adoption of 2010 Incentive Plan
In April 2010, the Company’s board of directors granted to employees options to purchase an aggregate of 84,000 shares of the Company’s common stock with an exercise price of $2.09 per share.
In May 2010, the Company’s board of directors granted to directors, employees and consultants options to purchase an aggregate of 1,050,215 shares of the Company’s common stock with a weighted-average exercise price of $2.09 per share.
In May 2010, the Company’s board of directors increased the total number of shares of the Company’s common stock that may be issued under the 2000 Plan to 18,341,915 and also adopted the Company’s 2010 Incentive Plan (2010 Plan), which will become effective upon the closing of the Company’s IPO. The board has authorized 4,340,250 shares of common stock for issuance under the 2010 Plan. In addition, any shares available for issuance under the Company’s 2000 Stock Option/Stock Issuance Plan, and any shares subject to outstanding awards under the 2000 Plan or the 1998 Plan as of the effective date of the 2010 Plan that cease to be subject to these awards (other than from exercise or settlement of the awards in shares), will automatically become available for issuance under the 2010 Plan, up to an aggregate maximum of 17,125,102 shares.
In May 2010, warrants to purchase 391,543 shares of Series B preferred stock were exercised resulting in total proceeds of $0.4 million.
F-27
Table of Contents
TRIPWIRE, INC.
Notes to Consolidated Financial Statements—(Continued)
December 31, 2008 and 2009
and June 30, 2010 (unaudited)
(c) Approval of IPO
On May 25, 2010, the Company’s board of directors approved the filing by the Company with the SEC of a registration statement covering shares of the Company’s common stock to be issued and sold by the Company, and to be sold by certain Company stockholders, in an IPO.
The Company has evaluated subsequent events from the balance sheet date through May 28, 2010, the date at which the financial statements were issued, and determined there are no other items to disclose.
F-28
Table of Contents

Table of Contents
shares
Common Stock
Prospectus
| J.P. Morgan | Stifel Nicolaus Weisel | |
| Needham & Company, LLC | RBC Capital Markets | |
Table of Contents
PART II
INFORMATION NOT REQUIRED IN PROSPECTUS
| ITEM 13. Other | Expenses of Issuance and Distribution. |
The following table shows expenses to be incurred in connection with the offering described in this registration statement, all of which will be paid by the registrant. All amounts are estimates, other than the SEC registration fee, the FINRA filing fee and the Nasdaq Global Market listing fee.
| Item |
Amount | ||
| SEC registration fee |
$ | 6,150 | |
| FINRA filing fee |
9,125 | ||
| Nasdaq Global Market listing fee |
125,000 | ||
| Accounting fees and expenses |
* | ||
| Legal fees and expenses |
* | ||
| Printing and engraving expenses |
* | ||
| Transfer agent and registrar fees and expenses |
* | ||
| Blue sky fees and expenses |
* | ||
| Miscellaneous |
* | ||
| Total |
$ * | ||
| * | To be filed by amendment. |
| ITEM 14. Indemnification | of Directors and Officers. |
Section 145 of the Delaware General Corporation Law (DGCL) authorizes a corporation to indemnify its directors, officers, employees and agents against expenses (including attorney’s fees), judgments, fines and amounts paid in settlement reasonably incurred, provided they act in good faith and in a manner reasonably believed to be in or not opposed to the best interests of the corporation, and, with respect to any criminal proceeding, had no reasonable cause to believe their conduct was unlawful, although in the case of proceedings brought by or on behalf of the corporation, such indemnification is limited to expenses and is not permitted if the individual is adjudged liable to the corporation (unless the Delaware Court of Chancery or the court in which such proceeding was brought determines otherwise in accordance with the DGCL).
Section 102 of the Delaware General Corporation Law authorizes a corporation to limit or eliminate its directors’ liability to the corporation or its stockholders for monetary damages for breaches of fiduciary duties, other than for (1) breaches of the duty of loyalty, (2) acts or omissions not in good faith or that involve intentional misconduct or knowing violations of law, (3) unlawful payments of dividends, stock purchases or redemptions, or (4) transactions from which a director derives an improper personal benefit.
Upon the closing of the offering, our amended and restated certificate of incorporation will contain provisions protecting our directors and officers to the fullest extent permitted by Sections 102 and 145 of the DGCL. Our amended and restated by-laws will provide similar protection under Section 145 of the DGCL for our directors and officers.
Section 145 of the DGCL also authorizes a corporation to purchase and maintain insurance on behalf of any person who is or was a director, officer, employee or agent of the corporation against any liability asserted against and incurred by such person in any such capacity, or arising out of such person’s status as such. We have obtained liability insurance covering our directors and officers for claims asserted against them or incurred by them in such capacity.
II-1
Table of Contents
We have also entered into agreements to indemnify our directors to the maximum extent allowed under Delaware law. These agreements will, among other things, indemnify our directors for certain expenses (including attorneys’ fees), judgments, fines and settlement amounts reasonably incurred by such person in any action or proceeding, including any action by or in our right, on account of any services undertaken by such person on behalf of the company or that person’s status as a director of Tripwire.
The underwriting agreement provides that the underwriters are obligated, under certain circumstances, to indemnify our directors, officers and controlling persons against certain liabilities, including liabilities under the Securities Act. Reference is made to the form of underwriting agreement to be filed as Exhibit 1.1 hereto.
Reference is also made to Item 17 for our undertakings with respect to indemnification for liabilities under the Securities Act.
| ITEM 15. Recent | Sales of Unregistered Securities. |
Since January 1, 2007, we made sales of the following unregistered securities:
1. Since January 1, 2007, we have granted stock options to purchase an aggregate of 9,904,486 shares of our common stock at exercise prices ranging from $0.60 to $2.09 per share to a total of 362 directors, officers, employees and consultants under our 2000 Stock Option/Stock Issuance Plan. These transactions were exempt from the registration requirements of the Securities Act in reliance upon Rule 701 promulgated under the Securities Act or Section 4(2) of the Securities Act. All grants made in reliance upon Section 4(2) of the Securities Act were made to accredited investors.
2. Since January 1, 2007, we have issued warrants to purchase 200,000 shares of our common stock, at an exercise price of $2.00 per share, for an aggregate purchase price of $400,000. This transaction was exempt from the registration requirements of the Securities Act in reliance upon Rule 504 under Section 3(b) of the Securities Act.
3. Since January 1, 2007, we have issued and sold (a) an aggregate of 358,800 shares of our common stock to directors, officers, employees and consultants at prices ranging from $0.10 to $0.22 per share pursuant to the exercise of stock options granted under our 1998 Stock Option Plan, and (b) an aggregate of 1,041,257 shares of our common stock to directors, officers, employees and consultants at prices ranging from $0.45 to $1.00 per share pursuant to exercise of stock options granted under our 2000 Stock Option/Stock Issuance Plan. These transactions were exempt from the registration requirements of the Securities Act in reliance upon Rule 701 promulgated under the Securities Act or Section 4(2) of the Securities Act. All issuances made in reliance upon Section 4(2) of the Securities Act were made to accredited investors.
4. Since January 1, 2007, we have issued and sold 391,543 shares of our Series B preferred stock to an accredited investor at a price of $0.89 per share, pursuant to the exercise of warrants to purchase such shares. These transactions were exempt from the registration requirements of the Securities Act in reliance on Section 4(2) of the Securities Act.
The recipients of the securities in each of these transactions represented their intentions to acquire the securities for investment only and not with a view to or for sale in connection with any distribution thereof, and appropriate legends were placed upon stock certificates issued in these transactions.
II-2
Table of Contents
| ITEM 16. Exhibits | and Financial Statement Schedules. |
(a) Exhibits
EXHIBIT INDEX
| Exhibit |
Description | |
| 1.1* | Form of Underwriting Agreement | |
| 3.1** | Eighth Amended and Restated Certificate of Incorporation, dated June 17, 2003, as amended on February 12, 2004 and July 7, 2006 (as currently in effect) | |
| 3.2* | Amended and Restated Certificate of Incorporation (to be in effect upon the closing of the offering) | |
| 3.3** | Amended and Restated By-laws (as currently in effect) | |
| 3.4* | Amended and Restated By-laws (to be in effect upon the closing of the offering) | |
| 4.1* | Specimen Common Stock Certificate | |
| 4.2** | Fourth Amended and Restated Investors’ Rights Agreement, as amended | |
| 5.1* | Opinion of Perkins Coie LLP | |
| 10.1* | Form of Indemnification Agreement for directors | |
| 10.2* | Tripwire, Inc. 2010 Incentive Plan (to be in effect upon the closing of the offering) | |
| 10.3* | Form of Stock Option Grant Notice and Stock Option Agreement under Tripwire, Inc. 2010 Incentive Plan | |
| 10.4** | Tripwire, Inc. 2000 Stock Option/Stock Issuance Plan | |
| 10.5** | Notice of Grant of Stock Option and Form of Stock Option Agreement under Tripwire, Inc. 2000 Stock Option/Stock Issuance Plan | |
| 10.6** | Letter Agreement, dated January 27, 2003, between the company and Robert C. McCarthy | |
| 10.7** | Offer Letter, dated July 2, 2004, between the company and Robert F. Dunne | |
| 10.8** | Lease, dated July 1, 2008, between One Main Place Portland-Oregon, Inc. and Tripwire, Inc., as amended on November 20, 2008, December 4, 2009 and June 5, 2010 | |
| 23.1 | Consent of KPMG LLP, independent registered public accounting firm | |
| 23.2* | Consent of Perkins Coie LLP (contained in the opinion filed as Exhibit 5.1) | |
| 24.1** | Power of Attorney | |
| * | To be filed by amendment. |
| ** | Previously filed. |
(b) The following financial statement schedule is filed as part of this Registration Statement:
All financial statement schedules have been omitted because they are not required, not applicable or the information to be included in the financial statement schedules is included in the consolidated financial statements or the notes thereto.
| ITEM 17. Undertakings. |
(a) Insofar as indemnification for liabilities arising under the Securities Act of 1933 may be permitted to directors, officers and controlling persons of the registrant pursuant to the foregoing provisions, or otherwise, the registrant has been advised that in the opinion of the Securities and Exchange Commission such indemnification is against public policy as expressed in the Securities Act and is, therefore, unenforceable. In the event that a claim for indemnification against such liabilities (other than the payment by the registrant of expenses incurred or
II-3
Table of Contents
paid by a director, officer or controlling person of the registrant in the successful defense of any action, suit or proceeding) is asserted by such director, officer or controlling person in connection with the securities being registered, the registrant will, unless in the opinion of its counsel the matter has been settled by controlling precedent, submit to a court of appropriate jurisdiction the question whether such indemnification by it is against public policy as expressed in the Securities Act and will be governed by the final adjudication of such issue.
(b) The undersigned registrant hereby undertakes that:
(1) For purposes of determining any liability under the Securities Act of 1933, the information omitted from the form of prospectus filed as part of this registration statement in reliance upon Rule 430A and contained in a form of prospectus filed by the registrant pursuant to Rule 424(b)(1) or (4) or 497(h) under the Securities Act shall be deemed to be part of this registration statement as of the time it was declared effective.
(2) For the purpose of determining any liability under the Securities Act of 1933, each post-effective amendment that contains a form of prospectus shall be deemed to be a new registration statement relating to the securities offered therein, and the offering of such securities at that time shall be deemed to be the initial bona fide offering thereof.
(c) The registrant hereby undertakes to provide to the underwriters at the closing specified in the underwriting agreement, certificates in such denominations and registered in such names as required by the underwriters to permit prompt delivery to each purchaser.
II-4
Table of Contents
SIGNATURES
Pursuant to the requirements of the Securities Act of 1933, the registrant has duly caused this Amendment No. 2 to Registration Statement to be signed on its behalf by the undersigned, thereunto duly authorized, in the City of Portland, State of Oregon, on July 30, 2010.
| TRIPWIRE, INC. | ||
| By: | /S/ JAMES B. JOHNSON | |
| James B. Johnson | ||
| President and Chief Executive Officer | ||
Pursuant to the requirements of the Securities Act of 1933, this Amendment No. 2 to Registration Statement has been signed by the following persons in the capacities and on the dates indicated:
| Name |
Title |
Date | ||
| /S/ JAMES B. JOHNSON James B. Johnson |
President, Chief Executive Officer and Director (Principal Executive Officer) |
July 30, 2010 | ||
| /S/ KELLY E. LANG Kelly E. Lang |
Vice President and Chief Financial Officer (Principal Financial and Accounting Officer) |
July 30, 2010 | ||
| * Steven N. Baloff |
Director |
July 30, 2010 | ||
| * Robert J. Finocchio, Jr. |
Director |
July 30, 2010 | ||
| * Justin Label |
Director |
July 30, 2010 | ||
| * William W. Lattin |
Director |
July 30, 2010 | ||
| * James T. Richardson |
Director |
July 30, 2010 | ||
| *By: |
/s/ JAMES B. JOHNSON | |
| James B. Johnson Attorney-in-Fact |
II-5
Table of Contents
INDEX TO EXHIBITS
| Exhibit |
Description | |
| 1.1* | Form of Underwriting Agreement | |
| 3.1** | Eighth Amended and Restated Certificate of Incorporation, dated June 17, 2003, as amended on February 12, 2004 and July 7, 2006 (as currently in effect) | |
| 3.2* | Amended and Restated Certificate of Incorporation (to be in effect upon the closing of the offering) | |
| 3.3** | Amended and Restated By-laws (as currently in effect) | |
| 3.4* | Amended and Restated By-laws (to be in effect upon the closing of the offering) | |
| 4.1* | Specimen Common Stock Certificate | |
| 4.2** | Fourth Amended and Restated Investors’ Rights Agreement, as amended | |
| 5.1* | Opinion of Perkins Coie LLP | |
| 10.1* | Form of Indemnification Agreement for directors | |
| 10.2* | Tripwire, Inc. 2010 Incentive Plan (to be in effect upon the closing of the offering) | |
| 10.3* | Form of Stock Option Grant Notice and Stock Option Agreement under Tripwire, Inc. 2010 Incentive Plan | |
| 10.4** | Tripwire, Inc. 2000 Stock Option/Stock Issuance Plan | |
| 10.5** | Notice of Grant of Stock Option and Form of Stock Option Agreement under Tripwire, Inc. 2000 Stock Option/Stock Issuance Plan | |
| 10.6** | Letter Agreement, dated January 27, 2003, between the company and Robert McCarthy | |
| 10.7** | Offer Letter, dated July 2, 2004, between the company and Robert F. Dunne | |
| 10.8** | Lease, dated July 1, 2008, between One Main Place Portland-Oregon, Inc. and Tripwire, Inc., as amended on November 20, 2008, December 4, 2009 and June 5, 2010 | |
| 23.1 | Consent of KPMG LLP, independent registered public accounting firm | |
| 23.2* | Consent of Perkins Coie LLP (contained in the opinion filed as Exhibit 5.1) | |
| 24.1** | Power of Attorney (contained on page II-5) | |
| * | To be filed by amendment. |
| ** | Previously filed. |