Attached files
| file | filename |
|---|---|
| 8-K - FORM 8-K - IMPERIAL OIL LTD | d8k.htm |

Exhibit 99.1
|
Q2 news release FOR THE SIX MONTHS ENDED JUNE 30, 2010
|
Calgary, July 29, 2010
Imperial Oil announces estimated second-quarter financial and operating results
|
Second Quarter
|
Six Months
| |||||||||||||
| (millions of dollars, unless noted) | 2010 | 2009 | % | 2010 | 2009 | % | ||||||||
| Net income (U.S. GAAP) |
517 | 209 | 147 | 993 | 498 | 99 | ||||||||
| Net income per common share |
||||||||||||||
| - assuming dilution (dollars) |
0.60 | 0.25 | 140 | 1.16 | 0.58 | 100 | ||||||||
| Capital and exploration expenditures |
881 | 535 | 65 | 1,781 | 1,029 | 73 | ||||||||
Bruce March, chairman, president and chief executive officer of Imperial Oil, commented:
“Imperial Oil delivered solid results with earnings of $517 million or $0.60 per share, up from $209 million in the second quarter of 2009, an increase of 147 percent. Earnings increased with stronger crude oil realizations, increased production, lower operating costs and improved downstream margins. These factors were partially offset by unfavourable foreign exchange effects of a stronger Canadian dollar. Strong operating performance in all business segments allowed us to take advantage of higher crude oil realizations in the Upstream and improved margins in petroleum product markets.
Earnings for the first six months of 2010 were $993 million or $1.16 per share, up from $498 million in the first six months of 2009, an increase of 99 percent.
With our strong balance sheet; cash flow from operations; minimal debt; and long-term disciplined approach, we are well positioned to add value to our shareholders through our company growth projects. Capital and exploration expenditures continued at a record pace and were $881 million in the second quarter, relating primarily to the Kearl oil sands project and continued exploration of promising shale gas acreage in Horn River.
We also announced an increase to the quarterly dividend paid to shareholders, which represents the fifteenth consecutive increase in Imperial’s annual per share dividend payments.”
Imperial Oil is one of Canada’s largest corporations and a leading member of the country’s petroleum industry. The company is a major producer of crude oil and natural gas, Canada’s largest petroleum refiner and a leading marketer with a coast-to-coast supply network that includes about 1,850 retail service stations.
1
Second quarter items of interest
| • | Net income was $517 million, compared with $209 million for the second quarter of 2009, an increase of 147% or $308 million. |
| • | Net income per common share was $0.60, an increase of 140% from the second quarter of 2009. |
| • | Cash generated from operating activities was $324 million, compared with $262 million in the same period last year. |
| • | Funding contributions of $295 million were made to the company’s registered pension plan, compared with $6 million in the second quarter of 2009. |
| • | Capital and exploration expenditures were $881 million, up 65% from the second quarter of 2009, supporting the Kearl oil sands and other growth projects. |
| • | Gross oil-equivalent barrels of production averaged 300,000 barrels a day, compared with 271,000 barrels a day in the same period last year. Higher production volumes in the second quarter were primarily due to increased Syncrude volumes, a result of lower maintenance activities. |
| • | Dividend increase – On April 28, 2010, the company declared a quarterly dividend of 11 cents per share, an increase of one cent a share from the previous quarter. The company has paid dividends every year for more than a century and has increased its annual dividend payment for fifteen consecutive years. |
| • | Strathcona refinery wins safety awards – In the second quarter, Imperial’s Strathcona refinery was honoured with two awards. Alberta Employment and Immigration recognized the refinery for best-in-class performance and the Alberta Petro-Chemical Safety Council honoured the facility for achieving best-in-class contractor safety performance. |
| • | Kearl oil sands project update – About 2,500 employees and contractors are currently working at the Kearl site. Construction activities on Kearl in the second quarter included work on piling, foundations and earthworks along with vessel and pipe fabrication. The first phase of Kearl will initially produce about 110,000 barrels of bitumen a day. Production is expected in late 2012. |
| • | Horn River update – Imperial drilled 10 exploration wells and participated in 3D seismic acquisition during the 2009-2010 winter drilling season. The company plans to initiate drilling a horizontal multi-well pad pilot development in the fall of 2010 to evaluate longer-term well productivity. |
| • | Orphan Basin – Imperial is an equity participant (15%) in a Chevron operated exploration well that spud in May 2010 in the Orphan Basin. The area lies offshore of Newfoundland and Labrador. |
| • | Indigenous women’s leadership program launched – In an event attended by Her Excellency Michaëlle Jean, Governor General of Canada, the Imperial Oil and ExxonMobil Foundations announced a $4 million partnership with the Coady International Institute to develop and support the leadership potential of Canadian Aboriginal women. |
| • | Executive management appointments – Effective May 1, 2010, the board of directors of Imperial Oil appointed Paul Masschelin as senior vice-president, finance and administration and treasurer. Mr. Masschelin previously held the position of controller, ExxonMobil Refining & Supply Company and ExxonMobil Research and Engineering Company. |
In addition, effective July 1, 2010, Imperial’s board of directors also appointed Glenn Scott as senior vice-president, resources division. Mr. Scott previously held the position of president of ExxonMobil Canada Limited and production manager for ExxonMobil Canada East.
2
Second quarter 2010 vs. second quarter 2009
The company’s net income for the second quarter of 2010 was $517 million or $0.60 a share on a diluted basis, compared with $209 million or $0.25 a share for the same period last year. Net income for the first six months of 2010 was $993 million or $1.16 a share on a diluted basis, versus $498 million or $0.58 a share for the first half of 2009.
Earnings in the second quarter were higher than the same quarter in 2009 with improvements in all operating segments. Earnings increased primarily due to the impacts of higher crude oil prices of about $150 million, higher Syncrude volumes of about $150 million, lower refinery and Syncrude maintenance of about $85 million and improved downstream margins of about $40 million. These factors were partially offset by the unfavourable foreign exchange effects of a higher Canadian dollar of about $115 million and higher royalty costs due to higher commodity prices of about $70 million. Earnings in the second quarter of 2010 also included a gain of about $30 million from the sale of a non-operating real estate property.
Upstream net income in the second quarter was $446 million, $194 million higher than the same period of 2009. Higher crude oil commodity prices in the second quarter of 2010 increased revenues, contributing to higher earnings of about $150 million. Earnings were also positively impacted by higher Syncrude volumes of about $150 million and lower Syncrude maintenance costs of about $30 million. These factors were partially offset by the unfavourable foreign exchange effects of a higher Canadian dollar of about $90 million and higher royalties due to higher commodity prices of about $70 million.
The average price of Brent crude oil in U.S. dollars, a common benchmark for world oil markets, was $78.27 a barrel in the second quarter of 2010, up about 33 percent from the corresponding period last year. The company’s average realizations on sales of Canadian conventional crude oil and synthetic crude oil from Syncrude production also increased.
Gross production of Cold Lake bitumen averaged 140 thousand barrels a day during the second quarter, versus 139 thousand barrels in the same quarter last year.
The company’s share of Syncrude’s gross production in the second quarter was 81 thousand barrels a day, versus 51 thousand barrels in the second quarter of 2009. Increased production in the second quarter was due to lower maintenance activities.
Gross production of conventional crude oil averaged 24 thousand barrels a day in the second quarter of 2010 and was slightly lower when compared to corresponding period in 2009 due to natural reservoir decline.
Gross production of natural gas during the second quarter of 2010 at 289 million cubic feet a day was essentially unchanged from the same period last year.
Downstream net income was $68 million in the second quarter of 2010, compared with negative $38 million in the same period a year ago. Favourable impacts of about $55 million associated with lower refinery maintenance activities and stronger overall margins of about $40 million were the main contributors to higher earnings. Second quarter earnings also benefited from a gain of about $25 million from the sale of a non-operating real estate property. These factors were partially offset by the unfavourable foreign exchange effects of a higher Canadian dollar of about $25 million.
Net income from Chemical was $22 million in the second quarter, $14 million higher than the same quarter last year. Improved industry margins were partially offset by lower sales volumes for polyethylene products and higher costs due to planned maintenance activities on the Sarnia ethylene cracker.
3
Second quarter 2010 vs. second quarter 2009 (continued)
Net income effects from Corporate and other were negative $19 million in the second quarter, compared with negative $13 million in the same period of 2009. Unfavourable earnings effects in the second quarter were primarily due to higher share-based compensation charges.
In the second quarter of 2010, cash flow of $324 million was generated from operations, compared with $262 million in the same period last year. Higher cash flow was primarily driven by higher earnings partially offset by funding contributions of $295 million to the company’s registered pension plan in the second quarter of 2010.
Investing activities used net cash of $797 million in the second quarter, an increase of $318 million from the corresponding period in 2009. Capital and exploration expenditures were $881 million in the second quarter, compared with $535 million during the same quarter 2009. Expenditures during the quarter were primarily for advancing growth projects such as Kearl.
The company’s balance of cash was $64 million at June 30, 2010, compared with $513 million at the end of 2009.
4
Six months highlights
| • | Net income was $993 million, up from $498 million in the first six months of 2009. |
| • | Net income per common share increased to $1.16 compared to $0.58 in the same period of 2009. |
| • | Cash generated from operations was $1,238 million, versus cash used in operations of $34 million in the first six months of 2009. |
| • | Capital and exploration expenditures were $1,781 million, up 73 percent, supporting the Kearl oil sands and other growth projects. |
| • | Gross oil-equivalent barrels of production averaged 296 thousands of barrels per day, compared to 286 thousands of barrels per day in the first half of 2009. |
| • | Per-share dividends declared in the first two quarters of 2010 totaled $0.21, up from $0.20 in the same period of 2009. |
Six months 2010 vs. six months 2009
Net income for the first six months of 2010 was $993 million or $1.16 a share on a diluted basis, versus $498 million or $0.58 a share for the first half of 2009.
Upstream net income for the first six months was $890 million versus $394 million during the same period last year. Higher crude oil commodity prices in 2010 increased revenues, contributing to higher earnings of about $700 million. Earnings were also positively impacted by higher Syncrude volumes of about $150 million and lower overall maintenance costs of about $50 million. These factors were partially offset by higher royalty costs due to higher commodity prices of about $250 million and the impact of a higher Canadian dollar of about $200 million.
The average price of Brent crude oil in U.S. dollars, a common benchmark for world oil markets, was $77.30 a barrel in the first half of 2010, up about 50 percent from the corresponding period last year. The company’s average realizations on sales of Canadian conventional crude oil and synthetic crude oil from Syncrude production also increased.
For the first six months, Cold Lake gross production was 144 thousand barrels a day this year, compared with 143 thousand barrels in the same period of 2009.
During the first half of the year, the company’s share of gross production from Syncrude averaged 74 thousand barrels a day, up from 60 thousand barrels in 2009. Increased production in the first half of 2010 was due to lower maintenance activities.
Gross production of conventional crude oil averaged 24 thousand barrels a day in the six months of 2010, and was slightly lower when compared to corresponding period in 2009 due to natural reservoir decline.
In the first half of the year, gross production of natural gas was 281 million cubic feet a day, down from 296 million cubic feet in the first six months of 2009. The lower production volume was primarily a result of maintenance activities and natural reservoir decline.
5
Six months 2010 vs. six months 2009 (continued)
Six-month net income from Downstream was $107 million, compared with $164 million in 2009. Lower earnings were primarily due to lower overall margins of about $90 million and the unfavourable effects of a higher Canadian dollar of about $55 million. These factors were partially offset by the favourable impacts of about $65 million associated with lower refinery maintenance activities and gain from sale of non-operating assets.
Chemical net income for the first six months was $21 million, up $10 million from the same period in 2009. Improved industry margins were partially offset by lower sales volumes for polyethylene products and higher costs due to planned maintenance activities.
For the six months, net income effects from Corporate and other were negative $25 million, versus negative $71 million last year. Favourable earnings effects were primarily due to lower share-based compensation charges.
Key financial and operating data follow.
Forward-Looking Statements
Statements in this report relating to future plans, projections, events or conditions are forward-looking statements. Actual future results, including project plans, costs, timing and capacities; financing sources; the resolution of contingencies and uncertain tax positions; the effect of changes in prices and other market conditions; and environmental and capital expenditures could differ materially depending on a number of factors, such as the outcome of commercial negotiations; changes in the supply of and demand for crude oil, natural gas, and petroleum and petrochemical products; political or regulatory events; and other factors discussed in Item 1A of the company’s 2010 Form 10K.
6
Attachment I
IMPERIAL OIL LIMITED
SECOND QUARTER 2010
| Second Quarter | Six Months | |||||||||
| millions of Canadian dollars, unless noted | 2010 | 2009 | 2010 | 2009 | ||||||
| Net income (U.S. GAAP) |
||||||||||
| Total revenues and other income |
6,139 | 5,303 | 12,305 | 9,973 | ||||||
| Total expenses |
5,457 | 5,009 | 10,972 | 9,277 | ||||||
| Income before income taxes |
682 | 294 | 1,333 | 696 | ||||||
| Income taxes |
165 | 85 | 340 | 198 | ||||||
| Net income |
517 | 209 | 993 | 498 | ||||||
| Net income per common share (dollars) |
0.61 | 0.25 | 1.17 | 0.59 | ||||||
| Net income per common share – assuming dilution (dollars) |
0.60 | 0.25 | 1.16 | 0.58 | ||||||
| Gain/(loss) on asset sales, after tax |
36 | 25 | 40 | 26 | ||||||
| Total assets at June 30 |
18,368 | 16,663 | ||||||||
| Total debt at June 30 |
228 | 141 | ||||||||
| Interest coverage ratio – earnings basis |
355.6 | 381.4 | ||||||||
| Other long-term obligations at June 30 |
2,427 | 2,232 | ||||||||
| Shareholders' equity at June 30 |
10,393 | 8,924 | ||||||||
| Capital employed at June 30 |
10,656 | 9,104 | ||||||||
| Return on average capital employed (a) |
20.8 | 27.8 | ||||||||
| Dividends on common stock |
||||||||||
| Total |
93 | 84 | 178 | 170 | ||||||
| Per common share (dollars) |
0.11 | 0.10 | 0.21 | 0.20 | ||||||
| Millions of common shares outstanding |
||||||||||
| At June 30 |
847.6 | 847.6 | ||||||||
| Average – assuming dilution |
854.5 | 854.9 | 854.3 | 858.8 | ||||||
| (a) | Return on capital employed is net income excluding after-tax cost of financing divided by the average rolling four quarters’ capital employed. |
7
Attachment II
IMPERIAL OIL LIMITED
SECOND QUARTER 2010
| Second Quarter | Six Months | |||||||||||
| millions of Canadian dollars | 2010 | 2009 | 2010 | 2009 | ||||||||
| Total cash and cash equivalents at period end |
64 | 390 | 64 | 390 | ||||||||
| Net income |
517 | 209 | 993 | 498 | ||||||||
| Adjustment for non-cash items: |
||||||||||||
| Depreciation and depletion |
192 | 193 | 374 | 390 | ||||||||
| (Gain)/loss on asset sales |
(42 | ) | (31 | ) | (46 | ) | (32 | ) | ||||
| Deferred income taxes and other |
70 | (71 | ) | 72 | (43 | ) | ||||||
| Changes in operating assets and liabilities |
(413 | ) (a) | (38 | ) | (155 | ) | (847 | ) | ||||
| Cash from (used in) operating activities |
324 | 262 | 1,238 | (34 | ) | |||||||
| Cash from (used in) investing activities |
(797 | ) | (479 | ) | (1,604 | ) | (886 | ) | ||||
| Proceeds from asset sales |
54 | 35 | 60 | 37 | ||||||||
| Cash from (used in) financing activities |
3 | (148 | ) | (83 | ) | (664 | ) | |||||
| (a) | Second quarter 2010 cash flow from operating activities was negatively impacted by $295 million funding contributions to the company's registered pension plans. |
8
Attachment III
IMPERIAL OIL LIMITED
SECOND QUARTER 2010
| Second Quarter | Six Months | |||||||||||
| millions of Canadian dollars | 2010 | 2009 | 2010 | 2009 | ||||||||
| Net income (U.S. GAAP) |
||||||||||||
| Upstream |
446 | 252 | 890 | 394 | ||||||||
| Downstream |
68 | (38 | ) | 107 | 164 | |||||||
| Chemical |
22 | 8 | 21 | 11 | ||||||||
| Corporate and other |
(19 | ) | (13 | ) | (25 | ) | (71 | ) | ||||
| Net income |
517 | 209 | 993 | 498 | ||||||||
| Total revenues |
||||||||||||
| Upstream |
1,984 | 1,596 | 4,193 | 3,016 | ||||||||
| Downstream |
5,312 | 4,530 | 10,504 | 8,613 | ||||||||
| Chemical |
331 | 313 | 684 | 585 | ||||||||
| Eliminations/Other |
(1,488 | ) | (1,136 | ) | (3,076 | ) | (2,241 | ) | ||||
| Revenues |
6,139 | 5,303 | 12,305 | 9,973 | ||||||||
| Purchases of crude oil and products |
||||||||||||
| Upstream |
653 | 468 | 1,440 | 832 | ||||||||
| Downstream |
4,237 | 3,566 | 8,424 | 6,433 | ||||||||
| Chemical |
234 | 233 | 510 | 432 | ||||||||
| Eliminations |
(1,488 | ) | (1,136 | ) | (3,077 | ) | (2,246 | ) | ||||
| Purchases of crude oil and products |
3,636 | 3,131 | 7,297 | 5,451 | ||||||||
| Production and manufacturing expenses |
||||||||||||
| Upstream |
573 | 630 | 1,175 | 1,276 | ||||||||
| Downstream |
389 | 400 | 759 | 736 | ||||||||
| Chemical |
50 | 47 | 108 | 95 | ||||||||
| Production and manufacturing expenses |
1,012 | 1,077 | 2,042 | 2,107 | ||||||||
| Capital and exploration expenditures |
||||||||||||
| Upstream |
832 | 471 | 1,687 | 918 | ||||||||
| Downstream |
46 | 61 | 84 | 103 | ||||||||
| Chemical |
2 | 2 | 8 | 6 | ||||||||
| Corporate and other |
1 | 1 | 2 | 2 | ||||||||
| Capital and exploration expenditures |
881 | 535 | 1,781 | 1,029 | ||||||||
| Exploration expenses charged to income included above |
30 | 22 | 117 | 105 | ||||||||
9
Attachment IV
IMPERIAL OIL LIMITED
SECOND QUARTER 2010
| Operating statistics | Second Quarter | Six Months | ||||||
| 2010 | 2009 | 2010 | 2009 | |||||
| Gross crude oil and Natural Gas Liquids (NGL) production |
||||||||
| (thousands of barrels a day) |
||||||||
| Cold Lake |
140 | 139 | 144 | 143 | ||||
| Syncrude |
81 | 51 | 74 | 60 | ||||
| Conventional |
24 | 25 | 24 | 26 | ||||
| Total crude oil production |
245 | 215 | 242 | 229 | ||||
| NGLs available for sale |
7 | 8 | 7 | 8 | ||||
| Total crude oil and NGL production |
252 | 223 | 249 | 237 | ||||
| Gross natural gas production (millions of cubic feet a day) |
289 | 286 | 281 | 296 | ||||
| Gross oil-equivalent production (a) |
||||||||
| (thousands of oil-equivalent barrels a day) |
300 | 271 | 296 | 286 | ||||
| Net crude oil and NGL production (thousands of barrels a day) |
||||||||
| Cold Lake |
112 | 116 | 115 | 128 | ||||
| Syncrude |
74 | 49 | 67 | 60 | ||||
| Conventional |
18 | 19 | 18 | 21 | ||||
| Total crude oil production |
204 | 184 | 200 | 209 | ||||
| NGLs available for sale |
5 | 6 | 5 | 6 | ||||
| Total crude oil and NGL production |
209 | 190 | 205 | 215 | ||||
| Net natural gas production (millions of cubic feet a day) |
265 | 276 | 251 | 269 | ||||
| Net oil-equivalent production (a) |
||||||||
| (thousands of oil-equivalent barrels a day) |
253 | 236 | 247 | 260 | ||||
| Cold Lake blend sales (thousands of barrels a day) |
184 | 180 | 192 | 189 | ||||
| NGL Sales (thousands of barrels a day) |
9 | 6 | 11 | 9 | ||||
| Natural gas sales (millions of cubic feet a day) |
263 | 265 | 263 | 271 | ||||
| Average realizations (Canadian dollars) |
||||||||
| Conventional crude oil realizations (a barrel) |
69.53 | 60.08 | 72.01 | 53.37 | ||||
| NGL realizations (a barrel) |
43.79 | 35.11 | 50.53 | 39.06 | ||||
| Natural gas realizations (a thousand cubic feet) |
3.79 | 3.48 | 4.49 | 4.67 | ||||
| Synthetic oil realizations (a barrel) |
77.98 | 68.27 | 79.91 | 61.11 | ||||
| Bitumen realizations (a barrel) |
54.46 | 56.74 | 58.73 | 45.58 | ||||
| Refinery throughput (thousands of barrels a day) |
418 | 365 | 428 | 412 | ||||
| Refinery capacity utilization (percent) |
83 | 73 | 85 | 82 | ||||
| Petroleum product sales (thousands of barrels a day) |
||||||||
| Gasolines |
214 | 205 | 209 | 198 | ||||
| Heating, diesel and jet fuels |
136 | 135 | 141 | 146 | ||||
| Heavy fuel oils |
31 | 24 | 32 | 28 | ||||
| Lube oils and other products |
47 | 36 | 43 | 36 | ||||
| Net petroleum products sales |
428 | 400 | 425 | 408 | ||||
| Petrochemical Sales (thousands of tonnes a day) |
2.6 | 2.9 | 2.6 | 2.8 | ||||
| (a) | Gas converted to oil-equivalent at 6 million cubic feet = 1 thousand barrels |
10
Attachment V
IMPERIAL OIL LIMITED
SECOND QUARTER 2010
| Net income (U.S. GAAP) | Net income per common share | |||
| (millions of Canadian dollars) | (dollars) | |||
| 2006 |
||||
| First Quarter |
591 | 0.60 | ||
| Second Quarter |
837 | 0.85 | ||
| Third Quarter |
822 | 0.84 | ||
| Fourth Quarter |
794 | 0.83 | ||
| Year |
3,044 | 3.12 | ||
| 2007 |
||||
| First Quarter |
774 | 0.82 | ||
| Second Quarter |
712 | 0.76 | ||
| Third Quarter |
816 | 0.88 | ||
| Fourth Quarter |
886 | 0.97 | ||
| Year |
3,188 | 3.43 | ||
| 2008 |
||||
| First Quarter |
681 | 0.76 | ||
| Second Quarter |
1,148 | 1.29 | ||
| Third Quarter |
1,389 | 1.57 | ||
| Fourth Quarter |
660 | 0.77 | ||
| Year |
3,878 | 4.39 | ||
| 2009 |
||||
| First Quarter |
289 | 0.34 | ||
| Second Quarter |
209 | 0.25 | ||
| Third Quarter |
547 | 0.64 | ||
| Fourth Quarter |
534 | 0.63 | ||
| Year |
1,579 | 1.86 | ||
| 2010 |
||||
| First Quarter |
476 | 0.56 | ||
| Second Quarter |
517 | 0.61 | ||
11
Attachment VI
IMPERIAL OIL LIMITED
SECOND QUARTER 2010
Factors affecting net income (millions of Canadian dollars)
| Upstream Earnings 2Q10 vs 2Q09 | ||||||
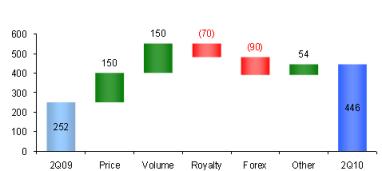
|
2Q10 | 2Q09 | 2Q10 vs 2Q09 | |||
| 446 | 252 | 194 | ||||
| Downstream Earnings 2Q10 vs 2Q09 | ||||||
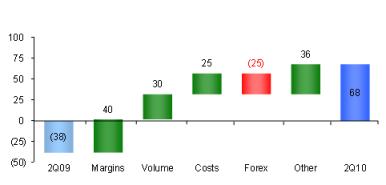
|
2Q10 | 2Q09 | 2Q10 vs 2Q09 | |||
| 68 | (38) | 106 | ||||
| Chemical Earnings 2Q10 vs 2Q09 | ||||||
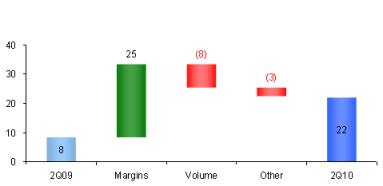
|
2Q10 | 2Q09 | 2Q10 vs 2Q09 | |||
| 22 | 8 | 14 | ||||
12