Attached files
| file | filename |
|---|---|
| 8-K - FORM 8-K - TESSERA TECHNOLOGIES INC | d8k.htm |
| EX-99.1 - PRESS RELEASE - TESSERA TECHNOLOGIES INC | dex991.htm |
Exhibit 99.2

Q2 2010 Earnings Prepared Remarks
Summary Results
The second quarter of 2010 was the best quarter of revenue, excluding settlements, in our history. Total revenue for the second quarter of 2010 was $74.6 million, up 20% from the second quarter of 2009 and 16% from the first quarter of 2010. Micro-electronics revenue was $65.1 million and Imaging & Optics revenue was $9.5 million, of which $6.2 million was products and services.
GAAP net income for the second quarter of 2010 was $15.0 million, or $0.30 per share. Non-GAAP net income was $23.2 million, or $0.45 per share.
We ended the second quarter of 2010 with $437.8 million in cash, cash equivalents, and investments.
Company Overview
Tessera invests in, develops, licenses, and delivers innovative miniaturization technologies for next-generation electronic devices. The company has two business segments; Micro-electronics and Imaging & Optics. Tessera’s primary served markets are memory (especially dynamic random access memory or DRAM) and mobile wireless devices.
Segment Review
Micro-electronics
In our Micro-electronics division, we have advanced integrated circuit (IC) packaging solutions that range from chip scale packaging (CSP) solutions, to multi-chip packaging solutions such as mixed die System-in-Package (SiP) and Package-on-Package (PoP) stacking, to flip chip packaging solutions. We have development efforts underway in advanced packaging and thermal management.
1
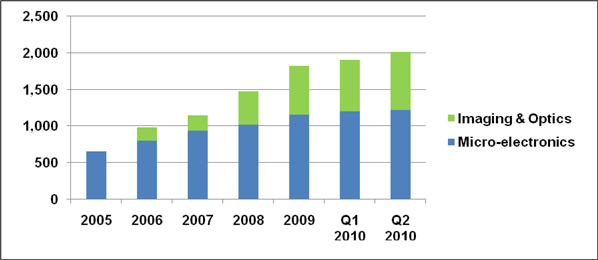
Licensing our innovative packaging technology has generated significant growth in our Micro-electronics segment over the last five years. Royalties and licensee fees, excluding arbitration awards and past production payments, in our Micro-electronics licensing business have grown from $53.6 million for the fiscal year of 2004 to $209.1 million in 2009 or a compound annual growth rate (CAGR) of 31%.
In the DRAM market, our CSP technology is used widely to package DDR2 and DDR3 memory chips. Industry analysts such as Gartner Dataquest forecast that the DRAM market will grow approximately 25% in 2010 over 2009 in terms of units shipped and will more than double from 14 billion units in 2009 to 32 billion units in 2013. We believe we will benefit from the market’s growth, but as we have indicated in the past, it will not be a direct correlation due to volume based pricing incentives in place with two of our DRAM manufacturer licensees.
In the mobile wireless device market, our packaging solutions are used for chips such as baseband processors, Digital Signal Processors (DSP) and Radio Frequency (RF) transceivers. Smart phones, in particular, can contain up to ten devices packaged using our technologies. According to industry analysts such as Gartner, the global market for smart phones is expected to grow 45% in 2010 over 2009. As with the DRAM market, we believe our business will benefit from the industry’s continued use of our packaging technologies. As the functionality in these mobile IC devices has increased, so have requirements for the semiconductor packages. This has driven increased demand for flip chip and fine pitch stacked packages. Tessera has amassed a broad portfolio of packaging technologies and IP through investing substantially in these technology areas.
Due to our continued innovation and expanding IP portfolio, we believe we have the technology and IP that will play a key role in our served DRAM and mobile wireless device markets for years to come.
Our thermal management efforts continue to progress with the development of our silent air cooling technology. We are working to secure early design wins with leading OEMs in the laptop market where the need for silent cooling for very thin devices is an excellent application for our technology. We will pursue a product-based business model for our silent air cooling technology and will likely use outsourced manufacturing partners in Asia. We are pleased that several manufacturing partners have expressed strong interest in engaging with us.
2
Imaging & Optics
During the second quarter we completed our sixth Imaging & Optics acquisition in the past five years with the acquisition of Siimpel, a developer and manufacturer of Micro Electro Mechanical Systems (MEMS) based camera solutions for mobile imaging applications. The other acquisitions were:
| • | Shellcase in December 2005 – the source of our Wafer-level Packaging efforts |
| • | Digital Optics Corp. in July 2006 – the source of our Micro-optics and Wafer-level Optics solutions |
| • | Eyesquad in February 2007 – the source of our Optical Image Enhancement technologies |
| • | FotoNation in February 2008 – the source of our Embedded Image Enhancement technologies, and |
| • | DBlur in May 2009 – an additional source of our Optical Image Enhancement technologies. |
As a result of these acquisitions and our internal development and integration efforts, our Imaging & Optics business now consists of both licensable technologies and products. These technologies and products are used today in electronic consumer devices such as digital still cameras and cell phones. Millions of smart phones today contain our licensable technologies such as our Wafer-level Packaging and Optical and Embedded Image Enhancement solutions, and in the future will contain products such as our MEMS-based Auto-focus and Auto-focus with Shutter solutions. The list of Tessera solutions embedded in smart phones will grow in the future as we expand the benefits and functionality Tessera brings to everyday consumer devices.
Our licensable technology generally falls into two main categories: infrastructure IP and design-in IP. For Wafer-level Packaging and Wafer-level Optics, which we designate infrastructure IP, the average amount of time to get to production and revenue varies according to the nature of the licensee’s facility, its experience, and the technologies being licensed. If a licensee has an existing facility, it can take up to one and a half to two years after a license agreement is executed for royalties to be paid. If the facility needs to be built from scratch, it may take an additional six to nine months. For technologies like our Optical and Embedded Image Enhancement solutions, or what we designate design-in IP, it can take one to one and a half years from the license agreement execution to the payment of royalties.
In infrastructure IP, we currently have six Wafer-level Packaging licensees; Xintec, China WLCSP, AWLP, Nemotek, Q-Tech, and J-CAP. Our Wafer-level Packaging, we believe, is the dominant CSP used to package complementary metal-oxide-semiconductor (CMOS) image sensors. According to industry
3
analyst Prismark, CSP is used to package roughly 47% of all CMOS image sensors, with that share expected to grow to 67% by 2012. Two of our Wafer-level Packaging licensees, Nemotek and Q-Tech also licensed our Wafer-level Optics. Nemotek is production ready and widely sampling Wafer-level Optics and Q-Tech is expecting to commence production of Wafer-level Optics in the fourth quarter of this year
Turning to design-in IP, our Optical Image Enhancement technologies are licensed today for use in cell phones and laptops. Five companies have licensed our Extended Depth of Field (EDOF) technology. The announced licensees are Azurewave, a division of Samsung, ST Micro, and Toshiba. The division of Samsung licensed the technology for use in cell phones and laptops. ST Micro and Toshiba are focused on the cell phone market, while Azurewave’s focus is laptops. We are receiving royalties from one of our announced licensees and expect two more to begin generating royalties in the second half of this year, building a growing stream of revenue from this technology.
Today, our Embedded Image Enhancement technologies are licensed for use in digital still cameras and cell phones. Since the FotoNation acquisition, we introduced four new technologies; BlinkCheck, FaceEnhance, FaceRecognition, and Video Tools. During that time we signed ten new customer agreements including; Casio, Fujitsu, Samsung, and SK Telesys.
Through research, development, and integration of acquired technologies, we continue to invent, productize, and innovate. One example is our Zoom technology, the first combination of our Optical and Embedded Image Enhancement technologies. We expect our first licensee for Zoom in the second half of 2010. Another example is our newest Embedded Image Enhancement technology – Video Tools. We combine image processing hardware acceleration and software into a single solution, which improves recorded video quality through improved image stabilization while reducing demands on system resources.
Turning to the product and services side of Imaging & Optics, our second quarter 2010 product and services revenue was the highest it has been since the first quarter of 2008. Today, the majority of our Imaging & Optics products and services revenue comes from sales of our Micro-optics products into the lithography and communications markets.
4
In addition, we expect our newly expanded product portfolio will also generate growth. With the MEMS based Auto-focus and Auto-focus with Shutter solutions for mobile imaging applications we acquired from Siimpel in the second quarter, our Image Enhancement portfolio now addresses a wider spectrum of the camera module market. We are working on bringing our Gen 2 MEMS-based product to commercialization. Our Gen 2 MEMS-based product is smaller in size than our Gen 1 product, is faster in operation, and reduces power consumption, which is especially important for the increasing demand for mobile video applications. We plan to manufacture these patent-protected products via an outsourced manufacturing model.
We have previously discussed a goal of reaching $100 million in total Imaging & Optics revenue by 2011, which would consist of 70% royalties and license fees and 30% products and services. $100 million in revenue is a milestone on a path to a much larger opportunity for Tessera, and it is a question of when, not if, we will reach that milestone. We have recently determined, however, that neither the $100 million in revenue nor a 70/30 mix is an appropriate public goal for Tessera in 2011, due to the following reasons:
| • | First, the market’s adoption of Wafer-level Optics technology – which dramatically reduces the size and total materials cost of camera modules while maintaining camera performance – is happening at a slower rate than originally anticipated for market participants. This has negatively impacted the near-term outlook for available Wafer-level Optics related royalties. |
| • | Second, we are seeing a significant increase in our Imaging & Optics product opportunities. If we are successful capturing a share of these opportunities, we anticipate that our product and services revenue will be greater than 30% of our Imaging & Optics revenue in 2011. |
| • | Third, we have learned from experience that the variable rate of adoption of our innovative technologies in the growing wireless device market, as well as the somewhat unpredictable nature of the other emerging target markets for our Imaging & Optics technologies, makes the timing of any potential revenue milestone more difficult to predict than we previously anticipated. |
Our recognition that the previously stated 2011 goal is no longer appropriate due to changed circumstances does not diminish our belief in the strength of our technologies and the expanding market opportunities we see before us. We remain confident that Tessera will play an important role in the anticipated multi-billion unit Imaging & Optics market.
5
Patent Portfolio Review
We continue to foster innovation and dedicate resources to research and development. High-quality patents are the international currency of IP. As of June 30, 2010, our patent portfolio totaled over 2,000 domestic and international patents and patent applications. Roughly 1,200 of our patents and patent applications are for technologies in our Micro-electronics segment. Approximately 800 patents and patent applications are for technologies in our Imaging & Optics segment.
6
Financial Discussion
Revenue ($ in millions)
| Q2 2010 | Q2 2009 | Y-0-Y % | Q1 2010 | Q-o-Q % | |||||||||||
| Total Revenue |
$ | 74.6 | $ | 62.3 | 20 | % | $ | 64.3 | 16 | % | |||||
| Micro-electronics |
$ | 65.1 | $ | 55.6 | 17 | % | $ | 55.8 | 17 | % | |||||
| Imaging & Optics |
$ | 9.5 | $ | 6.7 | 43 | % | $ | 8.5 | 11 | % | |||||
Total revenue for the second quarter of 2010 was $74.6 million, which was within the range of our revised guidance provided on June 2, 2010.
Total Micro-electronics revenue for the second quarter of 2010 was $65.1 million, which as previously mentioned is our best revenue quarter in the history of the company, excluding the effects of settlement amounts. As a reminder, Micro-electronics revenue is comprised of royalties and license fees.
Imaging & Optics total revenue is comprised of products and services and royalties and license fees revenue. Second quarter 2010 products and services revenue was $6.2 million, up 15% quarter-over-quarter and 160% year-over-year. Our products and services revenue enjoyed increased growth from our Micro-optics business in connection with the strengthened demand in the semiconductor capital equipment market. Royalties and license fees were $2.4 million in royalties and $0.9 million in license fees, for a total of $3.3 million, which was up 5% quarter-over-quarter, but down 23% year-over-year. For reference, the second quarter of 2009 had $3.1 million in license fees and $1.2 million in royalties. As we have previously indicated, quarterly revenue for this line is uneven due to the timing and amount of license fees, which can be significant relative to ongoing royalties. Royalties for the second quarter were $2.4 million, up 6% quarter-over-quarter and up 113% year-over-year.
Other Income Statement Metrics
Total GAAP operating expenses in the second quarter of 2010 were $48.6 million and included two months of Siimpel operating expenses following the close of the acquisition. Total GAAP operating expenses are as follows:
| • | Cost of revenues: $5.8 million, |
| • | R&D: $18.3 million, |
7
| • | SG&A: $20.2 million, and |
| • | Litigation expense: $4.3 million. |
Second quarter total GAAP operating expenses were up 4% quarter-over-quarter and 12% year-over-year. Siimpel, which had total GAAP operating expenses of $1.9 million, was the primary reason for the quarter-over-quarter increase and accounted for four points of the year-over-year 12 point increase. In addition
| • | Stock based compensation expense was $7.4 million, |
| • | Amortization of acquired intangibles was $3.6 million, |
| • | Other income, net of expense, was $0.4 million, and |
| • | GAAP tax expense was $11.4 million, representing a 43% estimated tax rate for the quarter. |
GAAP Net Income and EPS
| Q2 2010 | Q2 2009 | Y-0-Y % | Q1 2010 | Q-o-Q % | |||||||||||
| GAAP Net Income |
$ | 15.0 | $ | 11.8 | 27 | % | $ | 9.8 | 52 | % | |||||
| GAAP EPS |
$ | 0.30 | $ | 0.24 | $ | 0.20 | |||||||||
| Fully Diluted Shares |
50.3 | 48.8 | 50.1 | ||||||||||||
($ in Millions, except per share and %)
Non GAAP Results
Non-GAAP results exclude stock based compensation, charges for acquired in-process research and development, acquired intangibles amortization, and related tax effects. We have included a detailed reconciliation between our GAAP and Non-GAAP net income in both our earnings release and on our web site for your convenient reference.
Total Non-GAAP operating expenses for the second quarter of 2010 were $37.6 million, and included two months of Siimpel operating expenses. Sequentially, our total Non-GAAP expenses were up 3% quarter-over-quarter and 12% year-over-year, due to higher cost of revenues related to increased product sales from our Micro-optics business, higher R&D expenses supporting our continued innovation efforts, and the impact of the Siimpel acquisition. Excluding litigation expense, Non-GAAP operating expenses totaled $33.3 million in the quarter.
8
Non-GAAP operating expenses were as follows:
| • | Cost of revenues was $4.0 million, |
| • | R&D was $15.0 million, |
| • | SG&A was $14.3 million, and |
| • | Litigation expense was $4.3 million. |
Cost of revenues was up 20% sequentially in connection with higher revenue related to Micro-optics. R&D expense was up 20% quarter-over-quarter, due to the Siimpel acquisition, which contributed the majority of the increase in expenses. SG&A expenses were flat sequentially.
Litigation expense was down 34% sequentially from the first quarter. The first quarter included litigation expense associated with the breach of contract lawsuit we filed against UTAC that settled just before the trial was scheduled to begin.
Non-GAAP Net Income and EPS
Tax adjustments in the second quarter of 2010 for Non-GAAP items were approximately $2.8 million.
| Q2 2010 | Q2 2009 | Y-0-Y % | Q1 2010 | Q-o-Q % | |||||||||||
| Non-GAAP Net Income |
$ | 23.2 | $ | 18.3 | 27 | % | $ | 17.8 | 30 | % | |||||
| Non-GAAP EPS |
$ | 0.45 | $ | 0.37 | $ | 0.35 | |||||||||
| Fully Diluted Shares |
51.2 | 49.7 | 51.0 | ||||||||||||
($ in Millions, except per share and EPS)
Balance Sheet Metrics
We ended the quarter with $437.8 million in cash, cash equivalents, and investments, which represents a $5.7 million increase over the prior quarter. Net cash provided from operations was $24.2 million. Major uses of cash in the quarter included $17.5 million for tax payments, $15.0 million for the acquisition of Siimpel, and $5.0 million for purchases of capital equipment.
Third Quarter 2010 Guidance
Total revenue for the third quarter 2010 will range between $79 million and $82 million, which represents an increase of approximately 20% to 24% over third quarter 2009 total revenues of $66.1 million. Micro-electronics revenue will range between $69 million and $72 million, all of which will be royalty and license related. Third quarter revenue includes $6 million we expect to receive from UTAC as a result of the settlement in the first quarter of the breach of contract litigation we filed against UTAC. As a comparison, third quarter 2009 Micro-electronics royalties and license fees were $59.1 million and included approximately $4 million from several one-time items.
9
As a reminder, two major DRAM manufacturers who are licensees of ours have volume pricing adjustments in their licenses which may cause, at certain high unit shipment volumes, and for these two DRAM manufacturers only, our aggregate annual DRAM royalty revenue to grow less rapidly than annual growth in overall unit shipments in the DRAM segment. An additional effect may include some quarter-to-quarter fluctuations in growth in our revenues from the DRAM segment, depending on the overall unit growth of the DRAM market and the relative DRAM market share enjoyed by these two DRAM manufacturers. As the unit growth of the DRAM market in 2010 is occurring at a faster pace than in 2009, we expect to see some impact from these volume pricing adjustments on our third quarter Micro-electronics revenue, which is reflected accordingly in the guidance.
Third quarter 2010 Imaging & Optics revenue, in total, is expected to be approximately $10 million. This compares to third quarter of 2009 Imaging & Optics revenue of $7.0 million. Royalties and license fees are expected to be approximately $4.5 million as we anticipate increased royalties from our EDOF licensees. As a comparison, royalties and license fees were $3.7 million in the third quarter of 2009, which included $2.6 million of license fees. Sequentially, royalties and license fees are expected to be up approximately $1.2 million over the $3.3 million in the second quarter of 2010.
Third quarter 2010 products and services revenue is expected to be approximately $5.5 million. This business is a backlog and purchase order business. This is down from the prior quarter due to what we believe is a one quarter product mix change at an end customer.
Third quarter 2010 Non-GAAP operating expenses, less litigation expense, are expected to range between $35 million and $36 million.
Non-GAAP cost of revenues is expected be down approximately 10% sequentially due to lower products and services revenue.
10
Non-GAAP R&D is expected to be up approximately 19% sequentially which includes the full quarter effect of Siimpel, in addition to anticipated hiring, increased outside service costs, materials, and patent filing costs.
Non-GAAP SG&A is expected to be flat sequentially.
We expect our litigation expense in the third quarter of 2010 to be up slightly in comparison to the prior quarter. This expense is expected to increase due to the Hynix antitrust action, the Amkor arbitration, and legal activity related to the appeals of the International Trade Commission (ITC) 605 and 630 cases, which are both pending in the U.S. Court of Appeals for the Federal Circuit. If a trial date is set in the Hynix antitrust action within the quarter, our litigation expense may increase.
We expect third quarter 2010 stock based compensation to be approximately $7.0 million and amortization charges to be $3.8 million.
Our estimated tax rate for fiscal year 2010 is expected to be approximately 43%.
Litigation Review
Our two International Trade Commission actions are now on appeal before the U.S. Court of Appeals for the Federal Circuit. Following oral argument, the appeal of the ITC 605 Wireless Action was submitted to the Court and we await the Federal Circuit’s ruling in that matter. In the ITC 630 DRAM Action, we are preparing our reply brief, which is due August 6, 2010. The Federal Circuit has not yet set a date for oral argument for the 630 case.
We are making progress in the pretrial phase of the antitrust case we filed against Hynix. The Court has scheduled pretrial case management hearings to occur on August 24 and 25, as well as September 9 and 24, 2010, but has not yet set a formal trial date in the case.
Similarly, we are making progress, albeit slowly, in the Amkor arbitration. The arbitration panel recently re-scheduled a hearing on a discrete part of the case, namely, certain issues arising from the previous arbitration, from September to December 2010. As a reminder, the previous Amkor arbitration took approximately three years before being resolved in Tessera’s favor.
11
Safe Harbor Statement
This document contains forward-looking statements, which are made pursuant to the safe harbor provisions of the Private Securities Litigation Reform Act of 1995. Forward-looking statements involve risks and uncertainties that could cause actual results to differ significantly from those projected, particularly with respect to the company’s financial results, the size of market opportunities, growth of the company’s served markets, industry and technology trends, use of the company’s technology in additional applications, impact of volume based pricing incentives in our Micro-electronics segment and revenue growth in our Imaging & Optics segment, future investment and development resources, the expansion of the company’s intellectual property portfolios, and the company’s IP protection efforts, including litigation. Material factors that may cause results to differ from the statements made include delays, setbacks or losses relating to our intellectual property or intellectual property litigations, or any invalidation or limitation of our key patents; fluctuations in our operating results due to the timing of new license agreements and royalties, or due to legal costs; changes in patent laws, regulation or enforcement, or other factors that might affect our ability to protect our intellectual property; the risk of a decline in demand for semiconductor products; failure by the industry to adopt our technologies; competing technologies; the future expiration of our patents; the future expiration of our license agreements and the cessation of related royalty income; the failure or refusal of licensees to pay royalties; failure to achieve the growth prospects and synergies expected from acquisition transactions; and delays and challenges associated with integrating acquired companies with our existing businesses. You are cautioned not to place undue reliance on the forward-looking statements, which speak only as of the date of this release. Tessera’s filings with the Securities and Exchange Commission, including its Annual Report on Form 10-K for the year ended Dec. 31, 2009, and Form 10-Q for the quarter ended March 31, 2010 include more information about factors that could affect the company’s financial results. Tessera assumes no obligation to update information contained in this press release. Although this release may remain available on Tessera’s website or elsewhere, its continued availability does not indicate that Tessera is reaffirming or confirming any of the information contained herein.
Non-GAAP Financial Measures
In addition to disclosing financial results calculated in accordance with U.S. generally accepted accounting principles (GAAP), this document contains non-GAAP financial measures adjusted for either
12
one-time or ongoing non-cash acquired intangibles amortization charges, acquired in-process research and development, all forms of stock-based compensation, and related tax effects. The non-GAAP financial measures also exclude the effects of FASB Accounting Standards Codification Topic 718 – Stock Compensation upon the number of diluted shares used in calculating non-GAAP earnings per share. Management believes that the non-GAAP measures used in this report provide investors with important perspectives into the company’s ongoing business performance. The non-GAAP financial measures disclosed by the company should not be considered a substitute for, or superior to, financial measures calculated in accordance with GAAP, and the financial results calculated in accordance with GAAP and reconciliations to those financial statements should be carefully evaluated. The non-GAAP financial measures used by the company may be calculated differently from, and therefore may not be comparable to, similarly titled measures used by other companies.
13