Attached files
| file | filename |
|---|---|
| 8-K - FORM 8-K - FULTON FINANCIAL CORP | f8k.htm |

1
Fulton Financial
Corporation
-------------------------------------
July 2010
Investor Presentation
Data as of June 30, 2010

2
Forward-Looking Statement
n This presentation may contain forward-looking statements about Fulton Financial Corporation’s financial
condition, results of operations, business, strategies, products and services. You can identify forward-looking
statements by the use of words such as “may”, “should”, “will”, “could”, “estimates”, “predicts”, “potential”,
“continue”, “anticipates”, “believes”, “plans”, “expects”, “future” and “intends” and similar expressions
which are intended to identify forward-looking statements.
n Such forward-looking statements reflect the current beliefs and expectations of the Corporation’s
management, are based on estimates, assumptions and projections about the Corporation’s business and its
industry, and involve significant risks and uncertainties, some of which are beyond our control and difficult to
predict. These statements are not guarantees of future performance and actual results may differ materially
from those expressed or forecasted in the forward-looking statements. The Corporation undertakes no
obligation to update or revise any forward-looking statements, whether as a result of new information, future
events or otherwise. Accordingly, investors and others are cautioned not to place undue reliance on such
forward-looking statements.
n Many factors could affect future financial results including, without limitation, asset quality and the impact of
adverse changes in the economy and in credit or other markets and resulting effects on credit risk and asset
values; acquisition and growth strategies; market risk; changes or adverse developments in economic,
political or regulatory conditions; a continuation or worsening of the current disruption in credit and other
markets, including the lack of or reduced access to, and the abnormal functioning of markets for mortgages
and other asset-backed securities and for commercial paper and other short-term borrowings; changes in the
levels of Federal Deposit Insurance Corporation deposit insurance premiums and assessments; the effect of
competition and interest rates on net interest margin and net interest income; investment strategy and income
growth; investment securities gains and losses; declines in the value of securities which may result in charges
to earnings; changes in rates of deposit and loan growth or a decline in loans originated; balances of risk-
sensitive assets to risk-sensitive liabilities; salaries and employee benefits and other expenses; amortization
of intangible assets; goodwill impairment; capital and liquidity strategies; and other financial and business
matters for future periods.
n For a more complete discussion of certain risks and uncertainties affecting the Corporation, please see the
sections entitled “Risk Factors” and “Management’s Discussion and Analysis of Financial Condition and
Results of Operations” set forth in the Corporation’s filings with the Securities and Exchange Commission.
sections entitled “Risk Factors” and “Management’s Discussion and Analysis of Financial Condition and
Results of Operations” set forth in the Corporation’s filings with the Securities and Exchange Commission.

3
Presentation Outline
u Corporate Profile
u Franchise and Markets
u Overview of the 2nd Quarter
u Capital
u Earnings/Peer Group
u Financial Performance
u Supplemental Credit Information
u Investment Portfolio

4
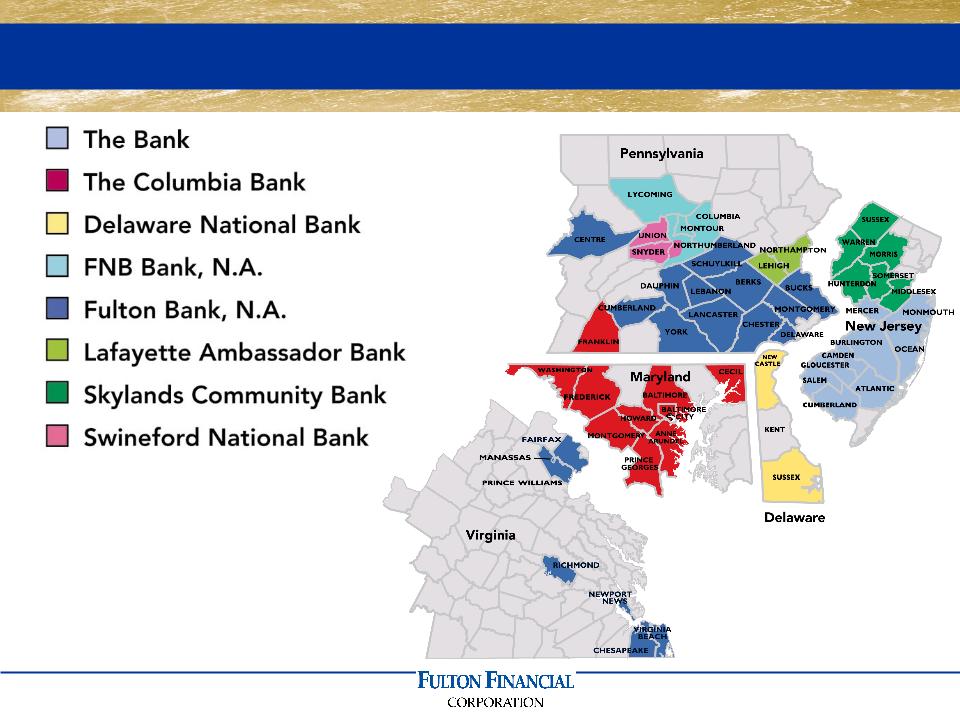
Fulton Financial Profile (as of 6/30/10)
n Mid-Atlantic regional financial holding company
n A family of 8 community banks in 5 states
n Fulton Financial Advisors
n Fulton Mortgage Company
n 270 community banking offices
n Asset size: $ 16.6 billion
n 3,950 Team Members
n Market capitalization: $ 1.8 billion
n Book value per common share: $ 9.37
n Tangible book value per common share: $ 6.60
n Shares outstanding: 198.5 million
5
A Valuable Geographic Franchise

6
Care, Listen, Understand, Deliver
Superior Customer Experience
7
COMMUNITY BANKING
SMALL BUSINESS
HIGH NET WORTH
RETAIL BANKING
LISTENING IS JUST THE BEGINNING.
Our Brand

8
Overview of the 2nd Quarter
n Strong investment community response to our
$230 million capital raise
$230 million capital raise
n Good core deposit growth / strong liquidity
position
position
n Regulation E communication plan implemented
and ongoing
and ongoing
n Expenses well controlled / core competency
n Named 100 Most Trustworthy Companies by
Forbes
Forbes

9
Overview of the 2nd Quarter / Credit
n Non-performing assets increased from prior quarter
n Linked quarter decrease in overall delinquency
n Earning asset growth a challenge / slow economic
recovery
recovery
n $ 40 million provision unchanged from prior quarter
n Asset quality ratios compare favorably to peers
n Diversified loan portfolio with managed reduction in
construction exposure
construction exposure

10
TARP Repayment Completed
n Preferred shares redeemed in full on July 14, 2010
n Eliminates $18.8 million in annual dividends to the
U. S. Treasury
U. S. Treasury
n Additional capital cushion initially obtained as
“insurance” for protracted recession no longer
necessary
“insurance” for protracted recession no longer
necessary
n Positions corporation for future growth
opportunities, both organic and through
acquisition
opportunities, both organic and through
acquisition

11
|
|
Reported(1)
|
Pro-Forma(2)
|
|
GAAP Capital
|
$2.23 billion
|
$1.85 billion
|
|
Total Risk-Based Capital
|
$2.17 billion
|
$1.75 billion
|
|
Total Risk-Based Capital
|
16.60%
|
13.70%
|
|
Tier 1 Risk-Based Capital
|
14.10%
|
11.20%
|
|
Leverage Capital
|
11.30%
|
8.90%
|
|
Tangible Common Equity
|
8.20%
|
8.20%
|
|
Tangible Common Equity
to Risk-Weighted Assets |
10.20%
|
10.20%
|
(1) Risk-based and leverage capital ratios are estimates.
(2) Including estimated effect of TARP repayment.
Capital 6/30/10

12
Forbes.com
n Fulton Financial named one of the nation’s “100
Most Trustworthy Companies”
Most Trustworthy Companies”
n Selected from over 8,000 publicly held companies
n Only bank included in
large-cap or mid-cap
company lists
n One of only 4 banks
on entire list
n Criteria: governance,
accounting practices,
financial transparency

13
n 51 relationships with commitments to lend
of $20 million or more
n Maximum individual commitment: $33 million
n Maximum commitment land development:
$25 million
n Maximum commitment any one development
project: $15 million
project: $15 million
n Average commercial lending relationship size is
$460,957
$460,957
n Loans and corresponding relationships are
within Fulton’s geographic market area
within Fulton’s geographic market area
Summary of Larger Loans

14
Financial Performance
15
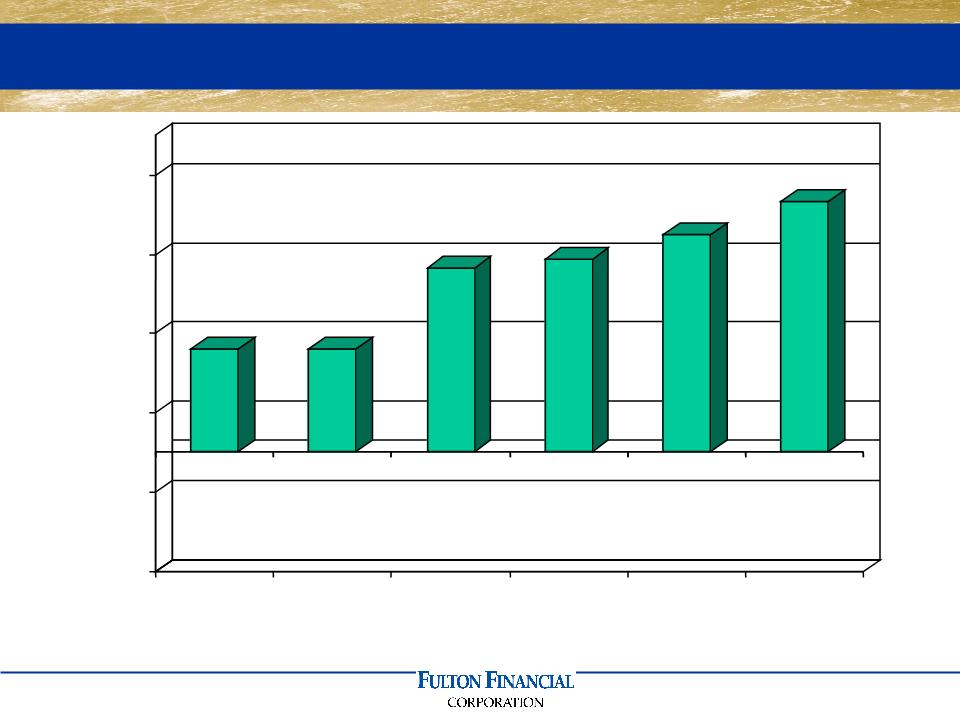
13.1
13.1
23.3
24.4
27.5
31.7
-15.0
-5.0
5.0
15.0
25.0
35.0
Q1 09
Q2 09
Q3 09
Q4 09
Q1 10
Q2 10
Quarterly Net Income (in millions)
16
Net Interest Income
139,160
$
138,510
$
650
$
0%
Loan Loss Provision
(40,000)
(40,000)
-
0%
Other Income
43,060
39,690
3,370
8%
Securities Losses
900
(2,220)
3,120
n/m
Other Expenses
(100,160)
(99,230)
(930)
1%
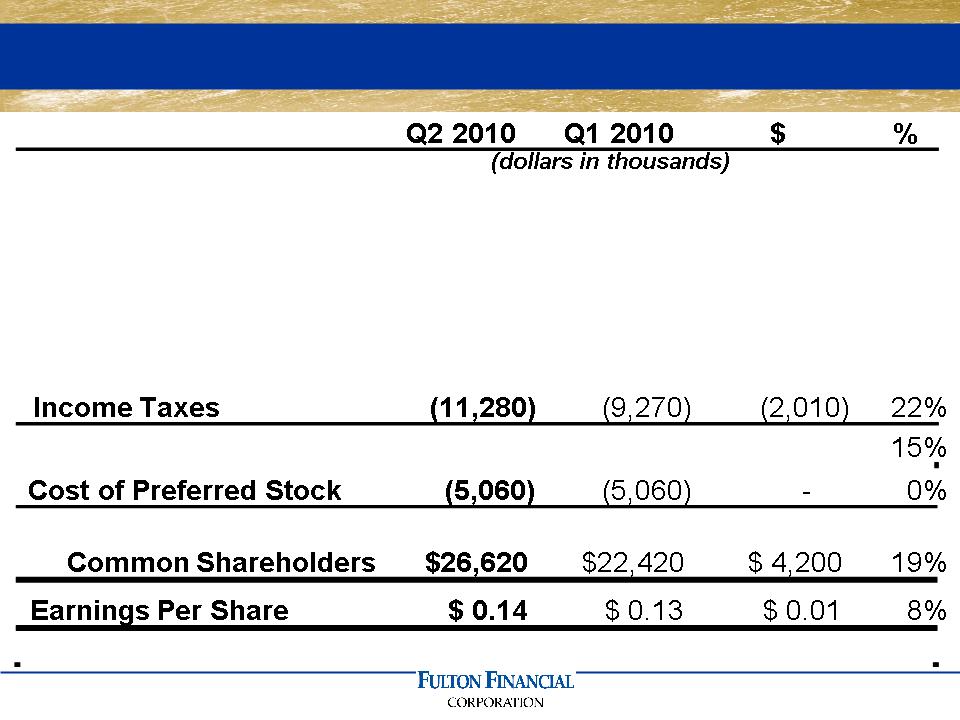
Net Income
31,680
27,480
4,200
Net Income Available to
Income Statement Summary (Q2 2010 vs. Q1 2010)

17
Net Interest Income
277,670
$
252,060
$
25,610
$
10%
Loan Loss Provision
(80,000)
(100,000)
20,000
-20%
Other Income
82,750
89,300
(6,550)
-7%
Securities (Losses) Gains
(1,320)
3,000
(4,320)
n/m
Other Expenses
(199,390)
(214,180)
14,790
-7%
Net Income
59,160
26,200
32,960
Cost of Preferred Stock
(10,130)
(10,080)
(50)
0%
Net Income Available to
Income Statement Summary (YTD June)

18
International Bancshares Corporation
Old National Bancorp
South Financial Group, Inc.
Susquehanna Bancshares, Inc.
TCF Financial Corporation
Trustmark Corporation
UMB Financial Corporation
United Bankshares, Inc.
Valley National Bancorp
Whitney Holding Corporation
Wilmington Trust Corporation
*Fulton’s peer group as of June 30, 2010
Associated Banc-Corp
BancorpSouth, Inc.
Bank of Hawaii Corporation
BOK Financial Corporation
Citizens Republic Bancorp
City National Corporation
Commerce Bancshares, Inc.
Cullen/Frost Bankers, Inc.
First Citizens BancShares, Inc.
First Midwest Bancorp, Inc.
First Merit Corporation
Peer Group*

19
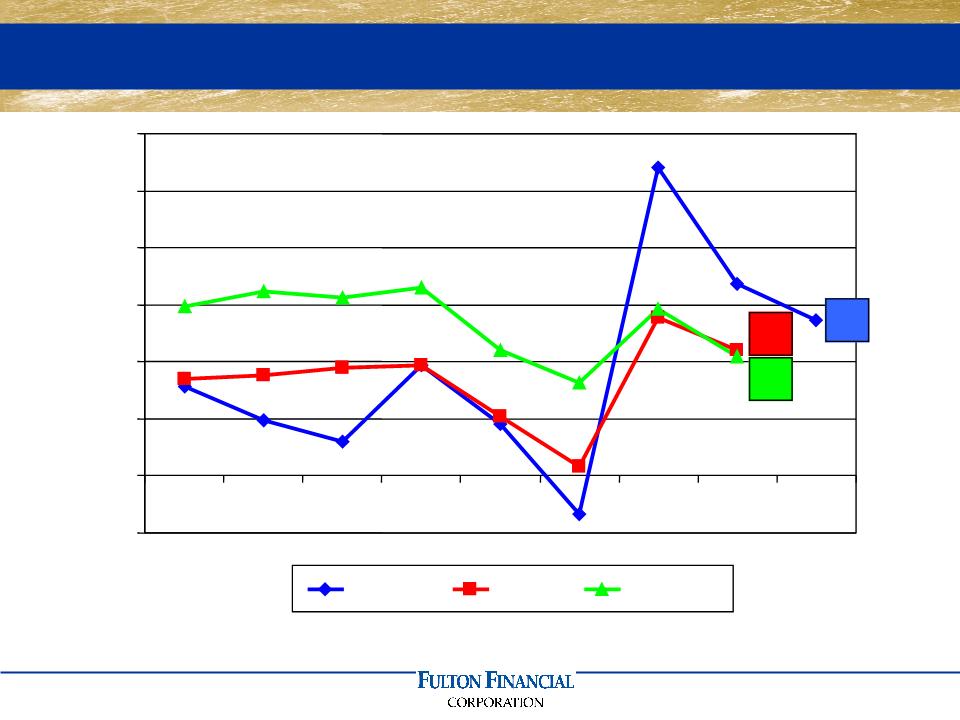
3.77
3.66
3.39
3.00
3.25
3.50
3.75
4.00
Q1
06
Q2
06
Q3
06
Q4
06
Q1
07
Q2
07
Q3
07
Q4
07
Q1
08
Q2
08
Q3
08
Q4
08
Q1
09
Q2
09
Q3
09
Q4
09
Q1
10
YTD
6/10
FULT
Peer
Top 50
Net Interest Margin

20
Q2 2010
Q1 2010
$
%
(dollars in millions)
Comm'l Mort
4,320
$
4,310
$
10
$
0%
Commercial
3,690
3,690
-
0%
Home Equity
1,640
1,640
-
0%
Resid Mort
970
940
30
3%
Construction
910
960
(50)
-5%
Cons./Other
430
430
-
0%
Total Loans
11,960
$
11,970
$
(10)
$
0%
Average Loans (Q2 2010 vs. Q1 2010)

21
2010
2009
$
%
(dollars in millions)
Comm'l Mort
4,310
$
4,070
$
240
$
6%
Commercial
3,690
3,660
30
1%
Home Equity
1,640
1,680
(40)
-2%
Resid Mort
960
950
10
1%
Construction
940
1,190
(250)
-21%
Cons./Other
430
450
(20)
-4%
Total Loans
11,970
$
12,000
$
(30)
$
0%
Average Loans (June 30th - Year to Date)
22
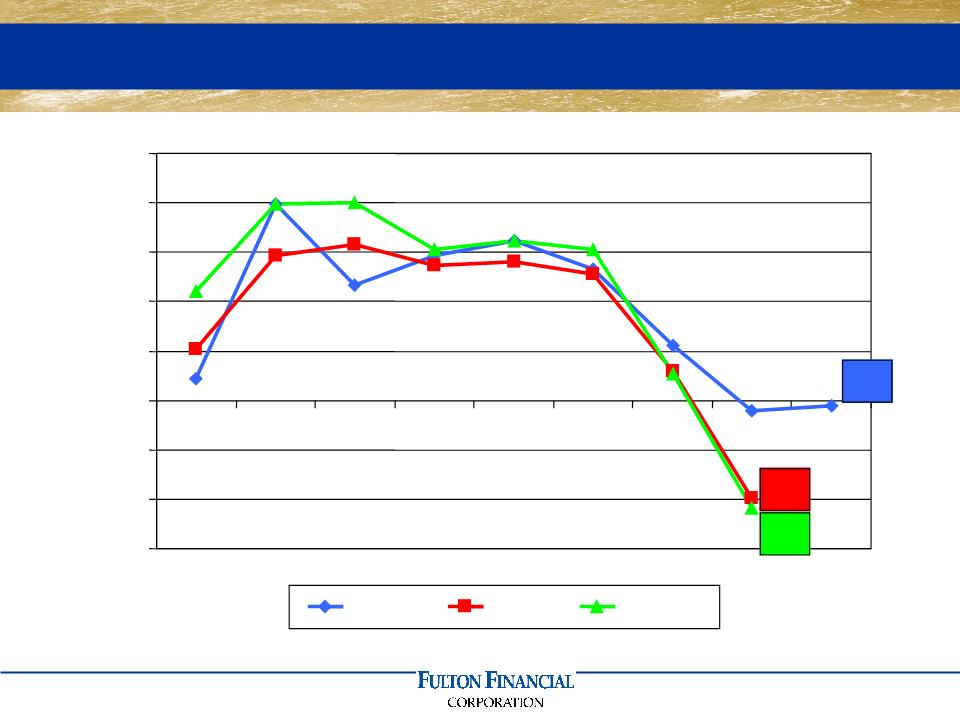
-0.3
-5.9
-6.5
-9.0
-6.0
-3.0
0.0
3.0
6.0
9.0
12.0
15.0
03
04
05
06
07
08
09
Q1 10
YTD
6/10
FULT
Peer
Top 50
Average Loan Growth
23
0.96
1.22
1.69
0.00
0.50
1.00
1.50
2.00
01
02
03
04
05
06
07
08
09
Q1 10
YTD
6/10
FULT
Peer
Top 50
Net Charge-Offs To Average Loans

24
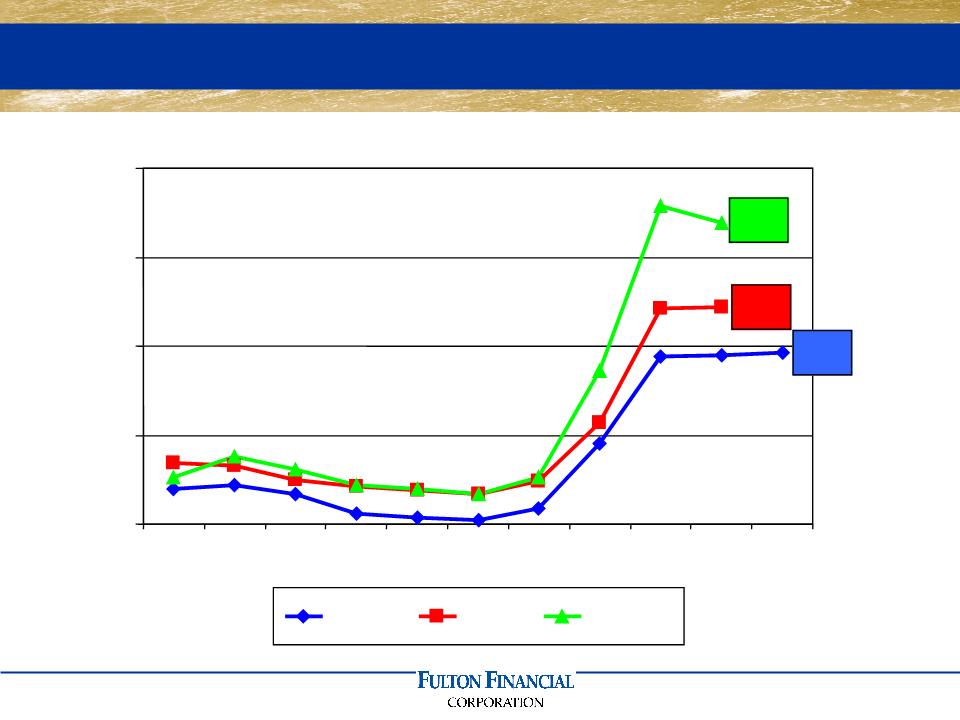
2.65
2.46
3.21
0.00
1.00
2.00
3.00
4.00
04
05
06
07
08
09
Q1 10
Q2 10
FULT
Peer
Top 50
Non-performing Loans to Loans
25
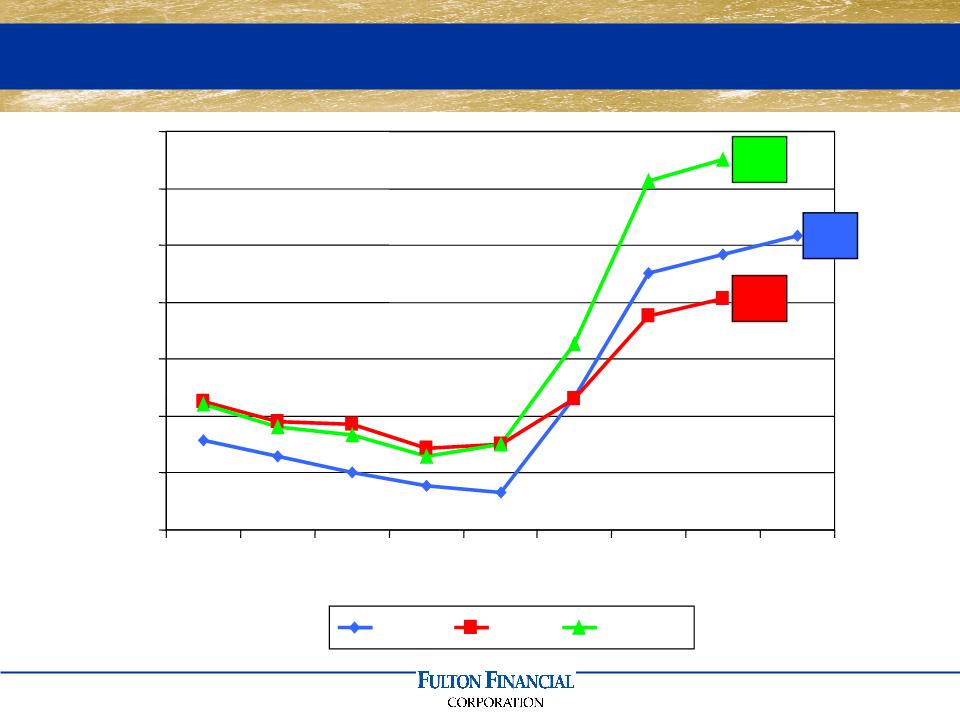
2.35
2.02
2.75
0.80
1.10
1.40
1.70
2.00
2.30
2.60
2.90
03
04
05
06
07
08
09
Q1 10
Q2 10
FULT
Peer
Top 50
Allowance to Loans
26
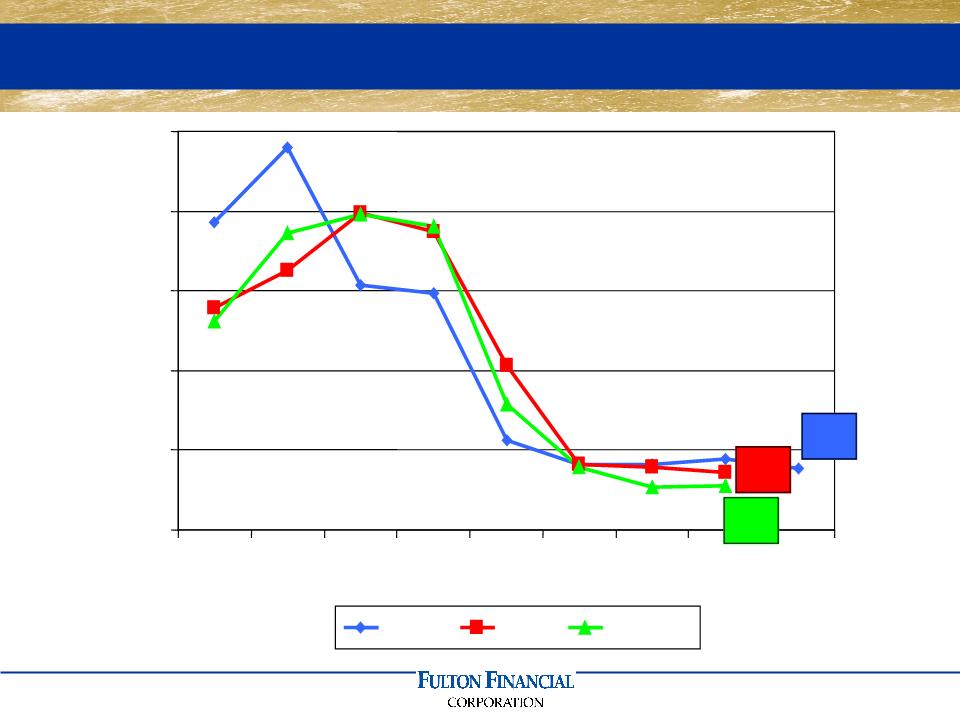
88.5
85.8
77.9
50.0
100.0
150.0
200.0
250.0
300.0
03
04
05
06
07
08
09
Q1 10
Q2 10
FULT
Peer
Top 50
Allowance to Non-performing Loans

27
Q2 2010
Q1 2010
$
%
(dollars in millions)
Nonint DDA
2,080
$
1,970
$
110
$
6%
Int DDA
2,020
1,980
40
2%
Savings/MMDA
3,090
2,850
240
8%
CD's
5,120
5,210
(90)
-2%
Cash Management
470
470
-
0%
Total Deposits
12,780
$
12,480
$
300
$
2%
Average Deposits (Q2 2010 vs. Q1
2010)
2010)

28
2010
2009
$
%
(dollars in millions)
Nonint DDA
2,030
$
1,740
$
290
$
17%
Int DDA
2,000
1,790
210
12%
Savings/MMDA
2,970
2,180
790
36%
CD's
5,160
5,520
(360)
-7%
Cash Management
470
570
(100)
-18%
Total Deposits
12,630
$
11,800
$
830
$
7%
Average Deposits (June 30th - Year to Date)
29
8.2
6.6
6.3
(3.0)
0.0
3.0
6.0
9.0
12.0
15.0
18.0
03
04
05
06
07
08
09
Q1 10
YTD
6/10
FULT
Peer
Top 50
Average Deposit Growth
30
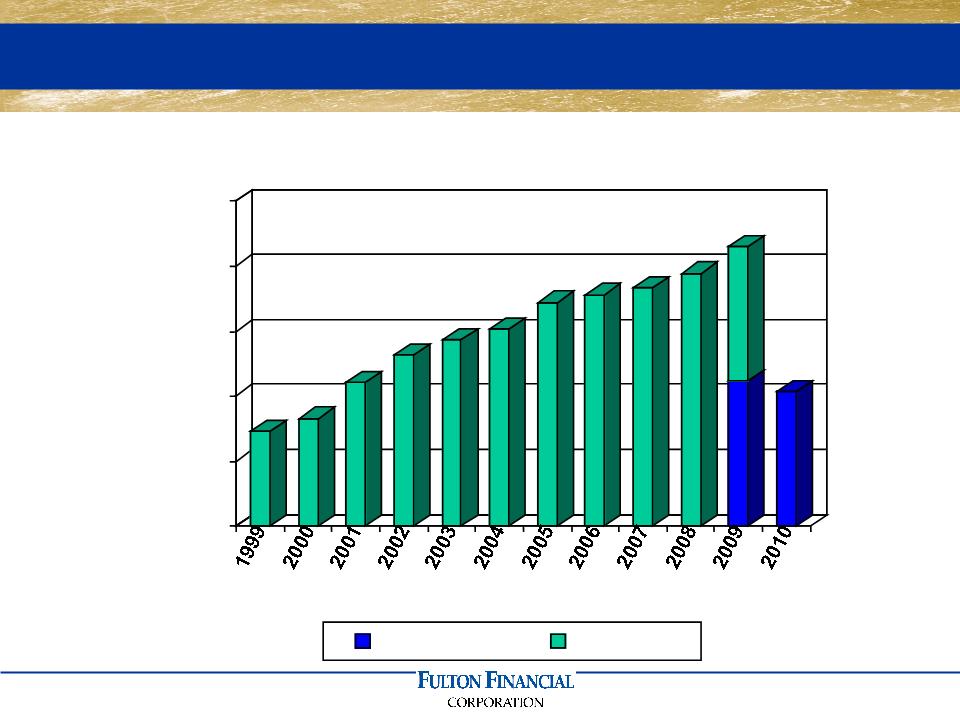
0.0
40.0
80.0
120.0
160.0
200.0
Millions
YTD June
YTD Dec
Other Income
31
(dollars in thousands)
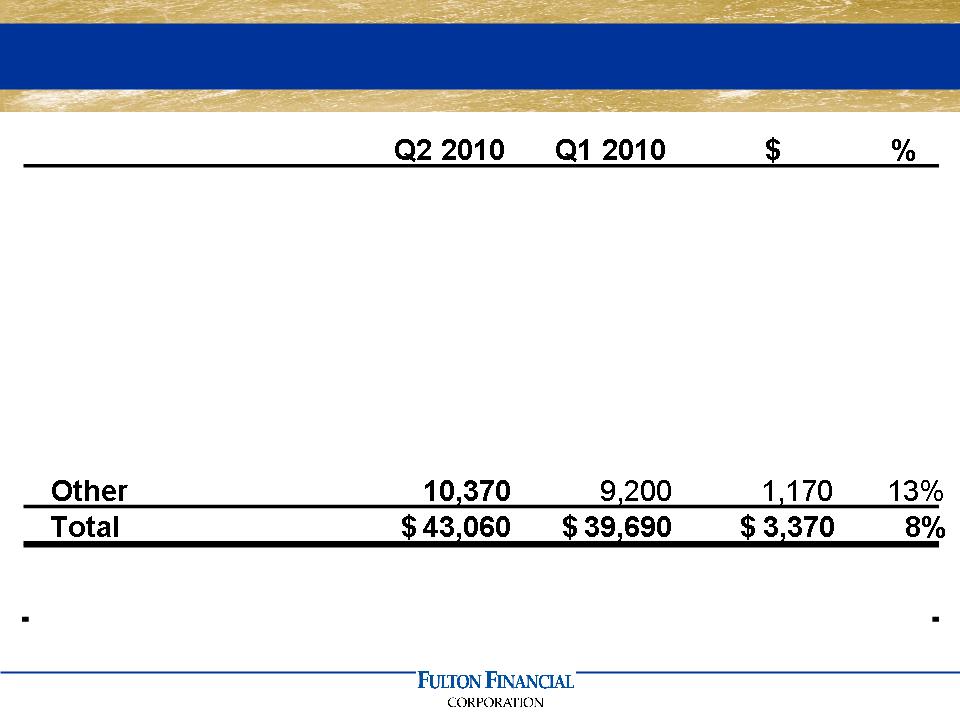
Overdraft & NSF Fees
9,620
$
8,880
$
740
$
8%
Invt Mgt & Trust
8,660
8,090
570
7%
Debit Card Fees
3,370
2,950
420
14%
Service Charges
3,350
3,110
240
8%
Mort. Sales Gains
3,060
3,360
(300)
-9%
Cash Mgt Fees
2,510
2,280
230
10%
Merchant Fees
2,120
1,820
300
16%
Other Income (Q2 2010 vs. Q1 2010)
32
(dollars in thousands)
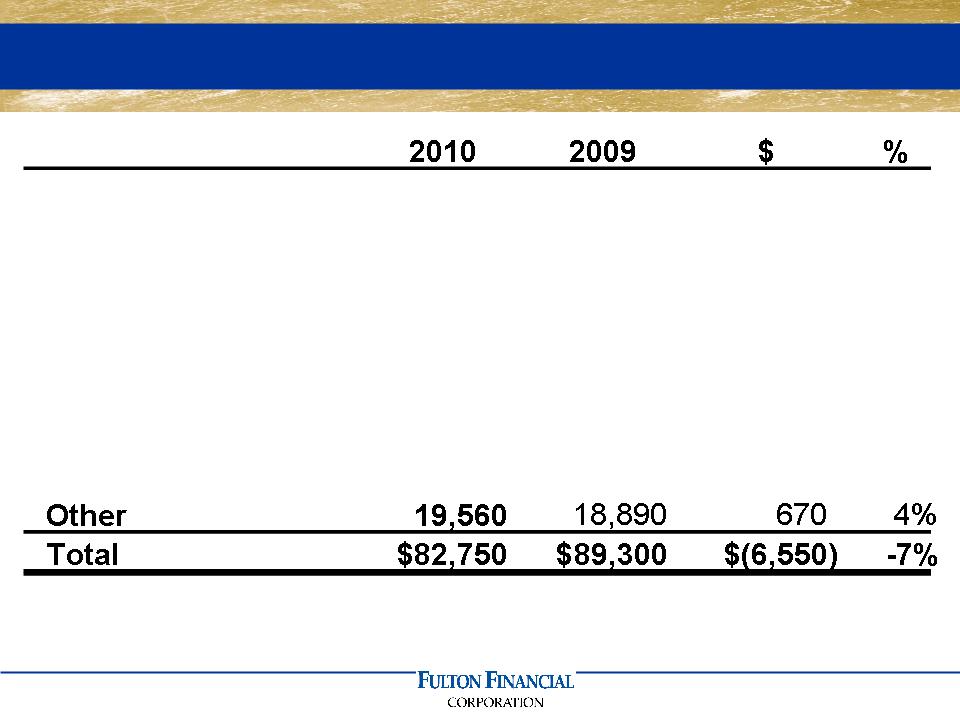
Overdraft & NSF Fees
18,500
$
17,230
$
1,270
$
7%
Invt Mgt & Trust
16,740
15,780
960
6%
Service Charges
6,460
6,430
30
0%
Mort. Sales Gains
6,430
15,990
(9,560)
-60%
Debit Card Fees
6,320
5,190
1,130
22%
Cash Mgt Fees
4,790
6,290
(1,500)
-24%
Merchant Fees
3,950
3,500
450
13%
Other Income (June 30th - Year to Date)

33
53.4
61.4
62.4
50.0
52.0
54.0
56.0
58.0
60.0
62.0
64.0
03
04
05
06
07
08
09
1Q 10
YTD
6/10
FULT
Peer
Top 50
Efficiency Ratio Lower Than Peers
34
(dollars in thousands)
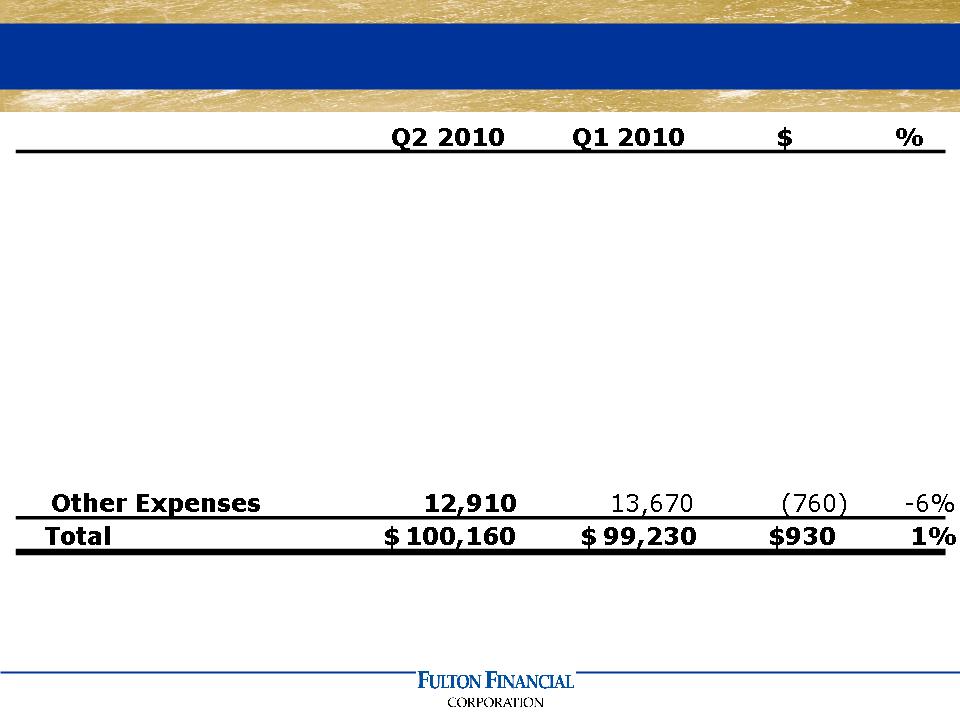
Salaries & Benefits
54,650
$
52,350
$
2,300
$
4%
Occupancy & Equip.
13,180
14,740
(1,560)
-11%
FDIC Insurance
5,140
4,950
190
4%
Data Proc. & Software
4,070
4,240
(170)
-4%
Legal & Audit
3,030
2,550
480
19%
Supplies & Postage
2,820
2,630
190
7%
Marketing
2,270
1,830
440
24%
Telecommunications
2,090
2,270
(180)
-8%
Other Expense (Q2 2010 vs. Q1 2010)

35
(dollars in thousands)
Salaries & Benefits
107,000
$
111,100
$
(4,100)
$
-4%
Occupancy & Equip.
27,920
27,640
280
1%
FDIC Insurance
10,090
16,490
(6,400)
-39%
Data Proc. & Software
8,310
9,240
(930)
-10%
Legal & Audit
5,580
4,320
1,260
29%
Supplies & Postage
5,460
5,370
90
2%
Telecommunications
4,360
4,340
20
0%
Marketing
4,100
4,290
(190)
-4%
Operating Risk Loss
1,150
6,340
(5,190)
-82%
Other Expense (June 30th - Year to Date)

36
Future Growth Initiatives
n Leverage local community banking
market presence and brand
market presence and brand
n Core deposit growth / segmentation
n Organic growth / increase market share
n Grow quality earning assets
n Superior customer experience /
relationship strategy
relationship strategy
n Grow non-interest income
n Branch expansion / select markets

37
Fulton Financial Corporation
One Penn Square
Lancaster, PA 17602
www.fult.com

38
Supplemental Credit
Information
Information

39
Manufacturing
13.6
RE - Rental and Leasing
13.0
Construction
11.6
Agriculture
8.6
Retail
8.4
Wholesale
7.0
Health Care
6.6
Other
5.5
Financial Services
3.1
Arts and Entertainment
2.4
Transportation
Commercial Loans by Industry (June 30, 2010)

40
Average
% of
10 v. 09
%
Balance
Total
Growth
Growth
Pennsylvania
6,670,000
$
55.8%
225,000
$
2%
New Jersey
2,474,000
20.7%
(24,000)
-1%
Maryland
1,427,000
11.9%
(136,000)
-8%
Virginia
1,056,000
8.8%
(54,000)
-6%
Delaware
333,000
2.8%
(12,000)
-4%
11,960,000
$
Loan Distribution by State (Q2 2010)
41
Provision
Net Charge-Offs / Average Loans
$50
$45
$45
$40
$40
$0
$20
$40
$60
Q2 2009
Q3 2009
Q4 2009
Q1 2010
Q2 2010
($ in millions)
0.97%
0.81%
0.97%
0.95%
0.97%
0.00%
0.50%
1.00%
1.50%
Q2 2009
Q3 2009
Q4 2009
Q1 2010
Q2 2010
Provision and Net Charge-Offs Stable

42
Comm'l
Res. Mtg.
(in thousands)
Pennsylvania
5,373
$
417
$
1,674
$
432
$
1,102
$
8,998
$
Maryland
(476)
-
(483)
138
443
(378)
New Jersey
7,477
3,308
4,939
232
358
16,314
Virginia
(189)
33
2,588
948
261
3,641
Delaware
Avg Loans
3,686,000
4,320,000
910,000
2,610,000
434,000
11,960,000
NCO %
1.33%
0.35%
3.83%
0.29%
2.11%
0.97%
Net Charge-offs (Q2 2010)

43
|
Category
|
Total (%)
6/30/09
|
90-Days
6/30/09
|
Total (%)
6/30/10
|
90-Days
6/30/10
|
|
Commercial
Loans |
2.24
|
1.77
|
2.58
|
2.12
|
|
Consumer
Direct |
1.36
|
0.52
|
1.61
|
0.71
|
|
Commercial
Mortgage |
1.95
|
1.22
|
3.13
|
2.33
|
|
Residential
Mortgage |
9.31
|
4.25
|
8.36
|
4.69
|
|
Construction
|
10.36
|
9.31
|
9.93
|
8.86
|
|
Total
Portfolio |
3.28
|
2.24
|
3.63
|
2.65
|
Loan Delinquency (Key Sectors)
44
Comm'l
Res. Mtg.
(in thousands)
Pennsylvania
39,278
$
42,900
$
12,264
$
11,005
$
4,829
$
110,276
$
Maryland
7,444
5,105
34,012
5,084
1,839
53,484
New Jersey
16,895
41,977
14,153
9,973
4,213
87,211
Virginia
13,341
4,491
18,294
15,960
1,077
53,163
Delaware
End Loans
3,665,000
4,331,000
893,000
2,622,000
429,000
11,940,000
NPL%
2.12%
2.34%
8.86%
1.74%
3.08%
2.65%
* Includes accruing loans > 90 days past due.
Non-performing Loans* (June 30, 2010)

45
Ending
% of
NPL
Allowance
Pennsylvania
1,364,000
$
52.0%
11,010
$
5,240
$
New Jersey
451,000
17.2%
9,970
2,490
Maryland
433,000
16.5%
5,080
1,570
Virginia
227,000
8.7%
15,960
6,600
Delaware
Res Mtg and HE by State (June 30, 2010)
46
Ending
% of
NPL
Allowance
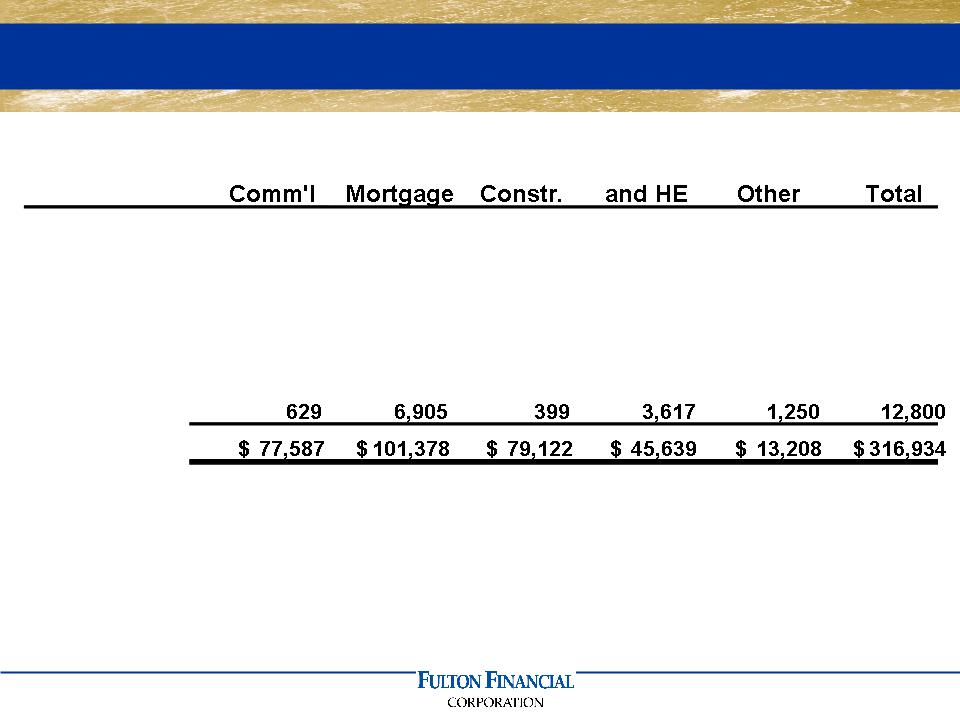
Pennsylvania
2,442,000
$
66.6%
39,280
$
65,020
$
New Jersey
569,000
15.5%
16,900
19,830
Maryland
357,000
9.7%
7,440
6,520
Virginia
265,000
7.2%
13,340
10,550
Delaware
C&I Loans by State (June 30, 2010)

47
Ending
% of
NPL
Allowance
Pennsylvania
314,000
$
35.2%
12,270
$
10,210
$
Virginia
215,000
24.1%
18,290
28,350
Maryland
194,000
21.7%
34,010
25,730
New Jersey
155,000
17.4%
14,150
10,080
Delaware
Construction Loans (June 30, 2010)
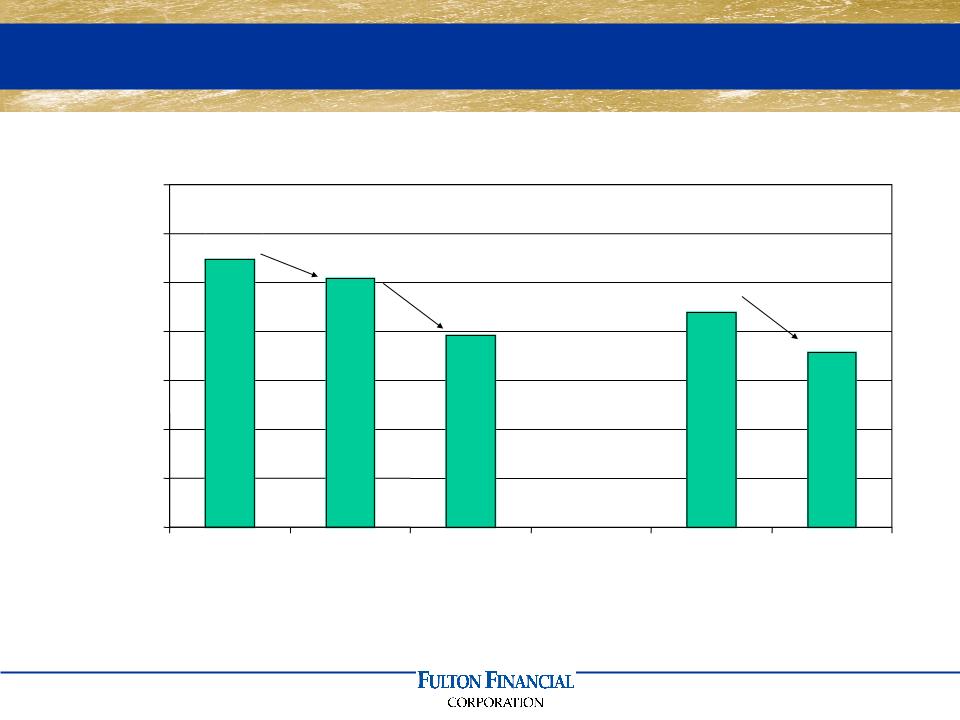
48
$893
$1,096
$1,367
$1,269
$978
$0
$250
$500
$750
$1,000
$1,250
$1,500
$1,750
12/31/2007
12/31/2008
12/31/2009
06/30/2009
06/30/2010
(7%)
(23%)
(19%)
($ in millions)
Construction Loans /
Total Loans
Total Loans
12.2%
10.5%
8.2%
9.2%
7.5%
Declining Construction Exposure
49
Ending
% of
Balance
Total
Commercial Residential
586,000
$
65.6%
Commercial
249,000
27.9%
Real Estate
46,000
5.2%
Other Commercial
12,000
1.3%
893,000
$
Construction Loans by Type

50
Ending
% of
NPL
Allowance
Balance
Total
Balance
Allocations
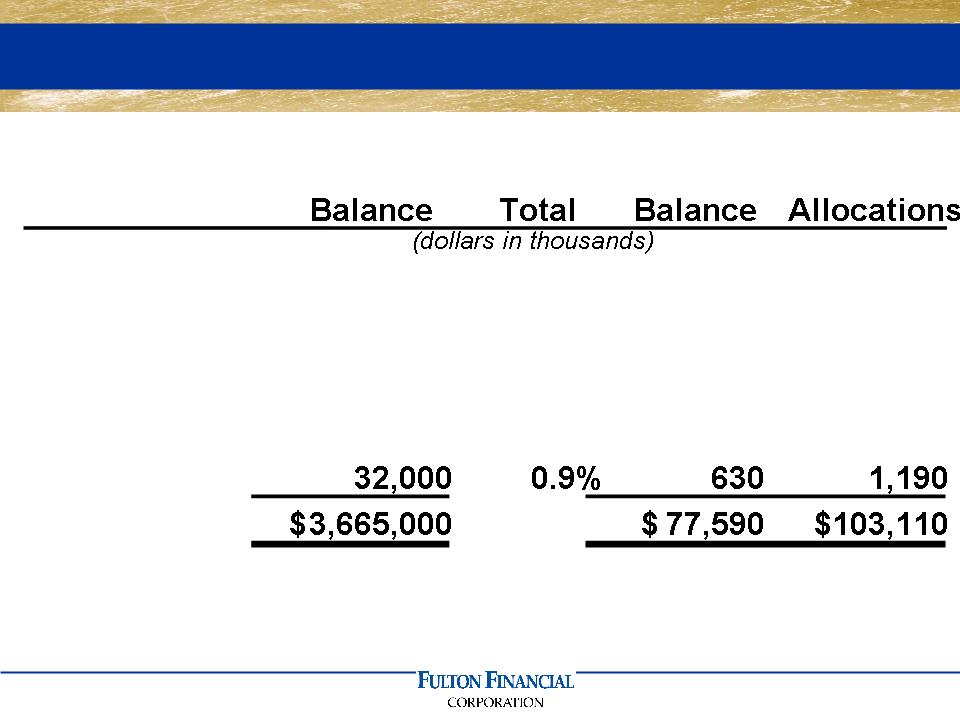
Pennsylvania
2,252,000
$
52.0%
42,900
$
17,050
$
New Jersey
1,211,000
28.0%
41,980
12,270
Maryland
389,000
9.0%
5,100
2,940
Virginia
349,000
8.0%
4,490
4,400
Delaware
130,000
3.0%
6,910
3,760
4,331,000
$
101,380
$
40,420
$
CRE Loans by State (June 30, 2010)
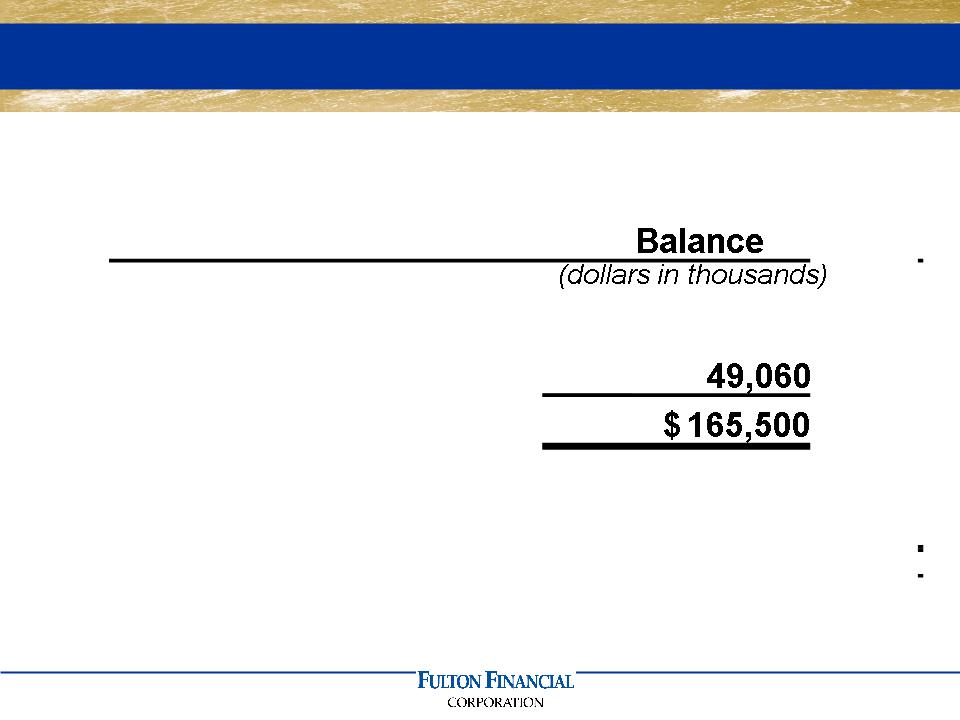
51
Ending
Commercial / Industrial
116,440
$
Commercial Real Estate
Total Outstanding
Delinquency: 2.9%
Shared National Credits (June 30, 2010)
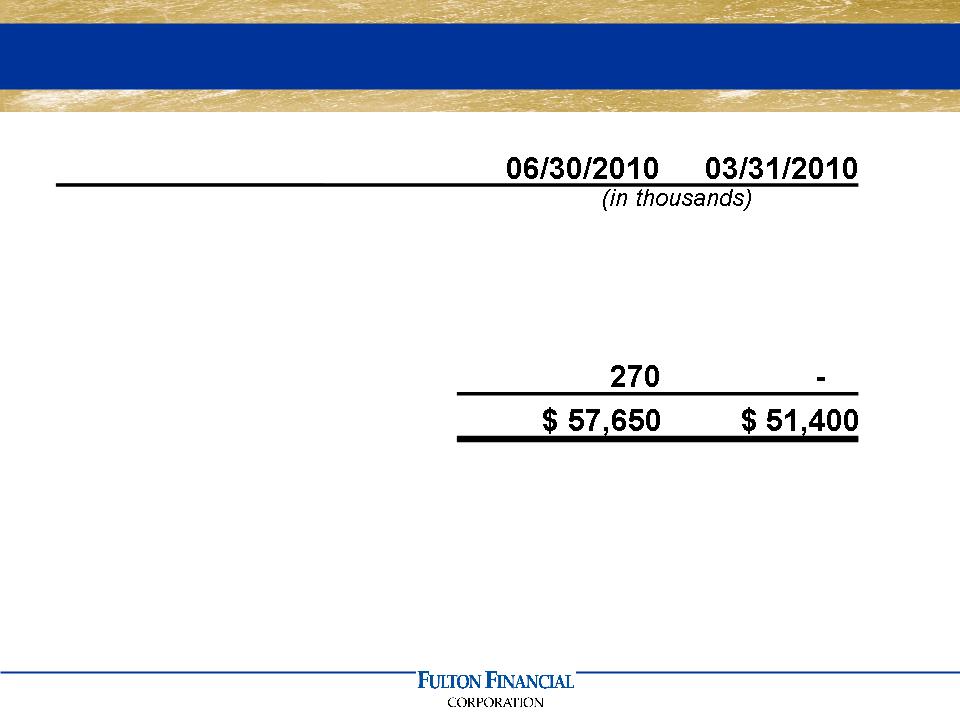
52
Residential Mtg
32,010
$
27,290
$
C&I/Comm'l Mtg
19,210
19,290
Construction
6,160
4,820
Consumer/other
Note: Excludes non-accrual TDR's
Troubled Debt Restructurings

53
Investment Portfolio Detail
54
ENDING
MODIFIED
BALANCE
DURATION
(in millions)
Agency mortgage-backed securities
883.4
$
3.11
Agency collateralized mortgage obligations
1,003.2
2.48
Municipal bonds
345.1
4.68
Auction rate securities
282.8
3.66
Corporate & trust preferred securities
144.0
10.64
U.S. Treasuries and agencies
11.5
3.13
FHLB & FRB stock
100.3
NA
Bank stocks
31.2
NA
Other investments
24.3
NA
Net unrealized gain / (loss)
67.1
Investment Portfolio (June 30, 2010)

55
Fulton Financial Corporation
One Penn Square
Lancaster, PA 17602
www.fult.com