Attached files
| file | filename |
|---|---|
| EX-21 - IMMUCOR INC | ex21.htm |
| EX-32.1 - IMMUCOR INC | ex32-1.htm |
| EX-32.2 - IMMUCOR INC | ex32-2.htm |
| EX-31.2 - IMMUCOR INC | ex31-2.htm |
| EX-23.1 - IMMUCOR INC | ex23-1.htm |
| EX-31.1 - IMMUCOR INC | ex31-1.htm |
| EX-99.1 - IMMUCOR INC | ex99-1.htm |
UNITED
STATES
SECURITIES
AND EXCHANGE COMMISSION
Washington,
D.C. 20549
FORM
10-K
| (Mark One) | ANNUAL REPORT PURSUANT TO SECTION 13 OR 15(d) OF | |
| x | THE SECURITIES EXCHANGE ACT OF 1934 | |
| For the fiscal year ended May 31, 2010 | ||
| OR | ||
| o | TRANSITION REPORT PURSUANT TO SECTION 13 OR 15(d) OF | |
| THE SECURITIES EXCHANGE ACT OF 1934 |
For the
transition period from ________ to ________
Commission
file number 0-14820
IMMUCOR,
INC.
(Exact
name of registrant as specified in its charter)
|
Georgia
|
22-2408354
|
|
(State
or other jurisdiction of incorporation or organization)
|
(I.R.S.
Employer Identification No.)
|
|
3130
GATEWAY DRIVE, P.O. BOX 5625
|
|
|
Norcross,
Georgia
|
30091-5625
|
|
(Address
of principal executive offices)
|
(Zip Code) |
Registrant’s
telephone number, including area code, is (770) 441-2051
Securities
registered pursuant to Section 12(b) of the Act:
|
Title
of Each Class
|
Name
of Each Exchange on Which Registered
|
|
COMMON
STOCK, $.10 PAR VALUE
|
The
Nasdaq Stock Market LLC
|
|
COMMON
STOCK PURCHASE RIGHTS
|
Securities
registered pursuant to Section 12(g) of the Act:
NONE
Indicate
by check mark if the registrant is a well-known seasoned issuer, as defined in
Rule 405 of the Securities Act. Yes x
No o
Indicate
by check mark if the registrant is not required to file reports pursuant to
Section 13 or Section 15(d) of the Act. Yes o
No x
Indicate
by check mark whether the registrant (1) has filed all reports required to be
filed by Section 13 or 15(d) of the Securities Exchange Act of 1934 during the
preceding 12 months (or for such shorter period that the Registrant was required
to file such reports), and (2) has been subject to such filing requirements for
the past 90 days. Yes x
No o
Indicate
by check mark whether the registrant has submitted electronically and posted on
its corporate website, if any, every Interactive Data File required to be
submitted and posted pursuant to Rule 405 of Regulation S-T (§ 229.405 of this
chapter) during the preceding 12 months (or for such shorter period that the
registrant was required to submit and post such
files). Yes o
No o
Indicate
by a check mark if disclosure of delinquent filers pursuant to Item 405 of
Regulation S-K is not contained herein, and will not be contained, to the best
of registrant's knowledge, in definitive proxy or information statements
incorporated by reference in Part III of this Form 10-K or any amendment to this
Form 10-K. o
Indicate
by check mark whether the registrant is a large accelerated filer, an
accelerated filer, a non-accelerated filer, or a smaller reporting company. See
definition of “large accelerated filer,” “accelerated filer” and “small
reporting company” in Rule 12b-2 of the Exchange Act.
|
Large
accelerated filer x
|
Accelerated
filer
o
|
|
Non-accelerated
filer o
|
Small
reporting company o
|
|
Indicate
by check mark whether the registrant is a shell company (as defined in
Rule 12b-2 of the Act). Yes o
No x
|
As of
November 30, 2009, the aggregate market value of the common stock held by
non-affiliates of the registrant was $1,280,626,276, based upon the closing
price on The Nasdaq Stock Market on that date. For the purpose of
calculating this amount, all officers and directors have been treated as
affiliates.
As of
June 30, 2010, there were 69,979,036 shares of common stock
outstanding.
Part III
- Portions of the Registrant’s definitive Proxy Statement relating to the
registrant’s 2010 Annual Meeting of Shareholders, to be filed with the
Securities and Exchange Commission within 120 days following the end of the
Company’s fiscal year, are incorporated by reference in Part III of this Annual
Report on Form 10-K as indicated herein.
Table Of Contents
|
Part I
|
||
|
Item
1.
|
Business
|
3 |
|
Item
1A.
|
Risk
Factors
|
9 |
|
Item
1B.
|
Unresolved
Staff Comments
|
14 |
|
Item
2.
|
Properties
|
14 |
|
Item
3.
|
Legal
Proceedings
|
14 |
|
Item
4.
|
Submission
Of Matters To A Vote Of Security Holders
|
15 |
|
Part
II
|
||
|
Item
5.
|
Market
For The Registrant’s Common Equity, Related Stockholder Matters And Issuer
Purchases of Equity Securities
|
15 |
|
Item
6.
|
Selected
Financial Data
|
18 |
|
Item
7.
|
Management’s
Discussion And Analysis Of Financial Condition And Results Of
Operations
|
19 |
|
Item
7A.
|
Quantitative
And Qualitative Disclosures About Market Risk
|
34 |
|
Item
8.
|
Financial
Statements And Supplementary Data
|
34 |
|
Item
9.
|
Changes
In And Disagreements With Accountants On Accounting And Financial
Disclosure
|
64 |
|
Item
9A.
|
Controls
And Procedures
|
64 |
|
Item
9B.
|
Other
Information
|
65 |
|
Part
III
|
||
|
Item
10.
|
Directors,
Executive Officers and Corporate Governance
|
66 |
|
Item
11.
|
Executive
Compensation
|
66 |
|
Item
12.
|
Security
Ownership Of Certain Beneficial Owners And Management And Related
Stockholder Matters
|
66 |
|
Item
13.
|
Certain
Relationships And Related Transactions, And Director
Independence
|
66 |
|
Item
14.
|
Principal
Accountant Fees And Services
|
66 |
|
Part
IV
|
||
|
Item
15.
|
Exhibits
And Financial Statement Schedules
|
66 |
|
|
Signatures | 70 |
|
Ex-21
|
Subsidiaries
Of The Registrant
|
|
|
Ex-23
|
Consents
Of Experts And Counsel
|
|
|
Ex-31.1
|
Certificate
Of Principal Executive Officer Pursuant To Rule 13a-14(a)
|
|
|
Ex-31.2
|
Certificate
Of Principal Financial Officer Pursuant To Rule 13a-14(a)
|
|
|
Ex-32
|
Certifications
Required Under Section 906 Of The Sarbanes-Oxley Act Of
2002
|
2
PART
I
FORWARD –
LOOKING STATEMENTS
This
annual report on Form 10-K contains forward-looking statements that are based
upon current expectations and are made pursuant to the Safe Harbor Provisions of
the Private Securities Litigation Reform Act of 1995. Forward-looking statements
include, without limitation, any statement that may predict, forecast, indicate,
or imply future results, performance, or achievements, and may contain the words
“believe,” “anticipate,” “expect,” “estimate,” “project,” “will be,” “will
continue,” “will likely result,” or words or phrases of similar meaning.
Forward-looking statements involve risks and uncertainties that may cause actual
results to differ materially from the forward-looking statements. We intend that
such statements be protected by the safe harbor created thereby. The risks and
uncertainties are detailed from time to time in reports filed by us with the
SEC, including Forms 8-K, 10-Q, and 10-K.
In
addition, such statements are subject to the risks and uncertainties discussed
in the “Risk Factors” section and elsewhere in this annual report on Form 10-K.
The risks included here are not exhaustive. Other sections of this report may
include additional factors that could adversely affect our business and
financial performance. Moreover, we operate in a very competitive and rapidly
changing environment. New risk factors emerge from time to time, and it is not
possible for management to predict all such risk factors, nor can it assess the
impact of all such risk factors on our business or the extent to which any
factor, or combination of factors, may cause actual results to differ materially
from those contained in any forward-looking statements. Given these risks and
uncertainties, investors should not place undue reliance on forward-looking
statements as a prediction of actual results.
Item 1. — Business.
Founded
in 1982, Immucor, Inc., a Georgia corporation (“Immucor” or the “Company”),
develops, manufactures and sells a complete line of reagents and automated
systems that detect and identify certain properties of the cell and serum
components of human blood for the purpose of blood transfusion. Our offerings
are targeted at hospitals, donor centers and reference
laboratories.
Industry
We are
part of the blood banking industry, which generally seeks to prevent transfusion
reactions through the testing of blood and blood components prior to
transfusion. In the United States (U.S.), the Food and Drug Administration
(“FDA”) regulates the transfusion of human blood as a drug and as a biological
product. The FDA regulates all phases of the blood banking industry, including
donor selection and the collection, classification, storage, handling and
transfusion of blood and blood components. The FDA requires all facilities that
manufacture products used for any of these purposes, and the products
themselves, to be registered or licensed by the FDA. (See “Regulation” for
further discussion.)
The
principal components of blood are red cells (the cellular portion) and plasma
(the fluid portion). Attached to the exterior of red cells are
antigens, which determine the blood group (A, B, AB or O) and type (Rh positive
or Rh negative) of an individual’s blood. Plasma contains many different kinds
of proteins, including antibodies that are produced by the body in response to
foreign substances, such as foreign red cell antigens introduced in a
transfusion. In its normal state, a patient’s blood does not contain antibodies
that will react with its own red cell antigens. However, if foreign antigens are
introduced into the patient’s blood in a transfusion, the patient’s body will
produce antibodies to combat those foreign antigens.
Because
of the potential reaction of antigens and antibodies, it is crucial that
healthcare providers correctly identify the antigens and antibodies present in
patient blood and donor blood before a transfusion. If a donor’s red cells
contain antigens that are recognized by antibodies in the patient’s plasma, the
transfused red cells could be destroyed in a potentially life-threatening
reaction. Also, if foreign antigens from donor red cells are introduced into a
patient’s blood through a transfusion, the patient’s body can produce new
antibodies to the foreign antigens. The production of these new
antibodies, known as alloimmunization, can complicate future
transfusions.
Because
of the critical importance of matching patient and donor blood, highly skilled
and educated technologists in hospitals, donor centers and reference
laboratories generally perform procedures for testing compatibility. At present,
many customers perform these tests manually in the U.S., making blood testing
laboratories much more labor intensive than other types of testing laboratories.
In our direct markets outside of the U.S., a significant portion of the
customers are performing these tests with automation.
We
estimate the worldwide blood banking reagent and instrument market at
approximately $1.2 billion. The markets in which we have a direct distribution
presence, the U.S., Canada, Western Europe and Japan, represent most of the
addressable market today. We sell through distributors in other international
markets.
3
Strategy
and Long-Term Growth Drivers
Strategy
Our
strategy is to drive automation in the blood bank. We began our automation
strategy in 1998 with the goal of improving the operations of the blood bank as
well as patient safety. Through our innovation, we believe that our instruments
are among the most functionally rich instrumentation available on the
market.
We
believe our customers, whether a hospital, a donor center or a reference
laboratory, benefit from automation. Automation can allow customers to reduce
headcount as well as overtime in the blood bank, which can be a benefit given
the current shortage of qualified blood bank technologists. We also believe that
automation can improve patient safety, can increase operational efficiency and,
for customers such as integrated delivery networks with multiple blood banks,
can permit the standardization of best practices. For Immucor, automation allows
us to gain market share and secure a long-term, contractual relationship with
our customers.
We
continually innovate to ensure our automation offerings are competitive. We
offer two fully automated instruments for serology testing – NEO™ and Echo® – to meet the
different needs of our customers depending upon the volume in their laboratory
and the complexity of the testing required.
In late
fiscal 2010, we began the worldwide introduction of our fourth generation
automated instrument, NEO. Targeted at large hospitals, donor centers and
reference laboratories, NEO replaces our previous high volume instrument,
Galileo®, and due to added functionality, we believe NEO is a more attractive
instrument for the hospital market. NEO delivers the market’s highest
type-and-screen throughput and broadest test menu as well as new STAT priority
functionality for improved workflow. During February 2010, NEO received CE
(Conformité Européenne) Mark approval in the European Union and in April 2010
NEO received FDA clearance in the U.S.
Launched
worldwide in 2007, Echo, our third generation automated instrument, is targeted
at the market segment that is the least automated in the U.S. – small- to
medium-sized hospitals. Echo features STAT functionality, exceptional mean time
between failures and what we believe is the fastest turnaround time in the
industry.
In August
2008, we invested in what we believe will be the future of the blood bank –
molecular immunohematology – with our acquisition of privately-held BioArray
Solutions (“BioArray”). BioArray pioneered the development of DNA typing of
blood for transfusion. With the goal of improving transfusion medicine, we
believe that molecular immunohematology will revolutionize blood bank
operations. In many countries, blood pre-transfusion testing is limited to the
prevention of transfusion reactions and not for the prevention of
alloimmunization, which occurs when antigens foreign to the patient are
inadvertently introduced into the patient’s blood system through transfusions.
If alloimmunization occurs, the patient develops new antibodies in response to
the foreign antigens, thereby complicating future transfusions. By using
multiplex, cost-effective molecular testing, our molecular technology allows
testing to prevent alloimmunization for better patient care. We are currently
working on the next generation instrument, which we believe will allow for the
further commercialization of our molecular immunohematology technology. Our
current plan is to have a Research Use Only instrument available in the first
half of calendar 2011.
Long-Term
Growth Drivers
Our
long-term growth drivers revolve around our automation strategy. We believe
innovative instrumentation is the key to improving blood bank operations and
patient safety, as well as increasing our market share around the world. In
implementing our automation strategy, we are focused on the
following:
|
i)
|
Product Innovations –
We believe innovation is an important part of our strategy. We
continually seek to improve existing products and develop new products to
increase our market share and to improve the operations of our customers.
In fiscal 2010, we introduced our fourth generation automated instrument
for serology testing, NEO. We are currently developing new serology
reagent tests for use on our automated instruments as well as in a manual
testing environment to further improve transfusion medicine. As noted
above, in the new field of molecular immunohematology, we are currently
developing the next generation automated instrument for the DNA typing of
blood for the purpose of transfusion, which we believe will be the future
of blood bank operations.
|
|
ii)
|
Instrument Placements –
We believe that instrument placements are the most effective way to gain
market share as there are tangible benefits in terms of gaining
operational efficiencies and improving patient safety for customers
automating their blood bank or upgrading their current instrumentation. We
continually innovate to ensure our automation offerings are competitive
and believe that our “Scalable Solutions” meet the needs of blood banks,
regardless of size. Our serology instruments are “closed systems,” using
our proprietary Capture® reagents as well as certain traditional reagents.
Our goal in placing instruments is to secure a long-term, contractual
relationship with the customer for reagents. Each instrument placed
typically provides us with a recurring revenue stream through the sale of
reagents and supplies.
|
4
|
iii)
|
International Growth –
Outside of the U.S., we have direct distribution operations in Canada,
Western Europe and Japan as well as a network of distributors in other
parts of the world. We made investments in the United Kingdom and France
during fiscal 2009 to sell directly to the end users (e.g. hospitals),
although we had a previous presence in those markets through distributor
arrangements. As of May 31, 2010, approximately 30% of our sales were from
outside the United States. We believe that our innovative automation
offering and our proprietary and traditional reagent lines for serology as
well as our new molecular immunohematology offering (discussed below) will
enable us to continue to grow our market share outside the U.S.
|
|
iv)
|
Standardize Pricing and
Promote Customer Loyalty – We continue to follow our pricing
strategy of having customers adhere to standardized pricing tiers. We also
continue to offer a Customer Loyalty Program, which allows customers to
achieve more favorable pricing through commitment to Immucor as a primary
vendor. We expect these and other pricing adjustments to continue to have
a favorable impact on our financial performance in the near
term.
|
|
v)
|
Molecular Immunohematology
– We believe that our acquisition of BioArray provides new,
strategic growth markets for us, both in our current market of transfusion
medicine through an offering complementary to our current serology product
offerings as well as in potential new markets. We are currently working on
the next generation molecular immunohematology instrument, which we
believe will help us further commercialize this innovative technology. Our
current plan is to have a Research Use Only instrument available in the
first half of calendar 2011. We believe that bringing the DNA typing of
blood for transfusion to the blood bank will revolutionize transfusion
medicine. We believe that we are in the forefront of this
field.
|
Traditional
Serology Reagents
A reagent
is a substance that is added during a test in order to bring about a reaction.
The resulting reaction is used to confirm the presence of another substance. Our
reagents are used to identify different properties of blood for the purpose of
transfusion.
Most of
our current reagent products are used in tests to i) identify the blood group
(A, B, AB, O) and type (Rh positive or negative) ii) to detect and identify red
cell antibodies or red cell antigens, iii) to detect and identify platelet
antibodies and iv) to determine blood compatibility (crossmatch). The FDA
requires the accurate testing of blood and blood components for the purpose of
transfusion, using only reagents that have been licensed or cleared by the
FDA.
Under
traditional agglutination blood testing techniques (manual method), the
technologist manually mixes serum with red blood cells in a test tube, performs
several additional procedures, and then examines the mixture to determine
whether there has been an agglutination reaction. A positive reaction occurs if
the cells are drawn together in clumps by the presence of corresponding
antibodies and antigens. Due to the critical importance of matching patient and
donor blood, testing procedures using agglutination techniques are usually
performed manually by highly educated and skilled technologists.
We
estimate that approximately 60% of customers in the U.S. perform testing on a
manual basis without the use of an automated instrument. These customers are
primarily in the small- to medium-hospital segment of the market. In the high
volume segment of the U.S. market (large hospitals, donor centers and reference
laboratories) and in our international direct markets, a significant portion of
the customers are automated.
Traditional
reagents accounted for approximately 63% of our revenue in fiscal 2010. We
believe there is a slight amount of seasonality in our reagent business as fewer
donations and elective surgical procedures are performed in our first fiscal
quarter (June-August).
Proprietary
Technology Platforms
Solid
Phase Technology
Our
serology instruments use both our proprietary solid phase technology, marketed
under the name Capture, as well as certain manual reagents to perform tests. In
our proprietary solid phase blood test system, red cell or platelet antigens are
bound to a microtitration plate as a solid support (the solid phase), and the
bound reactant captures other reactants in a fluid state and binds those fluid
reactants to the solid phase. In this testing system, patient or donor serum or
plasma is placed in the well of a plastic microtitration plate on which antigen
reactants have been bound. Special proprietary indicator cells manufactured by
Immucor are then added. In a positive reaction, antibodies in the test sample
are captured by the indicator cells and adhere to the bottom of the test well as
a thin layer. In a negative reaction, there is no antibody attached to the
indicator cells and they settle to the bottom of the test well as a small cell
button. These reactions occur rapidly and result in clearly defined,
machine-readable test results that are often easier to interpret than the
subjective results sometimes obtained from existing agglutination technology
(manual method). Also, in batch test mode the solid phase test results can
generally be obtained in substantially less time than by traditional
agglutination techniques. We have FDA approval or clearance for the Capture-P
products for platelet testing, the Capture-R products for red cell testing, and
one infectious disease test, Capture-CMV (acute cytomegalovirus).
5
Molecular Immunohematology
Technology
Our
molecular immunohematology technology, which was obtained in August 2008 through
our acquisition of BioArray, is marketed as the BeadChip™ system. BioArray
developed a novel and flexible technology platform that allows for a variety of
multiplex DNA-based testing, combining DNA amplification (PCR) with BeadChip
detection and data analysis software. The platform combines semiconductor
technology, microparticle chemistry and molecular biology to bring a high degree
of flexibility and performance to qualitative and quantitative DNA and protein
analyses. Current BeadChip kits include Multiplex Human Erythrocyte Antigen
(HEA) and Human Platelet Antigen (HPA). In late fiscal 2010, we received CE Mark
approval for our HPA product as well as our current instrument (see below). In
June 2010, subsequent to our fiscal 2010 year end, we received CE Mark approval
for our HEA product. The BeadChip system is currently available for Research Use
Only in the U.S.
Instruments
and Instrument Systems
We offer
customers a selection of automated analyzers, marketed as “Scalable Solutions,”
which address the various needs of low, medium, and high-volume testing
facilities. While we design and own the rights to our instruments, we contract
with third-party manufacturers for their production.
Serology
NEO – Targeted at donor
centers, large-volume hospitals and reference laboratories, NEO provides a
fully-automated solution to perform all routine blood bank tests, including
blood grouping, antibody screening, crossmatch, direct antiglobulin test (DAT)
and antibody identification. Launched in Europe in February 2010 and cleared for
marketing in the U.S. in late April 2010, NEO is our fourth generation automated
instrument. It replaces our previous high volume instrument, Galileo, which was
launched in Europe in 2002 and in the U.S. in 2004. We believe Galileo is
entering its natural replacement cycle (approximately five to seven years). In
addition to opportunities in the Galileo installed base, we believe there is
also opportunity to expand our automated footprint in the hospital market
because of NEO’s added functionality, including STAT functionality, a faster
turnaround time and improved reliability. A high throughput instrument, NEO can
process up to 224 different samples at once, and can perform approximately 60
type-and-screen tests an hour. NEO uses our proprietary Capture
reagent products as well as certain traditional reagents. We believe that NEO
has the highest type and screen throughput available in the global
market.
ECHO – Launched worldwide in
2007, Echo is targeted at small- to medium-sized hospitals as well as at
integrated delivery networks (both hospital and lab systems) in combination with
NEO. Like NEO, Echo has a broad test menu and uses both our proprietary Capture
reagents as well as certain traditional reagents to perform its testing. With
the capacity to load 20 samples at a time, Echo can perform approximately 14
type-and-screen tests an hour. We believe Echo has the fastest turnaround time
of any instrument in the global market.
CAPTURE WORKSTATION (Semi-automated
Processor) – The Capture Workstation has semi-automated components for
performing our proprietary Capture assays manually. It is marketed as a back-up
system for our fully automated NEO and Echo instruments, or as a standalone test
system for small laboratories looking to standardize testing.
Molecular
ARRAY IMAGING SYSTEM AND BASIS™
(Semi-automated) – Today, molecular
testing using our BeadChip technology is a semi-automated process. The testing
itself is primarily manual while the reading and interpretation of test results
is automated with our Array Imaging System and BASIS database. We are in the
process of developing a next generation instrument that will automate the manual
testing process. We are targeting to have a Research Use Only instrument
available in the first half of calendar 2011.
Research
and Development
We
continually seek to improve our existing products and to develop new ones in
order to increase our market share. Prior to sale, any new product
requires regulatory approvals, including licensing or pre-market clearance from
the FDA in the U.S. and CE marking in Western Europe. For the fiscal
years ended May 31, 2010, 2009 and 2008, we spent approximately $15.4 million,
$10.7 million and $6.5 million, respectively, for research and development.
Research and development expenses have increased over the past three years due
to the acquisition of BioArray in August 2008 and the subsequent development
work on our molecular immunohematology offering.
6
Marketing
and Distribution
Our
potential customers are donor centers, hospitals and reference laboratories. No
single customer represents 10% or more of our annual consolidated
revenue.
We have a
direct sales presence in the U.S., Canada, Western Europe and Japan. We sell
through distributors in other regions of the world. We offer several instrument
procurement options, including direct sales and rentals.
Backlog
As of May
31, 2010, we had an instrument backlog of approximately 179 Echos and 43
Galileo/NEOs. This backlog represents instrument orders that have been received
but the instruments have either not been installed or the customer validation
process has not been completed. As such, the instruments are not generating
recurring reagent revenue at their expected annualized run rates. While the
instrument backlog is not material as of May 31, 2010, reagent revenue that will
be generated from these instruments will contribute to revenue growth in the
future. At May 31, 2010, in accordance with U.S. generally accepted
accounting principles, we had not recognized approximately $16.7 million in
deferred revenue from instrument sales contracts that had reagent price
protection and from extended warranty sales.
Suppliers
We obtain
raw materials from numerous outside suppliers and believe our business
relationships with them are good. Some of our products are derived from blood
having particular or rare combinations of antibodies or antigens, which are
found in a limited number of individuals. To date, we have been able to obtain
sufficient quantities of such blood for use in manufacturing our products, but
there can be no assurance that a sufficient supply of such blood will always be
available to us.
We source
our serology instruments from single-source suppliers. While these relationships
are significant, our business is not substantially dependent upon them because
we believe that other manufacturers could supply the instruments to us after a
reasonable transition period. We believe that our business relationship with our
instrument suppliers is excellent. We have elected not to dual source our
instruments because we consider our primary exposure to be the sudden bankruptcy
of one or both suppliers. In the event a current instrument supplier experiences
financial problems that prevent it from continuing to produce our instrument, we
believe it would take in the range of 18 months to 24 months to transfer the
technology and begin production with a new instrument supplier. While a change
in an instrument supplier would disrupt our growth opportunities during the
transition period, we do not believe it would have a material financial impact
on our existing business as nearly 90% of our revenue is generated from our
reagents.
Regulation
The
manufacture and sale of blood banking products is a highly regulated business
and is subject to continuing compliance with multiple U.S., Canadian, Western
European, Japanese and other country-specific statutes, regulations and
standards that generally include licensing, product testing, facilities
compliance, product labeling, post-market vigilance and consumer
disclosure.
In the
U.S., an FDA biologics license is issued for an indefinite period of time,
subject to the FDA’s right to revoke the license. As part of its overview
responsibility, the FDA makes facility inspections on an unannounced
basis. In 2006, we consolidated our Houston manufacturing facility under
the Immucor, Inc. FDA license, and subsequently discontinued operations in
Houston in December 2007. In 2008, we received FDA approval for the
transfer of manufacturing activities to Norcross and an expansion of our
manufacturing facilities at the same location.
In addition, each product
manufactured by us is subject to formal product submissions and review processes
by the FDA and other regulatory bodies, such as Health Canada, a European Union
recognized Notified Body and the Japanese Ministry of Health prior to
authorization to market. Significant changes to our products or facilities can require
additional submission and review prior to implementation. For example, we
hold several FDA biologic licenses to manufacture blood grouping reagents,
anti-human globulin reagents and reagent red blood cells. We must submit
biologic license applications or 510(k) pre-market notifications to the FDA to
obtain product licenses or market clearance for new products or
instruments. To accomplish this, we must submit detailed product
information to the FDA, perform a clinical trial of the product, and demonstrate
to the satisfaction of the FDA that the product meets certain efficacy and
safety standards. There can be no assurance that any future product
licenses or instrument clearances will be obtained by us.
7
Our
manufacturing and distribution facilities in the U.S., Germany and Canada are
certified to ISO 13485:2003. This is an internationally recognized standard and
certification is required in order to continue product distribution in key
markets such as the European Union and Canada. In addition, to allow continued
marketing of our products in the European Union, we are required to maintain
certification under the EC Full Quality Assurance System Assessment in
accordance with the requirements of Annex IV of the IVD Medical Devices
Directive 98/79/EC. This certification authorizes the use of the CE Mark on
our products that allows products free access to all countries within the
European Union. We have successfully completed certifications for CE
marking of all products manufactured for the European market.
In
addition to the U.S., Western Europe, Canada and Japan, there are multiple
countries worldwide that also impose regulatory barriers to market
entry. We continue to maintain product registrations and approvals
necessary to maintain access to foreign markets.
In June
2009, we announced that the FDA, in an administrative action based on a January
2009 inspection, issued a notice of intent to revoke our biologics license with
respect to our Reagent Red Blood Cells and Anti-E (Monoclonal) Blood Grouping
Reagent products. Under this administrative action, we have the opportunity to
demonstrate or achieve compliance before the FDA initiates revocation
proceedings or takes other action. The FDA did not order the recall of any of
our products or restrict us from selling these products. This administrative
action was a follow on to a warning letter that we received in May 2008. We had
been working on an FDA-approved remediation plan, submitted after the warning
letter, but had failed to make adequate progress at the time of the FDA’s
follow-up inspection in January 2009. In early calendar 2009 (during our fiscal
third quarter of 2009), we formalized efforts to improve our quality systems
through the Quality Process Improvement Project. In August 2009 in response to
the June 2009 administrative action, we submitted a detailed remediation plan
that outlined our actions and timelines to correct the FDA’s noted deficiencies
from the January 2009 inspection. The Quality Process Improvement Project served
as the basis for the detailed remediation plan. During our third fiscal quarter
of 2010, we completed the remediation portion of the Project. During June 2010,
after our fiscal 2010 year-end, the FDA conducted an inspection of our
facilities. We have no update on our compliance status at this
time.
Environmental
Some of
our processes generate hazardous waste and we have a U.S. Environmental
Protection Agency identification number. We believe we are in compliance with
applicable portions of the federal and state hazardous waste
regulations.
Patents
and Trademarks
Since
1986, the U.S. Patent Office has issued six patents to us pertaining to our
solid phase technology for serology testing, five of which have expired. The
remaining patent expires in 2012. We believe the remaining patent, together with
our trade secrets and know-how, will help prevent any current or future
competitors from successfully copying our solid phase products.
When we
acquired BioArray in August 2008, we acquired a substantial portfolio of issued
patents or pending patent applications. Through the development of
technologies supported by the patents, BioArray developed a novel and flexible
technology platform that allows for a variety of DNA-based testing. The platform
combines semiconductor technology, microparticle chemistry and molecular biology
to bring a high degree of flexibility and performance to qualitative and
quantitative DNA and protein analysis. Using this technology platform, BioArray
developed complete assay solutions called the BeadChip system. These patents
expire between 2018 and 2025.
Several of the products we sell are trademarked. These trademarks are protected by registration in the U. S. and other countries where such products are marketed. We consider these trademarks in the aggregate to be of material importance in the operation of our business.
Competition
Competition
in the blood banking industry is based on quality of instrumentation and
reagents, pricing, talent of the sales forces, ability to furnish a range of
quality existing and new products, reliable technology, skilled and trained
technicians, customer service and continuity of product supply. We believe we
are well positioned to compete favorably in this industry principally because of
the completeness, reliability and quality of our product line, our competitive
pricing structure and our introduction of new innovative products, such as our
Capture technology and full line of automated instruments for serology testing
and our innovative molecular immunohematology offering. We also believe that
continuing research efforts in the area of blood bank automation, the experience
and expertise of our sales personnel and the expertise of our technical and
customer support staff will enable us to remain competitive in the
market.
In the
U.S. and Canada, Ortho-Clinical Diagnostics (“Ortho”), a Johnson & Johnson
company, is our main competitor. In Western Europe, our principal competitors
are Bio-Rad Laboratories, Inc. (“Bio-Rad”) and Ortho. Both Ortho and Bio-Rad
sell instrumentation as well as reagents. Our principal competitor in Japan is
Ortho.
8
Financial
Information about Geographic Areas
We
conduct our business globally with manufacturing facilities in the U.S. and
Canada. We have sales operations in the U.S., Canada, several Western European
countries and Japan. Roughly 30% of our revenues are generated by our
international affiliates. In addition to the potentially adverse impact of
foreign regulations (see “Regulations”), we may also be affected by more
difficult market conditions outside the U.S., which could impact our revenues
and profit margins. Also, there may be adverse consequences from fluctuations in
foreign currency exchange rates, which may affect the competitiveness of our
products and our profit margins because our affiliates sell our products
predominantly in local currencies, but our cost structure is weighted towards
the U.S. dollar.
For
financial information about geographic areas, see Note 14 “Domestic and Foreign
Operations” of the notes to the consolidated financial statements.
Employees
At May
31, 2010, we had a total of 760 full-time employees worldwide. We have a low
staff turnover rate and consider our employee relations to be good. In addition
to our full-time work force, we employ temporary and contract employees. None of
our employees are represented by a labor union.
Available
Information
We file
reports, proxy statements and other information under the Securities Exchange
Act of 1934 with the Securities and Exchange Commission (the
“SEC”). Electronic versions of our annual report on Form 10-K,
quarterly reports on Form 10-Q, current reports on Form 8-K and any amendments
to these reports filed or furnished with the SEC may be accessed free of charge
through our website at www.immucor.com. The
information may also be accessed at the SEC’s web site at www.sec.gov.
Item 1A. — Risk Factors.
We
are subject to various risks and uncertainties relating to or arising out of the
nature of our business and general business, economic, financing, legal and
other factors or conditions that may affect us. We provide the following
cautionary discussion of risks and uncertainties relevant to our business, which
we believe are factors that, individually or in the aggregate, could have a
material and adverse impact on our business, results of operations and financial
condition, or could cause our actual results to differ materially from expected
or historical results. You should understand that it is not possible to predict
or identify all such factors. Consequently, our business operations could also
be affected by additional factors that are not presently known to us or that we
currently consider to be immaterial to our operations.
Risks
Relating to Our Company
FDA
administrative action could have a material and adverse effect on our
business.
In June
2009, we announced that the Food and Drug Administration (“FDA”), in an
administrative action based on a January 2009 inspection, issued a notice of
intent to revoke our biologics license (“NOIR”) with respect to our Reagent Red
Blood Cells and Anti-E (Monoclonal) Blood Grouping Reagent products. As part of
its overview responsibility, the FDA makes plant and facility inspections on an
unannounced basis. The FDA could seek to escalate the NOIR, for example, by
issuing a consent decree or revoking our biologics license for the products
impacted if we fail to implement a corrective action plan that adequately
addresses the deficiencies noted by the NOIR. The FDA could also take further
regulatory actions, including recalls or seizures of our products, a total or
partial shutdown of production, delays in future marketing clearances or
approvals, and withdrawals or suspensions of our current products from the
market.
On-going
governmental investigations and litigation could have a material and adverse
effect on our business.
As noted
in Item 3 below, we are the subject of a number of investigations and
private actions.
9
|
·
|
We
are under investigation by the Department of Justice (“DOJ”) through a
federal grand jury concerning possible criminal violations of the
antitrust laws. The DOJ could seek an indictment and conviction against
us, which could result in the imposition of substantial fines, among other
remedies.
|
|
·
|
The
Federal Trade Commission (“FTC”) is investigating whether Immucor violated
federal antitrust laws or engaged in unfair methods of competition,
through three acquisitions made in the period from 1996 through 1999 or by
restricting price competition. The FTC could decide to commence
administrative and possibly federal court proceedings for purposes of
determining whether there has been a violation and might seek to impose a
variety of remedies for any violation including injunctive relief,
divestiture of assets and/or disgorgement of
profits.
|
|
·
|
We
are the subject of a number of private civil actions by customers seeking
class certification and alleging price fixing. Were plaintiffs to prevail
in one or more of the pending civil actions, we could have to pay
significant amounts, including treble damages and attorneys’
fees.
|
|
·
|
We
are the subject of a private civil action brought by a shareholder seeking
class certification and alleging that the Company failed to disclose
material information with respect to alleged violations of the antitrust
laws and that the Company made inadequate disclosures about the results of
FDA inspections and the Company’s quality control efforts. Were the
plaintiff to prevail in this action on behalf of a class, we could have to
pay significant amounts, including damages and attorneys’
fees.
|
The
imposition of any of the above remedies could have a materially adverse impact
on our business, financial condition and results of operations. In addition,
regardless of the ultimate outcome in the above matters, we expect to incur
significant expenses, including attorneys’ fees, in responding to and defending
against issues raised in the above matters.
A
catastrophic event at our Norcross, Georgia facility would prevent us from
producing many of our reagent products.
Substantially
all our reagent products are produced in our Norcross facility. While we have
reliable supplies of most raw materials, our reagent production is highly
dependent on the uninterrupted and efficient operation of the Norcross facility,
and we currently have no plans to develop a third-party reagent manufacturing
capability. Therefore, if a catastrophic event occurred at the Norcross
facility, such as a fire or tornado, many of those products could not be
produced until the manufacturing portion of the facility was restored and
cleared by the FDA. We maintain a disaster plan to minimize the effects of such
a catastrophe, and we have obtained insurance to protect against certain
business interruption losses. However, there can be no assurance that such
coverage will be adequate or that such coverage will continue to remain
available on acceptable terms, if at all.
Unforeseen
product performance problems could prevent us from selling or result in a recall
of the affected products.
In the
event that we experience a product performance problem with either our
instruments or our reagents, we may be required to voluntarily recall or suspend
selling the products until the problem is resolved. Depending on the product as
well as the availability of acceptable substitutes, such a product recall or
suspension could significantly impact our operating results.
Poor
product performance could increase operating costs and result in the loss of
current or future customers.
Instrument
performance and reliability is a key factor in satisfying current customers and
attracting new customers. Poor performance or unreliability of instruments would
not only increase maintenance costs but also could result in losing important
customers. Therefore, if we are unable to provide effective instrument support
and service and minimize instrument down time, our revenues and financial
results would be adversely affected.
Because
we sell our products internationally, we could be adversely affected by
fluctuations in foreign currency exchange rates.
In the
fiscal year ended May 31, 2010, revenue outside the U.S. was approximately 30%
of total revenue. As a result, fluctuations in foreign currency exchange rates,
particularly the Euro, the Canadian Dollar, the British Pound and the Japanese
Yen against the U.S. Dollar, could make our products less competitive and affect
our sales and earnings levels. An increase in our revenue outside the U.S. would
increase this exposure. We have not historically hedged against currency
exchange rate fluctuations, but may do so in the future if the exposure
increases.
Gross
margin volatility may negatively impact our profitability.
Our gross
margin may be volatile from period to period due to various factors, including
instrument sales, reagent product mix and manufacturing costs. As we continue to
drive automation in the blood bank marketplace and experience increased
instrument sales as a result, the probable sales mix (in terms of
instrument/reagent sales) could make it difficult for us to sustain the overall
gross margins we have generated in the past. The higher margins on the Capture
reagents used on our instruments may not be enough to offset the lower margins
on the instruments themselves. Moreover, if the sales mix of instruments include
more capital purchases and fewer rentals, applicable accounting rules could put
further pressure on our overall gross margin. ASC 605-25 “Revenue Recognition:
Multiple-Element Arrangements,” requires that, for sales made on a purchase
basis, the cost of the instrument be expensed upfront and the corresponding
revenue be spread over the entire sales contract period for sales contracts with
reagent price guarantees. For our reagent products, margins vary depending upon
the product with rarer products generating higher margins. Depending upon the
sales mix of these products, margins could vary significantly from period to
period. Our reagent products are manufactured in-house. Margins for these
products could be impacted based upon costs of raw materials and labor as well
as overhead and the efficiency of our manufacturing operations from period to
period. Margins may also be negatively impacted by increased competition. New
market entrants or existing market participants seeking to gain market share may
foster a competitive environment of pricing pressures and/or increased marketing
and other expenditures that could negatively impact profitability.
10
If
customers delay integrating our instruments into their operations, the growth of
our business could be negatively impacted.
From time
to time in the past, some of our customers have experienced significant delays
between the purchase of an instrument and the time at which it has been
successfully integrated into the customer’s existing operations and is
generating reagent revenue at its expected annualized run rate. These delays may
be due to a number of factors, including staffing and training issues and
difficulties interfacing our instruments with the customer’s computer systems.
Because our business operates on a “razor/razorblade” model, such integration
delays result in delayed purchases of the reagents used with the instrument. A
number of steps have mitigated these integration delays: improved performance of
our field service staff, better instrument instructions, increased use of
internet-based remote diagnostic tools, and more efficient scheduling of
instrument installations. In addition, we have taken steps in the design of our
next generation instruments intended to make it easier for our customers to
integrate the instruments into existing operations. However, delays of customers
successfully integrating instruments into their operations could adversely
impact our future revenues and earnings growth.
We
may not be successful in capitalizing on acquisitions of former distributors or
newly established distribution networks outside the U.S.
An
integral part of our strategy is to place our instruments in additional markets
outside North America. To further this strategy, in the past few years we have
acquired our former distribution businesses in Japan and the U.K. and
established our own direct distribution organization in France. Our ability to
grow successfully in overseas markets depends in part on our ability to achieve
product acceptance and customer loyalty in these markets. Additionally, our
operations in foreign countries present certain challenges and are subject to
certain risks not necessarily present in our domestic operations, such as
fluctuations in currency exchange rates, shipping delays, changes in applicable
laws and regulations and various restrictions on trade. These factors could
impact our ability to compete successfully in these markets, which could in turn
negatively affect our international expansion goals, and could have a material
adverse effect on our operating results.
Our financial performance is highly
dependent on the timely and successful introduction of new products and
services.
Our
financial performance depends in part upon our ability to successfully develop
and market next generation automated instruments, new instruments such as our
next generation molecular immunohematology instrument and other products in a
rapidly changing technological and economic environment. Our market share and
operating results would be adversely affected if we fail to successfully
identify new product opportunities and timely develop and introduce new
instruments that achieve market acceptance, or if new products or technology are
introduced in the market by competitors that could render Immucor’s instruments
or reagents uncompetitive or obsolete. In addition, delays in the introduction
of new products due to regulatory, developmental, or other obstacles could
negatively impact our revenue and market share, as well as our earnings,
including the potential impairment of goodwill related to our molecular
immunohematology offering.
Global
economic conditions may have a material adverse impact on our
results.
Immucor
is a global company with direct operations in the U.S., Canada, Western Europe
and Japan and customers around the world. General economic conditions impact our
customers, particularly hospitals. For our instruments that are primarily sold
on a capital purchase basis, reduced capital budgets that result from negative
economic conditions, such as a global recession, could result in lower
instrument sales, which would negatively impact our future revenue,
profitability and cash flow. A shift from capital purchases to rentals, which
require no upfront cash outlay, could negatively impact our cash flow in the
near term. Additionally, global economic conditions may adversely affect the
ability of our customers to access funds to enable them to fund their operating
and capital budgets. Budget constraints could slow our progress in driving
automation in both our customer base and the blood banking industry as a whole,
which could negatively impact our future revenues, profitability and cash
flow.
We
are highly dependent on our senior management team and other key employees, and
the loss of one or more of these employees could adversely affect our
operations.
Our
success is dependent upon the efforts of our senior management and staff,
including sales, technical and management personnel, many of whom have very
specialized industry and technical expertise that is not easily replaced. If key
individuals leave us, we could be adversely affected if suitable replacement
personnel are not quickly recruited. Our future success depends on our ability
to continue to attract, retain and motivate qualified personnel. There is
intense competition for medical technologists and in some markets there is a
shortage of qualified personnel in our industry. If we are unable to continue to
attract or retain highly qualified personnel, the development, growth and future
success of our business could be adversely affected.
11
Supply
chain interruptions could negatively impact our operations and financial
performance.
Supply
chain interruptions could negatively impact our operations and financial
performance. The supply of any of our manufacturing materials may be interrupted
because of poor vendor performance or other events outside our control, which
may require us, among other things, to identify alternate vendors and result in
lost sales and increased expenses. While such interruption could impact any of
our third-party sourced materials, two particular areas of note are our
instrument suppliers and our supply sources for rare antibodies or antigen
combinations, which are described below.
We
purchase our serology instruments from single-source suppliers. If the supply of
any of our instruments were interrupted, due to the supplier’s financial
problems or otherwise, we believe an alternative supplier could be found but it
would take in the range of 18 months to 24 months to transfer the technology and
begin production with a new instrument supplier. The disruption of one of these
supply relationships could cause us to incur costs associated with the
development of an alternative source. Also, we may be required to obtain FDA
clearance of the instrument if it is not built to the same specifications as
with the previous supplier. The process of changing an instrument supplier could
have an adverse impact on future growth opportunities during the transition
period if supplies of finished goods on hand were insufficient to satisfy
demand.
Some of
our reagent products are derived from blood having particular or rare
combinations of antibodies or antigens, which are found in a limited number of
individuals. If we had difficulty in obtaining sufficient quantities of such
blood and the supply was interrupted, we would need to establish a viable
alternative, which may take both time and expense to either identify and/or
develop and could have an adverse impact on our operations and financial
position.
Distribution
chain interruptions could negatively impact our operations and financial
performance.
Distribution
chain interruptions could negatively impact our operations and financial
performance. Our international affiliates are supplied with a significant amount
of product from our U.S. manufacturing facility. If circumstances arose that
disrupted our distribution of U.S.-sourced product internationally, we would
need to establish an alternate distribution channel, which may take both time
and expense to establish and could have an adverse impact on our operations and
financial position.
We
may be unable to adequately protect our proprietary technology.
We have a
substantial patent portfolio of issued patents or pending patent applications
supporting our molecular immunohematology offering. Also, we have one of the
original six patents on our proprietary Capture technology still in force. Our
competitiveness depends in part on our ability to maintain the proprietary
nature of our owned and licensed intellectual property. Because the law is
constantly changing, and unforeseen facts may arise, there is always a risk that
patents may be found to be invalid or unenforceable. Therefore, there is no
absolute certainty as to the exact scope of protection associated with any
intellectual property. We believe our patents, together with our trade secrets
and know-how, will prevent any current or future competitors from successfully
copying and distributing our BeadChip and Capture products. However, there can
be no assurance that competitors will not develop around the patented aspects of
any of our current or proposed products or independently develop technology or
know-how that is the same as or competitive with our technology and know-how.
Any damage to our intellectual property portfolio could result in an adverse
effect on our current or proposed products, our revenues and our
operations.
Protecting
our intellectual property rights is costly and time consuming. We may need to
initiate lawsuits to protect or enforce our patents, or litigate against third
party claims, which would be expensive and, if we lose, may cause us to lose
some of our intellectual property rights and reduce our ability to compete in
the marketplace. Furthermore, these lawsuits may divert the attention of our
management and technical personnel.
We
have been in the past, and may be in the future, subject to intellectual
property rights infringement claims, which are costly to defend, could require
us to pay substantial damages and could limit our ability to use certain
technologies in the future.
Our
commercial success depends, in part, not only on protecting our own intellectual
property but on not infringing the patents or proprietary rights of third
parties. From time to time we may receive notices from, or have lawsuits filed
against us by, third parties claiming that we infringe on their intellectual
property rights. Responding to such claims, regardless of their merit, can be
time consuming, result in costly litigation, divert management’s attention and
resources and cause us to incur significant expenses. Our practices, products
and technologies, particularly with respect to the field of molecular
immunohematology, may not be able to withstand third-party claims, regardless of
the merits of such claims.
As a
result of such potential intellectual property infringement claims, we could be
required or otherwise decide it is appropriate to discontinue manufacturing,
using, or selling particular products subject to infringement claims or develop
other technology not subject to infringement claims, which could be time
consuming and costly or may not be possible. In addition, to the extent
potential claims against us are successful, we may have to pay substantial
monetary damages or discontinue certain of our practices, products or
technologies that are found to be in violation of another party’s rights. We
also may have to seek third-party licenses to continue certain of our existing
or planned product lines, thereby incurring substantial costs related to royalty
payments for such licenses, which could negatively affect our gross margins.
Also, license agreements can be terminated under appropriate
circumstances. No assurance can be given that efforts to remediate
any infringement will be successful or that licenses can be obtained on
acceptable terms or that litigation will not occur.
12
In the
event there is a temporary or permanent injunction entered prohibiting us from
marketing or selling certain of our products, or a successful claim of
infringement against us requiring us to pay royalties to a third party, and we
fail to license such technology on acceptable terms and conditions or to develop
or license a substitute technology, our business, results of operations or
financial condition could be materially adversely affected. Further, any adverse
ruling or perception of an adverse ruling in defending ourselves against these
claims could have a material adverse impact on our stock price, which may be
disproportionate to the actual significance of the ruling itself.
Risks
Relating to our Industry
Government
regulation may delay or prevent new product introduction and affect our ability
to continue manufacturing and marketing existing products.
Our
instruments, reagents and other products are subject to regulation by
governmental and private agencies in the U.S. and abroad, which regulate the
testing, manufacturing, packaging, labeling, distribution and marketing of
medical supplies and devices. Certain international regulatory bodies also
impose import and tax restrictions, tariff regulations, and duties on imported
products. Delays in agency review can significantly delay new product
introduction and may result in a product becoming “outdated” or losing its
market opportunity before it can be introduced. Also, the FDA and international
agencies have the authority to require a recall or modification of products in
the event of a defect.
FDA
clearance or approval generally is required before we can market new instruments
or reagents in the U.S. or make significant changes to existing products. The
process of obtaining marketing clearances and approvals from regulatory agencies
for new products can be time consuming and expensive. There is no assurance that
clearances or approvals will be granted or that agency review will not involve
delays that would adversely affect our ability to commercialize our
products.
If any of
our products failed to perform in the manner represented during this clearance
or approval process, particularly concerning safety issues, one or more of these
agencies could require us to cease manufacturing and selling that product, or
even recall previously-placed products, and to resubmit the product for
clearance or approval before we could sell it again. Depending on the product,
and the availability of acceptable substitutes, such an agency action could
result in significantly reduced revenues and earnings for an indefinite
period. See the risk factor above describing in detail the risks
related to the FDA’s June 2009 administrative action.
Federal,
state and foreign regulations regarding the manufacture and sale of our products
are subject to change. We cannot predict what impact, if any, such changes might
have on our business. In addition, there can be no assurance that regulation of
our products will not become more restrictive in the future and that any such
development would not have a material adverse effect on our
business.
The
industry and market segment in which we operate are highly competitive, and we
may not be able to compete effectively with larger companies with greater
financial resources than we have.
Our
industry and the markets we operate in are highly competitive. Some of our
competitors have greater financial resources than we do, making them better
equipped to fund research and development, manufacturing and marketing efforts,
or license technologies and intellectual property from third parties. Moreover,
competitive and regulatory conditions in many markets in which we operate
restrict our ability to fully recoup our costs in those markets. Our competitors
can be expected to continue to improve the design and performance of their
products and to introduce new products with competitive price and performance
characteristics. Although we believe that we have certain technological and
other advantages over our competitors, maintaining these advantages will require
us to continue to invest in research and development, sales and marketing and
customer service and support. We cannot assure you that we will have sufficient
resources to continue to make such investments at levels that our larger
competitors could make or that we will be successful in maintaining such
advantages.
Increased
competition in the United States could negatively impact our revenues and
profitability.
We could
face increased competition in the U.S. market, which historically has had a
limited number of market participants. For fiscal 2010, approximately 70% of our revenues
were generated in the U.S., and our U.S. operations have higher gross margins
than our operations outside the U.S. Additional competition in the U.S. could
negatively impact our revenues and/or our profitability.
13
Changes
in government policy may have a material adverse effect on our
business.
Changes
in government policy could have a significant impact on our business by
increasing the cost of doing business, affecting our ability to sell our
products and negatively impacting our profitability. Such changes could include
modifications to existing legislation, such as U.S. tax policy, or entirely new
legislation, such as the recently adopted healthcare reform bill.
The newly
enacted Patient Protection and Affordable Care Act imposes a new 2.3% excise tax
on medical device makers beginning in 2013, which could have a material negative
impact on our results of operations and our cash flows. Other elements of this
legislation could meaningfully change the way healthcare is developed and
delivered, and may materially impact numerous aspects of our
business.
We
may be exposed to product liability claims resulting from the use of products we
sell and distribute.
Although
product liability claims in our industry are infrequent, the expansion of our
business in an increasingly litigious business environment may expose us to
product liability claims related to the products we sell. We maintain insurance
that includes product liability coverage and we believe our insurance coverage
is adequate for our business. However, there can be no assurance that insurance
coverage for these risks will continue to be available or, if available, that it
will be sufficient to cover potential claims or that the present level of
coverage will continue to be available at a reasonable cost. A partially or
completely uninsured successful claim against us could have a material adverse
effect on us.
Item 1B. — Unresolved Staff Comments.
Not
applicable.
Item
2. — Properties.
In the
U.S., we lease our corporate office and main manufacturing facilities along with
laboratories and warehouses, which are located in Norcross, Georgia. We also
lease the manufacturing facility for our molecular immunohematology products,
which is located in Warren, New Jersey. Outside the U.S., we lease our
distribution facility in Germany as well as our sales offices in Western Europe
and in Japan, with the exception of our Belgium sales office, which we own. We
also own our Canadian manufacturing facility.
Our owned
properties are not encumbered as security for any loan. We believe that our
current facilities are adequate for our current and anticipated needs and do not
foresee any difficulty in renewing leases that expire in the near
term.
Item
3. — Legal Proceedings.
In
October 2007, we reported that the Federal Trade Commission (“FTC”) was
investigating whether Immucor violated federal antitrust laws or engaged in
unfair methods of competition through three acquisitions made in the period from
1996 through 1999, and whether Immucor or others engaged in unfair methods of
competition by restricting price competition. The FTC letter
requested that we provide certain documents and information to the FTC
concerning those acquisitions and concerning our product pricing activities
since then. In July 2008, the FTC formalized its document and
information requests into a Civil Investigative Demand (“CID”) and also required
us to provide certain additional information within the same general scope of
its previous requests. The FTC has also required that we provide to them the
documents we provided to the Department of Justice (see below). We have been
cooperating with the FTC and we intend to continue cooperating, and we are
assured that the issuance of a formal CID does not indicate any dissatisfaction
with our cooperation. As was previously the case, at this time we cannot
reasonably assess the timing or outcome of the investigation or its effect, if
any, on our business.
In April
2009, we received a subpoena from the United States Department of Justice,
Antitrust Division (“DOJ”), requiring us to produce documents for the period
beginning September 1, 2000 through April 23, 2009, pertaining to an
investigation of possible violations of the federal criminal antitrust laws in
the blood reagents industry. We have been cooperating with the DOJ and we intend
to continue cooperating. At this time we cannot reasonably assess the timing or
outcome of the investigation or its effect, if any, on our
business.
Beginning
in May 2009, a series of class action lawsuits has been filed against the
Company, Ortho-Clinical Diagnostics, Inc. and Johnson & Johnson Health Care
Systems, Inc. alleging that the defendants conspired to fix prices at which
blood reagents are sold, asserting claims under Section 1 of the Sherman Act,
and seeking declaratory and injunctive relief, treble damages, costs, and
attorneys’ fees. These cases are identified in Exhibit 99.1 of the fiscal 2010
Form 10-K. All of these complaints make substantially the same allegations. The
cases have been consolidated in the United States District Court for the Eastern
District of Pennsylvania. There has been no discovery and no
determination has been made whether any of the plaintiffs’ claims have merit or
should be allowed to proceed as a class action. We intend to vigorously defend
against these cases. At this time we cannot reasonably assess the timing or
outcome of this litigation or its effect, if any, on our business.
14
Private
securities litigation in the United States District Court of North Georgia
against the Company and certain of its current and former directors and officers
asserts federal securities fraud claims on behalf of a putative class of
purchasers of the Company's Common Stock between October 19, 2005 and June 25,
2009. This case is identified in Exhibit 99.1 of the fiscal 2010 Form 10-K. The
case alleges that the defendants violated Sections 10(b) and 20(a) of the
Securities Exchange Act of 1934, as amended, by failing to disclose that Immucor
had violated the antitrust laws, and challenges the sufficiency of the Company’s
disclosures about the results of FDA inspections and the Company’s quality
control efforts. There has been no discovery and no determination has been made
whether any of the plaintiffs’ claims have merit or should be allowed to proceed
as a class action. The Company will defend the case vigorously. At this time,
the Company cannot reasonably assess the timing or outcome of this litigation or
its effect, if any, on its business.
In fiscal
2010, the Company spent approximately $2.9 million in legal expenses related to
the Department of Justice investigation and the related lawsuits.
Other
than as set forth above, we are not currently subject to any material legal
proceedings, nor, to our knowledge, is any material legal proceeding threatened
against us. However, from time to time, we may become a party to
certain legal proceedings in the ordinary course of business.
Item 4. — Submission of Matters to a Vote of Security
Holders.
During
the fourth quarter of fiscal year 2010, no matters were submitted to a vote of
the security holders.
PART
II
Item
5. — Market for Registrant’s Common Equity, Related Stockholder Matters and
Issuer Purchases of Equity Securities.
Our
common stock trades on The Nasdaq Stock Market under the symbol
BLUD. The following table sets forth the quarterly high and low
prices of the common stock for the fiscal periods indicated as reported on The
Nasdaq Stock Market.
|
High
|
Low
|
|||||||
|
Fiscal
Year Ended May 31, 2010
|
||||||||
|
First
Quarter
|
$18.80 | $11.24 | ||||||
|
Second
Quarter
|
19.44 | 16.84 | ||||||
|
Third
Quarter
|
21.45 | 18.17 | ||||||
|
Fourth
Quarter
|
22.79 | 18.81 | ||||||
|
Fiscal
Year Ended May 31, 2009
|
||||||||
|
First
Quarter
|
$33.13 | $24.71 | ||||||
|
Second
Quarter
|
33.80 | 21.17 | ||||||
|
Third
Quarter
|
29.20 | 21.34 | ||||||
|
Fourth
Quarter
|
26.09 | 13.75 | ||||||
As of
June 30, 2010, there were 450 holders of record of our
common stock, which excludes shareholders whose shares were held by brokerage
firms, depositories and other institutional firms in “street name” for their
customers.
Dividend
Policy
We have
never declared cash dividends with respect to our common stock. We presently
intend to continue to reinvest our earnings in the business.
15
Equity
Compensation Plan Information
In 2005,
our Board of Directors adopted, and the shareholders approved, the Immucor, Inc.
2005 Long-Term Incentive Plan (the “2005 Plan”). The 2005 Plan replaced our
preexisting stock option plans, which have been frozen and remain in effect only
to the extent of awards outstanding under these plans. Under the 2005 Plan, the
Company is able to award stock options, stock appreciation rights, restricted
stock, deferred stock, and other performance-based awards as incentive and
compensation to employees and directors. Awards for up to 3,600,000 shares of
the Company’s common stock may be granted under the 2005 Plan. There is a
restriction on the number of shares that may be used for awards other than stock
options (1,800,000), and a separate restriction on the number of shares that may
be used for grants of incentive stock options (also 1,800,000), but there is no
restriction on the number of shares that may be used for grants of non-incentive
stock options. Options are granted at the closing market price on the date of
the grant. Option awards generally vest equally over a four-year period and have
a six-year contractual term. Restricted stock awards generally vest equally over
a five-year period. The 2005 Plan provides for accelerated vesting of option and
restricted stock awards if there is a change in control, as defined in the
plan.
The
following table provides information as of May 31, 2010 with respect to the
shares of our common stock that may be issued under our existing equity
compensation plans:
|
Plan
category
|
Number
of securities to be issued upon exercise of outstanding options, warrants
and rights
|
Weighted
average exercise price of outstanding options, warrants and
rights
|
Number
of securities remaining available for future issuance ***
|
|||||||||
|
Equity
compensation plans approved by security holders *
|
2,696,347 | $17.44 | 1,447,474 | |||||||||
|
Equity
compensation plans not approved by security holders **
|
251,918 | $0.89 | - | |||||||||
|
Total
|
2,948,265 | $16.03 | 1,447,474 | |||||||||
|
|
*
|
Includes
our 1998 Stock Option Plan, 2003 Stock Option Plan and 2005
Plan.
|
|
|
**
|
Includes
our 1990 Stock Option Plan and 1995 Stock Option
Plan.
|
|
|
***
|
Number
of securities available for future issuance represents securities
available under the 2005 Plan. At May 31, 2010, options had been granted
under the 2005 Plan to purchase 2,016,540 shares of common stock and
483,727 shares of restricted stock had been granted; all of the 1,447,474
remaining shares are available for issue under the 2005 Plan. No
securities are available for future issuance under any of the other plans,
which were frozen when the 2005 Plan was adopted. For a description of the
material features of the 2005 Plan, see Note 11 to the consolidated
financial statements.
|
Stock
Repurchase Program
The
Company instituted a stock repurchase program in June 1998. In August 2009, the
Board of Directors authorized the Company to repurchase an additional 2,000,000
shares of the Company’s common stock under this repurchase program, bringing the
total authorized shares to 11,375,000. During the fiscal year ended May 31,
2010, we repurchased approximately 650,000 shares of our common stock in the
open market for $11.6 million. As of May 31, 2010, 9,178,356 shares had been
repurchased under the program, leaving 2,196,644 shares available for
repurchase.
No
repurchases were made during the three months ended May 31, 2010.
16
Performance
Graph
The
following performance graph compares the cumulative total shareholder return on
an investment of $100 in our common stock for the last five fiscal years with
the total return of the S & P 500 and a Peer Group Index for our last five
fiscal years. Our primary competitor in the U.S. market is Johnson & Johnson
through its Ortho-Clinical Diagnostics business unit. Due to the size and
diversity of Johnson and Johnson, we do not believe it to be a true peer. For
this reason, our Peer Group is comprised of the following publicly traded
companies: (1) Meridian Bioscience, Inc.;
(2) Gen-Probe, Inc.; (3) Haemonetics Corp. and (4) Qiagen NV,
which we consider peers because they are medical technology companies without
large pharmaceutical operations.
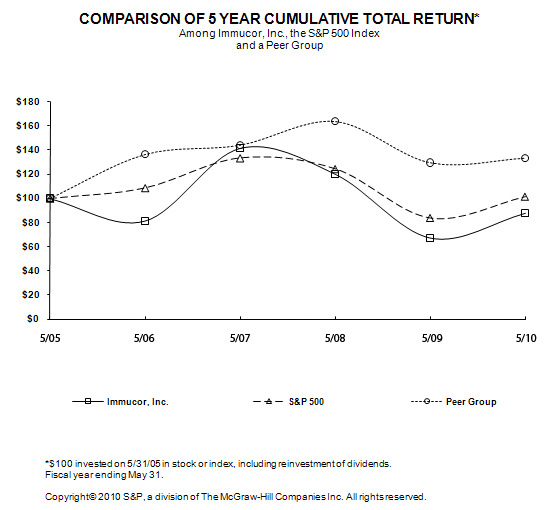
| 5/05 | 5/06 | 5/07 | 5/08 | 5/09 | 5/10 | ||||||||||||
|
Immucor,
Inc.
|
100.00 | 81.38 | 141.36 | 120.10 | 67.37 | 87.91 | |||||||||||
|
S&P
500
|
100.00 | 108.64 | 133.40 | 124.47 | 83.93 | 101.54 | |||||||||||
|
Peer
Group
|
100.00 | 136.45 | 144.22 | 163.82 | 129.66 | 133.52 |
The stock
price performance included in this graph is not necessarily indicative of future
stock price performance.
17
Item 6. – Selected Financial Data.
(All
amounts are in thousands, except per share amounts)
|
For
the Year Ended May 31,
|
||||||||||||||||||||
|
2010
|
2009
|
2008
|
2007
|
2006
|
||||||||||||||||
| (1) | (1) | (1) | (1) | (1) | ||||||||||||||||
|
Statement
of Income Data:
|
||||||||||||||||||||
|
Net
sales
|
$ | 329,073 | $ | 300,547 | $ | 261,199 | $ | 223,678 | $ | 183,506 | ||||||||||
|
Cost
of sales (exclusive of amortization included in operating expenses
below)
|
95,349 | 84,536 | 75,710 | 65,923 | 61,969 | |||||||||||||||
|
Gross
profit
|
233,724 | 216,011 | 185,489 | 157,755 | 121,537 | |||||||||||||||
|
Operating
expenses:
|
||||||||||||||||||||
|
Research
and development
|
15,437 | 10,698 | 6,454 | 6,354 | 4,623 | |||||||||||||||
|
Selling,
general, administrative and distribution
|
88,667 | 84,616 | 70,289 | 58,392 | 50,844 | |||||||||||||||
|
Restructuring
expenses
|
- | - | 646 | 1,051 | 2,689 | |||||||||||||||
|
Amortization
expense
|
4,278 | 3,739 | 357 | 346 | 341 | |||||||||||||||
|
Total
operating expenses
|
108,382 | 99,053 | 77,746 | 66,143 | 58,497 | |||||||||||||||
|
Income
from operations
|
125,342 | 116,958 | 107,743 | 91,612 | 63,040 | |||||||||||||||
|
Non-operating
income (expense):
|
||||||||||||||||||||
|
Interest
income
|
454 | 1,957 | 4,263 | 2,841 | 978 | |||||||||||||||
|
Interest
expense
|
(33 | ) | (250 | ) | (371 | ) | (432 | ) | (516 | ) | ||||||||||
|
Other
(expense) income – net
|
(551 | ) | (1,684 | ) | 33 | 133 | (342 | ) | ||||||||||||
|
Total
non-operating income (expense)
|
(130 | ) | 23 | 3,925 | 2,542 | 120 | ||||||||||||||
|
Income
before income taxes
|
125,212 | 116,981 | 111,668 | 94,154 | 63,160 | |||||||||||||||
|
Income
taxes
|
42,629 | 40,798 | 40,214 | 34,086 | 23,317 | |||||||||||||||
|
Net
income
|
$ | 82,583 | $ | 76,183 | $ | 71,454 | $ | 60,068 | $ | 39,843 | ||||||||||
|
Income
per share:
|
||||||||||||||||||||
|
Per
common share – Basic
|
$ | 1.18 | $ | 1.08 | $ | 1.02 | $ | 0.88 | $ | 0.59 | ||||||||||
|
Per
common share – Diluted
|
$ | 1.17 | $ | 1.07 | $ | 1.00 | $ | 0.85 | $ | 0.56 | ||||||||||
|
Weighted
average shares outstanding:
|
||||||||||||||||||||
|
Common
shares
|
70,062 | 70,382 | 69,867 | 68,441 | 68,004 | |||||||||||||||
|
Common
shares – assuming dilution
|
70,646 | 71,168 | 71,109 | 70,669 | 71,401 | |||||||||||||||
|
May
31,
|
||||||||||||||||||||
| 2010 | 2009 | 2008 | 2007 | 2006 | ||||||||||||||||
|
Balance
Sheet Data:
|
||||||||||||||||||||
|
Working
capital
|
$ | 270,939 | $ | 192,562 | $ | 230,556 | $ | 162,865 | $ | 92,883 | ||||||||||
|
Total
assets
|
519,834 | 451,340 | 364,950 | 275,478 | 191,687 | |||||||||||||||
|
Long-term
obligations, less current portion
|
- | - | - | 3,488 | 3,980 | |||||||||||||||
|
Retained
earnings
|
409,825 | 327,242 | 251,059 | 179,768 | 119,700 | |||||||||||||||
|
Shareholders’
equity
|
456,123 | 384,578 | 307,696 | 219,448 | 143,871 | |||||||||||||||
|
(1)
|
No
cash dividend was declared during any of the five
years.
|
18
Item
7. — Management’s Discussion and Analysis of Financial Condition and Results of
Operations.
Refer to “Forward Looking
Statements” following the Index and Item 1A “Risk Factors” of this Form
10-K.
Overview
Our
Business
We
develop, manufacture and sell a complete line of reagents and automated systems
used primarily by donor centers, hospitals and reference laboratories for
testing to detect and identify certain properties of human blood for the purpose
of blood transfusion. We have manufacturing facilities in the United States
(“U.S.”) and Canada and sell our products through our direct sales network in
the U.S., Canada, Western Europe and Japan as well as through third-party
distributors in other markets.
We
operate in a highly regulated industry and are subject to continuing compliance
with multiple country-specific statutes, regulations and standards. For example,
in the U.S. the Food and Drug Administration (“FDA”) regulates all aspects of
the blood banking industry, including the marketing of reagents and instruments
used to detect and identify blood properties. Additionally, we are subject to
government legislation that governs the delivery of healthcare. For
example, in the U.S. the Patient Protection and Affordable Care Act was signed
into law in March 2010 and contains elements that could meaningfully change the
way healthcare is developed and delivered in the U.S. Included in the
legislation is a 2.3% excise tax on medical device makers beginning in
2013.
In the
markets of Western Europe, the testing of donor and patient blood for the
purpose of transfusion is primarily automated. However, in the U.S., we estimate
approximately 60% of laboratories perform this testing manually today. These
laboratories are primarily in the small- to medium-sized hospital
segment.
Our
strategy is to drive automation in the blood bank with the goal of improving
operations as well as patient safety. We have introduced several serology
instruments in the past, and we continue to focus on developing new instruments
and improving our existing instruments. In late fiscal 2010, we began the
worldwide introduction of our fourth generation automated instrument, NEO™.
Targeted at large hospitals, donor centers and reference laboratories, NEO
replaces our previous high volume instrument, Galileo®, and due to added
functionality, we believe NEO is a more attractive instrument for the hospital
market. NEO delivers the market’s highest type-and-screen throughput and
broadest test menu as well as new STAT priority functionality for improved
workflow.
Launched
worldwide in 2007, Echo®, our third
generation automated instrument, is a compact bench top, fully-automated
walk-away serology instrument that meets the needs of the small- to medium-sized
hospital market as well as integrated delivery networks that want to standardize
the operations of their laboratories. Echo offers an extensive test menu and
significant labor reduction while increasing productivity and patient
safety.
Both our
high and lower volume serology instruments use Capture® technology, our
proprietary reagents, as well as certain traditional reagents to perform the
automated testing.
In fiscal
2009, we entered the field of molecular immunohematology, which is the DNA
analysis of blood for the purpose of transfusion, with our purchase of BioArray
Solutions.
BioArray
Acquisition
On August
4, 2008, we acquired BioArray Solutions Ltd. (“BioArray”), a privately-held
company based in Warren, New Jersey for an aggregate purchase price of $115.2
million in cash, including approximately $2.4 million of acquisition-related
transaction costs. We have included the financial results of BioArray in our
consolidated financial statements beginning August 4, 2008.
BioArray
pioneered the development of molecular diagnostic systems that enable the DNA
typing (genotyping) of blood for transfusion donors and recipients. In this
transaction, we acquired the broad intellectual property portfolio of issued
patents and pending patent applications that BioArray generated through its
substantial investments in research and development. Through the development of
technologies supported by the patents, BioArray developed a novel and flexible
technology platform that allows for a variety of DNA-based testing. The platform
combines semiconductor technology, microparticle chemistry and molecular biology
to bring a high degree of flexibility and performance to qualitative and
quantitative DNA and protein analysis. Using this technology platform, BioArray
offers complete assay solutions called the BeadChip™ system.
The
BeadChip system includes BeadChips featuring proprietary array designs as well
as a semi-automated instrument (the Array Imaging System and BASIS™) that reads
and interprets test results. The ensuing integrated assay delivery system
enables users to simultaneously perform dozens of customized tests on each
patient sample in a semi-automated fashion. We believe this versatility makes
the BeadChip format ideally suited to a wide scope of applications. The BeadChip
system is currently installed in a number of leading donor and transfusion
centers worldwide. In late fiscal 2010, we received CE (Conformité Européenne)
Mark approval for the Human Platelet Antigen (HPA) product as well as our
current instrument. In June 2010, after our fiscal 2010 year-end, we received CE
Mark approval for our Human Erythrocyte Antigen (HEA) product. The BeadChip
system is currently available for Research Use Only in the U.S.
19
We
believe that molecular immunohematology, or the DNA analysis of blood for the
purpose of transfusions, will revolutionize transfusion medicine. We believe
that our acquisition of BioArray provides new, strategic growth markets for the
Company in both our current market of transfusion through an offering
complementary to our current serology product offerings as well as potential new
markets. Our leadership in blood banking industry automation and BioArray’s
leadership in molecular diagnostic systems for specialty transfusion
applications should allow us to develop and deliver more precise molecular
immunohematology solutions to enhance patient outcomes.
We also
believe our proven strength in developing automated instruments combined with
our FDA licensing and CE Mark process experience, our established distribution
network, our sales and marketing capabilities as well as our financial resources
will generate enhanced long-term growth opportunities for the commercialization
of BioArray’s BeadChip system.
We are
currently working on the next generation molecular immunohematology instrument
that we believe will facilitate the further commercialization of this innovative
technology. Our current plan is to have a Research Use Only instrument available
in the first half of calendar 2011.
Recent
Developments
A
significant recent development is the work on our next generation automated
instrument to allow the full scale commercialization of our molecular
immunohematology offering, which is discussed above under “BioArray
Acquisition.” The following discusses other recent developments in our
business.
Worldwide Launch of NEO – In
late fiscal 2010, we began the worldwide introduction of our fourth generation
automated instrument for serology testing, NEO, which replaces our current high
volume instrument, Galileo. We believe Galileo, which was launched in Western
Europe in 2002 and in the U.S. in 2004, has reached its natural replacement
cycle of five to seven years. Like Galileo, NEO is targeted at high volume
customers: large hospitals, donor centers and reference laboratories. We believe
NEO will have broader market appeal in the hospital segment than Galileo due to
added functionality and faster turnaround times. During February 2010, NEO
received CE Mark approval in the European Union and in April 2010 NEO received
FDA clearance in the U.S.
Continued market penetration of the
Echo instrument – We
launched our third generation automated instrument for serology testing, Echo,
in the first quarter of fiscal 2008. Echo features STAT functionality,
exceptional mean time between failures and what we believe is the fastest
turnaround time in the industry. Echo is targeted at small- to medium-sized
hospitals, the largest segment of our market, as well as at integrated delivery
networks, in combination with NEO, to facilitate standardization across
facilities.
FDA Administrative Action –
In June 2009, we announced that the FDA, in an administrative action
based on a January 2009 inspection, issued a notice of intent to revoke our
biologics license with respect to our Reagent Red Blood Cells and Anti-E
(Monoclonal) Blood Grouping Reagent products. Under this administrative action,
we have the opportunity to demonstrate or achieve compliance before the FDA
initiates revocation proceedings or takes other action. The FDA did not order
the recall of any of our products or restrict us from selling these products.
This administrative action was a follow on to a warning letter that we had
received in May 2008. We had been working on an FDA-approved remediation plan,
submitted after the warning letter, but had failed to make adequate progress at
the time of the FDA’s follow up inspection in January 2009. In early calendar
2009 (during our third quarter of fiscal 2009), we formalized efforts to improve
our quality systems through the Quality Process Improvement Project, which is
discussed in further detail below. In August 2009 in response to the June 2009
administrative action, we submitted a detailed remediation plan that outlined
our actions and timelines to correct the FDA’s noted deficiencies from the
January 2009 inspection. The Quality Process Improvement Project served as the
basis for the detailed remediation plan. During our third fiscal quarter of
2010, we completed the remediation portion of the Project. During June 2010,
after our fiscal 2010 year-end, the FDA conducted an inspection of our
facilities. We have no update on our compliance status at this
time.
Quality Process Improvement Project
– During our third quarter of fiscal 2009, we formalized our efforts to
improve the processes and procedures of our quality department through
establishing the Quality Process Improvement Project. The Project expanded the
role of consultants hired in April 2008. The Project’s objective is to both
remediate the deficiencies noted by FDA and to deliver on our commitment of
maintaining a world-class quality system. During fiscal 2010 and fiscal 2009, we
spent approximately $5.9 million and $2.4 million, respectively, on the Project.
These costs were reflected in cost of sales and primarily represent the cost of
external consultants who were assisting us with the Project. During our third
fiscal quarter of 2010, we completed the remediation portion of the Project. The
Project continues with a focus on establishing a world-class quality system. We
will primarily use internal resources on the Project going forward.
Instruments
We
continue to focus on increasing market share and, therefore, revenue through our
automation strategy, which has instrument placements at its core. We believe our
innovative automation offering is a key competitive advantage we have in the
industry.
20
For
markets in which we sell directly to the end user (e.g., a hospital), the
process is as follows: we receive the order, we schedule installation of the
instrument and customer staff training, the customer performs validation testing
of the instrument, which begins generating recurring reagent revenue and the
revenue ramps up to its expected annualized run rate once the validation process
has been completed.
Revenue
and expenses related to the sale of instruments is accounted for under FASB Accounting Standards
CodificationTM
(“ASC”) 605-25 “Revenue Recognition: Multiple-Element Arrangements” (“ASC
605-25”). ASC 605-25 mandates the deferral of certain revenue for sales
agreements that have multiple deliverables while also mandating the upfront
expensing of the related costs. The reagent contracts that are signed when
customers automate typically have reagent price guarantee clauses. When
instruments are sold (versus rented) the instrument costs are expensed when the
sale is made and the related instrument revenue is deferred and recorded as
income over the term of the underlying reagent contract. If an instrument is
rented, then the revenue and expenses are recognized ratably over the contract
period. While the overall transaction economics may be similar, this accounting
treatment may result in margin improvement or degradation depending on the sales
mix of instruments purchased or rented by customers in the period. For Echo, in
fiscal 2010, we experienced a rental rate of more than 75% for new instrument
orders in the U.S. Historically, our high volume instrument, Galileo, was
purchased 90% of the time in the U.S. market. As of May 31, 2010 and 2009, we
had deferred revenue of approximately $16.7 million and $22.1 million,
respectively, and a major portion of these balances related to the deferral of
revenue from sales of instruments.
Results
of Operations
Comparison
of Years Ended May 31, 2010 and May 31, 2009
|
For
the Year Ended May 31,
|
Change
|
||||||||||||||
|
2010
|
2009
|
Amount
|
%
|
||||||||||||
|
($
in thousands)
|
|||||||||||||||
|
Net
Sales
|
$ | 329,073 | $ | 300,547 | $ | 28,526 | 9 | % | |||||||
|
Gross
profit (1)
|
233,724 | 216,011 | 17,713 | 8 | % | ||||||||||
|
Gross
profit percentage
|
71.0 | % | 71.9 | % | -1 | % | |||||||||
|
Operating
expenses
|
108,382 | 99,053 | 9,329 | 9 | % | ||||||||||
|
Income
from Operations
|
125,342 | 116,958 | 8,384 | 7 | % | ||||||||||
|
Non-operating
income (expense)
|
(130 | ) | 23 | (153 | ) | -665 | % | ||||||||
|
Income
before income tax
|
125,212 | 116,981 | 8,231 | 7 | % | ||||||||||
|
Provision
for income tax
|
42,629 | 40,798 | 1,831 | 4 | % | ||||||||||
|
Net
income
|
$ | 82,583 | $ | 76,183 | $ | 6,400 | 8 | % | |||||||
|
Earnings
per share:
|
|||||||||||||||
|
Per
common share - basic
|
$ | 1.18 | $ | 1.08 | $ | 0.10 | 9 | % | |||||||
|
Per
common share - diluted
|
$ | 1.17 | $ | 1.07 | $ | 0.10 | 9 | % | |||||||
|
(1)
The determination of gross margin is exclusive of amortization expense
which is presented separately as an operating expense in the statements of
income.
|
|||||||||||||||
Revenue
increased by approximately $28.5 million, or approximately 9%, during the year
ended May 31, 2010 compared with the prior year. This increase was primarily
attributable to approximately $18.1 million from price contributions, which
included incremental revenue from both contractual and discretionary sources,
and approximately $7.6 million from volume contributions, which included
incremental revenue primarily from instrument placements. Revenue also benefited
by approximately $2.8 million in fiscal 2010 from foreign currency fluctuations.
Approximately 70% of our fiscal 2010 consolidated revenue is from the U.S. and
approximately 30% is from international sales largely denominated in local
currency. Our significant currencies besides the U.S. dollar are the Euro, the
Canadian Dollar, the British Pound and the Japanese Yen. As a result, our
consolidated revenue expressed in dollars benefits when the U.S. dollar weakens
and decreases when the U.S. dollar strengthens in relation to other currencies.
For
fiscal 2010, our consolidated gross margin decreased to 71.0% from 71.9%
achieved in fiscal 2009, primarily due to expenses related to our Quality
Process Improvement Project, which were reflected in cost of sales. During
fiscal 2010, we spent approximately $5.9 million on our Quality Process
Improvement Project compared with approximately $2.4 million spent in fiscal
2009. Operating expenses increased approximately 9%, primarily due to our
acquisition of BioArray (which closed on August 4, 2008), increased legal
expenses and increased research and development expenses related to various
projects, including our next generation instrument for molecular
immunohematology. Net income increased approximately 8% in fiscal 2010 over the
prior year.
21
In fiscal
2010, we received 85 orders for our high volume instruments, Galileo and NEO,
including 83 in the rest of the world, including distributors, and 2 in the U.S.
and Canada. In fiscal 2010, we received 248 orders for our Echo instrument,
including 74 in the rest of the world, including distributors, and 174 in the
U.S. and Canada. As of May 31, 2010, we had an instrument backlog of 43
Galileo/NEOs and 179 Echos.
Net
sales
|
For
the Year Ended May 31,
|
Change
|
||||||||||||||
|
2010
|
2009
|
Amount
|
%
|
||||||||||||
|
($
in thousands)
|
|||||||||||||||
|
Traditional
reagents
|
$ | 207,710 | $ | 199,277 | $ | 8,433 | 4 | % | |||||||
|
Capture
reagents
|
77,003 | 64,145 | 12,858 | 20 | % | ||||||||||
|
Instruments
|
39,680 | 34,672 | 5,008 | 14 | % | ||||||||||
|
Molecular
immunohematology
|
4,680 | 2,453 | 2,227 | 91 | % | ||||||||||
| $ | 329,073 | $ | 300,547 | $ | 28,526 | 9 | % | ||||||||
Traditional
reagent revenue increased by approximately $8.4 million, or approximately 4%, in
fiscal 2010 compared with fiscal 2009 primarily due to price contributions,
which included incremental revenue from both contractual and discretionary
sources. Traditional reagent sales, which accounted for approximately 63% of
total revenue in fiscal 2010, have historically been a significant portion of
our revenue. Our revenue mix is changing over time as we place more instruments
in the market, which results in increased sales of our Capture
reagents.
Capture
revenue increased by approximately $12.9 million, or approximately 20%, in
fiscal 2010 over the prior year primarily due to increased volume. Sales of
Capture reagents are largely dependent on the number of installed instruments
requiring the use of our proprietary Capture technology. As we continue to place
more instruments in the market, we expect revenue from Capture reagents to
continue to increase.
Revenue
from instruments increased by approximately $5.0 million, or approximately 14%
in fiscal 2010 compared with the prior year due to increased instrument
placements. Instrument revenue is typically recognized over the life of either
the instrument rental period or the underlying reagent contract period. Historically, when
instruments are sold (versus rented) revenue is deferred and
recognized over the life of the underlying reagent contract period when the
contract includes a price guarantee (which our contracts typically do).
In fiscal 2010, approximately $16.8 million of deferred revenue was
recognized from previous instrument sales compared with $16.9 million recognized
in fiscal 2009. In fiscal 2010, we deferred approximately $11.6 million of
instrument and associated service revenues related to instrument sales compared
with $14.7 million in the prior year. As of May 31, 2010 and 2009, deferred
instrument and service revenues on the balance sheet totaled approximately $16.7
million and $22.1 million, respectively. Over the past three years, the
proportion of instruments rented (versus sold) has increased. Therefore, our
deferred revenue balance has declined.
Molecular
immunohematology revenue increased by approximately $2.2 million in fiscal 2010
compared with fiscal 2009, primarily due to the introduction of our molecular
offering outside the U.S. Our molecular immunohematology products are a result
of our August 4, 2008 BioArray acquisition.
22
Gross margin
|
For
the Year Ended May 31,
|
||||||||||||||||||
|
2010
|
2009
|
Change
|
||||||||||||||||
|
Amount
|
Margin %
|
Amount
|
Margin %
|
Amount
|
||||||||||||||
|
(in
'000)
|
(in
'000)
|
(in
'000)
|
||||||||||||||||
|
Traditional
reagents (1)
|
$ | 161,557 | 77.8% | $ | 155,744 | 78.2% | $ | 5,813 | ||||||||||
|
Capture
reagents (1)
|
62,732 | 81.5% | 54,411 | 84.8% | 8,321 | |||||||||||||
|
Instruments
(1)
|
8,813 | 22.2% | 5,259 | 15.2% | 3,554 | |||||||||||||
|
Molecular
immunohematology (1)
|
622 | 13.3% | 597 | 24.3% | 25 | |||||||||||||
| $ | 233,724 | 71.0% | $ | 216,011 | 71.9% | $ | 17,713 | |||||||||||
(1) The
determination of gross margin is exclusive of amortization expense which is
presented separately as an operating expense in the statements of
income.
Gross
margins on traditional reagents decreased to 77.8% in fiscal 2010 from 78.2% in
the prior year, primarily due to expenses related to our Quality Process
Improvement Project. During the current fiscal year, we spent approximately $5.9
million on our Quality Process Improvement Project compared with approximately
$2.4 million spent in fiscal 2009. These costs were primarily reflected in
traditional reagent cost of sales.
For
fiscal 2010, Capture product gross margins decreased to 81.5% from 84.8% in the
prior year primarily due to the allocation of revenue from Capture reagents to
instruments related to reagent rentals as well as due to manufacturing
variances. In a reagent rental, the reagent revenue stream is used to fund all
components of the customer’s acquisition, including the reagents themselves as
well as the instrument and instrument-related items, such as training. Reagent
gross margin is negatively impacted as a portion of reagent revenue is allocated
to instruments over the life of the contract but none of the costs associated
with the reagents are allocated.
Gross
margins on instruments increased to 22.2% in fiscal 2010 from 15.2% in the prior
year, primarily due to sales mix. In the current year, more instruments were
rented (versus sold) compared to the prior year. An instrument rental results in
revenue and expenses related to the instrument being recognized evenly over the
contract period. When we sell an instrument and the sales contract has reagent
price guarantees, which our contracts typically do, the instrument costs are
expensed upfront and the related instrument revenue is deferred and recognized
over the contract period. Current year and prior year margins benefited from the
recognition of revenue deferred from prior periods. In fiscal 2010 and fiscal
2009, we recognized $16.8 million and $16.9 million, respectively, of deferred
revenue related to instrument sales and service.
Operating
expenses
|
For
the Year Ended May 31,
|
Change
|
||||||||||||||
|
2010
|
2009
(1)
|
Amount
|
%
|
||||||||||||
|
($
in thousands)
|
|||||||||||||||
|
Research
and development
|
$ | 15,437 | $ | 10,698 | $ | 4,739 | 44 | % | |||||||
|
Selling
and marketing
|
36,995 | 38,315 | (1,320 | ) | -3 | % | |||||||||
|
Distribution
|
14,831 | 13,708 | 1,123 | 8 | % | ||||||||||
|
General
and administrative
|
36,841 | 32,593 | 4,248 | 13 | % | ||||||||||
|
Amortization
expense
|
4,278 | 3,739 | 539 | 14 | % | ||||||||||
|
Total
operating expenses
|
$ | 108,382 | $ | 99,053 | $ | 9,329 | 9 | % | |||||||
|
(1) Certain
prior year operating expenses have been reclassified to conform with
current year presentation.
|
|||||||||||||||
Research
and development expenses increased by approximately $4.7 million in fiscal 2010
over the prior year, primarily due to recognizing a full year of BioArray
expenses, which was acquired on August 4, 2008, and the development activities
for the next generation molecular immunohematology instrument.
Selling
and marketing expenses decreased by approximately $1.3 million in fiscal 2010
compared with fiscal 2009, primarily due to lower compensation
expense.
Distribution
expenses rose by approximately $1.1 million in fiscal 2010 over the prior year,
primarily due to increased shipping and packaging costs.
23
General
and administrative expenses increased by approximately $4.2 million in fiscal
2010 over the prior year, primarily due to legal expenses related to the
Department of Justice investigation and the related lawsuits.
Amortization
expense increased by approximately $0.5 million in fiscal 2010 compared with
fiscal 2009 primarily due to recognizing a full year of amortization of
finite-lived intangibles that were recorded upon the acquisition of
BioArray.
Non-operating
income (expense)
|
For
the Year Ended May 31,
|
Change
|
|||||||||||
|
2010
|
2009
|
Amount
|
||||||||||
|
($
in thousands)
|
||||||||||||
|
Non-operating
income (expense)
|
$ | (130 | ) | $ | 23 | $ | (153 | ) | ||||
The
year-over-year change in non-operating income (expense) was primarily
attributable to lower interest income due to a
decrease in interest rates.
Income
taxes
The
provision for income taxes increased $1.8 million in fiscal 2010 compared with
fiscal 2009 primarily due to increased pre-tax income. The effective income tax
rate was 34.0% in the current year compared with 34.9% in the prior year. The
tax rate in the current year period was favorably impacted primarily by a settlement with a state
taxing authority.
As a
result of using compensation cost deductions arising from the exercise of
nonqualified employee stock options and vesting of restricted shares for federal
and state income tax purposes, we had an income tax shortfall of approximately
$0.2 million in fiscal 2010 and we realized income tax benefits of $3.3 million
in fiscal 2009.
As required by U.S.
generally accepted accounting principles, the income tax shortfall and income
tax benefits are recognized in our financial statements as a reduction of or an
addition to additional paid-in capital rather than as an increase or reduction
of the respective income tax provisions in the consolidated financial
statements.
Comparison
of Years Ended May 31, 2009 and May 31, 2008
|
For
the Year Ended May 31,
|
Change
|
||||||||||||||
|
2009
|
2008
|
Amount
|
%
|
||||||||||||
|
($
in thousands)
|
|||||||||||||||
|
Net
Sales
|
$
|
300,547
|
$
|
261,199
|
$
|
39,348
|
15
|
%
|
|||||||
|
Gross
profit (1)
|
216,011
|
185,489
|
30,522
|
16
|
%
|
||||||||||
|
Gross
profit percentage
|
71.9
|
%
|
71.0
|
%
|
|
1
|
%
|
||||||||
|
Operating
expenses
|
99,053
|
77,746
|
21,307
|
27
|
%
|
||||||||||
|
Income
from Operations
|
116,958
|
107,743
|
9,215
|
9
|
%
|
||||||||||
|
Non-operating
income
|
23
|
3,925
|
(3,902
|
)
|
-99
|
%
|
|||||||||
|
Income
before income tax
|
116,981
|
111,668
|
5,313
|
5
|
%
|
||||||||||
|
Provision
for income tax
|
40,798
|
40,214
|
584
|
1
|
%
|
||||||||||
|
Net
income
|
$
|
76,183
|
$
|
71,454
|
$
|
4,729
|
7
|
%
|
|||||||
|
Earnings
per share:
|
|||||||||||||||
|
Per
common share - basic
|
$
|
1.08
|
$
|
1.02
|
$
|
0.06
|
6
|
%
|
|||||||
|
Per
common share - diluted
|
$
|
1.07
|
$
|
1.00
|
$
|
0.07
|
7
|
%
|
|||||||
|
(1)
The determination of gross margin is exclusive of amortization expense
which is presented separately as an operating expense in the income
statement.
|
Revenue
increased by approximately $39.3 million, or approximately 15%, during the year
ended May 31, 2009 compared with the prior year. This increase was primarily
attributable to approximately $27.3 million from price contributions, which
included incremental revenue from both contractual and discretionary sources,
and approximately $15.7 million from volume contributions, which included
incremental revenue from instrument placements. These increases were offset by a
negative currency impact of approximately $3.7 million. Approximately 70% of our
fiscal 2009 consolidated revenue is from the U.S. and 30% is from international
sales largely denominated in local currency, with the majority of this revenue
in Euros, Canadian Dollars, British Pounds and Yen. As a result, our
consolidated revenue expressed in dollars benefits when the U.S. dollar weakens
and decreases when the U.S. dollar strengthens in relation to other currencies.
24
For
fiscal 2009, our consolidated gross margin increased to 71.9% from 71.0%
achieved in fiscal 2008, primarily due to margin improvements in traditional
reagents and instruments. During the current fiscal year, we spent approximately
$2.4 million on our Quality Process Improvement Project, which was primarily
reflected in cost of sales. Operating expenses increased approximately 27%,
primarily due to our acquisition of BioArray. Net income increased approximately
7% in fiscal 2009 over the prior year.
Net
sales
|
For
the Year Ended May 31,
|
Change
|
||||||||||||||
|
2009
|
2008
|
Amount
|
%
|
||||||||||||
|
($
in thousands)
|
|||||||||||||||
|
Traditional
reagents
|
$ | 199,277 | $ | 179,088 | $ | 20,189 | 11 | % | |||||||
|
Capture
reagents
|
64,145 | 53,372 | 10,773 | 20 | % | ||||||||||
|
Instruments
|
34,672 | 27,042 | 7,630 | 28 | % | ||||||||||
|
Molecular
immunohematology
|
2,453 | - | 2,453 | 100 | % | ||||||||||
|
Collagen
|
- | 1,697 | (1,697 | ) | -100 | % | |||||||||
| $ | 300,547 | $ | 261,199 | $ | 39,348 | 15 | % | ||||||||
Traditional
reagent revenue increased by approximately $20.2 million, or approximately 11%,
in fiscal 2009 compared with fiscal 2008 primarily due to price contributions,
which included incremental revenue from both contractual and discretionary
sources. Traditional reagent sales, which accounted for approximately two-thirds
of total revenue in fiscal 2009, have historically been a significant portion of
our revenue. We expect our revenue mix to change over time as we place more
instruments in the market, which results in increased sales of our Capture
reagents.
Capture
revenue increased by approximately $10.8 million, or approximately 20%, in
fiscal 2009 over the prior year primarily due to increased volume. Sales of
Capture reagents are largely dependent on the number of installed instruments
requiring the use of our proprietary Capture technology. As we continue to place
more instruments in the market, we expect revenue from Capture reagents to
continue to increase.
Revenue
from instruments increased by approximately $7.6 million, or approximately 28%
in fiscal 2009 compared with fiscal 2008 due to increased instrument placements.
Historically,
revenue from instrument sales in the United States has been recognized over the
life of the underlying reagent contract when it includes a price guarantee,
which is normally five years. In fiscal 2009, approximately $16.9 million
of deferred revenue was recognized from previously placed instruments compared
to $13.3 million recognized in fiscal 2008. We deferred approximately $14.7
million of instrument and associated service revenues related to instrument
placements in fiscal 2009, compared to $17.5 million in fiscal 2008. We had
increased rentals of instruments in the current year, which resulted in revenue
being recognized over the term of the contract as earned, versus deferred and
amortized as in the case of the instrument being sold. As of May 31, 2009 and
May 31, 2008, deferred instrument and service revenues totaled approximately
$22.1 million and $24.2 million, respectively.
The sale
of molecular immunohematology products produced by BioArray resulted in $2.5
million in revenue during fiscal 2009. BioArray was acquired on August 4,
2008.
We
discontinued manufacturing collagen products in the second quarter of fiscal
2008 when our commitment to a third party expired, which resulted in a revenue
decrease of $1.7 million in fiscal 2009.
25
Gross
margin
|
For
the Year Ended May 31,
|
||||||||||||||||||||
|
2009
|
2008
|
Change
|
||||||||||||||||||
|
Amount
|
Margin %
|
Amount
|
Margin %
|
Amount
|
||||||||||||||||
|
(in
'000)
|
(in
'000)
|
(in
'000)
|
||||||||||||||||||
|
Traditional
reagents (1)
|
$ | 155,744 | 78.2 | % | $ | 139,428 | 77.9 | % | $ | 16,316 | ||||||||||
|
Capture
reagents (1)
|
54,411 | 84.8 | % | 45,568 | 85.4 | % | 8,843 | |||||||||||||
|
Instruments
(1)
|
5,259 | 15.2 | % | 476 | 1.8 | % | 4,783 | |||||||||||||
|
Molecular
immunohematology (1)
|
597 | 24.3 | % | - | 0.0 | % | 597 | |||||||||||||
|
Collagen
(1)
|
- | 0.0 | % | 17 | 1.0 | % | (17 | ) | ||||||||||||
| $ | 216,011 | 71.9 | % | $ | 185,489 | 71.0 | % | $ | 30,522 | |||||||||||
|
(1) The
determination of gross margin is exclusive of amortization expense which
is presented separately as an operating expense in the income
statement.
|
Gross
margins on traditional reagents increased to 78.2% in fiscal 2009 from 77.9% in
the prior year, primarily due to higher revenue without a proportionate increase
in cost of sales. During fiscal 2009, we spent approximately $2.4 million on our
Quality Process Improvement Project. These costs were primarily reflected in
traditional reagent cost of sales.
For
fiscal 2009, Capture product gross margins decreased to 84.8% from 85.4% in the
prior year primarily due to foreign currency fluctuations and product sales
mix.
Gross
margins on instruments increased to 15.2% in fiscal 2009 from 1.8% in the prior
year, primarily due to sales mix. In the prior year, more instruments were sold
and in the current year more instruments were rented. Where sales contracts have
reagent price guarantee clauses (which our automation contracts typically do),
instrument costs are expensed when the sale is made, but the related instrument
revenue is deferred and recorded as income over the term of the contract. When
an instrument is rented, revenue and expenses for the transaction are recognized
evenly over the life of the contract. Additionally, current year margins
benefited from the recognition of revenue deferred from prior periods. In fiscal
2009, we recognized $3.6 million more deferred revenue than in the prior
year.
Operating
expenses
|
For
the Year Ended May 31,
|
Change
|
||||||||||||||
|
2009
(1)
|
2008
(1)
|
Amount
|
%
|
||||||||||||
|
($
in thousands)
|
|||||||||||||||
|
Research
and development
|
$ | 10,698 | $ | 6,454 | $ | 4,244 | 66 | % | |||||||
|
Selling
and marketing
|
38,315 | 32,510 | 5,805 | 18 | % | ||||||||||
|
Distribution
|
13,708 | 11,394 | 2,314 | 20 | % | ||||||||||
|
General
and administrative
|
32,593 | 26,385 | 6,208 | 24 | % | ||||||||||
|
Restructuring
expense
|
- | 646 | (646 | ) | -100 | % | |||||||||
|
Amortization
expense
|
3,739 | 357 | 3,382 | 947 | % | ||||||||||
|
Total
operating expenses
|
$ | 99,053 | $ | 77,746 | $ | 21,307 | 27 | % | |||||||
|
(1) Certain
prior year operating expenses have been reclassified to conform with
current year presentation.
|
Research
and development expenses increased by approximately $4.2 million in fiscal 2009
over the prior year, primarily due to the acquisition of BioArray, which took
place in the first quarter of this fiscal year, and the development activities
around the acquired molecular immunohematology offering.
Selling
and marketing expenses increased by approximately $5.8 million in fiscal 2009
compared with fiscal 2008, primarily due to the addition of new affiliates in
France and the United Kingdom, and the BioArray acquisition.
Distribution
expenses rose by approximately $2.3 million in fiscal 2009 over the prior year,
primarily due to an increase in freight charges and other general
expenses.
General
and administrative expenses increased by approximately $6.2 million in fiscal
2009 over the prior year, primarily due to the addition of BioArray and our
affiliates in the United Kingdom and France.
26
Amortization
expense increased by approximately $3.4 million in fiscal 2009 compared with
fiscal 2008 due to amortization of finite-lived intangibles that were recorded
upon the acquisition of BioArray and our affiliate in the United Kingdom. Both
acquisitions occurred in the first quarter of this fiscal year.
Non-operating
income
|
For
the Year Ended May 31,
|
Change
|
|||||||||||
|
2009
|
2008
|
Amount
|
||||||||||
|
($
in thousands)
|
||||||||||||
|
Non-operating
income
|
$ | 23 | $ | 3,925 | $ | (3,902 | ) | |||||
The year-over-year
decrease in non-operating income was primarily attributable to lower
interest income due to our lower cash balance as well as a decrease in interest
rates. Cash on hand was lower in fiscal 2009 as a result of the acquisitions
made in the first fiscal quarter. Additionally, non-operating income was lower
as a result of higher foreign exchange
losses related to an intercompany receivable.
Income
taxes
The
provision for income taxes increased $0.6 million in fiscal 2009 compared with
fiscal 2008 primarily due to increased pre-tax income. The effective income tax
rate was 34.9% in the current year compared with 36.0% in the prior year. The
tax rates in the current year periods were favorably impacted primarily by an
increase in research and development credits following the BioArray acquisition
and lower statutory rates in Italy.
As a
result of using compensation cost deductions arising from the exercise of
nonqualified employee stock options and vesting of restricted shares for federal
and state income tax purposes, we realized income tax benefits of approximately
$3.3 million in fiscal 2009 and $7.5 million in fiscal 2008. The majority of the
exercises that contribute to the tax benefit are exercises of options that were
granted prior to the adoption of ASC 718 “Compensation – Stock Compensation”
(“ASC 718”). Therefore, as required by U.S. generally accepted accounting
principles, these income tax benefits are recognized in our financial statements
as additions to additional paid-in capital rather than as reductions of the
respective income tax provisions in the consolidated financial statements
because the related compensation deductions were not recognized as compensation
expense for financial reporting purposes. Our income tax liability is reduced by
these amounts.
Liquidity
and Capital Resources
Cash
flow
Our
principal source of liquidity is our operating cash flow. This cash-generating
capability is one of our fundamental strengths and provides us with substantial
financial flexibility in meeting our operating, investing and financing needs.
We have adequate
working capital and sources of capital to operate our current business and to
meet our existing capital requirements. At May 31, 2010, we had working capital
of $270.9 million, compared to $192.6 million of working capital at May 31,
2009. The following table shows the cash flows provided by or used in
operating, investing and financing activities for fiscal years 2010, 2009 and
2008, as well as the effect of exchange rates on cash and cash equivalents for
those same years:
|
For
the Year Ended May 31,
|
||||||||||||
|
2010
|
2009
|
2008
|
||||||||||
|
(in
thousands)
|
||||||||||||
|
Net
cash provided by operating activities
|
$ | 84,751 | $ | 79,822 | $ | 75,105 | ||||||
|
Net
cash used in investing activities
|
(6,304 | ) | (116,556 | ) | (15,693 | ) | ||||||
|
Cash
provided by (used in) financing activities
|
(11,757 | ) | (1,396 | ) | 72 | |||||||
|
Effect
of exchange rate changes on cash and cash equivalents
|
(502 | ) | (465 | ) | 2,021 | |||||||
|
Increase
(decrease) in cash and cash equivalents
|
$ | 66,188 | $ | (38,595 | ) | $ | 61,505 | |||||
Our cash
and cash equivalents were $202.6 million as of May 31, 2010, as compared to
$136.5 million as of May 31, 2009. The increase in our cash position resulted
from operating cash flow in the current year.
27
Operating activities – Cash
flow from operations generally increases proportionately with increases in net
income.
In fiscal
2010, net cash generated by operating activities was $84.8 million compared with
$79.8 million in fiscal 2009. The year-over-year increase in cash flow from
operating activities was primarily attributable to the $6.4 million
year-over-year increase in net income.
In fiscal
2009, net cash generated by operating activities was $79.8 million compared with
$75.1 million in fiscal 2008. The year-over-year increase in cash flow from
operating activities was primarily attributable to the $4.7 million
year-over-year increase in net income.
Investing activities –
Generally, the primary use of cash for investing activities is related to the
purchase of property and equipment. However, in fiscal 2009, we used
a significant amount of cash for acquisitions.
In fiscal
2010, $6.3 million of net cash was used in investing activities compared with
$116.6 million of cash used in the fiscal 2009. Cash used in investing
activities in the current year related to the purchase of property and
equipment. In the prior year, we paid $108.0 million for the acquisition of
BioArray and our U.K. distributor as well as $8.6 million for the purchase of
property and equipment.
For
fiscal 2009, $116.6 million of net cash was used in investing activities
compared with $15.7 million of cash used in the fiscal 2008. We paid $108.0
million for the acquisition of BioArray and our U.K. distributor in fiscal 2009.
For the purchase of property and equipment, we spent $8.6 million in the fiscal
2009 compared with $11.6 million spent in fiscal 2008.
Financing activities – For
financing activities, the typical use of cash is for the repurchase of our
common stock and the typical cash proceeds relates to the exercise of stock
options.
Net cash
used in financing activities was $11.8 million during fiscal 2010, compared with
$1.4 million in the prior year. During fiscal 2010, we used $11.6 million to
repurchase shares of our common stock in the open market. Also reflected in
‘repurchase of common stock’ in the cash flow statement is approximately $0.3
million in withholding taxes we paid. This payment was in compliance with
statutory tax withholding requirements for the exercise of options and vesting
of restricted shares in exchange for surrender of the Company’s shares of equal
value. During fiscal 2010, we received $0.3 million cash from the exercise of
employee stock options compared with $3.2 million in the same period of the
prior year. For fiscal 2010 we had a tax shortfall of $0.2 million and in fiscal
2009 we had a tax benefit of $3.3 million from the exercise of nonqualified
employee stock options.
In fiscal
2009, net cash used in financing activities was $1.4 million compared with net
cash generated by financing activities of $0.1 million in the prior year. During
fiscal 2009, we used $6.7 million to repurchase shares of our common stock in
the open market. Also reflected in ‘repurchase of common stock’ in the cash flow
statement is approximately $1.0 million in withholding taxes we
paid. This payment was in compliance with statutory tax withholding
requirements for the exercise of options and vesting of restricted shares in
exchange for surrender of the Company’s shares of equal value. We received $3.2
million and $2.7 million from the exercise of employee stock options in fiscal
2009 and fiscal 2008, respectively. For fiscal 2009 and fiscal 2008, we received
$3.3 million and $7.5 million, respectively, of excess tax benefits from
share-based compensation.
Stock
Repurchase Program
The
Company instituted a stock repurchase program in June 1998. In August 2009, the
Board of Directors authorized the Company to repurchase an additional 2,000,000
shares of the Company’s common stock under this repurchase program, bringing the
total authorized shares to 11,375,000.
During
fiscal 2010, approximately 650,000 shares were repurchased in the open market
under the 1998 repurchase plan for approximately $11.6 million. During
fiscal 2009, we repurchased 295,409 shares in the open market for approximately
$6.7 million. We made no share repurchases during fiscal 2008. Shares that are
repurchased by the Company are returned to the status of authorized but
unissued.
As of May
31, 2010, 9,178,356 shares had been repurchased under the program, leaving
2,196,644 shares available for repurchase. The Company’s stock
repurchase program does not have an expiration date.
Contingencies
We record
contingent liabilities resulting from asserted and unasserted claims against us
when it is probable that a liability has been incurred and the amount of the
loss is reasonably estimable. We disclose contingent liabilities when there is a
reasonable possibility that the ultimate loss will exceed the recorded
liability. Estimating probable losses requires analysis of multiple factors, in
some cases including judgments about the potential actions of third-party
claimants and courts. Therefore, actual losses in any future period are
inherently uncertain. We are currently involved in certain legal proceedings.
(See Item 3 – Legal Proceedings for further discussion.) We believe we have
meritorious defenses to the claims and other issues asserted in such matters;
however,
there can be no assurance that such matters or any future legal matters will not
have an adverse effect on the Company or our financial
position. Contingent liabilities are described in Note 16 to the
consolidated financial statements.
28
Future
Cash Requirements and Restrictions
We expect
that cash and cash equivalents and cash flows from operations will be sufficient
to support our operations and planned capital expenditures for at least the next
12 months. We expect to continue to generate net positive cash flow. In the
longer term, we will be able to use a portion of the acquired net operating loss
tax carry-forwards from the BioArray acquisition, subject to certain conditions
and limitations, which will positively impact cash flows. We have normal
maintenance capital expenditure requirements that we plan to fund through
operating cash flow. Additionally, we internally finance the rental agreements
for our instruments and also plan to fund this activity through operating cash
flows. There are no restrictions on our subsidiaries with respect to sending
dividends, or making loans or advances to Immucor.
Contractual
Obligations and Commercial Commitments
Contractual
obligations and commercial commitments, primarily for the next five years, are
detailed in the table below:
|
Contractual
Obligations
|
Payments
Due by Period
(in
thousands)
|
|||||||||||||||||||
|
Total
|
Less
than 1 year
|
1-3
years
|
4 -
5 years
|
After
5 years
|
||||||||||||||||
|
Operating
leases
|
$ | 14,494 | $ | 3,063 | $ | 5,127 | $ | 4,138 | $ | 2,166 | ||||||||||
|
Purchase
obligations
|
17,141 | 16,958 | 126 | 57 | - | |||||||||||||||
|
Total
contractual cash obligations
|
$ | 31,635 | $ | 20,021 | $ | 5,253 | $ | 4,195 | $ | 2,166 | ||||||||||
In
addition to the obligations in the table above, approximately $8.1 million of
unrecognized tax benefits have been recorded as liabilities in accordance with
ASC 740, “Income Taxes” (“ASC 740”), and we are uncertain as to if or when such
amounts may be settled. Related to the unrecognized tax benefits not
included in the table above, we have also recorded a liability for interest
of $0.6 million.
Off-Balance
Sheet Arrangements
We have
no off-balance sheet financial arrangements as of May 31, 2010.
Critical
Accounting Policies and Estimates
General
We have
identified the policies below as critical to our business operations and the
understanding of our results of operations. The impact and any associated risks
related to these policies on our business operations are discussed throughout
Management’s Discussion and Analysis of Financial Condition and Results of
Operations where such policies affect our reported and expected financial
results. For a detailed discussion on the application of these and
other accounting policies, see Note 1 to the consolidated financial statements
in Item 8 of this Annual Report on Form 10-K. Note that our
preparation of this Annual Report on Form 10-K requires us to make estimates and
assumptions that affect the reported amounts of assets and liabilities, the
disclosure of contingent assets and liabilities at the date of our financial
statements, and the reported amounts of revenue and expenses during the
reporting period. Actual results could differ from those estimates, and certain
assumptions could prove to be incorrect. Senior management has
discussed the development and selection of critical accounting estimates and the
related Management’s Discussion and Analysis of Financial Condition and Results
of Operations disclosure with the Audit Committee of our Board of Directors. We
believe that our most critical accounting policies and estimates relate to the
following:
|
i.
|
Revenue
recognition
|
|
ii.
|
Trade
accounts receivable and allowance for doubtful
accounts
|
|
iii.
|
Inventories
|
|
iv.
|
Goodwill
|
|
v.
|
Taxation
|
|
vi.
|
Stock-based
compensation
|
29
i) Revenue Recognition
In
accordance with ASC 605, “Revenue Recognition” (“ASC 605”), we recognize
revenue when the following four basic criteria have been met: (1)
persuasive evidence of an arrangement exists; (2) delivery has occurred or
services are rendered; (3) the fee is fixed and determinable; and (4)
collectibility is reasonably assured. Should changes in conditions
cause management to determine these criteria are not met for certain future
transactions, revenue recognized for any reporting period could be adversely
affected.
|
·
|
Reagent
sales
|
Revenue
from the sale of our reagents to end users is primarily recognized upon shipment
when both title and risk of loss transfer to the customer, unless there are
specific contractual terms to the contrary. Revenue from the sale of
our reagents to distributors is recognized FOB customs clearance when both title
and risk of loss transfer to the customer.
|
·
|
Instrument
sales
|
Contracts
for the sale or rental of our instruments typically have multiple
deliverables. In such cases, we recognize revenue on the sale of
instruments in accordance with ASC 605-25. Our instrument sales contracts with
multiple deliverables include the sale or rental of an instrument (including
delivery, installation and training), the servicing of the instrument during the
first year, and, in many cases, price guarantees for reagents and consumables
purchased during the contract period. We have determined the fair
value of certain of these elements, such as training and first year service. We
do not believe it is possible to determine the fair value of price guarantees at
the time of the sale.
If the
contract contains price guarantees, which our contracts typically do, the entire
arrangement consideration is deferred and recognized over the related guarantee
period. For contracts without price guarantees, the sales price in
excess of the fair values of training and service is allocated to the instrument
itself and recognized upon shipment and completion of contractual obligations
relating to training and/or installation. The fair value of a training session
is recognized as revenue when services are provided. The fair value
of first year service is recognized over the first year of the contract. The
allocation of the total consideration, which is based on the estimated fair
value of the units of accounting, requires judgment by management.
In
revenue deferral situations, the costs related to the instruments are recognized
when the instrument is installed and accepted by the customer.
Revenue
from the sale of our instruments without multiple deliverables is generally
recognized upon shipment and completion of contractual
obligations. Revenue from rentals of our instruments is recognized
over the term of the rental agreement. Instrument service contract
revenue is recognized over the term of the service contract.
ii) Trade Accounts Receivable and
Allowance for Doubtful Accounts
Trade
receivables at May 31, 2010 and May 31, 2009, totaling $59.6 million and $57.0
million, respectively, are net of allowances for doubtful accounts of $2.1
million and $2.2 million, respectively. The allowance for doubtful accounts
represents a reserve for estimated losses resulting from the inability of our
customers to pay their debts. The collectibility of trade receivable balances is
regularly evaluated based on a combination of factors such as customer
credit-worthiness, past transaction history with the customer, current economic
industry trends and changes in customer payment patterns. If it is determined
that a customer will be unable to fully meet its financial obligation, such as
in the case of a bankruptcy filing or other material events impacting its
business, a specific allowance for doubtful accounts is recorded to reduce the
related receivable to the amount expected to be recovered.
iii)
Inventories
Inventories
are stated at the lower of cost (first-in, first-out basis) or market (net
realizable value). Cost includes material, labor and manufacturing overhead. The
Company also allocates certain production-related general and administrative
costs to inventory and incurred approximately $3.3 million, $3.0 million and
$3.9 million of such costs in fiscal 2010, 2009 and 2008, respectively. The
Company had approximately $1.2 million and $1.1 million of general and
administrative costs remaining in inventory as of May 31, 2010 and May 31, 2009,
respectively.
We use a
standard cost system as a tool to monitor production efficiency. The
standard cost system applies estimated labor and manufacturing overhead factors
to inventory based on budgeted production and efficiency levels, staffing levels
and costs of operation, based on the experience and judgment of
management. Actual costs and production levels may vary from the
standard established and such variances are charged to the consolidated
statement of income as a component of cost of sales. Since U.S.
generally accepted accounting principles require that the standard cost
approximate actual cost, periodic adjustments are made to the standard rates to
approximate actual costs. No material changes have been made to the
inventory policy during fiscal 2010, 2009 or 2008.
30
iv) Goodwill
Consistent
with ASC 350, “Intangibles – Goodwill and Other” (“ASC 350”), goodwill and
intangible assets with indefinite lives are no longer amortized but are tested
for impairment annually or more frequently if impairment indicators
arise. Intangible assets that have finite lives continue to be
amortized over their useful lives.
We
evaluate the carrying value of goodwill at the end of the third quarter of each
year and between annual evaluations if events occur or circumstances change that
would more likely than not reduce the fair value of the reporting unit below its
carrying amount. Such circumstances could include, but are not limited to: (1) a
significant adverse change in legal factors or in business climate, (2)
unanticipated competition, or (3) an adverse action or assessment by a
regulator. When evaluating whether goodwill is impaired, we compare the fair
value of the reporting unit to which the goodwill is assigned to the reporting
unit’s carrying amount, including goodwill. The fair value of the reporting unit
is estimated using primarily the income, or discounted cash flows, approach. If
the carrying amount of a reporting unit exceeds its fair value, then the amount
of the impairment loss must be measured. The impairment loss would be calculated
by comparing the implied fair value of the reporting unit’s goodwill to its
carrying amount. In calculating the implied fair value of the reporting unit’s
goodwill, the fair value of the reporting unit is allocated to all of the other
assets and liabilities of that unit based on their fair values. The excess of
the fair value of a reporting unit over the amount assigned to its other assets
and liabilities is the implied fair value of goodwill. An impairment loss would
be recognized when the carrying amount of goodwill exceeds its implied fair
value. Our evaluation of goodwill completed during the year resulted in no
impairment charges.
v)
Income Taxes
Our
income tax policy records the estimated future tax effects of temporary
differences between the tax bases of assets and liabilities and amounts reported
in the accompanying consolidated balance sheets, as well as operating loss and
tax credit carry-forwards. The value of our deferred tax assets assumes that we
will be able to generate sufficient future taxable income in certain tax
jurisdictions, based on estimates and assumptions. If these estimates and
related assumptions change in the future, we may be required to record
additional valuation allowances against our deferred tax assets resulting in
additional income tax expense in our consolidated statements of income. In
assessing the realizability of deferred tax assets, we consider whether it is
more likely than not that some portion or all of the deferred tax assets will
not be realized, and we consider the scheduled reversal of deferred tax
liabilities, projected future taxable income, carry-back opportunities, and
tax-planning strategies in making this assessment. We assess the need
for additional valuation allowances quarterly. See Note 12 to the
consolidated financial statements.
The
calculation of income tax liabilities involves significant judgment in
estimating the impact of uncertainties in the application of complex tax laws.
Although an update to ASC 740, “Income Taxes” (“ASC 740”), which we adopted at
the beginning of fiscal 2008, provides further clarification on the accounting
for uncertainty in income taxes recognized in the financial statements, the new
threshold and measurement attribute prescribed by the FASB will continue to
require significant judgment by management. Resolution of these uncertainties in
a manner inconsistent with our expectations could have a material impact on our
results of operations.
vi)
Stock-based Employee Compensation
We
adopted the provisions of ASC 718, “Compensation – Stock Compensation” (“ASC
718”), on June 1, 2006, using the modified prospective transition method, which
requires that (i) compensation costs be recorded as earned for all unvested
stock options outstanding at the beginning of the first fiscal year of adoption
based on the grant date fair value, and (ii) compensation costs for all
share-based payments granted or modified subsequent to the adoption be recorded,
based on the grant date fair value estimated in accordance with the provisions
of ASC 718. On adoption, we elected to attribute the value of
share-based compensation to expense using the straight-line method, which was
the method previously used for disclosing our required pro forma
information.
We
elected to estimate the fair value of our share-based payment awards using the
Black-Scholes option-pricing model (the “Black-Scholes model”), which was
previously used for disclosing our pro forma information. The Black-Scholes
model was developed for use in estimating the fair value of traded options that
have no vesting restrictions and are fully transferable. The
Black-Scholes model requires the input of assumptions regarding the expectations
of future volatility, term of the grant until exercise, dividend yield and risk
free interest rate. Our stock options have characteristics significantly
different from those of traded options, and changes in the assumptions can
materially affect the fair value estimates.
We have
calculated our additional paid in capital pool (“APIC pool”) based on the actual
income tax benefits received from exercises of stock options granted after the
effective date of ASC 718 using the long method. The APIC pool is available to
absorb any tax deficiencies subsequent to the adoption of ASC 718.
The
adoption of ASC 718’s fair value method negatively impacts our results of
operations. The future impact of adoption will depend on the level of
share-based payments granted in the future, expected volatilities and expected
useful lives, among other factors, present at the grant date.
31
Recently
Issued Accounting Standards
Adopted
by the Company in fiscal 2010
In June
2009, the Financial Accounting Standards Board (“FASB”) issued SFAS No. 168 “The
FASB Accounting Standards Codification™ and the Hierarchy of Generally Accepted
Accounting Principles – A Replacement of FASB Statement No. 162” (“SFAS 168”).
SFAS 168 establishes the FASB
Accounting Standards CodificationTM
(“ASC”) as the single source of authoritative U.S. generally accepted
accounting principles (“U.S. GAAP”) recognized by the FASB to be applied by
nongovernmental entities. Rules and interpretive releases of the SEC under
authority of federal securities laws are also sources of authoritative U.S. GAAP
for SEC registrants. SFAS 168 and the Codification are effective for financial
statements issued for interim and annual periods ending after September 15,
2009, which corresponds to the Company’s second quarter of fiscal 2010. Upon
adoption, the Codification superseded all existing non-SEC accounting and
reporting standards. All other non-grandfathered non-SEC accounting literature
not included in the Codification became non-authoritative. Following SFAS 168,
the FASB will not issue new standards in the form of Statements, FASB Staff
Positions, or Emerging Issues Task Force Abstracts. Instead, the FASB will issue
Accounting Standards Updates (“ASU”), which will serve only to: (a) update the Codification;
(b) provide background
information about the guidance; and (c) provide the bases for
conclusions on the change(s) in the Codification. The adoption of SFAS 168
during the second quarter of fiscal 2010 did not have a material impact on the
Company’s consolidated financial statements.
In
September 2006, the FASB issued an update to ASC 820, “Fair Value Measurements
and Disclosures” (“ASC 820”). The update provides guidance for using fair value
to measure assets and liabilities, and also responds to investors' requests for
expanded information about the extent to which companies measure assets and
liabilities at fair value, the information used to measure fair value and the
effect of fair value measurements on earnings. This update applies
whenever other standards require (or permit) assets or liabilities to be
measured at fair value. The standard does not expand the use of fair value in
any new circumstances. For financial assets and liabilities, this update is
effective for fiscal years beginning after November 15, 2007. The Company
adopted the provisions for the financial assets and liabilities in fiscal 2009
and adoption did not have a material impact on the Company’s results of
operations or financial position. For nonfinancial assets and
liabilities, this update is effective for fiscal years beginning after
November 15, 2008. The adoption of provisions of the update to ASC 820 for
nonfinancial assets and liabilities during the first quarter of fiscal 2010 did
not have a material impact on the Company’s results of operations or financial
position.
In
December 2007, the FASB issued an update to ASC 805, “Business Combinations”
(“ASC 805”). This update significantly changes the financial accounting and
reporting of business combination transactions. The update also establishes
principles for how an acquirer recognizes and measures the identifiable assets
acquired, liabilities assumed, and any noncontrolling interest in the acquiree;
recognizes and measures the goodwill acquired in the business combination or a
gain from a bargain purchase; and determines what information to disclose to
enable users of the financial statements to evaluate the nature and financial
effects of the business combination. The update to ASC 805 is effective for
acquisition dates on or after the beginning of an entity’s first year that
begins after December 15, 2008. The adoption of the update to ASC 805
during the first quarter of fiscal 2010 did not have a material impact on the
Company’s consolidated financial statements.
In
December 2007, the FASB issued an update to ASC 810, “Consolidation” (“ASC
810”). This update establishes accounting and reporting standards for the
non-controlling interest in a subsidiary and for the deconsolidation of a
subsidiary. This update is effective for fiscal years beginning on or after
December 15, 2008. The adoption of the update to ASC 810 during the first
quarter of fiscal 2010 did not have a material impact on the Company’s
consolidated financial statements.
In
April 2008, the FASB issued an update to ASC 350, “Intangibles – Goodwill
and Other” (“ASC 350”), which amends the factors an entity must consider when
developing renewal or extension assumptions used in determining the useful life
of a recognized intangible asset. It also requires entities to provide certain
disclosures about its assumptions. This update is effective for financial
statements issued for fiscal years beginning after December 15, 2008 and
interim periods within those fiscal years. The adoption of the update to ASC
350 during the first quarter of fiscal 2010 did not have a material impact
on the Company’s consolidated financial statements.
In June
2008, the FASB issued an update to ASC 260, “Earnings Per Share” (“ASC
260”). This update states that unvested share-based payment awards
that contain rights to receive nonforfeitable dividends (whether paid or unpaid)
are participating securities, and should be included in the two-class method of
computing EPS. The update is effective for fiscal years beginning after December
15, 2008, and interim periods within those years. The adoption of ASC
260-40-45-61A during the first quarter of fiscal 2010 did not have a material
impact on the Company’s consolidated financial statements.
32
In May
2009, the FASB established ASC 855, “Subsequent Events” (“ASC
855”). ASC 855 establishes general standards of accounting for and
disclosure of events that occur after the balance sheet date but before
financial statements are issued. The effective date of ASC 855 is
interim or annual financial periods ending after June 15, 2009. This
codification topic does not apply to subsequent events or transactions that are
within the scope of other applicable generally accepted accounting principles
that provide different guidance on the accounting treatment for subsequent
events or transactions. ASC 855 applies to both interim financial statements and
annual financial statements and should not result in significant changes in the
subsequent events that are reported. ASC 855 introduces the concept of financial
statements being available to be issued. It requires the disclosure of the date
through which a Company has evaluated subsequent events and the basis for that
date, whether that represents the date the financial statements were issued or
were available to be issued. ASC 855 should alert all users of financial
statements that an entity has not evaluated subsequent events after that date in
the set of financial statements being presented. The adoption of ASC 855 during
the first quarter of fiscal 2010 did not have a material impact on the Company’s
consolidated financial statements. Topic 855 was updated by FASB ASU
2010-09. Further discussion of related accounting treatment is noted
below.
In August
2009, the FASB issued Accounting Standard Update (“ASU”) 2009-05, “Measuring
Liabilities at Fair Value” (“ASU 2009-05”), which is an amendment of ASC 820,
“Fair Value Measurements and Disclosures” (“ASC 820”). ASU 2009-05 provides
clarification for circumstances where a quoted price in an active market for the
identical liability is not available. In that situation, entities are
required to measure fair value in one or more of the following
techniques:
|
1)
|
A
valuation technique that uses either a) the quoted price of the identical
liability when traded as an asset, or b) the quoted prices for similar
liabilities or similar liabilities when traded as an
asset.
|
|
2)
|
Another
valuation technique that is consistent with the principles of ASC 820,
such as an income approach or a market
approach.
|
ASU
2009-05 also clarifies that a reporting entity is not required to adjust the
fair value of a liability to include inputs relating to the existence of
transfer restrictions on that liability. The provisions of this
update are effective for the first reporting period (including interim periods)
beginning after issuance. The adoptions of the provisions of this
update to ASC 820 during the second quarter of fiscal 2010 did not have a
material impact on the Company’s consolidated financial statements.
In
February 2010, the FASB issued ASU 2010-09, effective immediately, which amended
ASC 855. The amendments were made to address concerns about conflicts with SEC
guidance and other practice issues. Among the provisions of the amendment, the
FASB defined a new type of entity, termed an “SEC filer,” which is an entity
required to file or furnish its financial statements with the SEC. While an SEC
filer is still required by GAAP to evaluate subsequent events through the date
its financial statements are issued, it is no longer required to disclose in the
financial statements that it has done so or the date through which subsequent
events have been evaluated. The adoption of the provisions of ASC 2010-09 during
the third quarter of fiscal 2010 did not have a material impact on the Company’s
consolidated financial statements.
Not
yet adopted by the Company
In June
2009, the FASB issued an update to ASC 810, “Consolidation” (“ASC 810”). This
update changes how a reporting entity determines when an entity that is
insufficiently capitalized or is not controlled through voting (or similar
rights) should be consolidated. The determination of whether a reporting entity
is required to consolidate another entity is based on, among other things, the
other entity’s purpose and design and the reporting entity’s ability to direct
the activities of the other entity that most significantly impact the other
entity’s economic performance. This update will require a reporting entity
to provide additional disclosures about its involvement with variable interest
entities and any significant changes in risk exposure due to that involvement. A
reporting entity will be required to disclose how its involvement with a
variable interest entity affects the reporting entity’s financial statements.
The update will be effective at the start of a reporting entity’s first fiscal
year beginning after November 15, 2009, which corresponds to the Company’s first
quarter of fiscal 2011. Early application is not permitted. The Company
does not expect the adoption of this update to ASC 810 to have a material impact
on its financial statements.
In
October 2009, the FASB issued ASU 2009-13, “Multiple Deliverables Revenue
Arrangements” (“ASU 2009-13”), which is an amendment of ASC 605-25, “Revenue
Recognition: Multiple Element Arrangements.” This update addresses
the accounting for multiple-deliverable arrangements to allow the vendor to
account for deliverables separately instead of as one combined unit by amending
the criteria for separating consideration in multiple-deliverable
arrangements. This guidance establishes a selling price hierarchy for
determining the selling price of a deliverable, which is based on a)
vendor-specific objective evidence (VSOE), b) third-party evidence or c) best
estimate of selling price. The residual method of allocation has been
eliminated and arrangement consideration is now required to be allocated to all
deliverables at the inception of the arrangement using the selling price
method. Additionally, expanded disclosures will be required relating
to multiple deliverable revenue arrangements. This update will be
effective for fiscal years beginning on or after June 15, 2010, which
corresponds to the Company’s first quarter of fiscal 2012. Early
adoption is permitted. The Company is currently evaluating the impact
of the adoption of this update to ASC 605-25 on its financial
statements.
In
December 2009, the FASB issued ASU 2009-16, “Accounting for Transfers of
Financial Assets” (“ASU 2009-16”), which is an amendment of ASC 860, “Transfers
and Servicing.” This update will require more information about the
transfer of financial assets. More specifically, ASU 2009-16
eliminates the concept of a “special purpose entity”, changes the requirements
for derecognizing financial assets, and enhances the information reported to
users of financial statements. This update will be effective for
fiscal years beginning on or after November 15, 2009, which corresponds to the
Company’s first quarter of fiscal 2011. Early application is not
permitted. The Company does not expect the adoption of this update to
ASC 860 to have a material impact on its financial statements.
33
In April
2010, the FASB issued ASU 2010-13, “Effect of Denominating the Exercise Price of
a Share-Based Payment Award in the Currency of the Market in Which the
Underlying Equity Security Trades” (“ASU 2010-13”), which is an amendment of ASC
718, “Compensation—Stock Compensation. This update clarifies that an
employee share-based payment award with an exercise price denominated in the
currency of a market in which a substantial portion of the entity’s equity
securities trades should not be considered to contain a condition that is not a
market, performance, or service condition. Therefore, an entity would not
classify such an award as a liability if it otherwise qualifies as equity. This
update will be effective for fiscal years and interim periods beginning on or
after December 15, 2010, which corresponds to the Company’s fourth quarter of
fiscal 2011. Early application is permitted. The Company
currently accounts for the above mentioned share-based payment awards as equity,
therefore the adoption of ASU 2010-13 will not have a material impact on its
financial statements.
Item
7A. — Quantitative and Qualitative Disclosures about Market Risk.
We are
exposed to market risks for foreign currency exchange rates principally with the
U.S. Dollar versus the Euro, Canadian Dollar, British Pound and Japanese Yen.
Our financial instruments that can be affected by foreign currency fluctuations
and exchange risks consist primarily of cash and cash equivalents and trade
receivables denominated in currencies other than the U.S. dollar. We
attempt to manage our exposure primarily by balancing assets and liabilities and
maintaining cash positions in foreign currencies only at levels necessary for
operating purposes. It has not been our practice to actively hedge our foreign
subsidiaries’ assets or liabilities denominated in foreign currencies. To manage
these risks, we regularly evaluate our exposure and, if warranted, may enter
into various derivative transactions when appropriate. We do not hold or issue
derivative instruments for trading or other speculative purposes.
As
part of accumulated other comprehensive income in shareholders’ equity, we
recorded foreign currency translation losses of $5.2 million and $4.0 million in
fiscal 2010 and fiscal 2009, respectively, and gains of $8.6 million in fiscal
2008. Additionally, we are exposed to interest rate risks related to
cash and cash equivalents. It has been our practice to hold cash and cash
equivalents in deposits that can be redeemed on demand and in investments with
an original maturity of three months or less. The interest income earned from
these deposits and investments is impacted by interest rate
fluctuations.
Item
8. — Financial Statements and Supplementary Data.
|
INDEX
TO CONSOLIDATED FINANCIAL STATEMENTS
|
Page
|
|
|
Reports
of Grant Thornton, LLP, Independent Registered Public Accounting
Firm
|
35
|
|
|
Consolidated
Balance Sheets, May 31, 2010 and 2009
|
37
|
|
|
Consolidated
Statements of Income for the Years Ended May 31, 2010, 2009 and
2008
|
38
|
|
|
Consolidated
Statements of Shareholders’ Equity and Comprehensive Income for the Years
Ended May 31, 2010, 2009 and 2008
|
39
|
|
|
Consolidated
Statements of Cash Flows for the Years Ended May 31, 2010, 2009 and
2008
|
40
|
|
|
Notes
to Consolidated Financial Statements
|
41
|
|
|
Consolidated
Financial Statement Schedule
|
64
|
34
REPORT
OF INDEPENDENT REGISTERED PUBLIC ACCOUNTING FIRM ON CONSOLIDATED FINANCIAL
STATEMENTS
Board of
Directors and Shareholders
Immucor,
Inc.
We have
audited the accompanying consolidated balance sheets of Immucor, Inc. (a Georgia
corporation) and subsidiaries (the “Company”) as of May 31, 2010 and 2009, and
the related consolidated statements of income, shareholders’ equity and
comprehensive income, and cash flows for each of the three years in the period
ended May 31, 2010. Our audits of the basic consolidated financial statements
included the financial statement schedule listed in the index appearing under
Item 8. These financial statements and the financial statement schedule are the
responsibility of the Company’s management. Our responsibility is to express an
opinion on these financial statements and financial statement schedule based on
our audits.
We
conducted our audits in accordance with the standards of the Public Company
Accounting Oversight Board (United States). Those standards require that we plan
and perform the audits to obtain reasonable assurance about whether the
financial statements are free of material misstatement. An audit includes
examining, on a test basis, evidence supporting the amounts and disclosures in
the financial statements. An audit also includes assessing the accounting
principles used and significant estimates made by management, as well as
evaluating the overall financial statement presentation. We believe that our
audits provide a reasonable basis for our opinion.
In our
opinion, the consolidated financial statements referred to above present fairly,
in all material respects, the financial position of the Company as of May 31,
2010 and 2009, and the consolidated results of its operations and its cash flows
for each of the three years in the period ended May 31, 2010 in conformity with
accounting principles generally accepted in the United States of
America. Also in our opinion, the related financial statement
schedule, when considered in relation to the basic consolidated financial
statements taken as a whole, presents fairly, in all material respects, the
information set forth therein.
As
described in Note 1 to the consolidated financial statements, the Company
adopted new accounting guidance related to the accounting for uncertainty in
income tax reporting effective June 1, 2007.
We also
have audited, in accordance with the standards of the Public Company Accounting
Oversight Board (United States), the Company’s internal control over financial
reporting as of May 31, 2010, based on criteria established in Internal Control—Integrated
Framework issued by the Committee of Sponsoring Organizations of the
Treadway Commission (COSO) and our report dated July 23, 2010 expressed an
unqualified opinion thereon.
/s/ Grant
Thornton LLP
Atlanta,
Georgia
July 23,
2010
35
REPORT
OF INDEPENDENT REGISTERED PUBLIC ACCOUNTING FIRM ON INTERNAL CONTROL OVER
FINANCIAL REPORTING
Board of
Directors and Shareholders
Immucor,
Inc.
We have
audited Immucor, Inc. (a Georgia corporation) and subsidiaries’ (the
"Company") internal control over financial reporting as of May 31, 2010, based
on criteria established in Internal Control—Integrated
Framework issued by the Committee of Sponsoring Organizations of the
Treadway Commission (COSO). The Company's management is responsible for
maintaining effective internal control over financial reporting and for its
assessment of the effectiveness of internal control over financial reporting,
included in Management's Report on Internal Controls Over Financial Reporting
appearing under Item 9A of this Annual Report on Form 10-K. Our responsibility
is to express an opinion on Immucor, Inc.'s internal control over financial
reporting based on our audit.
We
conducted our audit in accordance with the standards of the Public Company
Accounting Oversight Board (United States). Those standards require that we plan
and perform the audit to obtain reasonable assurance about whether effective
internal control over financial reporting was maintained in all material
respects. Our audit included obtaining an understanding of internal control over
financial reporting, assessing the risk that a material weakness exists, testing
and evaluating the design and operating effectiveness of internal control based
on the assessed risk, and performing such other procedures as we considered
necessary in the circumstances. We believe that our audit provides a reasonable
basis for our opinion.
A
company's internal control over financial reporting is a process designed to
provide reasonable assurance regarding the reliability of financial reporting
and the preparation of financial statements for external purposes in accordance
with generally accepted accounting principles. A company's internal control over
financial reporting includes those policies and procedures that (1) pertain
to the maintenance of records that, in reasonable detail, accurately and fairly
reflect the transactions and dispositions of the assets of the company;
(2) provide reasonable assurance that transactions are recorded as
necessary to permit preparation of financial statements in accordance with
generally accepted accounting principles, and that receipts and expenditures of
the company are being made only in accordance with authorizations of management
and directors of the company; and (3) provide reasonable assurance
regarding prevention or timely detection of unauthorized acquisition, use, or
disposition of the company's assets that could have a material effect on the
financial statements.
Because
of its inherent limitations, internal control over financial reporting may not
prevent or detect misstatements. Also, projections of any evaluation of
effectiveness to future periods are subject to the risk that controls may become
inadequate because of changes in conditions, or that the degree of compliance
with the policies or procedures may deteriorate.
In our
opinion, the Company maintained, in all material respects, effective internal
control over financial reporting as of May 31, 2010, based on criteria
established in Internal
Control—Integrated Framework issued by COSO.
We also
have audited, in accordance with the standards of the Public Company Accounting
Oversight Board (United States), the consolidated balance sheets of the Company
as of May 31, 2010 and 2009, and the related consolidated statements of income,
shareholders’ equity and comprehensive income, and cash flows for each of the
three years in the period ended May 31, 2010 and our report dated July 23, 2010
expressed an unqualified opinion on those financial statements.
/s/ GRANT
THORNTON LLP
Atlanta,
Georgia
July 23,
2010
36
ITEM 1. Financial Statements
IMMUCOR, INC. AND SUBSIDIARIES
CONSOLIDATED BALANCE SHEETS
(Amounts
in thousands, except share data)
|
May
31, 2010
|
May
31, 2009
|
|||||||
|
ASSETS
|
||||||||
|
CURRENT
ASSETS:
|
||||||||
|
Cash
and cash equivalents
|
$ | 202,649 | $ | 136,461 | ||||
|
Trade
accounts receivable, net of allowance for doubtful accounts
of
$2,122
and $2,179 at May 31, 2010 and 2009, respectively
|
59,578 | 57,017 | ||||||
|
Inventories
|
35,730 | 38,256 | ||||||
|
Deferred
income tax assets, current portion
|
14,807 | 7,979 | ||||||
|
Prepaid
expenses and other current assets
|
4,832 | 5,137 | ||||||
|
Total
current assets
|
317,596 | 244,850 | ||||||
|
PROPERTY
AND EQUIPMENT, Net
|
49,169 | 43,461 | ||||||
|
GOODWILL
|
94,336 | 97,255 | ||||||
|
INTANGIBLE
ASSETS, Net
|
57,628 | 61,355 | ||||||
|
DEFERRED
INCOME TAX ASSETS
|
540 | 3,638 | ||||||
|
OTHER
ASSETS
|
565 | 781 | ||||||
|
Total
assets
|
$ | 519,834 | $ | 451,340 | ||||
|
LIABILITIES
AND SHAREHOLDERS' EQUITY
|
||||||||
|
CURRENT
LIABILITIES:
|
||||||||
|
Accounts
payable
|
$ | 7,973 | $ | 9,344 | ||||
|
Accrued
expenses and other current liabilities
|
17,378 | 20,253 | ||||||
|
Income
taxes payable
|
12,312 | 11,469 | ||||||
|
Deferred
revenue, current portion
|
8,994 | 11,222 | ||||||
|
Total
current liabilities
|
46,657 | 52,288 | ||||||
|
DEFERRED
REVENUE
|
7,687 | 10,871 | ||||||
|
DEFERRED
INCOME TAX LIABILITIES
|
7,368 | 1,272 | ||||||
|
OTHER
LONG-TERM LIABILITIES
|
1,999 | 2,331 | ||||||
|
Total
liabilities
|
63,711 | 66,762 | ||||||
|
COMMITMENTS
AND CONTINGENCIES (Note 16)
|
- | - | ||||||
|
SHAREHOLDERS'
EQUITY:
|
||||||||
|
Common
stock, $0.10 par value; authorized 120,000,000 shares, issued and
outstanding 69,912,449
and 70,456,522 shares at May 31, 2010 and May 31, 2009,
respectively |
6,991 | 7,046 | ||||||
|
Additional
paid-in capital
|
36,256 | 42,012 | ||||||
|
Retained
earnings
|
409,825 | 327,242 | ||||||
|
Accumulated
other comprehensive income
|
3,051 | 8,278 | ||||||
|
Total
shareholders' equity
|
456,123 | 384,578 | ||||||
|
Total
liabilities and shareholders' equity
|
$ | 519,834 | $ | 451,340 | ||||
The accompanying notes are an integral part of these Consolidated
Financial Statements.
37
IMMUCOR, INC. AND SUBSIDIARIES
CONSOLIDATED STATEMENTS OF INCOME
(Amounts
in thousands, except share data)
|
For
the year ended May 31,
|
||||||||||||
|
2010
|
2009
(1)
|
2008
(1)
|
||||||||||
|
NET
SALES
|
$ | 329,073 | $ | 300,547 | $ | 261,199 | ||||||
|
COST
OF SALES
(exclusive
of amortization shown separately below)
|
95,349 | 84,536 | 75,710 | |||||||||
|
GROSS
PROFIT
|
233,724 | 216,011 | 185,489 | |||||||||
|
OPERATING
EXPENSES
|
||||||||||||
|
Research
and development
|
15,437 | 10,698 | 6,454 | |||||||||
|
Selling
and marketing
|
36,995 | 38,315 | 32,510 | |||||||||
|
Distribution
|
14,831 | 13,708 | 11,394 | |||||||||
|
General
and administrative
|
36,841 | 32,593 | 26,385 | |||||||||
|
Restructuring
expenses
|
- | - | 646 | |||||||||
|
Amortization
expense
|
4,278 | 3,739 | 357 | |||||||||
|
Total
operating expenses
|
108,382 | 99,053 | 77,746 | |||||||||
|
INCOME
FROM OPERATIONS
|
125,342 | 116,958 | 107,743 | |||||||||
|
NON-OPERATING
INCOME (EXPENSE)
|
||||||||||||
|
Interest
income
|
454 | 1,957 | 4,263 | |||||||||
|
Interest
expense
|
(33 | ) | (250 | ) | (371 | ) | ||||||
|
Other,
net
|
(551 | ) | (1,684 | ) | 33 | |||||||
|
Total
non-operating income (expense)
|
(130 | ) | 23 | 3,925 | ||||||||
|
INCOME
BEFORE INCOME TAXES
|
125,212 | 116,981 | 111,668 | |||||||||
|
PROVISION
FOR INCOME TAXES
|
42,629 | 40,798 | 40,214 | |||||||||
|
NET
INCOME
|
$ | 82,583 | $ | 76,183 | $ | 71,454 | ||||||
|
Earnings
per share:
|
||||||||||||
|
Per
common share - basic
|
$ | 1.18 | $ | 1.08 | $ | 1.02 | ||||||
|
Per
common share - diluted
|
$ | 1.17 | $ | 1.07 | $ | 1.00 | ||||||
The accompanying notes are an integral part of these Consolidated
Financial Statements.
(1) Certain prior year operating expenses have been reclassified
to conform to current year presentation.
38
IMMUCOR, INC. AND SUBSIDIARIES
CONSOLIDATED STATEMENTS OF SHAREHOLDERS' EQUITY AND
COMPREHENSIVE INCOME
(Amounts
in thousands)
|
Accumulated
|
|||||||||||||||||||||||
|
Additional
|
Other
|
Total
|
|||||||||||||||||||||
|
Common
Stock
|
Paid-In
|
Retained
|
Comprehensive
|
Shareholders’
|
|||||||||||||||||||
|
Shares
|
Amount
|
Capital
|
Earnings
|
Income
*
|
Equity
|
||||||||||||||||||
|
BALANCE,
MAY 31, 2007
|
69,087 | $ | 6,909 | $ | 29,076 | $ | 179,768 | $ | 3,695 | $ | 219,448 | ||||||||||||
|
Adjustment
on adoption of FIN 48
|
- | - | - | (163 | ) | - | (163 | ) | |||||||||||||||
|
BALANCE,
JUNE 1, 2007, adjusted
|
69,087 | $ | 6,909 | $ | 29,076 | $ | 179,605 | $ | 3,695 | $ | 219,285 | ||||||||||||
|
Shares
issued under employee stock plan
|
1,274 | 127 | 3,056 | - | - | 3,183 | |||||||||||||||||
|
Stock-based
compensation expense
|
- | - | 3,678 | - | - | 3,678 | |||||||||||||||||
|
Stock
repurchases and retirements
|
(225 | ) | (22 | ) | (6,024 | ) | - | - | (6,046 | ) | |||||||||||||
|
Tax
benefits related to stock-based compensation
|
- | - | 7,539 | - | - | 7,539 | |||||||||||||||||
|
Comprehensive
income (net of taxes):
|
|||||||||||||||||||||||
|
Foreign
currency translation adjustments
|
- | - | - | - | 8,603 | 8,603 | |||||||||||||||||
|
Net
income
|
- | - | - | 71,454 | - | 71,454 | |||||||||||||||||
|
Total
comprehensive income
|
80,057 | ||||||||||||||||||||||
|
BALANCE,
MAY 31, 2008
|
70,136 | $ | 7,014 | $ | 37,325 | $ | 251,059 | $ | 12,298 | $ | 307,696 | ||||||||||||
|
Shares
issued under employee stock plan
|
669 | 67 | 3,632 | - | - | 3,699 | |||||||||||||||||
|
Stock-based
compensation expense
|
- | - | 5,904 | - | - | 5,904 | |||||||||||||||||
|
Stock
repurchases and retirements
|
(349 | ) | (35 | ) | (8,102 | ) | - | - | (8,137 | ) | |||||||||||||
|
Tax
benefits related to stock-based compensation
|
- | - | 3,253 | - | - | 3,253 | |||||||||||||||||
|
Comprehensive
income (net of taxes):
|
|||||||||||||||||||||||
|
Foreign
currency translation adjustments
|
- | - | - | - | (4,020 | ) | (4,020 | ) | |||||||||||||||
|
Net
income
|
- | - | - | 76,183 | - | 76,183 | |||||||||||||||||
|
Total
comprehensive income
|
72,163 | ||||||||||||||||||||||
|
BALANCE,
MAY 31, 2009
|
70,456 | $ | 7,046 | $ | 42,012 | $ | 327,242 | $ | 8,278 | $ | 384,578 | ||||||||||||
|
Shares
issued under employee stock plan
|
125 | 12 | 324 | - | - | 336 | |||||||||||||||||
|
Stock-based
compensation expense
|
- | - | 5,946 | - | - | 5,946 | |||||||||||||||||
|
Stock
repurchases and retirements
|
(669 | ) | (67 | ) | (11,843 | ) | - | - | (11,910 | ) | |||||||||||||
|
Tax
benefits related to stock-based compensation
|
- | - | (183 | ) | - | - | (183 | ) | |||||||||||||||
|
Comprehensive
income (net of taxes):
|
|||||||||||||||||||||||
|
Foreign
currency translation adjustments
|
- | - | - | - | (5,227 | ) | (5,227 | ) | |||||||||||||||
|
Net
income
|
- | - | - | 82,583 | - | 82,583 | |||||||||||||||||
|
Total
comprehensive income
|
77,356 | ||||||||||||||||||||||
|
BALANCE,
MAY 31, 2010
|
69,912 | $ | 6,991 | $ | 36,256 | $ | 409,825 | $ | 3,051 | $ | 456,123 | ||||||||||||
*Accumulated
Other Comprehensive Income balance primarily consists of foreign currency
translation adjustments and has no tax effect.
The
accompanying notes are an integral part of these Consolidated Financial
Statements.
39
IMMUCOR, INC. AND SUBSIDIARIES
CONSOLIDATED STATEMENTS OF CASH FLOWS
(Amounts
in thousands)
|
For
the year ended May 31,
|
||||||||||||
|
2010
|
2009
|
2008
|
||||||||||
|
OPERATING
ACTIVITIES:
|
||||||||||||
|
Net
income
|
$ | 82,583 | $ | 76,183 | $ | 71,454 | ||||||
|
Adjustments
to reconcile net income to net cash provided by operating
activities:
|
||||||||||||
|
Depreciation
and amortization
|
16,569 | 13,306 | 8,376 | |||||||||
|
Accretion
of acquisition liabilities
|
- | - | 206 | |||||||||
|
Loss
on retirement of fixed assets
|
538 | 352 | 221 | |||||||||
|
Gain
from sale of Houston property
|
- | - | (1,654 | ) | ||||||||
|
Provision
for doubtful accounts
|
361 | 848 | 423 | |||||||||
|
Share-based
compensation expense
|
5,946 | 5,904 | 3,678 | |||||||||
|
Deferred
income taxes
|
4,994 | 5 | (1,751 | ) | ||||||||
|
Excess
tax (benefits) shortfall from share-based compensation
|
183 | (3,253 | ) | (7,539 | ) | |||||||
|
Changes
in operating assets and liabilities:
|
||||||||||||
|
Accounts
receivable, trade
|
(6,386 | ) | (6,310 | ) | (1,799 | ) | ||||||
|
Income
taxes
|
1,037 | 7,796 | 2,361 | |||||||||
|
Inventories
|
(12,551 | ) | (4,647 | ) | (1,473 | ) | ||||||
|
Other
assets
|
(102 | ) | (7,450 | ) | (840 | ) | ||||||
|
Accounts
payable
|
(1,060 | ) | 796 | (936 | ) | |||||||
|
Deferred
revenue
|
(5,258 | ) | (2,247 | ) | 4,224 | |||||||
|
Accrued
expenses and other liabilities
|
(2,103 | ) | (1,461 | ) | 154 | |||||||
|
Cash
provided by operating activities
|
84,751 | 79,822 | 75,105 | |||||||||
|
INVESTING
ACTIVITIES:
|
||||||||||||
|
Purchases
of property and equipment
|
(6,304 | ) | (8,602 | ) | (11,573 | ) | ||||||
|
Proceeds
from sale of property and equipment
|
- | - | 2,003 | |||||||||
|
Acquisition
of businesses, net of cash acquired
|
- | (107,954 | ) | - | ||||||||
|
Deposit
paid to acquire net assets of a company
|
- | - | (4,432 | ) | ||||||||
|
Payment
for acquired distribution rights
|
- | - | (969 | ) | ||||||||
|
Payments
for capitalized acquisition costs
|
- | - | (722 | ) | ||||||||
|
Cash
used in investing activities
|
(6,304 | ) | (116,556 | ) | (15,693 | ) | ||||||
|
FINANCING
ACTIVITIES:
|
||||||||||||
|
Repayments
of long-term debt and capital leases
|
- | (206 | ) | (4,652 | ) | |||||||
|
Repurchase
of common stock
|
(11,910 | ) | (7,621 | ) | (5,549 | ) | ||||||
|
Proceeds
from exercise of stock options
|
336 | 3,178 | 2,734 | |||||||||
|
Excess
tax (shortfall) benefits from share-based compensation
|
(183 | ) | 3,253 | 7,539 | ||||||||
|
Cash
(used in) provided by financing activities
|
(11,757 | ) | (1,396 | ) | 72 | |||||||
|
EFFECT
OF EXCHANGE RATES ON CASH AND CASH EQUIVALENTS
|
(502 | ) | (465 | ) | 2,021 | |||||||
|
INCREASE
(DECREASE) IN CASH AND CASH EQUIVALENTS
|
66,188 | (38,595 | ) | 61,505 | ||||||||
|
CASH
AND CASH EQUIVALENTS AT BEGINNING OF YEAR
|
136,461 | 175,056 | 113,551 | |||||||||
|
CASH
AND CASH EQUIVALENTS AT END OF YEAR
|
$ | 202,649 | $ | 136,461 | $ | 175,056 | ||||||
|
SUPPLEMENTAL
INFORMATION:
|
||||||||||||
|
Tax
paid
|
$ | 36,295 | $ | 32,528 | $ | 39,594 | ||||||
|
Interest
paid
|
$ | - | $ | 36 | $ | 138 | ||||||
|
NON-CASH
INVESTING AND FINANCING ACTIVITIES:
|
||||||||||||
|
Shares
surrendered for amounts due on stock options exercised
|
$ | - | $ | 516 | $ | 497 | ||||||
|
Movement
from inventory to property and equipment for instruments
placed on rental agreements
|
$ | 13,733 | $ | 6,707 | $ | 1,993 | ||||||
40
IMMUCOR,
INC. AND SUBSIDIARIES
NOTES
TO FINANCIAL STATEMENTS
|
1.
|
NATURE
OF BUSINESS AND SUMMARY OF SIGNIFICANT ACCOUNTING
POLICIES
|
Nature of Business – Founded
in 1982, Immucor, Inc., a Georgia corporation (“Immucor” or the “Company”),
develops, manufactures and sells a complete line of reagents and automated
systems used primarily by hospitals, reference laboratories and donor centers in
a number of tests performed to detect and identify certain properties of the
cell and serum components of human blood used for blood
transfusion. The Company operates facilities in the U.S., Canada,
Western Europe and Japan.
Consolidation Policy – The
consolidated financial statements include the accounts of the Company and all
its subsidiaries. All significant inter-company balances and
transactions have been eliminated in consolidation.
Use of Estimates – The
preparation of financial statements in conformity with generally accepted
accounting principles in the U.S. requires management to make estimates and
assumptions that affect the amounts reported in the financial statements and
accompanying notes. Actual results could differ from those
estimates.
Share-Based Compensation –
The Company records share-based compensation expense in accordance with FASB Accounting Standard
Codification™ (“ASC”) 718, “Compensation – Stock Compensation” (“ASC
718”). The Company values its share-based payment awards using the
Black-Scholes option-pricing model based on grant date fair value
estimated. The expense for each share-based payment award is expensed
over the vesting period of the award using the straight-line method. See Note 11
of the notes to the consolidated financial statements for a detailed discussion
of share-based compensation.
The
Company has calculated its additional paid in capital pool (“APIC pool”) based
on the actual income tax benefits received from exercises of stock options
granted after the effective date of ASC 718 using the long method. The APIC pool
is available to absorb any tax deficiencies subsequent to the adoption of ASC
718.
Concentration of Credit Risk
– Financial instruments that potentially subject the Company to concentrations
of credit risk consist primarily of cash and cash equivalents and accounts
receivable. In order to mitigate the concentration of credit risk, the Company
places its cash and cash equivalents with multiple financial institutions. Cash
and cash equivalents were $202.6 million and $136.5 million at May 31, 2010 and
2009, respectively, with approximately 80% of it located in the U.S. in both
periods.
Concentrations
of credit risk with respect to accounts receivable are limited because a large
number of geographically diverse customers make up the Company’s customer base,
thus spreading the trade credit risk. At May 31, 2010, and May 31, 2009, no
single customer or group of customers represented more than 10% of total
accounts receivable. The Company controls credit risk through credit limits and
monitoring procedures. At May 31, 2010 and 2009, the Company’s accounts
receivable balances were $59.6 million and $57.0 million, respectively with
about 50% of these accounts being of foreign origin, predominantly
European. Companies and government agencies in some European
countries require longer payment terms as a part of doing
business. This may subject the Company to a higher risk of
uncollectiblity. This risk is considered when the allowance for
doubtful accounts is evaluated. The Company generally does not require
collateral from its customers.
Concentration of Production
Facilities and Supplies – Substantially all of the Company’s reagent
products are produced in its Norcross, Georgia facility in the U.S., and its
reagent production is highly dependent on the uninterrupted and efficient
operation of this facility. Therefore, if a catastrophic event
occurred at the Norcross facility, such as a fire or tornado or if there is a
production disruption for an extended period for any other reason, many of those
products could not be produced until the manufacturing portion of the facility
is restored and cleared by the FDA. The Company maintains a disaster
plan to minimize the effects of such a catastrophe, and the Company has obtained
insurance to protect against certain business interruption losses. While the
Company purchases certain raw materials from a single supplier, the Company has
reliable supplies of most raw materials.
Cash and Cash Equivalents –
The Company considers deposits that can be redeemed on demand and investments
with an original maturity of three months or less when purchased to be cash and
cash equivalents. Generally, cash and cash equivalents held at financial
institutions are in excess of the Federal Deposit Insurance Corporation (FDIC)
insurance limit. The Company limits its exposure to credit loss by placing its
cash and cash equivalents in liquid investments with high-quality financial
institutions.
41
Inventories – Inventories are
stated at the lower of cost (first-in, first-out basis) or market (net
realizable value). Cost includes material, labor and manufacturing
overhead. The Company also allocates certain production related
general and administrative costs to inventory and incurred approximately $3.3
million, $3.0 million, and $3.9 million of such costs in fiscal 2010, 2009 and
2008, respectively. The Company had approximately $1.2 million and $1.1 million
of general and administrative costs remaining in inventory as of May 31, 2010
and May 31, 2009, respectively.
The
Company uses a standard cost system as a tool to monitor production
efficiency. The standard cost system applies estimated labor and
manufacturing overhead factors to inventory based on budgeted production and
efficiency levels, staffing levels and costs of operation, based on the
experience and judgment of management. Actual costs and production
levels may vary from the standard established, and variances are charged to the
consolidated statement of income as a component of cost of
sales. Since U.S. generally accepted accounting principles require
that the standard cost approximate actual cost, periodic adjustments are made to
the standard rates to approximate actual costs. No material changes have been
made to the inventory policy during fiscal 2010, 2009 or 2008.
Fair Value of Financial Instruments
– The carrying amounts reported in the consolidated balance sheets for
cash and cash equivalents, accounts receivable and accounts payable approximate
their fair values.
Property, Plant and Equipment
– Property, plant and equipment is stated at cost less accumulated
depreciation. Expenditures for replacements are capitalized, and the
replaced items are retired. Normal maintenance and repairs are
charged to operations. Major maintenance and repair activities that
significantly enhance the useful life of the asset are capitalized. When
property and equipment are retired, sold, or otherwise disposed of, the asset’s
carrying amount and related accumulated depreciation are removed from the
accounts and any gain or loss is included in operations. Depreciation
is computed using the straight-line method over the estimated lives of the
related assets ranging from three to thirty years.
Goodwill – On adoption of ASC
350, “Intangibles – Goodwill and Other” (“ASC 350”), goodwill and intangible
assets with indefinite lives are no longer amortized but are tested for
impairment annually or more frequently if impairment indicators
arise. Intangible assets that have finite lives continue to be
amortized over their useful lives.
The
Company evaluates the carrying value of goodwill at the end of the third quarter
of each fiscal year and between annual evaluations if events occur or
circumstances change that would more likely than not reduce the fair value of
the reporting unit below its carrying amount. Such circumstances could include,
but are not limited to: (1) a significant adverse change in legal factors or in
business climate, (2) unanticipated competition, or (3) an adverse action or
assessment by a regulator. When evaluating whether goodwill is impaired, the
Company compares the fair value of the reporting unit to which the goodwill is
assigned to the reporting unit’s carrying amount, including goodwill. The fair
value of the reporting unit is estimated using primarily the income, or
discounted cash flows, approach. If the carrying amount of a reporting unit
exceeds its fair value, then the amount of the impairment loss must be measured.
The impairment loss would be calculated by comparing the implied fair value of
the reporting unit’s goodwill to its carrying amount. In calculating the implied
fair value of the reporting unit’s goodwill, the fair value of the reporting
unit is allocated to all of the other assets and liabilities of that unit based
on their fair values. The excess of the fair value of a reporting unit over the
amount assigned to its other assets and liabilities is the implied fair value of
goodwill. An impairment loss would be recognized when the carrying amount of
goodwill exceeds its implied fair value. The Company’s evaluation of goodwill
completed during fiscal year 2010 resulted in no impairment
charges.
Deferred Licensing Costs –
Deferred licensing costs with finite lives are amortized over their useful
lives. In certain situations the deferred licensing costs are considered to have
indefinite lives such as in the countries where the law and regulations are such
that the barriers to obtaining a new license are very severe and upfront costs
are high but, once the licenses are acquired, effort and costs required to
maintain such licenses are minimal. The carrying values of assets with
indefinite lives are not amortized but they are tested annually for impairment
or more frequently if any triggering event which may impair the value of the
asset occurs.
Other Intangible Assets –
Other intangible assets includes customer lists, developed product technology,
trademarks and trade names. These intangible assets are
amortized over their useful lives. Carrying values of these assets
are tested for impairment annually or more frequently if impairment indicators
arise.
Net Sales Relating to Foreign
Operations – Sales to customers outside the United States were 28%, 27%
and 27% of net sales in fiscal 2010, 2009 and 2008, respectively.
Foreign Currency Translation
– The financial statements of foreign subsidiaries have been translated into
U.S. Dollars in accordance with ASC 830-30, “Translation of Financial
Statements” (“ASC 830-30”). The financial position and results of
operations of the Company’s foreign subsidiaries are measured using the foreign
subsidiary’s local currency as the functional currency. Revenues and expenses of
such subsidiaries have been translated into U.S. Dollars at average exchange
rates prevailing during the period. Assets and liabilities have been translated
at the rates of exchange on the balance sheet date. The resulting translation
gain and loss adjustments are recorded directly as a separate component of
shareholders’ equity, unless there is a sale or complete liquidation of the
underlying foreign investments. Foreign currency translation adjustments
resulted in losses of $5.2 million and $4.0 million in fiscal 2010 and fiscal
2009, respectively and a gain of $8.6 million in fiscal 2008.
42
Gains and
losses that result from foreign currency transactions are included in ‘other
non-operating income (expense)’ in the consolidated statements of income. In
fiscal 2010 and 2009, we incurred net foreign currency transaction losses of
$0.4 million and $1.9 million, respectively, and in fiscal 2008, we had a net
foreign currency transaction gain of $0.1 million.
Revenue Recognition – In
accordance with ASC 605, “Revenue Recognition” (“ASC 605”), the Company
recognizes revenue when the following four basic criteria have been
met: (1) persuasive evidence of an arrangement exists; (2) delivery
has occurred or services have been rendered; (3) the fee is fixed and
determinable; and (4) collectibility is reasonably assured.
|
·
|
Reagent
sales
|
Revenue
from the sale of the Company’s reagents to end users is primarily recognized
upon shipment when both title and risk of loss transfer to the customer, unless
there are specific contractual terms to the contrary. Revenue from
the sale of the Company’s reagents to distributors is recognized FOB customs
clearance when both title and risk of loss transfer to the
customer.
|
·
|
Instrument
sales
|
Contracts
for the sale or rental of our instruments typically have multiple
deliverables. In such cases, we recognize revenue on the sale of
instruments in accordance with ASC 605-25 “Revenue Recognition: Multiple-Element
Arrangements” (“ASC 605-25”). Our instrument sales contracts with multiple
deliverables include the sale or rental of an instrument (including delivery,
installation and training), the servicing of the instrument during the first
year, and, in many cases, price guarantees for reagents and consumables
purchased during the contract period. We have determined the fair
value of certain of these elements, such as training and first year service. We
do not believe it is possible to determine the fair value of price guarantees at
the time of sale.
If the
contract contains price guarantees, which our contracts typically do, the entire
arrangement consideration is deferred and recognized over the related guarantee
period. For contracts without price guarantees, the sales price in
excess of the fair values of training and service is allocated to the instrument
itself and recognized upon shipment and completion of contractual obligations
relating to training and/or installation. The fair value of a training session
is recognized as revenue when services are provided. The fair value
of first year service is recognized over the first year of the contract. The
allocation of the total consideration, which is based on the estimated fair
value of the units of accounting, requires judgment by management.
In
revenue deferral situations, the costs related to the instruments are recognized
when the instrument is installed and accepted by the customer.
Revenue
from the sale of our instruments without multiple deliverables is generally
recognized upon shipment and completion of contractual
obligations. Revenue from rentals of our instruments is recognized
over the term of the rental agreement. Instrument service contract
revenue is recognized over the term of the service contract.
Shipping and Handling Charges and
Sales Tax – The amounts billed to customers for shipping and handling of
orders are classified as revenue and reported in the statements of income as net
sales. The costs of handling and shipping customer orders are
reported in the operating expense section of the statements of income as
distribution expense. For the years ended May 31, 2010, 2009 and 2008, these
costs were $14.8 million, $13.7 million and $11.4 million, respectively. Sales
taxes invoiced to customers and payable to government agencies are recorded on a
net basis with the sales tax portion of a sales invoice directly credited to a
liability account and the balance of the invoice credited to a revenue
account.
Trade Accounts Receivable and
Allowance for Doubtful Accounts – Trade receivables at May 31, 2010 and
May 31, 2009 were $59.6 million and $57.0 million, respectively, and were net of
allowances for doubtful accounts of $2.1 million and $2.2 million,
respectively. The allowance for doubtful accounts represents a
reserve for estimated losses resulting from the inability of the Company’s
customers to pay their debts. The collectibility of trade receivable balances is
regularly evaluated based on a combination of factors such as customer
credit-worthiness, past transaction history with the customer, current economic
industry trends and changes in customer payment patterns. If it is determined
that a customer will be unable to fully meet its financial obligation, such as
in the case of a bankruptcy filing or other material events impacting its
business, a specific allowance for doubtful accounts is recorded to reduce the
related receivable to the amount expected to be recovered.
43
Advertising Costs –
Advertising costs are expensed as incurred and are classified as selling and
marketing operating expenses in the consolidated income
statement. Advertising expenses were $0.6 million, $0.7 million and
$0.4 million for the years ended May 31, 2010, 2009 and 2008,
respectively.
Research and Development costs
– Research and development costs are expensed as incurred and are
disclosed as a separate line item in the consolidated income statement.
Loss
contingencies – Certain conditions may exist as of the date the financial
statements are issued that may result in a loss to the Company but which will
only be determined and resolved when one or more future events occur or fail to
occur. The Company’s management and its legal counsel assess such contingent
liabilities, and such assessment inherently involves an exercise of judgment. In
assessing loss contingencies related to legal proceedings that are pending
against the Company or unasserted claims that may result in such proceedings,
the Company’s legal counsel evaluates the perceived merits of any legal
proceedings or unasserted claims as well as the perceived merits of the amount
of relief sought or expected to be sought therein.
If the
assessment of a contingency indicates that it is probable that a material loss
is likely to occur and the amount of the liability can be estimated, then the
estimated liability is accrued in the Company’s financial statements. If the
assessment indicates that a potentially material loss contingency is not
probable, but is reasonably possible, or is probable but cannot be estimated,
then the nature of the contingent liability, together with an estimate of the
range of possible loss if determinable and material, would be
disclosed.
Loss
contingencies considered remote are generally not accrued or disclosed unless
they involve guarantees, in which case the nature of the guarantee would be
disclosed. Legal costs relating to loss contingencies are expensed as
incurred.
Income
Taxes – The Company’s income tax policy is to record the estimated future
tax effects of temporary differences between the tax bases of assets and
liabilities and amounts reported in the accompanying consolidated balance
sheets, as well as operating loss and tax credit carry-forwards. The value of
the Company’s deferred tax assets assumes that the Company will be able to
generate sufficient future taxable income in applicable tax jurisdictions, based
on estimates and assumptions. If these estimates and related assumptions change
in the future, the Company may be required to record additional valuation
allowances against its deferred tax assets resulting in additional income tax
expense in the Company’s consolidated statements of income. In assessing the
realizability of deferred tax assets, management considers whether it is more
likely than not that some portion or all of the deferred tax assets will not be
realized, and the Company considers the scheduled reversal of deferred tax
liabilities, projected future taxable income, carry-back opportunities, and
tax-planning strategies in making this assessment. Management
assesses the need for additional valuation allowances quarterly.
The
calculation of income tax liabilities involves significant judgment in
estimating the impact of uncertainties in the application of complex tax laws.
An update to ASC 740, “Income Taxes” (“ASC 740”), which we adopted at the
beginning of fiscal 2008, provides further clarification on the accounting for
uncertainty in income taxes recognized in the financial statements. The impact
of an uncertain income tax position on an income tax return must be recognized
at the largest amount that has a greater than 50% cumulative probability to be
sustained upon audit by the relevant taxing authority. An uncertain
income tax position will not be recognized if it has less than a 50% likelihood
of being sustained. The new threshold and measurement attribute
prescribed by the FASB will continue to require significant judgment by
management.
Warranty – Each instrument
sale includes a standard one-year service warranty. An extended
warranty is sold separately. The start of the one-year standard service period
generally coincides with when the instrument revenue itself is recognized (upon
customer acceptance/training, etc.). Standard warranty revenues are thus
deferred until the instrument revenues are recognized and are then amortized
over a 12-month period. If the instrument revenue is deferred due to a price
protection clause, the revenue from warranty is also deferred and recognized
over the same period as the revenue from the instrument sale. The price charged
for the extended warranty is considered to be the fair market value of a first
year warranty built into the consideration arrangement and is in accordance with
the guidance provided in ASC 605-25 “Revenue Recognition: Multiple-Element
Arrangements.”
Impact of Recently Issued Accounting
Standards –
Adopted
by the Company in fiscal 2010
In June
2009, the Financial Accounting Standards Board (“FASB”) issued SFAS No. 168 “The
FASB Accounting Standards Codification™ and the Hierarchy of Generally Accepted
Accounting Principles – A Replacement of FASB Statement No. 162” (“SFAS 168”).
SFAS 168 establishes the FASB
Accounting Standards CodificationTM
(“ASC”) as the single source of authoritative U.S. generally accepted
accounting principles (“U.S. GAAP”) recognized by the FASB to be applied by
nongovernmental entities. Rules and interpretive releases of the SEC under
authority of federal securities laws are also sources of authoritative U.S. GAAP
for SEC registrants. SFAS 168 and the Codification are effective for financial
statements issued for interim and annual periods ending after September 15,
2009, which corresponds to the Company’s second quarter of fiscal 2010. Upon
adoption, the Codification superseded all existing non-SEC accounting and
reporting standards. All other non-grandfathered non-SEC accounting literature
not included in the Codification became non-authoritative. Following SFAS 168,
the FASB will not issue new standards in the form of Statements, FASB Staff
Positions, or Emerging Issues Task Force Abstracts. Instead, the FASB will issue
Accounting Standards Updates (“ASU”), which will serve only to: (a) update the Codification;
(b) provide background
information about the guidance; and (c) provide the bases for
conclusions on the change(s) in the Codification. The adoption of SFAS 168
during the second quarter of fiscal 2010 did not have a material impact on the
Company’s consolidated financial statements.
44
In
September 2006, the FASB issued an update to ASC 820, “Fair Value Measurements
and Disclosures” (“ASC 820”). The update provides guidance for using fair value
to measure assets and liabilities, and also responds to investors' requests for
expanded information about the extent to which companies measure assets and
liabilities at fair value, the information used to measure fair value and the
effect of fair value measurements on earnings. This update applies
whenever other standards require (or permit) assets or liabilities to be
measured at fair value. The standard does not expand the use of fair value in
any new circumstances. For financial assets and liabilities, this update is
effective for fiscal years beginning after November 15, 2007. The Company
adopted the provisions for the financial assets and liabilities in fiscal 2009
and adoption did not have a material impact on the Company’s results of
operations or financial position. For nonfinancial assets and
liabilities, this update is effective for fiscal years beginning after
November 15, 2008. The adoption of provisions of the update to ASC 820 for
nonfinancial assets and liabilities during the first quarter of fiscal 2010 did
not have a material impact on the Company’s results of operations or financial
position.
In
December 2007, the FASB issued an update to ASC 805, “Business Combinations”
(“ASC 805”). This update significantly changes the financial accounting and
reporting of business combination transactions. The update also establishes
principles for how an acquirer recognizes and measures the identifiable assets
acquired, liabilities assumed, and any noncontrolling interest in the acquiree;
recognizes and measures the goodwill acquired in the business combination or a
gain from a bargain purchase; and determines what information to disclose to
enable users of the financial statements to evaluate the nature and financial
effects of the business combination. The update to ASC 805 is effective for
acquisition dates on or after the beginning of an entity’s first year that
begins after December 15, 2008. The adoption of the update to ASC 805
during the first quarter of fiscal 2010 did not have a material impact on the
Company’s consolidated financial statements.
In
December 2007, the FASB issued an update to ASC 810, “Consolidation” (“ASC
810”). This update establishes accounting and reporting standards for the
non-controlling interest in a subsidiary and for the deconsolidation of a
subsidiary. This update is effective for fiscal years beginning on or after
December 15, 2008. The adoption of the update to ASC 810 during the first
quarter of fiscal 2010 did not have a material impact on the Company’s
consolidated financial statements.
In
April 2008, the FASB issued an update to ASC 350, “Intangibles – Goodwill
and Other” (“ASC 350”), which amends the factors an entity must consider when
developing renewal or extension assumptions used in determining the useful life
of a recognized intangible asset. It also requires entities to provide certain
disclosures about its assumptions. This update is effective for financial
statements issued for fiscal years beginning after December 15, 2008 and
interim periods within those fiscal years. The adoption of the update to ASC
350 during the first quarter of fiscal 2010 did not have a material impact
on the Company’s consolidated financial statements.
In June
2008, the FASB issued an update to ASC 260, “Earnings Per Share” (“ASC
260”). This update states that unvested share-based payment awards
that contain rights to receive nonforfeitable dividends (whether paid or unpaid)
are participating securities, and should be included in the two-class method of
computing EPS. The update is effective for fiscal years beginning after December
15, 2008, and interim periods within those years. The adoption of ASC
260-40-45-61A during the first quarter of fiscal 2010 did not have a material
impact on the Company’s consolidated financial statements.
In May
2009, the FASB established ASC 855, “Subsequent Events” (“ASC
855”). ASC 855 establishes general standards of accounting for and
disclosure of events that occur after the balance sheet date but before
financial statements are issued. The effective date of ASC 855 is
interim or annual financial periods ending after June 15, 2009. This
codification topic does not apply to subsequent events or transactions that are
within the scope of other applicable generally accepted accounting principles
that provide different guidance on the accounting treatment for subsequent
events or transactions. ASC 855 applies to both interim financial statements and
annual financial statements and should not result in significant changes in the
subsequent events that are reported. ASC 855 introduces the concept of financial
statements being available to be issued. It requires the disclosure of the date
through which a Company has evaluated subsequent events and the basis for that
date, whether that represents the date the financial statements were issued or
were available to be issued. ASC 855 should alert all users of financial
statements that an entity has not evaluated subsequent events after that date in
the set of financial statements being presented. The adoption of ASC 855 during
the first quarter of fiscal 2010 did not have a material impact on the Company’s
consolidated financial statements. Topic 855 was updated by FASB ASU
2010-09. Further discussion of related accounting treatment is noted
below.
45
In August
2009, the FASB issued Accounting Standards Update 2009-05, “Measuring
Liabilities at Fair Value” (“ASU 2009-05”), which is an amendment of ASC 820,
“Fair Value Measurements and Disclosures” (“ASC 820”). ASU 2009-05 provides
clarification for circumstances where a quoted price in an active market for the
identical liability is not available. In that situation, entities are
required to measure fair value in one or more of the following
techniques:
|
1)
|
A
valuation technique that uses either a) the quoted price of the identical
liability when traded as an asset or b) the quoted prices for similar
liabilities or similar liabilities when traded as an
asset.
|
|
2)
|
Another
valuation technique that is consistent with the principles of ASC 820,
such as an income approach or a market
approach.
|
ASU
2009-05 also clarifies that a reporting entity is not required to adjust the
fair value of a liability to include inputs relating to the existence of
transfer restrictions on that liability. The provisions of this
update are effective for the first reporting period (including interim periods)
beginning after issuance. The adoptions of the provisions of this
update to ASC 820 during the second quarter of fiscal 2010 did not have a
material impact on the Company’s consolidated financial statements.
In
February 2010, the FASB issued ASU 2010-09, effective immediately, which amended
ASC Topic 855. The amendments were made to address concerns about conflicts with
SEC guidance and other practice issues. Among the provisions of the amendment,
the FASB defined a new type of entity, termed an “SEC filer,” which is an entity
required to file or furnish its financial statements with the SEC. While an SEC
filer is still required by GAAP to evaluate subsequent events through the date
its financial statements are issued, it is no longer required to disclose in the
financial statements that it has done so or the date through which subsequent
events have been evaluated. The adoption of the provisions of ASC 2010-09 during
the third quarter of fiscal 2010 did not have a material impact on the Company’s
consolidated financial statements.
Not
yet adopted by the Company
In June
2009, the FASB issued an update to ASC 810, “Consolidation” (“ASC 810”). This
update changes how a reporting entity determines when an entity that is
insufficiently capitalized or is not controlled through voting (or similar
rights) should be consolidated. The determination of whether a reporting entity
is required to consolidate another entity is based on, among other things, the
other entity’s purpose and design and the reporting entity’s ability to direct
the activities of the other entity that most significantly impact the other
entity’s economic performance. This update will require a reporting entity
to provide additional disclosures about its involvement with variable interest
entities and any significant changes in risk exposure due to that involvement. A
reporting entity will be required to disclose how its involvement with a
variable interest entity affects the reporting entity’s financial statements.
The update will be effective at the start of a reporting entity’s first fiscal
year beginning after November 15, 2009, which corresponds to the Company’s first
quarter of fiscal 2011. Early application is not permitted. The Company
does not expect the adoption of this update to ASC 810 to have a material impact
on its financial statements.
In
October 2009, the FASB issued ASU 2009-13, “Multiple Deliverables Revenue
Arrangements” (“ASU 2009-13”), which is an amendment of ASC 605-25, “Revenue
Recognition: Multiple Element Arrangements.” This update addresses
the accounting for multiple-deliverable arrangements to allow the vendor to
account for deliverables separately instead of as one combined unit by amending
the criteria for separating consideration in multiple-deliverable
arrangements. This guidance establishes a selling price hierarchy for
determining the selling price of a deliverable, which is based on a)
vendor-specific objective evidence (VSOE), b) third-party evidence or c) best
estimate of selling price. The residual method of allocation has been
eliminated and arrangement consideration is now required to be allocated to all
deliverables at the inception of the arrangement using the selling price
method. Additionally, expanded disclosures will be required relating
to multiple deliverable revenue arrangements. This update will be
effective for fiscal years beginning on or after June 15, 2010, which
corresponds to the Company’s first quarter of fiscal 2012. Early
adoption is permitted. The Company is currently evaluating the impact
of the adoption of this update to ASC 605-25 on its financial
statements.
In
December 2009, the FASB issued ASU 2009-16, “Accounting for Transfers of
Financial Assets” (“ASU 2009-16”),which is an amendment of ASC 860, “Transfers
and Servicing.” This update will require more information about the
transfer of financial assets. More specifically, ASU 2009-16
eliminates the concept of a “special purpose entity”, changes the requirements
for derecognizing financial assets, and enhances the information reported to
users of financial statements. This update will be effective for
fiscal years beginning on or after November 15, 2009, which corresponds to the
Company’s first quarter of fiscal 2011. Early application is not
permitted. The Company does not expect the adoption of this update to
ASC 860 to have a material impact on its financial statements.
In April
2010, the FASB issued ASU 2010-13, “Effect of Denominating the Exercise Price of
a Share- Based Payment Award in the Currency of the Market in Which the
Underlying Equity Security Trades” (ASU 2010-13”), which is an amendment of ASC
718, “Compensation—Stock Compensation.” This update clarifies that an
employee share-based payment award with an exercise price denominated in the
currency of a market in which a substantial portion of the entity’s equity
securities trades should not be considered to contain a condition that is not a
market, performance, or service condition. Therefore, an entity would not
classify such an award as a liability if it otherwise qualifies as equity. This
update will be effective for fiscal years and interim periods beginning on or
after December 15, 2010, which corresponds to the Company’s fourth quarter of
fiscal 2011. Early application is permitted. The Company
currently accounts for the above mentioned share-based payment awards as equity,
therefore the adoption of ASU 2010-13 will not have a material impact on its
financial statements.
46
|
2.
|
ACQUISITIONS
|
BioArray
On March
11, 2008, the Company signed an Agreement and Plan of Merger with BioArray
Solutions Ltd. (“BioArray”), a privately-held company based in Warren, NJ. The
Company completed the acquisition of BioArray on August 4, 2008. Pursuant to the
agreement, the Company acquired 100% of the outstanding common stock of BioArray
for an aggregate purchase price of $115.2 million, including approximately $2.4
million of acquisition-related transaction costs. The purchase consideration was
paid in cash. The Company has included the financial results of BioArray in its
consolidated financial statements beginning August 4, 2008.
BioArray
is a pioneer in the field of molecular immunohematology or the DNA analysis of
blood for the purpose of transfusion. Through the development of technologies
supported by a substantial patent portfolio of issued or pending patents,
BioArray developed a novel and flexible technology platform that allows for a
variety of DNA-based testing. The platform combines semiconductor technology,
microparticle chemistry and molecular biology to bring a high degree of
flexibility and performance to qualitative and quantitative DNA and protein
analysis.
Using
this technology platform, BioArray developed complete assay solutions called the
BeadChipTM
system. The BeadChip system includes BeadChips featuring proprietary
array designs as well as a semi-automated instrument that reads and interprets
test results. The ensuing integrated assay delivery system enables users to
simultaneously perform dozens of customized tests on each patient sample in a
semi-automated fashion. The Company believes this versatility makes the BeadChip
format ideally suited to a wide scope of applications.
As of the
acquisition date, the BeadChip system was being sold to and used by a number of
customers in the U.S. for Research Use Only purposes, which does not require FDA
approval. After the acquisition was finalized, the Company began expanding the
footprint of the BeadChip system outside of the U.S., particularly in Western
Europe. The Company is in the process of developing the next
generation molecular immunohematology instrument, which we believe, will
facilitate the further commercialization of the BioArray
solution. The current plan is to have a Research Use Only instrument
available in the first half of calendar 2011.
Immucor
believes that molecular immunohematology will revolutionize transfusion
medicine. Immucor also believes that its acquisition of BioArray provides new,
strategic growth markets for the Company in both its current market of
transfusion, through an offering complementary to its current product offerings,
as well as the potential new market of transplantation. The purchase price for
BioArray, and the resulting goodwill, reflects the significant growth
opportunities that both companies believe BioArray’s technology and the
combination of the companies’ complementary strengths represents for future
growth.
Immucor’s
leadership in blood banking industry automation and BioArray’s leadership in
molecular diagnostic systems for specialty transfusion applications should allow
the combined company to develop and deliver more precise molecular
immunohematology solutions to enhance patient outcomes. Immucor also believes
its proven strength in developing automated instruments combined with its FDA
licensing and CE Mark process experience, its established distribution network,
its sales and marketing capabilities as well as its financial resources will
generate enhanced long-term growth opportunities for the commercialization of
BioArray’s BeadChip system.
The
acquisition has been accounted for as a purchase business combination. Assets
acquired and liabilities assumed were recorded at their fair values as of August
4, 2008. Acquisition-related transaction costs include investment
banking, legal and accounting fees, and other external costs directly related to
the acquisition.
In
connection with the transaction, BioArray formed a new company intended to
commercialize BioArray’s technology in fields outside of blood transfusion and
transplantation. In April 2009, Immucor bought back the rights to the
BioArray technology from the new company for approximately $1.0 million. As part
of the liquidation of the new company, Immucor received approximately $140,000
in cash from the net assets, proportional to Immucor’s ownership
interest.
47
The
transaction costs included a payment of $1.4 million to TM Capital Corp., an
investment bank which has represented the Company in a number of financial
transactions, including the acquisition of BioArray Solutions in August
2008. Michael S. Goldman, one the Company’s former directors, is a
Managing Director and founding principal of TM Capital Corp. With the
receipt of these fees, as of August 4, 2008, Mr. Goldman no longer qualified as
an “independent” director of the Company under Nasdaq Stock Market listing
standards. As a result, Mr. Goldman resigned his positions as a member of the
Compensation Committee and Governance Committee of the Board of Directors as of
August 4, 2008 and did not stand for re-election at the 2008 annual meeting of
shareholders.
Purchase
Price Allocation
Under
purchase accounting, the total purchase price was allocated to BioArray’s net
tangible and identifiable intangible assets based on their estimated fair values
as of August 4, 2008. The excess of the purchase price over the net tangible and
identifiable intangible assets was recorded as goodwill. The allocation of the
purchase price was based upon a valuation.
The
following table details the purchase price allocation (in
thousands):
|
Current
assets
|
$ | 8,097 | ||
|
Plant
and equipment
|
1,534 | |||
|
Goodwill
|
58,783 | |||
|
Developed
product technology
|
51,000 | |||
|
Deferred
tax asset
|
21,580 | |||
|
Trademarks
|
1,600 | |||
|
Non-compete
agreements
|
1,650 | |||
|
Total
assets acquired
|
144,244 | |||
|
Deferred
tax liability
|
(22,752 | ) | ||
|
Liabilities
assumed
|
(6,328 | ) | ||
|
Total
purchase price
|
$ | 115,164 |
As of
August 4, 2008, the Company made a preliminary determination of the amount of
BioArray’s operating loss carry-forwards that will be available to reduce the
Company’s future taxable income, based on the rules governing allowable
carry-forward of losses when changes in ownership occur under Internal Revenue
Code Section 382. This amount, which approximates $21.6 million, is recorded as
a deferred tax asset. The net operating losses and credit carry-forwards will
expire at various times between 2021 and 2028. The Company has acquired
intangible assets, not including goodwill, totaling approximately $54.3 million
in this transaction. The amortization of these intangibles is not
deductible for tax purposes and hence the Company has recorded a deferred tax
liability of approximately $22.8 million to offset the future book amortization
related to these intangibles. None of the goodwill of approximately $58.8
million resulting from the acquisition of BioArray is deductible for tax
purposes.
Identifiable
Intangible Assets
In
performing the purchase price allocation, the Company considered, among other
factors, the intended future use of acquired assets, analyses of historical
financial performance and estimates of future performance of BioArray’s
products. The fair value of intangible assets was based, in part, on a valuation
completed using an income approach. The rates used to discount net cash flows to
their present values were based on the Company’s weighted average cost of
capital and ranged from 13.5% to 15%. These discount rates were determined after
consideration of the Company’s rate of return on equity and the weighted average
return on invested capital. The following table sets forth the components of
intangible assets associated with the acquisition:
|
Intangible
Asset
|
Fair
Value
|
Useful
Life
|
|||
|
Developed
product technology
|
$ | 51,000 |
17
yrs.
|
||
|
Trademarks
|
1,600 |
17
yrs.
|
|||
|
Non-compete
agreements
|
1,650 |
5
yrs.
|
|||
| $ | 54,250 | ||||
48
Developed
product technology represents the value assigned to BioArray’s technology
platform, the BeadChip system. The BeadChip system is sold as a product platform
that has a number of applications. It was not possible to identify income
streams associated with the various technologies within the portfolio. As such,
the asset was valued as a single portfolio of technologies. The valuation was
developed based upon the projected future cash flows and other valuation factors
attributable to anticipated future sales of the BeadChip system. Immucor is in
the process of developing an automated instrument to further commercialize the
BeadChip system. This project was started post-acquisition. While there is some
risk that the FDA licensing or CE Mark process for the future automated
instrument would not be successful, Immucor did not consider this regulatory
risk to be significant enough to classify the technology portfolio that
comprises the BeadChip system as in-process research and
development.
Trademarks
represent the estimated fair value of the BioArray trademark. Non-compete
agreements represent the estimated fair value of agreements with BioArray’s
former management team members. Useful lives of the developed product technology
and trademarks were based on estimated economic useful lives and the non-compete
agreements useful lives were based on the terms in the agreements. Intangible
assets are being amortized using the straight-line method.
Pro
Forma Financial Information
The
financial information in the table below summarizes the combined results of
operations of Immucor and BioArray, on a pro forma basis, as though the
companies had been combined as of the beginning of the periods presented. The
pro forma financial information is presented for informational purposes only and
is not indicative of the results of operations that would have been achieved if
the acquisition had taken place at the beginning of the periods presented. Such
pro forma financial information is based on the historical financial statements
of Immucor and BioArray. This pro forma financial information is based on
estimates and assumptions, which have been made solely for purposes of
developing such pro forma information, including, without limitation, purchase
accounting adjustments. The pro forma financial information presented below also
includes depreciation and amortization based on the valuation of BioArray’s
tangible assets and identifiable intangible assets resulting from the
acquisition. The pro forma financial information presented below (in thousands,
except per share data) does not reflect any synergies or operating cost
reductions that may be achieved from the combined operations.
|
Year
Ended May 31,
|
||||||||
|
2009
|
2008
|
|||||||
|
Revenue
|
$ | 300,863 | $ | 262,930 | ||||
|
Net
Income
|
$ | 73,633 | $ | 59,640 | ||||
|
Earnings
per common share – basic
|
$ | 1.05 | $ | 0.85 | ||||
|
Earnings
per common share – diluted
|
$ | 1.03 | $ | 0.84 | ||||
IBG
Immucor Limited
In June
2008, with the intent to sell its products directly in the United Kingdom, the
Company acquired all of the outstanding shares of IBG Immucor Limited, a private
company registered in, and the Company’s distributor for the United Kingdom, for
an aggregate cash purchase price of $4.4 million.
49
|
3.
|
INVENTORY
|
Inventories
are stated at the lower of cost (first-in, first-out basis) or market (net
realizable value):
|
May
31,
|
||||||||
|
2010
|
2009
|
|||||||
|
(in
thousands)
|
||||||||
|
Raw
materials and supplies
|
$ | 8,211 | $ | 8,506 | ||||
|
Work
in process
|
4,145 | 3,486 | ||||||
|
Finished
goods
|
23,374 | 26,264 | ||||||
| $ | 35,730 | $ | 38,256 | |||||
|
4.
|
PROPERTY
AND EQUIPMENT
|
|
May
31,
|
||||||||
|
2010
|
2009
|
|||||||
|
(in
thousands)
|
||||||||
|
Land
|
$ | 62 | $ | 59 | ||||
|
Buildings
and improvements
|
1,702 | 1,732 | ||||||
|
Leasehold
improvements
|
15,167 | 12,905 | ||||||
|
Capital
work-in-progress
|
3,377 | 5,085 | ||||||
|
Furniture
and fixtures
|
3,521 | 2,916 | ||||||
|
Machinery
and equipment
|
74,996 | 61,945 | ||||||
| 98,825 | 84,642 | |||||||
|
Less
accumulated depreciation
|
(49,656 | ) | (41,181 | ) | ||||
|
Property,
plant and equipment – net
|
$ | 49,169 | $ | 43,461 | ||||
Depreciation
expense was $12.3 million in fiscal year 2010, $9.6 million in fiscal year 2009,
and $8.0 million in fiscal year 2008.
|
5.
|
GOODWILL
|
Changes
in the carrying amount of goodwill for the year ended May 31, 2010 and 2009 were
as follows:
|
May
31,
|
||||||||
|
2010
|
2009
|
|||||||
|
(in
thousands)
|
||||||||
|
Balance
at beginning of year
|
$ | 97,255 | $ | 36,758 | ||||
|
Additions:
|
||||||||
|
Acquisition
of IBG
|
- | 2,791 | ||||||
|
Acquisition
of BioArray
|
- | 58,783 | ||||||
|
Foreign
currency translation adjustment and other
|
(2,919 | ) | (1,077 | ) | ||||
|
Balance
at end of year
|
$ | 94,336 | $ | 97,255 | ||||
Goodwill
is tested for impairment at the end of the third quarter of each fiscal year or
earlier if a triggering event occurs. Testing for impairment of goodwill
confirmed that the carrying value of goodwill was not impaired, and consequently
no impairment charges were recorded in the years ended May 31, 2010, 2009 and
2008.
50
|
6.
|
OTHER
INTANGIBLE ASSETS
|
|
May
31, 2010
|
May
31, 2009
|
||||||||||||||||||||||||
|
Weighted
Average Life
|
Cost
|
Accumulated
Amortization
|
Net
|
Cost
|
Accumulated
Amortization
|
Net
|
|||||||||||||||||||
|
(in
thousands)
|
(in
thousands)
|
||||||||||||||||||||||||
|
Intangible
assets subject to amortization:
|
|||||||||||||||||||||||||
|
Deferred
licensing costs
|
5
yrs
|
$ | 1,013 | $ | (502 | ) | $ | 511 | $ | 581 | $ | (482 | ) | $ | 99 | ||||||||||
|
Distribution
rights
|
10
yrs
|
4,492 | (2,863 | ) | 1,629 | 4,492 | (2,358 | ) | 2,134 | ||||||||||||||||
|
Customer
lists
|
16
yrs
|
4,819 | (1,684 | ) | 3,135 | 4,911 | (1,372 | ) | 3,539 | ||||||||||||||||
|
Non-compete
agreements
|
5
yrs
|
1,650 | (605 | ) | 1,045 | 1,650 | (275 | ) | 1,375 | ||||||||||||||||
|
Developed
product technology
|
17
yrs
|
51,086 | (5,586 | ) | 45,500 | 51,095 | (2,595 | ) | 48,500 | ||||||||||||||||
|
Trademarks
/ tradenames
|
17
yrs
|
1,613 | (186 | ) | 1,427 | 1,615 | (93 | ) | 1,522 | ||||||||||||||||
|
Total
amortizable assets
|
64,673 | (11,426 | ) | 53,247 | 64,344 | (7,175 | ) | 57,169 | |||||||||||||||||
|
Intangible
assets not subject to amortization:
|
|||||||||||||||||||||||||
|
Deferred
licensing costs
|
4,381 | - | 4,381 | 4,186 | - | 4,186 | |||||||||||||||||||
|
Total
non-amortizable assets
|
4,381 | - | 4,381 | 4,186 | - | 4,186 | |||||||||||||||||||
|
Total
other intangible assets
|
$ | 69,054 | $ | (11,426 | ) | $ | 57,628 | $ | 68,530 | $ | (7,175 | ) | $ | 61,355 | |||||||||||
Distribution
rights include costs amounting to $0.9 million, net, incurred in fiscal 2009
related to reacquiring the rights to BioArray’s technology from an organization
that was formed during the time of the acquisition of BioArray, which was
intended to commercialize BioArray’s technology in fields outside of blood
transfusion and transplantation.
Amortization
of intangible assets amounted to $4.3 million, $3.7 million and $0.4 million for
the years ended May 31, 2010, 2009 and 2008, respectively. The following table
presents our estimate of amortization expense for each of the next five fiscal
years and thereafter (in thousands):
|
Year
Ending May 31:
|
||||
|
2011
|
4,308 | |||
|
2012
|
4,271 | |||
|
2013
|
3,856 | |||
|
2014
|
3,579 | |||
|
2015
|
3,524 | |||
|
Thereafter
|
33,709 | |||
| $ | 53,247 | |||
|
7.
|
ACCRUED
EXPENSES AND OTHER CURRENT
LIABILITIES
|
|
May
31,
|
||||||||
|
2010
|
2009
|
|||||||
|
(in
thousands)
|
||||||||
|
Sales
and other taxes payable
|
$ | 4,205 | $ | 4,236 | ||||
|
Salaries
and wages
|
9,524 | 10,763 | ||||||
|
Professional
fees and dealer commission
|
1,080 | 2,371 | ||||||
|
Royalties
|
497 | 297 | ||||||
|
Accruals
for pricing discounts to dealers
|
220 | 219 | ||||||
|
Other
accruals
|
1,852 | 2,367 | ||||||
|
Accrued
expenses and other current liabilities
|
$ | 17,378 | $ | 20,253 | ||||
51
|
8.
|
DEFERRED
REVENUE
|
As
described in Note 1, many of the Company’s instrument sales contracts involve
multiple deliverables with price guarantees, and revenues from these contracts
are deferred and recognized over the term of the agreements which are generally
five years. The Company also defers revenue from service contracts
over the term of the service agreements.
The
additions to and recognition of deferred revenue for the year ended May 31, 2010
and May 31, 2009 were as follows:
|
May
31,
|
||||||||
|
2010
|
2009
|
|||||||
|
(in
thousands)
|
||||||||
|
Balance
at beginning of year
|
$ | 22,093 | $ | 24,156 | ||||
|
Additions
to deferred revenue from acquisitions
|
- | 492 | ||||||
|
Additions
to deferred revenue from new contracts
|
11,555 | 14,672 | ||||||
|
Revenue
recognized during the year
|
(16,814 | ) | (16,913 | ) | ||||
|
Foreign
currency translation adjustment
|
(153 | ) | (314 | ) | ||||
|
Balance
at end of year
|
16,681 | 22,093 | ||||||
|
Less:
Deferred Revenue - current portion
|
(8,994 | ) | (11,222 | ) | ||||
|
Deferred Revenue
- non-current portion
|
$ | 7,687 | $ | 10,871 | ||||
Additions
to deferred revenue from contracts decreased during fiscal 2010 as instruments
were acquired more often through rental agreements than through
sales. Revenue related to rental agreements is recognized over the
rental period. These arrangements do not generate deferred
revenue.
|
9.
|
OTHER
LONG TERM LIABILITIES
|
|
May
31,
|
||||||||
|
2010
|
2009
|
|||||||
|
(in
thousands)
|
||||||||
|
Severance
indemnity for employees
|
$ | 965 | $ | 968 | ||||
|
Employment
agreement at acquisition
|
135 | 280 | ||||||
|
Deferred
leasehold improvement incentive
|
1,813 | 1,961 | ||||||
| 2,913 | 3,209 | |||||||
|
Less
current portion
|
(914 | ) | (878 | ) | ||||
|
Other
long term liabilities
|
$ | 1,999 | $ | 2,331 | ||||
The
Company credits leasehold improvement incentives received from landlords to rent
expense over the remaining term of the lease
agreement.
|
10.
|
COMMON
STOCK
|
Reserved
shares
At May
31, 2010, 2,948,265 shares of common stock were reserved for future issuance
upon the vesting of restricted stock or the exercise of stock options that have
previously been issued and are still outstanding under the Immucor, Inc. 2005
Long-Term Incentive Plan and previous plans.
Stock
repurchased
During
fiscal 2010, 2009 and 2008, the Company either withheld from certain option
exercises or reacquired from certain restricted shareholders an aggregate of
18,921, 35,088 and 207,176 shares valued at $0.3 million, $1.0 million and $5.5
million, respectively, in compliance with the statutory tax withholding
requirements. The Company retired these shares and disclosed their
value as ‘Stock repurchases and retirements’ in the consolidated statement of
shareholders’ equity and comprehensive income and as ‘Repurchase of common
stock’ under financing activities in the consolidated statements of cash
flows.
52
During
fiscal 2009 and 2008, the Company also withheld 18,600 shares and 18,609 shares
valued at $0.5 million and $0.5 million from certain option exercises where the
option exercise price was paid by having shares withheld. No shares were
withheld for this purpose in fiscal 2010. These shares were also
retired and their values were disclosed as ‘Stock repurchases and retirements’
in the consolidated statement of shareholders’ equity and comprehensive income
and as ‘Non-cash investing and financing activities’ in the consolidated
statements of cash flows.
The
shares acquired were returned to the status of authorized, but unissued
shares.
Stock
repurchase program
The
Company currently has a stock repurchase program approved by the Board of
Directors. In August 2009, the Board of Directors authorized the Company to
repurchase an additional 2,000,000 shares of the Company’s common stock under
this repurchase program, bringing the total authorized shares to
11,375,000.
During
the year ended May 31, 2010 and 2009, the Company spent $11.6 million and $6.7
million to repurchase 650,003 and 295,409 shares of its common stock at an
average per share price of $17.78 and $22.52, respectively. During
the year ended May 31, 2008, the Company did not repurchase any shares of common
stock under the repurchase program. Since 1998, the Company has
repurchased 9,178,356 shares of its common stock having an aggregate value of
approximately $69.2 million. An aggregate of 2,196,644 shares were available for
repurchase under the program as of May 31, 2010.
|
11.
|
SHARE–BASED
COMPENSATION
|
Impact
of share-based compensation on income statement
The
following table shows total share-based compensation expense before and after
the tax effect for the years ended May 31, 2010, 2009 and 2008, included in the
consolidated statements of income:
|
For
the Year Ended May 31,
|
||||||||||||
|
2010
|
2009
|
2008
|
||||||||||
|
(in
thousands)
|
||||||||||||
|
Pre-tax
compensation expense
|
$ | 5,946 | $ | 5,904 | $ | 3,678 | ||||||
|
After
tax compensation expense
|
$ | 4,143 | $ | 4,374 | $ | 2,629 | ||||||
Valuation
method used and assumptions
The
Company estimates the fair value of stock options using a Black-Scholes
valuation model. Key input assumptions used to estimate the fair value of stock
options include the expected term until the exercise of the option, the expected
volatility of the Company's stock, risk-free rates of return and dividend
yields, if any. The Company estimated the fair value of options at the grant
date using the following weighted average assumptions:
|
2010
|
2009
|
2008
|
||||||||||
|
Risk-free
interest rate (1)
|
2.15% | 3.13% | 4.82% | |||||||||
|
Expected
volatility (2)
|
45.47% | 42.41% | 40.37% | |||||||||
|
Expected
life (years) (3)
|
4.25 | 4.25 | 4.25 | |||||||||
|
Expected
dividend yield (4)
|
- | - | - | |||||||||
|
1.
|
Based
on the U.S. Treasury yield curve in effect at the time of
grant.
|
|
2.
|
Expected
stock price volatility is based on the average historical volatility of
the Company’s shares during the period corresponding to the expected life
of the options.
|
|
3.
|
Represents
the period of time options are expected to remain
outstanding. As the Company has so far only awarded “plain
vanilla options” as described by ASC 718-10-S99, “Compensation – Stock
Compensation: Overall: SEC Materials,” the Company used the “simplified
method” for determining the expected life of the options granted. The
simplified method calculates expected term as the sum of the vesting term
and the original contractual term divided by two. The Company will
continue to use the simplified method until such time that it has
sufficient historical data for options with six-year contractual terms to
estimate the expected term of share-based
awards.
|
|
4.
|
The
Company has not paid dividends on its common stock and does not expect to
pay dividends on its common stock in the near
future.
|
53
Plan
summary
At an
annual meeting of the Company’s shareholders held on December 13, 2005, the
shareholders approved establishment of the Immucor, Inc. 2005 Long-Term
Incentive Plan (the “2005 Plan”). The 2005 Plan replaced the Company’s
preexisting stock option plans that have been frozen and remain in effect only
to the extent of awards outstanding under these plans. Under the 2005 Plan, the
Company is able to award stock options, stock appreciation rights, restricted
stock, deferred stock, and other performance-based awards as incentive and
compensation to employees and directors. The Company’s shareholders approved
3,600,000 shares of the Company’s common stock to be used for grants under the
2005 Plan. There is a restriction on the number of shares that may be
used for awards other than stock options (1,800,000), and a separate restriction
on the number of shares that may be used for grants of incentive stock options
(also 1,800,000), but there is no restriction on the number of shares that may
be used for grants of non-incentive stock options. Options are
granted at the closing market price on the date of the grant. Option awards
generally vest equally over a four-year period and have a 6-year contractual
term. Restricted stock awards generally vest equally over a five-year
period. The 2005 Plan provides for accelerated vesting of option and
restricted stock awards if there is a change in control, as defined in the
plan.
Stock
option activity
Compensation
costs for stock options with tiered vesting terms are recognized evenly over the
vesting periods. Activity for the Company’s option plans was as follows for the
years ended May 31, 2010, 2009 and 2008:
|
Number
of Shares
|
Weighted
Average Exercise Price
|
Weighted
Average Remaining Contractual Life (years)
|
Aggregate
Intrinsic Value (1)
|
|||||||||||||
|
(in
thousands)
|
||||||||||||||||
|
Outstanding
at May 31, 2007
|
3,570,914 | $ | 5.63 | 4.9 | $ | 92,665 | ||||||||||
|
Granted
|
482,935 | $ | 29.30 | |||||||||||||
|
Exercised
|
(1,248,219 | ) | $ | 2.55 | ||||||||||||
|
Forfeited
|
(46,279 | ) | $ | 25.61 | ||||||||||||
|
Expired
|
(309,410 | ) | $ | 1.36 | ||||||||||||
|
Outstanding
at May 31, 2008
|
2,449,941 | $ | 12.03 | 4.9 | $ | 37,551 | ||||||||||
|
Granted
|
866,995 | $ | 27.08 | |||||||||||||
|
Exercised
|
(639,274 | ) | $ | 5.79 | ||||||||||||
|
Forfeited
|
(78,566 | ) | $ | 26.53 | ||||||||||||
|
Expired
|
(43,000 | ) | $ | 11.51 | ||||||||||||
|
Outstanding
at May 31, 2009
|
2,556,096 | $ | 18.26 | 4.4 | $ | 9,948 | ||||||||||
|
Granted
|
362,531 | $ | 17.00 | |||||||||||||
|
Exercised
|
(52,350 | ) | $ | 6.41 | ||||||||||||
|
Forfeited
|
(141,255 | ) | $ | 25.57 | ||||||||||||
|
Expired
|
(64,925 | ) | $ | 25.10 | ||||||||||||
|
Outstanding
at May 31, 2010
|
2,660,097 | $ | 17.77 | 3.7 | $ | 14,611 | ||||||||||
|
Exercisable
at May 31, 2010
|
1,711,401 | $ | 14.47 | 3.3 | $ | 13,622 | ||||||||||
|
1)
|
The
aggregate intrinsic value in the above table represents the total pre-tax
intrinsic value (the difference between the Company’s closing stock price
on the last trading day of the respective fiscal year and the exercise
price, multiplied by the number of options) of in-the-money
options.
|
The
weighted-average grant-date fair value of share options granted during fiscal
years 2010, 2009 and 2008 was $6.55, $10.35 and $11.53,
respectively. The total intrinsic value of share options exercised
during fiscal years 2010, 2009 and 2008 was $0.7 million, $14.7 million and
$33.3 million, respectively.
As of May
31, 2010, there was $6.3 million of total unrecognized compensation cost related
to nonvested stock option awards. This compensation cost is expected to be
recognized through May 2014, based on existing vesting terms with the weighted
average remaining expense recognition period being approximately 2.4
years.
On April
21, 2009, the Compensation Committee approved the acceleration of the vesting of
the stock options issued on June 8, 2007 to all employees other than officers of
the Company. This action added approximately $0.9 million to the
total compensation expense for fiscal 2009.
At May
31, 2010, 2009 and 2008, options for 1,711,401, 1,443,647 and 1,793,555 shares
of common stock were exercisable, at weighted average exercise prices of $14.47,
$11.65 and $6.77, respectively. In fiscal 2010, 2009 and 2008, all
options were granted with an exercise price that agreed to the fair value of the
shares at the date of grant.
54
The
following table as of May 31, 2010 sets forth by group of exercise price ranges,
the number of options outstanding, weighted average exercise prices and weighted
average remaining contractual lives of options outstanding, and the number and
weighted average exercise prices of options currently exercisable.
|
Options
Outstanding
|
Options
Exercisable
|
|||||||||||||||||||||||||
|
Range
of Exercise Prices
|
Number
of Shares
|
Weighted
Average Exercise Price
|
Weighted
Average Contractual Life
|
Number
of Shares
|
Weighted
Average Exercise Price
|
|||||||||||||||||||||
| $ | 0.01 | - | $ | 5.00 | 437,960 | $ | 1.30 | 1.7 | 437,960 | $ | 1.30 | |||||||||||||||
| 5.01 | - | 10.00 | 381,237 | 6.12 | 3.8 | 381,237 | 6.12 | |||||||||||||||||||
| 10.01 | - | 20.00 | 544,104 | 17.03 | 4.6 | 205,965 | 17.53 | |||||||||||||||||||
| 20.01 | - | 25.00 | 218,172 | 20.56 | 5.0 | 172,472 | 20.23 | |||||||||||||||||||
| 25.01 | - | 30.00 | 930,116 | 27.85 | 3.7 | 456,807 | 28.34 | |||||||||||||||||||
| 30.01 | - | 35.00 | 148,508 | 31.68 | 3.9 | 56,960 | 31.85 | |||||||||||||||||||
| 2,660,097 | $ | 17.77 | 3.7 | 1,711,401 | $ | 14.47 | ||||||||||||||||||||
Restricted
stock activity
The
following is a summary of the changes in unvested restricted stock for the
fiscal years ended May 31, 2010, 2009 and 2008:
|
Number
of Shares
|
Weighted-Average
Grant-Date Fair Value
|
|||||||
|
Nonvested
stock outstanding at May 31, 2007
|
112,590 | $ | 17.51 | |||||
|
Granted
|
48,055 | 29.23 | ||||||
|
Vested
|
(27,038 | ) | 18.32 | |||||
|
Forfeited
|
(9,316 | ) | 20.40 | |||||
|
Nonvested
stock outstanding at May 31, 2008
|
124,291 | $ | 21.65 | |||||
|
Granted
|
57,055 | 26.90 | ||||||
|
Vested
|
(30,120 | ) | 20.93 | |||||
|
Forfeited
|
(10,036 | ) | 24.55 | |||||
|
Nonvested
stock outstanding at May 31, 2009
|
141,190 | $ | 23.72 | |||||
|
Granted
|
251,512 | 16.27 | ||||||
|
Vested
|
(72,501 | ) | 21.23 | |||||
|
Forfeited
|
(32,033 | ) | 17.45 | |||||
|
Nonvested
stock outstanding at May 31, 2010
|
288,168 | $ | 18.54 | |||||
The total
fair value of restricted shares vested was $1.5 million, $0.8 million and $0.8
million during fiscal years ended May 31, 2010, 2009 and 2008,
respectively.
As of May
31, 2010, there was $3.9 million of total unrecognized compensation cost related
to nonvested restricted stock awards. This compensation cost is expected to be
recognized through August 2014, based on existing vesting terms with the
weighted average remaining expense recognition period being approximately 3.4
years.
Shares
available for future grants
As of May
31, 2010, a total of 1,447,474 shares were available for future grants. There is
no limitation on the number of available shares that can be used for
non-incentive stock options. However, no more than 1,363,108 shares
may be used for restricted stock.
55
|
12.
|
INCOME
TAXES
|
Sources
of income before income taxes are summarized below (in thousands):
|
Year
Ended May 31,
|
||||||||||||
|
2010
|
2009
|
2008
|
||||||||||
|
Domestic
Operations
|
$ | 105,181 | $ | 107,843 | $ | 102,481 | ||||||
|
Foreign
Operations
|
20,031 | 9,138 | 9,187 | |||||||||
|
Income
before income taxes
|
$ | 125,212 | $ | 116,981 | $ | 111,668 | ||||||
The
provision for income taxes is summarized as follows (in thousands):
|
Year
Ended May 31,
|
||||||||||||
|
2010
|
2009
|
2008
|
||||||||||
|
Current:
|
||||||||||||
|
Federal
|
$ | 30,706 | $ | 33,347 | $ | 34,513 | ||||||
|
Foreign
|
6,080 | 4,606 | 4,511 | |||||||||
|
State
|
905 | 2,851 | 2,870 | |||||||||
| 37,691 | 41,894 | 41,894 | ||||||||||
|
Deferred:
|
||||||||||||
|
Federal
|
4,134 | 91 | (1,231 | ) | ||||||||
|
Foreign
|
279 | (626 | ) | (287 | ) | |||||||
|
State
|
525 | 529 | (162 | ) | ||||||||
| 4,938 | (6 | ) | (1,680 | ) | ||||||||
|
Provision
for income taxes
|
$ | 42,629 | $ | 40,798 | $ | 40,214 | ||||||
Deferred
income taxes reflect the net tax effects of: (a) temporary differences between
the carrying amounts of assets and liabilities for financial reporting purposes
and income tax purposes; and (b) operating loss and credit
carry-forwards. Valuation allowances are established when necessary
to reduce deferred tax assets to the amounts expected to be
realized. Based on assessments of all available evidence including,
but not limited to, the operating history and lack of profitability of certain
subsidiaries, the Company is uncertain as to the ability to realize the
subsidiaries’ net operating loss carry-forwards and tax benefits and, as a
result, deferred tax valuation allowances have been recorded against these
deferred tax assets as follows: Belgium, $1.1 million; Japan, $0.6
million; France, $1.0 million; and BioArray, $4.0 million related to state net
operating losses. Net operating loss carry-forwards for France and
Belgium do not expire; operating loss carry-forwards for Japan expire beginning
in 2012; federal operating loss carry-forwards for BioArray of $12.5 million
expire beginning in 2023; certain state operating loss carry-forwards for
BioArray expire beginning in 2010 and are subject to a full valuation allowance;
and credit carry-forwards of $2.2 million for BioArray expire beginning in
2021.
The tax
effects of significant items comprising the Company’s net deferred tax assets at
May 31, 2010 and 2009 are as follows (in thousands):
|
Year
Ended May 31,
|
||||||||
|
2010
|
2009
|
|||||||
|
Deferred
tax liabilities:
|
||||||||
|
Intangibles
|
$ | (23,007 | ) | $ | (23,303 | ) | ||
|
Property,
Plant & Equipment
|
(2,075 | ) | (2,539 | ) | ||||
|
Prepaids
and other
|
(457 | ) | (428 | ) | ||||
|
Deferred
tax assets:
|
||||||||
|
Reserves
not currently deductible
|
4,191 | 4,913 | ||||||
|
Deferred
revenue
|
4,027 | 4,690 | ||||||
|
Compensation
expense
|
4,190 | 2,678 | ||||||
| Operating loss carry-forwards | 19,291 | 21,672 | ||||||
|
Credit
carry-forwards
|
2,770 | 2,253 | ||||||
|
Other
|
5,081 | 6,008 | ||||||
|
Uniform
capitalization
|
684 | 535 | ||||||
| 14,695 | 16,479 | |||||||
|
Valuation
allowance
|
(6,716 | ) | (6,134 | ) | ||||
|
Net
deferred tax assets
|
$ | 7,979 | $ | 10,345 | ||||
56
Deferred
taxes are not provided for temporary differences of approximately $43.3 million,
$31.3 million and $23.6 million as of May 31, 2010, 2009 and 2008,
respectively, representing cumulative earnings of non-U.S. subsidiaries that are
intended to be permanently reinvested. Computation of the potential deferred tax
liability associated with these undistributed earnings is not
practicable.
The
Company’s effective tax rate differs from the federal statutory rate as
follows:
|
Year
Ended May 31,
|
||||||||||||
|
2010
|
2009
|
2008
|
||||||||||
|
Federal
statutory tax rate
|
35 | % | 35 | % | 35 | % | ||||||
|
State
income taxes, net of federal tax benefit
|
3 | 3 | 3 | |||||||||
|
Production
activity deduction
|
(2 | ) | (2 | ) | (1 | ) | ||||||
|
Tax
exempt interest
|
- | - | (1 | ) | ||||||||
|
Change
in deferred tax valuation allowance
|
- | - | 1 | |||||||||
|
Change
in analysis of uncertain income tax positions
|
(1 | ) | - | - | ||||||||
|
Other
|
(1 | ) | (1 | ) | (1 | ) | ||||||
|
Effective
tax rate
|
34 | % | 35 | % | 36 | % | ||||||
The
Company adopted an update to ASC 740, “Income Taxes,” on July 1, 2007. The total
balance of unrecognized tax benefits that would affect the effective tax rate,
if recognized, is $3.0 million. We do not currently anticipate that the total
amount of unrecognized tax benefits will significantly increase or decrease
during the twelve-month period ending May 31, 2011.
The
Company recognizes interest and penalties accrued related to unrecognized tax
benefits in income tax expense. The Company recognized $0.1 million in gross
accrued interest expense during fiscal 2010 and in total, as of May 31, 2010,
has recognized a liability for interest of $0.6 million. The Company has not
recognized any accrued penalties since adoption of the update to ASC 740,
“Income Taxes.”.
The
Company is subject to taxation in the U.S. and various states and foreign
jurisdictions. The Company’s tax years for the fiscal years ended May 31, 2009
and May 31, 2008 remain subject to examination by U.S. tax authorities. The
audit of the Company’s U.S. income tax return for the fiscal year ended May 31,
2007 was completed in the fiscal year ended May 31, 2009.
The
following is a tabular reconciliation of the total amounts of unrecognized tax
benefits, which is included in income taxes payable on the balance sheet, for
the years ended May 31, 2010 and 2009 in (thousands):
|
Unrecognized
tax benefit - June 1, 2009
|
$ | 10,776 | ||
|
Gross
increases in unrecognized tax benefits as a result of tax positions taken
during a prior period
|
- | |||
|
Gross
decreases in unrecognized tax benefits as a result of tax positions taken
during a prior period
|
- | |||
|
Gross
increases in unrecognized tax benefits as a result of tax positions taken
during current period
|
1,172 | |||
|
Gross
decreases in unrecognized tax benefits as a result of tax positions taken
during current period
|
- | |||
|
Decrease
in unrecognized tax benefits relating to settlements with taxing
authorities
|
(3,855 | ) | ||
|
Reductions
to unrecognized tax benefits as a result of the applicable statute of
limitations
|
- | |||
|
Unrecognized
tax benefit - May 31, 2010
|
$ | 8,093 |
57
|
13.
|
EARNINGS
PER SHARE
|
The
following table sets forth the computation of basic and diluted earnings per
share in accordance with ASC 260, “Earnings per Share” (“ASC
260”). Basic earnings per common share are calculated by dividing net
income by weighted-average common shares outstanding during the
period. Diluted earnings per common share are calculated by dividing
net income by weighted-average common shares plus dilutive potential common
shares outstanding during the period. The following table details the
calculation of basic and diluted earnings per share:
|
Year
Ended May 31,
|
||||||||||||
|
2010
|
2009
|
2008
|
||||||||||
|
(Shares
and $ in thousands, except per share data)
|
||||||||||||
|
Numerator
for basic and diluted earnings per share:
|
||||||||||||
|
Net
Income
|
$ | 82,583 | $ | 76,183 | $ | 71,454 | ||||||
|
Denominator:
|
||||||||||||
|
For
basic earnings per share
|
||||||||||||
|
-
weighted average shares basis
|
70,062 | 70,382 | 69,867 | |||||||||
|
Effect
of dilutive stock options
|
584 | 786 | 1,242 | |||||||||
|
Denominator
for diluted earnings per share
|
||||||||||||
|
-adjusted
weighted average shares basis
|
70,646 | 71,168 | 71,109 | |||||||||
|
Earnings
per common share – basic
|
$ | 1.18 | $ | 1.08 | $ | 1.02 | ||||||
|
Earnings
per common share – diluted
|
$ | 1.17 | $ | 1.07 | $ | 1.00 | ||||||
The
effect of 1,652,275, 1,135,711 and 46,990 out-of-the-money options was excluded
from the above calculation as inclusion of these securities would be
anti-dilutive for the years ended May 31, 2010, 2009 and 2008,
respectively.
On June
7, 2010, the Company, under an annual group award, issued options to employees
to purchase 213,441 shares of common stock at an exercise price of $19.10 per
share, which was the closing price on the date of the grant. The Company also
issued 211,865 shares of restricted stock. These options and restricted stock
are excluded in calculating the above diluted earnings per share as they were
issued subsequent to year end but may have a dilutive effect on future earnings
per share calculations.
|
14.
|
DOMESTIC
AND FOREIGN OPERATIONS
|
The
Company’s operations and segments are organized around geographic areas. The
foreign locations principally function as distributors of products developed and
manufactured by the Company in the United States and Canada. Effective August 4,
2008, U.S. operations also includes the operations of BioArray, which was
acquired during the first quarter of fiscal 2009. The accounting policies
applied in the preparation of the Company’s consolidated financial statements
are applied consistently across the segments. Intersegment sales are
recorded at market price and are eliminated in consolidation.
Segment
information concerning the Company’s domestic and foreign operations for the
years ended May 31, 2010, 2009 and 2008 is summarized below (in
thousands):
58
|
For
the Year Ended May 31, 2010
|
||||||||||||||||||||||||
|
U.S.
|
Europe
|
Canada
|
Japan
|
Elims
|
Consolidated
|
|||||||||||||||||||
|
Traditional
reagent revenues:
|
||||||||||||||||||||||||
|
Unaffiliated
customers
|
$ | 159,779 | $ | 29,525 | $ | 9,644 | $ | 8,762 | $ | - | $ | 207,710 | ||||||||||||
|
Affiliates
|
4,870 | 4,892 | 280 | - | (10,042 | ) | - | |||||||||||||||||
|
Total
|
164,649 | 34,417 | 9,924 | 8,762 | (10,042 | ) | 207,710 | |||||||||||||||||
|
Capture
revenues:
|
||||||||||||||||||||||||
|
Unaffiliated
customers
|
47,911 | 22,818 | 5,045 | 1,229 | - | 77,003 | ||||||||||||||||||
|
Affiliates
|
6,752 | 2,965 | - | - | (9,717 | ) | - | |||||||||||||||||
|
Total
|
54,663 | 25,783 | 5,045 | 1,229 | (9,717 | ) | 77,003 | |||||||||||||||||
|
Net
instrument revenues:
|
||||||||||||||||||||||||
|
Unaffiliated
customers
|
25,522 | 11,116 | 2,297 | 745 | - | 39,680 | ||||||||||||||||||
|
Affiliates
|
4,326 | 6,537 | - | - | (10,863 | ) | - | |||||||||||||||||
|
Total
|
29,848 | 17,653 | 2,297 | 745 | (10,863 | ) | 39,680 | |||||||||||||||||
|
Net
molecular immunohematology revenues:
|
||||||||||||||||||||||||
|
Unaffiliated
customers
|
3,043 | 1,637 | - | - | - | 4,680 | ||||||||||||||||||
|
Affiliates
|
1,343 | 114 | - | - | (1,457 | ) | - | |||||||||||||||||
|
Total
|
4,386 | 1,751 | - | - | (1,457 | ) | 4,680 | |||||||||||||||||
|
Net
Sales
|
253,546 | 79,604 | 17,266 | 10,736 | (32,079 | ) | 329,073 | |||||||||||||||||
|
Income
from operations
|
105,447 | 9,698 | 8,186 | 1,596 | 415 | 125,342 | ||||||||||||||||||
|
Depreciation
|
7,879 | 3,956 | 328 | 128 | - | 12,291 | ||||||||||||||||||
|
Amortization
|
4,034 | 162 | - | 82 | - | 4,278 | ||||||||||||||||||
|
Income
tax expense
|
36,271 | 3,214 | 2,879 | - | 265 | 42,629 | ||||||||||||||||||
|
Interest
income
|
221 | 177 | 55 | 1 | - | 454 | ||||||||||||||||||
|
Capital
expenditures
|
5,753 | 361 | 148 | 42 | - | 6,304 | ||||||||||||||||||
|
Property
& equipment, net
|
36,334 | 10,945 | 1,595 | 295 | - | 49,169 | ||||||||||||||||||
|
Goodwill
|
73,881 | 6,235 | 8,360 | 5,860 | - | 94,336 | ||||||||||||||||||
|
Total
assets at period end
|
594,005 | 69,151 | 31,265 | 20,072 | (194,659 | ) | 519,834 | |||||||||||||||||
59
|
For
the Year Ended May 31, 2009
|
||||||||||||||||||||||||
|
U.S.
|
Europe
|
Canada
|
Japan
|
Elims
|
Consolidated
|
|||||||||||||||||||
|
Traditional
reagent revenues:
|
||||||||||||||||||||||||
|
Unaffiliated
customers
|
$ | 155,610 | $ | 26,445 | $ | 8,826 | $ | 8,396 | $ | - | $ | 199,277 | ||||||||||||
|
Affiliates
|
5,355 | 4,286 | 371 | - | (10,012 | ) | - | |||||||||||||||||
|
Total
|
160,965 | 30,731 | 9,197 | 8,396 | (10,012 | ) | 199,277 | |||||||||||||||||
|
Capture
revenues:
|
||||||||||||||||||||||||
|
Unaffiliated
customers
|
39,276 | 20,793 | 3,246 | 830 | - | 64,145 | ||||||||||||||||||
|
Affiliates
|
6,786 | 2,837 | - | - | (9,623 | ) | - | |||||||||||||||||
|
Total
|
46,062 | 23,630 | 3,246 | 830 | (9,623 | ) | 64,145 | |||||||||||||||||
|
Net
instrument revenues:
|
||||||||||||||||||||||||
|
Unaffiliated
customers
|
22,887 | 9,414 | 1,736 | 635 | - | 34,672 | ||||||||||||||||||
|
Affiliates
|
5,342 | 6,892 | - | - | (12,234 | ) | - | |||||||||||||||||
|
Total
|
28,229 | 16,306 | 1,736 | 635 | (12,234 | ) | 34,672 | |||||||||||||||||
|
Net
molecular immunohematology revenues:
|
||||||||||||||||||||||||
|
Unaffiliated
customers
|
2,303 | 150 | - | - | - | 2,453 | ||||||||||||||||||
|
Affiliates
|
224 | 8 | - | - | (232 | ) | - | |||||||||||||||||
|
Total
|
2,527 | 158 | - | - | (232 | ) | 2,453 | |||||||||||||||||
|
Net
Sales
|
237,783 | 70,825 | 14,179 | 9,861 | (32,101 | ) | 300,547 | |||||||||||||||||
|
Income
(loss) from operations
|
108,691 | 3,292 | 5,146 | 288 | (459 | ) | 116,958 | |||||||||||||||||
|
Depreciation
|
5,623 | 3,537 | 234 | 173 | - | 9,567 | ||||||||||||||||||
|
Amortization
|
3,386 | 277 | - | 76 | - | 3,739 | ||||||||||||||||||
|
Income
tax (benefit) expense
|
36,818 | 2,130 | 1,997 | - | (147 | ) | 40,798 | |||||||||||||||||
|
Interest
income
|
921 | 833 | 199 | 4 | - | 1,957 | ||||||||||||||||||
|
Capital
expenditures
|
3,253 | 4,701 | 599 | 49 | - | 8,602 | ||||||||||||||||||
|
Property
& equipment, net
|
30,625 | 10,855 | 1,699 | 282 | - | 43,461 | ||||||||||||||||||
|
Goodwill
|
76,586 | 7,089 | 7,981 | 5,599 | - | 97,255 | ||||||||||||||||||
|
Total
assets at period end
|
524,397 | 70,979 | 24,706 | 17,901 | (186,643 | ) | 451,340 | |||||||||||||||||
60
|
For
the Year Ended May 31, 2008
|
||||||||||||||||||||||||
|
U.S.
|
Europe
|
Canada
|
Japan
|
Elims
|
Consolidated
|
|||||||||||||||||||
|
Traditional
reagent revenues:
|
||||||||||||||||||||||||
|
Unaffiliated
customers
|
$ | 137,389 | $ | 24,188 | $ | 9,726 | $ | 7,785 | $ | - | $ | 179,088 | ||||||||||||
|
Affiliates
|
5,689 | 3,720 | 297 | - | (9,706 | ) | - | |||||||||||||||||
|
Total
|
143,078 | 27,908 | 10,023 | 7,785 | (9,706 | ) | 179,088 | |||||||||||||||||
|
Capture
revenues:
|
||||||||||||||||||||||||
|
Unaffiliated
customers
|
33,979 | 15,766 | 3,105 | 522 | - | 53,372 | ||||||||||||||||||
|
Affiliates
|
6,763 | 2,371 | - | - | (9,134 | ) | - | |||||||||||||||||
|
Total
|
40,742 | 18,137 | 3,105 | 522 | (9,134 | ) | 53,372 | |||||||||||||||||
|
Net
instrument revenues:
|
||||||||||||||||||||||||
|
Unaffiliated
customers
|
16,452 | 8,519 | 1,583 | 488 | - | 27,042 | ||||||||||||||||||
|
Affiliates
|
2,724 | 3,789 | - | - | (6,513 | ) | - | |||||||||||||||||
|
Total
|
19,176 | 12,308 | 1,583 | 488 | (6,513 | ) | 27,042 | |||||||||||||||||
|
Net
collagen revenues:
|
||||||||||||||||||||||||
|
Unaffiliated
customers
|
1,697 | - | - | - | - | 1,697 | ||||||||||||||||||
|
Affiliates
|
- | - | - | - | - | - | ||||||||||||||||||
|
Total
|
1,697 | - | - | - | - | 1,697 | ||||||||||||||||||
|
Net
Sales
|
204,693 | 58,353 | 14,711 | 8,795 | (25,353 | ) | 261,199 | |||||||||||||||||
|
Income
(loss) from operations
|
99,708 | 2,332 | 5,848 | (240 | ) | 95 | 107,743 | |||||||||||||||||
|
Depreciation
|
4,235 | 3,513 | 211 | 61 | - | 8,020 | ||||||||||||||||||
|
Amortization
|
289 | - | - | 67 | - | 356 | ||||||||||||||||||
|
Restructuring
expenses
|
646 | - | - | - | - | 646 | ||||||||||||||||||
|
Income
tax expense
|
35,990 | 2,098 | 2,091 | - | 35 | 40,214 | ||||||||||||||||||
|
Interest
income
|
3,182 | 851 | 227 | 3 | - | 4,263 | ||||||||||||||||||
|
Capital
expenditures
|
6,298 | 4,924 | 260 | 91 | - | 11,573 | ||||||||||||||||||
|
Property
& equipment, net
|
24,429 | 10,130 | 1,434 | 433 | - | 36,426 | ||||||||||||||||||
|
Goodwill
|
17,803 | 5,077 | 8,804 | 5,074 | - | 36,758 | ||||||||||||||||||
|
Total
assets at period end
|
315,921 | 62,390 | 22,824 | 16,917 | (53,102 | ) | 364,950 | |||||||||||||||||
The
Company had net export sales to unaffiliated customers (in
thousands):
|
For
the Year Ended May 31,
|
||||||||||||
|
2010
|
2009
|
2008
|
||||||||||
|
(In
thousands)
|
||||||||||||
|
United
States
|
$ | 5,378 | $ | 5,036 | $ | 6,254 | ||||||
|
Germany
|
5,947 | 5,657 | 6,734 | |||||||||
|
Canada
|
2,073 | 1,794 | 1,873 | |||||||||
|
Total
net export sales
|
$ | 13,398 | $ | 12,486 | $ | 14,861 | ||||||
|
15.
|
RETIREMENT
PLAN
|
The
Company maintains a 401(k) retirement plan covering its U.S. employees who meet
the plan requirements. The Company matches a portion of employee
contributions, which vest immediately. During the years ended May 31,
2010, 2009 and 2008, the Company’s matching contributions to the plan were
approximately $0.9 million, $0.8 million and $0.7 million,
respectively.
61
The
Company’s Canadian affiliate maintains a defined contribution pension plan
covering all Canadian employees, except temporary employees. The
Company matches a portion of employee contributions to the plan, and each
employee vests in the Company’s matching contributions once they have been a
participant continuously for two years. During each of the years
ended May 31, 2010, 2009 and 2008, the Company’s matching contributions to the
plan remained constant at approximately $0.1 million.
|
16.
|
COMMITMENTS
AND CONTINGENCIES
|
Lease
Commitments
In the
United States, the Company leases office, warehousing and manufacturing
facilities under several operating lease agreements expiring at various dates
through fiscal 2017 with a right to renew for an additional term in the case of
most of the leases. Outside the United States, the Company leases foreign office
and warehouse facilities under operating lease agreements expiring at various
dates through fiscal 2017. The total leasing expense for the Company was $3.8
million in fiscal 2010, $3.7 million in fiscal 2009 and $3.2 million in fiscal
2008.
The
following is a schedule of approximate future annual lease payments under all
operating leases that have initial or remaining non-cancelable lease terms as of
May 31, 2010 (in thousands):
|
Year
Ending May 31:
|
||||
|
2010
|
$ | 3,063 | ||
|
2011
|
$ | 2,717 | ||
|
2012
|
$ | 2,410 | ||
|
2013
|
$ | 2,116 | ||
|
2014
|
$ | 2,022 | ||
|
Thereafter
|
$ | 2,166 | ||
| $ | 14,494 | |||
Contingencies
In
October 2007, we reported that the Federal Trade Commission (“FTC”) was
investigating whether Immucor violated federal antitrust laws or engaged in
unfair methods of competition through three acquisitions made in the period from
1996 through 1999, and whether Immucor or others engaged in unfair methods of
competition by restricting price competition. The FTC letter
requested that we provide certain documents and information to the FTC
concerning those acquisitions and concerning our product pricing activities
since then. In July 2008, the FTC formalized its document and
information requests into a Civil Investigative Demand (“CID”) and also required
us to provide certain additional information within the same general scope of
its previous requests. The FTC has also required that we provide to them the
documents we provide to the Department of Justice (see below). We have been
cooperating with the FTC and we intend to continue cooperating, and we are
assured that the issuance of a formal CID does not indicate any dissatisfaction
with our cooperation. As was previously the case, at this time we cannot
reasonably assess the timing or outcome of the investigation or its effect, if
any, on our business.
In April
2009, we received a subpoena from the United States Department of Justice,
Antitrust Division (“DOJ”), requiring us to produce documents for the period
beginning September 1, 2000 through April 23, 2009, pertaining to an
investigation of possible violations of the federal criminal antitrust laws in
the blood reagents industry. We have been cooperating with the DOJ and we intend
to continue cooperating. At this time we cannot reasonably assess the timing or
outcome of the investigation or its effect, if any, on our
business.
Beginning
in May 2009, a series of class action lawsuits has been filed against the
Company, Ortho-Clinical Diagnostics, Inc. and Johnson & Johnson Health Care
Systems, Inc. alleging that the defendants conspired to fix prices at which
blood reagents are sold, asserting claims under Section 1 of the Sherman Act,
and seeking declaratory and injunctive relief, treble damages, costs, and
attorneys’ fees. These cases are identified in Exhibit 99.1 of the fiscal 2010
Form 10-K. All of these complaints make substantially the same allegations. The
cases have been consolidated in the United States District Court for the Eastern
District of Pennsylvania. There has been no discovery and no
determination has been made whether any of the plaintiffs’ claims have merit or
should be allowed to proceed as a class action. We intend to vigorously defend
against these cases. At this time we cannot reasonably assess the timing or
outcome of this litigation or its effect, if any, on our business.
62
Private
securities litigation in the United States District Court of North Georgia
against the Company and certain of its current and former directors and officers
asserts federal securities fraud claims on behalf of a putative class of
purchasers of the Company's Common Stock between October 19, 2005 and June 25,
2009. This case is identified in Exhibit 99.1 of the fiscal 2010 Form 10-K. The
case alleges that the defendants violated Sections 10(b) and 20(a) of the
Securities Exchange Act of 1934, as amended, by failing to disclose that Immucor
had violated the antitrust laws, and challenges the sufficiency of the Company’s
disclosures about the results of FDA inspections and the Company’s quality
control efforts. There has been no discovery and no determination has been made
whether any of the plaintiffs’ claims have merit or should be allowed to proceed
as a class action. The Company will defend the case vigorously. At this time,
the Company cannot reasonably assess the timing or outcome of this litigation or
its effect, if any, on its business.
Other
than as set forth above, we are not currently subject to any material legal
proceedings, nor, to our knowledge, is any material legal proceeding threatened
against us. However, from time to time, we may become a party to
certain legal proceedings in the ordinary course of business.
|
17.
|
SELECTED
QUARTERLY FINANCIAL DATA
(UNAUDITED)
|
|
(In
thousands, except per share amounts)
|
||||||||||||||||||||||||
|
Earnings
Per
|
||||||||||||||||||||||||
|
|
Income
|
Earnings
|
Common
Share -
|
|||||||||||||||||||||
|
Fiscal
Year
|
Net
|
Gross
|
from
|
Net
|
Per
Common
|
Assuming
|
||||||||||||||||||
|
Ended
|
Sales
|
Profit
|
Operations
|
Income
|
Share
|
Dilution
|
||||||||||||||||||
|
May
31, 2010
|
||||||||||||||||||||||||
|
First
Quarter
|
$ | 83,071 | $ | 59,689 | $ | 33,342 | $ | 21,333 | $ | 0.30 | $ | 0.30 | ||||||||||||
|
Second
Quarter
|
82,570 | 58,139 | 30,662 | 19,702 | $ | 0.28 | $ | 0.28 | ||||||||||||||||
|
Third
Quarter
|
80,499 | 55,714 | 30,874 | 20,061 | $ | 0.29 | $ | 0.28 | ||||||||||||||||
|
Fourth
Quarter
|
82,933 | 60,182 | 30,464 | 21,487 | $ | 0.31 | $ | 0.30 | ||||||||||||||||
| $ | 329,073 | $ | 233,724 | $ | 125,342 | $ | 82,583 | $ | 1.18 | $ | 1.17 | |||||||||||||
|
May
31, 2009
|
||||||||||||||||||||||||
|
First
Quarter
|
$ | 73,176 | $ | 53,425 | $ | 30,625 | $ | 19,956 | $ | 0.28 | $ | 0.28 | ||||||||||||
|
Second
Quarter
|
73,021 | 53,558 | 27,862 | 17,338 | $ | 0.25 | $ | 0.24 | ||||||||||||||||
|
Third
Quarter
|
75,309 | 53,789 | 29,298 | 19,457 | $ | 0.28 | $ | 0.27 | ||||||||||||||||
|
Fourth
Quarter
|
79,041 | 55,239 | 29,173 | 19,432 | $ | 0.28 | $ | 0.27 | ||||||||||||||||
| $ | 300,547 | $ | 216,011 | $ | 116,958 | $ | 76,183 | $ | 1.08 | $ | 1.07 | |||||||||||||
The sum
of the quarterly amounts of earnings per common share and diluted earnings per
common share for the fiscal years ended May 31, 2010 and 2009 is different than
the total due to rounding.
63
Item 8. — Financial Statements and Supplementary Data (Continued).
|
B.
|
Supplementary
Financial Information
|
Consolidated
Financial Statement Schedule
Schedule
II – Valuation and Qualifying Accounts
Years
ended May 31, 2010, 2009 and 2008
|
Beginning
Balance
|
Additions
to Expense
|
Deductions
|
Ending
Balance
|
|||||||||||||
|
2010
|
||||||||||||||||
|
Allowance
for doubtful accounts
|
$ | 2,179 | $ | 361 | $ | (418 | ) | $ | 2,122 | |||||||
|
Deferred
income tax valuation allowance
|
$ | 6,134 | $ | 582 | $ | - | $ | 6,716 | ||||||||
|
2009
|
||||||||||||||||
|
Allowance
for doubtful accounts
|
$ | 2,024 | $ | 848 | $ | (693 | ) | $ | 2,179 | |||||||
|
Deferred
income tax valuation allowance
|
$ | 3,042 | $ | 3,092 | $ | - | $ | 6,134 | ||||||||
|
2008
|
||||||||||||||||
|
Allowance
for doubtful accounts
|
$ | 1,726 | $ | 423 | $ | (125 | ) | $ | 2,024 | |||||||
|
Provision
for restructuring expense
|
$ | 443 | $ | - | $ | (443 | ) | $ | - | |||||||
|
Deferred
income tax valuation allowance
|
$ | 2,644 | $ | 398 | $ | - | $ | 3,042 | ||||||||
|
Note
1:
|
“Deductions”
for the “Allowance for doubtful accounts” represent accounts written off
during the period less recoveries of accounts previously written off and
exchange differences generated.
|
Item
9. — Changes in and Disagreements with Accountants on Accounting and Financial
Disclosure.
Not
applicable.
Item
9A. — Controls and Procedures.
(a)
Evaluation of Disclosure Controls and Procedures
The
Company, under the supervision and with the participation of its management,
including the Chief Executive Officer and the Chief Financial Officer, evaluated
the effectiveness of the design and operation of the Company’s “disclosure
controls and procedures” (as defined in Rule 13a-15(e) promulgated under the
Securities Exchange Act of 1934, as amended (the “Exchange Act”)).
Based on
their evaluation as of May 31, 2010, the Chief Executive Officer and Chief
Financial Officer have concluded that the Company’s disclosure controls and
procedures are effective to ensure that the information required to be disclosed
by the Company in the reports that it files or submits under the Exchange Act is
recorded, processed, summarized and reported within the time periods specified
in SEC rules and forms and that such information is accumulated and communicated
to our management, including our Chief Executive Officer and Chief Financial
Officer, as appropriate, to allow timely decisions regarding required
disclosures.
(b)
Changes in Internal Control
There
were no changes in our internal control over financial reporting during the
quarter ended May 31, 2010 that have materially affected, or are reasonably
likely to materially affect our internal control over financial
reporting.
64
(c) Management’s Report on Internal Control over Financial Reporting
The
management of Immucor is responsible for establishing and maintaining adequate
internal control over financial reporting, as such is defined in Rules 13a-15(f)
promulgated under the Securities Exchange Act of 1934, as amended, and for
performing an assessment of the effectiveness of internal control over financial
reporting as of May 31, 2010. The Company’s internal control over financial
reporting is a process that is designed to provide reasonable assurance
regarding the reliability of financial reporting and the preparation of
financial statements for external purposes in accordance with generally accepted
accounting principles.
Internal
control systems, no matter how well designed, have inherent limitations.
Therefore, even those systems determined to be effective can provide only
reasonable assurance with respect to financial statement preparation and
presentation, and may not prevent or detect misstatements. In addition,
projections of any evaluation of effectiveness to future periods are subject to
risks that controls may become inadequate because of changes in conditions, or
that the degree of compliance with policies or procedures may
deteriorate.
Immucor’s
management performed an assessment of the effectiveness of the Company’s
internal control over financial reporting as of May 31, 2010, using the
criteria described in “Internal Control—Integrated Framework” issued by the
Committee of Sponsoring Organizations of the Treadway Commission (“COSO”). The
objective of this assessment is to determine whether the Company’s internal
control over financial reporting was effective as of May 31, 2010.
Immucor’s management has concluded that, as of May 31, 2010, its internal
control over financial reporting was effective to provide reasonable assurance
regarding the reliability of its financial reporting and the preparation of its
financial statements for external purposes in accordance with United States
generally accepted accounting principles.
Grant
Thornton LLP, the Company’s Independent Registered Public Accounting Firm, has
issued an attestation report on the effectiveness of the Company’s internal
control over financial reporting. It appears in Item 8 immediately before the
Consolidated Financial Statements.
|
/s/ Dr. Gioacchino
DeChirico
|
/s/ Richard A. Flynt
|
||||||||
|
|
|||||||||
|
Dr.
Gioacchino DeChirico
|
Richard
A. Flynt
|
||||||||
|
President
and Chief Executive Officer
|
Vice
President —
Chief
Financial Officer
|
Item
9B. — Other Information.
Not
applicable.
PART
III
We will
file a definitive Proxy Statement for our 2010 Annual Meeting of Shareholders
with the SEC, pursuant to Regulation 14A, not later than 120 days after the end
of our fiscal year. Accordingly, certain information required by Part III has
been omitted under General Instruction G (3) to Form 10-K. Only those sections
of our definitive Proxy Statement that specifically address the items set forth
herein are incorporated by reference.
65
Item
10. — Directors, Executive Officers and Corporate Governance.
The
information required by Item 10 is hereby incorporated by reference from
the Company’s definitive Proxy Statement relating to the Company’s 2010 Annual
Meeting of Shareholders, to be filed with the Securities and Exchange Commission
within 120 days following the end of the Company’s fiscal year.
Item
11. — Executive Compensation.
The
information required by Item 11 is hereby incorporated by reference from
the Company’s definitive Proxy Statement relating to the Company’s 2010 Annual
Meeting of Shareholders, to be filed with the Securities and Exchange Commission
within 120 days following the end of the Company’s fiscal year.
Item
12. — Security Ownership of Certain Beneficial Owners and Management and Related
Stockholder Matters.
The
information required by Item 12 is hereby incorporated by reference from
the Company’s definitive Proxy Statement relating to the Company’s 2010 Annual
Meeting of Shareholders, to be filed with the Securities and Exchange Commission
within 120 days following the end of the Company’s fiscal year.
Item
13. — Certain Relationships and Related Transactions, and Director
Independence.
The
information required by Item 13 is hereby incorporated by reference from
the Company’s definitive Proxy Statement relating to the Company’s 2010 Annual
Meeting of Shareholders, to be filed with the Securities and Exchange Commission
within 120 days following the end of the Company’s fiscal year.
Item
14. — Principal Accountant Fees and Services.
The
information required by Item 14 is hereby incorporated by reference from
the Company’s definitive Proxy Statement relating to the Company’s 2010 Annual
Meeting of Shareholders, to be filed with the Securities and Exchange Commission
within 120 days following the end of the Company’s fiscal year.
PART
IV
Item
15. — Exhibits and Financial Statement Schedules.
|
(a)
|
Documents
filed as part of this report:
|
|
1.
|
Consolidated
Financial Statements.
|
The
Consolidated Financial Statements, Notes thereto, and Report of Independent
Registered Public Accounting Firm thereon are included in Part II, Item 8 of
this report.
|
2.
|
Consolidated
Financial Statement Schedule included in Part II, Item 8 of this
report.
|
Schedule
II — Valuation and Qualifying Accounts.
Other
financial statement schedules are omitted as they are not required or not
applicable.
|
3.
|
Exhibits.
|
See Item
15(b) below.
66
(b) Exhibits
The
following exhibits are filed as part of this report or hereby incorporated by
reference to exhibits previously filed with the SEC:
|
|
2.1
|
Agreement
of Plan and Merger by and among the Company, Merger Sub and BioArray dated
March 11, 2008 (incorporated by reference to Exhibit 2.1 to Immucor,
Inc.’s Current Report on Form 8-K
filed on March 17, 2008).
|
|
|
3.1
|
Amended
and Restated Articles of Incorporation dated September 7, 2006
(incorporated by reference to Exhibit 3.1 to Immucor, Inc.’s Quarterly
Report on Form 10-Q filed on January 5,
2007).
|
|
|
3.2
|
Amended
and Restated Bylaws (incorporated by reference to Exhibit 3.2 to Immucor,
Inc.’s quarterly report on Form 10-Q filed on October 4,
2008).
|
|
|
4.1
|
Amended
and Restated Shareholder Rights Agreement dated as of November 20, 2001
between Immucor, Inc. and Computershare Trust Company, N.A. (as successor
for EquiServe Trust Company, N.A.), as Rights Agent (incorporated by
reference to Exhibit 4.1 to Immucor, Inc.’s quarterly report on Form 10-Q
filed on January 14, 2002).
|
|
|
4.2
|
Amendment
No. 1, dated January 27, 2009, to the Amended and Restated Shareholder
Rights Agreement, dated as of November 20, 2001, between Immucor, Inc. and
Computershare Trust Company, N.A. (as successor for EquiServe Trust
Company, N.A.), as Rights Agent (incorporated by reference to Exhibit 4.2
to Immucor, Inc.’s Current Report on Form 8-K filed with the Securities
and Exchange Commission on January 30,
2009).
|
|
|
10.1
|
Standard
Industrial Lease, dated July 21, 1982, between the Company and Colony
Center, Ltd. (incorporated by reference to Exhibit 10.2 to Immucor, Inc.’s
Annual Report on Form 10-K for the fiscal year ended May 31,
1985).
|
|
|
10.1-1
|
Lease
Amendment dated June 28, 1989, between the Company and Colony Center, Ltd.
(incorporated by reference to Exhibit 10.1-1 to Immucor, Inc.’s Annual
Report on Form 10-K for the fiscal year ended May 31,
1989).
|
|
|
10.1-2
|
Lease
Amendment dated November 8, 1991, between the Company and Colony Center,
Ltd. (incorporated by reference to Exhibit 10.1-1 to Immucor, Inc.’s
Annual Report on Form 10-K for the fiscal year ended May 31,
1992).
|
|
|
10.1-3
|
Lease
Agreement, dated February 2, 1996, between the Company and Connecticut
General Life Insurance Company (incorporated by reference to Exhibit
10.1-3 to Immucor, Inc.’s Annual Report on Form 10-K for the fiscal year
ended May 31, 1996).
|
|
|
10.1-4
|
Lease
Amendment, dated March 8, 1998, between the Company and Connecticut
General Life Insurance Company (incorporated by reference to Exhibit
10.1-4 to Immucor, Inc.’s Annual Report on Form 10-K for the fiscal year
ended May 31, 1998).
|
|
|
10.1-5
|
Lease
Amendment, dated August 11, 1999, between the Company and Connecticut
General Life Insurance Company (incorporated by reference to Exhibit
10.1-5 to Immucor, Inc.’s Annual Report on Form 10-K for the fiscal year
ended May 31, 1999).
|
|
|
10.1-6
|
Lease
Amendment, dated August 8, 2002, between the Company and Crocker Realty
Trust, L.P., successor in interest to Connecticut General Life Insurance
Company (incorporated by reference to Exhibit 10.1-6 to Immucor, Inc.’s
Annual Report on Form 10-K for the fiscal year ended May 31,
2007).
|
|
|
10.1-7
|
Amended
and Restated Lease Amendment, dated January 18, 2005, between the Company
and AP-Southeast Realty LP, successor by name change to Crocker Realty
Trust, L.P., successor in interest to Connecticut General Life Insurance
Company (incorporated by reference to Exhibit 10.1-7 to Immucor, Inc.’s
Annual Report on Form 10-K for the fiscal year ended May 31,
2007).
|
|
|
10.1-8
|
Lease
Amendment, dated March 31, 2006, between the Company and AP-Southeast
Realty LP, successor by name change to Crocker Realty Trust, L.P.,
successor in interest to Connecticut General Life Insurance Company
(incorporated by reference to Exhibit 10.1-8 to Immucor, Inc.’s Annual
Report on Form 10-K for the fiscal year ended May 31,
2007).
|
|
|
10.1-9
|
Amended
and Restated Office Lease Agreement [2975 Building], dated January 26,
2007, between the Company and Business Park Investors Group, successor in
interest to AP-Southeast Realty LP, successor by name change to Crocker
Realty Trust, L.P., successor in interest to Connecticut General Life
Insurance Company (incorporated by reference to Exhibit 10.1-9 to Immucor,
Inc.’s Annual Report on Form 10-K for the fiscal year ended May 31,
2007).
|
67
|
|
10.1-10
|
Amended
and Restated Office Lease Agreement [2985 Building], dated January 26,
2007, between the Company and Business Park Investors Group, successor in
interest to AP-Southeast Realty LP, successor by name change to Crocker
Realty Trust, L.P., successor in interest to Connecticut General Life
Insurance Company (incorporated by reference to Exhibit 10.1-10 to
Immucor, Inc.’s Annual Report on Form 10-K for the fiscal year ended May
31, 2007).
|
|
|
10.1-11
|
Amended
and Restated Office Lease Agreement [2990 Building], dated January 26,
2007, between the Company and Business Park Investors Group, successor in
interest to AP-Southeast Realty LP, successor by name change to Crocker
Realty Trust, L.P., successor in interest to Connecticut General Life
Insurance Company (incorporated by reference to Exhibit 10.1-11 to
Immucor, Inc.’s Annual Report on Form 10-K for the fiscal year ended May
31, 2007).
|
|
|
10.1-12
|
Amended
and Restated Office Lease Agreement [3130 Building], dated January 26,
2007, between the Company and Business Park Investors Group, successor in
interest to AP-Southeast Realty LP, successor by name change to Crocker
Realty Trust, L.P., successor in interest to Connecticut General Life
Insurance Company (incorporated by reference to Exhibit 10.1-12 to
Immucor, Inc.’s Annual Report on Form 10-K for the fiscal year ended May
31, 2007).
|
|
|
10.1-13
|
Amended
and Restated Office Lease Agreement [3150 Building], dated January 26,
2007, between the Company and Business Park Investors Group, successor in
interest to AP-Southeast Realty LP, successor by name change to Crocker
Realty Trust, L.P., successor in interest to Connecticut General Life
Insurance Company (incorporated by reference to Exhibit 10.1-13 to
Immucor, Inc.’s Annual Report on Form 10-K for the fiscal year ended May
31, 2007).
|
|
|
10.1-14
|
Amended
and Restated Office Lease Agreement [7000 Building], dated January 26,
2007, between the Company and Business Park Investors Group, successor in
interest to AP-Southeast Realty LP, successor by name change to Crocker
Realty Trust, L.P., successor in interest to Connecticut General Life
Insurance Company (incorporated by reference to Exhibit 10.1-14 to
Immucor, Inc.’s Annual Report on Form 10-K for the fiscal year ended May
31, 2007).
|
|
|
10.2
|
Industrial
Multi-Tenant Lease between the Company and AMB Property, L.P., dated
December 29, 2005 (incorporated by reference to Exhibit 10.2 to Immucor,
Inc.’s Annual Report on Form 10-K for the fiscal year ended May 31,
2007).
|
|
|
10.3
|
United
States Department of Health and Human Services Establishment License dated
December 28, 1982, for the manufacture of biological products
(incorporated by reference to Exhibit 10.12 to Registration Statement No.
33-966 on Form S-1).
|
|
|
10.4
|
United
States Department of Health and Human Services Product License dated
December 28, 1982, for the manufacture and sale of reagent red blood cells
(incorporated by reference to Exhibit 10.13 to Registration Statement No.
33-966 on Form S-1).
|
|
|
10.5
|
United
States Department of Health and Human Services Product License dated May
20, 1983, for the manufacture and sale of blood grouping sera
(incorporated by reference to Exhibit 10.14 to Registration Statement No.
33-966 on Form S-1).
|
|
|
10.6
|
United
States Department of Health and Human Services Product License date
November 18, 1983, for the manufacture and sale of anti-human serum
(incorporated by reference to Exhibit 10.15 to Registration Statement No.
33-966 on Form S-1).
|
|
|
10.7*
|
Immucor,
Inc. 2005 Long-Term Incentive Plan (incorporated by reference to Exhibit
4.2 to Immucor, Inc.’s Registration Statement No. 333-131902 filed on
April 5, 2006).
|
|
|
10.8*
|
2003
Stock Option Plan (incorporated by reference to Exhibit 10.8 to Immucor,
Inc.’s Annual Report on Form 10-K filed on August 16,
2004).
|
68
|
|
10.8-1*
|
Amended
and Restated 2003 Stock Option Plan, amended and restated as of November
10, 2004 (incorporated by reference to Exhibit 10.8-1 to Immucor, Inc’s
Annual Report on Form 10-K filed on October 19, 2005).
|
|
|
10.9*
|
Amended
and Restated 1998 Stock Option Plan (incorporated by reference to Exhibit
10.9 to Immucor, Inc.’s Annual Report on Form 10-K filed on August 16,
2004).
|
|
|
10.10*
|
1990
Stock Option Plan, including form of Stock Option Agreement used
thereunder (incorporated by reference to Exhibit 10.15 to Immucor, Inc.’s
Annual Report on Form 10-K for the fiscal year ended May 31,
1995).
|
|
|
10.11*
|
Form
of indemnification agreement between the Company and certain directors
(incorporated by reference to Exhibit 10.22 to Immucor, Inc.’s quarterly
report on Form 10-Q filed January 14, 2002).
|
|
|
10.12
|
Loan
Agreement among Immucor, Inc., as borrower, and SunTrust Bank, as lender,
dated as of December 18, 2003 (incorporated by reference to Exhibit 10.1
to Immucor, Inc.’s quarterly report on Form 10-Q filed on April 14,
2004).
|
|
|
10.13*
|
Employment
Agreement, dated December 1, 2003, by and between the Company and
Gioacchino De Chirico (incorporated by reference to Exhibit 10.21/A to
Immucor, Inc.’s amended Annual Report on Form 10-K/A filed on December 6,
2006).
|
|
|
10.13-1*
|
Amendment
No. 1 to Employment Agreement, dated May 1, 2004, by and between the
Company and Dr. Gioacchino De Chirico (incorporated by reference to
Exhibit 10.22 to Immucor, Inc.’s Annual Report on Form 10-K filed on
August 16, 2004).
|
|
|
10.13-2*
|
Amendment
to Employment Agreement, dated June 1, 2007, by and between the Company
and Dr. Gioacchino De Chirico (incorporated by reference to Exhibit 10.2
to Immucor, Inc.’s Current Report on Form 8-K filed on June 25,
2007).
|
|
|
10.14*
|
Employment
Agreement dated April 1, 2007, between the Company and Philip H. Moïse
(incorporated by reference to Exhibit 10.1 to Immucor, Inc.’s Quarterly
Report on Form 10-Q filed on April 5,
2007).
|
|
|
10.15*
|
Employment
Agreement by and between the Company and Richard A. Flynt, effective
December 10, 2007 (incorporated by reference to Exhibit 10.1 to Immucor,
Inc.’s Current Report on Form 8-K filed on November 21,
2007).
|
|
|
10.16*
|
Employment
Agreement by and between the Company and Geoffrey S. Crouse, effective
August 3, 2009 (incorporated by reference to Exhibit 10.1 to Immucor,
Inc.’s Current Report on Form 8-K filed on July 16,
2009).
|
|
|
10.17*
|
Fiscal
Year 2009 Bonus Plan and Fiscal Year 2008 Long-Term Incentive Awards Plan
(incorporated by reference to Immucor, Inc.’s Current Report on Form 8-K
filed on May 28, 2008).
|
|
|
10.18*
|
Fiscal
Year 2010 Bonus and Long-Term Incentive Plan (incorporated by reference to
Immucor, Inc.’s Current Report on Form 8-K filed on June 10,
2009).
|
|
|
21**
|
Subsidiaries
of the Registrant.
|
|
|
23.1**
|
Consent
of Grant Thornton LLP, Independent Registered Public Accounting
Firm.
|
|
|
31.1**
|
Certification
of Principal Executive Officer Pursuant to Rule
13a-14(a).
|
|
|
31.2**
|
Certification
of Principal Financial Officer Pursuant to Rule 13a-14(a).
|
|
|
32.1**
|
Certification
of Chief Executive Officer Pursuant to Section 906 of the Sarbanes-Oxley
Act of 2002.
|
|
|
32.2**
|
Certification
of Chief Financial Officer Pursuant to Section 906 of the Sarbanes-Oxley
Act of 2002.
|
|
|
99.1**
|
Summary
of Lawsuits
|
|
|
*
|
Denotes
a management contract or compensatory plan or
arrangement.
|
|
|
**
|
Filed
or furnished herewith
|
69
(c) Financial Statement Schedule
No
financial statement schedules are filed herewith because (1) such schedules
are not required or (2) the information has been presented in Item 8 of
this annual report on Form 10-K.
SIGNATURES
Pursuant
to the requirements of Section 13 or 15(d) of the Securities Exchange Act of
1934, the registrant has duly caused this report to be signed on its behalf by
the undersigned, thereunto duly authorized.
IMMUCOR,
INC.
By: /s/ Dr. GIOACCHINO DE
CHIRICO
|
|
Dr.
Gioacchino De Chirico, President and Chief Executive
Officer
|
|
|
(Principal
Executive Officer)
|
|
|
July
23, 2010
|
Pursuant
to the requirements of the Securities Exchange Act of 1934, this report has been
signed below by the following persons on behalf of the registrant and in the
capacities and on the dates indicated.
/s/ Dr. Gioacchino De
Chirico
|
Dr.
Gioacchino De Chirico, President and Chief Executive
Officer
|
(Principal
Executive Officer)
July 23,
2010
/s/ Richard A.
Flynt
Richard
A. Flynt, Vice President - Chief Financial Officer
(Principal
Financial and Accounting Officer)
July 23,
2010
/s/ James
Clouser
James
Clouser, Director
July 23,
2010
/s/ Paul
Holland
Paul
Holland, Director
July 23,
2010
/s/ Ronny
Lancaster
Ronny
Lancaster, Director
July 23,
2010
/s/ Paul
Mintz
Paul
Mintz, Director
July 23,
2010
/s/ Chris
Perkins
Chris
Perkins, Director
July 23,
2010
/s/ Joseph E.
Rosen
Joseph E.
Rosen, Director
July 23,
2010
70
EXHIBIT INDEX
Number Description
|
|
21
|
Subsidiaries
of the Registrant.
|
|
|
23.1
|
Consent
of Grant Thornton LLP, Independent Registered Public Accounting
Firm.
|
|
|
31.1
|
Certification
of Principal Executive Officer Pursuant to Rule
13a-14(a).
|
|
|
31.2
|
Certification
of Principal Financial Officer Pursuant to Rule 13a-14(a).
|
|
|
32.1
|
Certification
of Chief Executive Officer Pursuant to Section 906 of the Sarbanes-Oxley
Act of 2002.
|
|
|
32.2
|
Certification
of Chief Financial Officer Pursuant to Section 906 of the Sarbanes-Oxley
Act of 2002.
|
|
|
99.1
|
Summary
of Lawsuits
|
71