Attached files
| file | filename |
|---|---|
| 8-K - 8-K - Federal Home Loan Bank of Boston | a10-14409_18k.htm |
| EX-99.1 - EX-99.1 - Federal Home Loan Bank of Boston | a10-14409_1ex99d1.htm |
Exhibit 99.2
|
|
Member Outreach Meeting July 22, 2010 Edward A. Hjerpe III - President and Chief Executive Officer M. Susan Elliott - Executive Vice President and Chief Business Officer George H. Collins - Senior Vice President and Chief Risk Officer |
|
|
1 Cautionary Statements Regarding Forward-Looking Statements, Data, and Adjusted Information Forward-looking statements: This presentation, including the second quarter 2010 highlights herein, uses forward-looking statements within the meaning of the "safe harbor" provisions of the Private Securities Litigation Reform Act of 1995 and are based on the Bank’s expectations as of the date hereof. The words “will,” “assume,” “forecast,” “believe,” “expect,” “looking ahead,” “likely,” and similar statements and their plural, negative, past, and progressive forms as well as statements about the Bank’s operating plan and future plans are used in this notification to identify some, but not all, of such forward-looking statements. The Bank cautions that, by their nature, forward-looking statements involve risks and uncertainties, including, but not limited to, the application of accounting standards relating to, among other things, the amortization of discounts and premiums on financial assets, financial liabilities, and certain fair-value gains and losses; hedge accounting of derivatives and underlying financial instruments; the fair values of financial instruments, including investment securities and derivatives; and other-than-temporary impairment of investment securities, in addition to instability in the credit and debt markets, economic conditions (including effects on, among other things, mortgage-backed securities), changes in interest rates, and prepayment spreads on mortgage assets. The Bank does not undertake to update any forward-looking statement herein or that may be made from time to time on behalf of the Bank. Data: Data set forth herein is unaudited. Data identified herein with a third-party source is provided to you without any independent verification by the Federal Home Loan Bank of Boston, and the Federal Home Loan Bank of Boston expressly disclaims any responsibility for, its accuracy, completeness or whether any additional information is necessary to make such data not materially misleading. Accordingly, you are cautioned against placing any undue reliance on such data. Adjusted information: This presentation uses non-GAAP financial information. Specifically, the Bank adjusts GAAP net income for the impact of (i) Affordable Housing Program and Resolution Funding Corporation assessments and (ii) OTTI charges. Management believes this information may be informative to investors in gauging the Bank’s financial performance, identifying trends, and providing meaningful period-to-period comparisons. |
|
|
Topics Federal Home Loan Bank of Boston Membership Profile New England Bank Performance Second Quarter Results Operating Plan Execution New Solutions Balancing Risk Exposure Looking Ahead 2 For your convenience, a copy of this presentation is available at http://www.fhlbboston.com |
|
|
Federal Home Loan Bank of Boston |
|
|
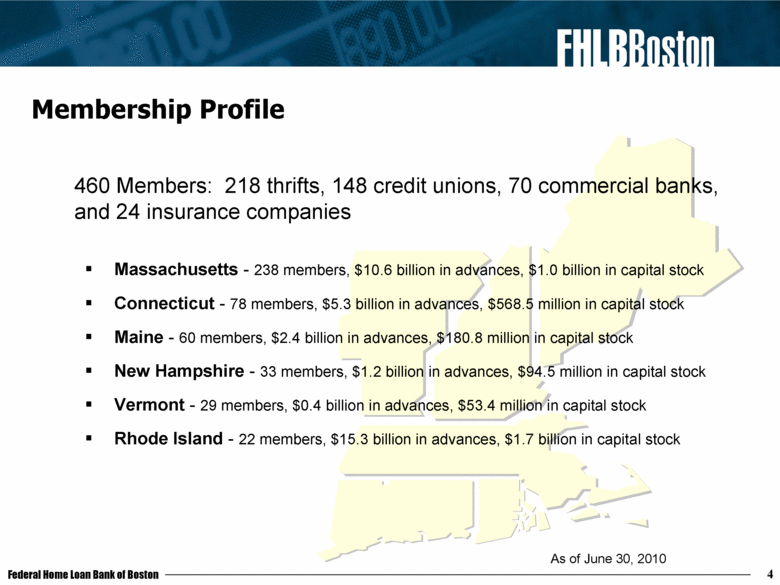
4 Membership Profile Massachusetts - 238 members, $10.6 billion in advances, $1.0 billion in capital stock Connecticut - 78 members, $5.3 billion in advances, $568.5 million in capital stock Maine - 60 members, $2.4 billion in advances, $180.8 million in capital stock New Hampshire - 33 members, $1.2 billion in advances, $94.5 million in capital stock Vermont - 29 members, $0.4 billion in advances, $53.4 million in capital stock Rhode Island - 22 members, $15.3 billion in advances, $1.7 billion in capital stock 460 Members: 218 thrifts, 148 credit unions, 70 commercial banks, and 24 insurance companies As of June 30, 2010 |
|
|
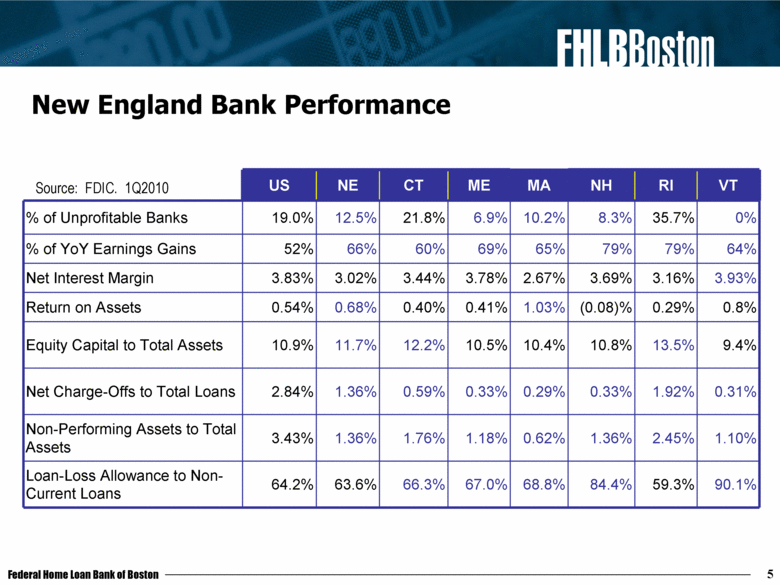
5 New England Bank Performance US NE CT ME MA NH RI VT % of Unprofitable Banks 19.0% 12.5% 21.8% 6.9% 10.2% 8.3% 35.7% 0% % of YoY Earnings Gains 52% 66% 60% 69% 65% 79% 79% 64% Net Interest Margin 3.83% 3.02% 3.44% 3.78% 2.67% 3.69% 3.16% 3.93% Return on Assets 0.54% 0.68% 0.40% 0.41% 1.03% (0.08)% 0.29% 0.8% Equity Capital to Total Assets 10.9% 11.7% 12.2% 10.5% 10.4% 10.8% 13.5% 9.4% Net Charge-Offs to Total Loans 2.84% 1.36% 0.59% 0.33% 0.29% 0.33% 1.92% 0.31% Non-Performing Assets to Total Assets 3.43% 1.36% 1.76% 1.18% 0.62% 1.36% 2.45% 1.10% Loan-Loss Allowance to Non-Current Loans 64.2% 63.6% 66.3% 67.0% 68.8% 84.4% 59.3% 90.1% Source: FDIC. 1Q2010 |
|
|
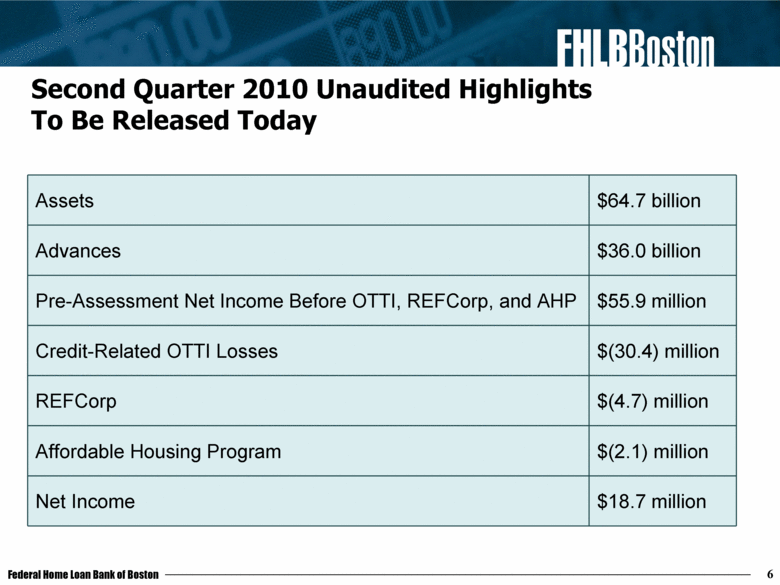
6 Second Quarter 2010 Unaudited Highlights To Be Released Today Assets $64.7 billion Advances $36.0 billion Pre-Assessment Net Income Before OTTI, REFCorp, and AHP $55.9 million Credit-Related OTTI Losses $(30.4) million REFCorp $(4.7) million Affordable Housing Program $(2.1) million Net Income $18.7 million |
|
|
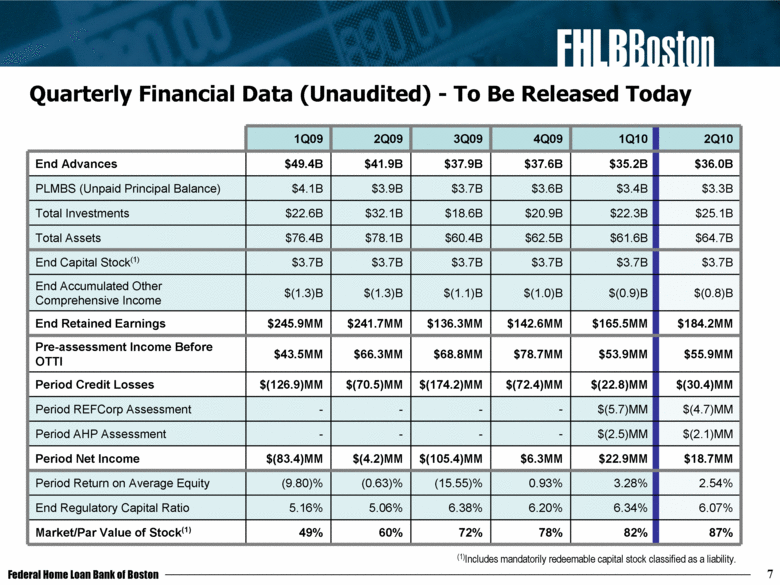
7 Quarterly Financial Data (Unaudited) - To Be Released Today 1Q09 2Q09 3Q09 4Q09 1Q10 2Q10 End Advances $49.4B $41.9B $37.9B $37.6B $35.2B $36.0B PLMBS (Unpaid Principal Balance) $4.1B $3.9B $3.7B $3.6B $3.4B $3.3B Total Investments $22.6B $32.1B $18.6B $20.9B $22.3B $25.1B Total Assets $76.4B $78.1B $60.4B $62.5B $61.6B $64.7B End Capital Stock(1) $3.7B $3.7B $3.7B $3.7B $3.7B $3.7B End Accumulated Other Comprehensive Income $(1.3)B $(1.3)B $(1.1)B $(1.0)B $(0.9)B $(0.8)B End Retained Earnings $245.9MM $241.7MM $136.3MM $142.6MM $165.5MM $184.2MM Pre-assessment Income Before OTTI $43.5MM $66.3MM $68.8MM $78.7MM $53.9MM $55.9MM Period Credit Losses $(126.9)MM $(70.5)MM $(174.2)MM $(72.4)MM $(22.8)MM $(30.4)MM Period REFCorp Assessment - - - - $(5.7)MM $(4.7)MM Period AHP Assessment - - - - $(2.5)MM $(2.1)MM Period Net Income $(83.4)MM $(4.2)MM $(105.4)MM $6.3MM $22.9MM $18.7MM Period Return on Average Equity (9.80)% (0.63)% (15.55)% 0.93% 3.28% 2.54% End Regulatory Capital Ratio 5.16% 5.06% 6.38% 6.20% 6.34% 6.07% Market/Par Value of Stock(1) 49% 60% 72% 78% 82% 87% (1)Includes mandatorily redeemable capital stock classified as a liability. |
|
|
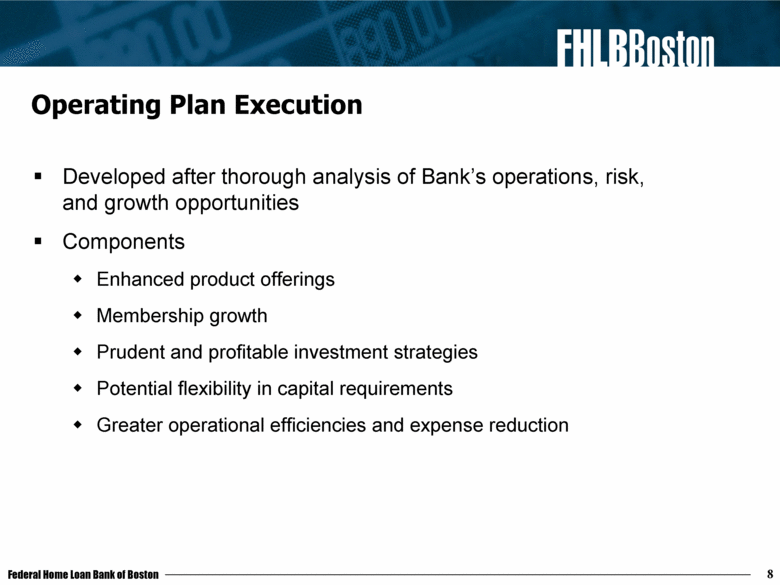
Operating Plan Execution Developed after thorough analysis of Bank’s operations, risk, and growth opportunities Components Enhanced product offerings Membership growth Prudent and profitable investment strategies Potential flexibility in capital requirements Greater operational efficiencies and expense reduction 8 |
|
|
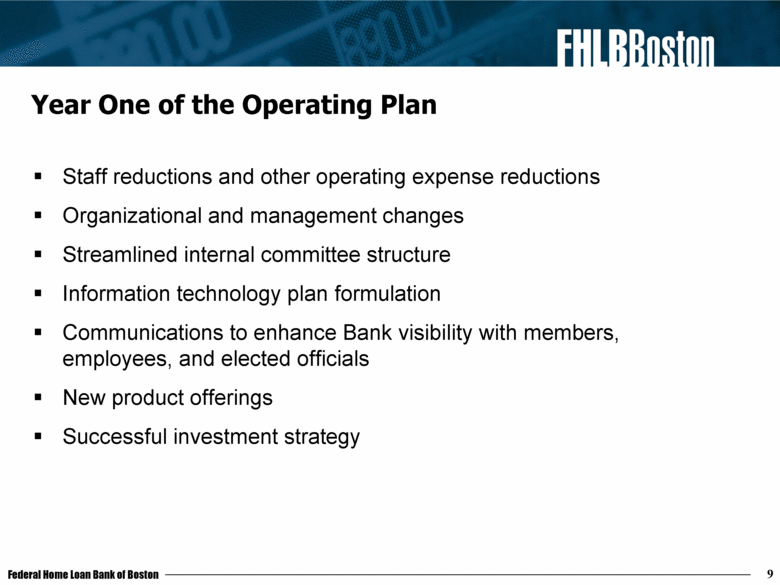
Year One of the Operating Plan Staff reductions and other operating expense reductions Organizational and management changes Streamlined internal committee structure Information technology plan formulation Communications to enhance Bank visibility with members, employees, and elected officials New product offerings Successful investment strategy 9 |
|
|
New Solutions |
|
|
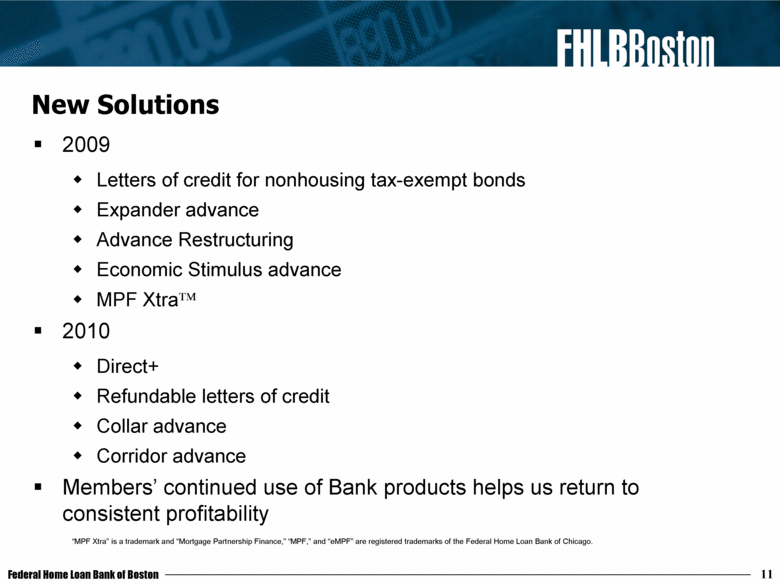
11 New Solutions 2009 Letters of credit for nonhousing tax-exempt bonds Expander advance Advance Restructuring Economic Stimulus advance MPF Xtra 2010 Direct+ Refundable letters of credit Collar advance Corridor advance Members’ continued use of Bank products helps us return to consistent profitability “MPF Xtra” is a trademark and “Mortgage Partnership Finance,” “MPF,” and “eMPF” are registered trademarks of the Federal Home Loan Bank of Chicago. |
|
|
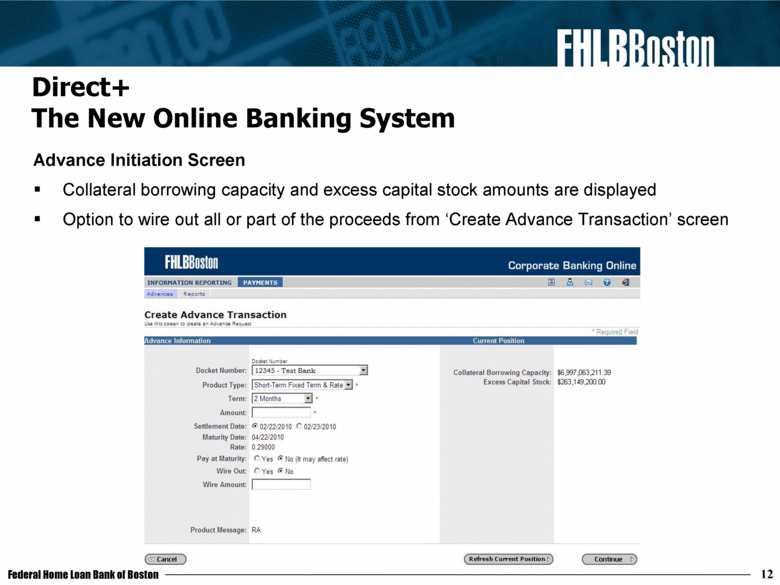
12 Advance Initiation Screen Collateral borrowing capacity and excess capital stock amounts are displayed Option to wire out all or part of the proceeds from ‘Create Advance Transaction’ screen Direct+ The New Online Banking System |
|
|
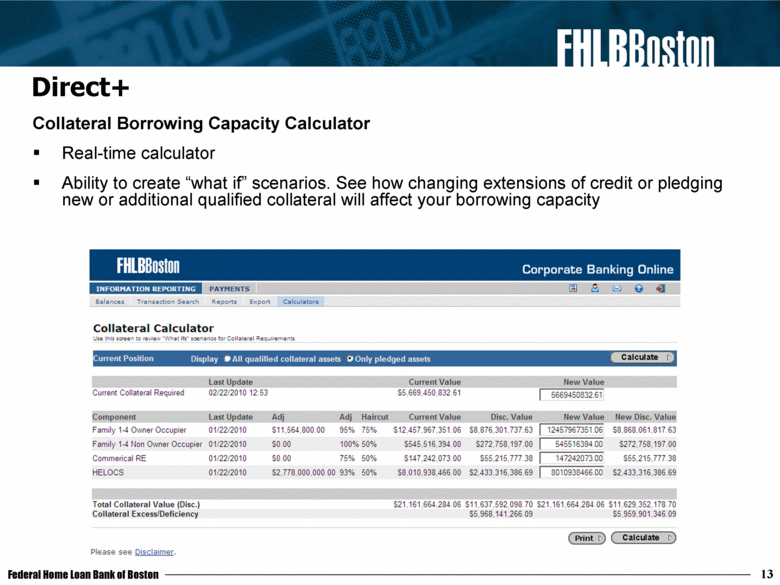
13 Collateral Borrowing Capacity Calculator Real-time calculator Ability to create “what if” scenarios. See how changing extensions of credit or pledging new or additional qualified collateral will affect your borrowing capacity Direct+ |
|
|
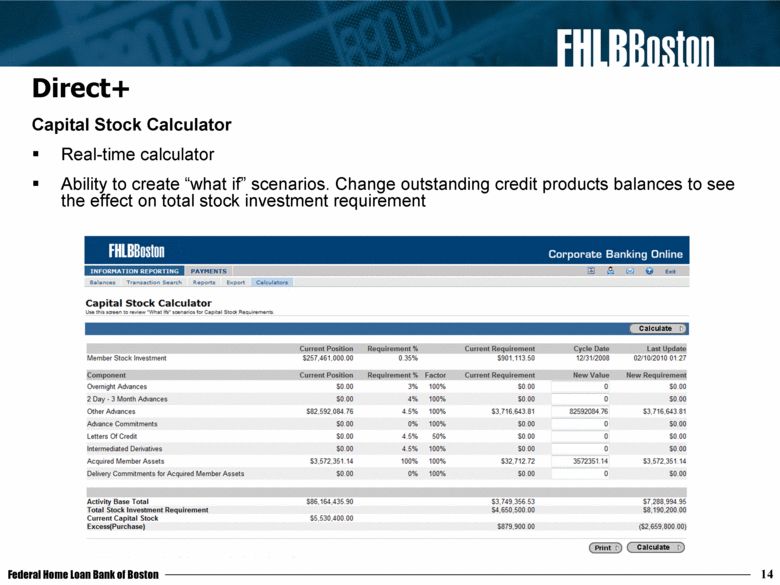
14 Capital Stock Calculator Real-time calculator Ability to create “what if” scenarios. Change outstanding credit products balances to see the effect on total stock investment requirement Direct+ |
|
|
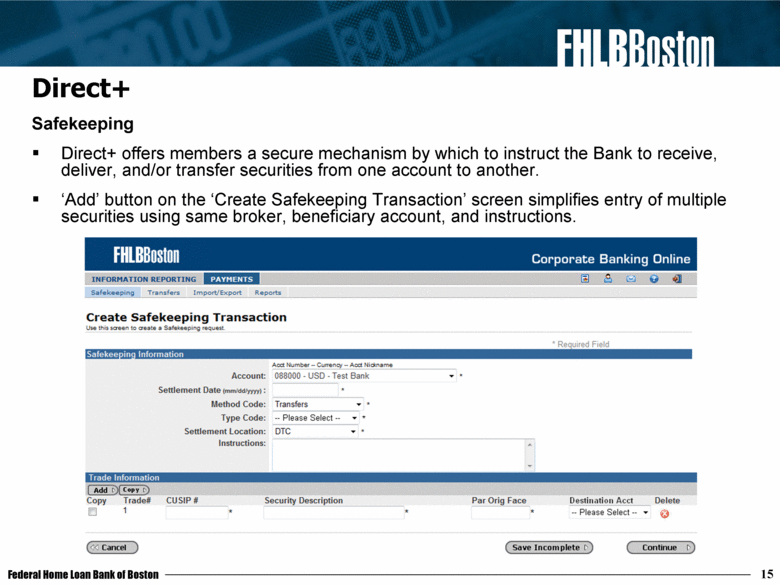
15 Safekeeping Direct+ offers members a secure mechanism by which to instruct the Bank to receive, deliver, and/or transfer securities from one account to another. ‘Add’ button on the ‘Create Safekeeping Transaction’ screen simplifies entry of multiple securities using same broker, beneficiary account, and instructions. Direct+ |
|
|
Balancing Risk Exposure |
|
|
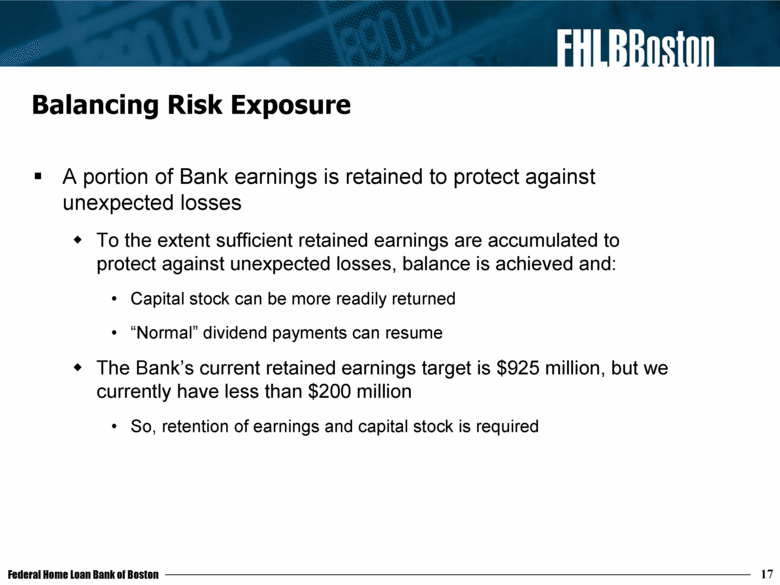
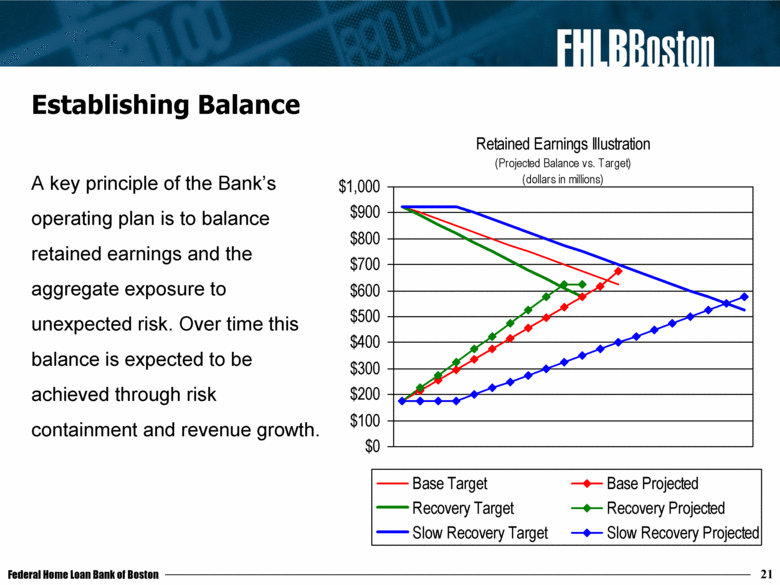
Balancing Risk Exposure A portion of Bank earnings is retained to protect against unexpected losses To the extent sufficient retained earnings are accumulated to protect against unexpected losses, balance is achieved and: Capital stock can be more readily returned “Normal” dividend payments can resume The Bank’s current retained earnings target is $925 million, but we currently have less than $200 million So, retention of earnings and capital stock is required 17 |
|
|
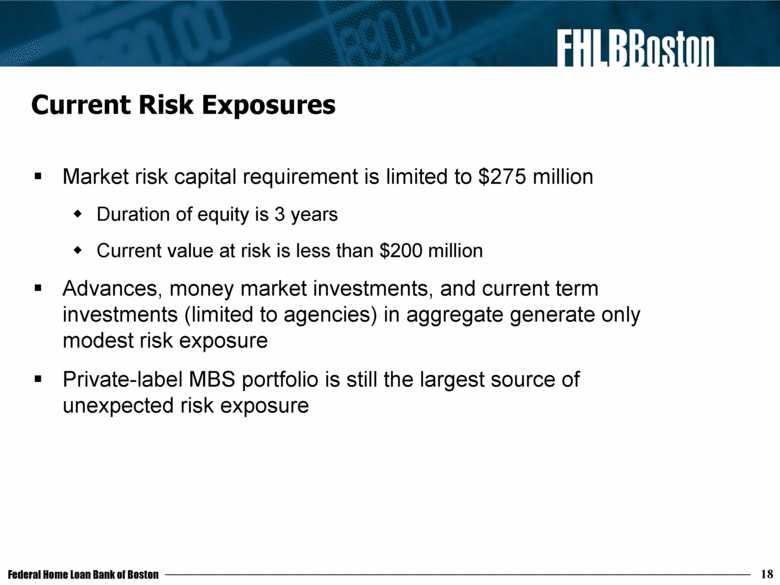
Current Risk Exposures Market risk capital requirement is limited to $275 million Duration of equity is 3 years Current value at risk is less than $200 million Advances, money market investments, and current term investments (limited to agencies) in aggregate generate only modest risk exposure Private-label MBS portfolio is still the largest source of unexpected risk exposure 18 |
|
|
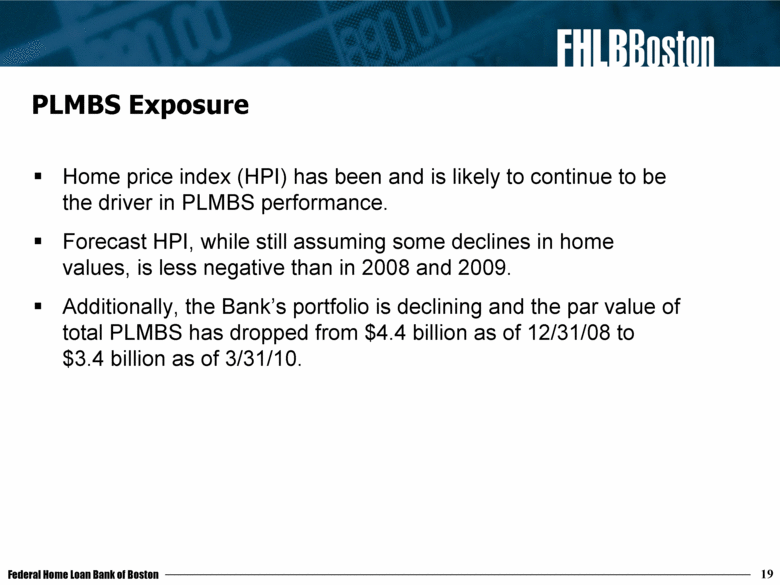
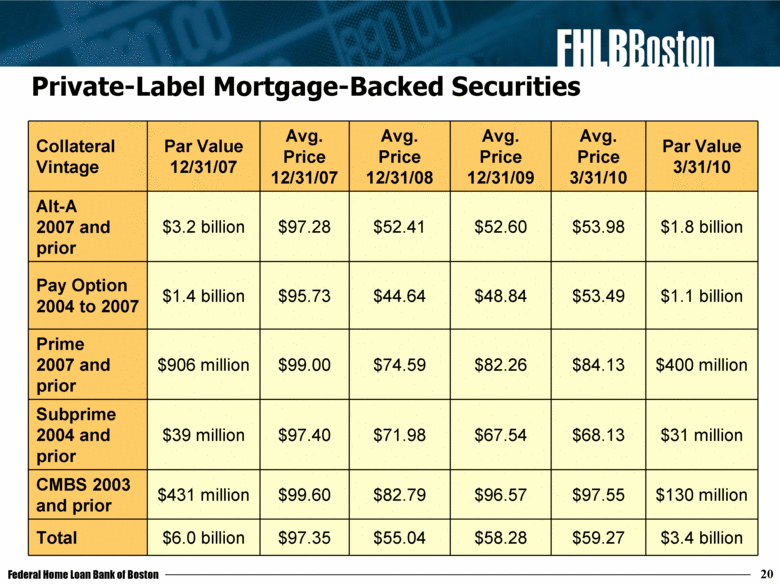
PLMBS Exposure Home price index (HPI) has been and is likely to continue to be the driver in PLMBS performance. Forecast HPI, while still assuming some declines in home values, is less negative than in 2008 and 2009. Additionally, the Bank’s portfolio is declining and the par value of total PLMBS has dropped from $4.4 billion as of 12/31/08 to $3.4 billion as of 3/31/10. 19 |
|
|
20 Private-Label Mortgage-Backed Securities Collateral Vintage Par Value 12/31/07 Avg. Price 12/31/07 Avg. Price 12/31/08 Avg. Price 12/31/09 Avg. Price 3/31/10 Par Value 3/31/10 Alt-A 2007 and prior $3.2 billion $97.28 $52.41 $52.60 $53.98 $1.8 billion Pay Option 2004 to 2007 $1.4 billion $95.73 $44.64 $48.84 $53.49 $1.1 billion Prime 2007 and prior $906 million $99.00 $74.59 $82.26 $84.13 $400 million Subprime 2004 and prior $39 million $97.40 $71.98 $67.54 $68.13 $31 million CMBS 2003 and prior $431 million $99.60 $82.79 $96.57 $97.55 $130 million Total $6.0 billion $97.35 $55.04 $58.28 $59.27 $3.4 billion |
|
|
21 Establishing Balance A key principle of the Bank’s operating plan is to balance retained earnings and the aggregate exposure to unexpected risk. Over time this balance is expected to be achieved through risk containment and revenue growth. Retained Earnings Illustration (Projected Balance vs. Target) (dollars in millions) $0 $100 $200 $300 $400 $500 $600 $700 $800 $900 $1,000 Base Target Base Projected Recovery Target Recovery Projected Slow Recovery Target Slow Recovery Projected |
|
|
Looking Ahead |
|
|
Looking Ahead Development of next year’s business plan underway. Will continue to: Adjust plan to get to retained earnings target and reduce balance sheet risk position Develop products and services Build strength in management and overall employee base Improve organizational effectiveness and efficiency GSE Reform: Much effort will be focused on it in 2011 and beyond Impact unknown - may impact entire business model Will analyze and help shape as much as possible We believe in the FHLBank business model relative to others Challenges: Economy, health of industry, regulatory and legislative risk Primary Focus: Restore consistent profitability and normal operations so that we can pay a dividend, repurchase excess stock, and more fully fund the Affordable Housing Program 23 |

