Attached files
| file | filename |
|---|---|
| EX-23.1 - EXHIBIT 23.1 - Euramax Holdings, Inc. | a2199444zex-23_1.htm |
As filed with the Securities and Exchange Commission on July 22, 2010
Registration No. 333-
UNITED STATES SECURITIES AND EXCHANGE COMMISSION
Washington, D.C. 20549
FORM S-1
REGISTRATION STATEMENT UNDER
THE SECURITIES ACT OF 1933
EURAMAX HOLDINGS, INC.
(Exact Name of Registrant as Specified in Its Charter)
| Delaware (State or Other Jurisdiction of Incorporation or Organization) |
3444 (Primary Standard Industrial Classification Code Number) |
58-2502320 (I.R.S. Employer Identification Number) |
5445 Triangle Parkway, Suite 350
Norcross, GA 30092
(770) 449-7066
(Address, Including Zip Code, and Telephone Number,
Including Area Code, of Registrant's Principal Executive Offices)
R. Scott Vansant
Vice President, Secretary and Chief Financial Officer
5445 Triangle Parkway, Suite 350
Norcross, GA 30092
(770) 449-7066
(Name, Address, Including Zip Code, and Telephone Number,
Including Area Code, of Agent for Service)
With a copy to:
Michael A. Levitt Fried, Frank, Harris, Shriver & Jacobson LLP One New York Plaza New York, New York 10004 (212) 859-8000 |
Samir A. Gandhi Sidley Austin LLP 787 Seventh Avenue New York, New York 10019 (212) 839-5300 |
Approximate date of commencement of proposed sale to the public:
As soon as practicable after the effective date of this Registration Statement.
If any of the securities being registered on this Form are to be offered on a delayed or continuous basis pursuant to Rule 415 under the Securities Act of 1933, check the following box. o
If this Form is filed to register additional securities for an offering pursuant to Rule 462(b) under the Securities Act, please check the following box and list the Securities Act registration statement number of the earlier effective registration statement for the same offering. o
If this Form is a post-effective amendment filed pursuant to Rule 462(c) under the Securities Act, check the following box and list the Securities Act registration statement number of the earlier effective registration statement for the same offering. o
If this Form is a post-effective amendment filed pursuant to Rule 462(d) under the Securities Act, check the following box and list the Securities Act registration statement number of the earlier effective registration statement for the same offering. o
Indicate by check mark whether the registrant is a large accelerated filer, an accelerated filer, a non-accelerated filer, or a smaller reporting company. See the definitions of "large accelerated filer," "accelerated filer" and "smaller reporting company" in Rule 12b-2 of the Exchange Act.
| Large accelerated filer o | Accelerated filer o | Non-accelerated filer ý (Do not check if a smaller reporting company) |
Smaller reporting company o |
CALCULATION OF REGISTRATION FEE
|
|||||||
| Title of Each Class of Securities to be Registered |
Proposed Maximum Aggregate Offering Price(1)(2) |
Amount of Registration Fee(2) |
|||||
|---|---|---|---|---|---|---|---|
Common Stock, $0.01 par value |
$ | 175,000,000 | $ | 12,477.50 | |||
|
|||||||
- (1)
- Includes
offering price of shares which the underwriters have an option to purchase. See "Underwriting."
- (2)
- Estimated solely for the purpose of calculating the registration fee pursuant to Rule 457(o) of the Securities Act of 1933, as amended.
The Registrant hereby amends this Registration Statement on such date or dates as may be necessary to delay its effective date until the Registrant shall file a further amendment which specifically states that this Registration Statement shall thereafter become effective in accordance with Section 8(a) of the Securities Act of 1933 or until the Registration Statement shall become effective on such date as the Securities and Exchange Commission, acting pursuant to said Section 8(a), may determine.
The information in this prospectus is not complete and may be changed. We may not sell these securities until the registration statement filed with the Securities and Exchange Commission is effective. This prospectus is not an offer to sell these securities and it is not soliciting an offer to buy these securities in any jurisdiction where the offer or sale is not permitted.
Subject to Completion
Preliminary Prospectus dated July 22, 2010
P R O S P E C T U S
Shares

Euramax Holdings, Inc.
Common Stock
We are offering shares of our common stock.
Currently, no public market exists for the shares. We expect the public offering price to be between $ and $ per share. We intend to apply to list the common stock on the under the symbol "EMAX."
Investing in our common stock involves risks that are described in the "Risk Factors" section beginning on page 14 of this prospectus.
| |
Per Share | Total | |||||
|---|---|---|---|---|---|---|---|
Public offering price |
$ | $ | |||||
Underwriting discount |
$ | $ | |||||
Proceeds, before expenses, to us |
$ | $ | |||||
The underwriters may also purchase up to an additional shares from us at the public offering price, less the underwriting discount, within 30 days from the date of this prospectus to cover overallotments, if any.
Neither the Securities and Exchange Commission nor any state securities commission has approved or disapproved of these securities or determined if this prospectus is truthful or complete. Any representation to the contrary is a criminal offense.
The shares will be ready for delivery on or about , 2010.
Joint Book-Running Managers
BofA Merrill Lynch |
Deutsche Bank Securities |
The date of this prospectus is , 2010.
You should rely only on the information contained in this prospectus and any free writing prospectus prepared by us or on our behalf that we have referred you to. Neither we nor the underwriters have authorized anyone to provide you with additional or different information. If anyone provides you with additional, different or inconsistent information, you should not rely on it. We and the underwriters are not making an offer to sell these securities in any jurisdiction where an offer or sale is not permitted. You should not assume that the information in this prospectus and any free writing prospectus is accurate as of any date other than the date of the applicable document, regardless of its time of delivery or the time of any sales of our common stock. Our business, financial condition, results of operations or prospects may have changed since the date of the applicable document.
i
INDUSTRY, RANKING AND MARKET DATA
Market and industry data included in this prospectus, including all market share and market size data and our position and the positions of our competitors within these markets, are based on estimates derived from our management's knowledge and experience in the markets in which we operate, as well as information obtained from internal research and surveys, our customers, distributors, suppliers, trade and business organizations and other contacts in the markets in which we operate. Although we believe that these sources were reasonably derived and are accurate as of the date of this prospectus, we have not independently verified data from these sources or obtained third party verification of market share data. Further, data regarding market position and market share within our industry is intended to provide general guidance but is inherently imprecise. Market share data is subject to change and cannot always be verified with certainty due to limits on the availability and reliability of raw data, the voluntary nature of the data gathering process and other limitations and uncertainties inherent in any statistical survey of market shares. In addition, customer preferences can and do change. Also, the discussion herein regarding our various markets is based on our views regarding the end markets for our products, which products may be either part of larger overall markets or markets that include other types of products. As a result, you should be aware that market share, ranking and other similar data set forth herein, and estimates and beliefs based on such data, may not be reliable. We cannot guarantee the accuracy or completeness of any such information contained in this prospectus.
ii
This summary highlights significant aspects of our business and this offering, but it is not complete and does not contain all of the information you should consider before making your investment decision. You should carefully read this entire prospectus, including the "Risk Factors" and our consolidated financial statements and related notes included elsewhere in this prospectus, before making an investment decision. This summary contains forward-looking statements that involve risks and uncertainties. Our actual results may differ significantly from the results discussed in the forward-looking statements as a result of certain factors, including those set forth in the sections entitled "Risk Factors" and "Cautionary Statement Regarding Forward-Looking Statements." In this prospectus, all references to "the Company," "Euramax," "we," "us" and "our" refer to Euramax Holdings, Inc. and its consolidated subsidiaries, unless the context indicates or requires an alternative reference.
We are a leading international producer of metal and vinyl products sold to the residential repair and remodel, non-residential construction and recreational vehicle (RV) markets primarily in North America and Europe. We are a leader in several niche product categories, including preformed roof-drainage products sold in the U.S., metal roofing and siding for wood frame construction in the U.S., and aluminum siding for towable RVs in the U.S. and Europe. Sales to the building products and RV markets accounted for approximately 77% and 14% of our 2009 sales, respectively.
Our customers are located predominantly throughout North America and Europe and include distributors, contractors and home improvement retailers, as well as RV, transportation and other original equipment manufacturers, or OEMs. We have extensive in-house manufacturing and distribution capabilities for our more than 10,000 unique products and operate through a network consisting of 44 facilities, including 36 in the U.S., two in Canada and six in Europe. We have over 50 years of experience manufacturing building products and RV exterior components, including our time as a division of our former parent, Alumax Inc. ("Alumax"), a fully integrated aluminum producer acquired by Alcoa Inc. in 1998. We have operated as an independent company since 1996 when our division was acquired in a management-led buyout.
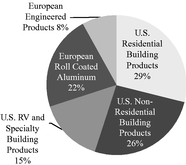
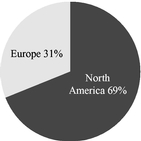
Our total net sales were $812.1 million for the year ended December 25, 2009. The following charts show our net sales by segment and geography during the year ended December 25, 2009:
| Net Sales by Segment | Net Sales by Geography | |
|
|
Our Segments
We manage our business and serve our customers through five reportable segments differentiated by market, product type and geography. Our structure and business model trace their roots to our history as a downstream producer of aluminum products and have evolved in response to customer demand for products made from materials other than aluminum and in pursuit of growth
1
opportunities in different end markets and geographies. Today we offer a full complement of products responsive to the demands of the markets we serve and produced from various materials, including aluminum, steel, copper, vinyl and fiberglass.
Our five reportable segments are described below:
U.S. Residential Building Products
Our U.S. Residential Building Products segment utilizes aluminum, steel, copper and vinyl to produce residential roof drainage products, including preformed gutters, downspouts, elbows, soffit, drip edge, fascia, flashing, snow guards and related accessories. These products are used primarily for the repair, replacement or enhancement of residential roof drainage systems. We sell these products to home improvement retailers, lumber yards, distributors and contractors from 10 manufacturing and distribution facilities located in North America.
This segment accounted for $232.1 million, or 28.6%, of our net sales in 2009. In 2009 we were the leading manufacturer of preformed metal gutters sold in North America. Further, we believe that we are the only North American supplier that produces preformed roof drainage systems from each of the four most common gutter materials: aluminum, steel, copper and vinyl.
U.S. Non-Residential Building Products
Our U.S. Non-Residential Building Products segment utilizes light gauge steel and aluminum coil to produce exterior building components, including roofing and siding panels, ridge caps, flashing, trim, soffit and other accessories. We sell these products to builders, contractors, lumber yards and home improvement retailers from 11 manufacturing and distribution facilities located in the U.S. These products are predominantly used in the construction of a wide variety of small scale non-residential, agricultural and industrial building types on either wood or metal frames.
This segment accounted for $211.9 million, or 26.1%, of our net sales in 2009. We believe that we are the second largest supplier of steel roofing and siding utilized for wood frame construction in the U.S. and believe that we have the largest market share of steel roofing and siding supplied to the Northeastern U.S. wood frame market.
U.S. RV and Specialty Building Products
Our U.S. RV and Specialty Building Products segment utilizes various materials including aluminum coil, steel coil and fiberglass to create exterior components for the towable RV, cargo and manufactured housing markets. These products include sidewall components, siding, doors and trim. We also produce specialty made-to-order vinyl replacement windows and aluminum patio and awning components sold primarily to home improvement contractors in the Western U.S. Our vinyl windows and patio and awning products are high-end replacement and remodel products that carry strong brand recognition in the regional markets where they are sold. This segment operates from 15 manufacturing and distribution facilities located in the U.S.
This segment accounted for $119.0 million, or 14.7%, of our net sales in 2009. We estimate that we sold at least 44% of the aluminum sidewalls and 32% of the doors used in the production of towable RVs in the United States in 2009. In addition, we believe that we are the only supplier of aluminum sidewalls in the U.S. with in-house coil coating capabilities.
European Roll Coated Aluminum
Our European Roll Coated Aluminum segment uses a roll coating process to apply paint to bare aluminum coil and, to a lesser extent, bare steel coil in order to produce specialty coated coil, which we also process into specialty coated sheets and panels. We sell these products to building panel
2
manufacturers, contractors and UK "holiday home," RV and transportation OEMs that sell to customers throughout Europe and in parts of Asia. Our customers use our specialty coated metal products to manufacture, among other things, RV sidewalls, commercial roofing panels, interior ceiling panels, and liner panels for shipping containers. We produce and distribute these roll coated products from one facility in The Netherlands and one facility in the UK.
This segment accounted for $180.3 million, or 22.2%, of our net sales in 2009. We estimate that we sold at least 85% of the aluminum sidewall material used in the production of RVs in Europe in 2009.
European Engineered Products
Our European Engineered Products segment utilizes aluminum and vinyl extrusions to produce residential windows, doors and shower enclosures. These products are sold to home improvement retailers, distributors and factory-built "holiday home" builders in the UK. We also produce windows used in the operator compartments of heavy equipment, components sold to suppliers to automotive OEMs in Western Europe and RV doors. We produce and distribute these engineered products from two facilities in France and two facilities in the UK and have developed extensive in-house manufacturing capabilities, including powder coating, glass cutting, anodizing and glass toughening.
This segment accounted for $68.8 million, or 8.4%, of our net sales in 2009. We believe that we are the largest supplier of residential vinyl windows to the UK home improvement and holiday home markets.
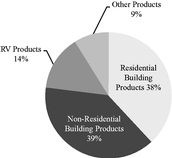
Our End Markets
Through our five segments we serve three primary end markets—Residential Building Products, Non-Residential Building Products and Recreational Vehicle Products. We believe our geographic network, broad product portfolio and customization capabilities allow us to effectively meet the diverse requirements of our customers within our end markets. These primary end markets are discussed below:
| Net Sales by End Market in 2009 |
|
Residential Building Products
Our net sales to the Residential Building Products end market in 2009 were $308.6 million, or 38% of our net sales, of which approximately 88% were from North America and approximately 12% were from Europe. We supply roof drainage components, vinyl windows, patio components, roofing and siding panels and other related products to the Residential Building Products market. Our roof drainage products are typically used for repair, remodel or replacement projects which are driven by wear and tear and weather damage. Roof drainage repair projects are often low cost and non-discretionary in nature. We believe that over 95% of our sales to this end market are derived from repair and remodel activity, with demand typically driven by turnover and aging of housing stock,
3
consumer sentiment, availability of home equity and consumer financing and, in the case of our vinyl window products, increasing consumer interest in energy efficiency. Growth in the U.S. residential repair and remodel market is expected to be driven in the short term by expenditures that were deferred during the economic downturn and over the longer term by the aging of existing housing stock, improvements in consumer confidence and a general recovery in the U.S. residential housing sector.
Non-Residential Building Products
Our net sales to the Non-Residential Building Products end market in 2009 were $312.3 million, or 39% of our net sales, of which approximately 68% were from the U.S. and Canada and approximately 32% were from Europe. Our non-residential building products are typically used in new construction and include, in the U.S., light gauge steel and aluminum roofing and siding panels, trim and hardware and, in Europe, the Middle East and Asia, roll coated aluminum coil and sheet. In the U.S. and Canada, our products are used in a variety of building applications including barns, smaller commercial buildings, storage sheds, schools, churches, shopping centers, parking garages, pavilions, boat docks and carports. Demand for these products varies according to end use and project scale, with smaller projects driven by consumer confidence and the availability of consumer credit and farm or rural applications driven by the strength of agricultural markets. Outside the U.S. and Canada, our specialty coated aluminum coil is used by customers who produce interior and exterior panels for roofs, ceilings, and siding used in larger commercial construction projects. Demand for these products is generally tied to commercial construction activity throughout Europe, the Middle East and Asia. The Non-Residential Building Products end market contracted significantly during the economic downturn, but as the economy recovers this end market is ultimately expected to benefit from accompanying improvements in consumer confidence, increased consumer disposable income and greater access to financing.
Recreational Vehicle Products
Our net sales to the Recreational Vehicle Products end market in 2009 were $113.3 million, or 14% of our net sales, of which approximately 43% were from the U.S. and approximately 57% were from Europe. We supply aluminum siding, doors and accessories for RVs in both the U.S. and Europe. This end market is comprised of two distinct RV products: motorhomes and towables. Motorhomes are generally larger, motorized vehicles and towables are lower-cost units towed by automobiles or light trucks. The majority of our sales to this end market are within the towable segment, which comprises the majority of global RV industry unit shipments, and includes sales to substantially all major towable RV OEMs in both the U.S. and Europe. We believe we are the number one supplier of aluminum siding for towable RVs in the combined U.S. and European markets.
The U.S. RV market is a $5 billion industry that is currently rebounding following substantial contraction in 2008 and 2009, according to the Recreation Vehicle Industry Association (RVIA). Significant pent-up demand for RVs, the return of attractive RV financing options, improved macro-economic conditions and stabilized gasoline prices are expected to support the rebound of the U.S. RV industry. According to an RVIA report from June 2010, total RV shipments in the U.S. are expected to increase annually by 23% from 2009 through 2011. The European RV industry generated $6.5 billion of revenue in 2009, according to the European Caravan Federation (ECF). In Europe, touring RV shipments are expected to decline by 10% annually from 2009 through 2011, while motorhome shipments are expected to decline by 4% annually over the same period, according to the European Caravan Federation (ECF).
4
Other Products
Our net sales of Other Products in 2009 were $77.9 million, or 9% of our net sales, of which approximately 40% were from the U.S. and Canada and approximately 60% were from Europe. In addition to serving our three primary end markets, we have taken advantage of our available manufacturing capacity and leveraged our materials expertise to develop and sell new products into other markets. These include various metal-based products, such as micro-car frames, heavy equipment operator compartments, utility trailer sidewalls, automobile sunroofs and windows for buses and trains.
The following competitive strengths have contributed to our success and are critical to maintaining the market positions that we enjoy and to achieving our plans for future growth. We believe that the combination of these strengths is unique to us among our competitors in the markets we serve. They include:
Well positioned leader in rebounding end markets. We maintain leading market positions in a number of niche markets which we believe are likely to rebound following a severe cyclical downturn. These positions include:
- •
- #1 position in preformed residential gutters sold in the U.S.
- •
- #1 position in metal roofing and siding for wood frame construction in the Northeast U.S.
- •
- #1 position in aluminum siding for towable RV exteriors in the U.S.
- •
- #1 position in aluminum siding and roofing for towable RVs in Europe
- •
- #1 position in steel exterior panels for manufactured housing in the U.S.
- •
- #1 position in vinyl windows for the UK holiday home and home center markets
Our total net sales derived from these #1 positions were $295.6 million in 2009, or 36.4% of our total net sales. We believe our leading market positions have positioned us to grow sales and improve our profitability amid a period of anticipated recovery in the residential repair and remodel, non-residential construction and RV markets.
Unique fabrication capabilities specifically tailored for niche markets. Our unique manufacturing capabilities are critical to maintaining our strong position in several niche markets for our products. In the U.S., our integrated metal coil coating capabilities provide us with a competitive advantage in the home improvement retail and RV industries as an integrated low-cost supplier of metal products with the ability to meet the demanding delivery requirements of customers in these industries. We believe we are also the only supplier who can manufacture roof drainage components from each of the four most common gutter materials: aluminum, steel, copper and vinyl. In Europe, our 103" wide aluminum coating line in The Netherlands is one of only two such lines in the world that coat metal in excess of 96" wide.
Strong, established customer relationships. We maintain long-standing relationships among our major customers across our end markets and are a critical supplier to many of our customers. Our top ten accounts have been customers of ours for more than 20 years on average, and include The Home Depot® and Lowe's, the two largest home improvement retailers in the U.S., each of whom have been our customer for over 25 years. In addition, since 2005, the year-over-year retention rate of our top 100 customers has averaged over 97%. The depth and longevity of our customer relationships provide a foundation for recurring revenues and an outlet for the introduction of new products.
More efficient, lower cost business. Since the third quarter of 2008 we have worked to operate a more efficient, lower cost business. Recent improvements reflect the results of our ongoing initiatives to
5
centralize certain management controls, rationalize our operating structure and implement best practices to improve our manufacturing culture. Specific initiatives include:
- •
- Facility rationalization. Between January 2008 and
December 2009, we closed 26 facilities representing approximately 24% of our square footage devoted to U.S. manufacturing and distribution. These closures eliminated redundant and less profitable or
unprofitable facilities while reducing supervisory and administrative personnel. In closing these facilities, we endeavored to and believe we did retain a significant portion of the profitable
business previously served by these closed facilities. We believe we have enhanced the overall productivity potential of our facilities and will be able to support the peak volumes that existed prior
to these closures.
- •
- Centralized lean manufacturing deployment. Beginning in
June 2008, we centralized the implementation and execution of our lean manufacturing initiatives and related integrated sales and operational planning. As a result, we have achieved significant
reductions in inventory, improved our efficiency and strengthened customer service at many of our facilities. We expect to continue to benefit from greater efficiencies incrementally as we implement
these best practices across our global platform.
- •
- Information technology deployment. We have deployed a
market leading enterprise resource planning, or ERP, system in our U.S. Non-Residential Building Products segment, and expect to deploy this system in our other U.S. segments over the next several
years. Our new ERP system enables us to better support our manufacturing and selling processes by providing critical information related to product cost, supply chain status and customer
profitability. In 2009, for instance, our ERP system allowed us to more easily identify and ultimately terminate over 750 customer relationships which represented insignificant revenue, while
accounting for a disproportionate portion of our costs.
- •
- Improved freight and logistics productivity. We have
undertaken a significant number of initiatives to improve our freight and logistics productivity and reduce our shipping costs, including outsourcing routes, implementing load optimization software,
changing our driver compensation structure and adding on-board GPS systems to track productivity and manage mileage-based compensation within our captive shipping fleet.
- •
- Non-metal procurement cost management. Under our procurement cost reduction initiatives, in 2009 we reduced our non-metal procurement costs by more than $6 million.
As a result of these and other initiatives, we have a more favorable cost structure than we did prior to 2008. For example, we estimate that we increased our net sales per employee by 7.5% in the twelve months ended April 2, 2010 compared to the year ended December 28, 2007. We also estimate that we reduced our selling and general expenses (excluding depreciation) as a percentage of sales volume by 3.8% in the twelve months ended April 2, 2010 compared to the year ended December 28, 2007. These improvements were achieved despite a 22.6% reduction in net sales volume during the same period. We believe that these improvements have made us more competitive and have positioned us to improve our operating margins as our key end markets recover.
Significant diversification across products, materials, customers, end markets and geography. We produce and deliver over 10,000 unique products, utilizing aluminum, steel, copper, vinyl and fiberglass, through a multi-channel distribution network that serves customers across multiple end markets and geographies. Our customer base is highly diverse, with our top ten customers accounting for less than 31% and no single customer accounting for more than 12% of our total 2009 net sales. Further, our top ten customers include customers from each of our five segments. Our sales are also diversified geographically, with 69% of our 2009 net sales originating in the U.S. and Canada, and the remainder originating in the UK, The Netherlands and France. This diversity has helped to offset the cyclicality
6
that is experienced in some of the markets we serve, while allowing us to address profitable growth opportunities as they arise in different product lines, end markets and geographies.
Committed and experienced management team. We have an experienced management team led by our chief executive officer Mitchell B. Lewis and chief financial officer R. Scott Vansant. Messrs. Lewis and Vansant each have approximately 20 years of industry experience with us and our predecessor and have effectively led us through various industry cycles, economic conditions and capital and ownership structures.
Our strategy is to leverage the strengths and experience that have provided us leading market positions to grow our business beyond our current product offerings and the customers and geographic markets we currently serve. In addition, we will endeavor to improve our capabilities and profitability through process improvement initiatives and further cost reductions.
Capture growth related to anticipated market recovery. As a leading manufacturer of exterior building products, we intend to capitalize on the anticipated recovery in the residential repair and remodel, non-residential construction and RV markets. We believe that our leading market positions, well-established customer relationships, broad product portfolio, national distribution capabilities and low cost manufacturing platform provide us with a competitive advantage over other suppliers.
Continue to focus on operational leverage. We believe that we have created significant operating leverage within our current manufacturing platform that will provide substantially greater earnings potential in a rising volume environment and position us for continued improvement in our profitability. We intend to continue to improve our cost structure through incremental lean manufacturing deployment, improved supply chain management, reduced freight and procurement costs, incremental facility rationalization, and implementation of best practices throughout our organization. We also intend to continue to integrate new information technologies across our business, which we expect will further enhance our management capabilities, improve our data quality and enable further integration of our businesses. We have already shown significant improvement in operational leverage, but we believe there remain significant opportunities for further improvements in each of these categories.
Drive growth through business development initiatives. We have instituted a series of business development initiatives that we believe will position us to achieve profitable organic growth. As part of our planning process, we task each segment to broaden its geographic presence and product offering. Given our efficient and adaptable manufacturing and distribution platform, as well as our existing channel partners and industry relationships, we believe that we are particularly well positioned to develop and profitably commercialize new products as well as modify existing products to respond to new and expanding markets, particularly as our markets continue to recover from 2009 levels. As part of our efforts, we have instituted an incentive compensation structure that specifically rewards business development efforts among key managers.
- •
- Expand into new geographic markets. Given our efficient and adaptable manufacturing and distribution platform as well as our established channel partners and industry relationships, we are well positioned to identify and selectively act on growth opportunities in new geographic markets. The versatility of our product line allows us to modify already successful products for use in other geographic areas both in the U.S. and abroad. For example, we plan to grow our sales of roof drainage products in Canada and our sales to the distributor channel outside the Northeastern U.S. Internationally, we have increased our sales effort and representation in emerging markets where our manufacturing and distribution expertise can be leveraged profitably.
7
- •
- Increase sales to new customers. We plan to continue to
identify and develop new market opportunities for our products, such as sales to government entities (including the military) or through government contractors, and leverage our product portfolio to
increase penetration of our full product line across all building materials sales channels.
- •
- Develop innovative new products. We plan to continue to engage in research and development of new products and leverage our existing relationships to distribute these products, such as our recent successful introduction of a new solid gutter cover in the U.S. as well as a roll coated aluminum coil offering with unique sand-resistant properties specifically designed for applications in the Middle East.
Identify and integrate selected value-enhancing acquisitions. Our acquisition strategy is designed to complement our business development efforts. We intend to selectively pursue bolt-on acquisitions that enable us to broaden our product offering to existing customers or to accelerate our growth in new geographic areas.
Risks Relating to Our Business
We face certain risks that could materially affect our business, financial condition, results of operations and prospects. You should carefully consider the risks and uncertainties summarized below, the risks described under "Risk Factors," the other information contained in this prospectus and our consolidated financial statements and the related notes before you decide whether to invest in our common stock. Some of the more significant challenges and risks we face include the following:
- •
- our susceptibility to cyclical fluctuations in the end markets we serve, declines in U.S., European and global general
economic conditions and the stability of our end markets;
- •
- our ability to maintain positive relations with our key customers and the risk to our business if we lose business from or
terminate relationships with our major customers;
- •
- the cost and availability of raw materials used in our products, particularly aluminum and steel, and our ability to pass
through increases in these costs to our customers;
- •
- our reliance on unique fabrication techniques and risks associated with manufacturing processes;
- •
- our dependence on information technology in our operations, including our new ERP system;
- •
- the highly competitive nature of our business;
- •
- risks arising from the international scope of our business;
- •
- our substantial indebtedness; and
- •
- restrictions contained in our debt agreements which may limit our flexibility in operating our business.
Euramax Holdings, Inc. is a corporation formed under the laws of Delaware. Our headquarters and principal executive offices are located at 5445 Triangle Parkway, Suite 350, Norcross, Georgia 30092 and our telephone number is (770) 449-7066. Our website address is www.euramax.com. Our website and the information contained therein or connected thereto is not incorporated into this prospectus or the registration statement of which this prospectus forms a part, and you should not rely on any such information in making your decision whether to purchase our securities.
8
The Euramax logo, "Flex-A-SpoutTM" and other trademarks or service marks of Euramax appearing in this prospectus are the property of Euramax. This prospectus contains additional trade names, trademarks and service marks of other companies, which are the property of their respective owners.
We operate on a 52 or 53 week fiscal year ending on the last Friday in December. Our fiscal years consisted of 52 weeks for the years ended December 25, 2009, December 26, 2008 and December 28, 2007, respectively. Fiscal years are referred to in this prospectus according to the closest calendar year. For example, 2009 refers to the fiscal year ended December 25, 2009.
9
Issuer |
Euramax Holdings, Inc. | |
Common stock offered by us |
shares. |
|
Option to purchase additional shares of common stock from us |
shares. |
|
Common stock outstanding immediately after the offering |
shares. |
|
Use of proceeds |
We estimate that the net proceeds to us in this offering, after deducting the underwriters' discount and the estimated expenses of the offering payable by us, will be approximately $ million (based on the midpoint of the price range set forth on the cover page of this prospectus). We expect to use the net proceeds of this offering to repay $ million of the term loans under our first lien credit facility. If the underwriters exercise their option to purchase additional shares from us in full, the additional net proceeds to us would be approximately $ million (and the total net proceeds to us would be approximately $ million) and we intend to use such additional net proceeds in the manner described above. See "Use of Proceeds." |
|
Dividend policy |
We do not intend to pay any dividends on our common stock for the foreseeable future following completion of the offering. See "Dividend Policy." |
|
Proposed ticker symbol |
"EMAX" |
|
Risk factors |
See "Risk Factors" beginning on page 14 of this prospectus for a discussion of factors that you should carefully consider before deciding to invest in our common stock. |
Unless we indicate otherwise or the context requires, all information in this prospectus relating to the number of shares of common stock to be outstanding after the offering:
- •
- excludes (1) shares of restricted stock
and restricted stock units granted to
employees pursuant to our Executive Incentive Plan, none of which are currently vested, and (2) shares of common stock reserved for issuance under
our equity award plans;
- •
- assumes no exercise by the underwriters of their option to purchase up to shares of
common stock from us;
and
- •
- gives effect to a for stock split with respect to our common stock that will be effected prior to consummation of this offering.
10
Summary Consolidated Financial Information
The following table sets forth our summary historical consolidated financial data as of and for the periods indicated. The financial data for the fiscal years ended December 25, 2009, December 26, 2008 and December 28, 2007 are derived from our consolidated financial statements which have been audited by Ernst & Young LLP, independent registered public accounting firm. The financial data for the fiscal year ended December 29, 2006 and the six month periods ended July 1, 2005 and December 30, 2005 have been derived from our unaudited consolidated financial statements. The summary historical consolidated financial data for fiscal year 2005 are divided into Predecessor and Successor periods as a result of the acquisition of our business by private equity funds and certain members of management on July 1, 2005, which required the application of the purchase method of accounting under GAAP. The summary historical consolidated financial data for the three months ended April 2, 2010 and March 27, 2009 have been derived from our unaudited consolidated financial statements. The unaudited consolidated interim financial information set forth below has been prepared on the same basis as our audited consolidated financial statements and includes all adjustments, consisting of normal recurring adjustments, that we consider necessary for a fair presentation of our financial position and operating results for such periods. The financial data set forth in this table are not necessarily indicative of our future results of operations and should be read in conjunction with our consolidated financial statements and related notes included elsewhere in this prospectus and the information under "Selected Consolidated Financial Data" and "Management's Discussion and Analysis of Financial Condition and Results of Operations."
11
| |
Successor(1) | Predecessor | ||||||||||||||||||||||||
|---|---|---|---|---|---|---|---|---|---|---|---|---|---|---|---|---|---|---|---|---|---|---|---|---|---|---|
| |
Three months ended April 2, 2010 |
Three months ended March 27, 2009 |
Year ended December 25, 2009 |
Year ended December 26, 2008 |
Year ended December 28, 2007 |
Year ended December 29, 2006 |
Six months ended December 30, 2005 |
Six months ended July 1, 2005(2) |
||||||||||||||||||
| |
(Unaudited) |
(Unaudited) |
|
|
|
(Unaudited) |
(Unaudited) |
(Unaudited) |
||||||||||||||||||
| |
(in thousands, except per share data) |
|||||||||||||||||||||||||
Statements of Operations Data: |
||||||||||||||||||||||||||
Net sales |
$ | 200,539 | $ | 159,685 | $ | 812,055 | $ | 1,173,493 | $ | 1,245,631 | $ | 1,140,417 | $ | 511,138 | $ | 508,023 | ||||||||||
Cost of goods sold (excluding depreciation and amortization) |
164,878 | 146,289 | 675,126 | 1,009,392 | 1,052,838 | 941,426 | 420,665 | 412,792 | ||||||||||||||||||
Gross profit |
35,661 | 13,396 | 136,929 | 164,101 | 192,793 | 198,991 | 90,473 | 95,231 | ||||||||||||||||||
Selling and general (excluding depreciation and amortization) |
23,439 | 23,271 | 91,802 | 110,608 | 101,189 | 90,793 | 42,169 | 39,861 | ||||||||||||||||||
Debt restructuring, acquisition and forbearance expenses |
— | 4,001 | 13,307 | 3,798 | — | — | — | 90,905 | ||||||||||||||||||
Depreciation and amortization |
9,097 | 9,817 | 39,721 | 55,348 | 57,590 | 52,689 | 28,684 | 10,190 | ||||||||||||||||||
Goodwill and other impairments |
— | — | 3,516 | 401,376 | — | — | — | — | ||||||||||||||||||
Income (loss) from operations |
3,125 | (23,693 | ) | (11,417 | ) | (407,029 | ) | 34,014 | 55,509 | 19,620 | (45,725 | ) | ||||||||||||||
Interest expense |
(18,695 | ) | (26,540 | ) | (84,204 | ) | (109,527 | ) | (84,923 | ) | (74,675 | ) | (36,761 | ) | (24,402 | ) | ||||||||||
Gain on extinguishment of debt |
— | — | 8,723 | — | — | — | — | — | ||||||||||||||||||
Other income (loss), net |
(4,075 | ) | (4,340 | ) | 1,303 | (22,716 | ) | 5,143 | 11,949 | (1,173 | ) | (19,567 | ) | |||||||||||||
Loss from continuing operations before income taxes |
(19,645 | ) | (54,573 | ) | (85,595 | ) | (539,272 | ) | (45,766 | ) | (7,217 | ) | (18,314 | ) | (89,694 | ) | ||||||||||
Benefit for income taxes |
(557 | ) | (10,360 | ) | (1,297 | ) | (61,078 | ) | (2,529 | ) | (3,374 | ) | (3,811 | ) | (27,989 | ) | ||||||||||
Loss from continuing operations |
(19,088 | ) | (44,213 | ) | (84,298 | ) | (478,194 | ) | (43,237 | ) | (3,843 | ) | (14,503 | ) | (61,705 | ) | ||||||||||
Loss from discontinued operations, net of tax |
(96 | ) | (1,015 | ) | (1,330 | ) | (22,413 | ) | (6,194 | ) | (1,830 | ) | (603 | ) | 559 | |||||||||||
Net loss |
(19,184 | ) | (45,228 | ) | (85,628 | ) | (500,607 | ) | (49,431 | ) | (5,673 | ) | (15,106 | ) | (61,146 | ) | ||||||||||
Per Share Data: |
||||||||||||||||||||||||||
Pro forma basic and diluted net loss per share(3): |
||||||||||||||||||||||||||
Basic |
||||||||||||||||||||||||||
Diluted |
||||||||||||||||||||||||||
Pro forma weighted average shares outstanding(3): |
||||||||||||||||||||||||||
Basic |
||||||||||||||||||||||||||
Diluted |
||||||||||||||||||||||||||
Other Financial Data: |
||||||||||||||||||||||||||
Net cash flow provided by (used in): |
||||||||||||||||||||||||||
Operating activities |
(28,717 | ) | (403 | ) | 59,482 | (16,455 | ) | 74,916 | (12,639 | ) | 45,319 | (4,311 | ) | |||||||||||||
Investing activities |
664 | (1,006 | ) | (2,026 | ) | (6,784 | ) | (50,076 | ) | (65,901 | ) | (7,782 | ) | (20,964 | ) | |||||||||||
Financing activities |
(2,191 | ) | (12,688 | ) | (35,929 | ) | 59,598 | (27,893 | ) | 45,645 | (28,329 | ) | 24,135 | |||||||||||||
Capital expenditures |
(1,519 | ) | (1,022 | ) | (4,351 | ) | (14,824 | ) | (21,255 | ) | (25,048 | ) | (9,846 | ) | (7,526 | ) | ||||||||||
Adjusted EBITDA(4) |
13,226 | (6,090 | ) | 56,344 | 68,291 | 101,685 | 115,403 | 51,855 | 57,772 | |||||||||||||||||
Balance Sheet Data: |
||||||||||||||||||||||||||
Cash and cash equivalents |
38,320 | — | 69,944 | 48,658 | 8,272 | 16,425 | 47,409 | — | ||||||||||||||||||
Working capital(5) |
158,709 | — | 163,393 | 167,849 | 138,828 | 217,296 | 161,957 | — | ||||||||||||||||||
Total assets |
729,163 | — | 758,626 | 841,966 | 1,423,648 | 1,190,767 | 1,072,292 | — | ||||||||||||||||||
Total debt, including current portion |
523,295 | — | 525,319 | 884,740 | 812,401 | 807,849 | 735,337 | — | ||||||||||||||||||
Total shareholders' equity (deficit) |
23,674 | — | 47,060 | (259,282 | ) | 273,771 | 320,276 | 237,731 | — | |||||||||||||||||
- (1)
- Our
fiscal year ends on the last Friday in December of each calendar year. Each of our fiscal years presented is based on a 52 week period. Our
fiscal year ended December 31, 2010 will include 53 weeks.
- (2)
- On
July 1, 2005, we were acquired by certain private equity funds and members of management, as described under "Management's Discussion and
Analysis of Financial Condition and Results of Operations—History." As a result of the application of the purchase method of accounting in connection with the acquisition, our
shareholders' equity increased by $156.8 million. In addition, our net income for the six months ended July 1, 2005 reflects certain costs and expenses associated with the acquisition.
- (3)
- All
share and per share amounts reflect a for stock split with
respect to our common stock which will be effected prior to
consummation of this offering.
- (4)
- Adjusted EBITDA is defined as net loss plus (i) benefit for income taxes, (ii) interest expense and (iii) depreciation and amortization, as further adjusted to exclude the effects of certain income and expense items that management believes make it more difficult to assess the Company's actual operating performance.
12
- We
believe Adjusted EBITDA is helpful to investors and our management in highlighting trends because Adjusted EBITDA excludes the results of
certain decisions of operating management that can differ significantly from company to company depending on long-term strategic decisions regarding capital structure, the tax
jurisdictions in which companies operate and capital investments. We believe that excluding items such as goodwill and asset impairment charges, restructuring charges, gain on extinguishment of debt
and the other charges specified below helps investors compare our operating performance with our results in prior periods. We believe it is appropriate to exclude these items as they are not related
to ongoing operating performance and, therefore, limit comparability between periods and between us and similar companies. Management compensates for the limitations of using non-GAAP
financial measures by using them to supplement GAAP results to provide a more complete understanding of the factors and trends affecting the business than GAAP results alone.
- We
also believe Adjusted EBITDA is useful to investors because it is frequently used by securities analysts, investors and other interested
parties in the evaluation of companies in our industry. We understand that investors use Adjusted EBITDA, among other things, to assess our period-to-period operating
performance and to gain insight into the manner in which management analyzes operating performance. In addition, we believe that Adjusted EBITDA is useful in evaluating our operating performance
compared to that of other companies in our industry because the calculation of Adjusted EBITDA generally eliminates the effects of financing and income taxes and the accounting effects of capital
spending and acquisitions, which items may vary for different companies for reasons unrelated to overall operating performance. Using several measures to evaluate the business allows us and investors
to assess our relative performance against our competitors and ultimately monitor our capacity to generate returns for our stockholders.
- Although we believe that Adjusted EBITDA can make an evaluation of our operating performance more consistent because it removes items that do not reflect our core operations, other companies, even in the same industry, may define Adjusted EBITDA differently than we do. Because not all companies use identical calculations, our presentation of Adjusted EBITDA may not be comparable to similarly titled measures of other companies. As a result, it may be difficult to use Adjusted EBITDA or similarly named non-GAAP measures that other companies may use to compare the performance of those companies to our performance. We do not, and investors should not, place undue reliance on Adjusted EBITDA as a measure of operating performance. Adjusted EBITDA is not a measure of financial performance under accounting principles generally accepted in the U.S., and should not be considered an alternative to net income as a measure of operating performance or cash flows from operating, investing and financing activities as a measure of liquidity. In addition, Adjusted EBITDA is not intended to be a measure of free cash flow available for management's discretionary use, as it does not consider certain cash requirements such as interest payments, tax payments and other debt service requirements.
Reconciliation of net income (loss) attributable to Adjusted EBITDA is as follows:
| |
Three months ended April 2, 2010 |
Three months ended March 27, 2009 |
Year ended December 25, 2009 |
Year ended December 26, 2008 |
Year ended December 28, 2007 |
Year ended December 29, 2006 |
Six months ended December 30, 2005 |
Six months ended July 1, 2005 |
|||||||||||||||||
|---|---|---|---|---|---|---|---|---|---|---|---|---|---|---|---|---|---|---|---|---|---|---|---|---|---|
Net loss |
$ | (19,184 | ) | $ | (45,228 | ) | $ | (85,628 | ) | $ | (500,607 | ) | $ | (49,431 | ) | $ | (5,673 | ) | $ | (15,106 | ) | $ | (61,146 | ) | |
Add: |
|||||||||||||||||||||||||
Provision (benefit) for income taxes |
(557 | ) | (10,360 | ) | (1,297 | ) | (61,078 | ) | (2,529 | ) | (3,374 | ) | (3,811 | ) | (27,989 | ) | |||||||||
Interest expense |
18,695 | 26,540 | 84,204 | 109,527 | 84,923 | 74,675 | 36,761 | 24,402 | |||||||||||||||||
Depreciation and amortization |
9,263 | 10,270 | 41,347 | 57,689 | 60,116 | 55,009 | 29,235 | 10,190 | |||||||||||||||||
Adjustments: |
|||||||||||||||||||||||||
Goodwill and other impairments |
— | — | 3,516 | 401,376 | — | — | — | — | |||||||||||||||||
Other income/loss net |
4,075 | 4,340 | (1,303 | ) | 22,716 | (5,143 | ) | (11,949 | ) | 1,173 | 19,567 | ||||||||||||||
Debt restructuring, acquisition and forbearance expenses(a) |
— | 4,001 | 13,307 | 4,234 | 1,206 | 169 | 3,000 | 92,441 | |||||||||||||||||
Management and advisory fees(b) |
— | — | — | — | — | — | — | 482 | |||||||||||||||||
Gain on extinguishment of debt(c) |
— | — | (8,723 | ) | — | — | — | — | — | ||||||||||||||||
Loss from discontinued operations, net of tax |
96 | 1,015 | 1,330 | 22,413 | 6,194 | 1,830 | 603 | (559 | ) | ||||||||||||||||
Stock compensation expense |
583 | 315 | 2,885 | 925 | 1,107 | 1,261 | — | 384 | |||||||||||||||||
Non-recurring expenses |
255 | 3,017 | 6,707 | 11,096 | 5,242 | 3,455 | — | — | |||||||||||||||||
Adjusted EBITDA |
13,226 | (6,090 | ) | 56,344 | 68,291 | 101,685 | 115,403 | 51,855 | 57,772 | ||||||||||||||||
- (a)
- Debt
restructuring, acquisition and forbearance expenses include: (i) for the six months ended July 1, 2005, expenses associated with the
acquisition of the Company by certain private equity funds and members of management, and the impact on cost of goods sold of purchase accounting adjustments to inventory resulting from an
acquisition, and (ii) for the years ended December 26, 2008 and December 25, 2009, expenses associated with a series of forbearance and limited waiver agreements in place from
November 10, 2008 to June 29, 2009 with our then-existing lenders. See "Management's Discussion and Analysis of Financial Condition and Results of
Operations—History."
- (b)
- Represents
advisory fees paid to Goldman, Sachs & Co. prior to June 29, 2009, and advisory fees paid to CVC Management LLC
prior to July 1, 2005.
- (c)
- Represents
the gain recognized in connection with our June 2009 debt restructuring, in which lenders cancelled 100% of amounts owed under our
then-existing Second Lien Credit Agreement consisting of principal and accrued interest of $191 million and $12 million, respectively, in exchange for 100% of our issued and
outstanding shares of common stock. See "Management's Discussion and Analysis of Financial Condition and Results of Operations—History."
- (5)
- We define working capital as current assets less current liabilities.
13
An investment in our common stock involves a high degree of risk. You should carefully consider the risk factors set forth below as well as the other information contained in this prospectus before investing in our common stock, or deciding whether you will or will not participate in this offering. The risks described below are not the only risks facing us. Any of the following risks, and additional risks and uncertainties not currently known to us or those we currently view to be immaterial, could materially and adversely affect our business, financial condition, results of operations, prospects or cash flows. In such a case, the trading price of our common stock may decline and you may lose all or part of your original investment.
Risks Relating to Our Business
Demand for our products is cyclical, and reduced demand in our end markets is likely to adversely affect our profitability and cash flow.
Demand for many of our products is cyclical in nature. Because the ultimate end users of our products are most typically individuals electing whether to make discretionary expenditures, our results are affected by various macroeconomic trends which affect consumer confidence and access to financing. Sales of our residential building products for repair, remodel and replacement applications depend upon the availability of home equity and consumer financing, low interest rates, the turnover and aging of housing stock, wear and tear, weather damage and consumer sentiment. Expenditures in the broader U.S. residential repair and remodel industry declined substantially between 2007 and 2009 due to adverse changes in many of these factors. Sales of our non-residential building products are affected by consumer confidence, interest rates, consumer disposable income, the strength of agricultural markets, consumer access to affordable financing and commercial construction trends. Demand for our RV products is driven by trends in disposable income, interest rates and general economic conditions, as well as demographic trends relating to consumers in the 55 through 74 year old age group, who constitute a significant source of demand for RV products. For example, the U.S. towable RV market suffered a 30% decline in shipments in 2008 and an additional 27% decline in 2009 due to changes in certain of these economic factors. Adverse trends in these and other cyclical factors are likely to materially reduce demand for and sales of our products. Moreover, simultaneous declines in multiple end markets, such as those we experienced in 2008 and 2009, could have a material adverse effect on our business, financial condition, results of operations, prospects and cash flows.
In addition, our sales to the European RV industry, which comprised 8%, 10% and 11% of our net sales in 2009, 2008 and 2007, respectively, are expected to decline as this end market continues to contract. The overall European RV industry is forecast to contract by 8% per year from 2009 through 2011. Any contraction in this market will reduce our sales, which would adversely affect our profitability and cash flow.
Our business, financial condition, results of operations, prospects and cash flows have been and in the future may be materially and adversely affected by U.S., European and global general economic conditions.
Many aspects of our business, including demand for our products and the pricing and availability of raw materials, are affected by global general economic conditions and, specifically, economic conditions in the U.S. and Europe. General economic conditions and predictions regarding future economic conditions also affect our business strategies, and a decrease in demand for our products or other adverse effects resulting from an economic downturn affecting our geographic end markets may cause us to fail to achieve our anticipated financial results. General economic factors beyond our control that affect our business and end-markets include interest rates, inflation, deflation, consumer credit availability, consumer debt levels, consumer confidence, employment levels, business confidence levels, housing markets, energy costs, tax rates and policy, unemployment rates,
14
commencement or escalation of war or hostilities, the threat or possibility of war, terrorism or other global or national unrest, political or financial instability, and other matters that influence spending by our customers and in our end markets. Increasing volatility in financial markets may cause these factors to change with a greater degree of frequency or increase in magnitude.
Beginning in the fall of 2008 and continuing through 2009 and into 2010, the global economy entered a financial crisis and severe global recession, which materially and adversely impacted our business and the businesses of our customers. Volatile capital and credit markets, declining business and consumer confidence and increased unemployment precipitated a continuing economic slowdown. The economic slowdown decreased demand for the products offered by our customers, resulting in decreased sales volumes and reduced earnings. The severe downturn affected all of our end markets, ultimately required us to restructure our debt in June 2009 and caused our then-existing equity holders to lose the full value of their investment. See "Management's Discussion and Analysis of Financial Condition and Results of Operations—History." Part of our business strategy anticipates recovery in the residential repair and remodel, non-residential construction and RV markets; however, there can be no assurances that a recovery in any of these markets will occur as anticipated. Although there have recently been signs of recovery in many regions, economic weakness could continue or worsen, as has occurred in certain regions of Europe due to concerns over the fiscal and monetary situation in a number of countries. There can be no assurance that governmental or other measures to aid economic recovery, including economic stimulus legislation, will be effective or that our sales volumes will increase or stabilize in the future. There can also be no assurance that the conditions that affected us beginning in the fall of 2008 and during 2009 will not recur or worsen. Continued adverse economic conditions could have a material adverse effect on our business, financial condition, results of operations, prospects and cash flows.
A decline in our relations with our key customers or the amount of products they purchase from us could materially adversely affect our business, financial position, results of operations, prospects and cash flows.
Our business depends on our ability to maintain positive relations with our key customers. In 2009 our largest customer accounted for approximately 11.3% of our net sales and our top ten customers combined accounted for approximately 30.9% of our net sales. Although we have established and maintain significant long-term relationships with our key customers, we cannot assure you that all of these relationships will continue or will not diminish. In addition, we generally do not enter into long-term contracts with our customers and they generally do not have an obligation to purchase products from us. The loss of, or a diminution in, our relationship with any of our largest customers would have a material adverse effect on us. In addition, the loss of any of our largest customers in any of our segments could have a material adverse effect on the results of operations of that segment.
Our competitors may adopt more aggressive sales policies and devote greater resources to the development, promotion and sale of their products than we do, which could result in a loss of customers. Generally, our customers are price sensitive, which could further lead to the loss of customers if our prices do not remain competitive. The loss of, or a reduction in orders from, any significant customers, losses arising from customer disputes regarding shipments, fees, merchandise condition or related matters, or our inability to collect accounts receivable from any major customer could have a material adverse effect on our business. Customers accounting for a significant amount of our revenues may also become more resistant to price changes as their purchase volumes increase relative to our other customers, limiting our ability to increase prices to these customers and eroding our margins. Also, revenue from customers that have accounted for significant revenue in past periods, individually or as a group, may not continue in future periods or, if continued, may not reach or exceed historical levels in any period.
Further, we have no operational or financial control over our customers and have limited influence over how they conduct their businesses. If any of these customers fail to remain competitive
15
in their respective markets or encounter financial or operational problems, our revenue and profitability may decline. Market conditions could also result in our significant customers experiencing financial difficulties. We are exposed to the credit risk of our customers, and their failure to meet their financial obligations when due because of their bankruptcy, lack of liquidity, operational failure or other reasons could result in decreased sales and earnings for us. The decreased availability of consumer credit resulting from the financial crisis, as well as general unfavorable economic conditions, may cause consumers to further decrease their spending, which would reduce the demand for the products of our customers, which would affect our sales and cash flow.
Certain of our customers have been expanding and may continue to expand through consolidation and internal growth, potentially increasing their buying power, which could materially and adversely affect our business, financial condition, results of operations, prospects and cash flows. Certain of our important customers are large companies with significant buying power. In addition, potential further consolidation among our customers could enhance the ability of these customers to seek more favorable terms, including pricing, for the products that they purchase from us. Accordingly, our ability to maintain or raise prices in the future may be limited, including during periods of raw material and other cost increases. See "—Our financial performance is affected by the prices of our key raw materials, particularly aluminum and steel. Price fluctuations relating to aluminum and steel could have a material adverse effect on our business, financial condition, results of operations, prospects and cash flows and limit our operating flexibility." If we are forced to reduce prices or to maintain prices during periods of increased production costs, or if we lose customers because of pricing or other methods of competition, our business, financial condition, results of operations, prospects and cash flows may be materially and adversely affected.
Our financial performance is affected by the prices of our key raw materials, particularly aluminum and steel. Price fluctuations relating to aluminum and steel could have a material adverse effect on our business, financial condition, results of operations, prospects and cash flows and limit our operating flexibility.
The manufacture of our products requires substantial amounts of raw materials, which consist principally of aluminum and steel and, to a lesser extent, paint, glass, copper and vinyl. Over 75% of our raw material costs consist of the cost of aluminum and steel. Our manufacturing operations and our financial performance is affected to a substantial extent by the market prices for these raw materials.
Aluminum and steel are cyclical commodities with prices subject to global market forces of supply and demand and other related factors. Such factors include speculative activities by market participants, production capacity, strength or weakness in key end markets such as housing and transportation, political and economic conditions and production costs in major production regions. Prices have been historically volatile. For example, from January 2008 through May 2010 the London Metals Exchange settlement price for spot aluminum ranged from a high of $1.49 per pound in July 2008 to a low of $0.57 per pound in February 2009. Changes in the prices of aluminum and steel could have a material adverse effect on our business, financial condition, results of operations, prospects and cash flows.
We have historically priced our products by reference to raw material costs and generally we seek to pass through raw material price increases to our customers. However, due to the uncertainty of aluminum and steel prices and the time between material purchases and product sales, we cannot assure you that we always will be able to successfully pass through such price increases to our customers or fully offset the effects of high raw materials costs through productivity improvements. For example, in the U.S., we purchase aluminum based upon the 30-day average price in the month prior to the month of delivery. If we cannot pass increases in the cost of raw materials to our customers, higher prices could cause our customers to consider competitors' products, some of which may be available at a lower cost. For example, where a competitor had previously purchased a large quantity of
16
raw materials into inventory at a lower price, such a competitor could afford to pass on savings from subsequently higher prices to its customers. We also risk purchasing materials for delivery commitments to customers who later file for bankruptcy protection or repudiate or cancel their purchase agreement with us during a falling price environment, causing us to take delivery of raw materials at an above market cost. As a result, to the extent that the time lag associated with a price increase pass through becomes significant, such increases may have a material adverse effect on our business, financial condition, results of operations, prospects and cash flows.
Where changes in aluminum and steel prices are passed through to our customers, increases or decreases in aluminum and steel prices will cause corresponding increases and decreases in reported net sales, causing fluctuations in reported revenues that are unrelated to our level of business activity. Accordingly, any change in the price of aluminum and/or steel could have a material adverse effect on our business, financial condition, results of operations, prospects and cash flows. See "Management's Discussion and Analysis of Financial Condition and Results of Operations—Overview and Executive Summary—Key Factors Affecting our Business" and "Business—Raw Materials."
Our performance is dependent on the continued availability of necessary raw materials, particularly aluminum and steel.
We are dependent on the continued availability of critical raw materials, particularly aluminum and steel. The supply and demand for these critical raw materials are subject to cyclical price fluctuations and other market disturbances, including supply shortages. We purchase a majority of our steel from domestic steel producers, but we have no long-term contracts with any steel suppliers and we generally purchase steel at market prices. In the event of an industry-wide general shortage of raw materials we use, or a shortage or discontinuation of certain types of raw materials, we may not be able to arrange for alternative sources of such raw materials and products. The number of available suppliers has been reduced in recent years due to industry consolidation and bankruptcies affecting steel and metal producers and this trend may continue. Our top ten suppliers accounted for 35% of our purchases during 2009. If we are required to utilize alternative suppliers, this could cause delays in the delivery of such raw materials and possible losses in revenue. Also, alternative suppliers may not be available, or may not provide their products and services at similar or favorable prices. Additionally, increased demand from other countries such as China has put upward pressure on the market prices for raw materials. We also purchase raw materials on a regular basis in an effort to maintain our inventory at levels that we believe are sufficient to satisfy the anticipated needs of our customers based upon historic buying practices and market conditions. However, we cannot assure you that there will always be an adequate supply to meet our demand for aluminum and steel, and we are subject to the risk of lost revenue in the event that we cannot obtain quantities of aluminum and steel necessary to meet customer demand. Interruptions in the operations of our suppliers due to labor or production problems, delivery interruptions, fires, floods, explosions, environmental issues, other Acts of God or other events could disrupt the supply of raw materials. Any disruption in the supply of aluminum and/or steel could have a material adverse effect on our business, financial condition, results of operations, prospects and cash flows, including temporarily impairing our ability to manufacture our products for our customers or requiring us to pay higher prices in order to obtain aluminum and/or steel from other sources, which could affect our net sales and profitability.
Due to our reliance on unique fabrication techniques for the niche markets we serve, our business is subject to risks associated with manufacturing processes.
We manufacture most of our products at our own production facilities. Any loss of the use of all or a portion of any of our facilities due to accidents, fires, explosions, labor issues, adverse weather conditions, natural disasters such as floods, tornados, hurricanes, ice storms and earthquakes, supply interruptions, transportation interruptions, human error, mechanical failure, terrorist acts, power
17
outages, discharges or releases of toxic or hazardous substances or gases, storage tank leaks and other environmental issues, or otherwise, whether short or long-term, could have a material adverse effect on us and our operations. As such events occur, we may experience substantial business losses, production delays, third party lawsuits and significant repair costs, as well as personal injury and/or loss of life, which could materially and adversely affect our business, financial condition, results of operations, prospects and cash flows.
In addition, unexpected failures of our equipment and machinery may result in production delays, revenue loss and significant repair costs, as well as injuries to our employees. Any interruption in production capability may require us to make large capital expenditures to remedy the situation, which could have a negative impact on our profitability and cash flows. A loss or interruption of production at certain of our facilities, such as our manufacturing facilities in The Netherlands, could significantly disrupt our operations and affect a large number of customers, decreasing our revenues. Moreover, there are a limited number of manufacturers that make the machines we use in our business. Because we supply certain of our products to OEMs, a temporary or long-term business disruption could result in a permanent loss of customers, who may be required to seek alternate suppliers. If this were to occur, our future sales levels, and therefore our business, financial condition, results of operations, prospects and cash flows, could be materially and adversely affected.
We are also subject to losses associated with equipment shutdowns which may be caused by the loss or interruption of electrical power to our facilities due to unusually high demand, blackouts, adverse weather, equipment failure or other catastrophic events. Losses caused by disruptions in the supply of electrical power could materially and adversely affect our business, financial condition, results of operations, prospects and cash flows. See "—Losses caused by disruptions in the supply of power or increases in energy costs would adversely affect our operations."
Our production facilities are located throughout North America and Europe. In the future, we may construct new manufacturing plants or repair or refurbish existing plants. Delays in the construction, repair and refurbishment of a manufacturing plant can occur as a result of events such as insolvency, work stoppages, other labor actions or "force majeure" events experienced by the companies working on the plants that are beyond our control. Any termination or breach of contract following such an event may result in, among other things, the forfeiture of prior deposits or payments made by us, potential claims and impairment of losses. A significant delay in the construction of a new plant or repair of an existing plant could have a material adverse effect on our business, financial condition, results of operations, prospects and cash flows.
Losses caused by disruptions in the supply of power or increases in energy costs would adversely affect our operations.
We use large amounts of electricity, natural gas and other energy sources to operate our manufacturing facilities. Any loss of power which reduces the amperage to our equipment or causes an equipment shutdown would result in a reduction in production volume. Interruptions in the supply of electrical power to our facilities can be caused by a number of circumstances, including unusually high demand, blackouts, equipment or transformer failure, human error, natural disasters or other catastrophic events. If such a condition were to occur, we may lose production for a prolonged period of time and incur significant losses. In addition, the volatility in costs of fuel, principally natural gas, and other utility services, principally electricity, used by our production facilities affect operating costs. Fuel and utility prices have been, and will continue to be, affected by factors outside our control, such as supply and demand for fuel and utility services in both local and regional markets and the potential regulation of greenhouse gases. Future increases in fuel and utility prices may have a material adverse effect on our business, financial condition, results of operations, prospects and cash flows.
18
The insurance that we maintain may not fully cover all potential exposures.
We maintain property, casualty and workers' compensation insurance, but such insurance does not cover all risks associated with the hazards of our business and is subject to limitations, including deductibles and maximum liabilities covered. We may incur losses beyond the limits, or outside the coverage, of our insurance policies, including liabilities for environmental compliance or remediation. In addition, from time to time, various types of insurance for companies in our industries have not been available on commercially acceptable terms or, in some cases, have not been available at all. In the future, we may not be able to obtain coverage at current levels, and our premiums may increase significantly on coverage that we maintain.
Consistent with market conditions in the insurance industry, premiums and deductibles for some of our insurance policies have been increasing and may in the future increase substantially. In some instances, some types of insurance may become available only for reduced amounts of coverage, if at all. In addition, there can be no assurance that our insurers would not challenge coverage for certain claims. Moreover, in some instances our insurers may become insolvent and could be unable to pay claims that are made in the future. If we were to incur a significant liability for which we were not fully insured or that our insurers disputed, it could have a material adverse effect on our financial condition. Even with insurance with sufficient coverage, we may still experience a significant interruption to our operations as discussed above. We also cannot assure you that we will maintain or renew our insurance on comparable terms or in sufficient amounts in the future.
We operate in highly competitive markets and our failure to compete effectively may adversely affect our business, financial condition, results of operations, prospects and cash flows.
The markets in which we operate are highly competitive. In the U.S., we face competition in each of our segments from both large and small companies. In Europe, our competitors include a number of integrated companies in the coil coating business. Other smaller companies compete with us in the building and construction, RV and transportation markets in Europe, both on a regional basis and on a pan-European basis. Some of our competitors are larger than us and have significantly greater financial, marketing and technical resources and greater purchasing power than we do. These competitors may be better able to withstand reduced revenues and adverse industry or economic conditions. Further, new competitors could emerge from within North America, Europe or globally. Due to the competitiveness in the various markets in which we operate, we may not be able to increase prices for our products to cover increases in our costs, including increases in raw material costs, or we may face pressure to reduce prices, which could materially and adversely affect our profitability. If we do not compete successfully, our business, financial condition, results of operations, prospects and cash flows could be materially and adversely affected.
Competitive factors in our industry include, without limitation, the importance of customer loyalty, changes in market penetration, increased price competition, the introduction of new products and technology by existing and new competitors, changes in marketing, product diversity, sales and distribution and the ability to supply products to customers in a timely manner. Further, branding is not a significant factor in the sale of many of our products to the end user and the barriers to entry resulting from product branding are therefore lower. In addition, because we do not have long-term contractual arrangements with many of our customers, these competitive factors could cause our customers to cease purchasing our products and shift suppliers.
In addition, our competitors may develop products that are superior to our products or may adapt more quickly to new technologies or evolving customer requirements. Technological advances by our competitors may lead to new material substitutions that are superior to aluminum, steel, copper and vinyl or that may make our products obsolete. New manufacturing techniques developed by competitors may make it more difficult for us to compete. For example, during the 1980s, fiberglass siding was introduced as an alternative to aluminum and took considerable market share in the U.S. RV products end market. Consolidation of our competitors or customers may also adversely affect our
19
businesses. Furthermore, global competition and customer demands for efficiency will continue to make price increases difficult. Because we are largely affected by customer needs and demands, we face uncertainties related to downturns or financial difficulties in our customers' businesses and unanticipated customer production shutdowns or curtailments.
We are increasingly dependent on information technology in our operations. If our computer systems fail or if we are unable to protect our information systems against data corruption, cyber-based attacks or network security breaches, our operations could be disrupted.
We rely on information technology networks and systems, including the Internet, to process, transmit and store electronic information and to support all aspects of our geographically diverse business operations. In particular, we depend on our information technology infrastructure for electronic communications among our locations around the world and between our personnel and other customers and suppliers. Such systems are subject to damage or interruption from power outages, computer and telecommunications failures, computer viruses, security breaches and natural disasters.
We may experience problems with either the operation of our current information technology systems or the development and implementation of our new ERP system that could adversely affect, or even temporarily disrupt, all or a portion of our operations until resolved, affecting our ability to realize projected and expected cost savings and causing significant loss. Damage or interruption to our computer systems may require a significant investment to fix or replace them, and we may suffer interruptions in our operations in the interim. A prolonged interruption or failure of any of our systems or their connective networks could have a material adverse effect on our business, financial condition, results of operations, prospects and cash flows.
Additionally, a compromise of our security systems resulting in unauthorized access to certain personal information about our customers or distributors could adversely affect our reputation with our customers, distributors and others, as well as our operations, and could result in litigation against us or the imposition of penalties. Security breaches of this infrastructure can create system disruptions, shutdowns or unauthorized disclosure of confidential information. If we are unable to prevent such breaches, our operations could be disrupted, or we may suffer financial damage or loss because of lost or misappropriated information. In addition, most states have enacted laws requiring companies to notify individuals and often state authorities of data security breaches involving their personal data. These mandatory disclosures regarding a security breach often lead to widespread negative publicity, which may cause our customers to lose confidence in the effectiveness of our data security measures. Any security breach, whether successful or not, would harm our reputation and brand, and it could cause the loss of customers. A security breach could also require that we expend significant additional resources related to our information security systems.
We also rely heavily on our information technology staff. If we cannot meet our staffing needs in this area, we may not be able to fulfill our technology initiatives while continuing to provide maintenance on existing systems. We rely on certain software vendors to maintain and periodically upgrade many of these systems so that they can continue to support our business. The software programs supporting many of our systems were licensed to us by independent software developers. The inability of these developers or us to continue to maintain and upgrade these information systems and software programs would disrupt or reduce the efficiency of our operations if we were unable to convert to alternate systems in an efficient and timely manner. In addition, costs and potential problems and interruptions associated with the implementation of new or upgraded systems and technology, including our new ERP system, or with maintenance or adequate support of existing systems could also disrupt or reduce the efficiency of our operations. Additionally, any systems failures could impede our ability to timely collect and report financial results in accordance with applicable laws and regulations.
20
Our business is subject to seasonality, with our highest sales volumes typically occurring during our second and third quarters.
Our business is subject to seasonality, with the second and third quarters typically accounting for our highest sales volumes. As a result, quarter-to-quarter comparisons of our sales and operating results should not be relied on as an indication of future performance, and the results of any quarterly period may not be indicative of expected results for a full year. Additionally, this seasonality affects how we manage our cash flows over the course of the year. For example, our working capital needs are typically at their highest during the second and third quarters.
Adverse weather conditions could have a material adverse effect on our business, financial condition, results of operations, prospects and cash flows.
Unusually prolonged periods of cold, rain, blizzards, hurricanes or other severe weather patterns could delay, halt or postpone renovation and construction activity. For example, an unusually severe winter can lead to reduced construction, repairing and remodeling activity and exacerbate the seasonal decline in our sales, cash flows from operations and results of operations during the winter months. If sales were to fall substantially below levels we would normally expect during certain periods, our financial results would be adversely impacted.
We may be unable to protect our intellectual property rights, and we may be subject to intellectual property litigation and infringement claims by third parties.
We rely on a combination of patents, trademarks, trade secrets, proprietary technology and technology advancements to maintain competitiveness in the market and to protect our branded products. We have licensed, and may license in the future, certain intellectual property and technology from third parties. Despite our efforts to protect our proprietary rights, third parties, including our competitors, may copy or otherwise obtain and use our products or technology. It is difficult for us to monitor unauthorized uses of our products or technology and we may not be able to adequately minimize damages to us from these violations. Failures to protect our intellectual property could have a material adverse effect on the competitiveness or profitability of our business. The steps we have taken may not prevent unauthorized use of our technology, particularly in foreign countries where the laws may not protect our proprietary rights as fully as in the United States. Further, we may not be able to deter current and former employees, contractors and other parties from breaching confidentiality obligations and misappropriating proprietary information. In addition, we cannot guarantee that our applications for registered protection will be accepted by the relevant registries or that courts will find any resulting registrations to be valid. If third parties take actions that affect our rights or the value of our intellectual property, similar proprietary rights or reputation, or we are unable to protect our intellectual property from infringement or misappropriation, other companies may be able to use our intellectual property to offer competitive products at lower prices and we may not be able to effectively compete against these companies. In addition, if any third party copies or imitates our products, in a manner that projects a lesser quality or carries a negative connotation, this could have a material adverse effect on our goodwill in the marketplace because it would damage the reputation of our products generally, whether or not it violates our intellectual property rights.
In addition, we face the risk of claims that we are infringing third parties' intellectual property rights. Although we believe that our intellectual property rights are sufficient to allow us to conduct our business without incurring liability to third parties, from time to time we are involved in legal proceedings that arise relating to intellectual property, and we can give no assurance that claims or litigation asserting infringement by us of intellectual property rights will not be initiated in the future seeking damages, payment of royalties or licensing fees, or an injunction against the sale of our products, or that we would prevail in any litigation or be successful in preventing such judgment. Any such claim, even if it is without merit, could be expensive and time-consuming to defend; could cause us to cease making, using or selling certain products that incorporate the disputed intellectual property;
21
could require us to redesign our products, if feasible; and could divert management time and attention, each of which could have a material adverse effect on our business, financial condition, results of operations, prospects and cash flows. In the event a claim of infringement against us is successful, we may be required to pay royalties or license fees to continue to use the applicable technology or other intellectual property rights or may be unable to obtain necessary licenses from third parties at all, or at a reasonable cost or within a reasonable time.
In the future, we may also rely on litigation to enforce our intellectual property rights and contractual rights and, if not successful, we may not be able to protect the value of our intellectual property. Regardless of the outcome, any litigation, whether commenced by us or third parties, could be protracted and costly and could have a material adverse effect on our business, financial condition, results of operations, prospects and cash flows.
We could face potential product liability or warranty claims relating to products we manufacture or distribute, and we may not have sufficient insurance coverage or funds available to cover all potential claims.
We face exposure to product liability claims in the event that the use of our products is alleged to have resulted in injury or other adverse effects. We currently maintain product liability coverage, but we may not be able to continue to maintain such insurance on acceptable terms in the future, if at all, or ensure that any such insurance provides adequate coverage against potential claims. Product liability claims can be expensive to defend and may divert management or other personnel for months or years regardless of the ultimate outcome. An unsuccessful product liability defense could have a material adverse effect on our business, financial condition, results of operations, prospects and cash flows.
We also provide warranties on certain products and are subject to potential warranty claims to the extent that products we manufacture are defective. The warranty periods differ depending on the product, but generally range from one year to limited lifetime warranties. We provide accruals for warranties based on historical experience and expectations of future occurrence. We may experience increased costs of warranty claims if our products are manufactured or designed defectively. Our warranty accruals may be insufficient or we could in the future become subject to a significant and unexpected warranty expense, which could have a material adverse effect on our business, financial condition, results of operations, prospects and cash flows.
We are subject to strict environmental laws and regulations that may lead to significant, unforeseen expenses.
Our manufacturing operations are subject to a range of federal, state, municipal, local, and foreign environmental and occupational health and safety laws and regulations, including those relating to air emissions, wastewater discharges, the handling and disposal of solid and hazardous waste and hazardous substances, and the remediation of contamination associated with the current and past use of hazardous substances or materials. We may not be, at all times, in compliance with all such requirements. Many of our operations require environmental permits and controls pursuant to these laws and regulations to prevent and limit pollution. These permits contain terms and conditions that impose limitations on our manufacturing activities, production levels and associated activities and periodically may be subject to modification, renewal and revocation by issuing authorities. Historically, the costs of achieving and maintaining compliance with environmental and health and safety requirements have not been material. However, the operation of manufacturing plants entails risks in these areas, and a failure by us to comply with applicable environmental, health and safety laws and regulations, or to obtain required permits necessary for our operations, could result in civil or criminal fines, penalties, enforcement actions, third party claims for property damage and personal injury, requirements to clean up property or to pay for the costs of cleanup, or regulatory or judicial orders enjoining or curtailing operations or requiring corrective measures, including the installation of pollution control equipment or remedial actions.
22
Under certain of these laws and regulations, such as the federal Comprehensive Environmental Response, Compensation, and Liability Act (CERCLA), known as the Superfund law, and its state law analogs, we may be held liable for releases of hazardous substances on or from our properties or any offsite disposal location to which we may have sent waste or if contamination from prior activities is discovered at any of our current or former properties. Such liability may include cleanup costs, natural resource damages and associated transaction costs. Liability under these laws can be joint and several, and can be imposed without regard to fault or the lawfulness of the actions that led to the release at the time they occurred.
Pursuant to these laws, we have been named as a potentially responsible party in state and federal administrative and judicial proceedings seeking contribution for costs associated with the investigation, analysis, correction and remediation of environmental conditions at eleven hazardous waste disposal sites. We continue to monitor these actions and proceedings and to vigorously defend them. Our ultimate liability in connection with present and future environmental claims will depend on many factors, including our volumetric share of the waste at a given site, the remedial action required, the total cost of remediation, and the financial viability and participation of the other entities that also sent waste to the site. Once it becomes probable that we will incur costs in connection with remediation of a site and such costs can be reasonably estimated, we establish or adjust our reserve for our projected share of these costs. Pursuant to the terms of the Alumax acquisition agreement, subject to certain terms and limitations, Alumax (and its successors) have agreed to indemnify us for all of the costs associated with each of these sites as well as for all of the costs associated with nine additional sites to which we may have sent waste for disposal but for which we have not received any notice of potential responsibility. We also establish reserves for investigation or remediation required from time to time at our own facilities, which represents our best estimate of probable liabilities with respect to environmental matters. As of April 2, 2010, we had no reserves recorded for environmental clean-up. However, the estimation of environmental liabilities is subject to uncertainties, including the scope and nature of contamination conditions, the success of remediation technologies being employed, new or changes to environmental laws, regulations or policies, future findings of investigation or remediation actions, alteration to expected remediation plans, Alumax's willingness or ability to honor its indemnification obligations or the number, financial condition and cooperation of other potentially responsible parties. In the event we are responsible for the costs of environmental cleanup, any actual liabilities that exceed our reserves may have a material and adverse effect on our financial condition and, in particular, our earnings. In addition, we may incur significant liabilities under cleanup laws and regulations in connection with environmental conditions currently unknown to us relating to our existing, prior, or future sites or operations or those of predecessor companies whose liabilities we may have assumed or acquired. See "Business—Environmental, Health and Safety Matters."
Compliance with environmental laws and regulations can be costly, and we have incurred and will continue to incur costs, including capital expenditures, to comply with these requirements. In addition, these laws and regulations and their interpretation or enforcement, are constantly evolving and have tended to become more stringent over time and the impact of these changes on our business, financial condition, results of operations, prospects or cash flows are impossible to predict. It is impossible to predict accurately the effect that changes in these laws and regulations, or their interpretation or enforcement, may have upon our business, financial condition, results of operations, prospects or cash flows. In particular, legislation and regulations limiting emissions of greenhouse gases, including carbon dioxide associated with the burning of fossil fuels, are at various stages of consideration and implementation, and if fully implemented, may significantly increase the price of the raw materials for our products and negatively impact the financial condition of many of our customers. If our compliance costs increase and are passed through to our customers, our products may become less competitive than other materials, which could reduce our sales, perhaps materially. Our costs of compliance with current and future environmental requirements could materially and adversely affect our business, financial condition, results of operations, prospects and cash flows.
23
Our substantial indebtedness and significant debt service obligations could adversely affect our ability to raise additional capital to fund our operations, limit our ability to react to changes in the economy or our industry and expose us to interest rate risk to the extent of our variable rate debt.
We have substantial indebtedness. As of April 2, 2010, after giving effect to this offering and the use of proceeds thereof, we would have had total indebtedness of approximately $ million. Subject to the limits contained in our credit facilities, we and our subsidiaries may incur additional debt from time to time to finance capital expenditures, investments or acquisitions, or for other general corporate purposes. In addition, a significant portion of our first lien credit facility consists of a payment-in-kind loan that allows us to pay interest by increasing the principal amount of the loan rather than paying cash interest; if the interest is not paid in cash, the pay-in-kind feature will result in our debt outstanding increasing substantially without additional borrowing. Our ability to make scheduled payments on or to refinance our debt obligations depends on our financial condition and operating performance, our lenders' financial stability, which are subject to prevailing global economic and market conditions, and certain financial, business and other factors, many of which are beyond our control. Even if we were able to refinance or obtain additional financing, the costs of new indebtedness could be substantially higher than the costs of our existing indebtedness.
Our substantial indebtedness could have important negative consequences to you, including:
- •
- we may have difficulty obtaining financing in the future for working capital, capital expenditures, acquisitions, debt
service or other purposes;
- •
- we will need to use a substantial portion of our available cash flow to pay interest and principal on our debt, which will
reduce the amount of money available to finance our operations and other business activities;
- •
- some of our debt, including our borrowings under our credit facilities, bear variable rates of interest, which exposes us
to the risk of interest rates increasing;
- •
- our substantial indebtedness increases our vulnerability to general economic downturns and adverse industry conditions;
- •
- our substantial indebtedness could limit our flexibility in planning for, or reacting to, changes in our business and in
our industry in general;
- •
- our substantial indebtedness and the amount we need to pay to service our indebtedness could place us at a competitive
disadvantage compared to our competitors that have less debt; and
- •
- our failure to comply with the financial and other restrictive covenants in our debt instruments which, among other things, require us to maintain specified financial ratios and limit our ability to incur debt and sell assets, could result in an event of default that, if not cured or waived, could have a material adverse effect on our business or prospects.
In addition, our credit facilities contain financial and other restrictive covenants that will limit our ability to engage in activities that may be in our long-term best interest. Beginning in 2011, our first lien credit agreement will also require the application of 75% of our consolidated excess cash flow (as defined in our first lien credit agreement) to prepay amounts outstanding under this facility. See "Management's Discussion and Analysis of Financial Condition and Results of Operations—Liquidity and Capital Resources." Our failure to comply with those covenants could result in an event of default, which, if not cured or waived, could result in the acceleration of all of our debt.
24
We may not be able to generate sufficient cash to service all of our indebtedness and may not be able to refinance our indebtedness on favorable terms. If we are unable to do so, we may be forced to take other actions to satisfy our obligations under our indebtedness, which may not be successful.
Our ability to make scheduled payments on or to refinance our debt obligations depends on our financial condition and operating performance, which are subject to prevailing economic and competitive conditions and to certain financial, business and other factors beyond our control. We cannot assure you we will maintain a level of cash flows from operating activities sufficient to permit us to pay the principal, premium, if any, and interest on our indebtedness.
As of April 2, 2010, our substantial indebtedness included $523.3 million of indebtedness under our first lien credit facility, which matures in June 2013. We currently have no indebtedness outstanding under our ABL Facility, which terminates in June 2012. After giving effect to this offering and the use of proceeds thereof, we would have had total indebtedness of approximately $ million as of April 2, 2010. Because a significant portion of our indebtedness matures in the next few years, we may find it necessary or prudent to refinance that indebtedness with longer-maturity debt at a higher interest rate. Our ability to refinance our indebtedness on favorable terms, or at all, is directly affected by global economic and financial conditions. In addition, our ability to incur secured indebtedness (which would generally enable us to achieve better pricing than the incurrence of unsecured indebtedness) depends in part on the value of our assets, which depends, in turn, on the strength of our cash flows and results of operations, and on economic and market conditions and other factors.
If our cash flows and capital resources are insufficient to fund our debt service obligations or we are unable to refinance our indebtedness, we may be forced to reduce or delay investments and capital expenditures, or to sell assets, seek additional capital or restructure our indebtedness. These alternative measures may not be successful and may not permit us to meet our scheduled debt service obligations. If our operating results and available cash are insufficient to meet our debt service obligations, we could face substantial liquidity problems and might be required to dispose of material assets or operations to meet our debt service and other obligations. We may not be able to consummate those dispositions, or the proceeds from the dispositions may not be adequate to meet any debt service obligations then due. If we were unable to repay amounts when due, our lenders could proceed against the collateral granted to them to secure that indebtedness. Such collateral includes substantially all of our assets under our existing credit facilities.
Our credit facilities contain restrictions that limit our flexibility in operating our business.
Our credit facilities contain a number of restrictive covenants that impose significant restrictions on us. Compliance with these restrictive covenants limits our flexibility in operating our business and could prevent us from engaging in favorable business activities or financing future operations or capital needs. Failure to comply with these covenants could give rise to one or more defaults or events of default under our credit facilities. These covenants restrict, among other things, our ability to:
- •
- incur indebtedness;
- •
- repurchase or redeem capital stock;
- •
- pay certain dividends, make certain distributions, make loans and transfer property;
- •
- make capital expenditures, acquisitions or investments;
- •
- incur liens;
- •
- sell assets;
25
- •
- issue or sell capital stock;
- •
- enter into transactions with affiliates;
- •
- consolidate or merge with other companies or sell all or substantially all of our assets; and
- •
- engage in certain business activities.
If we default on any of these covenants, our lenders could cause all amounts outstanding under the applicable credit facilities to be due and payable immediately, and the lenders under our credit facilities could proceed against any collateral securing that indebtedness. Our assets or cash flow may not be sufficient to repay in full the borrowings under our credit facilities, either upon maturity or if accelerated upon an event of default. In addition, any event of default or declaration of acceleration under one debt instrument could also result in a default or an event of default under one or more of our other debt instruments. We have pledged a significant portion of our assets as collateral under the credit facilities.
Despite our substantial indebtedness, we and our subsidiaries may still be able to incur significantly more debt. This could increase the risks associated with our substantial leverage, including our ability to service our indebtedness.
Our credit facilities contain restrictions on our subsidiaries' ability to incur additional indebtedness. However, these restrictions are subject to a number of important qualifications and exceptions, and the indebtedness incurred in compliance with these restrictions could be substantial. Accordingly, we and our subsidiaries could incur significant additional indebtedness in the future, much of which could constitute secured or senior indebtedness. In addition, a significant portion of our first lien credit facility consists of a payment-in-kind loan that allows us to pay interest by increasing the principal amount of the loan rather than paying cash interest; if the interest is not paid in cash, the pay-in-kind feature will result in our debt outstanding increasing substantially without additional borrowing. Moreover, because interest which is paid in the form of additional principal accrues on this payment-in-kind loan at an annual margin that is 2% greater than the applicable cash interest rate, our use of the payment-in-kind feature both increases our leverage and also increases the effective interest we pay on our debt. The more leveraged we and our subsidiaries become, the more we and our subsidiaries, and in turn our security holders, become exposed to the risks described above under "—Our substantial indebtedness and significant debt service obligations could adversely affect our ability to raise additional capital to fund our operations, limit our ability to react to changes in the economy or our industry and expose us to interest rate risk to the extent of our variable rate debt."
Our variable-rate indebtedness subjects us to interest rate risk, which could cause our annual debt service obligations to increase significantly.
Substantially all of our and our subsidiaries' indebtedness is subject to variable rates of interest and expose us to interest rate risk. Our variable rate indebtedness is also subject to minimum rates of interest that limit the potential benefit of any decrease in variable rates. If interest rates exceed the minimum rates payable on our debt, our debt service obligations on the variable rate indebtedness would increase, resulting in a reduction of our net income, even though the amount borrowed remained the same. As of April 2, 2010, after giving effect to this offering and the use of proceeds thereof, we would have had total indebtedness of approximately $ million. Based on this amount of indebtedness, if interest rates remained at April 2, 2010 levels, our annualized cash interest expense would be approximately $ million, all of which represents interest expense on floating-rate obligations (and thus is subject to increase in the event interest rates rise), prior to any consideration of the impact of interest rate swaps. A 1% increase in the interest rate on our indebtedness would
26
increase our annual interest expense by approximately $ million, prior to any consideration of the impact of minimum interest rates on our indebtedness.
Instability and volatility in the capital and credit markets could have a negative impact on our business, financial condition, results of operations and cash flows.
The capital and credit markets have experienced extreme volatility and disruption over the past two years. Our business, financial condition, results of operations, prospects and cash flows could be negatively impacted by the difficult conditions and extreme volatility in the capital, credit and commodities markets and in the global economy. The difficult conditions in these markets and the overall economy affect us in a number of ways. For example:
- •
- Although we believe we will have sufficient liquidity under our credit facilities to run our business, under extreme
market conditions there can be no assurance that such funds would be available under the facilities or sufficient to meet our needs, and in such a case, we may not be able to successfully obtain
additional financing on favorable terms, or at all.
- •
- Recent market volatility could make it difficult for us to raise additional debt and/or equity capital in the public or
private markets if we needed to do so.
- •
- Market conditions could cause the counterparties to the derivative financial instruments we use to hedge our exposure to
interest rate fluctuations to experience financial difficulties and, as a result, our efforts to hedge these exposures could prove unsuccessful, and, furthermore, our ability to engage in additional
hedging activities may decrease or become even more costly as a result of these conditions.
- •
- Our credit facilities contain various covenants that we must comply with. Due to the current economic environment there can be no assurance that we would be able to successfully amend our credit facilities in the future if we were to fail to comply with these covenants. Further, any such amendment could be very expensive and materially impair our cash flow and liquidity.
We are subject to the risks of doing business in foreign countries.
We are, and will continue to be, subject to financial, political, economic and business risks in connection with our non-U.S. operations. In 2009, 32% of our net sales were made outside of the U.S., and as of April 2, 2010 we operated six manufacturing and distribution facilities in Europe and two in Canada. Doing business in foreign countries entails certain risks, including, but not limited to:
- •
- exchange rate fluctuations;
- •
- adverse changes in economic conditions in other countries;
- •
- political or civil unrest and insurrection and armed hostilities;
- •
- government policies against ownership of businesses by non-nationals;
- •
- reduced protection of intellectual property rights;
- •
- a need to comply with numerous laws and regulations in each jurisdiction in which we operate;
- •
- legal systems that may be less developed and less predictable than those in the United States;
- •
- shipping delays;
27
- •
- licensing and other legal requirements;
- •
- local tax issues;
- •
- longer payment cycles in certain foreign markets;
- •
- the difficulties of staffing and managing dispersed international operations;
- •
- language and cultural issues in regions of the world outside the United States;
- •
- renegotiation or modification of existing agreements or arrangements with governmental authorities;
- •
- exportation and transportation tariffs;
- •
- foreign exchange restrictions and trade protection measures;
- •
- changes in the value of the U.S. dollar relative to foreign currencies; and
- •
- differences in laws governing employee and union relations.
The occurrence of any of these risks could materially disrupt or adversely impact our business.
In addition, because a significant portion of our operations are outside the U.S., we are subject to limitations on our ability to repatriate funds to the U.S. These limitations arise from regulations in certain countries that limit our ability to remove funds from or transfer funds to foreign subsidiaries, as well as from tax liabilities that would be incurred in connection with such transfers. These regulations could significantly limit our liquidity.
In addition, our revenues, expenses, cash flows and results of operations could be affected by actions in foreign countries that more generally affect the global markets, including inflation, fluctuations in currency and interest rates, competitive factors, civil unrest and labor problems. Our operations and the commercial markets for our products could also be materially and adversely affected by acts of war, terrorism or the threat of any of these events as well as government actions such as controls on imports, exports and prices, tariffs, new forms of taxation or changes in fiscal regimes and increased government regulation in countries engaged in the manufacture or consumption of aluminum and steel products. Unexpected or uncontrollable events or circumstances in any of these markets could materially and adversely affect our business, financial condition, results of operations, prospects and cash flows.
Fluctuations in foreign currency exchange rates could negatively affect our financial results.
We earn revenues, pay expenses, own assets and incur liabilities in countries using currencies other than the U.S. dollar. In 2009, we used three functional currencies in addition to the U.S. dollar and derived approximately 32% of our net sales from operations outside the U.S. Because our consolidated financial statements are presented in U.S. dollars, we must translate net sales, net income and expenses, as well as assets and liabilities, into U.S. dollars at exchange rates in effect during or at the end of each reporting period. Therefore, increases or decreases in the value of the U.S. dollar against other major currencies will affect our net sales, operating income and the value of balance sheet items, including intercompany assets and obligations. Changes in the value of the currencies we use also affect the value and amount of our debt which is recorded on our balance sheet. Because of the geographic diversity of our operations, weaknesses in some currencies might be offset by strengths in others over time. However, we cannot assure you that fluctuations in foreign currency exchange rates, particularly the strengthening of the U.S. dollar against major currencies, such as the Euro, or the currencies of large developing countries, would not materially adversely affect our financial results.
28
Doing business in foreign countries requires us to comply with U.S. and foreign anti-corruption laws and economic sanctions programs.
Our international operations are subject to U.S. and foreign anti-corruption laws and regulations, such as the Foreign Corrupt Practices Act ("FCPA"), and economic sanction programs administered by the U.S. Treasury Department's Office of Foreign Assets Control ("OFAC"). As a result of doing business in foreign countries, we are exposed to a heightened risk of violating anti-corruption laws and OFAC regulations. The FCPA prohibits us from providing anything of value to foreign officials for the purposes of obtaining or retaining business or securing any improper business advantage. As part of our business, we may deal with state-owned business enterprises, the employees of which are considered foreign officials for purposes of the FCPA. In addition, some of the international locations in which we operate lack a developed legal system and have higher than normal levels of corruption. Economic sanctions programs administered by OFAC restrict our business dealings with certain sanctioned countries and other sanctioned individuals and entities.
Violations of anti-corruption laws and OFAC regulations are punishable by civil penalties, including fines, denial of export privileges, injunctions, asset seizures, debarment from government contracts and revocations or restrictions of licenses, as well as criminal fines and imprisonment. We have established policies and procedures designed to assist our compliance with applicable U.S. and foreign laws and regulations. However, there can be no assurance that our policies and procedures will effectively prevent us from violating these laws and regulations in every transaction in which we may engage, and such a violation could materially and adversely affect our reputation, business, financial condition, results of operations, prospects and cash flows. In addition, various U.S. state and municipal governments, universities and other investors maintain prohibitions or restrictions on investments in companies that do business with sanctioned countries.
We are subject to various federal, state, local and non-U.S. tax requirements.
We may be subject to federal, state and local income taxes in the United States and non-U.S. income taxes in numerous other jurisdictions in which we transact business or generate net sales. Increases in income tax rates could reduce our after-tax income from affected jurisdictions. In addition, there have been proposals to reform U.S. tax laws that could significantly impact how U.S. multinational corporations are taxed in the U.S. on their foreign earnings; because we earn a substantial portion of our income in foreign countries, these proposals could affect our tax rates in a material and adverse manner. Although we cannot predict whether or in what form these proposals will pass, several of the proposals being considered could have a material adverse impact on our tax expense and cash flow, if such proposals are enacted.
Our business operations are subject to numerous duties or taxes that are not based on income, sometimes referred to as "indirect taxes," including import duties, excise taxes, sales or value-added taxes, property taxes and payroll taxes, in many of the jurisdictions in which we operate, including indirect taxes imposed by state and local governments. Increases in or the imposition of new indirect taxes on our business operations or products would increase the cost of products or, to the extent levied directly on consumers, make our products less affordable.
We are subject to taxation in multiple jurisdictions.
We are subject to taxation primarily in the U.S., Canada, the United Kingdom, The Netherlands and France. Our effective tax rate and tax liability will be affected by a number of factors, such as the amount of taxable income we generate in particular jurisdictions, the tax rates in those jurisdictions, tax treaties between jurisdictions, the extent to which we transfer funds and repatriate funds from our subsidiaries and future changes in local tax law. Our tax liability will usually be dependent upon our operating results and the manner in which our operations are funded. Generally,
29
the tax liability for each legal entity is determined either on a non-consolidated basis or on a consolidated basis only with other entities incorporated in the same jurisdiction. In either case, our tax liability is determined without regard to the taxable losses of non-consolidated affiliated entities. As a result, we may pay income taxes in one jurisdiction for a particular period even though on an overall basis we incur a net loss for that period.
We may experience fluctuations in our tax obligations and effective tax rate.
We are subject to taxes in the U.S. and numerous international jurisdictions. We record tax expense based on our estimates of future tax payments, which include reserves for estimates of probable settlements of international and domestic tax audits. At any one time, many tax years are subject to audit by various taxing jurisdictions. The results of these audits and negotiations with taxing authorities may affect the ultimate settlement of these issues. As a result, we expect that throughout the year there could be ongoing variability in our quarterly tax rates as taxable events occur and exposures are re-evaluated. Further, our effective tax rate in a given period may be materially impacted by changes in the mix and level of earnings by taxing jurisdiction or by changes to existing accounting rules or regulations.
Changes to accounting rules or regulations may adversely affect our financial position and results of operations.
Changes to existing accounting rules or regulations may impact our future results of operations and our ability to comply with covenants under our credit agreements or cause the perception that we are more highly leveraged. In addition, new accounting rules or regulations and varying interpretations of existing accounting rules or regulations may be adopted in the future. For instance, accounting regulatory authorities have indicated that they may begin to require lessees to capitalize operating leases in their financial statements in the next few years. If adopted, such a change would require us to record capital lease obligations on our balance sheet and make other changes to our financial statements. This and other future changes to accounting rules or regulations could adversely affect our financial position, results of operations and liquidity.
Acquisitions or divestitures that we make in the future may be unsuccessful.
We may opportunistically consider the acquisition of other companies or product lines of other businesses that either complement or expand our existing business, or we may consider the divestiture of some of our businesses. We may consider and make acquisitions or divestitures both in countries in which we currently operate and elsewhere. We cannot assure you that we will be able to consummate any such acquisitions or divestitures or that any future acquisitions or divestitures will be consummated at acceptable prices and terms. Any future acquisitions or divestitures we pursue may involve a number of special risks, including, but not limited to, some or all of the following:
- •
- the diversion of management's attention from our core businesses;
- •
- the disruption of our ongoing business;
- •
- entry into markets in which we have limited or no experience, including geographies that we have not previously operated
in;
- •
- the ability to integrate our acquisitions without substantial costs, delays or other problems, which would be complicated
by the breadth of our international operations;
- •
- inaccurate assessment of undisclosed liabilities;
30
- •
- potential known and unknown liabilities of the acquired businesses and limitations of seller indemnities;
- •
- the incorporation of acquired products into our business;
- •
- the failure to realize expected synergies and cost savings;
- •
- the loss of key employees or customers of the acquired or divested business;
- •
- increasing demands on our operational systems;
- •
- the integration of information system and internal controls;
- •
- possible adverse effects on our reported operating results, particularly during the first several reporting periods after
the acquisition is completed; and
- •
- the amortization of acquired intangible assets.
Additionally, any acquisitions we may make could result in significant increases in our outstanding indebtedness and debt service requirements. Any acquisition may also cause us to assume liabilities, record goodwill and indefinite-lived intangible assets that will be subject to impairment testing and potential impairment charges, incur significant restructuring charges and increase working capital and capital expenditure requirements, which would reduce our return on invested capital. In addition, the terms of our current indebtedness and any other indebtedness we may incur in the future may limit the acquisitions we may pursue.
Any acquisitions we may seek to consummate will be subject to the negotiation of definitive agreements, satisfactory financing arrangements and applicable governmental approvals and consents, including under applicable antitrust laws, such as the Hart-Scott-Rodino Act. We may not complete any additional acquisitions and any acquired entities or assets may not enhance our results of operations. Even if we are able to integrate future acquired businesses with our operations successfully, we cannot assure you that we will realize all of the cost savings, synergies or revenue enhancements that we anticipate from such integration or that we will realize such benefits within the expected time frame.
If we were to undertake a substantial acquisition, the acquisition would likely need to be financed in part through additional financing from banks, through public offerings or private placements of debt or equity securities or with other arrangements. We cannot assure you that the necessary acquisition financing would be available to us on acceptable terms if and when required, particularly because we are currently highly leveraged, which may make it difficult or impossible for us to secure financing for acquisitions. If we were to undertake an acquisition by issuing equity securities or equity-linked securities, the acquisition may have a dilutive effect on the interests of the holders of our common stock.
Our business operations depend on attracting and retaining qualified management and personnel.
Our success depends to a significant degree upon the ability, expertise, judgment, discretion, integrity and good faith of our senior management team and our workforce throughout our organization. Thus, our future performance depends on our continued ability to attract and retain experienced and qualified management and personnel. Competition for such personnel is intense, and we may be unable to continue to attract or retain such personnel. The loss of any of our key executive officers or the inability to attract qualified personnel could significantly impede our ability to successfully implement our business strategy, financial plans, marketing and other objectives. We do not currently have any key-person life insurance with respect to any of our executive officers or employees.
31
A portion of our workforce is unionized and we are subject to the risk of labor disputes and adverse employee relations, which may disrupt our business and increase our costs.
As of April 30, 2010, approximately 11% of our employees were represented by unions and approximately 23% were represented by similar bodies (e.g., work councils) and we were a party to six collective bargaining agreements. While we believe that our relations with our employees are good, our inability to negotiate acceptable contracts with these unions could result in, among other things, strikes, work stoppages, labor disturbances or other slowdowns by the affected workers. If our union-represented employees were to engage in a strike, work stoppage or other slowdown, or other employees were to become unionized, or the terms and conditions in our labor agreements were to be renegotiated in an adverse manner, we could experience significant disruption of our operations, which would cause higher ongoing labor costs and impact our ability to satisfy our customers' requirements. Any such cost increases, stoppages or disturbances could materially and adversely affect our business, financial condition, results of operations, prospects and cash flows by limiting plant production, sales volumes and profitability. See "Business—Employees."
Inflation may adversely affect our business operations in the future.
We have experienced certain inflationary conditions in our cost base due primarily to changes in foreign currency exchange rates that have reduced the purchasing power of the U.S. dollar and increases in selling, general and administrative expenses. In addition, we are party to certain leases that contain escalator provisions contingent on increases based on changes in the Consumer Price Index. Inflation can harm our margins and profitability if we are unable to increase prices or cut costs enough to offset the effects of inflation in our cost base. If inflation in these or other costs worsens, we cannot assure you that our attempts to offset the effects of inflation and cost increases through control of expenses, passing cost increases on to customers or any other method will be successful. Any future inflation could adversely affect our profitability and our business.
We will incur higher costs as a result of being a public company, which may be significant. If we fail to accurately predict or effectively manage these costs, our operating results could be materially and adversely affected.
As a public company, we will incur higher accounting, treasury, legal, risk management, corporate governance and other expenses, which may be significant. The SEC and the have imposed substantial requirements on public companies, including requirements related to corporate governance practices and for internal control over financial reporting under Section 404 of the Sarbanes-Oxley Act of 2002, or the Sarbanes-Oxley Act. We expect these rules and regulations to increase our accounting, legal and other costs and to make some activities more time-consuming. We may also need to recruit additional accounting, legal and administrative staff. Moreover, the rules that will be applicable to us as a public company after this offering could make it more difficult and expensive for us to attract and retain qualified members of our board of directors and qualified executive officers. In addition, we expect to incur additional costs associated with obtaining new insurance arrangements, including increased premiums and deductible amounts. If we fail to predict these costs accurately or to manage these costs effectively, our operating results could be adversely affected.
Compliance with the Sarbanes-Oxley Act will require substantial financial and management resources and may increase the time and costs of completing an acquisition.
Section 404 of the Sarbanes-Oxley Act requires that we evaluate and report on our system of internal controls and requires that we have such system of internal controls audited beginning with our annual report on Form 10-K for the fiscal year ending December 30, 2011. If we fail to maintain the adequacy of our internal controls, we could be subject to regulatory scrutiny, civil or criminal penalties and/or stockholder litigation. Any inability to provide reliable financial reports could harm our business.
32
Section 404 of the Sarbanes-Oxley Act also requires that our independent registered public accounting firm report on the effectiveness of our system of internal controls. A target business may not be in compliance with the provisions of the Sarbanes-Oxley Act regarding adequacy of its internal controls. The development of the internal controls of any such entity to achieve compliance with the Sarbanes-Oxley Act may increase the time and costs necessary to complete any such acquisition. Furthermore, any failure to implement required new or improved controls, or difficulties encountered in the implementation of adequate controls over our financial processes and reporting in the future, could harm our operating results or cause us to fail to meet our reporting obligations. Inferior internal controls could also cause investors to lose confidence in our reported financial information, which could have a negative effect on the trading price of our securities.
We have a substantial amount of goodwill and other intangible assets recorded on our balance sheet. The amortization of acquired assets will reduce our future reported earnings and, furthermore, if our goodwill or other intangible assets become impaired, we may be required to recognize impairment charges that would reduce our net income.
As of April 2, 2010, we had $312.1 million of goodwill and other intangible assets recorded on our balance sheet as a result of applying the purchase method of accounting in connection with our acquisition in 2005 and with acquisitions we have made in the past. In accordance with the purchase accounting method, the excess of the cost of purchased assets over the fair value of such assets is assigned to intangible assets and is amortized over a period of time. The amortization expense associated with our intangible assets will have a negative effect on our future reported earnings. Many other companies, including many of our competitors, may not have the significant acquired intangible assets that we have because they have not participated in recent acquisitions and business combination transactions similar to ours. Thus, our reported earnings may be more negatively affected by the amortization of intangible assets than the reported earnings of these companies will be.
Additionally, in accordance with U.S. GAAP, we test goodwill for impairment annually on the last day of our fiscal year, or more frequently if events or circumstances indicate the potential for impairment. Such reviews could result in an earnings charge for the impairment of goodwill, and any such charge could be material. Accordingly, our net income could be reduced even though there would be no impact on our underlying cash flow.
Global or regional catastrophic events, natural disasters, severe weather and global political events could impact our operations and financial results.
Because of our global presence and worldwide operations, our business can be affected by large-scale terrorist acts, especially those directed against the United States or other major industrialized countries; the outbreak or escalation of armed hostilities; political instability in oil-producing regions; major natural disasters such as earthquakes, hurricanes, volcano eruptions, fires and floods; inclement weather such as frequent or unusually heavy snow, ice or rain storms, or extended periods of unseasonable temperatures; widespread outbreaks of infectious diseases such as H1N1 influenza, avian influenza or severe acute respiratory syndrome (generally known as SARS); disruptive global political events, such as civil unrest in countries in which our suppliers are located; labor strikes or work stoppages; and other such catastrophes and events.
Such events could impair our ability to manage our business around the world, disrupt our supply of raw materials, result in increases in fuel (or other energy) prices or a fuel shortage or the temporary lack of an adequate work force in a market, and could impact production, transportation and delivery of our products. In addition, such events could cause disruption of regional or global economic activity, which may affect consumers' purchasing power in the affected areas and, therefore, reduce demand for our products. These events also can have indirect consequences such as increases in the costs of insurance if they result in significant loss of property or other insurable damage.
33
The recent health care legislation may increase our costs or otherwise have a negative impact on us.
The U.S. Congress recently passed health care reform legislation, but we cannot yet estimate if this legislation will have a material adverse effect on our insurance programs or on our business, financial condition, results of operations, prospects or cash flows. We are currently in the process of assessing the extent of the legislation on our operating costs, but we expect that it may increase our health insurance costs and accordingly have a negative impact on our financial condition, results of operations, prospects and cash flows.
Risks Related to an Investment in our Common Stock and this Offering
There is no existing market for our common stock and we do not know if one will develop, which could impede your ability to sell your shares and depress the market price of our common stock.
Prior to this offering, there has not been a public market for our common stock. We cannot predict the extent to which investor interest in us will lead to the development of an active trading market on the or otherwise or how liquid that market might become. If an active trading market does not develop, you may have difficulty selling any of our common stock that you buy. The initial public offering price for the common stock will be determined by negotiations between us and the representatives of the underwriters and may not be indicative of prices that will prevail in the open market following this offering. See "Underwriting." The market price of our common stock may decline below the initial offering price, and you may not be able to sell our common stock at prices equal to or greater than the price you paid in this offering, or at all.
The price of our common stock may fluctuate significantly and you could lose all or part of your investment.
Our stock price may be volatile. Volatility in the market price of our common stock may prevent you from being able to sell your common stock at or above the price you paid for your common stock. The market price for our common stock could fluctuate significantly for various reasons, including:
- •
- our operating and financial performance and prospects;
- •
- our quarterly or annual earnings or those of other companies in our industries;
- •
- conditions that impact demand for our products and services;
- •
- future announcements concerning our business or our competitors' businesses or the building and construction industry;
- •
- our results of operations that vary from the expectations of securities analysts and investors;
- •
- our results of operations that vary from those of our competitors;
- •
- announcements by third parties of significant claims or proceedings against us;
- •
- the public's reaction to our press releases, other public announcements and filings with the SEC;
- •
- changes in earnings estimates or recommendations by securities analysts who track our common stock;
- •
- market and industry perception of our success, or lack thereof, in pursuing our growth strategy;
- •
- strategic actions by us or our competitors, such as acquisitions or restructurings;
- •
- changes in government and environmental regulation;
- •
- changes in accounting standards, policies, guidance, interpretations or principles;
- •
- arrival and departure of key personnel;
34
- •
- the number of shares to be publicly traded after this offering;
- •
- sales of common stock by us, members of our management team or other holders;
- •
- adverse resolution of new or pending litigation against us;
- •
- changes in general market, economic and political conditions and their effects on global economies or financial markets,
including those resulting from natural disasters, terrorist attacks, acts of war and responses to such events; and
- •
- any material weakness in our internal control over financial reporting.
In addition, recently the stock market has experienced significant price and volume fluctuations. This volatility has had a significant impact on the market price of securities issued by many companies, including companies in our industry. The changes frequently appear to occur without regard to the operating performance of the affected companies. Hence, the price of our common stock could fluctuate based upon factors that have little or nothing to do with us, and these fluctuations could materially reduce our share price and materially affect the value of your investment.
In the past, following periods of market volatility, shareholders have instituted securities class action litigation. If we were involved in securities litigation, it could have a substantial cost and divert resources and the attention of executive management from our business regardless of the outcome of such litigation.
Because we have no plans to pay regular dividends on our common stock for the foreseeable future, you may not receive any return on your investment unless you sell your common stock for a price greater than that which you paid for it.
We have no plans to pay regular dividends on our common stock. Any declaration and payment of future dividends to holders of our common stock may be limited by restrictive covenants in our debt agreements, and will be at the sole discretion of our board of directors and will depend on many factors, including our financial condition, earnings, capital requirements, level of indebtedness, cash flows, statutory and contractual restrictions applying to the payment of dividends and other considerations that our board of directors deems relevant. In addition, the agreements governing our current and future indebtedness may not permit us to pay dividends on our common stock. As a result, you may not receive any return on your investment unless you sell your common stock for a price greater than that which you paid for it.
Future sales or the possibility of future sales of a substantial amount of our common stock may depress the price of shares of our common stock.
Future sales or the availability for sale of substantial amounts of our common stock in the public market could adversely affect the prevailing market price of our common stock and could impair our ability to raise capital through future sales of equity securities.
Our amended and restated certificate of incorporation authorizes us to issue million shares of common stock, of which shares will be outstanding upon consummation of this offering. This number includes (1) shares which may not be sold for 180 days after the date of this prospectus in accordance with lockup agreements with the underwriters and (2) shares that we are selling in this offering, which will be freely transferable without restriction following the date of this prospectus. See "Shares Eligible for Future Sale" for a discussion of the shares of our common stock that may be sold into the public market in the future.
We may issue shares of our common stock or other securities from time to time as consideration for future acquisitions and investments. If any such acquisition or investment is significant, the number of shares of our common stock, or the number or aggregate principal amount, as the case may be, of other securities that we may issue may in turn be substantial. We may also grant
35
registration rights covering those shares of our common stock or other securities in connection with any such acquisitions and investments.
Upon consummation of this offering, we will also have outstanding shares of restricted stock and options to purchase shares of our common stock. Following this offering, we intend to file a registration statement on Form S-8 registering up to million shares in connection with our employee benefit plans, including restricted stock and stock options referred to above.
We cannot predict the size of future issuances of our common stock or the effect, if any, that future issuances and sales of our common stock will have on the market price of our common stock. Sales of substantial amounts of our common stock (including shares of our common stock issued in connection with an acquisition), or the perception that such sales could occur, may adversely affect prevailing market prices for our common stock.
Delaware law and our organizational documents may impede or discourage a takeover, which could deprive our investors of the opportunity to receive a premium for their shares.
We are a Delaware corporation, and the anti-takeover provisions of the Delaware law impose various impediments to the ability of a third party to acquire control of us, even if a change of control would be beneficial to our existing stockholders. In addition, provisions of our amended and restated certificate of incorporation and bylaws may make it more difficult for, or prevent a third party from, acquiring control of us without the approval of our Board of Directors. These provisions include:
- •
- the ability of our board of directors to designate one or more series of preferred stock and issue shares of preferred
stock without stockholder approval;
- •
- provisions related to the removal of directors;
- •
- provisions related to the calling of special meetings of stockholders;
- •
- provisions related to the ability to act by written consent;
- •
- provisions related to the power of our board of directors to fill vacancies on our board; and
- •
- advance notice requirements for nominating directors or introducing other business to be conducted at stockholder meetings.
The foregoing factors could impede a merger, takeover or other business combination or discourage a potential investor from making a tender offer for our common stock, which, under certain circumstances, could reduce the market value of our common stock. See "Description of Capital Stock."
We may issue shares of preferred stock in the future, which could make it difficult for another company to acquire us or could otherwise adversely affect holders of our common stock, which could depress the price of our common stock.
Our amended and restated certificate of incorporation will authorize us to issue up to million shares of one or more series of preferred stock. Our board of directors will have the authority to determine the preferences, limitations and relative rights of shares of preferred stock and to fix the number of shares constituting any series and the designation of such series, without any further vote or action by our stockholders. Our preferred stock could be issued with voting, liquidation, dividend and other rights superior to the rights of our common stock. The potential issuance of preferred stock may delay or prevent a change in control of us, discouraging bids for our common stock at a premium over the market price, and materially and adversely affect the market price and the voting and other rights of the holders of our common stock.
36
You will incur immediate and substantial dilution in the net tangible book value of the shares you purchase in this offering.
Prior investors have paid substantially less per share of our common stock than the price in this offering. The initial public offering price of our common stock is substantially higher than the net tangible book value per share of our outstanding common stock prior to completion of the offering. Based on our net tangible book value as of April 2, 2010, if you purchase our common stock in this offering, you will pay more for your shares than the amounts paid by our existing shareholders for their shares and you will suffer immediate dilution of approximately $ per share in net tangible book value after giving effect to the sale of shares of our common stock in this offering assuming an initial public offering price of $ per share, less the underwriting discounts and commissions and the estimated offering expenses payable by us, and without taking into account any other changes in such net tangible book value after April 2, 2010. See "Dilution."
If securities analysts do not publish research or reports about our company, or if they issue unfavorable commentary about us or our industry or downgrade our common stock, the price of our common stock could decline.
The trading market for our common stock will depend in part on the research and reports that third-party securities analysts publish about our company and our industry. One or more analysts could downgrade our common stock or issue other negative commentary about our company or our industry. In addition, we may be unable or slow to attract research coverage. Alternatively, if one or more of these analysts cease coverage of our company, we could lose visibility in the market. As a result of one or more of these factors, the trading price of our common stock could decline.
We are a holding company and rely on dividends and other payments, advances and transfers of funds from our subsidiaries to meet our obligations.
Euramax Holdings, Inc. has no direct operations and no significant assets other than ownership of 100% of the stock of Euramax International Inc. and its subsidiaries. Because Euramax Holdings, Inc. conducts its operations through its subsidiaries, Euramax Holdings, Inc. depends on those entities for dividends and other payments to generate the funds necessary to meet its financial obligations, and to pay any dividends with respect to our common stock. Legal and contractual restrictions in our credit facilities and other agreements governing current and future indebtedness of our subsidiaries, as well as the financial condition and operating requirements of our subsidiaries, may limit the ability of Euramax Holdings, Inc. to obtain cash from its subsidiaries. The earnings from, or other available assets of, Euramax Holdings, Inc.'s subsidiaries may not be sufficient to pay dividends or make distributions or loans to enable us to pay any dividends on our common stock.
Your ability to influence corporate matters may be limited because a small number of stockholders beneficially own a substantial amount of our common stock and will continue to have substantial control over us after the offering.
Upon completion of this offering, certain of our stockholders will each beneficially own more than % of our common stock. Collectively, these stockholders will own more than % of our common stock. As a result, if these stockholders elected to act as a group, these stockholders would be able to exert significant influence over all matters requiring stockholder approval, including the election of directors and approval of significant corporate transactions, such as mergers or sales of our company or its assets. These stockholders may have interests that are different from yours and may vote in a way with which you disagree and which may be adverse to your interests. In addition, this concentration of ownership may have the effect of preventing, discouraging or deferring a change of control, which could depress the market price of our common stock. For information regarding ownership of our outstanding stock, see the section entitled "Principal Stockholders."
37
CAUTIONARY STATEMENT REGARDING FORWARD-LOOKING STATEMENTS
This prospectus contains forward-looking statements. Statements that are predictive in nature, that depend upon or refer to future events or conditions or that include the words "believe," "expect," "anticipate," "intend," "estimate" and other expressions that are predictions of or indicate future events and trends and that do not relate to historical matters identify forward-looking statements. Our forward-looking statements include statements about our business strategy, our industry, our future profitability, our expected capital expenditures and the impact of such expenditures on our performance, the costs of operating as a public company, our capital programs and environmental expenditures. These statements involve known and unknown risks, uncertainties and other factors, including the factors described under "Risk Factors," that may cause our actual results and performance to be materially different from any future results or performance expressed or implied by these forward-looking statements. Such risks and uncertainties include, among other things:
- •
- the cyclical nature of the markets we serve;
- •
- the general level of economic activity;
- •
- the loss or reduction of purchases by key customers;
- •
- consolidation of purchasing power among our customers;
- •
- the supply and price levels of essential raw materials, particularly aluminum and steel;
- •
- risks associated with the manufacturing process due to operating hazards and interruptions, including unscheduled
maintenance or downtime;
- •
- risks associated with higher energy costs and the risk of disruptions in energy suppliers;
- •
- the adequacy of our insurance coverage;
- •
- our ability to effectively compete in the markets we serve;
- •
- the integrity of our information systems;
- •
- seasonal effects on our customers' purchasing activity;
- •
- adverse weather conditions;
- •
- our ability to adequately protect our intellectual property rights and successfully defend against third-party claims of
intellectual property infringement;
- •
- the effect of product liability or warranty claims against us;
- •
- environmental, health and safety laws and regulations;
- •
- our significant indebtedness, and our ability to incur additional debt in the future;
- •
- restrictions under our credit facilities that limit our operations;
- •
- exposure to adjustments in interest rates;
- •
- instability and volatility in the capital and credit markets;
- •
- the risks of doing business in foreign countries;
- •
- fluctuations in foreign currency exchange rates;
- •
- exposure to U.S. and foreign anti-corruption laws and economic sanctions programs;
- •
- state, local and non-U.S. taxes and fluctuations in our tax obligations and effective tax rate;
- •
- adverse effects of foreign taxation;
38
- •
- adverse changes to accounting rules or regulations;
- •
- the success of our acquisitions or divestitures;
- •
- our ability to attract and retain qualified management and key personnel;
- •
- labor and work stoppages;
- •
- the effects of inflation on our business;
- •
- increased costs as a result of being a public company;
- •
- risks relating to the effectiveness of internal controls required by Section 404 of the Sarbanes-Oxley Act;
- •
- the potential for future impairment of our goodwill or other intangible assets;
- •
- global or regional catastrophic events; and
- •
- effects of health care legislation on our business.
You should not place undue reliance on our forward-looking statements. Although forward-looking statements reflect our good faith beliefs, forward-looking statements involve known and unknown risks, uncertainties and other factors, which may cause our actual results, performance or achievements to differ materially from anticipated future results, performance or achievements expressed or implied by such forward-looking statements. We caution you that the important factors referenced above may not contain all of the factors that are important to you. In addition, we cannot assure you that we will realize the results or developments we expect or anticipate or, even if substantially realized, that they will result in the consequences or affect us or our operations in the way we expect. The forward-looking statements included in this prospectus are made only as of the date hereof. We undertake no obligation to publicly update or revise any forward-looking statement, whether as a result of new information, future events, changed circumstances or otherwise.
39
We expect to receive approximately $ million of net proceeds from the sale of shares by us in this offering, after deducting underwriting discounts and commissions and the estimated expenses of the offering, based on an assumed initial public offering price of $ per share, which is the midpoint of the price range set forth on the cover page of this prospectus. We expect to use the net proceeds of this offering to repay $ million of the term loans under our first lien credit facility. If the underwriters exercise their option to purchase additional shares from us in full, the additional net proceeds to us would be approximately $ million (and the total net proceeds to us would be approximately $ million) and we intend to use such additional net proceeds in the manner described above.
As of April 2, 2010, approximately $523.3 million of term loans were outstanding under the first lien credit facility. The facility terminates on June 29, 2013. Interest accrues under the facility at the greater of 3.00% or a reserve adjusted Eurodollar rate, plus an applicable margin. The applicable margin for the cash pay portion is 7.00%. The applicable margin for the payment-in-kind portion is 11.00% unless we elect, at least ten days prior to the expiration of an interest contract period, to pay cash interest applicable to the contract period. In such event, the applicable margin is 9.00%.
A $1.00 increase (or decrease) in the assumed initial public offering price of $ per share, which is the midpoint of the price range set forth on the cover page of this prospectus, would increase (decrease) the net proceeds to us from this offering by $ million, assuming the number of shares offered by us, as set forth on the cover page of this prospectus, remains the same and after deducting the underwriting discounts and commissions and estimated offering expenses payable by us. The actual initial public offering price is subject to market conditions and deliberations between us and the underwriters. If we sell fewer shares than anticipated and/or sell shares at a price lower than $ per share, and as a result this offering generates less proceeds than expected, we would repay less debt and would be more highly leveraged than anticipated.
An affiliate of Merrill Lynch, Pierce, Fenner & Smith Incorporated, one of the underwriters in this offering, is a lender under the term loan facility and, accordingly, will receive a portion of the net proceeds of this offering that we use to repay term loans under the first lien credit facility. See "Underwriting."
40
We have never declared or paid, and do not anticipate declaring or paying for the forseeable future, any cash dividends on our common stock. We currently intend to retain future earnings from our business to service our debt and finance the expansion of our business. Any future determination to pay cash dividends will be at the discretion of our board of directors and will be dependent upon our financial condition, results of operations, general business conditions, contractual restrictions, cash requirements, capital requirements, business prospects, restrictions on the payment of dividends under Delaware law and any other factors our board of directors may deem relevant. In addition, the covenants contained in our credit facilities limit our ability to pay dividends. Our ability to pay dividends also may be limited by covenants contained in the instruments governing future indebtedness that we or our subsidiaries may incur in the future. See "Risk Factors—Risks Related to an Investment in our Common Stock and this Offering—Because we have no plans to pay regular dividends on our common stock for the foreseeable future, you may not receive any return on your investment unless you sell your common stock for a price greater than that which you paid for it."
41
The following table sets forth our consolidated cash and cash equivalents and capitalization as of April 2, 2010:
- •
- on an actual basis; and
- •
- on an as adjusted basis to give effect to (1) the sale by us of shares in this offering at an assumed initial offering price of $ per share, the midpoint of the price range set forth on the cover page of this prospectus, and the use of proceeds from this offering, and (2) the for stock split that we intend to effect prior to the consummation of this offering.
You should read this table in conjunction with "Use of Proceeds," "Selected Consolidated Financial Data," "Management's Discussion and Analysis of Financial Condition and Results of Operations," and the consolidated financial statements and related notes included elsewhere in this prospectus.
| |
As of April 2, 2010 | ||||||||
|---|---|---|---|---|---|---|---|---|---|
| |
Actual | As Adjusted | |||||||
| |
(in millions) |
||||||||
Cash and cash equivalents |
$ | 38.3 | $ | ||||||
Debt (including current portion): |
|||||||||
First Lien Credit Facility |
523.3 | ||||||||
ABL Facility(1) |
— | ||||||||
Total debt |
523.3 | ||||||||
Shareholders' equity: |
|||||||||
Common stock, $0.01 par value per share, 1,200,000 shares authorized, actual, and shares authorized, as adjusted; shares issued and outstanding, actual, and shares issued and outstanding, as adjusted(2) |
0.2 | ||||||||
Additional paid-in capital |
714.0 | ||||||||
Accumulated loss |
(700.0 | ) | |||||||
Accumulated other comprehensive income |
9.5 | ||||||||
Total shareholder equity |
23.7 | ||||||||
Total capitalization |
$ | 547.0 | $ | ||||||
- (1)
- As
of July 2, 2010, we had availability of $61.5 million under the ABL Facility.
- (2)
- The number of shares of common stock to be outstanding after the offering excludes (1) shares of restricted stock and restricted stock units granted to employees pursuant to our Executive Incentive Plan, none of which are vested, (2) shares of common stock reserved for issuance under our equity award plans and (3) shares of common stock subject to the underwriters' overallotment option.
A $1.00 increase (decrease) in the assumed initial public offering price of $ per share, which is the midpoint of the price range set forth on the cover page of this prospectus, would (decrease) increase total debt and would increase (decrease) each of additional paid-in capital and total stockholders' equity by approximately $ million, assuming that the number of shares offered by us, as set forth on the cover page of this prospectus, remains the same and after deducting estimated underwriting discounts and commissions. The actual initial public offering price is subject to market conditions and deliberations between us and the underwriters. In addition, depending on market
42
conditions at the time of pricing of this offering, we may sell fewer or more shares than the number set forth on the cover page of this prospectus. The adjusted information presented above is illustrative only and following the completion of this offering will be adjusted based on the actual initial public offering price and other terms of the offering determined at pricing. If we sell fewer shares than anticipated and/or sell shares at a price lower than $ per share, and as a result this offering generates less proceeds than expected, we would repay less debt and would be more highly leveraged than anticipated.
43
Purchasers of common stock offered by this prospectus will suffer immediate and substantial dilution in net tangible book value per share. Our pro forma net tangible book value (deficit) as of April 2, 2010, excluding the net proceeds of this offering, was approximately $( ) million, or approximately $( ) per share of common stock. Pro forma net tangible book value per share represents the amount of tangible assets (excluding the net proceeds of this offering) less total liabilities, divided by the pro forma number of shares of common stock outstanding (excluding the shares of common stock issued in this offering).
Dilution in net tangible book value per share represents the difference between the amount per share paid by purchasers of our common stock in this offering and the pro forma net tangible book value per share of our common stock immediately after this offering. After giving effect to the sale of shares of common stock in this offering at an assumed initial public offering price of $ per share, the midpoint of the price range set forth on the cover page of this prospectus, and after deduction of the estimated underwriting discounts and commissions and estimated offering expenses payable by us, our pro forma net tangible book value as of April 2, 2010 would have been approximately $ million, or $ per share. This represents an immediate increase in net tangible book value of $ per share of common stock to our existing shareholders and an immediate pro forma dilution of $ per share to purchasers of common stock in this offering. The following table illustrates this dilution on a per share basis.
Assumed initial public offering price per share |
$ | |||||||
Pro forma net tangible book value per share as of April 2, 2010, excluding the net proceeds of this offering |
$ | |||||||
Pro forma increase per share attributable to new investors |
$ | |||||||
Net tangible book value per share after the offering |
$ | |||||||
Dilution per share to new investors |
$ | |||||||
A $1.00 increase (decrease) in the assumed initial public offering price of $ per share, which is the midpoint of the price range set forth on the cover page of this prospectus, would increase (decrease) our pro forma net tangible book value by $ million, the pro forma net tangible book value per share by $ and the dilution per share to new investors by $ , assuming the number of shares offered by us, as set forth on the cover page of this prospectus, remains the same and after deducting the underwriting discounts and estimated offering expenses payable by us. Depending on market conditions at the time of pricing of this offering and other considerations, we may sell fewer or more shares than the number set forth on the cover page of this prospectus.
The following table sets forth as of April 2, 2010 the number of shares of common stock purchased or to be purchased from us, total consideration paid or to be paid and the average price per share paid by our existing stockholders and by new investors, before deducting estimated underwriting discounts and commissions and estimated offering expenses payable by us at an assumed initial public offering price of $ per share.
| |
Shares Purchased | Total Consideration | |
||||||||||||||
|---|---|---|---|---|---|---|---|---|---|---|---|---|---|---|---|---|---|
| |
Average Price Per Share |
||||||||||||||||
| |
Number | Percent | Amount | Percent | |||||||||||||
Existing shareholders |
% | $ | % | $ | |||||||||||||
New investors |
|||||||||||||||||
Total |
100 | % | $ | 100 | % | $ | |||||||||||
A $1.00 increase (decrease) in the assumed initial public offering price of $ per share, which is the midpoint of the price range set forth on the cover page of this prospectus, would
44
increase (decrease) total consideration paid by new investors and total consideration paid by all shareholders by $ million, assuming the number of shares offered by us, as set forth on the cover page of the prospectus, remains the same, and before deducting the underwriting discounts and estimated offering expenses payable by us.
If the underwriters exercise their option to purchase shares in full, then the pro forma increase per share attributable to new investors would be $ , the net tangible book value per share after the offering would be $ and the dilution per share to new investors would be $ . In addition, new investors would purchase shares, or approximately % of shares outstanding, and the total consideration paid by new investors would increase to $ , or % of the total consideration paid (based on the midpoint of the range set forth on the cover page of this prospectus).
If the underwriters exercise their option to purchase additional shares in full, our existing stockholders would own % and our new investors would own % of the total number of shares of our common stock outstanding after this offering.
45
SELECTED CONSOLIDATED FINANCIAL DATA
The selected historical consolidated financial data for the fiscal years ended December 25, 2009, December 26, 2008 and December 28, 2007 are derived from our consolidated financial statements which have been audited by Ernst & Young LLP, independent registered public accounting firm. The selected historical financial data for the fiscal year ended December 29, 2006 and the six month periods ended July 1, 2005 and December 30, 2005, have been derived from our unaudited consolidated financial statements. The selected historical consolidated financial data for fiscal year 2005 are divided into Predecessor and Successor periods as a result of the acquisition of our business by private equity funds and certain members of management on July 1, 2005, which required the application of the purchase method of accounting under GAAP. The selected historical consolidated financial data for the three months ended April 2, 2010 and March 27, 2009 have been derived from our unaudited consolidated financial statements included elsewhere in this prospectus. The unaudited consolidated interim financial information set forth below has been prepared on the same basis as our audited consolidated financial statements and includes all adjustments, consisting of normal recurring adjustments, that we consider necessary for a fair presentation of our financial position and operating results for such periods. The financial data set forth in this table are not necessarily indicative of our future results of operations and should be read in conjunction with our consolidated financial statements and related notes included elsewhere in this prospectus and the information under "Management's Discussion and Analysis of Financial Condition and Results of Operations."
46
| |
Successor(1) | Predecessor | |||||||||||||||||||||||||
|---|---|---|---|---|---|---|---|---|---|---|---|---|---|---|---|---|---|---|---|---|---|---|---|---|---|---|---|
| |
Three months ended April 2, 2010 |
Three months ended March 27, 2009 |
Year ended December 25, 2009 |
Year ended December 26, 2008 |
Year ended December 28, 2007 |
Year ended December 29, 2006 |
Six months ended December 30, 2005 |
Six months ended July 1, 2005(2) |
|||||||||||||||||||
| |
(Unaudited) |
(Unaudited) |
|
|
|
(Unaudited) |
(Unaudited) |
(Unaudited) |
|||||||||||||||||||
| |
(in thousands, except per share data) |
||||||||||||||||||||||||||
Statements of Operations Data: |
|||||||||||||||||||||||||||
Net sales |
$ | 200,539 | $ | 159,685 | $ | 812,055 | $ | 1,173,493 | $ | 1,245,631 | $ | 1,140,417 | $ | 511,138 | $ | 508,023 | |||||||||||
Cost of goods sold (excluding depreciation and amortization) |
164,878 | 146,289 | 675,126 | 1,009,392 | 1,052,838 | 941,426 | 420,665 | 412,792 | |||||||||||||||||||
Gross profit |
35,661 | 13,396 | 136,929 | 164,101 | 192,793 | 198,991 | 90,473 | 95,231 | |||||||||||||||||||
Selling and general (excluding depreciation and amortization) |
23,439 | 23,271 | 91,802 | 110,608 | 101,189 | 90,793 | 42,169 | 39,861 | |||||||||||||||||||
Debt restructuring, acquisition and forbearance expenses |
— | 4,001 | 13,307 | 3,798 | — | — | — | 90,905 | |||||||||||||||||||
Depreciation and amortization |
9,097 | 9,817 | 39,721 | 55,348 | 57,590 | 52,689 | 28,684 | 10,190 | |||||||||||||||||||
Goodwill and other impairments |
— | — | 3,516 | 401,376 | — | — | — | — | |||||||||||||||||||
Income (loss) from operations |
3,125 | (23,693 | ) | (11,417 | ) | (407,029 | ) | 34,014 | 55,509 | 19,620 | (45,725 | ) | |||||||||||||||
Interest expense |
(18,695 | ) | (26,540 | ) | (84,204 | ) | (109,527 | ) | (84,923 | ) | (74,675 | ) | (36,761 | ) | (24,402 | ) | |||||||||||
Gain on extinguishment of debt |
— | — | 8,723 | — | — | — | — | — | |||||||||||||||||||
Other income (loss), net |
(4,075 | ) | (4,340 | ) | 1,303 | (22,716 | ) | 5,143 | 11,949 | (1,173 | ) | (19,567 | ) | ||||||||||||||
Loss from continuing operations before income taxes |
(19,645 | ) | (54,573 | ) | (85,595 | ) | (539,272 | ) | (45,766 | ) | (7,217 | ) | (18,314 | ) | (89,694 | ) | |||||||||||
Benefit for income taxes |
(557 | ) | (10,360 | ) | (1,297 | ) | (61,078 | ) | (2,529 | ) | (3,374 | ) | (3,811 | ) | (27,989 | ) | |||||||||||
Loss from continuing operations |
(19,088 | ) | (44,213 | ) | (84,298 | ) | (478,194 | ) | (43,237 | ) | (3,843 | ) | (14,503 | ) | (61,705 | ) | |||||||||||
Loss from discontinued operations, net of tax |
(96 | ) | (1,015 | ) | (1,330 | ) | (22,413 | ) | (6,194 | ) | (1,830 | ) | (603 | ) | 559 | ||||||||||||
Net loss |
(19,184 | ) | (45,228 | ) | (85,628 | ) | (500,607 | ) | (49,431 | ) | (5,673 | ) | (15,106 | ) | (61,146 | ) | |||||||||||
Per Share Data: |
|||||||||||||||||||||||||||
Pro forma basic and diluted net loss per share(3): |
|||||||||||||||||||||||||||
Basic |
|||||||||||||||||||||||||||
Diluted |
|||||||||||||||||||||||||||
Pro forma weighted average shares outstanding(3): |
|||||||||||||||||||||||||||
Basic |
|||||||||||||||||||||||||||
Diluted |
|||||||||||||||||||||||||||
Other Financial Data: |
|||||||||||||||||||||||||||
Net cash flow provided by (used in): |
|||||||||||||||||||||||||||
Operating activities |
(28,717 | ) | (403 | ) | 59,482 | (16,455 | ) | 74,916 | (12,639 | ) | 45,319 | (4,311 | ) | ||||||||||||||
Investing activities |
664 | (1,006 | ) | (2,026 | ) | (6,784 | ) | (50,076 | ) | (65,901 | ) | (7,782 | ) | (20,964 | ) | ||||||||||||
Financing activities |
(2,191 | ) | (12,688 | ) | (35,929 | ) | 59,598 | (27,893 | ) | 45,645 | (28,329 | ) | 24,135 | ||||||||||||||
Capital expenditures |
(1,519 | ) | (1,022 | ) | (4,351 | ) | (14,824 | ) | (21,255 | ) | (25,048 | ) | (9,846 | ) | (7,526 | ) | |||||||||||
Balance Sheet Data: |
|||||||||||||||||||||||||||
Cash and cash equivalents |
38,320 | — | 69,944 | 48,658 | 8,272 | 16,425 | 47,409 | — | |||||||||||||||||||
Working capital |
158,709 | — | 163,393 | 167,849 | 138,828 | 217,296 | 161,957 | — | |||||||||||||||||||
Total assets |
729,163 | — | 758,626 | 841,966 | 1,423,648 | 1,190,767 | 1,072,292 | — | |||||||||||||||||||
Total debt, including current portion |
523,295 | — | 525,319 | 884,740 | 812,401 | 807,849 | 735,337 | — | |||||||||||||||||||
Total shareholders' equity (deficit) |
23,674 | — | 47,060 | (259,282 | ) | 273,771 | 320,276 | 237,731 | — | ||||||||||||||||||
- (1)
- Our
fiscal year ends on the last Friday in December of each calendar year. Each of our fiscal years presented is based on a 52 week period. Our
fiscal year ended December 31, 2010 will include 53 weeks.
- (2)
- On
July 1, 2005, we were acquired by certain private equity funds and members of management, as described under "Management's Discussion and
Analysis of Financial Condition and Results of Operations—History." As a result of the application of the purchase method of accounting in connection with the acquisition, our
shareholders' equity increased by $156.8 million. In addition, our net income for the six months ended July 1, 2005 reflects certain costs and expenses associated with the acquisition.
- (3)
- All share and per share amounts reflect a for stock split of our common stock, which will occur prior to the consummation of this offering.
47
MANAGEMENT'S DISCUSSION AND ANALYSIS OF
FINANCIAL CONDITION AND RESULTS OF OPERATIONS
You should read the following discussion and analysis of our financial condition and results of operations in conjunction with our consolidated financial statements and related notes included elsewhere in this prospectus. This discussion and analysis contains forward-looking statements that involve risks, uncertainties and assumptions. Our actual results may differ materially from those anticipated in these forward-looking statements as a result of a number of factors, including, but not limited to, those set forth under "Risk Factors," "Cautionary Statement Regarding Forward-Looking Statements" and elsewhere in this prospectus. All significant intercompany accounts and transactions have been eliminated in consolidation. We operate on a 52 or 53 week fiscal year ending on the last Friday in December. Our fiscal years consisted of 52 weeks for each of the years ended December 25, 2009, December 26, 2008 and December 28, 2007.
Our MD&A includes the following sections:
- •
- Overview and Executive Summary provides an overview of our business.
- •
- History discusses the history of our organization and recent restructuring
activity.
- •
- Results of Operations provides an analysis of our financial performance
and results of operations for the first quarter of fiscal 2010 compared to the first quarter of fiscal 2009, fiscal 2009 compared to fiscal 2008 and fiscal 2008 compared to fiscal 2007.
- •
- Liquidity and Capital Resources provides an overview of our financing,
capital expenditures, cash flows and contractual obligations.
- •
- Critical Accounting Policies provides a discussion of our accounting
policies that require critical judgment, assumptions and estimates.
- •
- Recently Adopted Accounting Pronouncements provides a brief description of
significant accounting standards which were adopted during the periods presented.
- •
- Quantitative and Qualitative Disclosures About Market Risk discusses market risks we face from changes in interest rates, currency exchange rates and commodity prices.
Overview and Executive Summary
We are a leading international producer of metal and vinyl products sold to the residential repair and remodel, non-residential construction and recreational vehicle (RV) markets primarily in North America and Europe. We are a leader in several niche product categories, including preformed roof-drainage products sold in the U.S., metal roofing and siding for wood frame construction in the U.S., and aluminum siding for towable RVs in the U.S. and Europe. Sales to the building products and RV markets accounted for approximately 77% and 14% of our 2009 sales, respectively.
Our customers are located predominantly throughout North America and Europe and include distributors, contractors and home improvement retailers, as well as RV, transportation and other original equipment manufacturers, or OEMs. We have extensive in-house manufacturing and distribution capabilities for our more than 10,000 unique products and operate through a network consisting of 44 facilities, including 36 in the U.S., two in Canada and six in Europe. We have over 50 years of experience manufacturing building products and RV exterior components, including our time as a division of our former parent, Alumax, a fully integrated aluminum producer acquired by Alcoa Inc. in 1998. We have operated as an independent company since 1996 when our division was acquired in a management-led buyout.
48
Our total net sales were $812.1 million for the year ended December 25, 2009. The following charts show our net sales by segment and geography during the year ended December 25, 2009:
| Net Sales by Segment | Net Sales by Geography | |
|
|

|
Our operating performance is primarily affected by the strength of demand for residential and non-residential building materials as well as, to a lesser extent, recreational vehicles in the U.S. and Western Europe. Our results in 2009 and 2008 reflect the challenging economic conditions in the regions and markets where we operate, including a recessionary economic environment and high levels of unemployment. Beginning in the second half of 2008 and intensifying during 2009, prolonged financial market and economic turmoil caused a significant downturn in the key markets we serve, including the residential repair and remodel, non-residential construction, and RV industries. The decline in consumer spending for residential repair, remodel and maintenance activity significantly impacted our sales to contractors, distributors and home improvement retailers, and sales of non-residential products in our U.S. Non-Residential Building Products segment dropped dramatically during 2009 due to lower levels of consumer confidence, credit availability, disposable income and commercial construction. In addition, the U.S. towable RV market suffered a 27% decline in shipments in 2008 and an additional 29% decline in 2009.
To address these challenges, during 2008 and 2009 and continuing into 2010 we focused on achieving greater operational effectiveness and undertook significant cost cutting measures to improve our operating results. From June 2008 through December 2009 we reduced our headcount by approximately 1,100 employees, or 33% of our workforce. From January 2008 to December 2009, we reduced the number of manufacturing facilities that we operate from 70 to 44. We also restructured our indebtedness under our existing credit facilities and entered into a new asset-based credit facility to support our liquidity needs. See "—Liquidity and Capital Resources." We believe that, as a result of our improved cost structure, we are now well positioned for future growth as our key end markets begin to recover.
Key Factors Affecting our Business
Niche Product Offering. Many of our products address a niche within broader markets, such as preformed roof-drainage products, vinyl windows for UK holiday homes and the Western U.S. market, metal roofing and siding for wood frame construction and aluminum siding for RVs and holiday homes. Because our products occupy a niche role, the levels of activity in our end markets do not maintain a strict correlation to broader economic indicators and may not improve or decline commensurately with fluctuations in general economic conditions.
Market Factors Affecting Product Demand. Our sales are particularly affected by the drivers of activity in our end-markets, which are beyond our control. Demand for our residential building products is primarily affected by residential repair and remodel activity, which depends upon the availability of home equity and consumer financing, the turnover and aging of housing stock, wear and tear and weather damage, consumer sentiment, and, in the case of our vinyl window products,
49
increasing consumer interest in energy efficiency. Demand for our non-residential building products is affected by consumer confidence, interest rates, consumer disposable income, the strength of agricultural markets, consumer access to affordable financing and commercial construction trends. Demand for our RV products is affected by, among other things, consumer discretionary spending levels, availability of consumer lending and gas prices.
Aluminum and Steel Prices. Historically, over 70% of our raw material costs consist of the cost of aluminum and steel raw materials. Aluminum and steel prices are highly volatile. Historically we have sought to pass raw material price increases and decreases on to our customers. However, due to the volatility in aluminum and steel pricing, our net sales and cost of goods sold can fluctuate significantly despite little or no change in the volume of our shipments. Also, in periods of rapidly declining aluminum and steel prices, we may place orders for raw materials at higher prices for particular customers who become unable to buy our product due to adverse economic conditions, resulting in potential losses. As a result, our results from quarter to quarter can be significantly affected by aluminum and steel prices. We do not engage in hedging activities intended to manage long-term risks related to movements in market prices of steel and aluminum raw materials.
Competition. The end-markets in which we compete are highly competitive. Competitive factors in our industry include, among others, changes in market penetration, increased price competition, the introduction of new products and technology by existing and new competitors, changes in marketing, product diversity, sales and distribution and the ability to supply products to customers in a timely manner. Branding is not a significant factor in the sales of most of our products to the end user and the barriers to entry resulting from product branding are therefore lower.
Exchange Rates. Our financial position, results of operations and cash flows can be affected by changes in exchange rates (primarily the Euro, British pound sterling and Canadian dollar). Weakening or strengthening of these foreign currencies relative to the U.S. dollar will reduce or increase, respectively, amounts recorded in our consolidated financial statements related to our foreign operations. We have historically entered into currency agreements and interest rate agreements with major banking institutions as part of a risk-management strategy to reduce the impact to us of exchange rate and interest rate fluctuations. See "—Quantitative and Qualitative Disclosures About Market Risk."
Seasonality. Our sales are somewhat seasonal, with the second and third quarters typically accounting for the highest sale volumes. First and fourth quarter sale volumes are generally lower primarily due to reduced repair and remodel activity and reduced activity in the building and construction industry as a result of colder and more inclement weather in our geographic end markets, as well as customer plant shutdowns in the RV and automotive industries during holidays and model changeovers.
History
Origin as an Independent Company
Prior to 1996, our business was a division of our former parent, Alumax. Our inception as an independent company was the result of a management-led buyout on September 25, 1996, when our former holding company purchased, through its wholly owned subsidiaries, all of the issued and outstanding capital stock of Alumax's subsidiaries which operated a portion of Alumax's fabricated products business. On June 12, 2003, Citigroup Venture Capital Equity Partners, L.P. ("CVCEP") and its affiliates acquired a majority of our common stock with management of CVCEP and directors and management of our company holding the remaining shares.
50
The Acquisition by the Equity Sponsors
On June 29, 2005, we were acquired by private equity funds affiliated with Goldman, Sachs & Co. and certain members of our senior management (the "Acquisition"). The aggregate purchase price paid for all of our common stock (including shares of common stock issuable upon the exercise of options) in connection with the Acquisition was $1,038.0 million, excluding fees and related expenses, less outstanding debt, net of cash and cash equivalents, and certain transaction expenses. In connection with the Acquisition, our then-existing equity sponsors made an equity contribution of $311.3 million and management rolled over approximately $20.7 million of equity (which included a rollover of $11.1 million of fully vested and exercisable options). In addition, we and our subsidiary Euramax International, Inc. incurred $750.0 million of debt to finance the Acquisition.
Restructuring
On June 29, 2009, we, our then-existing equity sponsors, our lenders and management shareholders agreed to a restructuring of indebtedness owed to lenders under our then-existing first and second lien credit agreements and of amounts owed to counterparties to our existing interest rate swaps (the "Restructuring"). Under the terms of the Restructuring, the lenders cancelled 100% of amounts owed under our second lien credit agreement, consisting of principal and accrued interest of $191 million and $12 million, respectively, in exchange for 100% of our issued and outstanding common stock as of the date of the Restructuring. Our common stock was issued to lenders in proportion to their holdings of the second lien loans immediately prior to the Restructuring. Our then-existing equity sponsors lost all of their equity investment in us. See "—Liquidity and Capital Resources" for additional information regarding the Restructuring.
Recent Initiatives
Since the second quarter of 2008 we have worked to operate a more efficient, lower cost business. Between January 2008 and December 2009 we closed 26 facilities representing approximately 24% of our square footage devoted to U.S. manufacturing and distribution. These closures eliminated redundant and less profitable or unprofitable facilities while reducing supervisory and administrative personnel. Beginning in June 2008, we centralized the implementation and execution of our lean manufacturing initiatives and related integrated sales and operations planning. We have also invested in a market leading enterprise resource planning, or ERP, system that we have implemented within our U.S. Non-Residential Building Products segment and plan to deploy to our other U.S. segments. Further, we have undertaken a significant number of initiatives to improve our freight and logistics productivity and reduce our shipping costs. Recent improvements reflect the results of our ongoing initiatives to centralize our management controls, rationalize our operating structure and implement best practices to improve our manufacturing culture.
Results of Operations
Our financial performance is affected by, among other factors, underlying trends in the U.S. and Europe related to demand for products related to residential repair and remodeling, non-residential construction and RVs.
- •
- Our building products sold for residential repair and remodeling include roof drainage products, vinyl windows, patios and awnings, and doors. Projects that utilize many of our roof drainage repair and remodeling products are often low cost activities that are necessary to prevent home damage as a result of wear and tear or weather damage. Roof drainage repair projects are often low cost and non-discretionary in nature. Repair and remodeling activity related to products other than roof drainage are typically higher cost and driven by turnover and aging of housing stock, consumer sentiment, availability of home equity and
51
- •
- Our building products sold for non-residential construction include, in the U.S., light gauge steel and
aluminum roofing and siding panels, trim and hardware and, in Europe, the Middle East and Asia, roll coated aluminum coil and sheet. Demand for these products is driven by consumer confidence,
interest rates, consumer disposable income, the strength of agricultural markets, consumer access to affordable financing and commercial construction trends.
- •
- Our products sold for the RV market include siding, roofing and doors. Demand for these RV products is driven by trends in disposable income, interest rates and general economic conditions, as well as similar demographic trends relating to the increased proportion of the U.S. and European population in the 55 through 74 year old age group, who serve as an important source of demand for our RV products.
consumer financing and, in the case of our vinyl window products, increasing consumer interest in energy efficiency.
Our sales are somewhat seasonal, with the second and third quarters typically accounting for higher sales volumes and profitability. Our working capital needs are typically at their highest during these periods. See "Risk Factors—Risks Relating to Our Business—Our business is subject to seasonality, with our highest sales volumes typically occurring during our second and third quarters."
The following table sets forth our statements of operations data expressed as a percent of net sales:
| |
Three months ended April 2, 2010 |
Three months ended March 27, 2009 |
Year ended December 25, 2009 |
Year ended December 26, 2008 |
Year ended December 28, 2007 |
||||||||||||
|---|---|---|---|---|---|---|---|---|---|---|---|---|---|---|---|---|---|
Statement of Earnings Data: |
|||||||||||||||||
Net sales |
100 | % | 100 | % | 100.0 | % | 100.0 | % | 100.0 | % | |||||||
Costs and expenses: |
|||||||||||||||||
Cost of goods sold (excluding depreciation and amortization) |
82.2 | % | 91.6 | % | 83.1 | % | 86.0 | % | 84.5 | % | |||||||
Selling and general (excluding depreciation and amortization) |
11.7 | % | 14.6 | % | 11.3 | % | 9.4 | % | 8.1 | % | |||||||
Debt restructuring and forbearance expenses |
— | 2.5 | % | 1.6 | % | 0.3 | % | — | |||||||||
Depreciation and amortization |
4.5 | % | 6.1 | % | 4.9 | % | 4.7 | % | 4.6 | % | |||||||
Goodwill and other impairments |
— | — | 0.4 | % | 34.2 | % | — | ||||||||||
Income (loss) from operations |
1.6 | % | (14.8 | )% | (1.4 | )% | (34.7 | )% | 2.7 | % | |||||||
Interest expense, |
(9.3 | )% | (16.6 | )% | (10.4 | )% | (9.3 | )% | (6.8 | )% | |||||||
Gain on extinguishment of debt |
— | — | 1.1 | % | — | — | |||||||||||
Other income (loss), net |
(2.0 | )% | (2.7 | )% | 0.2 | % | (1.9 | )% | 0.4 | % | |||||||
Loss from continuing operations before income taxes |
(9.8 | )% | (34.2 | )% | (10.5 | )% | (46.0 | )% | (3.7 | )% | |||||||
Benefit for income taxes |
(0.3 | )% | (6.5 | )% | (0.2 | )% | (5.2 | )% | (0.2 | )% | |||||||
Loss from continuing operations |
(9.5 | )% | (27.7 | )% | (10.3 | )% | (40.8 | )% | (3.5 | )% | |||||||
Loss from discontinued operations, net of tax |
(0.1 | )% | (0.6 | )% | (0.2 | )% | (1.9 | )% | (0.5 | )% | |||||||
Net (loss) |
(9.6 | )% | (28.3 | )% | (10.5 | )% | (42.7 | )% | (4.0 | )% | |||||||
52
Three Months Ended April 2, 2010 Compared to the Three Months Ended March 27, 2009.
The three-month period ended April 2, 2010 includes 14 weeks compared to 13 weeks in the three-month period ended March 27, 2009. The following table sets forth net sales and income (loss) from operations data by segment for the three months ended April 2, 2010 and March 27, 2009:
| |
Net Sales | Income (Loss) from Operations | ||||||||||||||||||
|---|---|---|---|---|---|---|---|---|---|---|---|---|---|---|---|---|---|---|---|---|
| |
Three Months Ended April 2, 2010 |
Three Months Ended March 27, 2009 |
Increase (Decrease) |
Three Months Ended April 2, 2010 |
Three Months Ended March 27, 2009 |
Increase (Decrease) |
||||||||||||||
| |
(dollars in millions) |
|||||||||||||||||||
U.S. Residential Building Products |
$ | 51.7 | $ | 38.8 | 33.2 | % | $ | 0.9 | $ | (1.4 | ) | 164.3 | % | |||||||
U.S. Non-Residential Building Products |
37.1 | 39.5 | (6.1 | )% | (3.4 | ) | (5.3 | ) | 35.8 | % | ||||||||||
U.S. RV and Specialty Building Products |
35.2 | 25.0 | 40.8 | % | (0.8 | ) | (5.2 | ) | 84.6 | % | ||||||||||
European Roll Coated Aluminum |
53.8 | 42.6 | 26.3 | % | 6.7 | (3.5 | ) | 291.4 | % | |||||||||||
European Engineered Products |
22.7 | 13.8 | 64.5 | % | 0.7 | (5.4 | ) | 113.0 | % | |||||||||||
Other Non-Allocated |
— | — | — | % | (0.9 | ) | (3.0 | ) | 70.0 | % | ||||||||||
Totals |
$ | 200.5 | $ | 159.7 | 25.5 | % | $ | 3.1 | $ | (23.7 | ) | 113.1 | % | |||||||
Net Sales. Net sales include the revenue recognized from the sales of our products less provisions for returns, allowances, rebates and discounts. Our net sales increased $40.8 million, or 25.5%, to $200.5 million in the first quarter of 2010 compared to $159.7 million in the first quarter of 2009 as global economic concerns diminished and pent up demand for many of our products was released.
Net sales of our U.S. Residential Building Products segment increased $12.9 million, or 33.2%, to $51.7 million in the first quarter of 2010 from $38.8 million in the first quarter of 2009. This increase in net sales resulted primarily from greater demand from distributors, home improvement retailers and other retailers for our roof drainage, roof edge and related products. Volume increases due to stronger demand were partially offset by selling price reductions driven by lower aluminum costs in the first quarter of 2010 compared to the first quarter of 2009. In addition to an increase in demand driven by improving economic conditions, we believe that the volume increase we experienced in the first quarter of 2010 was higher as a result of severe winter weather in the Northeast U.S. and above average levels of rain in the Southeast U.S. Products supplied by our U.S. Residential Building Products segment are typically utilized to repair damage caused by such weather events as well as damage caused by normal wear and tear.
Net sales of our U.S. Non-Residential Building Products segment declined $2.4 million, or 6.1%, to $37.1 million in the first quarter of 2010 from $39.5 million in the first quarter of 2009. This decline in net sales resulted primarily from a decline in the volume of steel and aluminum roofing and siding sold to distributors and contractors for non-wood frame commercial construction. We believe that the non-wood frame markets we serve are more economically sensitive than the markets and customers we serve for wood frame construction. Our customers in the wood frame construction markets include contractors, builders, lumber yards and home improvement retailers. Changes in sales to these customers in the first quarter of 2010 were insignificant compared to the first quarter of 2009.
Net sales of our U.S. RV and Specialty Building Products segment increased $10.2 million, or 40.8%, to $35.2 million in the first quarter of 2010 from $25.0 million in the first quarter of 2009. This increase in net sales resulted primarily from increases in the sales volume of RV exterior components
53
and doors to U.S. RV OEMs. Our higher net sales to RV OEMs were consistent with a significant increase in wholesale shipments of towable RVs in the U.S. generally during the first quarter of 2010 compared to the first quarter of 2009. Net sales also increased due to higher sales volumes of aluminum coil sold to distributors and vinyl windows and patio components sold to contractors in the Western U.S. These volume increases were partially offset by selling price reductions driven by lower aluminum costs in the first quarter of 2010 compared to the first quarter of 2009.
Total net sales for our U.S. segments increased $20.7 million, or 20.0%, to $124.0 million in the first quarter of 2010 from $103.3 million in the first quarter of 2009. We estimate that overall U.S. sales volume increases were partially offset by selling price decreases of approximately $7.2 million resulting from declines in bare aluminum and steel costs in the first quarter of 2010 compared to the first quarter of 2009.
Net sales of our European Roll Coated Aluminum segment increased $11.2 million, or 26.3%, to $53.8 million in the first quarter of 2010 from $42.6 million in the first quarter of 2009. This increase in net sales resulted primarily from an increase in sales volume of specialty coated coil and panels sold to European RV OEMs and producers of commercial panels used in commercial construction applications including roofing and siding. Our higher net sales to RV OEMs was consistent with the increase in European RV registrations as reported by the European Caravan Federation (ECF) in the first quarter of 2010 compared to the first quarter of 2009. The increase in sales volume to commercial panel producers reflects an increase in sales attributable to market development initiatives. Net sales also increased approximately $3.2 million due to the strengthening of the Euro, net of weakening of the British pound sterling, against the U.S. dollar. These increases were partially offset by a reduction in sales volume of specialty coated coil to transport container manufacturers.
Net sales of our European Engineered Products segment increased $8.9 million, or 64.5%, to $22.7 million in the first quarter of 2010 from $13.8 million in the first quarter of 2009. This increase in net sales resulted primarily from an increase in sales volume of windows and doors for factory built holiday homes in the UK and automotive components for European automotive and transportation OEMs. Net sales also increased approximately $3.2 million due to strengthening of the Euro, net of weakening of the British pound sterling, against the U.S. dollar. These increases were partially offset by a reduction in sales volume of vinyl replacement windows to UK home centers.
Cost of Goods Sold. Cost of goods sold includes the cost of raw materials, manufacturing labor, packaging, utilities, freight, maintenance and other elements of manufacturing overhead. Cost of goods sold increased $18.6 million, or 12.7%, to $164.9 million in the first quarter of 2010 from $146.3 million in the first quarter of 2009. This increase reflects higher raw material, labor, packaging, freight and utility costs due to higher sales volume. The percentage increases in these costs were generally less than the 25.5% increase in net sales for the same period, contributing to an increase in gross margin to 17.8% for the first quarter of 2010 from 8.4% for the first quarter of 2009. While raw material costs increased due to higher sales volume, per unit raw material costs in the first quarter of 2010 were lower compared to the first quarter of 2009. These lower unit costs were generally passed along to customers through selling price reductions. While this did not materially impact our profitability, it did have the effect of increasing our gross margin as a percentage of net sales. Cost of goods sold also increased approximately $2.8 million due to the strengthening of the Euro, net of weakening of the British pound sterling, against the U.S. dollar.
Selling and General. Selling and general expenses include salaries, benefits, incentive compensation, insurance, travel and entertainment and other administrative costs. Selling and general expenses increased $0.1 million, or 0.7%, to $23.4 million in the first quarter of 2010 from $23.3 million in the first quarter of 2009. This increase, while not significant, includes a $0.9 million reduction in bad debt expense partially offset by a $0.4 million increase in expense associated with the strengthening of the Euro, net of weakening of the British pound sterling, against the U.S. dollar.
54
Debt Restructuring and Forbearance Expenses. Debt restructuring and forbearance expenses include professional fees for attorneys and other advisors to the Company and its lenders in connection with the restructuring of our debt. Restructuring and forbearance expenses related to the restructuring of our debt were $4.0 million in the first quarter of 2009. No restructuring and forbearance expenses were recorded in the first quarter of 2010.
Depreciation and Amortization. Depreciation and amortization declined $0.7 million, or 7.3%, to $9.1 million in the first quarter of 2010 from $9.8 million in the first quarter of 2009. The decline resulted from an increase in the amount of assets that has become fully depreciated.
Income (Loss) From Operations. As a result of the aforementioned items, our income from operations was $3.1 million for the first quarter of 2010, as compared to a loss of $(23.7) million for the first quarter of 2009.
Income from operations of our U.S. Residential Building Products segment increased $2.3 million to $0.9 million for the first quarter of 2010 from a loss of $(1.4) million for the first quarter of 2009. The increase relates primarily to an increase in net sales volume and reductions in selling and general expenses.
The loss from operations of our U.S. Non-Residential Building Products segment improved $1.9 million to a loss of $(3.4) million for the first quarter of 2010 from a loss of $(5.3) million in the first quarter of 2009. This improvement, despite an insignificant change in net sales volume, is primarily due to an increase in gross margin resulting from a decline in raw material costs in excess of selling price reductions and lower direct and indirect manufacturing costs. The improvement also reflects a reduction in selling and general expenses.
The loss from operations of our U.S. RV and Specialty Building Products segment improved $4.4 million to a loss of $(0.8) million for the first quarter of 2010 from a loss of $(5.2) million for the first quarter of 2009. This improvement is primarily related to higher sales volume partially offset by a decline in selling prices in excess of raw material cost reductions.
Income (loss) from operations of our European Roll Coated Aluminum segment improved $10.2 million to income of $6.7 million for the first quarter of 2010 from a loss of $(3.5) million for the first quarter of 2009. This improvement was primarily due to the increase in sales volume and lower raw material costs. Lower raw material costs reflect conditions in the first quarter of 2009 that resulted in many of our specialty coated coil customers delaying or cancelling orders for which we had procured bare aluminum supply. We consumed and sold portions of this higher cost metal in the first quarter of 2009, a time when selling prices were declining. Accordingly, gross margin in the first quarter of 2009 was below historical levels.
Income (loss) from operations of our European Engineered Products segment improved $6.1 million to income of $0.7 million for the first quarter of 2010 from a loss of $(5.4) million for the first quarter of 2009. The improvement was primarily due to the increase in sales volume and a reduction in costs related to employee severances in 2009.
Interest Expense. Interest expense declined $7.8 million, or 29.6%, to $18.7 million in the first quarter of 2010 from $26.6 million in the first quarter of 2009. The decline is primarily due to the cancellation of indebtedness in connection with our debt restructuring. This decline was partially offset by an increase in interest rates on the first lien credit facility.
Other Loss, Net. Other loss, net includes translation gains and losses on intercompany obligations, gains and losses on asset disposals, interest income and other income or expense items of a non-operating nature. Other loss, net in the first quarter of 2010 of $(4.1) million included a translation loss of $(4.5) million on intercompany obligations partially offset by interest income. Other loss, net in
55
the first quarter of 2009 of $(4.3) million included a translation loss of $(2.7) million and a loss on our interest rate swaps of $(2.1) million.
Benefit for Income Taxes. We reported an income tax benefit of $0.6 million for the first quarter of 2010, as compared to a benefit of $10.4 million for the first quarter of 2009. Our effective tax rates were 2.8% for the three months ended April 2, 2010 and 19.0% for the three months ended March 27, 2009.
The effective rate for the first quarter of 2010 differed from the U.S. statutory rate primarily due to state income taxes, lower tax rates of our foreign operations as compared to the U.S. federal rates, U.S. tax impact of foreign dividends and non-deductible foreign currency transaction gains and losses.
The effective rate for the first quarter of 2009 differed from the U.S. statutory rate primarily due to state income taxes, lower tax rates of our foreign operations as compared to the U.S. federal rates, recognition of a valuation allowance on losses in the U.S., decreases in our reserves for uncertain tax positions as a result of effectively settling certain matters upon finalization of tax examinations, U.S. tax impact of foreign dividends and non-deductible foreign currency transaction gains and losses.
Our effective tax rate reflects tax benefits derived from significant operations in the U.S., which are generally taxed at rates higher than the foreign statutory tax rates. A change in the mix of pretax income from the various tax jurisdictions can have a significant impact on the Company's periodic effective tax rate.
Net Loss. Our net loss was $(19.2) million for the first quarter of 2010, as compared to a net loss of $(45.0) million for the first quarter of 2009.
Year Ended December 25, 2009 Compared to the Year Ended December 26, 2008.
The following table sets forth net sales and income (loss) from operations data by segment for the years ended December 25, 2009 and December 26, 2008:
| |
Net Sales | Income (Loss) from Operations | ||||||||||||||||||
|---|---|---|---|---|---|---|---|---|---|---|---|---|---|---|---|---|---|---|---|---|
| |
Year Ended December 25, 2009 |
Year Ended December 26, 2008 |
Increase (Decrease) |
Year Ended December 25, 2009 |
Year Ended December 26, 2008 |
Increase (Decrease) |
||||||||||||||
| |
(dollars in millions) |
|||||||||||||||||||
U.S. Residential Building Products |
$ | 232.1 | $ | 266.6 | (12.9 | )% | $ | 26.5 | $ | (98.7 | ) | 126.8 | % | |||||||
U.S. Non-Residential Building Products |
211.9 | 333.7 | (36.5 | )% | 0.6 | (63.3 | ) | 100.9 | % | |||||||||||
U.S. RV and Specialty Building Products |
119.0 | 194.1 | (38.7 | )% | (8.6 | ) | (123.4 | ) | 93.0 | % | ||||||||||
European Roll Coated Aluminum |
180.3 | 275.1 | (34.5 | )% | (3.8 | ) | (22.3 | ) | 83.0 | % | ||||||||||
European Engineered Products |
68.8 | 104.0 | (33.8 | )% | (6.8 | ) | (93.7 | ) | 92.7 | % | ||||||||||
Other Non-Allocated |
— | — | — | % | (19.3 | ) | (5.6 | ) | (242.9 | )% | ||||||||||
Totals |
$ | 812.1 | $ | 1,173.5 | (30.8 | )% | $ | (11.4 | ) | $ | (407.0 | ) | 97.3 | % | ||||||
Net Sales. Our net sales declined $361.4 million, or 30.8%, to $812.1 million in 2009 from $1,173.5 million in 2008. Net sales in each of our segments declined in 2009 compared to 2008 primarily due to lower demand that was generally attributable to continuing global economic uncertainty and disrupted credit markets. In addition, world prices for aluminum declined to a full year average of $1,665 per metric ton in 2009 from an average of $2,573 per metric ton for the full year of 2008. This decline, driven by lower expectations of world aluminum consumption due to the broader economic downturn, triggered price reductions for many of our aluminum based products. We estimate
56
that approximately $89.4 million, or 24.7%, of our decline in net sales in 2009 was attributable to lower selling prices for aluminum based products.
Net sales of our U.S. Residential Building Products segment declined $34.4 million, or 12.9%, to $232.2 million in 2009 from $266.6 million in 2008. This decline in net sales resulted primarily from a reduction in selling prices attributable to decreases in aluminum costs that were passed along to our customers. Net sales also declined as a result of the lower demand we experienced from distributors, home improvement retailers and other retailers in the U.S. for our roof drainage, roof edge and related products. Lower net sales to these customers resulted from lower levels of consumer spending on residential repair, remodel and maintenance activity and fewer existing housing sales, which tend to drive demand for our repair-oriented products.
Net sales of our U.S. Non-Residential Building Products segment declined $121.8 million, or 36.5%, to $211.9 million in 2009 from $333.7 million in 2008. This decline in net sales resulted primarily from lower sales volume of steel and aluminum roofing and siding panels sold to builders, contractors, lumberyards and home improvement retailers. Lower sales to these customers resulted from lower demand for wood framed buildings impacted by consumer confidence, availability of consumer credit and disposable income. Lower sales also resulted from lower levels of commercial construction for non-wood framed structures. Net sales also declined due to reductions in selling prices attributable to decreases in aluminum and steel costs that were passed along to customers.
Net sales of our U.S. RV and Specialty Products segment declined $75.1 million, or 38.7%, to $119.0 million in 2009 from $194.1 million in 2008. This decline in net sales resulted primarily from lower sales volume of RV sidewall components and doors to RV OEM's. Lower sales to these customers were indicative of softer demand from U.S. consumers for towable RVs, resulting from lower consumer discretionary spending and lower levels of consumer lending for RV purchases. Net sales also declined due to lower sales volume of vinyl replacement windows and patio products to contractors in the Western U.S. This decline was indicative of lower levels of consumer spending and available credit for residential repair and maintenance activity. Net sales also declined due to reductions in selling prices attributable to decreases in aluminum costs that were passed along to customers.
Total net sales for our U.S. segments decreased $231.4 million or 29.1% from $794.4 million in 2008 to $563.0 million in 2009.
Net sales of our European Roll Coated Aluminum segment decreased $94.8 million, or 34.5%, to $180.3 million in 2009 from $275.1 million in 2008. This decline in net sales resulted primarily from lower sales volume of specialty coated aluminum coil to RV OEM's, commercial panel producers and cargo container manufacturers. Lower sales to RV OEM's were indicative of a decrease in demand from European consumers for RVs resulting from economic uncertainty and lower levels of discretionary spending in our European end markets. Lower sales to commercial panel producers reflect a decline in commercial and industrial construction activity in our European end markets. Net sales also declined due to reductions in selling prices attributable to decreases in aluminum costs that were passed along to customers. Weakening of the Euro and British pound sterling against the U.S. dollar decreased net sales of this segment $15.5 million in 2009 compared to 2008.
Net sales of our European Engineered Products segment declined $35.2 million, or 33.8%, to $68.8 million in 2009 from $104.0 million in 2008. This decline in net sales resulted primarily from lower sales volumes of windows to holiday home manufacturers; automotive components to transportation OEM's; and RV doors to RV OEM's. These declines were partially offset by an increase in sales volume of vinyl windows sold to UK home centers that resulted from market share gains. Weakening of the Euro and British pound sterling against the U.S. dollar decreased net sales of the segment $9.6 million in 2009 compared to 2008.
57
Total net sales for our European segments decreased $130.0 million or 34.3% from $379.1 million in 2008 to $249.1 million in 2009. Weakening of the British pound sterling and Euro against the U.S. dollar decreased our 2009 net sales $25.1 million compared to 2008.
Cost of Goods Sold. Cost of goods sold declined $334.3 million, or 33.1%, to $675.1 million in 2009 from $1,009.4 million in 2008. The decline in cost of goods sold exceeded our 30.8% decline in net sales for 2009 compared to 2008, which contributed to an increase in gross margin to 16.9% for 2009 compared to 14.0% in 2008. We estimate that over 80% of our cost of goods sold is variable in nature. Such variable costs include material, direct labor, packaging and freight. In the declining market experienced in 2009, we were generally able to reduce these variable costs in line with reductions in sales volume. We also reduced fixed costs including indirect labor, maintenance, utilities and rent as a result of facility closures. In addition, steel and aluminum raw material costs declined in 2009 compared to 2008 due to lower demand for these commodities in global markets. Declines in raw material costs are typically, as was the case in 2009, accompanied by a similar decline in selling prices. Accordingly, raw material cost declines did not improve our profitability but did increase our gross margin as a percentage of net sales. In addition to fixed cost reductions and the impact of declining raw material costs, our gross margin also increased in 2009 due to a $8.8 million charge recorded in 2008 to write certain steel and aluminum inventories down to market value which was lower than cost. Weakening of the British pound sterling and Euro against the U.S. dollar decreased our 2009 cost of goods sold by $22.1 million compared to 2008.
Selling and General. Selling and general expenses declined $18.8 million, or 17.0%, to $91.8 million in 2009 from $110.6 million in 2008. The decrease in selling and general expenses is primarily due to the full year benefit of cost reductions initiated in 2008 and includes reductions in salaries, benefits and travel and entertainment. In addition, commission-based sales incentives were lower due to lower net sales. Offsetting these decreases were higher levels of sales and management incentive compensation tied to operating and profitability goals which were exceeded in 2009. Weakening of the British pound sterling, the Euro and the Canadian dollar against the U.S. dollar decreased our 2009 selling and general expenses by $2.5 million compared to 2008.
Debt Restructuring and Forbearance Expenses. Debt restructuring and forbearance expenses were $13.3 million in 2009 as a result of costs incurred in restructuring our first and second lien credit agreements on June 29, 2009 and expenses in connection with a series of forbearance and limited waiver agreements related to those credit agreements in place from November 10, 2008 to the completion of the restructuring. Restructuring and forbearance expenses were $3.8 million in 2008 as a result of the series of forbearance and limited waiver agreements under our first and second lien credit agreements in place during 2008.
Depreciation and Amortization. Depreciation and amortization declined $15.6 million, or 28.2%, to $39.7 million in 2009, from $55.3 in 2008. The decline is primarily related to lower depreciation and amortization resulting from lower tangible and intangible asset values due to write-offs of portions of these assets recorded in 2008.
Goodwill and Other Impairments. In 2008, declines in our net sales and operating results required us to test for the impairment of goodwill and other intangible assets. Due to substantial uncertainty regarding the duration of the economic downturn, we lowered our expectations for future cash flows at each of our reporting units. As a result, in 2008, we recorded impairment charges totaling $345.0 million, $50.4 million and $3.9 million, relating to goodwill, customer relationships and trade names, respectively. In addition, as a result of declines in the RV market in 2008, we determined that our investment in our Ft. Wayne, Indiana facility was not fully recoverable. Accordingly, we recorded a charge of $2.0 million in 2008 to reduce the carrying value of certain machinery and equipment, devoted to the manufacture of fiberglass products for the RV industry, to their appraised values.
58
In 2009, as a result of further declines in RV demand, we closed the Ft. Wayne facility and wrote down our investment in this facility by $3.5 million to its expected salvage value.
Income (Loss) From Operations. As a result of the aforementioned items, our loss from operations was $(11.4) million for 2009, as compared to $(407.0) million for 2008.
Income (loss) from operations of our U.S. Residential Building Products segment increased $125.2 million to $26.5 million in 2009 from a loss of $(98.7) million in 2008. This difference relates primarily to goodwill and other impairment charges recorded in 2008 of $117.1 million. The remaining difference reflects a decline in gross margin due to lower volumes offset by efficiency gains and lower selling and general expenses in 2009.
The income (loss) from operations of our U.S. Non-Residential Building Products segment improved by $63.9 million to income of $0.6 million in 2009 from a loss of $(63.3) million in 2008. This difference relates primarily to goodwill and other impairment charges recorded in 2008 of $58.7 million and lower selling and general expenses in 2009. These improvements were partially offset by a decline in gross margin attributable to lower net sales volume.
The loss from operations of our U.S. RV and Specialty Products segment improved by $114.8 million to a loss of $(8.6) million in 2009 from a loss of $(123.4) million in 2008. This difference related primarily to goodwill and other impairment charges recorded in 2008 of $107.4 million and lower selling and general expenses in 2009. These improvements were partially offset by a decline in gross margin attributable to lower net sales volume.
The loss from operations of our European Roll Coated Aluminum segment improved by $18.5 million to a loss of $(3.8) million in 2009 from a loss of $(22.3) million in 2008. This difference relates primarily to goodwill and other impairment charges recorded in 2008 of $43.3 million. This improvement was offset by a decline in gross margin attributable to a combination of lower net sales volume and lower selling prices in relation to aluminum costs. Higher aluminum costs resulted from the inability of certain customers to honor fixed price purchase commitments for aluminum that was in excess of market prices.
The loss from operations of our European Engineered Products segment improved by $86.9 million to a loss of $(6.8) million in 2009 from a loss of $(93.7) million in 2008. This difference relates primarily to goodwill and other impairment charges recorded in 2008 of $84.0 million. This improvement was offset by a decline in gross margin attributable to lower net sales volume.
Interest Expense. Interest expense declined $25.3 million, or 23.1%, to $84.2 million in 2009, from $109.5 million in 2008. This decline was due to the completion of the restructuring of our first and second lien credit agreements on June 29, 2009 which resulted in the cancellation of our Equity Sponsor PIK Notes and second lien debt, offset by an increase in the interest rates of our first lien credit facility. In 2008, we recognized interest expense of $21.6 million representing the accelerated amortization of remaining deferred financing fees to coincide with the term of the first forbearance entered under the credit agreements. In 2009, we recognized interest expense of $5.5 million representing fees and expenses relating to obtaining forbearances.
Other income (loss), net. Other income in 2009 of $1.3 million included translation gains totaling $4.6 million on intercompany obligations and interest income of $1.1 million, partially offset by losses on our interest rate swaps. Other loss in 2008 of $(22.7) million included a $(15.9) million translation loss on intercompany obligations and U.S. dollar debt issued by our foreign subsidiaries. The other income (loss) in 2008 also included a loss on our interest rate swaps.
Benefit for Income Taxes. We reported an income tax benefit of $1.3 million for 2009, as compared to a benefit of $61.1 million for 2008. Our effective tax rates were 1.5% for 2009 and 11.3% for 2008.
59
Our effective tax rate reflects tax benefits derived from significant operations in the U.S., which are generally taxed at rates higher than the foreign statutory tax rates. A change in the mix of pretax income from the various tax jurisdictions can have a significant impact on the Company's periodic effective tax rate.
In 2009, our effective tax rate included the following:
- •
- The impact of an approximate 25.9% effective tax rate on the restructuring activities.
- •
- A net benefit of approximately $(9.1) million related to amounts required to be recorded for changes to our
uncertain tax positions under Interpretation No. 48, including interest and penalties (see Note 11 of Notes to Consolidated Financial Statements).
- •
- A net charge of approximately $4.0 million related to foreign dividends taxed in the U.S. at the statutory rate of 35%.
In 2008, our effective tax rate included the following:
- •
- The impact of an approximate 19.2% effective tax rate on the permanent goodwill charges recognized.
- •
- A net charge of approximately $10.4 million related to amounts required to be recorded for changes to our uncertain
tax positions under Interpretation No. 48, including interest and penalties (see Note 11 of Notes to Consolidated Financial Statements).
- •
- A net charge of an approximate $12.9 million related to recording a valuation allowance against U.S. deferred tax assets.
Net Loss. Our net loss was $(85.6) million for 2009, as compared to a net loss of $(500.6) million for 2008.
Year Ended December 26, 2008 Compared to the Year Ended December 28, 2007.
The following table sets forth net sales and income from operations data by segment for the years ended December 26, 2008 and December 28, 2007:
| |
Net Sales | Income (Loss) from Operations |
|||||||||||||||
|---|---|---|---|---|---|---|---|---|---|---|---|---|---|---|---|---|---|
| |
Year Ended December 26, 2008 |
Year Ended December 28, 2007 |
Increase (Decrease) |
Year Ended December 26, 2008 |
Year Ended December 28, 2007 |
||||||||||||
| |
(dollars in millions) |
||||||||||||||||
U.S. Residential Building Products |
$ | 266.6 | $ | 267.6 | (0.4 | )% | $ | (98.7 | ) | $ | 18.6 | ||||||
U.S. Non-Residential Building Products |
333.7 | 330.8 | 0.9 | % | (63.3 | ) | (0.7 | ) | |||||||||
U.S. RV and Specialty Building Products |
194.1 | 236.4 | (17.9 | )% | (123.4 | ) | (1.6 | ) | |||||||||
European Roll Coated Aluminum |
275.1 | 281.6 | (2.3 | )% | (22.3 | ) | 19.2 | ||||||||||
European Engineered Products |
104.0 | 129.2 | (19.5 | )% | (93.7 | ) | (0.1 | ) | |||||||||
Other Non-Allocated |
— | — | — | % | (5.6 | ) | (1.4 | ) | |||||||||
Totals |
$ | 1,173.5 | $ | 1,245.6 | (5.8 | )% | $ | (407.0 | ) | $ | 34.0 | ||||||
Net sales. Our net sales declined $72.1 million, or 5.8%, to $1,173.5 million in 2008 from $1,245.6 million in 2007 as demand from our customers began to wane amidst a backdrop of global economic uncertainty precipitated by a collapse in the housing market and disruption in consumer and corporate credit markets. After achieving year over year growth of $19.0 million through the first half of 2008, our net sales in the third and fourth quarters of 2008, compared to the same periods of 2007, declined $15.0 million and $76.1 million, respectively.
60
Net sales of our U.S. Residential Building Products segment declined $1.0 million, or 0.4%, to $266.6 million in 2008 from $267.6 million in 2007. This decline, while not significant, reflects a decline in selling prices attributable to decreases in aluminum costs that were passed along to our customers. This decline was partially offset by an increase in sales volume of roof drainage, roof edge and related products to home improvement retailers and other retailers.
Net sales of our U.S. Non-Residential Building Products segment increased $2.9 million, or 0.9%, to $333.7 million in 2008 from $330.8 million in 2007. This increase, while not significant, reflects an increase in steel selling prices attributable to increases in galvanized steel costs and an increase in sales of steel and aluminum roofing and siding used in non-residential and industrial construction. This increase was partially offset by a decline in volume sold to builders, contractors, lumber yards and home improvement retailers of steel and aluminum roofing and siding for wood framed construction.
Net sales of our U.S. RV and Specialty Products segment declined $42.3 million, or 17.9%, to $194.1 million in 2008 from $236.4 million in 2007. This decline in net sales resulted primarily from lower sales volume of vinyl replacement windows and patio products to contractors in the Western U.S. This decline resulted from lower levels of spending by home owners on repair and remodel projects resulting from waning consumer confidence and less availability of home equity and consumer based credit. Net sales also declined to RV OEMs as the availability of consumer financing declined.
Total net sales for our U.S. segments declined $40.4 million, or 4.8%, to $794.4 million in 2008 from $834.8 million in 2007.
Net sales of our European Roll Coated Aluminum segment declined $6.5 million, or 2.3%, to $275.1 million in 2008 from $281.6 million in 2007. This decline in net sales resulted primarily from lower sales of specialty coated aluminum coil to RV OEMs. This decline was partially offset by an increase in volume of specialty coated aluminum to commercial and architectural panel manufacturers supplying the commercial construction markets due to market share gains. Strengthening of the Euro, partially offset by weakening of the British pound sterling, against the U.S. dollar, increased net sales of this segment $12.4 million in 2008 compared to 2007.
Net sales of our European Engineered Products segment declined $25.2 million, or 19.5%, to $104.0 million in 2008 from $129.2 million in 2007. This decline in net sales resulted primarily from lower sales volumes of windows to holiday home manufacturers; doors to RV OEM's; and doors and windows to UK home centers. These declines were partially offset by an increase in net sales of $2.3 million resulting from strengthening of the Euro, partially offset by weakening of the British pound sterling, against the U.S. dollar.
Total net sales for our European segments decreased $31.7 million, or 7.7%, to $379.1 million in 2008 from $410.8 million in 2007. Strengthening of the Euro, net of weakening of the British pound sterling, against the U.S. dollar increased our 2008 European net sales by $14.7 million compared to 2007.
Cost of Goods Sold. Our cost of goods sold declined $43.4 million, or 4.1%, to $1,009.4 million in 2008 from $1,052.8 million in 2007. The decline in cost of goods sold was less than the 5.8% decline in net sales for 2008 compared to 2007 which contributed to a decrease in gross margin to 14.0% for 2008 compared to 15.5% in 2007. We estimate that over 80% of our cost of goods sold in 2007 were variable in nature. Such variable costs include material, direct labor, packaging and freight. In the declining market experienced in 2008, we were generally able to reduce these variable costs in line with reductions in sales volume. However, our gross margin declined as bare aluminum and steel costs increased. These cost increases were generally accompanied by selling price increases and did not affect our per unit profitability; however, this situation did reduce our gross margin as a percentage of sales. Our fixed costs including facility rent, supervisory labor and leased equipment expenses increased as a percentage of net sales and reduced our gross margin primarily due to lower
61
net sales volume. In addition our gross margin also declined in 2008 due to an $8.8 million charge recorded to write certain steel and aluminum inventories down to market value which was lower than cost. Strengthening of the Euro, partially offset by weakening of the British pound sterling and Canadian dollar, against the U.S. dollar increased cost of goods sold $10.3 million in 2008 compared to 2007.
Selling and General. Selling and general expenses increased $9.4 million, or 9.3%, to $110.6 million in 2008 from $101.2 million in 2007. The increase in selling and general expenses is primarily due to an increase in our provision for doubtful accounts and costs related to employee severances. Strengthening of the Euro, partially offset by weakening of the British pound sterling and Canadian dollar, against the U.S. dollar increased selling and general expenses $0.2 million in 2008 compared to 2007.
Debt Restructuring and Forbearance Expenses. Debt Restructuring and forbearance expenses were $3.8 million in 2008 as a result of expenses in connection with a series of forbearance and limited waiver agreements related to our first and second lien credit agreements beginning November 10, 2008 and through the duration of 2008. There were no debt restructuring and forbearance expenses during 2007.
Depreciation and Amortization. Depreciation and amortization declined $2.3 million, or 4.0%, to $55.3 million in 2008, from $57.6 million in 2007. The decline is primarily related to lower amortization of intangible customer relationship assets.
Goodwill and other impairments. We recorded a non-cash impairment charge in the amount of $401.4 million during 2008. No goodwill or intangible asset impairment charges were recorded in 2007. Declines in our net sales and operating results required us to test for the impairment of goodwill and other intangible assets during 2008. Due to substantial uncertainty regarding the duration of the economic downturn, we lowered our expectations for future cash flows at each of our reporting units. As a result, in 2008, we recorded impairment charges totaling $345.0 million, $50.4 million and $3.9 million, relating to goodwill, customer relationships and trade names, respectively.
In addition, as a result of declines in the RV market in 2008, we determined that our investment in our Ft. Wayne, Indiana facility was not fully recoverable. Accordingly, we recorded a charge of $2.0 million in 2008 to reduce the carrying value of certain machinery and equipment, devoted to the manufacture of fiberglass products for the RV industry, to their appraised values.
Income (Loss) from Operations. As a result of the aforementioned items, our loss from operations was $(407.0) million for 2008, as compared to income from operations of $34.0 million for 2007.
Income (loss) from operations of our U.S. Residential Building Products segment declined $117.3 million to a loss of $(98.7) million in 2008 from income of $18.6 million in 2007. This difference relates primarily to goodwill and other impairment charges recorded in 2008 of $117.1 million. The remaining difference reflects a decline in gross margin primarily related to a lag in selling price increases necessary to cover raw material cost increases.
Income (loss) from operations of our U.S. Non-Residential Building Products segment declined $62.6 million to a loss from operations of $(63.3) million in 2008 from a loss of $(0.7) million in 2007. This difference relates primarily to goodwill and other impairment charges recorded in 2008 of $58.7 million. The remaining difference is primarily due to an increase in general expenses associated with facility closures, employee terminations and expenses associated with implementation of our new ERP system.
Income (loss) from operations of our U.S. RV and Specialty Building Products segment declined $121.8 million to a loss of $(123.4) million in 2008 from a loss of $(1.6) million in 2007. This
62
difference related primarily to goodwill and other impairment charges recorded in 2008 of $107.4 million and a decline in gross margin due to a decline in net sales. These declines were partially offset by reductions in selling and general expenses associated with facility closures and employee terminations.
Income (loss) from operations of our European Roll Coated Aluminum segment declined $41.5 million to a loss of $(22.3) million in 2008 from income of $19.2 million in 2007. This difference relates primarily to goodwill and other impairment charges recorded in 2008 of $34.1 million and a decline in gross margin due to a decline in net sales and an increase in bare aluminum costs.
Income (loss) from operations of our European Engineered Products segment declined $93.6 million to a loss of $(93.7) million in 2008 from a loss of $(0.1) million in 2007. This difference relates primarily to goodwill and other impairment charges recorded in 2008 of $84.1 million and a decline in gross margin due to a decline in net sales.
Interest Expense. Interest expense increased $24.6 million, or 29.0%, to $109.5 million in 2008 from $84.9 million in 2007. This increase was primarily due to the $21.6 million we recognized in 2008 representing the accelerated amortization of remaining deferred finance fees to coincide with the term of the first forbearance agreement entered under our first and second lien credit agreements. No such expenses were recognized during 2007.
Other income (loss), net. Other loss in 2008 of $(22.7) million included a $15.9 million translation loss on intercompany obligations and U.S. dollar debt issued by our foreign subsidiaries. The other loss also included a loss on our interest rate swaps. Other income in 2007 of $5.1 million included a translation gain of $6.8 million on debt issued by our foreign subsidiaries, interest income of $1.7 million, and a translation loss on intercompany obligations of $1.9 million.
Benefit for income taxes. We reported an income tax benefit of $61.1 million for 2008, as compared to a benefit of $2.5 million for 2007. Our effective tax rates were 11.3% for 2008 and 5.5% for 2007.
Our effective tax rate reflects tax benefits derived from significant operations in the U.S., which are generally taxed at rates higher than the foreign statutory tax rates. A change in the mix of pretax income from the various tax jurisdictions can have a significant impact on the Company's periodic effective tax rate.
In 2008, our effective tax rate included the following:
- •
- The impact of an approximate 19.2% effective tax rate on the permanent goodwill charges recognized.
- •
- A net charge of approximately $10.4 million related to amounts required to be recorded for changes to our uncertain
tax positions under Interpretation No. 48, including interest and penalties (see Note 11 of Notes to our consolidated financial statements included elsewhere in this prospectus).
- •
- A net charge of approximately $12.9 million related to recording a valuation allowance against U.S. deferred tax assets.
63
In 2007, our effective tax rate included the following:
- •
- A net charge of approximately $9.4 million related to foreign dividends taxed in the U. S. at the statutory rate of
35%.
- •
- A net charge of approximately $2.5 million related to amounts required to be recorded for changes to our uncertain tax positions under Interpretation No. 48, including interest and penalties (see Note 11 of Notes to our consolidated financial statements included elsewhere in this prospectus).
Net Loss. Our net loss was $(500.6) million for 2008 as compared to a net loss of $(49.4) million for 2007.
Liquidity and Capital Resources
Our principal sources of liquidity are from cash and cash equivalents, cash from operations and borrowings under our ABL Facility. As of April 2, 2010, we had cash and cash equivalents of $38.3 million. Net cash provided by (used in) operating activities was $(28.7) million and $59.5 million for the three months ended April 2, 2010 and the year ended December 25, 2009, respectively. As of April 2, 2010, we had availability of $43.4 million under our ABL Facility. As of July 2, 2010, we had no amounts outstanding and availability of $61.5 million under our ABL Facility.
Our ability to make payments on and to refinance our indebtedness, to fund planned capital expenditures and to satisfy our other capital and commercial commitments will depend on our ability to generate cash flow in the future. This, to a certain extent, is subject to general economic, financial, competitive, legislative, regulatory and other factors that are beyond our control. We believe our April 2, 2010 cash levels, together with our cash from operations, borrowings under our ABL Facility and the proceeds we receive from this offering, will be adequate to fund our cash requirements based on our current level of operations for at least the next twelve months. We cannot assure you, however, that our business will generate sufficient cash flow from operations, that anticipated net sales growth and operating improvements will be realized or that future borrowings will be available under our ABL Facility in an amount sufficient to enable us to service our indebtedness or to fund our other liquidity needs. See "Risk Factors—Risks Relating to Our Business—We may not be able to generate sufficient cash to service all of our indebtedness and may not be able to refinance our indebtedness on favorable terms. If we are unable to do so, we may be forced to take other actions to satisfy our obligations under our indebtedness, which may not be successful."
Other risks that could materially adversely affect our ability to meet our debt service obligations include, but are not limited to, a decline in gross domestic product levels, weakening of the residential and nonresidential construction markets, commodity price risks and volatility related to increases in the cost of aluminum, steel or raw materials generally, our ability to protect our intellectual property, rising interest rates, the loss of key personnel, our ability to continue to invest in equipment, and a decline in relations with our key distributors and dealers. In addition, any of the other factors discussed under "Risk Factors" may also significantly impact our liquidity.
Due to the deterioration in the credit markets, some financial institutions have reduced and, in certain cases, ceased to provide funding to borrowers. We are dependent on the borrowings provided by our lenders to support our working capital needs and capital expenditures. Our ABL Facility matures in June 2012. Our lenders may be unable to fund borrowings under their credit commitments to us if a lender faces bankruptcy, failure, collapse or sale. If our cash flow and capital resources do not provide necessary liquidity, such an event could have a significant negative effect on our results of operations.
We are constantly evaluating our capital structure and alternatives to our current credit facilities. We may in the future seek to refinance all or part of our current credit facilities by entering
64
into new credit facilities or issuing public or private debt securities in the capital markets. We may also seek to repurchase our debt from holders thereof. We cannot assure you that we would be successful in any such effort, which would be subject to market conditions and numerous other factors beyond our control.
Our ability to refinance our indebtedness on favorable terms, or at all, is directly affected by the current global economic and financial conditions and other economic factors that may be outside our control. In addition, our ability to incur secured indebtedness (which may enable us to achieve better pricing than the incurrence of unsecured indebtedness) depends in part on the covenants in our credit facilities and indentures and the value of our assets, which depends, in turn, on the strength of our cash flows, results of operations, economic and market conditions and other factors. We are currently in compliance with our financial covenants relating to our debt. See Note 7 to our consolidated financial statements included elsewhere in this prospectus entitled "Long-Term Debt" for more information regarding our debt covenants.
Debt
Restructuring
On June 29, 2009, we, the holders of substantially all of our then-existing equity securities and management shareholders agreed to a restructuring of indebtedness owed to our then-existing equity sponsors, lenders under our then existing first and second lien credit agreements and of amounts owed to counterparties under our then existing interest rate swaps (the "Restructuring"). Under the terms of the Restructuring, lenders cancelled 100% of amounts owed under our second lien credit agreement consisting of principal and accrued interest of $191 million and $12 million, respectively, in exchange for 100% of our issued and outstanding common stock as of the date of the Restructuring. Our common stock was issued to lenders in proportion to their holdings of the second lien loans prior to the Restructuring. As a result, we recorded the fair value of equity securities issued (less associated fees) as a credit to paid-in capital and recognized a pretax extinguishment gain of $8.7 million on the exchange. Our then-existing equity sponsors also cancelled all of our then-outstanding payment in kind notes, consisting of $195.4 million of principal and $1.4 million of accrued interest, in connection with the Restructuring. As of December 26, 2008, borrowings under the first and second lien credit agreements were recorded as long-term due to the Restructuring.
Also under the terms of the Restructuring, lenders under the first lien credit agreement, together with counterparties to our interest rate swaps, amended and restated the then-existing first lien credit agreement to, among other items, split the sum of amounts owed under the first lien secured revolving credit facility ($77.5 million), the U.S. dollar term loan facility ($304.8 million), the European term loan facility ($109.3 million) and the interest rate swaps ($18.9 million) into two components consisting of a cash pay portion (the "Cash Pay Loan") and a payment-in-kind portion (the "PIK Loan"). Immediately following the Restructuring, principal balances owed under the Cash Pay Loan and PIK Loan were $261.2 million (including capitalized fees of $1.3 million) and $251.8 million (including accrued interest and capitalized fees of $14.9 million), respectively. On the Restructuring date, debt issuance costs of $2.5 million were capitalized in connection with the amendment and restatement of the first lien credit agreement. In connection with the Restructuring, the holders of our then-existing equity securities lost the entire value of their investment.
The Restructuring was preceded by a series of forbearance and limited waiver agreements in place from November 10, 2008 to the Restructuring date. Under the forbearance agreements, lenders under the first and second lien credit agreements and our then-existing accounts receivable facility agreed to forbear from exercising their rights, including accelerating repayment of the outstanding debt, with respect to named events of default primarily related to financial covenant compliance. The forbearance agreements contained, among other items, a minimum liquidity requirement and
65
restrictions on distributions of cash. During the period of forbearance, we were restricted from borrowing under our then-existing first lien revolving credit facility. In 2008, we recognized interest expense of $21.6 million representing the accelerated amortization of remaining deferred financing fees to coincide with the term of the first forbearance. In 2009, we recognized interest expense of $5.5 million representing fees and expenses relating to obtaining forbearances.
The First Lien Credit Agreement
Our amended and restated first lien credit agreement (the "First Lien Credit Agreement") consists of $525.3 million in term loans in the form of the Cash Pay Loan and the PIK Loan. The Cash Pay Loan and PIK Loan each include (i) a U.S. dollar term loan facility (the "U.S. Dollar Term Loan Facility") and (ii) Euro and British pound sterling term loan facilities (together the "European Term Loan Facility"). Our subsidiaries Euramax International, Inc. and Euramax International Holdings B.V. are the borrowers (collectively, the "U.S. Borrowers") under the U.S. Dollar Term Loan Facility. Our subsidiaries Euramax Holdings Limited, Euramax Europe B.V. and Euramax Netherlands B.V. are the borrowers (collectively, the "European Borrowers") under the European Term Loan Facility. As of December 25, 2009, portions of the Cash Pay Loan denominated in U.S. dollars, Euros and British pounds sterling were $205.5 million, €31.8 million ($45.8 million) and £6.6 million ($10.6 million), respectively. Also, as of December 25, 2009, portions of the PIK Loan denominated in U.S. dollars, Euros and British pounds sterling were $206.2 million, €32.3 million ($46.5 million) and £6.7 million ($10.7 million), respectively.
Maturity and Prepayment. The maturity date of both the U.S. Dollar Term Loan Facility and the European Term Loan Facility (together the "Term Loans") is June 29, 2013. The Term Loans may be prepaid at any time without premium or penalty. We are required to make mandatory prepayments equal to proceeds arising from certain asset sales, casualty insurance, certain issuances of debt securities, and 75% of our annual consolidated excess cash flow (as defined). Prepayments are required annually (beginning in the first quarter of 2011) based upon the excess cash flow of the immediately preceding fiscal year.
Guarantees and Security. Each of our existing and subsequently acquired or organized domestic subsidiaries (the "U.S. Guarantors" and, together with the U.S. Borrowers, the "U.S. Obligors") guarantee all obligations under the U.S. Dollar Term Loan Facility. Each of our existing and subsequently acquired or organized domestic and foreign subsidiaries (the "European Guarantors" and, together with the European Borrowers, the "European Obligors"), to the extent that they may grant such upstream guarantees without breaching applicable financial assistance, corporate benefit or fiduciary duty rules or incurring adverse tax consequences, guarantee all obligations under the European Term Loan Facility. The U.S. Dollar Term Loan Facility is secured by a second priority security interest in the accounts receivable and inventory of the domestic subsidiaries of the U.S. Borrowers and a first priority security interest in substantially all other assets of the U.S. Obligors. The European Term Loan Facility is secured by a first priority security interest in all assets of the European Obligors.
Interest. Term Loans bear interest at the greater of 3.00% or a reserve adjusted Eurodollar rate, plus an applicable margin. The applicable margin for the Cash Pay Loan is 7.00%. The applicable margin for the PIK Loan is 11.00% unless we elect, at least ten days prior to the expiration of an interest contract period, to pay cash interest applicable to the contract period. In such event, the applicable margin is 9.00%. We may select interest contract periods of 30, 60, 90 or 180 days. Interest on the Cash Pay Loan and the Eurodollar component of the PIK Loan is payable on the last day of each calendar month within the interest contract period. Interest representing the applicable margin on the PIK Loan is payable at the earlier of the expiration of the interest contract period or within 90 days of the start of an interest contract period. Accrued interest attributable to the applicable
66
margin (PIK Interest) on the PIK Loan, if we do not elect to pay in cash, is capitalized at the earlier of the end of an interest contract period or 90 days. At December 25, 2009, PIK Interest of $2.1 million was recorded as a long-term liability based upon our ability and intent to capitalize such interest as part of the PIK Loan principal. The applicable interest rates for borrowings under the Cash Pay Loan and PIK Loan at December 25, 2009 were 10% and 14%, respectively. If by the third anniversary of the Restructuring (i.e., by June 29, 2012) we do not elect to begin making cash payments of interest on the PIK Loan, the applicable margins for the Cash Pay Loan and PIK Loan will increase to 9.0% and 13.0%, respectively.
Covenants. The First Lien Credit Agreement contains affirmative and negative covenants customary for this type of financing including, among others, financial covenants related to minimum interest coverage, minimum fixed charge coverage, maximum capital expenditures, maximum total leverage and minimum liquidity. We are required to maintain an interest coverage ratio (generally, the ratio of our Adjusted EBITDA to our interest expense less amortization of deferred financing fees and debt issuance costs and other fees) of 0.80x during the second quarter of 2010, 0.83x during the third quarter of 2010, and increasing in successive steps to 1.65x for the second quarter of 2013 through maturity. We are required to maintain a fixed charge coverage ratio (generally, the ratio of our Adjusted EBITDA less capital expenditures and taxes to our fixed charges) of 0.98x during the second quarter of 2010, 0.96x during the third quarter of 2010, and increasing in successive steps to 1.67x during the first quarter of 2012, and then decreasing in successive steps to 1.14x for the first quarter of March 2013 and 1.22x for the second quarter of 2013 through maturity. We are also required to maintain a leverage ratio (generally, our total debt to our Adjusted EBITDA) of 10.50x during the second quarter of 2010, 10.25x during the third quarter of 2010, and decreasing in successive steps to 5.25x for the second quarter of 2013 through maturity.
The First Lien Credit Agreement includes negative covenants that restrict our ability to, among other things, incur additional indebtedness, incur liens, guarantee obligations, pay dividends or make redemptions or make voluntary payments on subordinated debt, engage in mergers and make acquisitions, sell assets, enter into sale-leaseback transactions, and engage in certain types of transactions with affiliates. The First Lien Credit Agreement also contains cross default provisions with our ABL Facility. Failure to comply with covenants contained in our First Lien Credit Agreement in future periods, if not waived or amended, would result in an event of default. Under an event of default, the lender may declare all or any portion of the obligations immediately due and payable. Any default resulting in the acceleration of indebtedness or foreclosure on collateral would have a material adverse effect on us. As of April 2, 2010, we were in compliance with all of the covenants contained in the First Lien Credit Agreement.
Prior to the Restructuring, the First Lien Credit Agreement consisted of an $80.0 million senior secured revolving credit facility and $398.2 million of term loans comprised of the U.S. Dollar Term Loan Facility and the European Term Loan Facility. The U.S. Borrowers and the European Borrowers were the borrowers under the revolving credit facility. The revolving credit facility was eliminated in connection with the Restructuring.
Asset-Based Revolving Credit Facility
On the Restructuring date, we entered into a new $70.0 million asset-based revolving credit facility (the "ABL Facility"). Proceeds from the ABL Facility were used to pay certain fees incurred in connection with the Restructuring and may be used for working capital or other corporate purposes. Borrowings under the ABL Facility are secured by a first priority security interest in the accounts receivable and inventory of our domestic subsidiaries ($93.0 million as of December 25, 2009). We may elect either LIBOR or Base Rate revolving loans under the ABL Facility. For LIBOR Loans, borrowings bear interest at the greater of 2.50% or a LIBOR Index Rate plus an applicable margin of 3.50%. For Base Rate Loans, borrowings bear interest at the greater of 2.50%, the Federal Funds rate
67
plus 0.5%, or the lender's Prime Rate plus 2.0%, plus an applicable margin of 1.25%. The applicable margins for both Base Rate and LIBOR loans increase 0.5% and 1.0% in the event that availability under the ABL Facility falls below $25.0 million and $10.0 million, respectively. The ABL Facility requires us to pay commitment fees equal to 0.75% per annum on the average daily undrawn portion of the facility. Amounts under the ABL Facility may be borrowed, repaid and reborrowed until the loan termination date, subject to borrowing base limitations related to the amounts of eligible accounts receivable and inventory. At December 25, 2009, $47.5 million was available to be drawn on the ABL Facility. The ABL Facility contains affirmative and negative covenants customary for this type of financing and cross default provisions with the First Lien Credit Agreement. The ABL Facility terminates on June 29, 2012.
The Second Lien Credit Agreement
Prior to the Restructuring, the second lien credit agreement consisted of a $190.0 million term loan facility. Our subsidiaries Euramax International, Inc. and Euramax International Holdings B.V. were the borrowers under the term loan facility. Borrowings under the second lien term facility bore interest, at the borrower's option, at either a base rate plus an applicable margin of 6.00% to 7.75% per annum based on our leverage ratio, or a reserve adjusted Eurodollar rate plus an applicable margin of 7.00% to 8.75% per annum based on our leverage ratio. The second lien credit agreement was discharged in connection with the Restructuring.
Accounts Receivable Facility
Prior to the Restructuring, we were a party to a $60.0 million accounts receivable securitization facility. Under the accounts receivable facility, we sold substantially all of the trade receivables of certain of our U.S. subsidiaries to Euramax Receivables LLC, a wholly owned, special purpose subsidiary. Euramax Receivables LLC funded these purchases with borrowings under a loan agreement with a third party. Amounts outstanding under the loan agreement were collateralized by trade receivables purchased by Euramax Receivables LLC. Borrowings under the loan agreement bore interest at a LIBOR Index Rate plus an applicable margin of 1.50%. The accounts receivable facility required us to pay commitment fees equal to 0.25% per annum on the average daily undrawn portion of the facility. Euramax Receivables LLC is included in our consolidated financial statements. The accounts receivable facility was repaid in connection with the Restructuring.
Cash Flows
(in thousands)
|
Three months ended April 2, 2010 |
Three months ended March 27, 2009 |
Year ended December 25, 2009 |
Year ended December 26, 2008 |
Year ended December 28, 2007 |
|||||||||||
|---|---|---|---|---|---|---|---|---|---|---|---|---|---|---|---|---|
Net cash provided by (used in) operating activities |
$ | (28,717 | ) | $ | (403 | ) | $ | 59,482 | $ | (16,455 | ) | $ | 74,916 | |||
Net cash provided by (used in) investing activities |
664 | (1,006 | ) | (2,026 | ) | (6,784 | ) | (50,076 | ) | |||||||
Net cash provided by (used in) financing activities |
(2,191 | ) | (12,688 | ) | (35,929 | ) | 59,598 | (27,893 | ) | |||||||
Effect of exchange rate changes on cash |
(1,380 | ) | (1,839 | ) | (241 | ) | 4,027 | (5,100 | ) | |||||||
Net increase (decrease) in cash and cash equivalents |
$ | (31,624 | ) | $ | (15,936 | ) | $ | 21,286 | $ | 40,386 | $ | (8,153 | ) | |||
68
Three Months Ended April 2, 2010 Compared to the Three Months Ended March 27, 2009.
Operating Activities. Cash used in operating activities in the three months ended April 2, 2010 was $28.7 million. The primary use of cash during the three months ended April 2, 2010 was to fund increases in working capital consistent with the seasonality of our business. We did not experience this seasonal working capital increase in the first quarter of 2009 due to lower levels of sales activity resulting from economic difficulties in many of our markets. Cash used in operating activities was $0.4 million in the first quarter of 2009.
Investing Activities. Cash provided by investing activities in the three months ended April 2, 2010 was $0.7 million. Asset sales of $2.2 million were offset by capital expenditures of $1.5 million in the three months ended April 2, 2010.
Cash used in investing activities in the three months ended March 27, 2009 was $1.0 million and consisted primarily of capital expenditures.
Financing Activities. Cash used in financing activities during the three months ended April 2, 2010 was $2.2 million and consisted of a mandatory repayment of debt equal to asset sale proceeds.
Cash used in financing activities during the three months ended March 27, 2009 was $12.7 million and consisted of net repayments of amounts borrowed under our accounts receivable securitization facility.
Year Ended December 25, 2009 Compared to the Year Ended December 26, 2008 and the Year Ended December 28, 2007.
Operating Activities. Cash provided by operating activities in 2009 was $59.5 million, which included reductions in accounts receivable and inventory of $17.9 million and $45.1 million, respectively. The decline in accounts receivable was primarily related to lower sales volumes in 2009 compared to 2008. The decline in inventory was primarily due to initiatives we have undertaken to reduce our investment in inventory through the integration of sales, inventory and operational planning activities. These initiatives contributed to inventory reductions in both 2009 and 2008 of $45.1 million and $45.0 million, respectively.
Cash used in operating activities in 2008 was $16.5 million, which included a reduction in accounts payable of $62.5 million, partially offset by cash provided by reductions in inventory and accounts receivable. The reduction in accounts payable was primarily related to reductions in trade credit available to us from our suppliers resulting from our lower operating results and credit ratings.
Cash provided by operating activities in 2007 was $74.9 million. The positive cash flow from operating activities in 2007 was primarily driven by reductions in working capital together with cash provided by other operating activities.
Investing Activities. Cash used in investing activities in 2009 was $2.0 million. Capital expenditures of $4.4 million in 2009 were offset by $2.3 million of proceeds from the sale of assets.
Cash used in investing activities in 2008 was $6.8 million. Capital expenditures of $14.8 million in 2008 were offset by proceeds from the sale of assets of $8.0 million.
Cash used in investing activities in 2007 was $50.1 million. During 2007, cash used in investing activities mainly reflects the acquisitions of substantially all of the assets of Royal Apex Manufacturing Co. and certain assets of Owens Corning Fabwell, LLC in the aggregate amount of $30.0 million. In addition, capital expenditures of $21.3 million in 2007 were partially offset by $1.2 million of proceeds from the sale of assets.
69
Financing Activities. Cash used in financing activities during 2009 was $35.9 million. The use of cash in financing activities in 2009 mainly reflects the repayment of our accounts receivable securitization facility and debt issuance costs in connection with the restructuring of our first lien credit facility and with obtaining our ABL revolving credit facility.
Net cash provided by financing activities was $59.6 million in 2008. Cash provided by financing activities in 2008 primarily reflects borrowings under our first lien credit facility of $72.9 million.
Net cash used in financing activities during 2007 was $27.9 million. Cash used in financing activities in 2007 primarily reflects repayment of debt, offset by proceeds from equity contributions of $22.5 million.
Capital Expenditures
Our capital expenditures were $1.5 million and $1.0 million in the first quarters of 2010 and 2009, respectively. Our capital expenditures in 2009, 2008 and 2007 were $4.4 million, $14.8 million and $21.3 million, respectively. Capital expenditures related to the implementation of our new ERP system at our corporate offices and in our Non-Residential Building Products segment were $10.9 million, $9.3 million and $8.5 million in 2009, 2008 and 2007, respectively. In 2007, capital expenditures included $6.2 million to replace and upgrade components of our coil coating lines in The Netherlands. The balance of capital expenditures in each year, and in the first quarters of 2010 and 2009, relates primarily to purchases and upgrades of fabricating, transportation and material moving and handling equipment.
We anticipate that capital expenditures for the year ending December 31, 2010 will be approximately $14.0 million, an increase of $9.6 million in comparison to 2009. This increase results primarily from anticipated capital expenditures for 2010 related to implementation of our ERP system in our U.S. Residential Building Products segment and purchases of fabricating equipment. Maintenance capital expenditures are expected to be between $2.0 million and $5.0 million for the year ending December 31, 2010.
We have made and will continue to make capital expenditures to comply with environmental laws and regulations. We estimate that our environmental capital expenditures for the year ending December 30, 2010 will be approximately $0.2 million.
Working Capital Management
Working capital declined $4.7 million, or 2.9%, to $158.7 million as of April 2, 2010 from $163.4 million as of December 25, 2009. This decline in working capital is primarily attributable to a reduction in cash partially offset by seasonal increases in accounts receivable and inventory. We typically experience an increase in inventory and accounts receivable during our first quarter as many of our customers in our markets increase purchases in the spring.
Accounts receivable of $99.4 million as of April 2, 2010 increased $9.5 million from $89.9 million as of December 25, 2009. As of April 2, 2010, days sales outstanding in accounts receivable were 47.9 days, compared to 39.3 days as of December 25, 2009 and 57.3 days as of March 27, 2009.
Inventories of $93.8 million as of April 2, 2010 increased $14.6 million, from $79.2 million as of December 25, 2009. As of April 2, 2010, days sales in inventories were 47.6 days, compared to 40.6 days as of December 25, 2009 and 35.3 days as of March 27, 2009. Inventories increased as a result of seasonal increases in demand.
70
Capital and Commercial Commitments
In addition to long-term debt, we are required to make payments relating to various types of obligations. The following table summarizes our minimum payments as of December 25, 2009 relating to long-term debt, operating leases, unconditional purchase obligations and other specified capital and commercial commitments. This table does not include information on our recurring purchases of materials for use in production, as our raw materials purchase contracts do not require fixed or minimum quantities. This table also excludes payments relating to income tax due to the fact that, at this time, we cannot determine either the timing or the amounts of payments for all periods beyond 2009 for certain of these liabilities. Future events could cause actual payments to differ from these amounts. See "Cautionary Statement Regarding Forward-Looking Statements."
| |
Payments Due by Period | ||||||||||||||||
|---|---|---|---|---|---|---|---|---|---|---|---|---|---|---|---|---|---|
| |
Total | Less than 1 year |
1 – 3 years | 3 – 5 years | More than 5 years |
||||||||||||
| |
(in millions) |
||||||||||||||||
Contractual Obligations(1) |
|||||||||||||||||
Long-term debt(2) |
$ | 525 | $ | — | $ | 525 | $ | — | $ | — | |||||||
Interest on long-term debt(3) |
226 | 36 | 125 | 65 | — | ||||||||||||
Non-cancellable operating leases(4) |
29 | 11 | 13 | 4 | 1 | ||||||||||||
Unconditional purchase obligations |
35 | 35 | — | — | — | ||||||||||||
Total |
$ | 815 | $ | 82 | $ | 663 | $ | 69 | $ | 1 | |||||||
- (1)
- Income
tax liabilities, including accrued interest and penalties related to unrecognized tax benefits, totaling $16.8 million, are not included in
this table as the settlement period for our income tax liability cannot be determined.
- (2)
- Long-term
debt amortization is based on the contractual terms of our credit facilities and assumes no additional borrowings under our ABL Credit
Facility. We intend to prepay a portion of our long-term debt with the proceeds of this offering.
- (3)
- Interest
payments are based on interest rates in effect at December 25, 2009. We intend to prepay a portion of our long-term debt with
the proceeds of this offering.
- (4)
- We lease various facilities and equipment under non-cancelable operating leases for various periods.
In addition, we sponsor defined benefit pension plans for the benefit of certain of our employees located in the UK (the UK Plan) and the U.S. (the U.S. Plan). We curtailed the accrual of participant benefits under the UK Plan effective March 31, 2009. At December 25, 2009 the fair market value of the UK Plan assets was $25.6 million, or $21.3 million less than the projected benefit obligation of the UK Plan. In the first quarter of 2010, we froze future benefit accruals under our U.S. defined benefit pension plan. At December 25, 2009 the fair market value of the U.S. Plan assets was $5.4 million, or $3.0 million less than the projected benefit obligation of the U.S. Plan.
71
Credit Ratings
As of June 30, 2010, our current credit ratings, which are considered non-investment grade, were as follows:
| |
Moody's | Standard and Poor's |
||
|---|---|---|---|---|
Long-term debt(1) |
Caa1 | B- | ||
Outlook |
STABLE | STABLE |
- (1)
- Our long-term debt ratings presented have been assigned to Euramax International, Inc., our operating subsidiary and the borrower under our ABL Facility and First Lien Credit Agreement.
Our current credit ratings, as well as any adverse future actions taken by the rating agencies with respect to our debt ratings, could negatively impact our ability to finance our operations on satisfactory terms and could have the effect of increasing our financing costs. Our debt instruments do not contain provisions requiring acceleration of payment upon a debt rating downgrade. The rating agencies may, in the future, revise the ratings on our outstanding debt.
The above information regarding credit ratings and ratings outlook assigned to our indebtedness by Moody's and Standard & Poor's are opinions of our ability to meet our ongoing obligations. Credit ratings are not recommendations to buy, sell or hold securities and are subject to revision or withdrawal at any time by the assigning rating agency. Each agency's rating should be evaluated independently of any other agency's rating.
Off-Balance Sheet Arrangements
We do not have any off-balance sheet arrangements.
Seasonality; Inflation
Our sales are somewhat seasonal, with the second and third quarters typically accounting for our highest sale volumes. First and fourth quarter sale volumes are generally lower primarily due to reduced repair and remodel activity and reduced activity in the building and construction industry as a result of colder and more inclement weather in our geographic end markets, as well as customer plant shutdowns in the RV and automotive industries during holidays and model changeovers.
Our cost of goods sold is subject to inflationary pressures and price fluctuations of the raw materials we use, particularly the cost of aluminum and steel. In addition, we are party to certain leases that contain escalator clauses contingent on increases based on changes in the Consumer Price Index. In 2008, increased commodity cost pressures mainly related to aluminum and steel prices, which have been driven by global demand, increased the costs of certain products. Increases in petroleum, resin, metals, pulp and other raw material commodity driven costs also resulted in multiple product cost increases. We believe that our ability to increase selling prices in response to cost increases largely mitigated the effect of these cost increases on our overall results of operations. We believe that inflation and/or deflation had a minimal impact on our overall operations during the 2010 year-to-date period and in fiscal years 2009 and 2007.
Critical Accounting Policies
We prepare our consolidated financial statements in accordance with GAAP. In order to apply these principles, management must make judgments, assumptions and estimates based on the best available information at the time. Actual results may differ based on the accuracy of the information utilized and subsequent events. Our accounting policies are described in the notes to our audited
72
financial statements included elsewhere in this prospectus. Our critical accounting policies, which are described below, could materially affect the amounts recorded in our financial statements. Management believes that the following policies are critical because they involve significant judgment, assumptions and estimates.
Allowance for Doubtful Accounts, Inventory Realizability and Obsolescence and Warranty Reserves
We record trade accounts receivable at net realizable value. This value includes an allowance for doubtful accounts based on historical experience, current economic conditions and an evaluation of the relevant customer's credit worthiness. We charge off accounts receivable against the allowance for doubtful accounts when it is probable that the receivable will not be recovered.
Our inventories are stated at the lower of cost or market, with cost determined under the first-in, first-out (FIFO) method. Cost of manufactured inventory includes direct labor and manufacturing overhead. Market with respect to all inventories is replacement cost subject to a floor for an approximate normal profit margin on disposition.
We provide warranties on certain products. The warranty periods differ depending on the product, but generally range from one year to limited lifetime warranties. We provide accruals for warranties based on historical experience and expectations of future occurrences.
We make estimates and assumptions related to establishing reserves and allowances doubtful accounts for inventory obsolescence and warranty costs. Ranges of estimates are developed based upon historical experience, specifically identified conditions and management expectations for the future occurrence of certain events. In the event that actual results differ from these estimates or we adjust these estimates in future periods, adjustments to the amounts recorded could materially impact our financial position and results of operations. Historically, our experience has not been materially different than our estimates. There have been no significant changes in the assumptions used to develop our estimates in establishing reserves and allowances for doubtful accounts, inventory obsolescence and warranty costs from fiscal year 2007 to fiscal year 2009 and no significant changes are anticipated for fiscal year 2010.
Property, Plant, and Equipment
We record property, plant, and equipment at cost. Cost of property, plant, and equipment acquired in a business combination is recorded at fair value based on the age and current replacement cost for similar assets on the date of the acquisition. We generally expense repair and maintenance costs unless they extend the useful lives of assets. Depreciation of property, plant, and equipment is computed principally on the straight-line method over the estimated useful lives of the assets ranging from 3 to 37 years for equipment and from 17 to 25 years for buildings. Gains and losses related to the disposition of property, plant, and equipment are charged to other income or expense when incurred. Also, when events or changes in circumstances indicate that the carrying value of an asset may not be recoverable, management assesses whether there has been an impairment in the value of the asset by comparing the estimated undiscounted future cash flows expected to result from the use of the asset and its eventual disposition to the carrying amount of the asset. If the expected future cash flows are less than the carrying amount of the asset, an impairment loss is recognized based on the excess of the asset's carrying value over its fair value. Fair value is estimated based on discounted cash flows, independent appraisals or comparable market transactions.
Goodwill and Intangible Assets
Our goodwill represents the excess of the purchase price we pay in a business combination over the fair value of net tangible and identifiable intangible assets acquired. We have assigned goodwill to multiple reporting units at either the operating segment, or one level below, primarily based upon the
73
nature of discrete businesses comprising our operations. We test our goodwill for impairment annually on the last day of our fiscal year, or more frequently, if events or circumstances indicate the potential for impairment. In 2008, our testing indicated that the net carrying value of our reporting units exceeded their fair values. Accordingly, we proceeded to determine the implied fair value of goodwill for comparison to recorded amounts. We recorded an impairment charge of approximately $345.0 million in 2008. The implied fair value of goodwill was determined by estimating the fair value of the reporting units and allocating such value to the tangible and identifiable intangible assets of each reporting unit. Our fair value estimate was based upon estimates of the future cash flows of the reporting units and market valuations of comparable companies. Significant judgments were made in estimating the future cash flows of the reporting units and determining comparable companies upon which fair values of our reporting units were based. No goodwill impairment charges were recorded based upon impairment testing performed as of December 25, 2009.
We have recognized intangible assets, apart from goodwill, acquired in business combinations and resulting from certain shareholder transactions, at fair value on the date of the transactions. Indefinite lived intangible assets are not amortized, but are tested for impairment annually on the last day of our fiscal year, or more frequently if events or circumstances indicate the potential for impairment. We amortize our intangible assets with finite lives over their useful lives based upon the pattern in which the economic benefits of the intangible assets are recognized. If that pattern cannot be determined, a straight-line amortization method is used. Intangible assets with finite lives are tested for impairment when there are indications that the carrying amount of an intangible asset may not be recoverable. We utilize an income approach to estimate the fair value of our definite and indefinite lived intangible assets to test for impairment.
We record impairment charges on goodwill and intangible assets in goodwill and other impairments in the consolidated statement of operations. The 2008 impairments of goodwill, trade names and customer relationships resulted from broad declines in our estimate of cash flows to be derived from future sales. See Note 6 to our consolidated financial statements included elsewhere in this prospectus for further disclosures related to goodwill and other intangible assets.
Income Taxes
We account for income taxes using the asset and liability method of accounting. Under the asset and liability method, deferred income taxes are recognized for the tax consequences of "temporary differences" by applying enacted statutory tax rates applicable for future years to differences between financial statement and tax bases of existing assets and liabilities. We establish valuation allowances if we believe it is more likely than not that some or all of deferred tax assets will not be realized. We do not recognize a tax benefit unless we conclude that it is more likely than not that the benefit will be sustained on audit by the taxing authority based solely on the technical merits of the associated tax position. If the recognition threshold is met a tax benefit is recognized and measured as the largest amount of the tax benefit that in our judgment is greater than 50 percent likely to be realized. Interest and penalties related to unrecognized tax positions are recorded in provision (benefit) for income taxes in our consolidated financial statements. See Note 11 to our consolidated financial statements included elsewhere in this prospectus for further disclosures related to income taxes.
Revenue Recognition
We recognize revenue when persuasive evidence of an agreement exists, delivery has occurred, our price to the buyer is fixed and determinable and collectibility is reasonably assured. Delivery is not considered to have occurred until the customer takes title and assumes the risks and rewards of ownership.
74
Recently Issued Accounting Standards
See Note 2 to our consolidated financial statements included elsewhere in this prospectus.
Quantitative and Qualitative Disclosures About Market Risk
We are exposed to market risk from changes in currency exchange rates (primarily the Euro and British pound sterling), interest rates and commodity prices (primarily aluminum and steel).
Foreign Currency Exchange Risk
Approximately 27% of our net sales for the year ended December 25, 2009 originated in Europe. Although our sales outside the United States are subject to exchange rate fluctuations, we do not use derivatives to manage our foreign currency exchange risks resulting from foreign sales. Changes in foreign exchange rates affect interest expense recorded in relation to our foreign currency-denominated debt instruments. As of December 25, 2009, we estimate that a 10% hypothetical change in foreign exchange rates would impact our pre-tax earnings due to the effect of foreign currency translation on interest expense related to our debt instruments by $1.4 million.
Interest Rate Risk
We have market risk related to changing interest rates. Although we historically entered into interest rate agreements to reduce the impact of interest rate fluctuations on our interest expense, we terminated all of our outstanding interest rate swaps in connection with the Restructuring. We may enter into additional interest rate swaps in the future to manage our interest rate risk.
As of December 25, 2009, all of the $525.3 million of outstanding borrowings under our first lien credit facility was at floating rates and there were no amounts outstanding under our ABL Credit Facility. An increase of 1.0% in the LIBOR rate would not result in an increase or decrease in our interest expense under our ABL Credit Facility or under our first lien credit facility.
Commodity Price Risk
From time to time we enter into contracts for the purchase of aluminum and steel at market values in an attempt to assure a margin on specific customer orders. We may also choose to commit to purchase a specific quantity of aluminum over a specified time period at a fixed price, exposing us to the difference between the fixed price and the market price of aluminum during that time period. We do not use hedges to manage our long-term risks relating to market prices of steel and aluminum raw materials because we are generally able to pass on changes in market prices to customers.
75
We are a leading international producer of metal and vinyl products sold to the residential repair and remodel, non-residential construction and recreational vehicle (RV) markets primarily in North America and Europe. We are a leader in several niche product categories, including preformed roof-drainage products sold in the U.S., metal roofing and siding for wood frame construction in the U.S., and aluminum siding for towable RVs in the U.S. and Europe. Sales to the building products and RV markets accounted for approximately 77% and 14% of our 2009 sales, respectively.
Our customers are located predominantly throughout North America and Europe and include distributors, contractors and home improvement retailers, as well as RV, transportation and other original equipment manufacturers, or OEMs. We have extensive in-house manufacturing and distribution capabilities for our more than 10,000 unique products and operate through a network consisting of 44 facilities, including 36 in the U.S., two in Canada and six in Europe. We have over 50 years of experience manufacturing building products and RV exterior components, including our time as a division of our former parent, Alumax, a fully integrated aluminum producer acquired by Alcoa Inc. in 1998. We have operated as an independent company since 1996 when our division was acquired in a management-led buyout.
Our total net sales were $812.1 million for the year ended December 25, 2009. The following charts show our net sales by segment and geography during the year ended December 25, 2009:
| Net Sales by Segment | Net Sales by Geography | ||
|
|
|
Our Competitive Strengths
The following competitive strengths have contributed to our success and are critical to maintaining the market positions that we enjoy and are achieving our plans for future growth. We believe that the combination of these strengths is unique to us among our competitors in the markets we serve. They include:
Well positioned leader in rebounding end markets. We maintain leading market positions in a number of niche markets which we believe are likely to rebound following a severe cyclical downturn. These positions include:
- •
- #1 position in preformed residential gutters sold in the U.S.
- •
- #1 position in metal roofing and siding for wood frame construction in the Northeast U.S.
- •
- #1 position in aluminum siding for towable RV exteriors in the U.S.
- •
- #1 position in aluminum siding and roofing for towable RVs in Europe
- •
- #1 position in steel exterior panels for manufactured housing in the U.S.
- •
- #1 position in vinyl windows for the UK holiday home and home center markets
76
Our total net sales derived from these #1 positions were $295.6 million in 2009, or 36.4% of our total net sales. We believe our leading market positions have positioned us to grow sales and improve our profitability amid a period of anticipated recovery in the residential repair and remodel, non-residential construction and RV markets.
Unique fabrication capabilities specifically tailored for niche markets. Our unique manufacturing capabilities are critical to maintaining our strong position in several niche markets for our products. In the U.S., our integrated metal coil coating capabilities provide us with a competitive advantage in the home improvement retail and RV industries as an integrated low-cost supplier of metal products with the ability to meet the demanding delivery requirements of customers in these industries. We believe we are also the only supplier who can manufacture roof drainage components from each of the four most common gutter materials; aluminum, steel, copper and vinyl. In Europe, our 103" wide aluminum coating line in The Netherlands is one of only two such pre-painted metal roll coating lines in the world that coat metal in excess of 96" wide.
Strong, established customer relationships. We maintain long-standing relationships among our major customers across our end markets and are a critical supplier to many of our customers. Our top ten accounts have been customers of ours for more than 20 years on average, and include The Home Depot® and Lowe's, the two largest home improvement retailers in the U.S., each of whom have been our customer for over 25 years. In addition, since 2005, the year-over-year retention rate of our top 100 customers has average over 97%. The depth and longevity of our customer relationships provide a foundation for recurring revenues and an outlet for the introduction of new products.
More efficient, lower cost business. Since the third quarter of 2008 we have worked to operate a more efficient, lower cost business. Recent improvements reflect the results of our ongoing initiatives to centralize certain management controls, rationalize our operating structure and implement best practices to improve our manufacturing culture. Specific initiatives include:
- •
- Facility rationalization. Between January 2008 and
December 2009, we closed 26 facilities representing approximately 24% of our square footage devoted to U.S. manufacturing and distribution. These closures eliminated redundant and less profitable or
unprofitable facilities while reducing supervisory and administrative personnel. In closing these facilities, we endeavored to and believe we did retain a significant portion of the profitable
business previously served by these closed facilities. We believe we have enhanced the overall productivity potential of our facilities and will be able to support the peak volumes that existed prior
to these closures.
- •
- Centralized lean manufacturing deployment. Beginning in
June 2008, we centralized the implementation and execution of our lean manufacturing initiatives and related integrated sales and operational planning. As a result, we have achieved significant
reductions in inventory, improved our efficiency and strengthened customer service at many of our facilities. We expect to continue to benefit from greater efficiencies incrementally as we implement
these best practices across our global platform.
- •
- Information technology deployment. We have deployed a market leading enterprise resource planning, or ERP, system in our U.S. Non-Residential Building Products segment and expect to deploy this system in our other U.S. segments over the next several years. Compared to the legacy systems previously utilized, our new ERP system enables us to better support our manufacturing and selling processes by providing critical information related to product cost, supply chain status and customer profitability. In 2009, for instance, our ERP system allowed us to more easily identify and ultimately terminate over 750 customer relationships which represented insignificant revenue, while accounting for a disproportionate portion of our costs.
77
- •
- Improved freight and logistics productivity. We have
undertaken a significant number of initiatives to improve our freight and logistics productivity and reduce our shipping costs, including outsourcing routes, implementing load optimization software,
changing our driver compensation structure and adding on-board GPS systems to track productivity and manage mileage-based compensation within our captive shipping fleet.
- •
- Non-metal procurement cost management. Under our procurement cost reduction initiatives, in 2009 we reduced our non-metal procurement costs by more than $6 million.
As a result of these and other initiatives, we have a more favorable cost structure than we did prior to 2008. For example, we estimate that we increased our net sales per employee by 7.5% in the twelve months ended April 2, 2010 compared to the year ended December 28, 2007. We also estimate that we reduced our selling and general expenses (excluding depreciation) as a percentage of sales volume by 3.8% in the twelve months ended April 2, 2010 compared to the year ended December 28, 2007. These improvements were achieved despite a 22.6% reduction in net sales volume during the same period. We believe that these improvements have made us more competitive and have positioned us to improve our operating margins as our key end markets recover.
Significant diversification across products, materials, customers, end markets and geography. We produce and deliver over 10,000 unique products, utilizing aluminum, steel, copper, vinyl and fiberglass, through a multi-channel distribution network that serves customers across multiple end markets and geographies. Our customer base is highly diverse, with our top ten customers accounting for less than 31% and no single customer accounting for more than 12% of our total 2009 net sales. Further, our top ten customers include customers from each of our five segments. Our sales are also diversified geographically, with 69% of our 2009 net sales originating in the U.S. and Canada and the remainder originating in the UK, The Netherlands and France. This diversity has helped to offset the cyclicality that is experienced in some of the markets we serve, while allowing us to address profitable growth opportunities as they arise in different product lines, end markets and geographies.
Committed and experienced management team. We have an experienced management team led by our chief executive officer Mitchell B. Lewis and chief financial officer R. Scott Vansant. Messrs. Lewis and Vansant each have approximately 20 years of industry experience with us and our predecessor and have effectively led us through various industry cycles, economic conditions and capital and ownership structures.
Our Business Strategy
Our strategy is to leverage the strengths and experience that have provided us leading market positions to grow our business beyond our current product offerings and the customers and geographic markets we currently serve. In addition, we will endeavor to improve our capabilities and profitability through process improvement initiatives and further cost reductions.
Capture growth related to anticipated market recovery. As a leading manufacturer of exterior building products, we intend to capitalize on the anticipated recovery in the residential repair and remodel, non-residential construction and RV markets. We believe that our leading market positions, well-established customer relationships, broad product portfolio, national distribution capabilities and low cost manufacturing platform provide us with a competitive advantage over other suppliers.
Continue to focus on operational leverage. We believe that we have created significant operating leverage within our current manufacturing platform that will provide substantially greater earnings potential in a rising volume environment and position us for continued improvement in our profitability. We intend to continue to improve our cost structure through incremental lean manufacturing deployment, improved supply chain management, reduced freight and procurement costs, incremental facility rationalization, and implementation of best practices throughout our
78
organization. We also intend to continue to integrate new information technologies across our business, which we expect will further enhance our management capabilities, improve our data quality and enable further integration of our businesses. We have already shown significant improvement in operational leverage, but we believe there remain significant opportunities for further improvements in each of these categories.
Drive growth through business development initiatives. We have instituted a series of business development initiatives that we believe will position us to achieve profitable organic growth. As part of our planning process, we task each segment to broaden its geographic presence and product offering. Given our efficient and adaptable manufacturing and distribution platform, as well as our existing channel partners and industry relationships, we believe that we are particularly well positioned to develop and profitably commercialize new products as well as modify existing products to respond to new and expanding markets, particularly as our markets continue to recover from 2009 levels. As part of our efforts, we have instituted an incentive compensation structure that specifically rewards business development efforts among key managers.
- •
- Expand into new geographic markets. Given our efficient
and adaptable manufacturing and distribution platform as well as our established channel partners and industry relationships, we are well positioned to identify and selectively act on growth
opportunities in new geographic markets. The versatility of our product line allows us to modify already successful products for use in other geographic areas both in the U.S. and abroad. For example,
we plan to grow our sales of roof drainage products in Canada and our sales to the distributor channel outside the Northeastern U.S. Internationally, we have increased our sales effort and
representation in emerging markets where our manufacturing and distribution expertise can be leveraged profitably.
- •
- Increase sales to new customers. We plan to continue to
identify and develop new market opportunities for our products, such as sales to government entities (including the military) or through government contractors, and leverage our product portfolio to
increase penetration of our full product line across all building materials sales channels.
- •
- Develop innovative new products. We plan to continue to engage in research and development of new products and leverage our existing relationships to distribute these products, such as our recent successful introduction of a new solid gutter cover in the U.S. as well as a roll coated aluminum coil offering with unique sand-resistant properties specifically designed for applications in the Middle East.
Identify and integrate selected value-enhancing acquisitions. Our acquisition strategy is designed to complement our business development efforts. We intend to selectively pursue bolt-on acquisitions that enable us to broaden our product offering to existing customers or to accelerate our growth in new geographic areas.
Our Segments
We manage our business and serve our customers through five reportable segments differentiated by market, product type and geography. Our structure and business model trace their roots to our history as a downstream producer of aluminum products and have evolved in response to customer demand for products made from materials other than aluminum and in pursuit of growth opportunities in different end markets and geographies. Today we offer a full complement of products responsive to the demands of the markets we serve and produced from various materials, including aluminum, steel, copper, vinyl and fiberglass.
79
Our five reportable segments are described below:
U.S. Residential Building Products
Our U.S. Residential Building Products segment utilizes aluminum, steel, copper and vinyl to produce residential roof drainage products, including preformed gutters, downspouts, elbows, soffit, drip edge, fascia, flashing, snow guards and related accessories. These products are used primarily for the repair, replacement or enhancement of residential roof drainage systems. We sell these products to home improvement retailers, lumber yards, distributors and contractors from 10 manufacturing and distribution facilities located in North America.
This segment accounted for $232.1 million, or 28.6%, of our net sales in 2009. In 2009 we were the leading manufacturer of preformed metal gutters sold in North America. Further, we believe that we are the only North American supplier that produces preformed roof drainage systems from each of the four most common gutter materials aluminum, steel, copper and vinyl.
U.S. Non-Residential Building Products
Our U.S. Non-Residential Building Products segment utilizes light gauge steel and aluminum coil to produce exterior building components, including roofing and siding panels, ridge caps, flashing trim, soffit and other accessories. We sell these products to builders, contractors, lumber yards and home improvement retailers from 11 manufacturing and distribution facilities located in the U.S. These products are predominantly used in the construction of a wide variety of small scale non-residential, agricultural and industrial building types on either wood or metal frames.
This segment accounted for $211.9 million, or 26.1%, of our net sales in 2009. We believe that we are the second largest supplier of steel roofing and siding utilized for wood frame construction in the U.S. and believe that we have the largest market share of steel roofing and siding supplied to the Northeastern U.S. wood frame market.
U.S. RV and Specialty Building Products
Our U.S. RV and Specialty Building Products segment utilizes various materials including aluminum coil, steel coil and fiberglass to create exterior components for the towable RV, cargo and manufactured housing markets. These products include sidewall components, siding, doors and trim. We also produce specialty made-to-order vinyl replacement windows and aluminum patio and awning components sold primarily to home improvement contractors in the Western U.S. Our vinyl windows and patio and awning products are high-end replacement and remodel products that carry strong brand recognition in the regional markets where they are sold. This segment operates from 15 manufacturing and distribution facilities located in the U.S.
This segment accounted for $119.0 million, or 14.7%, of our net sales for 2009. We estimate that we sold at least 44% of the aluminum sidewalls and 32% of the doors used in the production of towable RVs in the United States in 2009. In addition, we believe that we are the only supplier of aluminum sidewalls in the U.S. with in-house coil coating capabilities.
European Roll Coated Aluminum
Our European Roll Coated Aluminum segment uses a roll coating process to apply paint to bare aluminum coil and, to a lesser extent, bare steel coil in order to produce specialty coated coil, which we also process into specialty coated sheets and panels. We sell these products to building panel manufacturers, contractors and UK "holiday home," RV and transportation OEMs that sell to customers throughout Europe and in parts of Asia. Our customers use our specialty coated metal products to manufacture, among other things, RV sidewalls, commercial roofing panels, interior ceiling
80
panels, and liner panels for shipping containers. We produce and distribute these roll coated products from one facility in The Netherlands and one facility in the UK.
This segment accounted for $180.3 million, or 22.2%, of our net sales in 2009. We estimate that we sold at least 85% of the aluminum sidewall material used in the production of RVs in Europe in 2009.
European Engineered Products
Our European Engineered Products segment utilizes aluminum and vinyl extrusions to produce residential windows, doors and shower enclosures. These products are sold to home improvement retailers, distributors and factory-built "holiday home" builders in the UK. We also produce windows used in the operator compartments of heavy equipment, components sold to suppliers to automotive OEMs in Western Europe and RV doors. We produce and distribute these engineered products from two facilities in France and two facilities in the UK and have developed extensive in-house manufacturing capabilities, including powder coating, glass cutting, anodizing and glass toughening.
This segment accounted for $68.8 million, or 8.4%, of our net sales in 2009. We believe that we are the largest supplier of residential vinyl windows to the UK home improvement and holiday home markets.
81
Our Products
Our products are sold to a diverse group of customers operating in a variety of industries. Our sales and marketing effort are organized on a decentralized basis to provide services to our broad customer base in multiple geographic areas. The table below lists our key products, materials used, customers, sales regions, segments and end markets:
Products
|
Primary Materials | Customers | Primary Sales Regions |
Segments | End Markets | |||||
|---|---|---|---|---|---|---|---|---|---|---|
| Roof Drainage Products (gutters, downspouts and accessories) | Aluminum, Steel, Vinyl, Copper | Home Improvement Retailers, Lumber Yards, Rural Contractors, Home Improvement Contractors, Distributors, Manufactured Housing Producers | U.S. | U.S. Residential Building Products and U.S. Non-Residential Building Products | Residential Building Products; Non-Residential Building Products | |||||
Soffits (roof overhangs), Fascia (trims), Flashing (roofing valley material) |
Aluminum, Steel, Copper |
Home Improvement Retailers, Lumber Yards, Rural Contractors, Industrial and Architectural Contractors, Home Improvement Contractors, Manufactured Housing Producers |
U.S. |
U.S. Residential Building Products and U.S. Non-Residential Building Products |
Residential Building Products; Non-Residential Building Products |
|||||
Roofing & Siding (including RV siding and building panels) |
Aluminum, Steel, Vinyl, Fiberglass |
OEMs, RV Manufacturers, Rural Contractors, Distributors, Lumber Yards, Industrial and Architectural Contractors, Home Improvement Contractors, Manufactured Housing Producers, Home Improvement Retailers |
U.S., Europe |
U.S. Non-Residential Building Products, U.S. RV and Specialty Building Products, European Roll Coated Aluminum and European Engineered Products |
Residential Building Products, RV Products, Non-Residential Building Products |
|||||
Doors |
Aluminum, Fiberglass |
RV Manufacturers, Distributors, Home Improvement Retailers, Home Improvement Contractors |
U.S., Europe |
U.S. Non-Residential Building Products, U.S. RV and Specialty Building Products and European Engineered Products |
RV Products, Residential Building Products |
|||||
Windows |
Aluminum, Vinyl |
OEMs, RV Manufacturers, Home Improvement Contractors, Holiday Home Manufacturers, Transportation Industry Manufacturers |
U.S., Europe |
U.S. Non-Residential Building Products, U.S. RV and Specialty Building Products and European Engineered Products |
RV Products, Residential Building Products, Other Products |
|||||
Specialty Coated Coils (painted aluminum and steel coils) |
Aluminum, Steel |
RV Manufacturers, Transportation Industry Manufacturers, Various Building Panel Manufacturers, OEMs |
Europe |
European Roll Coated Aluminum |
RV Products, Non-Residential Building Products, Other Products |
82
Our End Markets
Through our five segments we serve three primary end markets—Residential Building Products, Non-Residential Building Products and Recreational Vehicle Products. We believe our geographic network, broad product portfolio and customization capabilities allow us to effectively meet the diverse requirements of our customers within our end markets. The following table illustrates our net sales in 2009 by segment and end market:
| |
End Markets Served | |
|
||||||||||||||||
|---|---|---|---|---|---|---|---|---|---|---|---|---|---|---|---|---|---|---|---|
Segment
|
Residential Building Products |
Non- Residential Building Products |
Recreational Vehicle Products |
Other Products |
Net Sales | % of Net Sales |
|||||||||||||
U.S. Residential Building Products |
$ | 225.8 | $ | — | $ | — | $ | 6.3 | $ | 232.1 | 28.6 | % | |||||||
U.S. Non-Residential Building Products |
— | 211.9 | — | — | 211.9 | 26.1 | % | ||||||||||||
U.S. RV and Specialty Building Products |
46.0 | — | 48.2 | 24.8 | 119.0 | 14.7 | % | ||||||||||||
European Roll Coated Aluminum |
— | 97.3 | 59.0 | 24.0 | 180.3 | 22.2 | % | ||||||||||||
European Engineered Products |
36.8 | 3.1 | 6.1 | 22.8 | 68.8 | 8.4 | % | ||||||||||||
Net Sales |
$ | 308.6 | $ | 312.3 | $ | 113.3 | $ | 77.9 | $ | 812.1 | 100.0 | % | |||||||
% of Net Sales |
38.0 | % | 38.5 | % | 13.9 | % | 9.6 | % | 100 | % | |||||||||
Principal Products |
Gutters, downspouts, gutter guards, soffits, patio doors, windows, etc. | Metal roofing, siding panels, drip caps, coated metal coil. | RV exterior components and doors | Glove boxes, sunroofs, bus windows. | |||||||||||||||
Customer Type |
Home improvement contractors, home improvement retailers, distributors and manufacturing housing producers |
Rural, industrial and architectural contractors, distributors and builders |
RV OEMs |
Transportation OEMs |
|||||||||||||||
Residential Building Products
We are a leading supplier of metal and vinyl gutters and related components to U.S. home improvement retailers. Our other residential building products include patio doors, windows and bath and shower products primarily used in the home improvement market. We continue to grow our sales into the residential building products end market through an emphasis on growing our sales of patio doors, vinyl windows and lattice systems.
Roof Drainage Products
We produce and distribute virtually every component of roof drainage systems and offer a complete product line, including aluminum, steel, copper and vinyl products.
83
Home Improvement Retailers. We sell to all major home improvement retailers, which represent the largest customer group for our roof drainage sales. Our success in this market can be attributed to the following factors:
- •
- Distribution: We maintain a national manufacturing and distribution network to home improvement retailers in the roof
drainage sector. We have a national distribution network which is able to satisfy short lead times (usually two days) mandated by home improvement retailers.
- •
- One-stop Shopping: We offer home improvement retailers a full spectrum of roof drainage products and
accessories. Further, we offer new and innovative products, including patented products. For example, we introduced the patented Flex-A-SpoutTM which diverts
water around trees, shrubs and decks with a corrugated design that easily bends and holds its shape, even when buried.
- •
- Cost: Our size and ability to internally paint metal provides a distinct cost advantage compared to most of our
competitors. Our purchasing power also affords us a raw materials cost advantage.
- •
- Customer Relationships: We have developed long-term relationships with home improvement retailers, having served that market for over 30 years.
Distributors. Roof drainage products sold into the distributor market are generally characterized by heavier gauges and different component parts. Orders from distributors are typically larger in size than those from either the home improvement retailer or contractor market, which allows us to service this market with fewer locations. Products bought by distributors are typically resold to individual contractors.
Other Residential Building Products
We produce and distribute a wide range of other residential building products including awning systems, vinyl windows, aluminum shower enclosures, patio doors and manufactured housing siding. These products are typically sold to holiday home and manufactured housing OEMs, home improvement contractors and distributors.
Replacement Vinyl Windows
We manufacture and sell vinyl windows for the residential replacement markets in the U.S. and UK Vinyl windows require low maintenance and generally are more resistant to temperature than wood and aluminum. In the U.S., we sell primarily to the high-end residential contractor market from manufacturing facilities in Sacramento, California and Loveland, Colorado. Over recent years, vinyl window sales have eroded business from wood and aluminum. We also manufacture vinyl windows in the UK that we sell to the UK holiday home market.
Lattice and Awning System Products
Lattice and awning systems are patio covers and shade structures that enhance outdoor living space. Each component is manufactured from structural aluminum alloys and finished with a high performance coating offered in a variety of colors. This gives the products the appearance of wood with long-term durability. Our lattice and awning systems are sold to contractors and distributors and sales tend to be driven by general remodeling activity. These systems are manufactured in Romoland, California and distributed through two locations in California and Arizona. We believe that the versatility of this product line will provide us a growth opportunity by allowing us to modify these already successful products for use in other geographic locations.
84
Aluminum Bath and Shower Enclosures
We manufacture and sell aluminum bath and shower enclosures. These products are manufactured in one location in the United Kingdom and are sold to the UK distributor and holiday home markets. These products have benefited from overall market growth as consumers begin to switch to more modern baths and showers.
Patio and French Doors
We manufacture and sell vinyl patio and French doors for the UK home center market. By applying our expertise from our U.S. vinyl operation to support our initiative in the United Kingdom, we have grown sales significantly since initiating this program in 2003.
Non-Residential Building Products
We supply metal roofing, siding and accessories for a wide variety of non-residential construction applications, including agricultural, industrial and architectural uses. The core products we sell to this end market include metal roofing and siding, along with numerous accessories such as ridge caps, ridge vents and corners used in non-residential construction. In addition, we manufacture and sell specialty coated aluminum and steel products that are further fabricated by our non-residential customers. We serve a variety of customers through a number of distribution channels including contractors, distributors and lumber yards.
Demand in the agricultural/rural market is driven by non-residential construction trends in rural areas. In addition to increased volumes from overall market growth, we plan to grow our share in regions of North America where we have low penetration. We have not historically had a major presence in the industrial and architectural market, and management believes there is potential for increasing our market share by leveraging our product and manufacturing capabilities and our cost advantage.
Metal Roofing, Siding and Accessories ("MRS")
This end market's core products include fabricated metal roofing and siding panels, along with numerous accessories such as drip caps, ridge vents and corners. These products are used primarily for exterior walls and roofs. We also sell metal roofing panels directly to contractors for use in smaller non-residential construction (e.g., schools and office buildings). In addition, we supply home improvement retailers with standard metal panels which are then sold to customers or contractors in the "Do-It-Yourself", or DIY, market.
MRS serves a highly fragmented market divided into two distinct market customer groups: the wood frame market and the industrial/architectural market. Both markets are regional and characterized by high shipping costs and short lead times. Sales to the wood frame group are made primarily through builders, distributors and contractors, and are driven by rural construction trends. Sales to the industrial/architectural customer group tend to be more customized with product characteristics often specified by architects. We serve this customer group through Fabral, Inc., a well recognized brand name in the industry.
Demand is largely driven by consumer confidence, interest rates, consumer disposable income, the strength of agricultural markets, consumer access to affordable financing and commercial construction trends. The agricultural market is highly fragmented and we compete against a number of smaller, mostly private companies.
85
Specialty Coated Metals
We manufacture and sell specialty coated aluminum and steel that is further fabricated by our non-residential customers. We purchase coil from primary metal producers, which is then coated through a roll-coating painting process before being sold for further fabrication by customers. We primarily focus on niche products that have difficult technical and quality requirements such as rolled aluminum unique colors and patterns, advanced finishes and higher-end panels. The market for specialty painted coils is fragmented and diverse with demand driven primarily by non-residential construction trends.
Recreational Vehicle Products
We manufacture and sell components for use in the production of RV exteriors to all major RV OEMs. These products include painted aluminum coils, roll formed aluminum panels, doors and exterior wall panels (typically a fiberglass reinforced panel). Aluminum panels sold to our customers are initially painted at one of our coil coating lines, and are then either delivered directly to customers or further fabricated.
There are two distinct segments in the RV market: products for (i) motorhomes and (ii) towable RVs. Motorhomes are motorized RVs, whereas towable RVs are towed by automobiles and light trucks. In these markets, we believe we are the number one supplier of RV aluminum siding for towable RVs in the combined U.S. and European markets. Geographically, approximately 57% of 2009 overall RV net sales were in Europe with the balance in the United States.
Demand for our RV products is driven by trends in disposable income, interest rates and general economic conditions, as well as demographic trends relating to consumers in the 55 through 74 year old age group, who constitute a significant source of demand for RV products. We primarily supply the lower price point aluminum towable RV market in the United States, which has historically been more stable relative to motorhomes. In Europe, we focus on both towables and motorhomes. Our decorative coating capabilities in the United States and in Europe provide a distinct technological and competitive advantage over other suppliers. These capabilities enable us to paint a stripe or other decorative pattern directly onto the aluminum sheet according to customer specifications. The alternative to a painted stripe is decorative tape, which cannot be applied with the tight tolerances achieved by our painting process and risks de-lamination over time.
Aluminum Siding and Roofing
Europe
In Europe, we serve substantially all major RV OEMs with aluminum exteriors. We serve our customers from one location in Corby, United Kingdom, and one location in Roermond, The Netherlands. Overall, the European RV market is more regionally focused than the U.S. market and country preferences have a significant impact on RV purchases. As a result of gasoline prices and aesthetic preferences, fiberglass, which as applied on a recreational vehicle is heavier than aluminum, has not gained significant market share over aluminum in Europe.
United States
We believe we are the only national RV supplier of exterior aluminum siding with multiple locations across the United States. We also paint our coils internally, providing us with a significant cost advantage.
Over the last 15 years, fiberglass has gained significant share as compared to aluminum in the production of RVs in the U.S. market due to its resistance to denting and scratching. This has occurred even though fiberglass is more costly and requires the use of a luaun substrate similar to plywood,
86
which adds significant weight to the vehicle. In recent years, aluminum's share of the towable RV market has stabilized.
We also serve the U.S. RV exterior market, including all four major, multi-location North American OEMs through six fabrication facilities. Our three Indiana facilities are strategically located to service the market as approximately 80% of all North American RVs are produced within 30 miles of Elkhart, Indiana. However, we are the only supplier with a network of locations producing aluminum siding outside of Elkhart, providing us with a significant competitive advantage in servicing our customers on a national basis.
RV Doors
We sell entry, portable office and access doors for the RV, utility trailer and mobile modular industries. RV doors are produced in three locations: Indiana, United States, Pudsey, United Kingdom and Andrezieux-Boutheon, France. RV doors are typically aluminum framed and the exterior is painted and manufactured to perfectly match the side panel of the RV.
Other Products
In addition to serving our three principal end markets, we have taken advantage of available manufacturing capacity and leveraged our expertise to develop and sell new products into other markets. We develop and manufacture various metal-based products, including windows sold to bus manufacturers, specialty coated metals for the appliance and transportation markets, and engineered transportation components sold to transportation suppliers. Our auto component products include seat rails made of extruded aluminum, aluminum extruded frames, and custom made sunroofs. The majority of our Other Products end market sales are in France.
Because of its weight advantages, aluminum is displacing steel in automobile manufacturing. As that trend continues, we expect to capitalize on our aluminum fabrication and extrusion capabilities by increasing sales to Tier I suppliers of aluminum components. We have also emphasized sales of painted aluminum coil into specialty applications. For example, we sell wide painted aluminum into the container market, which improves aesthetics and enables customers to reduce application costs by avoiding seams on their interior panels.
Customer Groups
Within our three principal end markets, we sell our products to a diverse array of customer groups operating in different industries. The following chart illustrates the distribution of actual net sales among different customer groups.
| |
Year Ended | |||||||||
|---|---|---|---|---|---|---|---|---|---|---|
| |
December 25, 2009 | December 26, 2008 | December 28, 2007 | |||||||
Home Improvement Retailers |
23.8 | % | 18.2 | % | 16.6 | % | ||||
OEMs |
21.8 | % | 27.0 | % | 28.1 | % | ||||
Industrial and Architectural Contractors |
18.7 | % | 18.0 | % | 16.1 | % | ||||
Rural Contractors |
17.2 | % | 19.2 | % | 19.5 | % | ||||
Distributors |
10.1 | % | 9.3 | % | 9.2 | % | ||||
Home Improvement Contractors |
4.5 | % | 4.0 | % | 5.2 | % | ||||
Manufactured Housing Producers |
3.9 | % | 4.3 | % | 5.3 | % | ||||
|
100.0 | % | 100.0 | % | 100.0 | % | ||||
We believe that our focus on customer service and product innovation has helped us to establish and maintain long-standing relationships across various customer groups. Our top ten
87
customers in 2009 have purchased our products for more than 20 years on average. For example, we have maintained long-standing relationships with the two largest leading home improvement retailers in the United States, having done business with each of them for over 25 years.
We work to foster and build on these relationships by offering our customers a national distribution network with what we believe to be among the best lead times in the industry; developing new products; strengthening the customer/supplier relationship through joint information technology system development and linkage; and building and maintaining personal relationships at multiple levels of our customers' organizations. We believe we have a diverse customer base, and our top ten customers, on a combined basis, represented approximately 31% of our 2009 net sales. In fiscal year 2009, The Home Depot®, our largest customer, accounted for approximately 11% of our net sales.
Original Equipment Manufacturers
We supply OEMs, such as RV, holiday home, manufactured housing and transportation industry manufacturers. Our principal OEM customers are described below:
Recreational Vehicle Manufacturers: We supply various aluminum products to RV manufacturers in the United States and Europe including aluminum siding, roofing, doors and accessories. In addition, we supply laminated aluminum and fiberglass panels to RV manufacturers.
Commercial Panel Manufacturers: We sell painted aluminum coil to customers who produce commercial building panels. These panels become part of a total package of commercial building wall panels and facades.
Transportation Industry Manufacturers: In addition to supplying RV manufacturers and commercial panel manufacturers, we also supply manufacturers in the transportation industry in Europe with windows, sunroofs, frames and various other components fabricated from aluminum extrusions.
Other Manufacturers: We also use our decorative and coil coating capabilities for products supplied to producers of transport containers.
Home Improvement Retailers
Our home improvement retail customers supply the well-established DIY market in the United States, Canada and the United Kingdom. In the United States, we sell building and construction products. In the United Kingdom, we sell patio doors, vinyl windows and residential entry doors. Home improvement retailers include small hardware stores, large cooperative buying groups, lumberyards and major home improvement retailers.
Rural Contractors
We supply aluminum and steel roofing and siding products to rural contractors for use in agricultural and rural buildings such as sheds and animal confinement buildings. We sell our products to traditional rural contractors, including building supply dealers, building and agricultural cooperatives, and animal confinement integrators. Building suppliers and agricultural cooperatives typically purchase smaller quantities of product at multiple locations whereas contractors and integrators generally purchase large volumes for delivery to one site.
Home Improvement Contractors
We sell a variety of products to home improvement contractors, the most significant of which are raincarrying systems and vinyl replacement windows. Other products sold to home improvement contractors include awnings, lattice systems, metal roofing, shower doors and patio and entrance doors. In the United States, we offer a full complement of vinyl replacement windows.
88
Distributors
We sell to distributors who distribute to smaller contractors and act as service centers for the next tier of customers in both the United States and Europe. Residential building products sold through distributors include a wide range of shower enclosures, metal roof flashing materials, painted aluminum trim coil, raincarrying systems, fascia/soffit systems and drip edges.
Industrial and Architectural Contractors
We sell various products to the architectural and industrial contractor markets including standing seam panels, siding, painted coil, soffit and fascia. These products are primarily produced from galvanized steel or aluminum.
Manufactured Home Producers
We sell fabricated steel siding and accessory parts to producers of manufactured housing in the United States. These products are used for exterior walls and roofs. In addition to steel siding, we also fabricate and supply a variety of steel and aluminum accessory components for manufactured home exteriors.
Sales and Marketing
Our products and services are sold primarily by our sales personnel and outside sales representatives located throughout the United States and Europe. We have organized sales teams to focus on specific customers and national accounts to allow us to provide enhanced supply solutions, and enhance our ability to increase the number of products that we provide to those customers and accounts.
Seasonality
Our sales are somewhat seasonal, with the second and third quarters typically accounting for the highest sale volumes. First and fourth quarter sale volumes are generally lower primarily due to reduced activity in the building and construction industry as a result of colder and more inclement weather in our geographic end markets, as well as customer plant shutdowns in the RV and automotive industries during holidays and model changeovers.
Manufacturing Processes
Our manufacturing processes employ a variety of equipment and several types of facilities. We believe that our deployment of equipment enables us to manufacture standard and custom products efficiently and economically. We have the equipment necessary for processing substantially all of our products in-house, which minimizes reliance on third party processors. This provides certain cost benefits while enabling us to add new products on a timely basis. These capabilities provide marketing and pricing advantages, including the ability to better control delivery time and to develop new and customer-specific products in an expeditious manner.
Our manufacturing process generally begins with painting aluminum or steel coil through a process known as roll-coating. Once coated, the aluminum or steel is further fabricated through selected processes which include tension leveling, embossing, slitting, rollforming, brake pressing, notching and bending. These processes complete the appropriate steps to fabricate a finished product. Our coating and fabrication capabilities are described in more detail as follows:
Coating (painting and anodizing). Roll-coating is the process of applying a variety of liquid coatings (primarily paint) to bare aluminum or steel coil, providing a baked-on finish that is both protective and decorative. We have three coating lines in the United States and four in Europe. Two of
89
the coating lines in the United States are primarily utilized for internal processing, while one coating line in the United States and the four coating lines in Europe, located within two facilities, are utilized to supply roll-coated products to both internal and external customers.
Anodizing is an electrochemical process that alters an aluminum surface through a controlled and accelerated oxidation process, which, if desired, may also color the material. Anodizing provides a high quality architectural finish to aluminum extrusions, which is demanded by certain customers. Anodizing is a key manufacturing process we offer in certain European facilities included in the European Engineered Products segment, which fabricate bath and shower enclosures, automotive parts and extrusions used in the transportation industry.
Fabrication. After coating, the slit or uncut coil in our U.S. Residential Building Products U.S. Non-Residential Building Products, and U.S. RV and Specialty Building Products segments may then undergo a variety of downstream production processes which further fabricate the aluminum and steel sheet to form the desired product. Fabrication equipment includes rollformers, punch and brake presses, embossers and expanding machinery for a variety of applications. Production machinery also includes equipment to bend, notch and cut aluminum and vinyl extrusions required, together with glass, for the assembly of windows and doors.
Raw Materials
Our main raw material purchases consist primarily of aluminum and steel, and, to a lesser extent, paint, glass, copper and vinyl. We purchased $ million of raw materials in 2009 comprised primarily of aluminum and steel. Aluminum and steel account for approximately 78% of our raw material costs. By value, we sold $ million of aluminum and $ million of steel. In addition, we sold $ million of products from materials other than aluminum and steel. All of our raw materials are sourced from external suppliers who are located primarily in the United States and Europe. As one of the largest aluminum coil purchasers in the building products sector, we have enjoyed significant purchasing power which we believe has historically allowed for favorable pricing terms compared to our smaller competitors.
All of our raw material inputs are sourced from external suppliers. We purchase our steel and aluminum sheet requirements from several foreign and domestic aluminum and steel mills. We believe there is sufficient supply in the market place to competitively source all of our requirements without reliance on any particular supplier. To assure continuity of supply, we negotiate contracts for minimum annual purchases of aluminum from several suppliers. Commitments for minimum annual purchases are typically at a market price. At December 25, 2009, we did not have any such minimum purchase commitments outstanding. In addition, to ensure a margin on specific customer orders, we may commit to purchase aluminum ingot or coil at a fixed market price for future delivery. At December 25, 2009, such fixed price purchase commitments were approximately $34.9 million.
Approximately 47% and 28% of our net sales in 2009 derived from sales of aluminum and steel products, respectively. Both of these raw materials are subject to a high degree of volatility caused by, among other items, the relationship of world supply to world demand, the relationship of the U.S. dollar to other currencies, and the imposition of import and export tariffs. Historically, prices at which we sell aluminum and steel products tend to fluctuate with corresponding changes in the prices paid to suppliers for these raw materials. Supplier price increases and decreases are typically, but not always, due to competition and the market for alternative products, passed on to customers. Accordingly, our net sales and margins attributable to aluminum and steel products may fluctuate, with little or no change in the volume of shipments. See "Risk Factors—Risks Relating to Our Business—Our financial performance is affected by the prices of our key raw materials, particularly aluminum and steel. Price fluctuations relating to aluminum and steel could have a material adverse effect on our business, financial condition, results of operations, prospects and cash flows and limit our operating flexibility."
90
Intellectual Property
We rely on a combination of patents, trademarks, trade secrets, other intellectual property rights, and other protective measures to protect our proprietary rights, such as our patented Flex-A-SpoutTM product. We do not believe that any individual item of our intellectual property portfolio is material to our current business. We have licensed, and may license in the future, certain intellectual property and technology from third parties. See "Risk Factors—Risks Relating to Our Business—We may be unable to protect our intellectual property rights, and we may be subject to intellectual property litigation and infringement claims by third parties."
Competition
We believe the principal competitive factors affecting our business are market diversity, customer diversity, geographic diversity and product and material diversity. We believe that we are well positioned to compete with regard to each of these factors in each of the core markets in which we operate.
We have leading market positions in many of our core product markets. We have historically utilized our strong market positions and operating platforms to grow our business through both organic initiatives and acquisitions, and to improve our profitability. In certain fragmented markets, we are a national supplier to a broad customer base. We have focused on both introducing new products to our existing customer base and selling existing products into new markets and regions.
In the residential end market, which includes roof drainage products, our competitors in all three selling channels (home improvement retailers, distributors and contractors) are fragmented and only have regional distribution capabilities. Selected competitors include Gibraltar Industries, Spectra and Royal-Apex Manufacturing Company, Inc. The U.S. RV OEM end market is a small, concentrated industry with a handful of large-scale competitors including Foremost and Drew Industries. In Europe, the market is similarly concentrated with primary competitors being Holzhauer and Eltherington Group Ltd., to which we supply certain products. The non-residential end-market includes the agricultural and industrial sectors. The agricultural market is extremely fragmented in the U.S. Our primary competitors are Metal Sales Manufacturing Corp., McElroy, Wheeling-Pittsburgh Steel Corporation and Vicwest. In the architectural market, which is also highly fragmented, CENTRIA Architectural Systems, Metal Sales Manufacturing Corp., NCI and Peterson Aluminum Corporation are our principal competitors. In the industrial market, particularly in Europe, we occasionally compete with vertically integrated aluminum mills such as Novelis Inc., Hydro Aluminum, Alcoa and Hulett.
Environmental, Health and Safety Matters
Our manufacturing operations are subject to a range of federal, state, local and foreign environmental and occupational health and safety laws and regulations, including those relating to air emissions, wastewater discharges, the handling and disposal of solid and hazardous waste and substances, and the remediation of contamination associated with the current and past use of hazardous substances or materials. We may not be, at all times, in compliance with all such requirements. Many of our operations require environmental permits and controls pursuant to these laws and regulations to prevent and limit pollution. These permits contain terms and conditions that impose limitations on our manufacturing activities, production levels and associated activities and periodically may be subject to modification, renewal and revocation by issuing authorities. Historically, the costs of achieving and maintaining compliance with environmental and health and safety requirements have not been material costs. However, the operation of manufacturing plants entails risks in these areas, and a failure by us to comply with applicable environmental, health and safety laws, regulations, or permits required for our operations could result in civil or criminal fines, penalties, enforcement actions, third party claims for property damage and personal injury, requirements to clean up property or to pay for the costs of
91
cleanup, or regulatory or judicial orders enjoining or curtailing operations or requiring corrective measures, including the installation of pollution control equipment or remedial actions. While the amount of such liability could be material, we conduct our current operations in a manner intended to reduce the risks of such liability.
Under certain of these laws and regulations, such as the federal Comprehensive Environmental Response, Compensation, and Liability Act (CERCLA), known as the Superfund law, and its state law analogs, we may be held liable for releases of hazardous substances on or from our properties or any offsite disposal location to which we may have sent waste or if contamination from prior activities is discovered at any of our current or former properties. Such liability may include cleanup costs, natural resource damages and associated transaction costs. Liability under these laws can be joint and several, and can be imposed without regard to fault or the lawfulness of the actions that led to the release at the time they occurred.
Pursuant to these laws, we have been named as a potentially responsible party in state and federal administrative and judicial proceedings seeking contribution for costs associated with the investigation, analysis, correction and remediation of environmental conditions at eleven hazardous waste disposal sites. We continue to monitor these actions and proceedings and to vigorously defend them. Our ultimate liability in connection with present and future environmental claims will depend on many factors, including our volumetric share of the waste at a given site, the remedial action required, the total cost of remediation, and the financial viability and participation of the other entities that also sent waste to the site. Once it becomes probable that we will incur costs in connection with remediation of a site and such costs can be reasonably estimated, we establish or adjust our reserve for our projected share of these costs. Pursuant to the terms of the Alumax acquisition agreement, subject to certain terms and limitations, Alumax (and its successors) have agreed to indemnify us for all of the costs associated with each of these sites as well as for all of the costs associated with nine additional sites to which we may have sent waste for disposal but for which we have not received any notice of potential responsibility. We also establish reserves for investigation or remediation required from time to time at our own facilities, which represents our best estimate of probable liabilities with respect to environmental matters. As of April 2, 2010, we had no reserves recorded for environmental clean-up. However, the estimation of environmental liabilities is subject to uncertainties, including the scope and nature of contamination conditions, the success of remediation technologies being employed, new or changes to environmental laws, regulations or policies, future findings of investigation or remediation actions, alteration to expected remediation plans, Alumax's willingness or ability to honor its indemnification obligations or the number, financial condition and cooperation of other potentially responsible parties. In the event that we are responsible for the costs of environmental cleanup, any actual liabilities that exceed our reserves may have a material and adverse effect on our financial condition and, in particular, our earnings. In addition, we may incur significant liabilities under cleanup laws and regulations in connection with environmental conditions currently unknown to us relating to our existing, prior, or future sites or operations or those of predecessor companies whose liabilities we may have assumed or acquired.
The facility that Berger Bros Company ("Berger"), a subsidiary of Berger Holdings Ltd., leases in Ivyland, Pennsylvania has contaminated groundwater as a result of the migration from an adjacent property which was formerly the Naval Air Warfare Center, currently an NPL site under CERCLA. The area designated as an NPL site includes our leased property. The United States Navy is conducting a clean-up of the Naval Air Warfare Center NPL site under the Environmental Protection Agency's supervision. The owner/landlord of the Berger property obtained liability protection under Pennsylvania's Brownfield Law by demonstrating to the Commonwealth of Pennsylvania that the contamination is from an off-site source, and, under Pennsylvania law, such liability protection benefits tenants as well. Moreover, under Berger's lease, the landlord retained any liability for this contamination. Accordingly, although the facility leased by Berger is located on an NPL site, the effects
92
of this contamination would not reasonably be expected to have a material adverse effect on our consolidated financial position, results of operations or cash flows.
Compliance with environmental laws and regulations can be costly, and we have incurred and will continue to incur costs, including capital expenditures, to comply with these requirements. We estimate that our environmental capital expenditures will be approximately $0.2 million in 2010. In addition, these laws and regulations and their interpretation or enforcement are constantly evolving and have tended to become more stringent over time, and the impact of these changes on our business, financial condition, results of operations or cash flows are impossible to predict. In particular, legislation and regulations limiting emissions of greenhouse gases, including carbon dioxide associated with the burning of fossil fuels, are at various stages of consideration and implementation, and if fully implemented, could significantly affect the price of the raw materials for our products. If our compliance costs increase and are passed through to our customers, our products may become less competitive than other materials, which could reduce our sales. Our costs of compliance with current and future environmental requirements could materially and adversely affect our business, financial condition and results of operations, prospects and cash flows.
Employees
As of April 30, 2010 we had approximately 2,246 employees, of which approximately 745 (33%) are employed in Europe and approximately 1,501 (67%) in the United States and Canada. Of these employees, approximately 32% are salaried and 68% are hourly employees.
As of April 30, 2010, approximately 11% of the Company's labor force is represented by collective bargaining agreements.
We are not a party to any material pending labor proceedings and believe that our relationship with employees is good.
Facilities and Properties
Our principal executive office and headquarters is located in Norcross, Georgia. Our principal facilities are listed below by end market:
| |
End Market | |
|
||||||||||||
|---|---|---|---|---|---|---|---|---|---|---|---|---|---|---|---|
Facility
|
Residential Building Products |
Non- Residential Building Products |
Recreational Vehicle Products |
Other Products |
Owned/ Leased |
Square footage |
|||||||||
North America |
|||||||||||||||
Norcross, GA—Corporate HQ |
L | 14,153 | |||||||||||||
Anaheim, CA |
ü | ü | L | 19,546 | |||||||||||
Barrie, Ontario |
ü | O | 78,656 | ||||||||||||
Barrie, Ontario |
ü | L | 27,000 | ||||||||||||
Bloomsburg, PA |
ü | L | 90,478 | ||||||||||||
Bristol, IN |
ü | O | 110,000 | ||||||||||||
Buena Park, CA |
ü | L | 31,900 | ||||||||||||
Cedar City, UT |
ü | L | 43,400 | ||||||||||||
Denver, CO |
ü | L | 7,270 | ||||||||||||
Duluth, GA |
ü | L | 230,000 | ||||||||||||
Elkhart, IN |
ü | L | 68,000 | ||||||||||||
Feasterville, PA |
ü | O | 110,475 | ||||||||||||
Grand Prairie, TX |
ü | L | 134,859 | ||||||||||||
Grapevine, TX |
ü | L | 90,014 | ||||||||||||
93
| |
End Market | |
|
||||||||||||
|---|---|---|---|---|---|---|---|---|---|---|---|---|---|---|---|
Facility
|
Residential Building Products |
Non- Residential Building Products |
Recreational Vehicle Products |
Other Products |
Owned/ Leased |
Square footage |
|||||||||
Gridley, IL |
ü | O | 99,700 | ||||||||||||
Idabel, OK |
ü | O | 45,540 | ||||||||||||
Ivyland, PA |
ü | L | 105,431 | ||||||||||||
Jackson, GA |
ü | O | 70,000 | ||||||||||||
Lancaster, PA |
ü | O | 220,726 | ||||||||||||
Lancaster, PA |
ü | O | 134,830 | ||||||||||||
Loveland, CO |
ü | L | 51,362 | ||||||||||||
Mansfield, TX |
O | 55,280 | |||||||||||||
Marshfield, WI |
ü | O | 29,000 | ||||||||||||
Nappanee, IN |
ü | O | 200,000 | ||||||||||||
Plano, TX—ABP HQ |
L | 12,400 | |||||||||||||
Phoenix, AZ |
ü | L | 34,565 | ||||||||||||
Romeoville, IL |
ü | L | 108,643 | ||||||||||||
Romoland, CA |
ü | ü | O | 75,000 | |||||||||||
Sacramento, CA |
ü | L | 40,000 | ||||||||||||
Sacramento, CA |
ü | L | 31,240 | ||||||||||||
Salem, OR |
ü | L | 116,800 | ||||||||||||
Spokane, WA |
ü | O | 32,400 | ||||||||||||
Stayton, OR |
ü | L | 35,000 | ||||||||||||
St. Joseph, MN |
ü | L | 67,000 | ||||||||||||
Tifton, GA |
ü | L | 55,000 | ||||||||||||
Tifton, GA |
ü | L | 53,744 | ||||||||||||
West Helena, AR |
ü | ü | O | 226,850 | |||||||||||
Woodland, CA |
ü | L | 91,445 | ||||||||||||
Europe |
|||||||||||||||
Andrezieux-Boutheon, France |
ü | O | 73,628 | ||||||||||||
Corby, England |
ü | ü | ü | O | 167,917 | ||||||||||
Leeds, England |
ü | L | 56,941 | ||||||||||||
Montreuil-Bellay, France |
ü | O | 216,355 | ||||||||||||
Pudsey, England |
ü | ü | L | 183,169 | |||||||||||
Roermond, The Netherlands |
ü | ü | ü | O | 245,789 | ||||||||||
Total Leased(26) |
1,799,360 | ||||||||||||||
Total Owned(18) |
2,192,146 | ||||||||||||||
We believe that our facilities, taken as a whole, have adequate productive capacity and sufficient manufacturing equipment to conduct business at levels meeting current demand. Our broad U.S. and Western European network is well maintained and our sites are located to optimize customer service, market requirements, distribution capability and freight costs. We do not expect significant increases in the number of site locations, except for the contractor roof drainage customer group which we estimate will add approximately three to four sites per year.
Legal Proceedings
We are currently party to legal proceedings that have arisen in the ordinary course of business. We believe that the ultimate outcome of these matters would not, individually or in the aggregate, reasonably be expected to have a material adverse effect on our consolidated financial position, results of operations or cash flows.
94
Executive Officers and Directors
The following sets forth certain information with respect to our board of directors and executive officers of our company.
Name
|
Age | Title | |||
|---|---|---|---|---|---|
Mitchell B. Lewis |
48 | Chief Executive Officer, President and Director | |||
R. Scott Vansant |
48 | Vice President, Secretary and Chief Financial Officer | |||
Scott R. Anderson |
48 | Vice President, U.S. Residential Building Products | |||
Jeffrey C. Hummel |
46 | Vice President, Human Resources | |||
Michael D. Lundin |
50 | Chairman and Director | |||
James G. Bradley |
65 | Director | |||
Marjorie L. Bowen |
45 | Director | |||
Jeffrey A. Brodsky |
51 | Director | |||
G. Fulton Collins |
43 | Director | |||
Alvo M. Oddis |
54 | Director | |||
Mitchell B. Lewis has been a director since February 2008 and became the chief executive officer of Euramax in February 2008, chief operating officer of Euramax in 2005, executive vice president of Euramax in 2002, and group vice president in 1997. Prior to being appointed group vice president, Mr. Lewis served as president of Amerimax Building Products, Inc. from 1993 to 1997, and assistant general manager of Amerimax Building Products, Inc. from 1992 to 1993. Prior to 1992, Mr. Lewis served as corporate counsel with Alumax, and, prior to joining Alumax, he practiced law with Alston & Bird LLP, specializing in mergers and acquisitions. Mr. Lewis received a B.A. in Economics from Emory University in 1984 and a J.D. from the University of Michigan in 1987. Mr. Lewis is uniquely qualified to serve as one of our directors due to his extensive leadership experience in our industry and deep knowledge of our operations.
R. Scott Vansant became the Chief Financial Officer of Euramax in July 1998 and vice president and secretary of Euramax in September 1996. He joined Alumax in 1991. From 1995 to 1996, Mr. Vansant served as director of internal audit for Alumax. Mr. Vansant also served in various operational positions with Alumax Building Products, Inc., including serving as controller from 1993 to 1995 and branch manager from 1992 to 1993. Prior to 1991, Mr. Vansant worked as a certified public accountant for Ernst & Young LLP. Mr. Vansant received a BBA in Accounting from Mercer University in 1984.
Scott R. Anderson became vice president responsible for our U.S. Residential Building Products segment in September 2006. Previously, Mr. Anderson served as president of our subsidiary Amerimax Building Products, Inc. beginning in October 1998. Mr. Anderson has served in various financial and operational roles since joining our company in 1987, including operations manager of Amerimax Building Products, Inc. from 1997 to 1998 and controller of Amerimax Building Products, Inc. from 1995 to 1997. Mr. Anderson received a B.S. in Finance from the University of Utah in 1987 and an M.B.A. from New York University in 1995. He is a certified public accountant.
Jeffrey C. Hummel became vice president of human resources in April 2008. From 2001 to 2008, Mr. Hummel was the vice president of human resources in the Barnes Distribution division of Barnes Group Inc. Mr. Hummel served as corporate counsel for Barnes Group Inc. from 1998 to 2001. From 1993 to 1998, Mr. Hummel practiced law as an associate with Skoler, Abbott & Presser, P.C. Prior to 1993, Mr. Hummel was an associate with Muller, Mintz from 1991 to 1993 and with Bingham, Dana & Gould from 1989 to 1991. Mr. Hummel received a B.S., summa cum laude, in Journalism from Boston University in 1985 and a J.D. from Emory University School of Law in 1989.
95
Michael D. Lundin has been a director since July 2009, and became chairman at that time. Mr. Lundin is currently a partner in Resilience Capital Partners, a private equity firm focused on investments in companies in special situations. Previously, Mr. Lundin was president and chief executive officer of the Oglebay Norton Company, a miner, processor, transporter and marketer of industrial minerals and aggregates from December 2002 until February 2008, and was employed by Oglebay Norton since 2000. Oglebay Norton filed a voluntary petition for relief under Chapter 11 of the U.S. Bankruptcy Code on February 23, 2004. Prior to joining Oglebay Norton, Mr. Lundin served as vice president and then president/partner of Michigan Limestone Operations, LP. Mr. Lundin earned a B.S. in Manufacturing Engineering and Product Development from the University of Wisconsin and an M.B.A. from Loyola Marymount University. Mr. Lundin is currently a director of Rand Logistics, Inc., Broder Bros., Co. and Avtron, Inc. and, until 2008, was a director of Oglebay Norton Company. Mr. Lundin brings to our board extensive corporate oversight and financial management expertise as well as strategic and financial transactional experience.
James G. Bradley has been a director since April 2010. Mr. Bradley retired in 2006 as chairman and chief executive officer of Wheeling-Pittsburgh Steel, a producer of steel sheet products such as hot rolled, cold rolled, hot dipped galvanized, electro-galvanized, black plate and electrolytic tinplate. Mr. Bradley became chief executive officer of Wheeling-Pittsburgh in 1998, prior to which he was vice president of operations. Mr. Bradley retired from Wheeling-Pittsburg Steel in 2006. Wheeling-Pittsburgh Steel filed a voluntary petition for relief under Chapter 11 of the U.S. Bankruptcy Code in 2000 and emerged from bankruptcy in 2003. Mr. Bradley received a B.S. in civil engineering from Carnegie Institute of Technology in 1967. Mr. Bradley provides our board with significant executive experience in the steel manufacturing industry.
Marjorie L. Bowen has been a director since July 2009. From May 1989 to January 2008 Ms. Bowen was with Houlihan Lokey Howard & Zukin, Inc., an international advisory-focused investment banking firm. While at Houlihan Lokey, Ms. Bowen served as a Managing Director, where she advised an extensive number of public company boards of directors. Ms. Bowen was also a member of the firm's Management Committee for Financial Advisory Services. Ms. Bowen currently serves on the board of directors and the audit and governance committees of The Talbots, Inc. and on the board of directors and the audit and compensation committees of Global Aviation Holdings, Inc. From October 2009 to July 2010, Ms. Bowen served on the board of directors and the compensation and governance committees of Texas Industries, Inc. Ms. Bowen provides our board with a strong mix of skills and experience in areas including financial review and analysis, strategic planning, transaction experience, professional services and corporate governance.
Jeffrey A. Brodsky has been a director since July 2009. Mr. Brodsky is currently leading Quest Turnaround Advisors, L.L.C. ("Quest") in its role as Plan Administrator of Adelphia Communications Corporation and is also chairman, president and chief executive officer of PTV, Inc. Mr. Brodsky co-founded Quest, a financial advisory and restructuring firm in Purchase, NY in 2000 and has been a managing director there since that time. Prior to founding Quest, Mr. Brodsky held various senior management roles with Integrated Resources, Inc., a diversified financial services firm. He is a certified public accountant. Mr. Brodsky is currently a director of AboveNet, Inc. Mr. Brodsky's significant experience in the areas of accounting and finance and general business matters are important to the board's ability to review our financial statements, assess potential financings and strategies and otherwise supervise and evaluate our business decisions.
G. Fulton Collins has been a director since September 2009. Mr. Collins has been the president of Modeci Inc., a specialty mobile technology business, since June 2006, and is also the president of Collins Capital and Consulting, a small growth private equity and consulting firm, a position he has held since August 2000. Previously, Mr. Collins was president of Windsor Equity Group from November 2004 to February 2007. Mr. Collins brings to our board significant experience in operational oversight and logistics, and extensive financial planning experience.
96
Alvo M. Oddis has been a director since July 2009. Since September 2004, Mr. Oddis has been president of Oddis Consulting, LLC. From 2002 to 2007, Mr. Oddis was president and chief executive officer of Vitality Foodservice, Inc., a provider of dispensed beverages to the food services industry. From 1990 to 2002, Mr. Oddis was president and chief executive officer of Clayton Group Inc., a waterworks distributor. From 1987 to 1990, Mr. Oddis was a partner in Transfirst Financial Corporation, specializing in mergers and acquisitions of wholesale distribution and manufacturing companies. Mr. Oddis brings many years of operational and distribution leadership experience to our board.
Board of Directors
Our board of directors consists of seven members. The current directors are included above.
Each of the directors was elected to the board of directors in accordance with the shareholders' agreement between the company and its shareholders. Following the consummation of this offering, the shareholders agreement will terminate in accordance with its terms. Our directors will be elected annually to serve until the next annual meeting of stockholders or until their successors are duly elected and qualified. Upon completion of this offering, we anticipate that a majority of our board of directors will be independent under the rules.
Our board of directors has established an audit committee and a compensation committee. Prior to the completion of this offering, our board of directors plans to establish a nominating and corporate governance committee.
Audit Committee. Our audit committee is currently comprised of Messrs. Bowen, Brodsky and Lundin. Mr. Brodsky is the chairman of the audit committee. Our board of directors has determined that each of the members of the committee is "financially literate" and that Mr. Brodsky qualifies as an "audit committee financial expert" within the meaning of the regulations adopted by the SEC. Our board of directors has affirmatively determined that all of the directors on the committee are independent under the rules of the and the SEC's rules. The audit committee has direct responsibility for the appointment, evaluation, retention, compensation and oversight of the work of our independent registered public accounting firm; to review the accounting principles of our company; to coordinate the board's oversight of our internal control over financial reporting; to review policies governing related party transactions and approve related party transactions; and to review risk management policies and other compliance matters.
Our board of directors has adopted a written charter for the audit committee which will be available on our website at www.euramax.com. Our website and the information contained therein or connected thereto is not incorporated into this prospectus or the registration statement of which this prospectus forms a part, and you should not rely on any such information in making your decision whether to purchase our securities.
Compensation Committee. Our compensation committee is currently comprised of Messrs. G. Fulton Collins, James G. Bradley and Alvo M. Oddis. Mr. Collins is the chairman of the compensation committee. Our board of directors has affirmatively determined that all of the directors on the committee are independent under the rules of and meet the definition of "outside director" for purposes of Section 162(m) of the Internal Revenue Code of 1986, as amended (the "Code"), and the definition of "non-employee director" for purposes of Section 16 of the Securities Exchange Act of 1934, as amended (the "Exchange Act"). The principal responsibilities of the compensation committee are to establish policies and periodically determine matters involving executive compensation, review policies relating to the compensation and benefits of our employees, recommend changes in employee benefit programs and to administer equity-based incentive or compensation plans. See "Executive Compensation—Compensation Discussion and Analysis."
97
Our board of directors has adopted a written charter for the compensation committee which will be available on our website identified above.
Nominating and Corporate Governance Committee. Our nominating and corporate governance committee will be comprised of Messrs. , and . Mr. will be the chairman of the nominating and corporate governance committee. Our board of directors has affirmatively determined that all of the directors on the committee are independent under the rules of the . The principal duties of the nominating and corporate governance committee will be to recommend to the board of directors proposed nominees for election to the board of directors by the stockholders at annual meetings and to develop and make recommendations to the board of directors regarding corporate governance matters and practices.
Our board of directors will adopt a written charter for the nominating and corporate governance committee which will be available on our website identified above.
Compensation Committee Interlocks and Insider Participation
No member of the compensation committee is an officer or employee of the company. None of our executive officers serves, or has served during the past fiscal year, as a member of the board of directors or compensation committee of any other company that has one or more executive officers serving as a member of our board of directors.
98
Compensation Discussion and Analysis
Introduction
This section discusses the material elements of compensation for the executive officers who served as principal executive officer (our Chief Executive Officer), principal financial officer (our Chief Financial Officer), and the three most highly compensated executive officers during 2009, our last completed fiscal year. These named executive officers are referred to in this Compensation Discussion and Analysis as our "NEOs." This compensation discussion focuses on the policies and decisions and the most important factors relevant to an analysis of these policies and decisions. It provides qualitative information regarding the manner and context in which compensation is awarded to and earned by our NEOs and it is intended to place in perspective the data presented in the tables and narrative that follow.
Our NEOs are:
Name
|
Title | |
|---|---|---|
| Mitchell B. Lewis | Chief Executive Officer and President | |
| R. Scott Vansant | Vice President, Secretary and Chief Financial Officer | |
| Scott R. Anderson | Vice President—U.S. Residential Building Products | |
| Jeffrey C. Hummel | Vice President, Human Resources | |
| Ronald Slahetka | Vice President, Operations |
Overview
The following is a discussion and analysis of compensation arrangements of our NEOs for fiscal year 2009 and fiscal year 2010 to date. The discussion contains forward-looking statements that are based on current plans, considerations, expectations, and determinations regarding future compensation programs. The actual amount and form of compensation and the compensation programs that we ultimately adopt may differ materially from currently planned programs summarized in this discussion.
Our compensation strategy focuses on providing a total rewards package that not only attracts and retains high caliber executive officers and employees, but is utilized as a tool to communicate and align employee contributions with our corporate objectives and stockholders interests. The key elements of our executive compensation program are discussed in more detail below. The same types of compensation and benefits provided for our NEOs are provided for our other executive officers and senior managers. We have not adopted any formal or informal policies or guidelines for allocating compensation between long-term and short-term compensation, between cash and non-cash compensation or among different forms of cash and non-cash compensation. We intend to continue our existing practices of providing a competitive total compensation package and will share our success with our NEOs, as well as our other employees, when stated objectives are met.
The compensation committee of our board of directors is responsible for establishing, implementing and monitoring adherence with our compensation philosophy. We expect that our compensation committee will undertake a substantial review of our existing compensation programs, objectives and philosophy and determine whether such programs, objectives, and philosophy are appropriate given that we have become a public company. In addition, after we become a public company, we expect that the specific direction, emphasis and components of our executive compensation program will continue to evolve.
In connection with becoming a public company, we intend to develop and implement a new long-term incentive plan to retain effectively officers, senior executives and other employees, whose
99
skills, performance and loyalty to our objectives and interests are critical to our success. We anticipate that the new long-term incentive plan our board intends to adopt will include long-term cash incentive awards, as well as equity and equity-based incentive awards. See "—Equity and Cash Incentives—Euramax Holdings, Inc. 2010 Equity Incentive Plan" below.
Executive Compensation Objectives and Philosophy
The key objectives of our executive compensation programs are (1) to attract, motivate, reward and retain superior executive officers with the skills necessary to successfully lead and manage our business, (2) to achieve accountability for performance by linking annual cash incentive compensation to the achievement of measurable performance objectives, and (3) to align the interests of the executive officers and our stockholders through short-term and long-term incentive compensation programs. For our NEOs, these short- and long-term incentives are designed to accomplish these objectives by providing a significant financial correlation between the Company's financial results and their total compensation.
A significant portion of the compensation of the NEOs has historically consisted of equity compensation as well as cash incentive compensation contingent upon the achievement of financial performance metrics. We expect to continue to provide our NEOs with a majority of their compensation in this form. These two elements of executive compensation are aligned with the interests of our stockholders because the amount of compensation ultimately received by the NEOs will vary with our company's financial performance. Equity compensation derives its value from our equity value, which is likely to fluctuate based on our financial performance. Payment of cash incentives is dependent on our achievement of pre-determined financial objectives.
We seek to apply a consistent compensation philosophy for all executive officers. Our compensation philosophy is based on the following core principles:
- •
- Total compensation should be related to company performance
We believe that a significant portion of our executive officers' total compensation should be linked to achieving specified financial and business objectives that will create stockholder value and provide incentives to our officers to work as a team. Individuals in senior leadership roles are compensated based on a combination of total company performance and an assessment of individual performance. Total company performance is evaluated primarily based on the degree to which financial objectives are met. Individual performance is evaluated based upon several individualized leadership factors, including:
- •
- attaining specific financial objectives;
- •
- building and developing individual skills and a strong leadership team; and
- •
- developing an effective infrastructure to support business growth and profitability.
A significant portion of total compensation is delivered in the form of equity-based award opportunities to directly link compensation with stockholder value.
- •
- Total compensation should be competitive
We believe that our total compensation programs should be competitive so that we can attract, retain, and motivate talented executive officers who will help us outperform our competitors.
- •
- Executive compensation should be equitable
We believe that it is important to apply generally consistent guidelines for all executive officer compensation programs. We also believe that executive officers' total compensation should reward individual skills and performance achievements and encourage individual contributions to achieve
100
exceptional performance. In order to continue delivering equitable pay levels, we expect that the compensation committee will consider depth and scope of accountability, complexity of responsibility, qualifications and executive performance, both individually and collectively as a team.
In addition to short-term and long-term compensation, we have found it important to provide our CEO and CFO with post-employment compensation. Post-employment compensation consists of two main types—qualified and nonqualified defined contribution retirement plan benefits and termination benefits. We believe that retirement plan benefits and termination benefits are important components in a well-structured executive officer compensation package, and have sought to ensure that the combined package is competitive at the time the package is negotiated with the executive officer.
Based on these philosophies, we seek to reward our executive officers when we achieve financial and business goals and objectives and to generate stockholder returns by providing a significant portion of executive compensation in the form of performance-based compensation. By placing a significant portion of executive officers' total compensation at risk, we believe their interests are more closely aligned with the interests of the stockholders.
Role of Compensation Committee and Executive Officers in Compensation Decisions
Our compensation committee oversees our executive compensation program. In this role, our compensation committee reviews all compensation decisions relating to the NEOs and to all of our senior executive officers, and makes recommendations regarding compensation packages to our board of directors. The compensation committee has the authority to engage the services of outside consultants as its independent compensation consultant. In determining each executive officer's compensation, our compensation committee reviews competitive market information, corporate financial performance and financial conditions and assesses the performance of the individual executive officer, based largely on information provided by the CEO for all of the NEOs, excluding himself. Our CEO provides recommendations to our compensation committee and our board of directors with respect to salary adjustments, annual cash incentive bonus targets and awards, and equity incentive awards for the NEOs, excluding himself, and the other executive officers who report to him. Our compensation committee meets with our CEO at least annually to discuss and review his recommendations.
The compensation committee consists of three members of the board of directors, Messrs. Collins, Oddis and Bradley. Our board of directors has determined that each member of our compensation committee was and remains an outside director for purposes of Section 162(m) of the Code, a nonemployee director for purposes of Rule 16b-3 under the Exchange Act and an independent director as that term is defined under the rules of the Financial Industry Regulatory Authority.
Consistent with our past practice, we expect that following this offering, the compensation committee will review compensation elements and amounts for the NEOs on an annual basis, at the time of a promotion or other change in level of responsibilities, as well as when competitive circumstances or business needs may require. We may, but do not currently, use a third party consultant on a regular basis to assist us with determining compensation levels. We expect that each year our head of human resources will compile a report of benchmark data for executive positions of similar companies, including summaries of base salary, annual cash incentive plan opportunities and awards and long-term incentive award values. We retained Pearl Meyer and Associates, an independent executive compensation consulting firm, on a limited project basis, to provide benchmarking data to assist us in structuring and determining executive compensation for the 2010 merit review cycle. We expect that the compensation committee will determine a list of companies that we will benchmark our compensation packages against shortly after consummation of this offering and will compare our pay practices and overall pay levels with other leading building products and metals manufacturing
101
organizations, and, where appropriate, with non-building materials and non-metals manufacturing organizations, when establishing our pay guidelines.
We expect that the CEO will provide compensation recommendations to the compensation committee for executives other than himself based on this data and the other considerations mentioned in this Compensation Discussion and Analysis. We expect that the compensation committee will recommend a compensation package that is consistent with our compensation philosophy, strategically positioned above the median of the peer group and competitive with other leading building materials and metals manufacturing organizations. The compensation committee will then discuss these recommendations with the CEO and the head of human resources and will make a recommendation to the board, which the board will consider and approve, if appropriate.
We expect that the compensation committee will consider input from our CEO and CFO when setting financial objectives for our incentive plans. We also expect that the compensation committee in determining compensation will consider input from our CEO, with the assistance of our head of human resources (for officers other than for themselves), regarding benchmarking and recommendations for base salary, annual incentive targets and other compensation awards. The compensation committee will likely give significant weight to our CEO's judgment when assessing each of the other officer's performance and determining appropriate compensation levels and incentive awards. The compensation committee may modify individual compensation components for executives other than the CEO after reviewing the CEO's recommendations and there are no limits on the amounts of such modification. The members of the board of directors or the compensation committee, (in each case, other than the CEO), meeting in executive session, will determine the compensation of the CEO, including his annual incentive targets. The compensation committee makes all final compensation decisions for the NEOs and all executive officers and approves any equity incentive awards for all of executive officers.
Although we make many compensation decisions in the first quarter of the calendar year, the compensation evaluation process is ongoing throughout the year. Compensation discussions and decisions are designed to promote our fundamental business objectives and strategy. Evaluation of management performance and awards are performed annually or more often, as needed.
Components of Executive Compensation
As discussed throughout this Compensation Discussion and Analysis, the compensation policies applicable to our NEOs are reflective of our pay-for-performance philosophy, whereby a significant portion of both cash and equity compensation is contingent upon achievement of measurable financial objectives and enhanced equity value, as opposed to current cash compensation and perquisites, which are not directly linked to objective financial performance of the Company. This compensation mix is consistent with our performance-based philosophy that the role of executive officers is to enhance equity holder value over the long term.
The primary elements of our executive compensation program are (1) base salary; (2) performance-based cash incentives; (3) equity incentives; (4) termination; severance and change in control benefits; (5) retirement benefits; (6) health and welfare benefits; and (7) certain additional executive perquisites. Base salary, performance-based cash incentives and long-term equity-based
102
incentives are the most significant elements of our executive compensation program and, on an aggregate basis, they are intended to substantially satisfy our program's overall objectives as follows:
Compensation Element
|
Primary Objective | |
|---|---|---|
| Base Salary | To recognize ongoing performance of job responsibilities and as a necessary tool in attracting and retaining employees. | |
Performance-based cash compensation (bonuses) |
To re-emphasize corporate and individual objectives and provide additional reward opportunities for our NEOs (and senior managers) when key business and individual objectives are met. |
|
Equity incentive compensation |
To incent and reward increases in stockholder value and to emphasize and reinforce our focus on team success and to assist with the attraction and retention of key employees. |
|
Termination, severance and change in control benefits |
To provide protection in the event of involuntary loss of employment and to focus the CEO and CFO on stockholder interests when considering strategic alternatives. |
|
Retirement benefits |
To provide retirement savings and income in a tax efficient manner. |
|
Health and welfare benefits |
To provide a basic level of protection from health, dental, life and disability risks. |
Our board of directors and compensation committee work to ensure that total executive compensation is fair, reasonable and competitive. Typically, the compensation committee has sought to set each of these elements of compensation at the same time to enable the compensation committee to simultaneously consider all of the significant elements and their impact on total executive compensation and also to consider the allocation of compensation among certain of these elements and total compensation.
Weighting of Compensation Components
We strive to achieve an appropriate mix between the various elements of our compensation program to meet our compensation objectives and philosophy. However, we do not apply any rigid formulas in setting our executive compensation, and we may make adjustments to this approach for various positions after giving due consideration to prevailing circumstances. We do not use predefined ratios in determining the allocation of compensation among base salary, bonus and equity components. Rather, we determine the mix of each executive's total compensation based on market conditions, geographic considerations, competitive market data and other factors.
- •
- Base Salary
We provide a base salary to our executive officers to compensate them for their services during the year and to provide them with a stable source of income. Our NEOs', and all employees' base salaries, depend on their qualifications, their position within the company, the scope of their job responsibilities, the period during which they have been performing those responsibilities, their individual performance and the results achieved, unique skill sets or knowledge which would impact our ability to replace the individual and pay mix (base salary, annual cash incentives, equity incentives, perquisites and other executive benefits) and compensation practices in our markets.
103
The base salaries for our NEOs, other than the CEO, were established by our compensation committee, based in large part on the recommendations of the CEO. In setting base salaries, the CEO and our compensation committee considered the factors described above. However, in view of the uncertain direction of the economy in late 2008 and early 2009, our CEO, NEOs, compensation committee and board of directors jointly determined that there should be no increases in base salaries due to global economic conditions and their effect on our company and our markets. Consequently, none of the NEOs received an increase in base salary in 2009. The 2009 base salaries of our NEOs remained unchanged and identical to their 2008 annual base salaries, except for the CEO who voluntarily imposed a fifty percent reduction in his base salary.
The annual base salaries in effect for each of our NEOs as of December 31, 2009 were as follows:
Name
|
Annual Salary | |||
|---|---|---|---|---|
Mitchell B. Lewis |
$ | (1 | ) | |
R. Scott Vansant |
$ | |||
Scott R. Anderson |
$ | |||
Jeffrey C. Hummel |
$ | |||
Ron Slahetka |
$ | |||
- (1)
- In light of economic and market conditions and the company's performance, Mr. Lewis, upon his own recommendation and the board of directors' agreement, voluntarily reduced his annual base salary by 50% from $ to $ for a six month period that began November 1, 2008.
In the future, we expect that salaries for executive officers will be reviewed annually, as well as at the time of a promotion or other change in level of responsibilities, or when competitive circumstances or business needs may require. As noted above, we expect that the compensation committee will recommend a compensation package (including base salary) that is consistent with our compensation philosophy and strategically positioned above the median of our determined peer group.
- •
- Performance-Based Cash Incentives
We maintain the Euramax International, Inc. Executive Incentive Plan which is an annual performance-based cash incentive bonus program in which each of our NEOs participates. This annual cash incentive bonus program is intended to align the compensation of our NEOs with the achievement of our short-term corporate financial and operational goals. We created this program in order to attract and retain highly qualified executive talent and to motivate our NEOs to achieve our corporate objectives. Under the terms of our incentive compensation plan, we establish annual performance objectives for each participant and a target award upon achievement of performance objectives. The performance objectives are generally based on a formula that incorporates earnings and the target awards are based on a percentage of each participant's base salary. Annual awards are paid as soon as practicable after our determination of the achievement of performance objectives and when the results are certified by the compensation committee.
In 2008, the compensation committee, upon the recommendation of our CEO, set financial performance objectives that reflected the challenging economic environment and its impact on the markets in which the company operates. Consequently, we made the decision to add reduction in working capital as a primary performance objective for the company and each operating unit.
The objective financial incentive target goals under this plan for fiscal 2009 were (a) achievement of the company's operating earnings on a consolidated basis, or as to an operating unit of the company, that operating unit's earnings for the fiscal year, determined in accordance with GAAP, before deducting interest, taxes, depreciation and amortization ("EBITDA"); and (b) reduction in
104
working capital. We believe EBITDA has been an appropriate measure of the Company's and our NEOs' success because it emphasizes operating cash flow (which is important for meeting our debt service obligations) and revenue performance as well as improvements in our operating efficiency over the period in which executives can have significant impact. Our CEO and the compensation committee sets the performance goals annually based on an analysis of (1) historical performance; (2) income, expense and margin expectations; (3) financial results of other comparable businesses; (4) economic conditions; and (5) progress toward achieving our strategic plan. The financial goals for the NEOs at target under this plan for fiscal 2009 were achievement of $ EBITDA and days working capital. The actual results achieved for fiscal 2009 were $ EBITDA (or % to target) and days working capital (or % to target).
The target cash incentive compensation opportunity for each eligible executive is set at a percentage of base salary. For fiscal year 2009, the amount of performance-based cash incentive opportunity for participating executives ranged from % of their incentive target to % of their incentive target, based upon the extent to which the performance goals are achieved or exceeded. Although the actual performance of the company and the NEOs exceeded the target payouts, the CEO recommended and the compensation committee agreed to cap all bonus payouts at the target level in light of the unpredictable market and economic conditions and its effect on the company.
The following tables show each NEO's performance-based cash incentive targets and actual payout as a percentage of base salary for fiscal year 2009:
| |
Fiscal Year 2009 | |
||||||||||||||
|---|---|---|---|---|---|---|---|---|---|---|---|---|---|---|---|---|
| |
Percentage of Base Salary (December 2008 through December 2009) |
|
||||||||||||||
Name
|
Threshold Payout(1) |
Target Payout | Maximum Payout(2) |
Actual Payout | Actual Payout | |||||||||||
Mitchell B. Lewis |
% | % | % | % | $ | |||||||||||
R. Scott Vansant |
% | % | % | % | $ | |||||||||||
Scott R. Anderson |
% | % | % | % | $ | |||||||||||
Jeffrey C. Hummel |
% | % | % | % | $ | |||||||||||
Ron Slahetka |
% | % | % | % | $ | |||||||||||
- (1)
- Under
the terms of the plan, the minimum payout threshold is upon achievement of % of the plan performance objectives. Plan performance
achievement between % and % of Target Payout pays out % for
every % above the Threshold Payout % level.
- (2)
- Achievement of plan objectives above Target Payout, pays out % for every % of plan achievement above the Target Payout.
The performance-based cash incentive bonus program in which each of our NEOs participates was changed by the compensation committee for 2010. The compensation committee believes that the Company will benefit by providing the executive officers with an unlimited award potential based on achieving the best possible performance results for the company. Accordingly, the maximum award limitation has been removed from the plan for 2010. The only constraint on the performance-based cash incentive bonus payout is the increased difficulty to achieve incremental results above the financial objectives established to be eligible for a target payout. The compensation committee considered the historical achievements of the Company, the payouts received by the NEOs, and the challenging nature of achieving incremental results above the target levels that already exist in the plan which will act as a limitation and provide reasonable payouts based on achievement of extraordinary results. The compensation committee believes that the annual cash incentive bonus plan for 2010 more properly aligns the compensation of our NEOs and all executives of the Company with the interests of the company.
105
The following table shows each NEO's performance-based cash incentive targets as a percentage of base salary for fiscal year 2010. For fiscal year 2010, we are using EBITDA (as calculated under "Prospectus Summary—Summary Consolidated Financial Information") as the primary financial measure for the plan. We are using EBITDA for the same reasons noted above for fiscal year 2009, as well as because EBITDA is a key metric used by management and the board to assess our operating performance. We do not believe that disclosure of our 2010 EBITDA goals are relevant to an understanding of compensation for our 2009 fiscal year. In addition, because the components of EBITDA for 2010 contain highly sensitive data, we do not disclose specific future measures and targets in this Compensation Discussion and Analysis because we believe that such disclosure would result in serious competitive harm and be detrimental to our operating performance. Our 2010 EBITDA goals are intended to be realistic and reasonable, but challenging, in order to drive performance on an individual basis as well as for the company. In addition to EBITDA, for fiscal year 2010, we are using working capital and new business development goals as measures for the plan.
| |
Fiscal Year 2010 | ||||||
|---|---|---|---|---|---|---|---|
| |
Percentage of Base Salary (January 2010 through December 2010) |
||||||
Name
|
Threshold Payout | Target Payout | |||||
Mitchell B. Lewis |
% | % | |||||
R. Scott Vansant |
% | % | |||||
Scott R. Anderson |
% | % | |||||
Jeffrey C. Hummel |
% | % | |||||
Ron Slahetka(1) |
% | ||||||
- (1)
- Mr. Slahetka's employment agreement terminated on June 30, 2010 in connection to his retirement from Euramax.
Historically, our CEO has worked with the compensation committee to set our financial goals and our executive officers' individual cash incentive bonus targets each year in advance. The goals have been established based on historical operating results and growth rates, as well as our expected future results, and are designed to require significant effort and operational success on the part of our NEOs and the company. However, during the course of the year, the board and the compensation committee, based on the recommendations of our CEO (with respect to our other NEOs), may adjust such goals as they deem appropriate.
Although EBITDA was used as the financial measure for fiscal years 2009 and 2010, in the future the compensation committee may use other objective financial performance indicators for the plan, including, without limitation, the price of our common stock, shareholder return, return on equity, return on investment, return on capital, sales productivity, economic profit, economic value added, net income, operating income, gross margin, sales, free cash flow, working capital, earnings per share, operating company contribution, EBITDA (or any derivative thereof) or market share.
- •
- Equity Incentives—Summary of our Current Plan
In July 2009, our board of directors adopted an equity compensation program, the Euramax Holdings, Inc. Executive Incentive Plan (the "Equity Plan"), for the purposes of attracting and retaining valued employees. Our long-term equity incentive awards are generally intended to accomplish the following main objectives: create a direct correlation between our financial and equity value performance and compensation paid to the NEOs; function as a long-term retention of the NEOs and all executives; create a corporate culture that aligns employee interests with stockholder interests; attract and motivate key employees; reward participants for performance in relation to the creation of stockholder value; and deliver competitive levels of compensation consistent with our compensation philosophy.
106
Until the consummation of our initial public offering, our long term equity compensation program consists solely of restricted stock and restricted stock units issued under the 2009 Equity Plan.
The Equity Plan is administered by the compensation committee. The compensation committee has full authority to act in selecting the eligible employees, officers, directors and consultants to whom awards of restricted stock or restricted stock units (hereinafter "Restricted Stock Awards") may be granted. The compensation committee will determine the times at which such Restricted Stock Awards may be granted, the amount of awards that may be granted, the terms and conditions of awards that may be granted and the terms of agreements which will be entered into with all award recipients designated to participate in the Equity Plan.
On September 24, 2009, the compensation committee authorized and the company granted Restricted Stock Awards representing shares, or of the total authorized and available shares, to senior management employees and executives, including the NEOs, in connection with the Restructuring of the Company. An additional shares representing of the total authorized and available shares, were reserved for future awards primarily for new employees. Since the Restructuring and the initial grant of the Restricted Stock Awards, we have granted restricted stock units following a senior manager or an executive officer's start date. All such grants are principally based on the total amount authorized under the plan, the historical range of equity grants provided to company executives under expired plans with consideration given to the nature of the job and the individual's experience, as well as the current market conditions relating to equity ownership of officers in similar positions at similarly situated companies.
The Equity Plan provides that upon a change in control of the Company, including any person becoming the beneficial owner of 50% or more of the then-outstanding shares of common stock of the company, all Restricted Stock Awards shall become fully vested. Under the terms of the Equity Plan, the compensation committee, in its sole discretion, may determine that upon the consummation of the initial public offering or upon the occurrence of any corporate event or transaction involving the company, all time-based restrictions on any outstanding Restricted Stock Awards shall lapse. In addition, upon a change in control, any shares that remain available for issuance immediately prior to a change in control will be issued to executives and senior management on a pro rata basis at or immediately prior to such change in control. Alternatively, the compensation committee may determine that in connection with any recapitalization or exchange of shares, the Restricted Stock Awards will be assumed by another party to a transaction or otherwise be equitably converted or substituted in connection with such transaction. Following this offering, all Restricted Stock Awards will remain outstanding and continue to vest in accordance with their terms and no additional grants will be made under the Equity Incentive Plan.
The one-time grant of Restricted Stock Awards approved by the board in 2009 for each of our NEOs is shown in the following table:
Name
|
Restricted Stock Award | |||
|---|---|---|---|---|
Mitchell B. Lewis |
(1 | )(2) | ||
R. Scott Vansant |
(1 | )(2) | ||
Scott R. Anderson |
(1 | )(2) | ||
Jeffrey C. Hummel |
(1 | )(2) | ||
Ron Slahetka |
(1 | ) | ||
- (1)
- All
outstanding Restricted Stock Awards were granted September 24, 2009. Mr. Salahetka did not receive a long term incentive grant at this
time because he had announced his plan to retire effective June 30, 2010.
- (2)
- No additional grants to the NEOs have been made under this plan prior to this offering.
107
Equity and Cash Incentives—Euramax Holdings, Inc. 2010 Equity Incentive Plan
Effective upon the consummation of this offering, we will implement the Euramax Holdings, Inc. Equity Incentive Plan (the "2010 Plan"). The 2010 Plan will enable the board of directors, in its discretion, to provide for grants of stock options, stock appreciation rights, restricted stock and other stock-based awards. Independent directors, officers and other employees of the Company and our subsidiaries, as well as others performing consulting services for us, will be eligible for grants under the 2010 Plan. The purpose of the 2010 Plan is to provide incentives that will attract, retain and motivate high performing officers, directors, employees and consultants by providing them with appropriate incentives and rewards for high levels of performance and exceptional efforts. The following is a summary of the material terms of the 2010 Plan, but does not include all of the provisions of the 2010 Plan. For further information about the 2010 Plan, we refer you to the complete copy of the 2010 Plan which is filed as an exhibit to the registration statement of which this prospectus forms a part.
Administration
The 2010 Plan will be administered by the compensation committee. Among the compensation committee's powers are to determine the form, amount and other terms and conditions of awards, clarify, construe or resolve any ambiguity in any provision of the 2010 Plan or any award agreement, amend the terms of outstanding awards and adopt such rules, forms, instruments and guidelines for administering the 2010 Plan as it deems necessary or proper. All actions, interpretations and determinations by the compensation committee or by our board of directors are final and binding.
The compensation committee will have full authority to administer and interpret the 2010 Plan, to grant discretionary awards under the 2010 Plan, to determine the persons to whom awards will be granted, to determine the types of awards to be granted, to determine the terms and conditions of each award, to determine the number of shares of common stock to be covered by each award and to make all other determinations in connection with the 2010 Plan and the awards thereunder as the compensation committee, in its sole discretion, deems necessary or desirable.
Available Shares
The aggregate number of shares of common stock which may be issued or used for reference purposes under the 2010 Plan or with respect to which awards may be granted is million shares. We anticipate that in connection with this offering, we expect to grant options to purchase an aggregate of shares of our common stock and restricted stock units at an exercise price equal to the initial public offering price of our common stock. Of these grants, we anticipate that options to acquire shares of our common stock will be granted to our executive officers, including options to acquire shares to Mr. Lewis, shares to Mr. Vansant, shares to Mr. Anderson, and shares to Mr. Hummel. The shares may be either authorized and unissued shares of our common stock or shares of common stock held in or acquired for our treasury. If awards under the 2010 Plan are for any reason cancelled, or expire or terminate unexercised, the shares covered by such awards will again be available for the grant of awards under the 2010 Plan.
Eligibility for Participation
Members of our board of directors, as well as employees of, and consultants to, the company or any of our subsidiaries are eligible to receive awards under the 2010 Plan. The selection of participants is within the sole discretion of the compensation committee.
108
Award Agreement
Awards granted under the 2010 Plan shall be evidenced by award agreements, which may differ from award to award, that provide additional terms, conditions, restrictions and/or limitations covering the grant of the award, including, without limitation, additional terms providing for the acceleration of exercisability or vesting of awards in the event of a change in control or conditions regarding the participant's employment, as determined by the compensation committee in its sole discretion.
Stock Options
The compensation committee may grant nonqualified stock options and incentive stock options to purchase shares of our common stock only to eligible employees. The compensation committee will determine the number of shares of our common stock subject to each option, the term of each option, which may not exceed ten years, or five years in the case of an incentive stock option granted to a 10% stockholder, the exercise price, the vesting schedule, if any, and the other material terms of each option. No incentive stock option or nonqualified stock option may have an exercise price less than the fair market value of a share of our common stock at the time of grant or, in the case of an incentive stock option granted to a 10% stockholder, 110% of such share's fair market value. Options will be exercisable at such time or times and subject to such terms and conditions as determined by the committee at grant and the exercisability of such options may be accelerated by the compensation committee in its sole discretion.
Stock Appreciation Rights
The compensation committee may grant stock appreciation rights, which we refer to as SARs, either with a stock option, which may be exercised only at such times and to the extent the related option is exercisable, which we refer to as a Tandem SAR, or independent of a stock option, which we refer to as a Non-Tandem SAR. Non-Tandem SARs will be exercisable at such time or times and subject to such terms and conditions as determined by the committee at grant and the exercisability of such Non-Tandem SARs may be accelerated by the compensation committee in its sole discretion. A SAR is a right to receive a payment in shares of our common stock or cash, as determined by the compensation committee, equal in value to the excess of the fair market value of one share of our common stock on the date of exercise over the exercise price per share established in connection with the grant of the SAR. The term of each SAR may not exceed ten years. The exercise price per share covered by an SAR will be the exercise price per share of the related option in the case of a Tandem SAR and will be the fair market value of our common stock on the date of grant in the case of a Non-Tandem SAR. The compensation committee may also grant limited SARs, either as Tandem SARs or Non-Tandem SARs, which may become exercisable only upon the occurrence of a change in control, as defined in the 2010 Plan, or such other event as the compensation committee may, in its sole discretion, designate at the time of grant or thereafter.
Restricted Stock
The compensation committee may award shares of restricted stock. Except as otherwise provided by the compensation committee upon the award of restricted stock, the recipient generally will have the rights of a stockholder with respect to the shares, including the right to receive dividends, the right to vote the shares of restricted stock and, conditioned upon full vesting of shares of restricted stock, the right to tender such shares, subject to the conditions and restrictions generally applicable to restricted stock or specifically set forth in the recipient's restricted stock agreement. The compensation committee may determine at the time of award that the payment of dividends, if any, will be deferred until the expiration of the applicable restriction period.
109
Recipients of restricted stock will be required to enter into a restricted stock agreement that will state the restrictions to which the shares are subject, which may include satisfaction of pre-established performance goals, and the criteria or date or dates on which such restrictions will lapse.
If the grant of restricted stock or the lapse of the relevant restrictions is based on the attainment of performance goals, the committee will establish, for each recipient, the applicable performance goals, formulae or standards and the applicable vesting percentages with reference to the attainment of such goals or satisfaction of such formulae or standards while the outcome of the performance goals are substantially uncertain. Such performance goals may incorporate provisions for disregarding, or adjusting for, changes in accounting methods, corporate transactions, including, without limitation, dispositions and acquisitions, and other similar events or circumstances.
Other Stock-Based Awards
The compensation committee may, subject to limitations under applicable law, make a grant of such other stock-based awards, including, without limitation, performance units, dividend equivalent units, stock equivalent units, restricted stock units and deferred stock units under the 2010 Plan that are payable in cash, or denominated or payable in or valued by shares of our common stock or factors that influence the value of such shares. The compensation committee shall determine the terms and conditions of any such other awards, which may include the achievement of certain minimum performance goals for purposes of compliance with Section 162(m) of the Code and/or a minimum vesting period.
Performance Awards
The compensation committee may grant a performance award to a participant payable upon the attainment of specific performance goals. The compensation committee may grant performance awards that are intended to qualify as performance-based compensation under Section 162(m) of the Code as well as performance awards that arc not intended to qualify as performance-based compensation under Section 162(m) of the Code. Based on service, performance and/or such other factors or criteria, if any, as the compensation committee may determine, the compensation committee may, at or after grant, accelerate the vesting of all or any part of any performance award.
Performance Goals
The compensation committee may grant awards of restricted stock, performance awards, and other stock-based awards that are intended to qualify as performance-based compensation for purposes of Section 162(m) of the Code. These awards may be granted, vest and be paid based on attainment of specified performance goals established by the compensation committee. These performance goals will be based on the attainment of a certain target level of, or a specified increase or decrease in, one or more of the following measures selected by the committee: (1) earnings per share; (2) operating income; (3) gross income; (4) net income (before or after taxes); (5) cash flow; (6) gross profit; (7) gross profit return on investment; (8) gross margin return on investment; (9) gross margin; (10) operating margin; (11) working capital; (12) earnings before interest and taxes; (13) EBITDA; (14) return on equity; (15) return on assets; (16) return on capital; (17) return on invested capital; (18) net revenues; (19) gross revenues; (20) revenue growth; (21) annual recurring revenues; (22) recurring revenues; (23) working capital; (24) license revenues; (25) sales or market share; (26) total shareholder return; (27) economic value added; (28) specified objectives with regard to limiting the level of increase in all or a portion of our bank debt or other long-term or short-term public or private debt or other similar financial obligations, which may be calculated net of cash balances and/or other offsets and adjustments as may be established by the committee in its sole
110
discretion; (29) the fair market value of the a share of common stock; (30) the growth in the value of an investment in the common stock assuming the reinvestment of dividends; or (31) reduction in operating expenses.
To the extent permitted by law, the compensation committee may also exclude the impact of an event or occurrence which the compensation committee determines should be appropriately excluded, including: (1) restructurings, discontinued operations, extraordinary items and other unusual or non-recurring charges; (2) an event either not directly related to our operations or not within the reasonable control of management; or (3) a change in accounting standards required by GAAP.
Performance goals may also be based on an individual participant's performance goals, as determined by the compensation committee, in its sole discretion.
In addition, all performance goals may be based upon the attainment of specified levels of our performance, or the performance of a subsidiary, division or other operational unit, under one or more of the measures described above relative to the performance of other corporations. The compensation committee may designate additional business criteria on which the performance goals may be based or adjust, modify or amend those criteria.
Change in Control
In connection with a change in control, as defined in the 2010 Plan, the compensation committee may accelerate vesting of outstanding awards under the 2010 Plan. In addition, such awards will be, in the discretion of the compensation committee, (1) assumed and continued or substituted in accordance with applicable law, (2) purchased by us for an amount equal to the excess of the price of a share of our common stock paid in a change in control over the exercise price of the award(s) or (3) cancelled if the price of a share of our common stock paid in a change in control is less than the exercise price of the award. The compensation committee may also, in its sole discretion, provide for accelerated vesting or lapse of restrictions of an award at any time.
Amendment and Termination
Notwithstanding any other provision of the 2010 Plan, our board of directors may at any time amend any or all of the provisions of the 2010 Plan, or suspend or terminate it entirely, retroactively or otherwise; provided, however, that, unless otherwise required by law or specifically provided in the 2010 Plan, the rights of a participant with respect to awards granted prior to such amendment, suspension or termination may not be adversely affected without the consent of such participant.
Transferability
Awards granted under the 2010 Plan are nontransferable other than by will or the laws of descent and distribution and, in some cases, pursuant to a domestic relations order.
Effective Date
The 2010 Plan will be adopted by the board of directors in connection with this offering.
Additional Executive Benefits and Perquisites
We provide our executive officers with executive benefits and perquisites that the compensation committee believes are reasonable and in the best interests of the Company and its stockholders. Consistent with our compensation philosophy, we intend to continue to maintain our current benefits for our executive officers, including retirement plans, executive medical benefits, life insurance benefits,
111
housing relocation benefits, paid vacation and other perquisites described below. The compensation committee, in its discretion, may revise, amend or add to an officer's executive benefits if it deems it advisable. We believe these benefits are generally equivalent to benefits provided by comparable companies. We have no current plans to change the levels of benefits provided thereunder.
Retirement Plan Benefits
We sponsor a tax-qualified defined benefit retirement plan for hourly U.S. employees and a tax-qualified defined contribution retirement plan for all U.S. employees including our NEOs.
Qualified Retirement Plans. The company sponsors a non-contributory defined-benefit pension plan that covered substantially all of our non-union U.S. hourly employees, the Amerimax Companies Retirement Income Plan ("Retirement Plan"), which is intended to qualify under Section 401 of the Code. The company does not sponsor a defined benefit retirement plan for any U.S. salaried employees, including the NEOs, as we do not believe that such a plan best serves the needs of our employees or the business at this time. On April 1, 2010, the company closed the Retirement Plan to new participants and froze the accrual of additional benefits in place for all existing participants.
The company also sponsors a defined contribution pension plan ("401k") which is made available to all eligible U.S. employees, including executive officers, and allows them to elect to make contributions up to the maximum limits allowable under the Code.
UK Pension Plan. We sponsor a foreign defined benefit pension plan, the Euramax U.K. Pension Plan (the "UK Plan"), which is contracted out of the State Earnings Related Pension Scheme on a final salary basis and is approved under Chapter I of Part XIV of the Income and Corporation Taxes Act of 1988. The UK Plan covers substantially all of our employees located in the United Kingdom. The benefits under this plan are based primarily on the highest annual average of pensionable salary during any continuous three year period during the ten years prior to normal retirement.
Perquisites
In general. We provide the opportunity for our NEOs to receive certain perquisites and other personal benefits, including car allowances and company-paid life insurance premiums. We provide these benefits to provide an additional useful benefit for our executives, and we believe that providing these benefits is essential to our ability to remain competitive in the general marketplace for attracting and retaining executive talent.
2009 perquisites and other personal benefits. For the year ended 2009, we provided personal benefits and perquisites, including company car or car allowances, to all of our NEOs, as described below in the "—Compensation Tables—Summary Compensation Table."
Accounting and Tax Considerations
In determining which elements of compensation are to be paid, and how they are weighted, we also take into account whether a particular form of compensation will be deductible under Section 162(m) of the Code. Section 162(m) generally limits the deductibility of compensation paid to our NEOs to $1 million during any fiscal year unless such compensation is "performance-based" under Section 162(m). However, under a Section 162(m) transition rule for compensation plans or agreements of corporations which are privately held and which become publicly held in an initial public offering, compensation paid under a plan or agreement that existed prior to the initial public offering will not be subject to Section 162(m) until the earlier of (1) the expiration of the plan or agreement, (2) a material
112
modification of the plan or agreement, (3) the issuance of all employer stock and other compensation that has been allocated under the plan, or (4) the first meeting of stockholders at which directors are to be elected that occurs after the close of the third calendar year following the year of the initial public offering (the "Transition Date"). After the Transition Date, rights or awards granted under the plan, other than options and stock appreciation rights, will not qualify as "performance- based compensation" for purposes of Section 162(m) unless such rights or awards are granted or vest upon pre-established objective performance goals, the material terms of which are disclosed to and approved by our stockholders.
Our compensation program is intended to maximize the deductibility of the compensation paid to our NEOs to the extent that we determine it is in our best interests. Consequently, we may rely on the exemption from Section 162(m) afforded to us by the transition rule described above for compensation paid pursuant to our pre-existing plans.
Many other Code provisions, SEC regulations and accounting rules affect the payment of executive compensation and are generally taken into consideration as programs are developed. Our goal is to create and maintain plans that are efficient, effective and in full compliance with these requirements.
Compensation Tables
The purpose of the following tables is to provide information regarding the compensation earned during our most recently completed fiscal year by our NEOs.
Summary Compensation Table
The following table shows the compensation by our NEOs during the fiscal year ended December 31, 2009, referred to as fiscal year 2009.
Name and Principal Position
|
Year (a) |
Salary ($)(b) |
Non-Equity Incentive Compensation Plan ($)(c)(1) |
Stock Awards ($)(d)(2) |
All Other Compensation ($)(e)(3) |
Total ($)(f) |
|||||||||||||
|---|---|---|---|---|---|---|---|---|---|---|---|---|---|---|---|---|---|---|---|
Mitchell B. Lewis |
2009 | ||||||||||||||||||
R. Scott Vansant |
2009 |
||||||||||||||||||
Scott R. Anderson |
2009 |
||||||||||||||||||
Jeffrey C. Hummel |
2009 |
||||||||||||||||||
Ron Slahetka |
2009 |
||||||||||||||||||
- (1)
- Represents amounts paid under our performance-based cash incentive plan. Bonuses earned for 2009 performance under the 2010 Plan were paid in April 2010 after completion of audited financial statements and approval by the compensation committee.
113
- (2)
- Amounts
shown for Stock Awards relate to restricted stock, and are equal to the dollar amounts recognized in 2009 for financial reporting purposes, computed
in accordance with FASB ASC Topic 718, based on assumptions described in Note 10 to our consolidated financial statements included elsewhere in this prospectus.
- (3)
- The following table details All Other Compensation paid to each NEO during fiscal year 2009:
Name
|
Executive Health Benefits ($)(b)(1) |
Executive Life and Disability Insurance ($)(c)(2) |
Car Allowance ($)(d)(3) |
401(k) Company Match ($)(e)(3) |
|||||||||
|---|---|---|---|---|---|---|---|---|---|---|---|---|---|
Mitchell B. Lewis |
|||||||||||||
R. Scott Vansant |
|||||||||||||
Scott R. Anderson |
|||||||||||||
Jeffrey C. Hummel |
|||||||||||||
Ron Slahetka |
|||||||||||||
- (1)
- The
following items are included in "Executive Health Benefits": average company cost per employee for the Employee Medical Plan and Employee Dental Plan;
actual company expenses for the Executive Physical Program; and actual premiums paid by the company for the Executive Medical Plan.
- (2)
- Amounts
represent the annual premiums paid by the company for executive life insurance, and executive disability insurance.
- (3)
- See "—Retirement Plan Benefits—Qualified Retirement Plans" for additional information.
Grants of Plan-Based Awards
| |
|
Estimated Future Payouts Under Non-Equity Plan Awards(1) |
All Other Stock Awards: Number of Shares of Stock or Units (#) |
|
|||||||||||||||
|---|---|---|---|---|---|---|---|---|---|---|---|---|---|---|---|---|---|---|---|
| |
|
Grant Date Fair Value of Stock and Option Awards ($/Sh) |
|||||||||||||||||
Name
|
Grant Date | Threshold ($) |
Target ($) |
Maximum ($) |
|||||||||||||||
Mitchell Lewis |
|||||||||||||||||||
R. Scott Vansant |
|||||||||||||||||||
Scott R. Anderson |
|||||||||||||||||||
Jeffrey C. Hummel |
|||||||||||||||||||
Ron Slahetka |
|||||||||||||||||||
- (1)
- For actual amounts earned by the NEOs under the 2010 Plan see "—Summary Compensation Table."
114
Employment and Restricted Stock Agreements
On June 12, 2009, we entered into employment agreements with each of Mr. Lewis, our Chief Executive Officer and Mr. Vansant, our Chief Financial Officer. Each employment agreement provides for a two-year term commencing June 12, 2009 with such term being extended for an additional day on each day after such commencement date unless either the Company or the executive provides at least 60 days notice of non-renewal.
Under the terms of the employment agreements, Mr. Lewis is entitled to an annual base salary of $ and Mr. Vansant is entitled to an annual base salary of $ . Both Mr. Lewis's and Mr. Vansant's base salary is subject to annual review by our board of directors for potential increase. In addition, both Mr. Lewis and Mr. Vansant are each eligible to participate in our cash bonus plan with a target annual bonus equal to % of base salary. Mr. Lewis and Mr. Vansant are also eligible to receive benefits in accordance with the standard benefit plans we provide to our other senior executives. In addition, the employment agreements provide for benefits in the event of a termination of employment under specific circumstances. Such termination benefits and the associated restrictive covenants for each of Mr. Lewis and Mr. Vansant are described below under "—Potential Payments Upon Termination of Employment and Change in Control."
The restricted stock agreements in effect on the date hereof provide that the participant will vest in 100% of the restricted shares four years from the date of the grant. If an employee voluntarily terminates his or her employment, the employee will forfeit any unvested Restricted Stock Awards. If employment is terminated as a result of death, disability or in the event of a change in control, as such term is defined under the Equity Plan, all time-based vesting restrictions on that participant's outstanding awards lapse and the unvested shares of the restricted stock shall be accelerated as of the date of the non-voluntary termination.
As a condition of receiving a Restricted Stock Award, the committee has required each recipient to enter into an agreement that prohibits each recipient from engaging in activities competitive with us, soliciting our employees and consultants, and diverting business from us while serving as an employee, director or consultant and for a period from one to two years after termination of employment or service.
Outstanding Equity Awards at Fiscal Year-End
The table below sets forth certain information regarding the outstanding equity awards held by our NEOs as of December 31, 2009.
| |
Stock Awards | ||||||
|---|---|---|---|---|---|---|---|
Name
|
Number of Shares or Units of Stock that Have Not Vested (#)(1) |
Market Value of Shares or Units of Stock that Have Not Vested ($) |
|||||
Mitchell B. Lewis |
|||||||
R. Scott Vansant |
|||||||
Scott R. Anderson |
|||||||
Jeffrey C. Hummel |
|||||||
Ron Slahetka |
|||||||
- (1)
- These shares of restricted stock will vest at a rate of 25% per year beginning on the one year anniversary of the date of grant.
115
Pension Benefits
Our NEOs did not participate in or have account balances in any qualified or nonqualified defined benefit plans sponsored by us. Our board of directors or compensation committee may elect to adopt qualified or nonqualified benefit plans in the future if it determines that doing so is in our best interest.
Potential Payments Upon Termination of Employment and Change in Control
The compensation committee believes that our current severance arrangements protect stockholder interests by retaining management should periods of uncertainty arise. Because our severance arrangements are structured to serve the above purposes and because severance agreements represent a contractual obligation of our company, decisions relating to other elements of compensation have minimal effect on decisions relating to existing severance agreements.
In the event that Mr. Lewis's employment as our CEO or Mr. Vansant's employment as our CFO is terminated by us without "cause" or by Mr. Lewis or Mr. Vansant for "good reason" (each as defined in Mr. Lewis's and Mr. Vansant's employment agreements and each an involuntary termination), Mr. Lewis and Mr. Vansant are entitled to severance that is quantified in the tables that follow.
Mr. Lewis and Mr. Vansant have also agreed to customary restrictions with respect to the use of our confidential information, and each has agreed that all intellectual property developed or conceived by them while employed with us which relates to our business is our property. During the term of Mr. Lewis's and Mr. Vansant's employment and for the month period immediately thereafter, Mr. Lewis and Mr. Vansant have each agreed not to (1) solicit or hire any of our employees, (2) induce or attempt to induce any supplier, licensee, licensor or other material business relation of ours to cease doing business with us, or (3) participate (whether as an officer, director, employee or otherwise) in any competitive business.
All of the executive officers including the NEOs, other than the CEO, CFO and Mr. Slahetka, are eligible to receive severance benefits under the Amerimax Fabricated Products, Inc. Severance Pay Plan (the "Severance Pay Plan"). Under the terms of the Severance Pay Plan, upon an involuntary termination of employment without cause ("Qualifying Termination"), the NEOs shall be paid weeks of base salary plus an additional one week of base salary for each year of service up to a maximum total payment of weeks of base salary; provided, however, that for employees who do not meet the one year minimum service eligibility requirement, the minimum payments shall be weeks of base salary. For purposes of the Severance Pay Plan, any severance payment shall be calculated on the basis of the Participant's position and base salary immediately prior to the Qualifying Termination of employment and "base salary" shall be deemed to mean the Participant's base salary in effect at that time excluding any bonuses, awards, overtime, premiums, expense reimbursements, etc. All right to benefits under the Severance Pay Plan cease upon subsequent employment following a Qualifying Termination.
The information below describes and quantifies certain compensation that would become payable under employment agreements with the following NEOs if, as of December 31, 2009, his/her employment with us had been terminated. Due to the number of factors that affect the nature and amount of any benefits provided upon the events discussed below, any actual amounts paid or distributed may be different. Factors that could affect these amounts include the timing during the year of any such event. Further, the information below does not incorporate the terms of any agreement entered into after December 31, 2009.
116
Mitchell B. Lewis
| |
|
Involuntary without Cause or Voluntary with Good Reason |
|
|
|
||||||||||||||
|---|---|---|---|---|---|---|---|---|---|---|---|---|---|---|---|---|---|---|---|
| |
Voluntary Resignation without Good Reason(1) |
|
|
|
|||||||||||||||
| |
Involuntary w/out Cause following Change in Control(1)(3) |
|
|
||||||||||||||||
Component
|
Without Signed Release |
With Signed Release(1)(3) |
Disability(1)(2) | Retirement | |||||||||||||||
Total Severance |
$ | $ | $ | $ | $ | $ | |||||||||||||
- (1)
- This
amount reflects the maximum payment that can be awarded under the employment agreement and is subject to pro rata reduction based on the date of
termination under the formula described above.
- (2)
- Acceleration
of equity occurs only upon disability.
- (3)
- Estimates for benefits and perquisites include the continuation of group health and welfare and executive benefits for a period of months pursuant to the terms of Mr. Lewis's employment agreement.
R. Scott Vansant
| |
|
Involuntary without Cause or Voluntary with Good Reason |
|
|
|
||||||||||||||
|---|---|---|---|---|---|---|---|---|---|---|---|---|---|---|---|---|---|---|---|
| |
Voluntary Resignation without Good Reason(1) |
|
|
|
|||||||||||||||
| |
Involuntary w/out Cause following Change in Control(1)(3) |
|
|
||||||||||||||||
Component
|
Without Signed Release |
With Signed Release(1)(3) |
Disability(1)(2) | Retirement | |||||||||||||||
Total Severance |
$ | $ | $ | $ | $ | $ | |||||||||||||
- (1)
- This
amount reflects the maximum payment that can be awarded under the employment agreement. This amount is subject to reduction under the formula described
above.
- (2)
- Acceleration
of equity occurs only upon disability.
- (3)
- Estimates for benefits and perquisites include the continuation of group health and welfare and executive benefits for a period of pursuant to the terms of Mr. Vansant's employment agreement.
Scott R. Anderson
| |
|
Involuntary without Cause or Voluntary with Good Reason |
|
|
|
||||||||||||||
|---|---|---|---|---|---|---|---|---|---|---|---|---|---|---|---|---|---|---|---|
| |
Voluntary Resignation without Good Reason(1) |
|
|
|
|||||||||||||||
| |
Involuntary w/out Cause following Change in Control(1)(3) |
|
|
||||||||||||||||
Component
|
Without Signed Release |
With Signed Release(1)(3) |
Disability(1)(2) | Retirement | |||||||||||||||
Total Severance |
$ | $ | $ | $ | $ | $ | |||||||||||||
Jeffrey C. Hummel
| |
|
Involuntary without Cause or Voluntary with Good Reason |
|
|
|
||||||||||||||
|---|---|---|---|---|---|---|---|---|---|---|---|---|---|---|---|---|---|---|---|
| |
Voluntary Resignation without Good Reason(1) |
|
|
|
|||||||||||||||
| |
Involuntary w/out Cause following Change in Control(1)(3) |
|
|
||||||||||||||||
Component
|
Without Signed Release |
With Signed Release(1)(3) |
Disability(1)(2) | Retirement | |||||||||||||||
Total Severance |
$ | $ | $ | $ | $ | $ | |||||||||||||
117
Director and Officer Indemnification and Limitation of Liability
We are currently party to indemnification agreements with each of our directors. There is no pending litigation or proceeding naming any of our directors or officers pursuant to which indemnification is being sought, and we are not aware of any pending or threatened litigation that may result in claims for indemnification by any director.
Compensation of Directors
2009 Director Compensation
The table below sets forth information regarding amounts earned by our directors during 2009.
Name
|
Fees Earned or Paid In Cash ($)(b) |
Stock Awards ($)(c)(1) | Total ($)(h) | |||||||
|---|---|---|---|---|---|---|---|---|---|---|
Marjorie L. Bowen |
||||||||||
James G. Bradley |
||||||||||
Jeffrey A. Brodsky |
||||||||||
G. Fulton Collins |
||||||||||
Michael D. Lundin |
||||||||||
Alvo M. Oddis |
||||||||||
- (1)
- Amounts shown for Stock Awards relate to restricted stock, and are equal to the dollar amounts recognized in 2009 for financial reporting purposes, computed in accordance with FASB ASC Topic 718, based on assumptions described in Note 10 to our Consolidated Financial Statements.
Director Compensation
Our directors currently each receive an annual cash fee of $ and the chairman of our board of directors receives an additional annual cash fee of $ . Additionally, we pay an annual fee of $ to each of our audit committee and compensation committee chairpersons and an annual fee of $ to each member of such board committees. As illustrated on the table above, certain of our directors were each granted restricted shares which will vest at a rate of 25% per year beginning on the one year anniversary of the date of grant and if the director is terminated as a result of death or disability, or in the event of a change in control, as such term is defined under the Equity Plan, all time-based vesting restrictions on the director's outstanding awards lapse and the unvested shares of the restricted stock shall be accelerated as of the date of the non-voluntary termination. Finally, our directors are each entitled to an in-person meeting fee of $ per meeting and a significant telephone conference fee of $ per call.
118
The following table presents information regarding beneficial ownership of our common stock by:
- •
- each of our directors;
- •
- each of our named executive officers;
- •
- each stockholder known by us to beneficially hold five percent or more of our common stock; and
- •
- all of our executive officers and directors as a group.
Beneficial ownership is determined under the rules of the SEC and generally includes voting or investment power with respect to securities. Unless indicated below, to our knowledge, the persons and entities named in the table have sole voting and sole investment power with respect to all shares beneficially owned, subject to community property laws where applicable. Shares of common stock subject to options that are currently exercisable or exercisable within 60 days of the date of this prospectus are deemed to be outstanding and to be beneficially owned by the person holding such options for the purpose of computing the percentage ownership of that person but are not treated as outstanding for the purpose of computing the percentage ownership of any other person. Except as otherwise indicated, the business address for each of our beneficial owners is c/o Euramax International, Inc., 5445 Triangle Parkway, Suite 350, Norcross, GA 30092.
| |
Shares Beneficially Owned Prior to this Offering |
Shares Beneficially Owned After this Offering Assuming the Underwriters' Option Is Not Exercised(1) |
Shares Beneficially Owned After this Offering Assuming the Underwriters' Option Is Exercised In Full(1) |
||||||||||||||||
|---|---|---|---|---|---|---|---|---|---|---|---|---|---|---|---|---|---|---|---|
Name and Address
|
Number | Percent | Number | Percent | Number | Percent | |||||||||||||
Mitchell B. Lewis |
% | % | % | ||||||||||||||||
R. Scott Vansant |
% | % | % | ||||||||||||||||
Scott R. Anderson |
% | % | % | ||||||||||||||||
Jeffrey C. Hummel |
% | % | % | ||||||||||||||||
Michael Lundin |
% | % | % | ||||||||||||||||
Jim Bradley |
% | % | % | ||||||||||||||||
Marjorie Bowen |
% | % | % | ||||||||||||||||
Jeffrey Brodsky |
% | % | % | ||||||||||||||||
Fulton Collins |
% | % | % | ||||||||||||||||
Alvo M. Oddis |
% | % | % | ||||||||||||||||
All directors and executive officers, as a group (10 persons) |
% | % | % | ||||||||||||||||
- *
- Less
than 1%
- (1)
- The underwriters have an option to purchase up to an additional shares from us in this offering.
119
CERTAIN RELATIONSHIPS AND RELATED PARTY TRANSACTIONS
This section describes related party transactions that have occurred since December 29, 2006, and any currently proposed transactions, that involve Euramax Holdings, Inc. and exceed $120,000, and in which any director, executive officer and/or 5% stockholder had or has a direct or indirect material interest.
Restructuring
On June 29, 2009, we, the Equity Sponsors and certain management shareholders agreed to a restructuring of indebtedness owed to lenders under our then existing first and second lien credit agreements and of amounts owed to counterparties under our then-existing interest rate swaps (the "Restructuring"). Under the terms of the Restructuring, lenders cancelled 100% of amounts owed under our second lien credit agreement consisting of principal and accrued interest of $191 million and $12 million, respectively, in exchange for 100% of our issued and outstanding stock. Our stock was issued to lenders in proportion to their holdings of the second lien loans prior to the Restructuring. The following lenders who received common stock in the Restructuring currently own more than 5% of our common stock: . See "Principal Stockholders." Also see "Management's Discussion and Analysis of Financial Condition and Results of Operations—Liquidity and Capital Resources" for additional information regarding the Restructuring.
Registration Rights Agreement
We are party to a registration rights agreement with our existing stockholders. Under the registration rights agreement, a stockholder who holds "registrable securities" may request that we register such registrable securities through a demand registration or a piggyback registration. Registrable securities include the common stock delivered to our stockholders in connection with the Restructuring (whether or not the common stock continues to be held by the stockholder who acquired the common stock in the Restructuring) and common stock issued to management under our Executive Incentive Plan.
Piggyback Registration. If we propose to register any securities then, within a specified number of days prior to the anticipated date of the preliminary prospectus relating to the registration, we must notify each holder of registrable securities of the registration and offer each of them the opportunity to include as many of their registrable securities in the registration statement as they may request. If the managing underwriter of the proposed offering should advise us that, in its view, the number of shares requested to be registered exceeds the largest number of shares that can be sold without having an adverse effect on the proposed registered offering, we will include (i) first, any securities proposed to be registered for us, (ii) second, all securities requested to be registered by the holders of registrable securities and (iii) third, any securities proposed to be registered for any other person with respect to such priorities among them as we determine. These provisions do not apply to this offering.
Demand Registration. Stockholders holding a majority of our outstanding common stock may request that we register all or any portion of their registrable securities. If we receive notice from stockholders who hold registrable securities requesting a demand registration, we must provide notice of the requested registration to each stockholder who holds registrable securities within a specified number of days prior to the anticipated date of the preliminary prospectus. If the managing underwriter of the proposed offering should advise us that, in its view, the number of shares requested to be registered exceeds the largest number of shares that can be sold without having an adverse effect on the proposed registered offering, we will include (i) first, all securities requested to be registered by the stockholders and (ii) second, any securities proposed to be registered by us.
We are not required to effect a demand registration within three months of a public offering of our securities. We are not required to effect more than four demand registrations, and are not required
120
to effect more than one demand registration in any six-month period. We were not obligated to effect a demand registration for this offering, and are not obligated to effect a demand registration for any offering which would be our first public offering, unless the managing underwriter advises us that, in its view, such offering would result in us and the registering stockholders receiving, in the aggregate, no less than $50 million of net proceeds from the offering. The stockholder requesting a demand registration has the right to select an underwriter or underwriters in connection with the demand registration offering, subject to our approval. We will select the underwriter or underwriters in connection with any other public offering, including this offering.
The registration rights agreement may only be amended with the consent of our board of directors and stockholders holding at least two-thirds of the then outstanding registrable securities.
Stockholders Agreement
We are party to a stockholders agreement with the existing holders of our common stock. The stockholders agreement provides that stockholders holding a majority of our outstanding common stock must approve, among other things: (i) our engagement in a public offering, (ii) amendment or restatement of our charter of bylaws, (iii) any increase or decrease in the number of directors on our board and (iv) any actions, approvals or agreements with respect to the foregoing provisions. The agreement imposes transfer restrictions that control the manner in which our stockholders may transfer their shares. The agreement also provides for preemptive rights. The preemptive rights do not apply in connection with a public offering. The agreement also provided that the seven members of our board of directors would be elected to the board of directors.
The stockholders agreement will terminate upon a "qualified public offering," defined as (i) a public offering by us in which we receive no less than $50 million of net proceeds or (ii) a demand registration under the Registration Rights Agreement that is our first public offering. We expect that this offering will be deemed a "qualified public offering" and that the stockholders agreement will be terminated in connection with this offering.
Related Party Transaction Policy
Prior to the completion of this offering, our board of directors will adopt a Related Party Transaction Policy, which is designed to monitor and ensure the proper review, approval, ratification and disclosure of related party transactions involving us. This policy will apply to any transaction, arrangement or relationship (or any series of similar transactions, arrangements or relationships) in which we were, are or will be a participant and the amount involved exceeds $120,000, and in which any related party had, has or will have a direct or indirect material interest. The audit committee of our board of directors must review, approve and ratify a related party transaction if such transaction is consistent with the Related Party Transaction Policy and is on terms, taken as a whole, which the audit committee believes are no less favorable to us than could be obtained in an arms-length transaction with an unrelated third party, unless the audit committee otherwise determines that the transaction is not in our best interests. Any related party transaction or modification of such transaction which our board of directors has approved or ratified by the affirmative vote of a majority of directors, who do not have a direct or indirect material interest in such transaction, does not need to be approved or ratified by our audit committee. In addition, related party transactions involving compensation may be approved by our compensation committee or the full board of directors in lieu of our audit committee.
121
The following is a description of the material terms of our Amended and Restated Certificate of Incorporation and Amended and Restated Bylaws as each is anticipated to be in effect upon the closing of this offering. We also refer you to our amended and restated certificate of incorporation and amended and restated bylaws, copies of which are filed as exhibits to the registration statement of which this prospectus forms a part.
Authorized Capital
Our authorized capital stock consists of:
- •
- shares of common stock, par value $0.01 per share, of which shares were issued and
outstanding as of , 2010, and;
- •
- shares of preferred stock, of which no shares are issued and outstanding.
As of , 2010, there were holders of record of our common stock.
Immediately following the closing of this offering, there are expected to be shares of common stock issued and outstanding (or shares of common stock if the underwriters exercise their option to purchase additional shares) and no shares of preferred stock outstanding.
Common Stock
Holders of our common stock are entitled to one vote for each share on all matters voted upon by our stockholders, including the election of directors, and do not have cumulative voting rights. Subject to the rights of holders of any then outstanding shares of our preferred stock, our common stockholders are entitled to any dividends that may be declared by our board of directors. Holders of our common stock are entitled to share ratably in our net assets upon our dissolution or liquidation after payment or provision for all liabilities and any preferential liquidation rights of our preferred stock then outstanding. Holders of our common stock have no preemptive rights to purchase shares of our common stock. The shares of our common stock are not subject to any redemption provisions and are not convertible into any other shares of our capital stock. All outstanding shares of our common stock are, and the shares of common stock to be issued in this offering will be, upon payment therefor, fully paid and nonassessable. The rights, preferences and privileges of holders of our common stock will be subject to those of the holders of any shares of our preferred stock we may issue in the future.
Preferred Stock
Our board of directors may, from time to time, authorize the issuance of one or more series of preferred stock without stockholder approval. Subject to the provisions of our amended and restated certificate of incorporation and limitations prescribed by law, our board of directors is authorized to adopt resolutions to issue shares, designate the series, establish the number of shares, change the number of shares constituting any series, and provide or change the voting powers, preferences and relative participating, optional and other special rights, and any qualifications, limitations or restrictions on shares of our preferred stock, including dividend rights, terms of redemption, conversion rights and liquidation preferences, in each case without any action or vote by our stockholders. We have no current intention to issue any shares of preferred stock.
One of the effects of undesignated preferred stock may be to enable our board of directors to discourage an attempt to obtain control of our company by means of a tender offer, proxy contest,
122
merger or otherwise. The issuance of preferred stock may adversely affect the rights of our common stockholders by, among other things:
- •
- restricting dividends on the common stock;
- •
- diluting the voting power of the common stock;
- •
- impairing the liquidation rights of the common stock; or
- •
- delaying or preventing a change in control without further action by the stockholders.
Authorized but Unissued Capital Stock
Delaware law does not require stockholder approval for any issuance of authorized shares. However, the listing requirements of the , which would apply as long as our common stock is listed on the , require stockholder approval of certain issuances equal to or exceeding 20% of the then outstanding voting power or then outstanding number of shares of common stock. These additional shares may be used for a variety of corporate purposes, including future public offerings, to raise additional capital or to facilitate acquisitions.
One of the effects of the existence of unissued and unreserved common stock or preferred stock may be to enable our board of directors to issue shares to persons friendly to current management, which issuance could render more difficult or discourage an attempt to obtain control of our company by means of a merger, tender offer, proxy contest or otherwise, and thereby protect the continuity of our management and possibly deprive the stockholder of opportunities to sell their shares of common stock at prices higher than prevailing market prices.
Limitation on Liability and Indemnification of Officers and Directors
Our amended and restated certificate of incorporation limits the liability of directors to the fullest extent permitted by Delaware law. The effect of this provision is to eliminate the rights of our company and our stockholders, through stockholders' derivative suits on behalf of our company, to recover monetary damages against a director for breach of fiduciary duty as a director, including breaches resulting from grossly negligent behavior. However, our directors will be personally liable to us and our stockholders for any breach of the director's duty of loyalty, for acts or omissions not in good faith or which involve intentional misconduct or a knowing violation of law, under Section 174 of the Delaware General Corporation Law or for any transaction from which the director derived an improper personal benefit. In addition, our amended and restated certificate of incorporation and bylaws provide that we will indemnify our directors and officers to the fullest extent permitted by Delaware law. We may enter into indemnification agreements with our current directors and executive officers prior to the completion of this offering. We also maintain directors and officers insurance.
Delaware Anti-Takeover Law
Our amended and restated certificate of incorporation provides that we are not subject to Section 203 of the Delaware General Corporation Law which regulates corporate acquisitions. This law provides that specified persons who, together with affiliates and associates, own, or within three years did own, 15% or more of the outstanding voting stock of a corporation may not engage in business combinations with the corporation for a period of three years after the date on which the person became an interested stockholder. The law defines the term "business combination" to include mergers, asset sales and other transactions in which the interested stockholder receives or could receive a financial benefit on other than a pro rata basis with other stockholders.
123
Removal of Directors; Vacancies
Our amended and restated certificate of incorporation and bylaws provide that any director or the entire board of directors may be removed with or without cause by the affirmative vote of the majority of all shares then entitled to vote at an election of directors. Our amended and restated certificate of incorporation and bylaws also provide that any vacancies on our board of directors will be filled by the affirmative vote of a majority of the board of directors then in office, even if less than a quorum, or by a sole remaining director.
Voting
The affirmative vote of a plurality of the shares of our common stock present, in person or by proxy, will decide the election of any directors, and the affirmative vote of a majority of the shares of our common stock present, in person or by proxy, will decide all other matters voted on by stockholders, unless the question is one upon which, by express provision of law, under our amended and restated certificate of incorporation, or under our bylaws, a different vote is required, in which case such provision will control.
Listing
We intend to apply to list our common stock on the under the symbol "EMAX."
Registration Rights Agreement
We are party to a registration rights agreement with our existing stockholders. Under the registration rights agreement, a stockholder who holds "registrable securities" may request that we register such registrable securities through a demand registration or a piggyback registration. Registrable securities include the common stock delivered to our stockholders in connection with the Restrcturing (whether or not the common stock continues to be held by the stockholder who acquired the common stock in the Restructuring) and common stock issued to management under our Executive Incentive Plan.
Piggyback Registration. If we propose to register any securities then, within a specified number of days prior to the anticipated printing date of the preliminary prospectus relating to the registration, we must notify each holder of registrable securities of the registration and offer each of them the opportunity to include as many of their registrable securities in the registration statement as they may request. If the managing underwriter should advise us that, in its view, the number of shares requested to be registered exceeds the largest number of shares that can be sold without having an adverse effect on the proposed offering, we will include (i) first, any securities proposed to be registered for us, (ii) second, all securities requested to be registered by the holders of registrable securities and (iii) third, any securities proposed to be registered for any other person with respect to such priorities among them as we determine. These provisions do not apply to this offering.
Demand Registration. Stockholders holding a majority of our outstanding common stock may request that we register all or any portion of their registrable securities. If we receive notice from stockholders who hold registrable securities requesting a demand registration, we must provide notice of the requested registration to each stockholder who holds registrable securities within a specified number of days prior to the anticipated printing date for the preliminary prospectus. If the managing underwriter should advise us that, in its view, the number of shares requested to be registered exceeds the largest number of shares that can be sold without having an adverse effect on the proposed
124
offering, we will include (i) first, all securities requested to be registered by the stockholders and (ii) second, any securities proposed to be registered by us.
We are not required to effect a demand registration within three months of a public offering of our securities. We are not required to effect more than four demand registrations, and are not required to effect more than one demand registration in any six-month period. We are not obligated to effect a demand registration that would be our first public offering unless the proposed managing underwriter advises us that, in its view, such offering would result in us and the registering stockholders receiving, in the aggregate, no less than $50 million of net proceeds from the offering. The stockholder requesting a demand registration has the right to select an underwriter or underwriters in connection with the demand registration offering, subject to our approval. We will select the underwriter or underwriters in connection with any other public offering.
The registration rights agreement may only be amended with the consent of our board of directors and stockholders holding at least two-thirds of the then outstanding registrable securities.
Transfer Agent and Registrar
The transfer agent and registrar for our common stock is .
125
SHARES ELIGIBLE FOR FUTURE SALE
Upon the completion of this offering, we will have outstanding shares of common stock. The shares sold in this offering plus any additional shares sold upon exercise of the underwriters' option will be freely tradable without restriction under the Securities Act, unless purchased by our "affiliates" as that term is defined in Rule 144 under the Securities Act. In general, affiliates include executive officers, directors and our largest stockholders. Shares of common stock purchased by affiliates will remain subject to the resale limitations of Rule 144.
The shares outstanding prior to this offering are restricted securities within the meaning of Rule 144. Restricted securities may be sold in the public market only if registered or if they qualify for an exemption from registration under Rules 144 or Rule 701 promulgated under the Securities Act.
Our executive officers and directors, who hold shares, and other shareholders, who own shares, have agreed to enter into lock-up agreements with the underwriters in connection with this offering, generally providing that they will not offer, sell, contract to sell, or grant any option to purchase or otherwise dispose of our common stock or any securities exercisable for or convertible into our common stock owned by them for a period of 180 days after the date of this prospectus without the prior written consent of . Any shares subject to a lock-up agreement will not be salable until the lock-up agreement expires or is waived by . Upon expiration of the lockup, shares held by non-affiliates can be sold without limitation, and shares held by affiliates may be sold subject to the limitations of Rule 144.
The remaining shares of common stock, held by stockholders who have not signed lock-up agreements with the underwriters, may be sold immediately following this offering, assuming they are not affiliates of the issuer. If they are an affiliate of the issuer, their shares may be resold in accordance with Rule 144.
In general, under Rule 144 as currently in effect, a person who has beneficially owned restricted securities for at least for at least six months and is not an affiliate of the issuer may sell their shares freely without any limitations. Shareholders who have held their shares for six months and are affiliates of the issuer may sell within any three month period a number of shares that does not exceed the greater of the following:
- •
- one percent of the number of shares of common stock then outstanding, which will equal
approximately
shares immediately after this offering; or
- •
- the average weekly trading volume of the common stock during the four calendar weeks preceding the sale.
Sales by affiliates under Rule 144 are also subject to requirements with respect to manner-of-sale requirements, notice requirements and the availability of current public information about us.
Holders of shares of our common stock are parties to a registration rights agreement with us. Such holders can, under certain circumstances, request that we register their shares with the SEC at any time on up to four occasions, including pursuant to shelf registration statements. Such holders may also, under certain circumstances, piggyback on any registration statement we file with the SEC. The piggyback provisions do not apply to this offering. See "Description of Capital Stock—Registration Rights Agreement."
126
MATERIAL U.S. FEDERAL INCOME AND ESTATE
TAX CONSIDERATIONS TO NON-U.S. HOLDERS
The following is a summary of the material U.S. federal income and estate tax consequences of the acquisition, ownership and disposition of our common stock by a non-U.S. holder. As used in this summary, the term "non-U.S. holder" means a beneficial owner of our common stock that is not, for U.S. federal income tax purposes:
- •
- an individual who is a citizen or resident of the United States or a former citizen or resident of the United States
subject to taxation as an expatriate;
- •
- a corporation (or other entity classified as a corporation for these purposes) created or organized in or under the laws
of the United States or of any political subdivision of the United States;
- •
- a partnership (including any entity or arrangement classified as a partnership for these purposes);
- •
- an estate whose income is includible in gross income for U.S. federal income tax purposes regardless of its source; or
- •
- a trust, if (1) a U.S. court is able to exercise primary supervision over the trust's administration and one or more "United States persons" (within the meaning of the U.S. Internal Revenue Code of 1986, as amended (the "Code")) has the authority to control all of the trust's substantial decisions, or (2) the trust has a valid election in effect under applicable U.S. Treasury regulations to be treated as a "United States person."
If a partnership or other pass-through entity (including an entity or arrangement treated as a partnership or other type of pass-through entity for U.S federal income tax purposes) owns our common stock, the tax treatment of a partner or beneficial owner of the partnership or other pass-through entity may depend upon the status of the partner or beneficial owner, the activities of the partnership or entity and certain determinations made at the partner or beneficial owner level. Partners and beneficial owners in partnerships or other pass-through entities that own our common stock should consult their own tax advisors as to the particular U.S. federal income and estate tax consequences applicable to them.
This summary does not discuss all of the aspects of U.S. federal income and estate taxation that may be relevant to a non-U.S. holder in light of the non-U.S. holder's particular investment or other circumstances. In particular, this summary only addresses a non-U.S. holder that holds our common stock as a capital asset (generally, investment property) and does not address:
- •
- special U.S. federal income tax rules that may apply to particular non-U.S. holders, such as financial
institutions, insurance companies, tax-exempt organizations, and dealers and traders in stocks, securities or currencies;
- •
- non-U.S. holders holding our common stock as part of a conversion, constructive sale, wash sale or other
integrated transaction or a hedge, straddle or synthetic security;
- •
- any U.S. state and local or non-U.S. or other tax consequences; or
- •
- the U.S. federal income or estate tax consequences for the beneficial owners of a non-U.S. holder.
This summary is based on provisions of the Code, applicable U.S. Treasury regulations and administrative and judicial interpretations, all as in effect or in existence on the date of this prospectus. Subsequent developments in U.S. federal income or estate tax law, including changes in law or differing interpretations, which may be applied retroactively, could have a material effect on the U.S. federal
127
income and estate tax consequences of purchasing, owning and disposing of our common stock as set forth in this summary. Each non-U.S. holder should consult a tax advisor regarding the U.S. federal, state, local and non-U.S. income and other tax consequences of acquiring, holding and disposing of our common stock.
Dividends
In the event that we make a distribution to a non-U.S. holder with respect to our common stock that constitutes a dividend for U.S. federal income tax purposes, that is not effectively connected with a non-U.S. holder's conduct of a trade or business in the United States, a U.S. federal withholding tax at a rate of 30%, or a lower rate under an applicable income tax treaty, will be withheld from the gross amount of the dividends paid to such non-U.S. holder. A distribution will constitute a dividend for U.S. federal income tax purposes to the extent of our current or accumulated earnings and profits as determined for U.S. federal income tax purposes. Any distribution not constituting a dividend will be treated first as reducing the adjusted basis in the non-U.S. holder's shares of our common stock and, to the extent it exceeds the adjusted basis in the non-U.S. holder's shares of our common stock, as gain from the sale or exchange of such common stock.
In order to claim the benefit of an applicable income tax treaty, a non-U.S. holder will be required to provide:
- •
- a properly executed U.S. Internal Revenue Service Form W-8BEN (or other applicable form) in accordance
with the applicable certification and disclosure requirements. Special rules apply to partnerships and other pass-through entities and these certification and disclosure requirements also
may apply to beneficial owners of partnerships and other pass-through entities that hold our common stock, or
- •
- in the case of payments made outside the United States to an offshore account (generally, an account maintained by such non-U.S. holder at an office or branch of a bank or other financial institution at any location outside the United States), other documentary evidence establishing such non-U.S. holder's entitlement to the lower treaty rate in accordance with U.S. Treasury regulations.
A non-U.S. holder that is eligible for a reduced rate of U.S. federal withholding tax under an income tax treaty may obtain a refund or credit of any excess amounts withheld by timely filing an appropriate claim for a refund with the U.S. Internal Revenue Service. Non-U.S. holders should consult their own tax advisors regarding their entitlement to benefits under a relevant income tax treaty and the manner of claiming the benefits.
Dividends that are effectively connected with a non-U.S. holder's conduct of a trade or business in the United States and, if required by an applicable income tax treaty, are attributable to a permanent establishment maintained by the non-U.S. holder in the United States, will be taxed on a net income basis at the regular graduated rates and in the manner applicable to United States persons. In that case, the U.S. federal withholding tax discussed above will not apply if the non-U.S. holder provides a properly executed U.S. Internal Revenue Service Form W-8ECI (or other applicable form) in accordance with the applicable certification and disclosure requirements. In addition, a "branch profits tax" may be imposed at a 30% rate, or a lower rate under an applicable income tax treaty, on dividends received by a foreign corporation that are effectively connected with the conduct of a trade or business in the United States.
128
Gain on Disposition of Our Common Stock
A non-U.S. holder generally will not be taxed on any gain recognized on a disposition (or other transaction treated as a sale or exchange for U.S. federal income tax purposes) of our common stock unless:
- •
- the gain is effectively connected with the non-U.S. holder's conduct of a trade or business in the United
States and, if required by an applicable income tax treaty, is attributable to a permanent establishment maintained by the non-U.S. holder in the United States; in these cases, the gain
will be taxed on a net income basis at the regular graduated rates and in the manner applicable to United States persons (unless an applicable income tax treaty provides otherwise) and, if the
non-U.S. holder is a foreign corporation, the "branch profits tax" described above may also apply;
- •
- the non-U.S. holder is an individual who holds our common stock as a capital asset, is present in the United
States for more than 182 days in the taxable year of the disposition and meets other requirements (in which case, except as otherwise provided by an applicable income tax treaty, the gain,
which may be offset by U.S. source capital losses recognized in the same taxable year, generally will be subject to a flat 30% U.S. federal income tax, even though the non-U.S. holder is
not considered a resident alien under the Code); or
- •
- we are or have been a "U.S. real property holding corporation" for U.S. federal income tax purposes at any time during the shorter of the five-year period ending on the date of disposition or the period that the non-U.S. holder held our common stock.
Generally, a corporation is a "U.S. real property holding corporation" if the fair market value of its "U.S. real property interests" equals or exceeds 50% of the sum of the fair market value of its worldwide real property interests plus its other assets used or held for use in a trade or business. The tax relating to stock in a U.S. real property holding corporation generally will not apply to a non-U.S. holder whose holdings, direct and indirect, at all times during the applicable period, constituted 5% or less of our common stock, provided that our common stock was regularly traded on an established securities market. We believe that we are not currently, and we do not anticipate becoming in the future, a U.S. real property holding corporation.
Federal Estate Tax
Our common stock that is owned or treated as owned by an individual who is not a U.S. citizen or resident of the United States (as specially defined for U.S. federal estate tax purposes) at the time of death will be included in the individual's gross estate for U.S. federal estate tax purposes, unless an applicable estate tax or other treaty provides otherwise and, therefore, may be subject to U.S. federal estate tax.
Information Reporting and Backup Withholding
Dividends paid to a non-U.S. holder may be subject to U.S. information reporting and backup withholding. Copies of the information returns reporting such dividend payments and any withholding may also be made available to the tax authorities in the country in which such non-U.S. holder resides under the provisions of a treaty or agreement. A non-U.S. holder will be exempt from backup withholding if the non-U.S. holder provides a properly executed U.S. Internal Revenue Service Form W-8BEN or otherwise meets documentary evidence requirements for establishing its status as a non-U.S. holder or otherwise establishes an exemption.
The gross proceeds from the disposition of our common stock may be subject to U.S. information reporting and backup withholding. If a non-U.S. holder sells our common stock outside the United States through a non-U.S. office of a non-U.S. broker and the sales proceeds are paid to the
129
non-U.S. holder outside the United States, then the U.S. backup withholding and information reporting requirements generally will not apply to that payment. However, U.S. information reporting, but not U.S. backup withholding, will apply to a payment of sales proceeds, even if that payment is made outside the United States, if a non-U.S. holder sells our common stock through a non-U.S. office of a broker that is a United States person or has certain enumerated connections with the United States, unless the broker has documentary evidence in its files that the non-U.S. holder is not a United States person and certain other conditions are met or the non-U.S. holder otherwise establishes an exemption.
If a non-U.S. holder receives payments of the proceeds of a sale of our common stock to or through a U.S. office of a broker, the payment is subject to both U.S. backup withholding and information reporting unless the non-U.S. holder provides a properly executed U.S. Internal Revenue Service Form W-8BEN certifying that the non-U.S. Holder is not a "United States person" or the non-U.S. holder otherwise establishes an exemption.
A non-U.S. holder generally may obtain a refund of any amounts withheld under the backup withholding rules that exceed the non-U.S. holder's U.S. federal income tax liability by timely filing a refund claim with the U.S. Internal Revenue Service.
Additional Withholding Requirements
Under recently enacted legislation, the relevant withholding agent may be required to withhold 30% of any dividends and the proceeds of a sale of our common stock paid after December 31, 2012 to (i) a foreign financial institution (as defined pursuant to that legislation) unless such foreign financial institution agrees to verify, report and disclose its U.S. accountholders and meets certain other specified requirements or (ii) a non-financial foreign entity that is the beneficial owner of the payment unless such entity certifies that it does not have any substantial United States owners or provides the name, address and taxpayer identification number of each substantial United States owner and such entity meets certain other specified requirements. If payment of this withholding tax is made, non-U.S. holders that are otherwise eligible for an exemption from, or reduction of, U.S. withholding taxes with respect to such dividends or proceeds will be required to seek a credit or refund from the U.S. Internal Revenue Service to obtain the benefit of such exemption or reduction. Non-U.S. holders should contact their own tax advisors regarding the particular consequences to them of this legislation.
130
Merrill Lynch, Pierce, Fenner & Smith Incorporated and Deutsche Bank Securities Inc. are acting as representatives (the "representatives") of each of the underwriters named below. Subject to the terms and conditions set forth in a purchase agreement among us and the underwriters, we have agreed to sell to the underwriters, and each of the underwriters has agreed, severally and not jointly, to purchase from us the number of shares of common stock set forth opposite its name below.
| Underwriter |
Number of Shares |
|||
|---|---|---|---|---|
Merrill Lynch, Pierce, Fenner & Smith |
||||
Deutsche Bank Securities Inc. |
||||
Total |
||||
Subject to the terms and conditions set forth in the purchase agreement, the underwriters have agreed, severally and not jointly, to purchase all of the shares sold under the purchase agreement if any of these shares are purchased. If an underwriter defaults, the purchase agreement provides that the purchase commitments of the nondefaulting underwriters may be increased or the purchase agreement may be terminated.
We have agreed to indemnify the underwriters against certain liabilities, including liabilities under the Securities Act, or to contribute to payments the underwriters may be required to make in respect of those liabilities.
The underwriters are offering the shares, subject to prior sale, when, as and if issued to and accepted by them, subject to approval of legal matters by their counsel, including the validity of the shares, and other conditions contained in the purchase agreement, such as the receipt by the underwriters of officer's certificates and legal opinions. The underwriters reserve the right to withdraw, cancel or modify offers to the public and to reject orders in whole or in part.
Commissions and Discounts
The representatives have advised us that the underwriters propose initially to offer the shares to the public at the public offering price set forth on the cover page of this prospectus and to dealers at that price less a concession not in excess of $ per share. The underwriters may allow, and the dealers may reallow, a discount not in excess of $ per share to other dealers. After the initial offering, the public offering price, concession or any other term of the offering may be changed.
The following table shows the public offering price, underwriting discount and proceeds before expenses to us. The information assumes either no exercise or full exercise by the underwriters of their overallotment option.
| |
Per Share | Without Option | With Option | |||||||
|---|---|---|---|---|---|---|---|---|---|---|
Public offering price |
$ | $ | $ | |||||||
Underwriting discount |
$ | $ | $ | |||||||
Proceeds, before expenses, to us |
$ | $ | $ | |||||||
The expenses of the offering, not including the underwriting discount, are estimated at $ and are payable by us.
131
Overallotment Option
We have granted an option to the underwriters to purchase up to additional shares at the public offering price, less the underwriting discount. The underwriters may exercise this option for 30 days from the date of this prospectus solely to cover any overallotments. If the underwriters exercise this option, each will be obligated, subject to conditions contained in the purchase agreement, to purchase a number of additional shares proportionate to that underwriter's initial amount reflected in the above table.
Reserved Shares
At our request, the underwriters have reserved for sale, at the initial public offering price, up to shares offered by this prospectus for sale to some of our directors, officers, employees, distributors, dealers, business associates and related persons. If these persons purchase reserved shares, this will reduce the number of shares available for sale to the general public. Any reserved shares that are not so purchased will be offered by the underwriters to the general public on the same terms as the other shares offered by this prospectus.
No Sales of Similar Securities
We, our executive officers and directors and our other existing security holders have agreed not to sell or transfer any common stock or securities convertible into, exchangeable for, exercisable for, or repayable with common stock, for 180 days after the date of this prospectus without first obtaining the written consent of . Specifically, we and these other persons have agreed, with certain limited exceptions, not to directly or indirectly:
- •
- offer, pledge, sell or contract to sell any common stock,
- •
- sell any option or contract to purchase any common stock,
- •
- purchase any option or contract to sell any common stock,
- •
- grant any option, right or warrant for the sale of any common stock,
- •
- lend or otherwise dispose of or transfer any common stock,
- •
- request or demand that we file a registration statement related to the common stock, or
- •
- enter into any swap or other agreement that transfers, in whole or in part, the economic consequence of ownership of any common stock whether any such swap or transaction is to be settled by delivery of shares or other securities, in cash or otherwise.
This lock-up provision applies to common stock and to securities convertible into or exchangeable or exercisable for or repayable with common stock. It also applies to common stock owned now or acquired later by the person executing the agreement or for which the person executing the agreement later acquires the power of disposition. In the event that either (x) during the last 17 days of the lock-up period referred to above, we issue an earnings release or material news or a material event relating to us occurs or (y) prior to the expiration of the lock-up period, we announce that we will release earnings results or become aware that material news or a material event will occur during the 16-day period beginning on the last day of the lock-up period, the restrictions described above shall continue to apply until the expiration of the 18-day period beginning on the issuance of the earnings release or the occurrence of the material news or material event.
132
Listing
We intend to apply to list our common stock on the under the symbol "EMAX." In order to meet the requirements for listing on that exchange, the underwriters have undertaken to sell a minimum number of shares to a minimum number of beneficial owners as required by that exchange.
Before this offering, there has been no public market for our common stock. The initial public offering price will be determined through negotiations among us and the representatives. In addition to prevailing market conditions, the factors to be considered in determining the initial public offering price are:
- •
- the valuation multiples of publicly traded companies that the representatives believe to be comparable to us,
- •
- our financial information,
- •
- the history of, and the prospects for, our company and the industry in which we compete,
- •
- an assessment of our management, its past and present operations, and the prospects for, and timing of, our future
revenues, and
- •
- the above factors in relation to market values and various valuation measures of other companies engaged in activities similar to ours.
An active trading market for the shares may not develop. It is also possible that after the offering the shares will not trade in the public market at or above the initial public offering price.
The underwriters do not expect to sell more than 5% of the shares in the aggregate to accounts over which they exercise discretionary authority.
Price Stabilization, Short Positions and Penalty Bids
Until the distribution of the shares is completed, SEC rules may limit underwriters and selling group members from bidding for and purchasing our common stock. However, the representatives may engage in transactions that stabilize the price of the common stock, such as bids or purchases to peg, fix or maintain that price.
In connection with the offering, the underwriters may purchase and sell our common stock in the open market. These transactions may include short sales, purchases on the open market to cover positions created by short sales and stabilizing transactions. Short sales involve the sale by the underwriters of a greater number of shares than they are required to purchase in the offering. "Covered" short sales are sales made in an amount not greater than the underwriters' overallotment option described above. The underwriters may close out any covered short position by either exercising their overallotment option or purchasing shares in the open market. In determining the source of shares to close out the covered short position, the underwriters will consider, among other things, the price of shares available for purchase in the open market as compared to the price at which they may purchase shares through the overallotment option. "Naked" short sales are sales in excess of the overallotment option. The underwriters must close out any naked short position by purchasing shares in the open market. A naked short position is more likely to be created if the underwriters are concerned that there may be downward pressure on the price of our common stock in the open market after pricing that could adversely affect investors who purchase in the offering. Stabilizing transactions consist of various bids for or purchases of shares of common stock made by the underwriters in the open market prior to the completion of the offering.
The underwriters may also impose a penalty bid. This occurs when a particular underwriter repays to the underwriters a portion of the underwriting discount received by it because the
133
representatives have repurchased shares sold by or for the account of such underwriter in stabilizing or short covering transactions.
Similar to other purchase transactions, the underwriters' purchases to cover the syndicate short sales may have the effect of raising or maintaining the market price of our common stock or preventing or retarding a decline in the market price of our common stock. As a result, the price of our common stock may be higher than the price that might otherwise exist in the open market. The underwriters may conduct these transactions on the , in the over-the-counter market or otherwise.
Neither we nor any of the underwriters make any representation or prediction as to the direction or magnitude of any effect that the transactions described above may have on the price of our common stock. In addition, neither we nor any of the underwriters make any representation that the representatives will engage in these transactions or that these transactions, once commenced, will not be discontinued without notice.
Electronic Offer, Sale and Distribution of Shares
In connection with the offering, certain of the underwriters or securities dealers may distribute prospectuses by electronic means, such as e-mail. In addition, Merrill Lynch, Pierce, Fenner & Smith Incorporated may facilitate Internet distribution for this offering to certain of its Internet subscription customers. Merrill Lynch, Pierce, Fenner & Smith Incorporated may allocate a limited number of shares for sale to its online brokerage customers. An electronic prospectus is available on the Internet web site maintained by Merrill Lynch, Pierce, Fenner & Smith Incorporated. Other than the prospectus in electronic format, the information on the Merrill Lynch, Pierce, Fenner & Smith Incorporated web site is not part of this prospectus.
Other Relationships
Some of the underwriters and their affiliates have engaged in, and may in the future engage in, investment banking and other commercial dealings in the ordinary course of business with us or our affiliates. They have received, or may in the future receive, customary fees and commissions for these transactions.
Notice to Prospective Investors in the European Economic Area ("EEA")
In relation to each Member State of the EEA which has implemented the Prospectus Directive (each, a "Relevant Member State") an offer to the public of any shares which are the subject of the offering contemplated by this prospectus may not be made in that Relevant Member State, except that an offer to the public in that Relevant Member State of any shares may be made at any time under the following exemptions under the Prospectus Directive, if they have been implemented in that Relevant Member State:
- (a)
- to
legal entities which are authorized or regulated to operate in the financial markets or, if not so authorized or regulated, whose corporate purpose is
solely to invest in securities;
- (b)
- to
any legal entity which has two or more of (1) an average of at least 250 employees during the last financial year; (2) a total balance
sheet of more than €43,000,000 and (3) an annual net turnover of more than €50,000,000, as shown in its last annual or consolidated accounts;
- (c)
- by the underwriters to fewer than 100 natural or legal persons (other than "qualified investors" as defined in the Prospectus Directive) subject to obtaining the prior consent of the representatives for any such offer; or
134
- (d)
- in any other circumstances falling within Article 3(2) of the Prospectus Directive;
provided that no such offer of shares shall result in a requirement for the publication by us or any underwriter of a prospectus pursuant to Article 3 of the Prospectus Directive.
For the purposes of this provision the expression an "offer to the public" in relation to any shares in any Relevant Member State means the communication in any form and by any means of sufficient information on the terms of the offer and any shares to be offered so as to enable an investor to decide to purchase any shares, as the same may be varied in that Member State by any measure implementing the Prospectus Directive in that Member State and the expression "Prospectus Directive" means Directive 2003/71/EC and includes any relevant implementing measure in each Relevant Member State.
This prospectus has been prepared on the basis that all offers of shares will be made pursuant to an exemption under the Prospectus Directive, as implemented in Member States of the EEA, from the requirement to produce a prospectus for offers of shares. Accordingly, any person making or intending to make any offer of shares within the EEA which are the subject of the offering contemplated in this prospectus should only do so in circumstances in which no obligation arises for us or any of the underwriters to produce a prospectus for such offer. Neither we nor the underwriters have authorized, nor do they authorize, the making of any offer of shares through any financial intermediary, other than offers made by the underwriters which constitute the final offering of shares contemplated in this prospectus.
Each person in a Relevant Member State who receives any communication in respect of, or who acquires any shares under, the offer of shares contemplated by this prospectus will be deemed to have represented, warranted and agreed to and with us and each underwriter that:
- (A)
- it
is a qualified investor within the meaning of the law in that Relevant Member State implementing Article 2(1)(e) of the Prospectus Directive; and
- (B)
- in the case of any shares acquired by it as a financial intermediary, as that term is used in Article 3(2) of the Prospectus Directive, (i) the shares acquired by it in the offering have not been acquired on behalf of, nor have they been acquired with a view to their offer or resale to, persons in any Relevant Member State other than qualified investors (as defined in the Prospectus Directive), or in circumstances in which the prior consent of the representatives has been given to the offer or resale; or (ii) where shares have been acquired by it on behalf of persons in any Relevant Member State other than qualified investors, the offer of those shares to it is not treated under the Prospectus Directive as having been made to such persons.
For the purposes of this representation, the expression an "offer of shares to the public" in relation to any shares in any Relevant Member State means the communication in any form and by any means of sufficient information on the terms of the offer and any shares to be offered so as to enable an investor to decide to purchase or subscribe for the shares, as the same may be varied in that Relevant Member State by any measure implementing the Prospectus Directive in that Relevant Member State and the expression "Prospectus Directive" means Directive 2003/71/EC and includes any relevant implementing measure in each Relevant Member State.
In addition, in the United Kingdom, this document is being distributed only to, and is directed only at, (i) investment professionals falling within Article 19(5) of the Financial Services and Markets Act 2000 (Financial Promotion) Order 2005, as amended (the "Order"), (ii) high net worth entities (or persons to whom it may otherwise be lawfully communicated) falling within Article 49(2)(a) to (d) of the Order, or (iii) other persons to whom it may lawfully be communicated in accordance with the Order (all such persons together being referred to as "relevant persons"). This document must not be acted on or relied on in the United Kingdom by persons who are not relevant persons. In the United
135
Kingdom, any investment or investment activity to which this document relates is only available to, and will be engaged in with, relevant persons.
Notice to Prospective Investors in Switzerland
This document, as well as any other material relating to the shares which are the subject of the offering contemplated by this prospectus, do not constitute an issue prospectus pursuant to Article 652a and/or 1156 of the Swiss Code of Obligations. The shares will not be listed on the SIX Swiss Exchange and, therefore, the documents relating to the shares, including, but not limited to, this document, do not claim to comply with the disclosure standards of the listing rules of SIX Swiss Exchange and corresponding prospectus schemes annexed to the listing rules of the SIX Swiss Exchange. The shares are being offered in Switzerland by way of a private placement, i.e., to a small number of selected investors only, without any public offer and only to investors who do not purchase the shares with the intention to distribute them to the public. The investors will be individually approached by the issuer from time to time. This document, as well as any other material relating to the shares, is personal and confidential and do not constitute an offer to any other person. This document may only be used by those investors to whom it has been handed out in connection with the offering described herein and may neither directly nor indirectly be distributed or made available to other persons without express consent of the issuer. It may not be used in connection with any other offer and shall in particular not be copied and/or distributed to the public in (or from) Switzerland.
Notice to Prospective Investors in the Dubai International Financial Centre
This document relates to an exempt offer in accordance with the Offered Securities Rules of the Dubai Financial Services Authority. This document is intended for distribution only to persons of a type specified in those rules. It must not be delivered to, or relied on by, any other person. The Dubai Financial Services Authority has no responsibility for reviewing or verifying any documents in connection with exempt offers. The Dubai Financial Services Authority has not approved this document nor taken steps to verify the information set out in it, and has no responsibility for it. The shares which are the subject of the offering contemplated by this prospectus may be illiquid and/or subject to restrictions on their resale. Prospective purchasers of the shares offered should conduct their own due diligence on the shares. If you do not understand the contents of this document you should consult an authorised financial adviser.
136
The validity of the shares of common stock offered by this prospectus will be passed upon for our company by Fried, Frank, Harris, Shriver & Jacobson LLP, New York, New York. Sidley Austin LLP, New York, New York, is acting as counsel to the underwriters.
The consolidated financial statements of Euramax Holdings, Inc. and subsidiaries as of December 25, 2009 and December 26, 2008 and for each of the three years in the period ended December 25, 2009 appearing in this prospectus and the registration statement of which this prospectus forms a part have been audited by Ernst & Young LLP, independent registered public accounting firm, as set forth in their report thereon appearing elsewhere herein and are included in reliance upon such report given on the authority of such firm as experts in accounting and auditing.
WHERE YOU CAN FIND MORE INFORMATION
We have filed with the United States Securities and Exchange Commission a registration statement on Form S-1 under the Securities Act relating to the common stock that includes important business and financial information about us that is not included in or delivered with this prospectus. If we have made references in this prospectus to any contracts, agreements or other documents and also filed any of those contracts, agreements or other documents as exhibits to the registration statement, you should read the relevant exhibit for a more complete understanding of the document or the matter involved.
As a result of this offering, we will become subject to the information and reporting requirements of the Exchange Act, as amended, and in accordance therewith, will file periodic reports, proxy statements and other information with the SEC. We will file annual, quarterly and special reports and other information with the SEC. Our filings with the SEC will be available to the public on the SEC's website at http://www.sec.gov. Those filings will also be available to the public free of charge on our corporate web site at http://www.euramax.com. The information we file with the SEC or contained on our corporate web site or any other web site that we may maintain is not part of this prospectus, any prospectus supplement or the registration statement of which this prospectus is a part. You may also read and copy, at SEC prescribed rates, any document we file with the SEC, including the registration statement (and its exhibits) of which this prospectus is a part, at the SEC's Public Reference Room located at 100 F Street, N.E., Washington, D.C. 20549. You can call the SEC at 1-800-SEC-0330 to obtain information on the operation of the Public Reference Room.
137
Euramax Holdings, Inc. and Subsidiaries
Audited Consolidated Financial Statements: |
||
Report of Ernst & Young LLP, Independent Registered Public Accounting Firm |
F-2 | |
Consolidated Balance Sheets |
F-3 | |
Consolidated Statements of Operations |
F-4 | |
Consolidated Statements of Changes in Equity (Deficit) |
F-5 | |
Consolidated Statements of Cash Flows |
F-6 | |
Notes to Consolidated Financial Statements |
F-7 | |
Unaudited Condensed Consolidated Financial Statements: |
||
Condensed Consolidated Balance Sheets |
F-47 | |
Condensed Consolidated Statements of Operations |
F-48 | |
Condensed Consolidated Statements of Cash Flows |
F-49 | |
Notes to Condensed Consolidated Financial Statements (unaudited) |
F-50 | |
Financial Statement Schedules: |
||
Schedule I—Condensed Financial Information Euramax Holdings, Inc. (Parent Company Only) |
F-62 |
F-1
REPORT OF INDEPENDENT REGISTERED PUBLIC ACCOUNTING FIRM
The
Board of Directors and Shareholders of
Euramax Holdings, Inc. and Subsidiaries
We have audited the accompanying consolidated balance sheets of Euramax Holdings, Inc. and Subsidiaries as of December 25, 2009 and December 26, 2008, and the related consolidated statements of operations, changes in equity (deficit) and cash flows for each of the three years in the period ended December 25, 2009. Our audits also included the financial statement schedule listed in the Index at Item 16(b). These financial statements and schedule are the responsibility of the Company's management. Our responsibility is to express an opinion on these financial statements and schedule based on our audits.
We conducted our audits in accordance with standards of the Public Company Accounting Oversight Board (United States). Those standards require that we plan and perform the audit to obtain reasonable assurance about whether the financial statements are free of material misstatement. We were not engaged to perform an audit of the Company's internal control over financial reporting. Our audits included consideration of internal control over financial reporting as a basis for designing audit procedures that are appropriate in the circumstances, but not for the purpose of expressing an opinion on the effectiveness of the Company's internal control over financial reporting. Accordingly, we express no such opinion. An audit also includes examining, on a test basis, evidence supporting the amounts and disclosures in the financial statements, assessing the accounting principles used and significant estimates made by management, and evaluating the overall financial statement presentation. We believe that our audits provide a reasonable basis for our opinion.
In our opinion, the financial statements referred to above present fairly, in all material respects, the consolidated financial position of Euramax Holdings, Inc. and Subsidiaries at December 25, 2009 and December 26, 2008, and the consolidated results of their operations and their cash flows for each of the three years in the period ended December 25, 2009, in conformity with U.S. generally accepted accounting principles. Also, in our opinion, the related financial statement schedule, when considered in relation to the basic financial statements taken as a whole, presents fairly in all material respects the information set forth therein.
As discussed in Notes 2, 11 and 13 to the consolidated financial statements, in 2009 the Company retrospectively adopted Financial Accounting Standards Board (FASB) Interpretation No. 48, Accounting for Uncertainties in Income Taxes—an interpretation of FASB No. 109 (codified in the FASB Accounting Standards Codification (ASC) Topic 740 Income Taxes) effective December 30, 2006 and the Company adopted Statement of Financial Accounting Standards No. 158, Employers' Accounting for Defined Benefit Pension and Other Postretirement Plans (codified in FASB ASC Topic 715 Compensation—Retirement Benefits) effective December 28, 2007.

Atlanta,
Georgia
July 22, 2010
F-2
EURAMAX HOLDINGS, INC. AND SUBSIDIARIES
CONSOLIDATED BALANCE SHEETS
(in thousands, except share data)
| |
December 25, 2009 |
December 26, 2008 |
||||||
|---|---|---|---|---|---|---|---|---|
Assets |
||||||||
Current assets: |
||||||||
Cash and cash equivalents |
$ | 69,944 | $ | 48,658 | ||||
Accounts receivable, less allowance for doubtful accounts (2009—$7,213; 2008—$7,194) |
89,924 | 107,699 | ||||||
Inventories, net |
79,195 | 120,428 | ||||||
Income taxes receivable |
4,250 | 9,189 | ||||||
Deferred income taxes |
5,478 | 11,512 | ||||||
Other current assets |
3,100 | 2,744 | ||||||
Assets related to discontinued operations |
2,327 | 5,098 | ||||||
Total current assets |
254,218 | 305,328 | ||||||
Property, plant, and equipment, net |
169,448 |
185,084 |
||||||
Goodwill, net |
208,474 | 205,012 | ||||||
Customer relationships, net |
109,314 | 129,135 | ||||||
Other intangible assets, net |
9,862 | 10,936 | ||||||
Deferred income taxes |
2,327 | — | ||||||
Other assets |
4,983 | 6,471 | ||||||
Total assets |
$ | 758,626 | $ | 841,966 | ||||
Liabilities and shareholders' equity (deficit) |
||||||||
Current liabilities: |
||||||||
Cash overdrafts |
$ | 8 | $ | 11 | ||||
Accounts payable |
55,335 | 59,623 | ||||||
Accrued expenses |
31,992 | 31,936 | ||||||
Accrued interest payable |
2,403 | 8,017 | ||||||
Deferred income taxes |
638 | 927 | ||||||
Liabilities related to discontinued operations |
449 | 2,332 | ||||||
Current maturities of long-term debt (Note 7) |
— | 34,633 | ||||||
Total current liabilities |
90,825 | 137,479 | ||||||
Long-term debt, less current maturities (includes related party notes of $186,954 in 2008) (Note 7) |
525,319 | 850,107 | ||||||
Deferred income taxes |
45,381 | 34,292 | ||||||
Other liabilities |
50,041 | 79,370 | ||||||
Total liabilities |
711,566 | 1,101,248 | ||||||
Commitments and contingencies (Note 14) |
||||||||
Shareholders' equity (deficit): |
||||||||
Class A common stock—$1.00 par value; 600,000 shares authorized, 178,263 issued and outstanding in 2009, 160,845 issued and outstanding in 2008 |
178 | 161 | ||||||
Class B convertible common stock—$1.00 par value; 600,000 shares authorized, no shares issued in 2009 and 2008 |
||||||||
Additional paid-in capital |
713,460 | 323,930 | ||||||
Accumulated loss |
(680,830 | ) | (595,202 | ) | ||||
Accumulated other comprehensive income |
14,252 | 11,829 | ||||||
Total shareholders' equity (deficit) |
47,060 | (259,282 | ) | |||||
Total liabilities and shareholders' equity (deficit) |
$ | 758,626 | $ | 841,966 | ||||
See accompanying notes.
F-3
EURAMAX HOLDINGS, INC. AND SUBSIDIARIES
CONSOLIDATED STATEMENTS OF OPERATIONS
(in thousands, except share data)
| |
Year Ended December 25, 2009 |
Year Ended December 26, 2008 |
Year Ended December 28, 2007 |
||||||||
|---|---|---|---|---|---|---|---|---|---|---|---|
Net sales |
$ | 812,055 | $ | 1,173,493 | $ | 1,245,631 | |||||
Costs and expenses: |
|||||||||||
Cost of goods sold (excluding depreciation and amortization) |
675,126 | 1,009,392 | 1,052,838 | ||||||||
Selling and general (excluding depreciation and amortization) |
91,802 | 110,608 | 101,189 | ||||||||
Debt restructuring and forbearance expenses |
13,307 | 3,798 | — | ||||||||
Depreciation and amortization |
39,721 | 55,348 | 57,590 | ||||||||
Goodwill and other impairments |
3,516 | 401,376 | — | ||||||||
(Loss) income from operations |
(11,417 | ) | (407,029 | ) | 34,014 | ||||||
Interest expense (includes related party interest expense of $8,427, $15,904, and $17,900 in 2009, 2008, and 2007) |
(84,204 | ) | (109,527 | ) | (84,923 | ) | |||||
Gain on extinguishment of debt |
8,723 | — | — | ||||||||
Other income (loss), net |
1,303 | (22,716 | ) | 5,143 | |||||||
Loss from continuing operations before income taxes |
(85,595 | ) | (539,272 | ) | (45,766 | ) | |||||
Benefit for income taxes |
(1,297 | ) | (61,078 | ) | (2,529 | ) | |||||
Loss from continuing operations |
(84,298 | ) | (478,194 | ) | (43,237 | ) | |||||
Loss from discontinued operations, net of tax |
(1,330 | ) | (22,413 | ) | (6,194 | ) | |||||
Net loss |
$ | (85,628 | ) | $ | (500,607 | ) | $ | (49,431 | ) | ||
Basic and diluted net loss per share |
|||||||||||
Loss from continuting operations |
$ | (472.89 | ) | $ | (2,682.52 | ) | $ | (242.54 | ) | ||
Loss from discontinued operations |
(7.46 | ) | (125.73 | ) | (34.75 | ) | |||||
Basic and diluted net loss per share |
$ | (480.35 | ) | $ | (2,808.25 | ) | $ | (277.29 | ) | ||
Weighted average number of shares |
|||||||||||
Basic and diluted |
178,263 | 178,263 | 178,263 | ||||||||
See accompanying notes.
F-4
EURAMAX HOLDINGS, INC. AND SUBSIDIARIES
CONSOLIDATED STATEMENTS OF CHANGES IN EQUITY (DEFICIT)
(in thousands)
| |
Common Stock |
Additional Paid-in Capital |
Accumulated Loss |
Accumulated Other Comprehensive Income |
Totals | ||||||||||||
|---|---|---|---|---|---|---|---|---|---|---|---|---|---|---|---|---|---|
Balance at December 29, 2006 |
$ | 161 | $ | 321,898 | $ | (22,003 | ) | $ | 20,220 | $ | 320,276 | ||||||
Comprehensive loss: |
|||||||||||||||||
Net loss |
— | — | (49,431 | ) | — | (49,431 | ) | ||||||||||
Foreign currency translation adjustment |
— | — | — | 26,742 | 26,742 | ||||||||||||
Pension liability adjustments, net of taxes |
— | — | — | 58 | 58 | ||||||||||||
Loss on derivative instruments, net of taxes |
— | — | — | (7,340 | ) | (7,340 | ) | ||||||||||
Comprehensive loss |
(29,971 | ) | |||||||||||||||
Impact of adopting certain provisions of ASC 715 |
— | — | — | 5,520 | 5,520 | ||||||||||||
Impact of adopting certain provisions of ASC 740 |
— | — | (23,161 | ) | — | (23,161 | ) | ||||||||||
Share-based compensation |
— | 1,107 | — | — | 1,107 | ||||||||||||
Balance at December 28, 2007 |
161 | 323,005 | (94,595 | ) | 45,200 | 273,771 | |||||||||||
Comprehensive loss: |
|||||||||||||||||
Net loss |
— | — | (500,607 | ) | — | (500,607 | ) | ||||||||||
Foreign currency translation adjustment |
— | — | — | (21,325 | ) | (21,325 | ) | ||||||||||
Pension liability adjustments, net of taxes |
— | — | — | (10,564 | ) | (10,564 | ) | ||||||||||
Loss on derivative instruments, net of taxes |
— | — | — | (1,482 | ) | (1,482 | ) | ||||||||||
Comprehensive loss |
(533,978 | ) | |||||||||||||||
Share-based compensation |
— | 925 | — | — | 925 | ||||||||||||
Balance at December 26, 2008 |
161 | 323,930 | (595,202 | ) | 11,829 | (259,282 | ) | ||||||||||
Comprehensive loss: |
|||||||||||||||||
Net loss |
— | — | (85,628 | ) | — | (85,628 | ) | ||||||||||
Foreign currency translation adjustment |
— | — | — | 2,084 | 2,084 | ||||||||||||
Pension liability adjustments, net of taxes |
— | — | — | (2,692 | ) | (2,692 | ) | ||||||||||
Amortization of losses on derivative instruments, net of taxes |
— | — | — | 3,031 | 3,031 | ||||||||||||
Comprehensive loss |
(83,205 | ) | |||||||||||||||
Restructuring of long-term debt |
— | 386,662 | — | — | 386,662 | ||||||||||||
Cancellation of issued shares related to the Restructuring |
(161 | ) | 161 | — | — | — | |||||||||||
Issuance of shares related to the Restructuring |
178 | (178 | ) | — | — | — | |||||||||||
Share-based compensation |
— | 2,885 | — | — | 2,885 | ||||||||||||
Balance at December 25, 2009 |
$ | 178 | $ | 713,460 | $ | (680,830 | ) | $ | 14,252 | $ | 47,060 | ||||||
See accompanying notes.
F-5
EURAMAX HOLDINGS, INC. AND SUBSIDIARIES
CONSOLIDATED STATEMENTS OF CASH FLOWS
(in thousands)
| |
Year Ended December 25, 2009 |
Year Ended December 26, 2008 |
Year Ended December 28, 2007 |
|||||||||
|---|---|---|---|---|---|---|---|---|---|---|---|---|
Operating activities |
||||||||||||
Net loss |
$ | (85,628 | ) | $ | (500,607 | ) | $ | (49,431 | ) | |||
Reconciliation of net loss to net cash provided by (used in) operating activities: |
||||||||||||
Depreciation and amortization |
39,721 | 58,607 | 60,240 | |||||||||
Amortization of deferred finance fees |
2,761 | 23,258 | 3,379 | |||||||||
Goodwill and other impairments |
3,516 | 407,174 | — | |||||||||
Gain on extinguishment of Second Lien debt facility |
(8,723 | ) | — | — | ||||||||
Pay-in-kind interest |
20,494 | 15,904 | 17,900 | |||||||||
Accrued interest and fees capitalized into first lien debt |
16,956 | — | — | |||||||||
Share-based compensation |
2,885 | 925 | 1,107 | |||||||||
Provision for doubtful accounts |
2,641 | 9,012 | 2,028 | |||||||||
Foreign exchange (gain) loss |
(3,856 | ) | 10,710 | (2,808 | ) | |||||||
(Gain) loss on sale of assets |
(151 | ) | (347 | ) | 908 | |||||||
Loss on assets held for sale |
— | 216 | — | |||||||||
Loss on interest rate swaps |
8,568 | 10,168 | — | |||||||||
Deferred income taxes |
9,658 | (69,296 | ) | (14,696 | ) | |||||||
Changes in operating assets and liabilities, net of acquisitions |
||||||||||||
Accounts receivable |
17,941 | 36,625 | 6,962 | |||||||||
Inventories |
45,075 | 44,982 | 27,324 | |||||||||
Other current assets |
(307 | ) | 1,090 | 1,117 | ||||||||
Accounts payable and other current liabilities |
(1,360 | ) | (62,459 | ) | 7,819 | |||||||
Income taxes payable |
(10,930 | ) | (14,896 | ) | 5,474 | |||||||
Other noncurrent assets and liabilities |
221 | 12,479 | 7,593 | |||||||||
Net cash provided by (used in) operating activities |
59,482 | (16,455 | ) | 74,916 | ||||||||
Investing activities |
||||||||||||
Proceeds from sale of assets |
2,325 | 8,040 | 1,171 | |||||||||
Purchases of businesses |
— | — | (29,992 | ) | ||||||||
Capital expenditures |
(4,351 | ) | (14,824 | ) | (21,255 | ) | ||||||
Net cash used in investing activities |
(2,026 | ) | (6,784 | ) | (50,076 | ) | ||||||
Financing activities |
||||||||||||
Changes in cash overdrafts |
(3 | ) | (175 | ) | (2,226 | ) | ||||||
Net (repayments) borrowings on First Lien Credit Facility |
(1,053 | ) | 72,911 | (36,597 | ) | |||||||
Net repayments on accounts receivable securitization facility |
(34,633 | ) | (5,367 | ) | (9,955 | ) | ||||||
Borrowings under Equity Sponsor PIK Notes |
— | — | 22,500 | |||||||||
Deferred financing fees |
(240 | ) | (7,771 | ) | (1,615 | ) | ||||||
Net cash (used in) provided by financing activities |
(35,929 | ) | 59,598 | (27,893 | ) | |||||||
Effect of exchange rate changes on cash |
(241 | ) | 4,027 | (5,100 | ) | |||||||
Net increase in cash and cash equivalents |
21,286 | 40,386 | (8,153 | ) | ||||||||
Cash and cash equivalents at beginning of period |
48,658 | 8,272 | 16,425 | |||||||||
Cash and cash equivalents at end of period |
$ | 69,944 | $ | 48,658 | $ | 8,272 | ||||||
Supplemental cash flow information |
||||||||||||
Income taxes paid (received), net |
$ | (5,802 | ) | $ | 4,898 | $ | 881 | |||||
Interest paid, net |
$ | 45,174 | $ | 76,284 | $ | 55,327 | ||||||
Significant noncash financing activities |
||||||||||||
Settlement of Second Lien Credit Facility in exchange for common stock |
$ | 202,912 | $ | — | $ | — | ||||||
Cancellation of Equity Sponsor Pay-in-Kind (PIK) Notes |
$ | 196,783 | $ | — | $ | — | ||||||
Issuance of First Lien Debt to settle interest rate swaps, accrued interest and issuance fees |
$ | 35,053 | $ | — | $ | — | ||||||
See accompanying notes.
F-6
EURAMAX HOLDINGS, INC. AND SUBSIDIARIES
NOTES TO CONSOLIDATED FINANCIAL STATEMENTS
(in thousands except share data)
1. Basis of Presentation
Nature of Operations and Organization
Euramax Holdings, Inc. and Subsidiaries (Euramax or the Company) is an international producer of residential and non-residential building materials and recreational vehicle, or RV, exterior components. The Company's core building products include aluminum, steel, vinyl and copper roof drainage products, steel roofing and siding and specialty coated aluminum coil. The Company's core RV products include aluminum siding, roofing and doors. In addition, the Company sells an extensive line of accessory products, including roofing and siding hardware, trim parts and roof drainage accessories. The Company sells its products to a wide range of customers, including distributors, contractors, and home improvement retailers, as well as RV and transportation original equipment manufacturers, or OEMs. The Company's manufacturing and distribution network consists of 44 strategically located facilities, of which 38 are located in North America and 6 are located in Europe. The Company's sales are somewhat seasonal, with the second and third quarters typically accounting for the highest sales volumes.
For periods prior to June 29, 2009, Euramax was owned by GS Capital Partners V Fund L.P., GS Capital Partners 2000 L.P., and their affiliated private equity funds (collectively, the Equity Sponsors), and certain members of the Company's management. The recessionary economic environment of 2008 and 2009 contributed to significant declines in the Company's net sales and operating results. These declines limited the Company's ability to comply with financial covenants required by its various debt agreements. As an alternative to other remedies available, the Company, its lenders and shareholders agreed to a debt restructuring that was effective on June 29, 2009. In connection with the restructuring of debt issued by Euramax and its subsidiaries, approximately $196.8 million of principal and interest on PIK Notes held by the Equity Sponsor was cancelled and the Equity Sponsors and management shareholders conveyed ownership of their shares of Euramax to lenders under the Second Lien Credit Agreement in exchange for the cancellation of debt and accrued interest totaling $202.9 million. See Note 7 for further discussion on the restructuring of debt issued by Euramax and its subsidiaries.
Principles of Consolidation
The consolidated financial statements of the Company are prepared in conformity with U.S. generally accepted accounting principles and include the accounts of the Company and all its subsidiaries. All significant intercompany accounts and transactions have been eliminated in consolidation.
2. Summary of Significant Accounting Policies
Fiscal Year
The Company operates on a 52 or 53 week fiscal year ending on the last Friday in December. The Company's 2009, 2008, and 2007 fiscal years consisted of 52 weeks.
Use of Estimates and Assumptions
The preparation of financial statements in conformity with U.S. generally accepted accounting principles requires management to make estimates and assumptions that may affect the reported amounts of certain assets, liabilities, revenues and expenses and disclosure of contingencies in the Company's consolidated financial statements. Although these estimates and assumptions are based on
F-7
EURAMAX HOLDINGS, INC. AND SUBSIDIARIES
NOTES TO CONSOLIDATED FINANCIAL STATEMENTS (Continued)
(in thousands except share data)
2. Summary of Significant Accounting Policies (Continued)
the Company's knowledge of current events and actions the Company may take in the future, actual results could ultimately differ from those estimates and assumptions, and the differences could be material.
Cash and Cash Equivalents
The Company considers all highly liquid investments with an initial maturity of three months or less to be cash equivalents. Certain cash overdrafts of the Company have been netted with positive cash balances held with the same financial institutions.
Trade Accounts Receivable
Trade accounts receivable are recorded at net realizable value. This value includes an allowance for doubtful accounts based on historical experience, the level of past-due accounts based on the contractual terms of the receivables, current economic conditions and an evaluation of the customers' credit worthiness, which is charged to the provision for doubtful accounts. Accounts receivable are charged off against the allowance for doubtful accounts when it is probable that the receivable will not be recovered.
Activity in the allowance for doubtful accounts was as follows:
| |
2009 | 2008 | 2007 | |||||||
|---|---|---|---|---|---|---|---|---|---|---|
Balance, beginning of year |
$ | 7,194 | $ | 2,394 | $ | 2,519 | ||||
Net charges to costs and expenses |
2,562 | 8,440 | 1,311 | |||||||
Write-offs, net of recoveries |
(2,596 | ) | (3,457 | ) | (1,513 | ) | ||||
Foreign currency translation |
53 | (183 | ) | 77 | ||||||
Balance, end of year |
$ | 7,213 | $ | 7,194 | $ | 2,394 | ||||
Inventories
Inventories are stated at the lower of cost or market, with cost determined under the first-in, first-out (FIFO) method. Cost of manufactured inventory includes direct labor and manufacturing overhead. Market with respect to all inventories is replacement cost subject to a floor for an approximate normal profit margin on disposition. Abnormal amounts of idle facility expense, freight, handling costs, and wasted materials are recorded as current period charges. The allocation of fixed production overheads to inventory is based on the normal capacity of the production facilities.
Property, Plant, and Equipment
Property, plant, and equipment is recorded at cost. Cost of property, plant, and equipment acquired in a business combination is recorded at fair value based on the age and current replacement cost for similar assets on the date of the acquisition. Repair and maintenance costs are generally expensed unless they extend the useful lives of assets. Depreciation of property, plant, and equipment is computed principally on the straight-line method over the estimated useful lives of the assets ranging from 3 to 37 years for equipment and from 17 to 25 years for buildings. Gains and losses related to the disposition of property, plant, and equipment are charged to other income or expense when incurred. Also, when events or changes in circumstances indicate that the carrying value of an asset may not be recoverable, management assesses whether there has been an impairment in the value of the asset by
F-8
EURAMAX HOLDINGS, INC. AND SUBSIDIARIES
NOTES TO CONSOLIDATED FINANCIAL STATEMENTS (Continued)
(in thousands except share data)
2. Summary of Significant Accounting Policies (Continued)
comparing the estimated undiscounted future cash flows expected to result from the use of the asset and its eventual disposition to the carrying amount of the asset. If the expected future cash flows are less than the carrying amount of the asset, an impairment loss is recognized based on the excess of the asset's carrying value over its fair value. Fair value is estimated based on discounted cash flows, independent appraisals or comparable market transactions.
Goodwill and Intangible Assets
Goodwill represents the excess of the purchase price in a business combination over the fair value of net tangible and identifiable intangible assets acquired. Goodwill has been assigned to multiple reporting units at either the operating segment, or one level below, primarily based upon the nature of discrete businesses comprising the Company's operations. Goodwill is tested for impairment annually on the last day of the Company's fiscal year, or more frequently, if events or circumstances indicate the potential for impairment. In 2008, the Company's testing indicated that the net carrying value of its six reporting units exceeded their fair values. Accordingly, the Company proceeded to determine the implied fair value of goodwill for comparison to recorded amounts. The Company recorded an impairment charge of approximately $345.0 million in 2008. The implied fair value of goodwill was determined by estimating the fair value of the reporting units and allocating such value to the tangible and identifiable intangible assets of each reporting unit. The Company's fair value estimate was based upon estimates of the future cash flows of the reporting units and market valuations of comparable companies. Significant judgments were made in estimating the future cash flows of the reporting units and determining comparable companies upon which fair values of the Company's reporting units were based. No goodwill impairment charges were recorded based upon impairment testing performed as of December 25, 2009.
The Company has recognized intangible assets, apart from goodwill, acquired in business combinations and resulting from certain shareholder transactions, at fair value on the date of the transactions. Indefinite lived intangible assets are not amortized, but are tested for impairment annually on the last day of the Company's fiscal year, or more frequently if events or circumstances indicate the potential for impairment. The Company amortizes its intangible assets with finite lives over their useful lives based upon the pattern in which the economic benefits of the intangible assets are recognized. If that pattern cannot be determined, a straight-line amortization method is used. Intangible assets with finite lives are tested for impairment when there are indications that the carrying amount of an intangible asset may not be recoverable. The Company utilizes an income approach to estimate the fair value of its definite and indefinite lived intangible assets to test for impairment.
Impairment charges on goodwill and intangible assets are recorded in goodwill and other impairments in the consolidated statement of operations. The 2008 impairments of goodwill, trade names and customer relationships resulted from broad declines in the Company's estimate of cash flows to be derived from future sales. See Note 6 for further disclosures related to goodwill and other intangible assets.
Income Taxes
The Company accounts for income taxes using the asset and liability method of accounting. Under the asset and liability method, deferred income taxes are recognized for the tax consequences of "temporary differences" by applying enacted statutory tax rates applicable for future years to differences between financial statement and tax bases of existing assets and liabilities. Valuation
F-9
EURAMAX HOLDINGS, INC. AND SUBSIDIARIES
NOTES TO CONSOLIDATED FINANCIAL STATEMENTS (Continued)
(in thousands except share data)
2. Summary of Significant Accounting Policies (Continued)
allowances are established if the Company believes it is more likely than not that some or all of deferred tax assets will not be realized. A tax benefit is not recognized unless the Company concludes that it is more likely than not that the benefit will be sustained on audit by the taxing authority based solely on the technical merits of the associated tax position. If the recognition threshold is met a tax benefit is recognized and measured as the largest amount of the tax benefit that in the Company's judgment is greater than 50 percent likely to be realized. Interest and penalties related to unrecognized tax positions are recorded in provision (benefit) for income taxes in the accompanying Consolidated Statements of Operations. See Note 11 for further disclosures related to income taxes.
Financial Instruments and Risk Management
All derivative instruments are recognized on the balance sheet at fair value. The accounting for changes in the fair value of a derivative instrument depends on whether it has been designated and qualifies as part of a hedging relationship and the type of hedging relationship. Derivative instruments that qualify as hedging instruments are designated based upon the exposure being hedged, as a fair value hedge, cash flow hedge or a hedge of net investment in a foreign operation. For derivative instruments that are designated and qualify as a fair value hedge, the gain or loss on the derivative instrument as well as the offsetting gain or loss on the hedged item attributable to the hedged risk is recognized in current earnings during the period of the change in fair values. For derivative instruments that are designated and qualify as a cash flow hedge, the effective portion of the gain or loss on the derivative instrument is reported as a component of Other Comprehensive Income (OCI) and reclassified into earnings in the same period or periods during which the hedged transaction affects earnings. The remaining gain or loss related to the ineffective portion of the derivative instrument, if any, is recognized in current earnings during the period of change. For derivative instruments that are designated and qualify as a hedge of a net investment in a foreign operation, the gain or loss is reported in OCI as part of the cumulative translation adjustment to the extent it is effective. For derivative instruments not designated as hedging instruments, the gain or loss is recognized in current earnings during the period of change. Should a financial instrument designated as a hedge be terminated while the underlying hedged transaction remains outstanding, or reasonably possible of occurring, the gain or loss would be deferred and amortized over the shorter of the remaining life of the underlying or the agreement.
The Company uses derivative financial instruments primarily to reduce its exposure to fluctuations in interest rates. When entered into, the Company formally designates and documents the financial instrument as a hedge of a specific exposure, as well as the risk management objectives and strategies for undertaking the hedge transaction. The Company formally assesses both at the inception and at least quarterly thereafter, whether the financial instruments that are used in hedging transactions are effective at offsetting changes in either the fair value or cash flows of the related exposure. Derivatives are recorded on the balance sheet at fair value as either other assets or other liabilities. The Company calculates the fair value of its derivatives using quoted market prices when available. When quoted market prices are not available, the Company uses standard pricing models with market-based inputs that take into account the present value of estimated future cash flows. The earnings impact resulting from the derivative instruments is recorded in the same line item within the statement of operations as the exposure being hedged. The ineffective portion of a financial instrument's change in fair value is immediately recognized in earnings as other income (expense).
F-10
EURAMAX HOLDINGS, INC. AND SUBSIDIARIES
NOTES TO CONSOLIDATED FINANCIAL STATEMENTS (Continued)
(in thousands except share data)
2. Summary of Significant Accounting Policies (Continued)
Revenue Recognition
The Company recognizes revenue when persuasive evidence of an agreement exists, delivery has occurred, the Company's price to the buyer is fixed and determinable and collectibility is reasonably assured. Delivery is not considered to have occurred until the customer takes title and assumes the risks and rewards of ownership.
The Company provides warranties on certain products. The warranty periods differ depending on the product, but generally range from one year to limited lifetime warranties. The Company provides accruals for warranties based on historical experience and expectations of future occurrence.
Shipping and Handling Costs
The Company classifies all shipping and handling charges as cost of goods sold.
Advertising Costs
The Company expenses all advertising costs as incurred. Advertising costs for 2009, 2008, and 2007 were $2.6 million, $4.0 million, and $4.7 million, respectively.
Translation of Foreign Currencies
Assets and liabilities of non-U.S. subsidiaries are translated to U.S. Dollars at the rate of exchange in effect on the balance sheet date. Income and expenses are translated to U.S. Dollars at the weighted average rates of exchange prevailing during the year. Foreign currency gains and losses resulting from the remeasurement of inter-company amounts that are not of a long-term investment nature into local currencies and certain indebtedness of foreign subsidiaries denominated in U.S. dollars are included in other income (expense) and amounted to $4.5 million, $(15.9) million, and $4.9 million in 2009, 2008, and 2007, respectively. Foreign currency gains and losses resulting from transactions in the ordinary course of business are recorded in selling and general expenses. The foreign currency translation gains and losses recorded in selling and general expenses were not significant for any period presented.
Earnings (Loss) Per Share
Basic earnings (loss) per share is calculated by dividing net income (loss) by the weighted average number of common shares outstanding during the period. Diluted earnings (loss) per share is calculated in a similar manner but include the effect of dilutive securities. To the extent these securities are anti-dilutive, they are excluded from the calculation of diluted earnings (loss) per share. Because the Company incurred losses in each of the three years ended 2009, earning (loss) per share excludes the dilutive impact of options and restricted stock outstanding.
In 2009, in connection with the Restructuring, all existing common shares of the Company, along with all outstanding options were cancelled and new shares of the Company were issued. The computation of earnings (loss) per share has been retroactively restated to consider the effect of the recapitalization.
Approximately 17,000 shares of unvested restricted shares were not included in the calculation of diluted earnings per share as they were anti-dilutive because the Company recorded a net loss in these periods.
F-11
EURAMAX HOLDINGS, INC. AND SUBSIDIARIES
NOTES TO CONSOLIDATED FINANCIAL STATEMENTS (Continued)
(in thousands except share data)
2. Summary of Significant Accounting Policies (Continued)
Recently Adopted Accounting Pronouncements
In June 2009, the Financial Accounting Standards Board, or FASB, issued SFAS No. 168, The FASB Accounting Standards Codification and the Hierarchy of Generally Accepted Accounting Principles, a replacement of FASB Statement No. 162. SFAS No. 168 establishes the FASB Accounting Standards Codification, or ASC, as the source of authoritative U.S. GAAP. SFAS No. 168 was codified as ASC Topic 105, The FASB Accounting Standards Codification and the Hierarchy of Generally Accepted Accounting Principles, (ASC 105). The ASC is not intended to change or alter existing U.S. GAAP. The ASC is effective for interim and annual financial periods ending after September 15, 2009. U.S. GAAP cited in these financial statements reference ASC topic numbers.
In July 2006, the FASB issued FASB Interpretation No. 48, Accounting for Uncertainty in Income Taxes, (FIN 48). FIN 48 was codified into ASC Topic 740, Income Taxes, (ASC 740). ASC 740 clarifies the accounting for uncertainty in income taxes recognized in an enterprise's financial statements and prescribes a recognition threshold and measurement attribute for the financial statement recognition and measurement of a tax position taken or expected to be taken in a tax return. ASC 740 also provides guidance on derecognition, classification, interest and penalties, accounting in interim periods, disclosure and transition. See Note 11 for further discussion of the Company's adoption of the revised guidance on accounting for uncertainty in income taxes.
In May 2009, the FASB issued SFAS No. 165, Subsequent Events. SFAS No. 165 was codified into ASC Topic 855, Subsequent Events, (ASC 855). ASC 855 establishes general standards of accounting for and disclosure of events that occur after the balance sheet date but before financial statements are issued. ASC 855 requires the disclosure of the date through which an entity has evaluated subsequent events and the rationale for why that date was selected. ASC 855 is effective for interim and annual periods ending after June 15, 2009, and accordingly, it was adopted by the Company in 2009.
In March 2008, the FASB issued SFAS No. 161, Disclosures about Derivative Instruments and Hedging Activities—an amendment of FASB Statement No. 133. SFAS No. 161 was codified into ASC Topic 815, Derivatives and Hedging, (ASC 815). ASC 815 requires additional disclosures about the objectives of derivative instruments and hedging activities, the method of accounting for such instruments and its related interpretations, and a tabular disclosure of the effects of such instruments and related hedged items on the Company's financial position, financial performance, and cash flows. The additional disclosures required under ASC 815 are included in Note 8.
In December 2007, the FASB issued SFAS No. 160, Noncontrolling Interests in Consolidated Financial Statements—an amendment of Accounting Research Bulletin No. 51. SFAS No. 160 was codified into ASC Topic 810, Consolidation, (ASC 810). ASC 810 establishes accounting and reporting standards for the noncontrolling interest in a subsidiary and for the deconsolidation of a subsidiary. ASC 810 also establishes disclosure requirements that clearly identify and distinguish between the controlling and noncontrolling interests and requires the separate disclosure of income attributable to controlling and noncontrolling interests. The standard is effective for fiscal years beginning after December 15, 2008. Adoption of ASC 810 did not have a significant impact on the Company's consolidated financial statements.
In February 2007, the FASB issued SFAS No. 159, The Fair Value Option for Financial Assets and Financial Liabilities—Including an amendment of FASB Statement No. 115. SFAS No. 159 was codified into ASC Topic 825, Financial Instruments, (ASC 825). The standard permits entities to choose
F-12
EURAMAX HOLDINGS, INC. AND SUBSIDIARIES
NOTES TO CONSOLIDATED FINANCIAL STATEMENTS (Continued)
(in thousands except share data)
2. Summary of Significant Accounting Policies (Continued)
to measure many financial instruments and certain other items at fair value. Unrealized gains and losses on items for which the fair value option has been elected will be recognized in earnings at each subsequent reporting date. ASC 825 was effective for the Company on December 29, 2007, the first day of the Company's 2008 fiscal year. Adoption of SFAS No. 159 did not have a significant impact on its consolidated financial statements.
In September 2006, the FASB issued SFAS No. 158, Employers' Accounting for Defined Benefit Pension and Other Postretirement Plans. SFAS No. 158 was codified into ASC Topic 715, Compensation Retirement Benefits, (ASC 715). ASC 715 requires the recognition of the funded status of a benefit plan in the balance sheet; the recognition in other comprehensive income of gains or losses and prior service costs or credits arising during the period but which are not included as components of periodic benefit cost; the measurement of defined benefit plan assets and obligations as of the balance sheet date; and disclosure of additional information about the effects on periodic benefit cost for the following fiscal year arising from delayed recognition in the current period. In addition, ASC 715 amends SFAS No. 87, Employers' Accounting for Pensions, and SFAS No. 106, Employers' Accounting for Postretirement Benefits Other Than Pensions, to include guidance regarding selection of assumed discount rates for use in measuring the benefit obligation. The Company adopted ASC 715 on December 28, 2007, the last day of the Company's 2007 fiscal year. The adoption of ASC 715 resulted in a decrease in recorded pension obligations and a credit to accumulated other comprehensive income in 2007 of approximately $7.7 million ($5.5 million net of tax).
In September 2006, the FASB issued SFAS No. 157, Fair Value Measurements. SFAS No. 157 was largely codified into ASC Topic 820, Fair Value Measurements and Disclosures, (ASC 820). The standard defines fair value, establishes a framework for measuring fair value and expands disclosure requirements about fair value measurements. The standard, as it relates to financial assets and financial liabilities, was effective for the Company on December 29, 2007, the first day of the Company's 2008 fiscal year. In February 2008, the FASB released a FASB Staff Position (FSP FAS 157-2—Effective Date of FASB Statement No. 157) which was codified into ASC 820 and delayed the effective date for all nonfinancial assets and nonfinancial liabilities, except those that are recognized or disclosed at fair value in the financial statements on a recurring basis, until December 27, 2008, the first day of the Company's 2009 fiscal year. See Note 8 for further discussion on the Company's adoption of this standard relating to its financial assets and liabilities. The adoption of the standard for all nonfinancial assets and nonfinancial liabilities did not have a material impact on the Company's consolidated financial statements.
In December 2007, the FASB issued SFAS No. 141 (revised 2007), Business Combinations. SFAS No. 141(R) was codified into ASC Topic 805, Business Combinations, (ASC 805). ASC 805 amends the principles and requirements for how an acquirer recognizes and measures in its financial statements the identifiable assets acquired, the liabilities assumed, any noncontrolling interest in the acquiree and the goodwill acquired. ASC 805 also establishes disclosure requirements to enable the evaluation of the nature and financial effects of the business combination. The adoption of ASC 805 did not have a material impact on the Company's consolidated financial statements.
Recent Accounting Pronouncements Not Yet Adopted
In June 2009, the FASB issued SFAS No. 167, Amendments to FASB Interpretation No. 46(R). SFAS No. 167 was codified into ASC Topic 810, Consolidation, (ASC 810). ASC 810 amends the consolidation guidance for variable-interest entities, or VIE. The revised guidance replaces the
F-13
EURAMAX HOLDINGS, INC. AND SUBSIDIARIES
NOTES TO CONSOLIDATED FINANCIAL STATEMENTS (Continued)
(in thousands except share data)
2. Summary of Significant Accounting Policies (Continued)
quantitative-based risks and rewards calculations for determining the primary beneficiary of a VIE with a qualitative approach that focuses on identifying which enterprise has a controlling financial interest in a VIE. Additionally, the revised guidance requires ongoing assessments of whether an enterprise is the primary beneficiary of a VIE and enhanced disclosures. The revised guidance is effective for the Company on December 26, 2009, the first day of the Company's 2010 fiscal year. The Company is evaluating the impact that the adoption will have on its consolidated financial statements.
In June 2009, the FASB issued SFAS No. 166, Accounting for Transfers of Financial Assets—an amendment of FASB Statement No. 140. SFAS No. 166 was codified into ASC Topic 860, Transfers and Servicing, (ASC 866). ASC 866 clarifies the determination of a transferor's continuing involvement in a transferred financial asset and limits the circumstances in which a financial asset should be derecognized when the transferor has not transferred the entire original financial asset. The revised guidance is effective for the Company on December 26, 2009, the first day of the Company's 2010 fiscal year. The Company is evaluating the impact that the adoption will have on its consolidated financial statements.
3. Inventories
Inventories were comprised of:
| |
December 25, 2009 |
December 26, 2008 |
|||||
|---|---|---|---|---|---|---|---|
Aluminum and steel coil |
$ | 43,517 | $ | 75,296 | |||
Raw materials |
20,390 | 25,635 | |||||
Work in process |
1,983 | 1,971 | |||||
Finished products |
13,305 | 17,526 | |||||
|
$ | 79,195 | $ | 120,428 | |||
The Company has disclosed aluminum and steel coil inventory separately, as it represents inventory that can be classified as raw material, work in process or finished product. Aluminum and steel coil represent both painted and bare coil. Inventories are net of related reserves totaling $4.1 million and $5.1 million at December 25, 2009 and December 26, 2008, respectively. During 2008, the Company recorded cost of sales totaling $8.8 million to reduce the carrying value of its inventory to market as a result of a significant decline in aluminum and steel market prices.
Activity in the allowance for obsolete inventory was as follows:
| |
2009 | 2008 | 2007 | |||||||
|---|---|---|---|---|---|---|---|---|---|---|
Balance, beginning of year |
$ | 5,130 | $ | 4,749 | $ | 3,411 | ||||
Net charges to costs and expenses |
3,686 | 5,864 | 2,367 | |||||||
Write-offs |
(4,795 | ) | (4,765 | ) | (1,771 | ) | ||||
Acquisition and purchase accounting adjustments |
— | (344 | ) | 599 | ||||||
Foreign currency translation |
109 | (374 | ) | 143 | ||||||
Balance, end of year |
$ | 4,130 | $ | 5,130 | $ | 4,749 | ||||
F-14
EURAMAX HOLDINGS, INC. AND SUBSIDIARIES
NOTES TO CONSOLIDATED FINANCIAL STATEMENTS (Continued)
(in thousands except share data)
4. Discontinued Operations
In November 2008, the Company made the decision to cease operations of its GSI subsidiary. GSI was previously included in the U.S. Residential Building Products segment. GSI produced and sold roof drainage products to contractors. The decision was based upon financial losses caused by poor economic conditions and diminishing prospects for market improvement. Following this decision, the GSI assets were offered for sale. The Company ceased operating at eleven of its twelve GSI locations prior to December 26, 2008. In 2008, GSI incurred goodwill and other impairment charges including impairments on fixed assets, goodwill and customer relationships of $5.1 million, $2.0 million and $5.7 million, respectively. Additionally, GSI accrued as operating expenses $0.8 million for future lease commitments. In 2009, certain GSI assets were sold for approximately $1.8 million, resulting in a loss of $0.2 million.
In the accompanying consolidated statements of operations, loss from discontinued operations, net of income taxes, consists of the following:
| |
December 25, 2009 |
Year Ended December 26, 2008 |
December 28, 2007 |
|||||||
|---|---|---|---|---|---|---|---|---|---|---|
Net sales |
$ | 2,353 | $ | 32,132 | $ | 51,529 | ||||
Operating and other expenses |
4,305 | 51,064 | 61,464 | |||||||
Goodwill and other impairments |
— | 12,795 | — | |||||||
Loss before income taxes |
(1,952 | ) | (31,727 | ) | (9,935 | ) | ||||
Benefit for income taxes |
(622 | ) | (9,314 | ) | (3,741 | ) | ||||
Loss from discontinued operations |
$ | (1,330 | ) | $ | (22,413 | ) | $ | (6,194 | ) | |
The following assets and liabilities are included in assets related to discontinued operations and liabilities related to discontinued operations in the consolidated balance sheets.
| |
December 25, 2009 |
December 26, 2008 |
|||||
|---|---|---|---|---|---|---|---|
Accounts receivable |
$ | 65 | $ | 530 | |||
Inventories |
— | 2,353 | |||||
Assets held for sale |
2,262 | 2,215 | |||||
Total assets |
$ | 2,327 | $ | 5,098 | |||
| |
December 25, 2009 |
December 26, 2008 |
|||||
|---|---|---|---|---|---|---|---|
Accounts payable |
$ | 9 | $ | 845 | |||
Accrued liabilities |
440 | 1,487 | |||||
Total liabilities |
$ | 449 | $ | 2,332 | |||
F-15
EURAMAX HOLDINGS, INC. AND SUBSIDIARIES
NOTES TO CONSOLIDATED FINANCIAL STATEMENTS (Continued)
(in thousands except share data)
5. Property, Plant, and Equipment
Property, plant, and equipment consisted of:
| |
December 25, 2009 | December 26, 2008 | |||||
|---|---|---|---|---|---|---|---|
Land and improvements |
$ | 23,900 | $ | 23,289 | |||
Buildings |
58,185 | 56,738 | |||||
Machinery and equipment |
157,735 | 159,882 | |||||
|
239,820 | 239,909 | |||||
Less accumulated depreciation |
(72,705 | ) | (57,229 | ) | |||
|
167,115 | 182,680 | |||||
Construction in progress |
2,333 | 2,404 | |||||
|
$ | 169,448 | $ | 185,084 | |||
Depreciation expense (including software amortization expenses disclosed below) for 2009, 2008, and 2007 was $17.8 million, $20.3 million, and $19.7 million, respectively.
As of December 25, 2009 and December 26, 2008, unamortized computer software costs totaling $15.2 million and $18.1 million, respectively, were recorded in property, plant and equipment. Amortization of capitalized computer software costs for 2009, 2008, and 2007 was $2.9 million, $2.2 million, and $0.4 million, respectively.
Due to declines in the RV market in 2008, the Company determined that its investment in its U.S. RV and Specialty Building Products facility located in Ft. Wayne, Indiana was not fully recoverable. Accordingly, the Company recorded a charge of $2.0 million in 2008 to reduce the carrying value of certain machinery and equipment devoted to the manufacture of fiberglass panels for the RV industry, to their appraised values. Further declines in RV demand in 2009, led to the closure of the fiberglass manufacturing facility. As a result, the Company wrote the investment in its facility down by $3.5 million to its expected salvage value.
6. Goodwill and Intangible Assets
Declines in net sales and operating results required the Company to test for the impairment of goodwill and other intangible assets. Substantial uncertainty related to the duration of the economic downturn resulted in the Company lowering its expectations for future cash flows at each of its reporting units. In 2008, the Company recorded impairment charges totaling $345.0 million relating to goodwill.
In 2008, impairment charges relating to customer relationships totaled $50.4 million, including $3.5 million in the U.S. Commercial Building Products segment, $5.1 million in the U.S. RV and Specialty Building Products segment, $16.3 million in the European Roll Coated segment, and $25.5 million in the European Engineered Products segment. In 2008, impairment charges relating to trade names totaled $3.9 million, including $2.3 million in the U.S. Residential Building Products segment and $1.6 million in the U.S. Commercial Building Products segment. No goodwill or intangible asset impairment charges were recorded in 2009 or 2007.
F-16
EURAMAX HOLDINGS, INC. AND SUBSIDIARIES
NOTES TO CONSOLIDATED FINANCIAL STATEMENTS (Continued)
(in thousands except share data)
6. Goodwill and Intangible Assets (Continued)
Goodwill balances and activity were as follows:
| |
U.S. Residential Building Products |
U.S. Non- Residential Building Products |
U.S. RV and Specialty Building Products |
European Roll Coated Aluminum |
European Engineered Products |
Consolidated | ||||||||||||||
|---|---|---|---|---|---|---|---|---|---|---|---|---|---|---|---|---|---|---|---|---|
Balance at December 28, 2007 |
$ | 181,370 | $ | 53,574 | $ | 115,382 | $ | 181,764 | $ | 40,696 | $ | 572,786 | ||||||||
Impairment charge |
(114,795 | ) | (53,574 | ) | (100,270 | ) | (58,526 | ) | (17,837 | ) | (345,002 | ) | ||||||||
Adjustment of income tax reserves |
— | — | — | 264 | (2,312 | ) | (2,048 | ) | ||||||||||||
Foreign currency translation |
(793 | ) | — | — | (11,179 | ) | (8,912 | ) | (20,884 | ) | ||||||||||
Other |
160 | — | — | — | — | 160 | ||||||||||||||
Balance at December 26, 2008 |
65,942 | — | 15,112 | 112,323 | 11,635 | 205,012 | ||||||||||||||
Foreign currency translation |
— | — | — | 2,666 | 1,040 | 3,706 | ||||||||||||||
Other |
— | — | — | (244 | ) | — | (244 | ) | ||||||||||||
Balance at December 25, 2009 |
$ | 65,942 | $ | — | $ | 15,112 | $ | 114,745 | $ | 12,675 | $ | 208,474 | ||||||||
Accumulated impairment losses were $279.2 million and $276.9 million as of December 25, 2009 and December 26, 2008, respectively. There were no accumulated impairment losses as of December 28, 2007. Changes in accumulated impairment losses resulted from foreign currency translation adjustments related to goodwill in the Company's foreign reporting units.
Intangible assets consisted of the following:
| |
As of December 25, 2009 | As of December 26, 2008 | ||||||||||||||||||
|---|---|---|---|---|---|---|---|---|---|---|---|---|---|---|---|---|---|---|---|---|
| |
Gross Carrying Amount |
Accumulated Amortization |
Net Carrying Amount |
Gross Carrying Amount |
Accumulated Amortization |
Net Carrying Amount |
||||||||||||||
Intangible assets subject to amortization: |
||||||||||||||||||||
Customer relationships |
$ | 219,585 | $ | (110,271 | ) | $ | 109,314 | $ | 217,291 | $ | (88,156 | ) | $ | 129,135 | ||||||
Patents |
5,800 | (2,655 | ) | 3,145 | 5,800 | (2,065 | ) | 3,735 | ||||||||||||
Non-compete agreements |
2,266 | (1,649 | ) | 617 | 2,266 | (1,165 | ) | 1,101 | ||||||||||||
|
227,651 | (114,575 | ) | 113,076 | 225,357 | (91,386 | ) | 133,971 | ||||||||||||
Intangible assets not subject to amortization: |
||||||||||||||||||||
Trade names |
6,100 | — | 6,100 | 6,100 | — | 6,100 | ||||||||||||||
Total intangible assets |
$ | 233,751 | $ | (114,575 | ) | $ | 119,176 | $ | 231,457 | $ | (91,386 | ) | $ | 140,071 | ||||||
F-17
EURAMAX HOLDINGS, INC. AND SUBSIDIARIES
NOTES TO CONSOLIDATED FINANCIAL STATEMENTS (Continued)
(in thousands except share data)
6. Goodwill and Intangible Assets (Continued)
The aggregate amortization expense for intangible assets for 2009, 2008, and 2007, was $21.9 million, $35.0 million, and $37.8 million, respectively. The average useful lives of the Company's customer relationships, patents and non-compete agreements are 12 years, 10 years and 3 years, respectively. Based on the carrying value of identified intangible assets recorded at December 25, 2009, and assuming no subsequent impairment of the underlying assets, the aggregate annual amortization expense for the next five years is expected to be as follows:
Year
|
Amortization of Intangible Assets | |||
|---|---|---|---|---|
2010 |
$ | 20,306 | ||
2011 |
18,305 | |||
2012 |
16,476 | |||
2013 |
15,083 | |||
2014 |
14,333 | |||
7. Long-Term Debt
Long-term debt obligations consisted of the following:
| |
December 25, 2009 |
December 26, 2008 |
||||||
|---|---|---|---|---|---|---|---|---|
First Lien Credit Agreement: |
||||||||
Cash Pay loans |
$ | 261,844 | $ | 398,214 | ||||
PIK loans |
263,475 | — | ||||||
Revolving credit facility |
— | 74,939 | ||||||
Second Lien Credit Agreement |
— | 190,000 | ||||||
Equity Sponsor PIK Notes |
— | 186,954 | ||||||
Accounts Receivable Securitization Facility |
— | 34,633 | ||||||
|
525,319 | 884,740 | ||||||
Less current maturities |
— | (34,633 | ) | |||||
|
$ | 525,319 | $ | 850,107 | ||||
Debt Restructuring
On June 29, 2009, Euramax, its lenders, the Equity Sponsors and certain management shareholders agreed to a restructuring of indebtedness owed by the Company to lenders under the First and Second Lien Credit Agreements, the Equity Sponsor PIK Notes, and of amounts owed to counterparties to the Interest Rate Swaps (the Restructuring). See Note 8 for further discussion of the Interest Rate Swaps. Under the terms of the Restructuring, 100% of the Equity Sponsor PIK Notes consisting of principal and accrued interest of $195.4 million and $1.4 million, respectively, were cancelled. In addition, lenders cancelled 100% of amounts owed under the Second Lien Credit Agreement consisting of principal and accrued interest of $191 million and $12 million, respectively. In exchange, lenders under the Second Lien Credit Agreement received 100% of the issued and outstanding stock of the Company. Such stock was issued to lenders in proportion to their holdings of the Second Lien loans prior to the restructuring. As a result, the Company recorded the fair value of
F-18
EURAMAX HOLDINGS, INC. AND SUBSIDIARIES
NOTES TO CONSOLIDATED FINANCIAL STATEMENTS (Continued)
(in thousands except share data)
7. Long-Term Debt (Continued)
equity securities issued (less associated fees) together with the cancelled principal and accrued interest under the Equity Sponsor PIK notes as a credit to paid-in-capital and recognized a pretax extinguishment gain of $8.7 million on the exchange. As of December 26, 2008, borrowings under the First and Second Lien Credit Agreements and the Equity Sponsor PIK Notes were recorded as long-term as amounts were refinanced or cancelled in connection with the Restructuring.
Also under the terms of the Restructuring, lenders under the First Lien Credit Agreement, together with counterparties to the Interest Rate Swaps, amended and restated the First Lien Credit Agreement to, among other items, split the sum of amounts owed under the First Lien secured revolving credit facility ($77.5 million), the U.S. Dollar Term Loan Facility ($304.8 million), the European Term Loan Facility ($109.3 million) and the Interest Rate Swaps ($18.9 million) into two components consisting of a cash pay portion (the Cash Pay Loan) and a payment-in-kind portion (the PIK Loan). Immediately following the Restructuring, principal balances owed under the Cash Pay Loan and PIK Loan were $261.2 million (including capitalized fees of $1.3 million) and $251.8 million (including accrued interest and capitalized fees of $14.9 million), respectively.
On the Restructuring date, debt issuance costs of $2.5 million were capitalized in connection with the amendment and restatement of the First Lien Credit Agreement.
The Restructuring was preceded by a series of forbearance and limited waiver agreements in place from November 10, 2008 to the Restructuring date. Pursuant to the terms of these agreements, lenders under the First and Second Lien Credit Agreements and the Accounts Receivable Facility agreed to forbear from exercising rights and remedies, including accelerating repayment of the outstanding debt, with respect to named events of default primarily related to financial covenant compliance. The forbearance agreements contained, among other items, a minimum liquidity requirement and restrictions on distributions of cash. During the period of forbearance, the Company was restricted from borrowing under the First Lien Revolving Credit Facility. In 2008, the Company recognized interest expense of $21.6 million representing the accelerated amortization of remaining deferred financing fees to coincide with the term of the first forbearance. In 2009, interest expense of $5.5 million was recognized representing fees and expenses relating to obtaining forbearances.
The First Lien Credit Agreement
Following the Restructuring, the amended and restated First Lien Credit Agreement consists of $525.3 million in term loans comprised of the Cash Pay Loan and the PIK Loan. The Cash Pay Loan and PIK Loan are each comprised of (i) a U.S. Dollar Term Loan Facility and (ii) Euro and British Pound term loan facilities (together the European Term Loan Facility). Euramax International, Inc. and Euramax International Holdings B.V. are the borrowers (collectively, the U.S. Borrowers) under the U.S. Dollar Term Loan Facility. Euramax Holdings Limited, Euramax Europe B.V. and Euramax Netherlands B.V. are the borrowers (collectively, the European Borrowers) under the European Term Loan Facility. As of December 25, 2009, portions of the Cash Pay Loan denominated in U.S. Dollars, Euros and British Pounds were $205.5 million, EUR 31.8 million ($45.8 million) and GBP 6.6 million ($10.6 million), respectively. Also, as of December 25, 2009, portions of the PIK Loan denominated in U.S. Dollars, Euros and British Pounds were $206.2 million, EUR 32.3 million ($46.5 million) and GBP 6.7 million ($10.7 million), respectively.
F-19
EURAMAX HOLDINGS, INC. AND SUBSIDIARIES
NOTES TO CONSOLIDATED FINANCIAL STATEMENTS (Continued)
(in thousands except share data)
7. Long-Term Debt (Continued)
The amended and restated First Lien Credit Agreement eliminated the revolving credit facility, extended the maturity date of both the U.S. Dollar Term Loan Facility and the European Term Loan Facility (together the Term Loans) from June 29, 2012 to June 29, 2013, and, eliminated requirements for quarterly repayments. The Term Loans may be prepaid at any time without premium or penalty. Mandatory prepayments are required to be made equal to proceeds arising from certain asset sales, casualty insurance, certain issuances of debt securities, and 75% of the Company's annual excess cash flow (as defined). Prepayments are required annually (beginning in the first quarter of 2011) based upon the excess cash flow of the immediately preceding fiscal year.
Each of the Company's existing and subsequently acquired or organized domestic subsidiaries (the U.S. Guarantors and, together with the U.S. Borrowers, the U.S. Obligors) guarantee all obligations under the U.S. Dollar Term Loan Facility. Each of the Company's existing and subsequently acquired or organized domestic and foreign subsidiaries (the European Guarantors and, together with the European Borrowers, the European Obligors), to the extent that they may grant such upstream guarantees without breaching applicable financial assistance, corporate benefit or fiduciary duty rules or incurring adverse tax consequences, guarantee all obligations under the European Term Loan Facility. The U.S. Dollar Term Loan Facility is secured by a second priority security interest in the accounts receivable and inventory of the domestic subsidiaries of the U.S. Borrowers and a first priority security interest in substantially all other assets of the U.S. Obligors. The European Term Loan Facility is secured by a first priority security interest in all assets of the European Obligors.
The First Lien Credit Agreement contains affirmative and negative covenants customary for this type of financing, including but not limited to, financial covenants related to minimum interest coverage, minimum fixed charge coverage, maximum capital expenditures, maximum total leverage and minimum liquidity. The First Lien Credit Agreement includes negative covenants that restrict the Company's ability to, among other things, incur additional indebtedness, incur liens, guarantee obligations, pay dividends or make redemptions or make voluntary payments on subordinated debt, engage in mergers and make acquisitions, sell assets, enter into sale leaseback transactions, and engage in certain types of transactions with affiliates. These limitations also prohibit the U.S. borrower's ability to transfer cash or other assets to Euramax Holdings, whether by dividend, loan or otherwise. Accordingly, restricted net assets of the Company's subsidiaries included in consolidated equity was approximately $46.8 million at December 25, 2009. The First Lien Credit Agreement also contains cross default provisions with the Asset Based Revolving Credit Facility. Failure to comply with covenants contained in the Company's First Lien Credit Agreement in future periods, if not waived or amended, would result in an event of default. Under an event of default, the lender may declare all or any portion of the obligations immediately due and payable. Any default resulting in the acceleration of indebtedness or foreclosure on collateral would have a material adverse effect on the Company.
Term Loans bear interest at the greater of 3.00% or a reserve adjusted Eurodollar rate, plus an applicable margin. The applicable margin for the Cash Pay Loan is 7.00%. The applicable margin for the PIK Loan is 11.00% unless the Company elects, at least ten days prior to the expiration of an interest contract period, to pay interest applicable to the contract period. In such event, the applicable margin is 9.00%. The Company may select interest contract periods of 30, 60, 90 or 180 days. Interest on the Cash Pay Loan and the Eurodollar component of the PIK Loan is payable on the last day of each calendar month within the interest contract period. Interest representing the applicable margin on
F-20
EURAMAX HOLDINGS, INC. AND SUBSIDIARIES
NOTES TO CONSOLIDATED FINANCIAL STATEMENTS (Continued)
(in thousands except share data)
7. Long-Term Debt (Continued)
the PIK Loan is payable at the earlier of the expiration of the interest contract period or within 90 days of the start of an interest contract period. Accrued interest attributable to the applicable margin (PIK Interest) on the PIK Loan, if not elected by the Company to be paid in cash, is capitalized at the earlier of the end of an interest contract period or 90 days. At December 25, 2009, PIK Interest of $2.1 million was recorded as a long-term liability based upon the Company's ability and intent to capitalize such interest as part of the PIK Loan principal. The applicable interest rates for borrowings under the Cash Pay Loan and PIK Loan at December 25, 2009, were 10% and 14%, respectively. If on the third anniversary of the Restructuring the Company does not elect to begin making cash payments of interest on the PIK Loan, the applicable margins for the Cash Pay Loan and PIK Loan increase to 9.0% and 13.0%, respectively.
Prior to the Restructuring, the First Lien Credit Agreement consisted of an $80.0 million senior secured revolving credit facility and $398.2 million of term loans, comprised of a U.S. Dollar Term Loan Facility and the European Term Loan Facility. The U.S. Borrowers and the European Borrowers were the borrowers under the revolving credit facility. The revolving credit facility was used for permitted capital expenditures and permitted acquisitions and to provide for ongoing working capital requirements of the Company and for general corporate purposes.
On March 18, 2008, the First Lien Credit Agreement was amended to, among other items, (i) raise the total leverage ratio permitted and decrease the total interest coverage required at each quarter end for the period March 31, 2008 through March 31, 2009, (ii) fix the Eurodollar and base rate applicable margins for the remaining term of the loans and (iii) establish a LIBOR floor of 3.50%.
Asset-Based Revolving Credit Facility
On the Restructuring date, the Company entered into a $70.0 million asset-based revolving credit facility (the ABL Facility). Proceeds from the ABL Facility were used to pay certain fees incurred in connection with the Restructuring and may be used for working capital or other corporate purposes. Borrowings under the ABL Facility are secured by a first priority security interest in the accounts receivable and inventory of the Company's domestic subsidiaries ($93.0 million as of December 25, 2009). The Company may elect either LIBOR or Base Rate revolving loans under the ABL Facility. For LIBOR Loans, borrowings bear interest at the greater of 2.50% or a LIBOR Index Rate plus an applicable margin of 3.50%. For Base Rate Loans, borrowings bear interest at the greater of 2.50%, the Federal Funds rate plus 0.5%, or the lender's Prime Rate plus 2.0%, plus an applicable margin of 1.25%. The applicable margins for both Base Rate and LIBOR loans increase 0.5% and 1.0% in the event that availability under the ABL Facility falls below $25.0 million and $10.0 million, respectively. The ABL Facility requires the Company to pay commitment fees equal to 0.75% per annum on the average daily undrawn portion of the facility. Amounts under the ABL Facility may be borrowed, repaid and reborrowed until the loan termination date, subject to borrowing base limitations related to the amounts of eligible accounts receivable and inventory. At December 25, 2009, $47.5 million was available to be drawn on the ABL Facility. The ABL Facility contains affirmative and negative covenants customary for this type of financing and cross default provisions with the First Lien Credit Agreement. The ABL Facility terminates on June 29, 2012.
F-21
EURAMAX HOLDINGS, INC. AND SUBSIDIARIES
NOTES TO CONSOLIDATED FINANCIAL STATEMENTS (Continued)
(in thousands except share data)
7. Long-Term Debt (Continued)
The Second Lien Credit Agreement
Prior to the Restructuring, the Second Lien Credit Agreement consisted of a $190.0 million term loan facility. Euramax International, Inc. and Euramax International Holdings B.V. were the borrowers under the term loan facility. Borrowings under the second lien term facility bore interest, at the borrower's option, at either a base rate plus an applicable margin of 6.00% to 7.75% per annum based on the leverage ratio, or a reserve adjusted Eurodollar rate plus an applicable margin of 7.00% to 8.75% per annum based on the leverage ratio.
Equity Sponsor PIK Notes
Prior to the Restructuring, notes issued to the Equity Sponsors (the Equity Sponsor PIK Notes) totaled $195.4 million, consisting of $172 million of original principal and $23.4 million in payment-in-kind interest. Euramax Holdings, Inc. was the borrower under the Equity Sponsor PIK Notes. Borrowings under the Equity Sponsor PIK Notes bore interest at 12.5% through December 21, 2007 and at 9.00% from that point forward until their cancellation. Interest on the equity sponsored notes was paid-in-kind.
Accounts Receivable Facility
Prior to the Restructuring, the Company was a party to a $60.0 million accounts receivable securitization facility (the Accounts Receivable Facility). The Accounts Receivable Facility was repaid on the Restructuring date. Under the Accounts Receivable Facility, the Company sold substantially all of the trade receivables of certain U.S. subsidiaries to Euramax Receivables LLC, a wholly owned, special purpose subsidiary. Euramax Receivables LLC funded these purchases with borrowings under a loan agreement with a third party. Amounts outstanding under the loan agreement were collateralized by trade receivables purchased by Euramax Receivables LLC. Borrowings under the loan agreement bore interest at a LIBOR Index Rate plus an applicable margin of 1.50%. The Accounts Receivable Facility required the Company to pay commitment fees equal to 0.25% per annum on the average daily undrawn portion of the facility. Euramax Receivables LLC is included in the Company's consolidated financial statements.
The Company's long-term debt totaling $525.3 million matures on June 29, 2013.
8. Financial Instruments
Historically, the Company has entered into interest rate agreements with major financial institutions to reduce the impact of interest rate fluctuations related to debt payments.
In October 2005, the Company entered into four interest rate swaps (the Interest Rate Swaps), whereby the Company paid its counterparties a fixed interest rate of 4.623% on a notional amount of $375.0 million. In exchange, the Company received payments equal to a floating interest rate of three-month U.S. Dollar LIBOR on an equivalent notional amount. The Interest Rate Swaps were initially designated as cash flow hedges that effectively converted a portion of the Company's U.S. Dollar floating rate debt into fixed rate debt. The effectiveness of the Interest Rate Swaps was assessed using the hypothetical derivative method. During 2008, amendments to the First and Second Lien Credit Agreements resulted in the Interest Rate Swaps no longer qualifying as cash flow hedges. After ceasing
F-22
EURAMAX HOLDINGS, INC. AND SUBSIDIARIES
NOTES TO CONSOLIDATED FINANCIAL STATEMENTS (Continued)
(in thousands except share data)
8. Financial Instruments (Continued)
to qualify for hedge accounting, changes in the fair value of the Interest Rate Swaps were recorded as a gain or loss in other (income) expense. In June 2009, as part of the Restructuring discussed in Note 7, the Interest Rate Swaps were terminated. The fair value (a liability of approximately $18.9 million) of the Interest Rate Swaps at the time of termination was added to the outstanding balance of the First Lien Term Loans.
Effective December 29, 2007, the first day of the Company's 2008 fiscal year, the Company adopted ASC 820, Fair Value Measurements and Disclosures. ASC 820 defines fair value as the price that would be received to sell an asset or paid to transfer a liability in an orderly transaction between market participants at the measurement date. ASC 820 classifies inputs used to measure fair value into the following hierarchy:
|
Level 1 | Unadjusted quoted prices in active markets for identical assets or liabilities. | ||
|
Level 2 |
Unadjusted quoted prices in active markets for similar assets or liabilities, or unadjusted quoted prices for identical or similar assets or liabilities in markets that are not active, or inputs other than quoted prices that are observable for the asset or liability. |
||
|
Level 3 |
Unobservable inputs for the asset or liability. |
The Company determined that the fair value of the Interest Rate Swaps is a level 2 measurement in the fair value hierarchy. To measure the fair value of the Interest Rate Swaps, the Company obtained quotations from financial institutions, including the swap counterparties. Such quotations were corroborated and compared to the Company's valuation determined through a discounted, estimated future cash flow methodology.
The following table summarizes the fair value of the Company's derivative financial instruments as of December 25, 2009, December 26, 2008, and December 28, 2007:
| |
At December 25, 2009 | At December 26, 2008 | |||||||||
|---|---|---|---|---|---|---|---|---|---|---|---|
| |
Balance Sheet Location |
Fair Value | Balance Sheet Location |
Fair Value | |||||||
Derivatives not designated as hedging instruments |
|||||||||||
Interest rate swap agreements |
Not applicable | $ | — | Other liabilities | $ | 18,950 | |||||
The following tables summarize the effect of the Company's derivative instruments on the Consolidated Statements of Operations for the years ended December 25, 2009, December 26, 2008, and December 28, 2007:
| |
Amount of Pretax Loss Recognized in Accumulated OCI |
|||||||||
|---|---|---|---|---|---|---|---|---|---|---|
| |
Year Ended December 25, 2009 |
Year Ended December 26, 2008 |
Year Ended December 28, 2007 |
|||||||
Derivatives previously designated as cash flow hedging instruments |
||||||||||
Interest rate swap agreements |
$ | 4,287 | $ | 8,782 | $ | 7,300 | ||||
F-23
EURAMAX HOLDINGS, INC. AND SUBSIDIARIES
NOTES TO CONSOLIDATED FINANCIAL STATEMENTS (Continued)
(in thousands except share data)
8. Financial Instruments (Continued)