Attached files
| file | filename |
|---|---|
| 8-K - ATHENAHEALTH, INC. 8-K - ATHENAHEALTH INC | a6370239.htm |
| EX-99.1 - EXHIBIT 99.1 - ATHENAHEALTH INC | a6370239ex99-1.htm |
Exhibit 99.2
|
Second Quarter Fiscal Year 2010 |
|
Prepared Remarks
Jonathan Bush, President, Chairman &
Chief Executive Officer
Tim Adams, Senior Vice President, Chief
Financial Officer
About These Remarks
The following commentary is
provided by management in conjunction with athenahealth’s second quarter
fiscal year 2010 earnings press release. These remarks represent
management’s current views on the Company’s financial and operational
performance and are provided to give investors and analysts more time to
analyze and understand our performance in advance of the earnings
conference call. These prepared remarks will not be read on the
conference call. A complete reconciliation between GAAP and non-GAAP
results as well as a summary of supplemental metrics and definitions is
provided in the tables following these prepared remarks.
Earnings Conference Call Information
As previously
announced, the Company’s second quarter 2010 earnings conference call
will be held on Friday, July 23rd at 8:00 a.m. ET and will
include only brief comments followed by questions and answers. To
participate in the Company's live conference call and webcast, please
dial 877-303-6175 (678-809-1072 for international calls) using
conference code No. 84476278 or visit the Investors section of the
Company's web site: www.athenahealth.com. A replay will be
available for one week following the conference call at 800-642-1687
(706-645-9291 for international calls) using conference code No.
84476278. A webcast replay will also be archived on the Company's
website.
Safe Harbor and Forward Looking Statements
These
remarks contain forward-looking statements, which are made pursuant to
the safe harbor provisions of the Private Securities Litigation Reform
Act of 1995, including statements reflecting management’s expectations
for future financial and operational performance and operating
expenditures, expected growth, including anticipated annual growth
rates, profitability and business outlook, increased sales and marketing
expenses, increased cross-selling efforts among the Company’s service
offerings, expected client implementations, expected certification and
regulatory approvals, the benefits of the Company's current service
offerings and research and development for new service offerings, the
benefits of current and expected strategic sales and marketing
relationships, and statements found under the Company’s Reconciliation
of Non-GAAP Financial Measures section of these remarks. The
forward-looking statements in these remarks do not constitute guarantees
of future performance. These statements are neither promises nor
guarantees, and are subject to a variety of risks and uncertainties,
many of which are beyond the Company’s control, which could cause actual
results to differ materially from those contemplated in these
forward-looking statements. In particular, the risks and uncertainties
include, among other things: the Company’s fluctuating operating
results; the Company’s variable sales and implementation cycles, which
may result in fluctuations in its quarterly results; risks associated
with its expectations regarding its ability to maintain profitability;
impact of increased sales and marketing expenditures, including whether
increased expansion in revenues is attained and whether impact on
margins and profitability is longer term than expected; changes in tax
rates or exposure to additional tax liabilities; the highly competitive
industry in which the Company operates and the relative immaturity of
the market for its service offerings; and the evolving and complex
governmental and regulatory compliance environment in which the Company
and its clients operate. Existing and prospective investors are
cautioned not to place undue reliance on these forward-looking
statements, which speak only as of the date hereof. The Company
undertakes no obligation to update or revise the information contained
in these remarks, whether as a result of new information, future events
or circumstances, or otherwise. For additional disclosure regarding
these and other risks faced by the Company, see the disclosures
contained in its public filings with the Securities and Exchange
Commission, available on the Investors section of the Company’s website
at http://www.athenahealth.com and on the SEC's website at http://www.sec.gov.
Use of Non-GAAP Financial Measures
These remarks
contain non-GAAP financial measures as defined by SEC Regulation G. The
GAAP financial measure most directly comparable to each non-GAAP
financial measure used or discussed, and a reconciliation of the
differences between each non-GAAP financial measure and the comparable
GAAP financial measure, are included following these prepared remarks or
can be found within the Company’s second quarter 2010 earnings press
release on the Investors section of the Company’s web site at http://www.athenahealth.com.
Opening Remarks
Our journey from best biller in the
cloud to the most trusted business service to medical groups continues.
In pursuit of this mission, we are evolving from an athenaCollector-only
Company to a full service partner across billing, medical records
management, patient communications and Business Intelligence. While our
growth is still primarily driven by the addition of new athenaCollector
clients to our network, the sale of additional services to these clients
is becoming a strong driver of growth, as well.
The majority of new deals now include at least two of our services. Furthermore, cross-sell of services to existing athenaCollector clients now comprises a larger percentage of our growth than it ever has before. To meet this growing demand, we have dedicated about 10% of our quota-carrying sales force to cross-sell and we plan to expand this team over time. With this rapid increase in the adoption of multiple services, there’s not necessarily a one-to-one correlation between percentage growth in our physician base and percentage growth in our total revenue. Nevertheless, we are not relenting on our long-term goal to expand the network to at least 100,000 physicians in size and to become a national information infrastructure that makes health care work as it should.
As market awareness is the primary driver of progression toward our goal, we maintained a methodical focus on increased sales and marketing investments throughout Q2. We expanded our sales force, executed ten regional flywheel programs and launched several targeted sales campaigns, including an Apple® iPod campaign that featured a video with a message from Jonathan Bush.
We continue to balance our long-term interest in expansion of market share with our short-term need to rapidly expand wallet share. We expect that executing on both our financial and strategic goals will be of paramount importance to our success and we look forward to providing updates on both fronts during the coming quarters.
Results Overview
athenahealth’s top line results for
the second quarter of fiscal year 2010 reflect strong annual revenue
growth, despite the Medicare claims hold that occurred in June, coupled
with continued Adjusted Gross Margin expansion:
- Total revenue of $58.6 million, representing 28% growth over $45.6 million in Q2 2009
- Non-GAAP Adjusted Gross Margin of 60.7%, up more than two points from 58.6% in Q2 2009
Our bottom line results for Q2, consistent with our growth strategy, reflect continued increased sales and marketing investments:
- GAAP sales and marketing expense of $12.7 million or 21.7% of total revenue, an increase of 43% over $8.9 million or 19.5% of total revenue in Q2 2009
- Non-GAAP Adjusted EBITDA of $9.9 million or 16.9% of total revenue, an increase of 29% over $7.7 million or 16.8% of total revenue in Q2 2009
- Non-GAAP Adjusted Net Income of $4.1 million or $0.12 per diluted share, an increase of 22% over $3.4 million or $0.10 per diluted share in Q2 2009
We believe that the Company’s underlying drivers of long-term success remain strong:
- Employee engagement remains high at 4.1 out of 5.0, up from 4.0 in Q2 2009
- Client satisfaction remains strong at 86.1%, down slightly from the same sample set in Q4 2009 and from 86.7% in Q2 2009
- Client Days in Accounts Receivable (DAR) was 38.8 days, an improvement of 3% or 1.4 days from 40.2 days in Q2 2009
athenahealth’s client base continues to expand while the adoption of new services grows rapidly:
- 58% of all new athenaCollector deals included athenaClinicals during Q2 2010, up from 18% in Q2 2009 (double barreled deals)
- 14% of all new athenaCollector deals included athenaClinicals and athenaCommunicator during Q2 2010 (triple barreled deals)
- 69 new athenaCollector client accounts added in Q2 2010 for a total of 1,753 at June 30, 2010, up 25% from 1,406 in Q2 2009
- 767 net new active physicians using athenaCollector for a total of 17,136 at June 30, 2010, up 26% from 13,591 in Q2 2009
- 804 net new active providers using athenaCollector for a total of 24,782 at June 30, 2010, up 22% from 20,323 in Q2 2009
- 273 net new active physicians using athenaClinicals for a total of 1,548 at June 30, 2010, up 148% from 624 in Q2 2009
- 389 net new active providers using athenaClinicals for a total of 2,256 at June 30, 2010, up 116% from 1,043 in Q2 2009
- For the first time, we are reporting physician and provider counts on athenaCommunicator:
- 442 active physicians using athenaCommunicator at June 30, 2010
- 689 active providers using athenaCommunicator at June 30, 2010
Network volumes on athenaCollector grew more modestly than usual due to lower physician office activity while network performance metrics improved on a year-over-year basis:
- $1,421,347,731 posted in total client collections during Q2 2010, up 18% from Q2 2009
- 11,312,806 claims submitted during Q2 2010, up 20% from Q2 2009
- 69% electronic remittance advice (ERA) rate, an improvement of 10 points from Q2 2009
- 93% first pass resolution (FPR) rate, an improvement of 1 point over Q2 2009
Product Development Discussion
Product development at
athenahealth is organized around the mission of being the best in the
world at getting doctors paid for doing the right thing. Q2 2010 marked
the first full quarter during which athenahealth has had three core
service offerings in market: athenaCollector for revenue cycle
management, athenaClinicals for clinical cycle management, and
athenaCommunicator for patient cycle management. In addition, we have
two lighter products that help us to attract new clients to our core
service offerings: Anodyne Analytics, the business intelligence
capability we acquired in October of 2009 and ReminderCall, the
automated patient messaging capability we acquired in September of 2008.
To fulfill our value proposition as an ongoing service provider, we continually enhance our service offerings in response to changes in the market and we evolve our technology platform to better serve physicians. In terms of athenaCollector, during Q2, we continued to beta test automatic month-end close reconciliation, a capability aimed at reducing manual work for physician practices. We began outreach to clients to capture the data necessary to ensure their compliance with 5010 transaction standards. For all services, we rolled out a redesign to the athenaNet client homepage to streamline information flow and enhance training opportunities.
Turning to athenaClinicals, it has come a long way since its launch in 2006. Because we serve all clients across all three core services on one application, we have been able to advance athenaClinicals’ capabilities far more rapidly than a legacy software vendor might. As a result, in just four years athenaClinicals has gone from relative obscurity to a #1 standing on the KLAS mid-year survey for electronic health record (EHR) platforms in the 1 physician segment and #2 in the 2-5 and 6-25 physician segments. In addition, athenaClinicals achieved preliminary Interim Final Rule (IFR) Stage 1 EHR certification from the Certification Commission for Health Information Technology (CCHIT®). And, with the release of the Final Rule last week, we extended the deadline for participation in our 2011 HITECH Act Guarantee Program by six months to June 30, 2011.
In addition, we are part way through a national roll-out of Credit Card Plus (CCP), the most sophisticated mechanism of capturing patient health care payments that we have ever devised. Before the patient leaves the office, this capability allows us to estimate and preauthorize the collection of patient self-pay balances due after the payer conducts final adjudication of the claim. We believe CCP will significantly improve the nexus between insurance companies and the payment responsibility of their members.
As reimbursement models evolve toward clinical and quality data, athenaClinicals is positioned for continued growth as a leading EHR. Over time, we believe that athenaClinicals will remain unique in its ability to translate clinical data into revenue dollars through a combination of service and technology. As our teams identify and codify new pay for performance (P4P) programs and reimbursement opportunities, clients benefit from real-time updates to the athenaClinicals application as well as automated reporting that helps them to earn more revenue.
Finally, athenaCommunicator, our newest service offering, has experienced early success since its launch just four months ago. More than 400 physicians are already live and more than 30,000 patients have visited the patient portals of these clients, conducted hundreds of credit card transactions and received thousands of test results. In addition, our early analysis indicates that automated appointment reminders are cutting patient no-show rates for athenaCommunicator clients in half. We are very excited about athenaCommunicator’s potential to become another valuable source of both cost savings and revenue growth to our client base.
Revenue Discussion
Our total revenue of $58.6 million
in Q2 2010 grew by 28% or $12.9 million year-over-year and 7%
sequentially. Although this rate of growth is below our stated goal to
grow revenue by at least 30% annually, we believe the primary driver for
this slower than anticipated growth was a timing item related to the
Medicare claims hold that occurred during the month of June. Many
Medicare carriers held claims in June until the final legislation on the
Medicare physician fee schedule was signed by President Obama on June
29, 2010. We estimate that approximately $30 million in client
collections and about $1 million of athenahealth’s business services
revenue was shifted from Q2 2010 to Q3 2010. Now that the legislation
has passed, we have begun to collect on these claims.
In addition, our quarterly analysis of physician office activity indicates that volumes were down slightly during Q2 2010 versus Q2 2009. This is illustrated by the value of physician office visits (total collections divided by claims submitted) and the number of claims per physician (claims submitted divided by total active athenaCollector physicians) in Q2 2010 declining from Q2 2009 levels. This is a continuation of the same trend we reported in Q1 2010 relating to fewer flu-related infections following a successful inoculation season. As a result of the continuation of this trend, we have adjusted our expectations for the back half of 2010 (see Fiscal Year 2010 Outlook below).
Client Base Discussion
Annual growth in total revenue
continues to outpace growth in our physician base. We believe this trend
will continue as athenaClinicals and athenaCommunicator are included in
a growing majority of new deals and as adoption of these services
spreads across our existing client base.
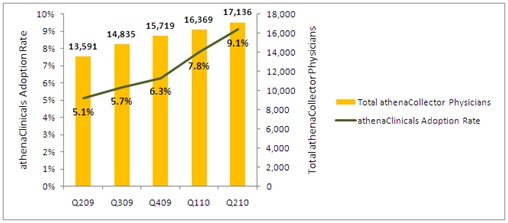
During Q2 2010, total active physicians on athenaCollector grew by 26% year-over-year to 17,136. On a sequential basis, we added 767 net new active physicians to the network, up from 395 added in Q2 2009. As a reminder, our quarterly net new physician additions may vary widely due to the number and size of larger clients that go live in a particular quarter. For example, in 2009, our quarterly net new physician additions ranged from 395 to 1,244.
Turning to athenaClinicals, we are seeing rapid growth in client adoption. Total active physicians live on athenaClinicals grew to 1,548 in the quarter, up 148% over Q2 2009. This equates to an overall adoption rate of 9% of total athenaCollector physicians, up from 5% in Q2 2009. We expect the athenaClinicals client base to increase significantly over time due to cross-selling within our existing base and growth in the volume of combined deals.
For the first time, we are excited to share athenaCommunicator provider counts. Total active physicians live on athenaCommunicator was 442 at June 30, 2010. This equates to an overall adoption rate of nearly 3% of total athenaCollector physicians. athenaCommunicator is also being adopted by brand new clients at a growing rate. During Q2 2010, 14% of new deals included all three core services. This early success demonstrates that our vision of “athenaOne”, the purchase of our full service offering as one integrated suite addressing the revenue, clinical and patient cycle needs of physician practices, is resonating with the market. We believe that enabling physicians to better streamline all aspects of the physician office workflow will become ever more important as meaningful use, coordination of care and clinical quality reporting requirements begin to impact physician reimbursement to a greater degree.
In terms of new implementations, we are pleased to confirm that three of our previously announced deals “went live” this quarter: Danbury Office of Physician Services (250 providers on athenaCollector), Lourdes Medical Associates (100 providers on athenaCollector), and Regional Health (100 providers on athenaCollector and partial on athenaClinicals). We have a number of other implementations in the pipeline with organizations such as Capella Healthcare (130 providers on athenaClinicals), Vohra Wound Physicians (100 providers on athenaCollector), Caritas Christi (500 providers on athenaClinicals), and Vanguard Health Systems (250 providers on athenaClinicals).
Non-GAAP Adjusted Gross Margin Discussion
Our Non-GAAP
Adjusted Gross Margin came in at 60.7% for Q2 2010, up from 58.6% in Q2
2009 and 58.5% in Q1 2010. Congratulations to our operations teams who
did a phenomenal job controlling unit costs for processing claims and
clinical documentation. As we have discussed for the last two quarters,
we are investing in both increased professional services capacity and
the creation of more self-service implementation tools and processes,
particularly for athenaClinicals. This month we launched the first beta
program enabling remote, automated implementation for athenaClinicals
clients in practices of 1-5 physicians. By the end of this year, we plan
to launch this capability into general availability and also plan to
offer both remote and simultaneous implementations of athenaCollector
and athenaClinicals for the small practice segment. This is an important
step in our migration toward lower cost, more rapid implementations and
equips us with greater scalability as adoption of our services increases.
Sales and Marketing Expense Discussion
GAAP sales and
marketing expense increased 43% to $12.7 million or 21.7% of total
revenue in Q2 2010, from $8.9 million or 19.5% of revenue in Q2 2009.
This is a significant year in the evolution of our sales and marketing
organization. As previously discussed, we have stepped up our
investments in this organization during 2010 as interest in our services
expands and as noise in the market on health care information technology
intensifies. Our sales and marketing investments this year are focused
on the following key initiatives:
- Hire and train approximately 30 new quota-carrying sales reps
- Intensify efforts to expand the enterprise sales pipeline
- Expand marketing programs to drive awareness and lead generation
- Enhance sales and marketing tools and CRM infrastructure
In terms of our sales force, we have added 12 new quota-carrying sales representatives year-to-date, and we currently plan to add approximately 18 quota-carrying sales representatives by year-end. Most of these reps will join our small practice sales force. In preparation for this growth in small practice sales, we have expanded from two to four sales regions and hired two new sales leaders to manage this growing team. Given that more than 70% of the nation’s doctors reside in practices of less than ten physicians1, this increased presence will enable us to capture more market share and to capitalize on opportunities associated with channels catering to smaller practices, such as the Regional Extension Centers (RECs).
____________________________
1 Health Market Science, 2010 data
We are also expanding our enterprise sales efforts. Enterprise deals have a significant impact on the growth in our physician base. However, they are also the least predictable, the most complex, and have the longest sales cycle. During the first half of 2010, our enterprise pipeline was not as robust as we would have liked it to be. As a result, we have taken the following steps to pursue new business in this market:
- Expanded our enterprise sales team
- Launched structured programs to attract and cultivate new enterprise relationships such as The athenahealth Institute, a strategic forum for health care executives facilitated by a Harvard Business School professor
- Targeted health care service companies that employ or manage physicians
|
Jonathan's iPod campaign |
As for awareness, our plan this year includes focused “flywheel campaigns” in ten markets. These campaigns are characterized by concentrated surges of marketing activity in a particular region. We conducted two of these campaigns last year and have refined our approach this year to reduce the cost per campaign while maximizing yield. We have already conducted the first flights of activity in all ten markets and thus far, are experiencing strong increases in lead volume from those regions. This year we also launched creative sales initiatives such as an Apple iPod campaign featuring Jonathan’s dancing silhouette and an invitation to learn more about athenahealth’s services. |

Lastly, our network of channel partners is growing stronger. Existing partners like PSS and new partners like RECs in Virginia and Vermont offer access to the small practice market while partnerships like that with VHA provide us with access to national networks of larger physician groups. We are very excited about these new partnerships and believe that channels will remain an important component of our go-to-market strategy, helping us to address a vast market opportunity in a scalable manner.
Balance Sheet and Cash Flow Highlights
Our cash, cash
equivalents and short-term investments totaled $89.4 million at June 30,
2010 and our debt totaled $11.0 million. Operating cash flow was $14.1
million in Q2 2010, up 88% from $7.5 million in Q2 2009. Our capital
expenditures, including capitalized software development, were $3.9
million or 6.7% of total revenue in the second quarter.
Fiscal Year 2010 Outlook
Looking ahead, we are updating
our expectations on revenue growth as we expect the softness in
physician office activity our clients experienced during the first half
of 2010 to continue during the second half of 2010. Due to this
softness, collections levels for many clients are not as robust as
previously anticipated in our 2010 forecast. As a result, while we
currently expect that Q3 2010 annual revenue growth will be 30% or
better, due in part to Medicare claims collections shifting into that
period, we do not believe Q4 2010 annual revenue growth will reach our
prior 30% target. Thus, for the full year 2010 we currently expect to
achieve 29-30% growth in total revenue over full year 2009.
In terms of profitability, we continue to expect year-over-year expansion in Adjusted Gross Margins as well as year-over-year expansion in Adjusted EBITDA and Adjusted Operating Margins during Q3 2010 and Q4 2010. We also continue to expect that our GAAP sales and marketing expense will be approximately 21% of total revenue for the full year of 2010. We will keep monitoring client performance as the year goes on and will share any relevant updates to our expectations during our Q3 2010 earnings call this fall.
Turning to our client base, as more clients adopt multiple services, average revenue per physician is rising. As mentioned in our opening remarks, this enables us to grow revenue at a faster rate than the rate of growth in our physician base. During the last year, the added complexity of and additional value earned by selling multiple services per deal has shifted the reliance on quota attainment for our sales reps toward dollars per deal versus number of deals. Although we did not sign any new enterprise clients for athenaCollector during the first half of 2010, business within the small and group practice segments has been stronger than expected. Taken together, this means we may not add as many new physicians during 2010 as we did during 2009.
Closing Remarks
We are extremely pleased with our
success at maintaining strong annual revenue growth even while migrating
to a multi-product sales and service company. As we go through this
evolution, we still believe that 30% annual revenue growth is the right
goal for us to shoot for in future years. Our rapid growth in wallet
share has been a strategic necessity and has outperformed our
expectations. As we continue to expand our sales force and our market
awareness levels, we believe that our rate of growth in market share
expansion will also increase over time. We are in the midst of our
5-year planning process and look forward to providing a more detailed
update on longer-term expectations during our 3rd Annual
Investor Summit in December.
Stock-Based Compensation Expense and Reconciliation of Non-GAAP Financial Measures
athenahealth, Inc.
STOCK-BASED COMPENSATION EXPENSE
(Unaudited,
in thousands)
Set forth below is a breakout of stock-based compensation expense for the three and six months ended June 30, 2010 and 2009:
| (unaudited, in thousands) | Three Months Ended | Six Months Ended | |||||||||
| June 30, | June 30, | ||||||||||
| 2010 | 2009 | 2010 | 2009 | ||||||||
|
Stock-based compensation charged to: |
|||||||||||
| Direct operating | $ | 652 | $ | 400 | $ | 1,120 | $ | 775 | |||
| Selling and marketing | 888 | 529 | 1,578 | 1,043 | |||||||
| Research and development | 679 | 251 | 1,003 | 494 | |||||||
| General and administrative | 1,691 | 896 | 2,993 | 1,680 | |||||||
| Total | $ | 3,910 | $ | 2,076 | $ | 6,694 | $ | 3,992 | |||
athenahealth, Inc.
RECONCILIATION OF NON-GAAP FINANCIAL
MEASURES
TO COMPARABLE GAAP MEASURES
(Unaudited, in
thousands, except per share amounts)
The following is a reconciliation of the non-GAAP financial measures used by the Company to describe the Company’s financial results determined in accordance with United States generally accepted accounting principles (GAAP). An explanation of these measures is also included below under the heading “Explanation of Non-GAAP Financial Measures”.
While management believes that these non-GAAP financial measures provide useful supplemental information to investors regarding the underlying performance of the Company’s business operations, investors are reminded to consider these non-GAAP measures in addition to, and not as a substitute for, financial performance measures prepared in accordance with GAAP. In addition, it should be noted that these non-GAAP financial measures may be different from non-GAAP measures used by other companies, and management may utilize other measures to illustrate performance in the future. Non-GAAP measures have limitations in that they do not reflect all of the amounts associated with the Company’s results of operations as determined in accordance with GAAP.
Non-GAAP Adjusted Gross Margin
Set forth below is a presentation of the Company’s “Non-GAAP Adjusted Gross Profit” and “Non-GAAP Adjusted Gross Margin,” which represents Non-GAAP Adjusted Gross Profit as a percentage of total revenue.
| (unaudited, in thousands) | Three Months Ended | Six Months Ended | |||||||||||||
| June 30, | June 30, | ||||||||||||||
| 2010 | 2009 | 2010 | 2009 | ||||||||||||
| (As Restated) | (As Restated) | ||||||||||||||
| Total revenue | $ | 58,552 | $ | 45,648 | $ | 113,029 | $ | 86,676 | |||||||
| Direct operating expense | 24,101 | 19,397 | 47,620 | 37,958 | |||||||||||
| Total revenue less direct | |||||||||||||||
| operating expense | 34,451 | 26,251 | 65,409 | 48,718 | |||||||||||
| Add: Stock-based compensation expense | |||||||||||||||
| allocated to direct operating expense | 652 | 400 | 1,120 | 775 | |||||||||||
| Add: Amortization of purchased intangibles | 460 | 80 | 920 | 160 | |||||||||||
| Non-GAAP Adjusted Gross Profit | $ | 35,563 | $ | 26,731 | $ | 67,449 | $ | 49,653 | |||||||
| Non-GAAP Adjusted Gross Margin | 60.7 | % | 58.6 | % | 59.7 | % | 57.3 | % | |||||||
Non-GAAP Adjusted EBITDA
Set forth below is a reconciliation of the Company’s “Non-GAAP Adjusted EBITDA” and “Non-GAAP Adjusted EBITDA Margin,” which represents Non-GAAP Adjusted EBITDA as a percentage of total revenue.
| (unaudited, in thousands) | Three Months Ended | Six Months Ended | |||||||||||||
| June 30, | June 30, | ||||||||||||||
| 2010 | 2009 | 2010 | 2009 | ||||||||||||
| (As Restated) | (As Restated) | ||||||||||||||
| Total Revenue | $ | 58,552 | $ | 45,648 | $ | 113,029 | $ | 86,676 | |||||||
| GAAP net income | 1,298 | 2,244 | 1,575 | 3,782 | |||||||||||
| Add: Provision for income taxes | 1,253 | 1,912 | 1,534 | 3,277 | |||||||||||
| Add (less) : Total other (income) expense | 323 | (424 | ) | 492 | (880 | ) | |||||||||
| Add: Stock-based compensation expense | 3,910 | 2,076 | 6,694 | 3,992 | |||||||||||
| Add: Depreciation and amortization | 2,657 | 1,798 | 5,077 | 3,437 | |||||||||||
| Add: Amortization of purchased intangibles | 460 | 80 | 920 | 160 | |||||||||||
| Non-GAAP Adjusted EBITDA | $ | 9,901 | $ | 7,686 | $ | 16,292 | $ | 13,768 | |||||||
| Non-GAAP Adjusted EBITDA Margin | 16.9 | % | 16.8 | % | 14.4 | % | 15.9 | % | |||||||
Non-GAAP Adjusted Operating Income
Set forth below is a reconciliation of the Company’s “Non-GAAP Adjusted Operating Income” and “Non-GAAP Adjusted Operating Income Margin.” Non-GAAP Adjusted Operating Income Margin represents Non-GAAP Adjusted Operating Income as a percentage of total revenue.
| (unaudited, in thousands) | Three Months Ended | Six Months Ended | |||||||||||||
| June 30, | June 30, | ||||||||||||||
| 2010 | 2009 | 2010 | 2009 | ||||||||||||
| (As Restated) | (As Restated) | ||||||||||||||
| Total revenue | $ | 58,552 | $ | 45,648 | $ | 113,029 | $ | 86,676 | |||||||
| GAAP net income | $ | 1,298 | $ | 2,244 | $ | 1,575 | $ | 3,782 | |||||||
| Add: Provision for income taxes | 1,253 | 1,912 | 1,534 | 3,277 | |||||||||||
| Add (less) : Total other (income) expense | 323 | (424 | ) | 492 | (880 | ) | |||||||||
| Add: Stock-based compensation expense | 3,910 | 2,076 | 6,694 | 3,992 | |||||||||||
| Add: Amortization of purchased intangibles | 460 | 80 | 920 | 160 | |||||||||||
| Non-GAAP Adjusted Operating Income | $ | 7,244 | $ | 5,888 | $ | 11,215 | $ | 10,331 | |||||||
| Non-GAAP Adjusted Operating Income Margin | 12.4 | % | 12.9 | % | 9.9 | % | 11.9 | % | |||||||
Non-GAAP Adjusted Net Income
Set forth below is a reconciliation of the Company’s “Non-GAAP Adjusted Net Income” and “Non-GAAP Adjusted Net Income per Diluted Share.”
| (unaudited, in thousands except per share amounts) | Three Months Ended | Six Months Ended | ||||||||||||||
| June 30, | June 30, | |||||||||||||||
| 2010 | 2009 | 2010 | 2009 | |||||||||||||
| (As Restated) | (As Restated) | |||||||||||||||
| GAAP net income | $ | 1,298 | $ | 2,244 | $ | 1,575 | $ | 3,782 | ||||||||
| (Less) Add: (Gain) loss on interest rate derivative | 304 | (308 | ) | 364 | (500 | ) | ||||||||||
| Add: Stock-based compensation expense | 3,910 | 2,076 | 6,694 | 3,992 | ||||||||||||
| Add: Amortization of purchased intangibles | 460 | 80 | 920 | 160 | ||||||||||||
| Sub-total of tax deductible items | 4,674 | 1,848 | 7,978 | 3,652 | ||||||||||||
| (Less): Tax impact of tax deductible items (1) | (1,870 | ) | (739 | ) | (3,191 | ) | (1,461 | ) | ||||||||
| Non-GAAP Adjusted Net Income | $ | 4,102 | $ | 3,353 | $ | 6,362 | $ | 5,973 | ||||||||
| Weighted average shares - diluted | 35,178 | 34,822 | 35,190 | 34,818 | ||||||||||||
| Non-GAAP Adjusted Net Income per Diluted Share | $ | 0.12 | $ | 0.10 | $ | 0.18 | $ | 0.17 | ||||||||
| (1) - Tax impact calculated using federal statutory tax rate of 34% and a blended state tax rate of 6% | ||||||||||||||||
| *Note that Other (income) expense is no longer excluded per revised non-GAAP methodology as discussed in our Current Report on Form 8-K filed with the SEC on February 4, 2010 | ||||||||||||||||
| (unaudited, in thousands except per share amounts) | Three Months Ended | Six Months Ended | ||||||||||||||
| June 30, | June 30, | |||||||||||||||
| 2010 | 2009 | 2010 | 2009 | |||||||||||||
| (As Restated) | (As Restated) | |||||||||||||||
| GAAP net income per share - diluted | $ | 0.04 | $ | 0.06 | $ | 0.04 | $ | 0.11 | ||||||||
| (Less) Add: (Gain) loss on interest rate derivative | 0.01 | (0.01 | ) | 0.01 | (0.01 | ) | ||||||||||
| Add: Stock-based compensation expense | 0.11 | 0.06 | 0.19 | 0.11 | ||||||||||||
| Add: Amortization of purchased intangibles | 0.01 | - | 0.03 | - | ||||||||||||
| Sub-total of tax deductible items | 0.13 | 0.05 | 0.23 | 0.10 | ||||||||||||
| (Less): Tax impact of tax deductible items (1) | (0.05 | ) | (0.01 | ) | (0.09 | ) | (0.04 | ) | ||||||||
| Non-GAAP Adjusted Net Income per Diluted Share | $ | 0.12 | $ | 0.10 | $ | 0.18 | $ | 0.17 | ||||||||
| Weighted average shares - diluted | 35,178 | 34,822 | 35,190 | 34,818 | ||||||||||||
| (1) - Tax impact calculated using federal statutory tax rate of 34% and a blended state tax rate of 6% | ||||||||||||||||
| *Note that Other (income) expense is no longer excluded per revised non-GAAP methodology as discussed in our Current Report on Form 8-K filed with the SEC on February 4, 2010 | ||||||||||||||||
Explanation of Non-GAAP Financial Measures
The Company
reports its financial results in accordance with United States generally
accepted accounting principles, or GAAP. However, management believes
that in order to properly understand the Company's short-term and
long-term financial and operational trends, investors may wish to
consider the impact of certain non-cash or non-recurring items, when
used as a supplement to financial performance measures in accordance
with GAAP. These items result from facts and circumstances that vary in
frequency and/or impact on continuing operations. Management also uses
results of operations before such items to evaluate the operating
performance of the Company and compare it against past periods, make
operating decisions, and serve as a basis for strategic planning. These
non-GAAP financial measures provide management with additional means to
understand and evaluate the operating results and trends in the
Company’s ongoing business by eliminating certain non-cash expenses and
other items that management believes might otherwise make comparisons of
the Company’s ongoing business with prior periods more difficult,
obscure trends in ongoing operations, or reduce management’s ability to
make useful forecasts. Management believes that these non-GAAP financial
measures provide additional means of evaluating period-over-period
operating performance. In addition, management understands that some
investors and financial analysts find this information helpful in
analyzing the Company’s financial and operational performance and
comparing this performance to its peers and competitors.
Management defines “Non-GAAP Adjusted Gross Profit” as total revenue, less direct operating expense, plus stock-based compensation expense allocated to direct operating expense and amortization of purchased intangibles, and “Non-GAAP Adjusted Gross Margin” as non-GAAP Adjusted Gross Profit as a percentage of total revenue. Management considers these non-GAAP financial measures to be important indicators of the Company’s operational strength and performance of its business and a good measure of its historical operating trends. Moreover, management believes that these measures enable investors and financial analysts to closely monitor and understand changes in the Company’s ability to generate income from ongoing business operations.
Management defines “Non-GAAP Adjusted EBITDA” as the sum of GAAP net income before provision for (benefit from) income taxes, total other (income) expense, stock-based compensation expense, depreciation and amortization, acquisition-related expenses and amortization of purchased intangibles and “Non-GAAP Adjusted EBITDA Margin” as Non-GAAP Adjusted EBITDA as a percentage of total revenue. Management defines “Non-GAAP Adjusted Operating Income” as the sum of GAAP net income before provision for (benefit from) income taxes, total other (income) expense, stock-based compensation expense, acquisition-related expenses and amortization of purchased intangibles and “Non-GAAP Adjusted Operating Income Margin” as Non-GAAP Adjusted Operating Income as a percentage of total revenue. Management defines “Non-GAAP Adjusted Net Income” as the sum of GAAP net income before unrealized (gain) loss on an interest rate derivative, stock-based compensation expense, acquisition-related expenses, amortization of purchased intangibles, and any tax impact related to these items, and “Non-GAAP Adjusted Net Income per Diluted Share” as Non-GAAP Adjusted Net Income divided by weighted average diluted shares outstanding. Management considers these non-GAAP financial measures to be important indicators of the Company’s operational strength and performance of its business and a good measure of its historical operating trends, in particular the extent to which ongoing operations impact the Company’s overall financial performance.
Management excludes each of the items identified below from the applicable non-GAAP financial measure referenced above for the reasons set forth with respect to that excluded item:
- Stock-based compensation expense — excluded because these are non-cash expenses that management does not consider part of ongoing operating results when assessing the performance of the Company’s business, and also because the total amount of expense is partially outside of the Company’s control because it is based on factors such as stock price volatility and interest rates, which may be unrelated to our performance during the period in which the expense is incurred.
- Acquisition-related expenses and amortization of purchased intangibles — acquisition-related expenses are reported at the time acquisition costs are incurred, and purchased intangibles are amortized over a period of several years after the acquisition and generally cannot be changed or influenced by management after the acquisition. Accordingly, these items are not considered by management in making operating decisions, and management believes that such expenses do not have a direct correlation to future business operations. Thus, including such charges does not accurately reflect the performance of the Company’s ongoing operations for the period in which such charges are incurred.
- Unrealized gains and losses on interest rate derivative — excluded because until they are realized, to the extent these gains or losses impact a period presented, management does not believe that they reflect the underlying performance of ongoing business operations for such period.
|
Supplemental Metrics and Definitions |
||||||||||||
|
|
||||||||||||
|
Supplemental Metrics (unaudited) |
||||||||||||
| Last Updated: June 30, 2010 | ||||||||||||
|
|
||||||||||||
| Fiscal Year 2009 |
Fiscal Year 2010 |
|||||||||||
| Q1 | Q2 | Q3 | Q4 | Q1 | Q2 | |||||||
|
Client Base |
||||||||||||
| Total Accounts | 1,333 | 1,406 | 1,507 | 1,592 | 1,684 | 1,753 | ||||||
| Total Physicians on athenaCollector | 13,196 | 13,591 | 14,835 | 15,719 | 16,369 | 17,136 | ||||||
| Total Providers on athenaCollector | 19,739 | 20,323 | 22,100 | 23,366 | 23,978 | 24,782 | ||||||
| Total Physicians on athenaClinicals | 574 | 624 | 780 | 920 | 1,275 | 1,548 | ||||||
| Total Providers on athenaClinicals | 949 | 1,043 | 1,270 | 1,471 | 1,867 | 2,256 | ||||||
| Total Physicians on athenaCommunicator | n/a | n/a | n/a | n/a | n/a | 442 | ||||||
| Total Providers on athenaCommunicator | n/a | n/a | n/a | n/a | n/a | 689 | ||||||
|
Client Performance |
||||||||||||
| Client Satisfaction | 82.4% | 86.7% | 86.4% | 88.7% | 86.6% | 86.1% | ||||||
| Client Days in Accounts Receivable (DAR) | 44.3 | 40.2 | 39.3 | 38.5 | 40.0 | 38.8 | ||||||
| First Pass Resolution (FPR) Rate | 91.4% | 92.3% | 92.5% | 93.5% | 93.1% | 93.4% | ||||||
| Electronic Remittance Advice (ERA) Rate | 55.5% | 58.5% | 64.2% | 68.0% | 68.9% | 68.8% | ||||||
| Total Claims Submitted | 9,073,155 | 9,414,482 | 9,970,800 | 11,582,674 | 11,175,099 | 11,312,806 | ||||||
| Total Client Collections | $ 1,085,652,593 | $ 1,208,859,985 | $ 1,223,100,008 | $ 1,355,616,378 | $ 1,312,820,931 | $ 1,421,347,731 | ||||||
| Total Working Days | 61 | 64 | 64 | 62 | 61 | 64 | ||||||
|
Employees |
||||||||||||
| Direct | 547 | 565 | 570 | 582 | 630 | 675 | ||||||
| Sales & Marketing | 99 | 101 | 110 | 123 | 157 | 168 | ||||||
| Research & Development | 128 | 150 | 162 | 177 | 172 | 187 | ||||||
| General & Administrative | 112 | 126 | 129 | 133 | 130 | 136 | ||||||
| Total Employees* | 886 | 942 | 970 | 1,014 | 1,087 | 1,166 | ||||||
|
Quota Carrying Sales Force |
||||||||||||
| Small Practice | 18 | 17 | 20 | 22 | 25 | 27 | ||||||
| Group Practice | 16 | 17 | 18 | 18 | 20 | 23 | ||||||
| Enterprise Segment | 5 | 5 | 5 | 5 | 5 | 6 | ||||||
| Cross-Sell | 4 | 4 | 5 | 5 | 5 | 6 | ||||||
| Total Quota Carrying Sales Representatives | 43 | 43 | 48 | 50 | 55 | 62 | ||||||
| *Headcount for Q409 has been adjusted to reflect full-time equivalent (FTE) methodology versus individual headcount methodology as reported in the Company's 2009 Annual Report on Form 10-K | ||||||||||||
|
|
|
| Supplemental Metrics Definitions | |
| Last Updated: June 30, 2010 | |
| Client Base | |
| Total Accounts | The number of discrete clients that are actively invoiced by athenahealth during the last 91 days. |
| Total Physicians on athenaCollector | The number of physicians that have rendered a service which generated a medical claim that was billed during the last 91 days on the athenaCollector platform. Examples of physicians include Medical Doctors (MD) and Doctor of Osteopathic Medicine (DO). |
| Total Providers on athenaCollector | The number of providers, including physicians, that have rendered a service which generated a medical claim that was billed during the last 91 days on the athenaCollector platform. Examples of non-physician providers are Nurse Practitioners (NP) and Registered Nurses (RN). |
| Total Physicians on athenaClinicals | The number of physicians that have rendered a service through the athenaClinicals platform which generated a medical claim that was billed during the last 91 days on the athenaCollector platform. Examples of physicians include Medical Doctors (MD) and Doctor of Osteopathic Medicine (DO). |
| Total Providers on athenaClinicals | The number of providers, including physicians, that have rendered a service through the athenaClinicals platform which generated a medical claim that was billed during the last 91 days on the athenaCollector platform. Examples of non-physicians are Nurse Practitioners (NP) and Registered Nurses (RN). |
| Total Physicians on athenaCommunicator | The number of physicians that have rendered a service which generated a medical claim that was billed during the last 91 days on the athenaCollector platform and whose practice is actively using athenaCommunicator. |
| Total Providers on athenaCommunicator | The number of providers, including physicians, that have rendered a service which generated a medical claim that was billed during the last 91 days on the athenaCollector platform and whose practice is actively using athenaCommunicator. |
| Client Performance | |
| Client Satisfaction | The percentage of athenaCollector clients who chose 4 or 5 on a scale of 1 to 5 when asked if they would recommend athenahealth to a trusted friend or colleague. These responses are generated from a "client listening" survey that the company conducts for two segments of its client base twice per year. |
| Client Days in Accounts Receivable (DAR) | The average number of days that it takes outstanding balances on claims to be resolved, e.g. paid, for clients on athenaCollector. Clients that have been live less than 90 days are excluded, as well as clients who are terminating services. |
| First Pass Resolution (FPR) Rate | Approximates the percentage of primary claims that are favorably adjudicated and closed after a single submission during the period. Currently, the FPR rate is calculated on a monthly basis, and certain practices are excluded (e.g. those that have been live for less than 90 days). |
| Electronic Remittance Advice (ERA) Rate | Remittance refers to the information about payments (a/k/a explanations of benefits) received from insurance companies during the period. The ERA rate reflects the percentage of total charges that were posted using electronic remittance. |
| Total Claims Submitted | The number of claims billed through athenaNet during the period. |
| Total Client Collections | The dollar value of collections posted on behalf of clients during the period. |
| Total Working Days | The total number of days during the quarter minus weekends and U.S. Post Office holidays. |
| Employees | |
| Direct | The total number of full time equivalent individuals (FTEs) employed by the Company to support its service operations as of quarter end. This team includes production systems, enrollment services, paper claim submission, claim resolution, clinical operations, professional services, account management, and client services. |
| Sales & Marketing | The total number of FTEs employed by the Company to support its sales and marketing efforts as of quarter end. This team includes sales representatives, business development staff and the marketing team. |
| Research & Development | The total number of FTEs employed by the Company to support its research and development efforts as of quarter end. This team includes product development and product management. |
| General & Administrative | The total number of FTEs employed by the Company to support its general and administrative functions as of quarter end. This team includes finance, human resources, compliance, learning and development, internal audit, corporate technology, recruiting, facilities, and legal. |
| Total Employees | The total number of FTEs employed by the Company as of quarter end. This number excludes interns and seasonal employees. |
| Quota-Carrying Sales Force | |
| Small Practice | Quota-carrying sales representatives assigned to bring in net new annual recurring revenue from the small practice segment (organizations with 1-3 physicians) as of quarter end. |
| Group Practice | Quota-carrying sales representatives assigned to bring in net new annual recurring revenue from the group practice segment (organizations with 4-150 physicians) as of quarter end. |
| Enterprise Segment | Quota-carrying sales representatives assigned to bring in net new annual recurring revenue from the enterprise market segment (organizations with150+ physicians) as of quarter end. |
| Cross-Sell | Quota-carrying sales representatives assigned to bring in net new annual recurring revenue from the sale of additional services to existing athenaCollector clients as of quarter end. |
| Total Quota Carrying Sales Representatives | The total number of sales representatives who carry quota for net new annual recurring revenue as of quarter end. |
15