Attached files
| file | filename |
|---|---|
| EX-99.1 - PRESS RELEASE - NETFLIX INC | dex991.htm |
| 8-K - FORM 8-K - NETFLIX INC | d8k.htm |
Exhibit 99.2
Safe Harbor Statement
Today’s management commentary contains forward-looking statements relating to future events or future financial performance that involve risks and uncertainties. Actual results may differ materially from those anticipated in these statements based on a number of factors, including those identified in the company’s annual report on Form 10-K filed with the SEC on February 22, 2010.
This commentary also contains references to non-GAAP financial measures. A presentation of and reconciliation to the most directly comparable GAAP financial measure, where such can be done without unreasonable effort, can be found on our Web site at http://ir.netflix.com.
Reed Hastings, CEO, Netflix
Q2 was another amazing quarter for us. Our Y/Y subscriber growth accelerated to 42%, our revenue growth accelerated to 27%, and GAAP EPS grew 48%. For the last two quarters, the acceleration of our growth has been astounding, driven by the increasing appeal of streaming. This kind of rapid acceleration is unlikely to continue for long, but as our guidance for Q3 implies, we do see it continuing in the third quarter. The mid-point of our Q3 guidance represents an increase from Q2’s 42% Y/Y subscriber growth rate to a 49% annual growth rate. We’ll know more about Q4 in October, but for now we are being prudent in forecasting that we’ll maintain an amazing 48% annual growth rate for Q4.
Turning to the P&L for Q2, we spent less than expected on cost of subscription, and more than we initially planned on marketing. This quarter more subscribers streamed more content and our Y/Y disc shipment growth, while positive, was less than we had forecast. Within a given quarter, it’s difficult to license more streaming content on such short notice, so we split the upside from lower shipment growth between marketing, which drove more subscriber growth, and earnings. Looking forward at the next two quarters, we’ll be investing the upside in the combination of streaming content and marketing as both drive subscriber growth. If we find enough content deals where the terms make sense to us, we’ll be spending lots more on streaming content. Otherwise, we can spend more on marketing. Either way our goal is to continue to drive growth and deliver earnings consistent with our guidance.
1
We’re investing aggressively in streaming content because of the clear benefits to the business - faster subscriber growth due to the attractiveness of our offering that includes great streaming and less growth in disc shipments due to substitution.
In terms of streaming content, we are rapidly expanding our TV shows available for streaming and since our last call we have added thousands of TV episodes from new deals with Fox, MTV Networks and Warner Television. These shows include all seasons of 24, Futurama, Lie To Me, The Chapelle Show, Nip/Tuck and Veronica Mars, and in a few weeks all seasons of The Family Guy will be available to stream as well. We see TV shows as equally important to our franchise as movies.
As we evolve from DVD by mail into streaming, the role of exclusive content changes. Exclusives in the DVD arena don’t work because of the First Sale copyright doctrine, but are a core part of the Pay-TV market into which we are growing. To date, we’ve been an outlier in the Pay-TV segment by not having any exclusive content. At this point we can start to afford some major TV shows and movies on an exclusive basis, and plan going forward on a mix of more-expensive exclusive content and lower-cost non-exclusive content. Our willingness to license some higher-priced exclusive content will open up new licensing opportunities for us.
In our deal with Relativity Media, for example, we gained the exclusive rights for a set of their movies for subscription. We’re very excited to get these movies and are looking for more exclusive deals, especially on TV shows, as well as non-exclusive content.
As we add more content, and more platforms, we are fortunate to have no single deal for content or platform accounting for more than about 20% of our streaming viewing, so we have reasonable and not excessive concentration risks with our suppliers. As we add even more content and platforms, we expect this modest concentration risk to decline further.
We recently announced that we would be launching a pure streaming service in Canada in the fall and we will have more to say about that on our call in October. We chose Canada because it forms a great validation market for us in terms of pure streaming. Our future international streaming-only investments will be dependent on our learning in Canada.
2
In terms of streaming platforms, we are very pleased with our success in getting on even more devices. In Q2, we launched Netflix on Nintendo Wii and Apple iPad and saw the introduction of dozens of new TVs and Blu-ray players from partners such as LG, Samsung, Sanyo, Sharp, Sony, Toshiba and VIZIO and by the end of the year we expect Netflix to be available on over 100 million devices in consumers’ homes. Not only are we adding more platforms, but we are also making significant improvements in our existing platforms. Before our next call in October, we expect to be launching a major new version of our Sony PS3 user interface which doesn’t require a disc, and is dynamically updated continuously with the latest Netflix UI improvements.
Looking at competition, consumers have an enormous array of choices for their entertainment. A new choice consumers now have is Hulu Plus, which directly competes with us in subscription streaming. Once Hulu Plus has a few hundred thousand subscribers we’ll be able to learn from consumers what they like about Hulu Plus. Then we’ll work to incorporate what we find back into Netflix. The Hulu team is sharp, and we’re not going to underestimate them. In the long term, Hulu Plus and Netflix share the same major competitive threat, which is the MVPD’s (multichannel video programming distributor) getting so much better that fewer consumers choose to supplement with Netflix or Hulu Plus.
In summary, Q2 was a great quarter and we are very well positioned to continue to benefit from the growth of Internet video. We know, however, there are many risks for our business, and we are staying as vigilant and focused as ever in this time of astounding business acceleration.
Barry McCarthy, CFO, Netflix
Accelerating subscriber growth and record high profit were the dominant themes of our Q2 results. The faster subscriber growth was expected but not the record high profit, which is why we beat our guidance for Q2 earnings. The outperformance in Q2 has important implications for long term growth and profit. Why were profits so strong this quarter? The answer is “streaming”. More about that shortly.
Q2 Results
Gross margin for the quarter was 39.4%. That’s the largest Y/Y improvement (530bps) in the last four years. Disc shipments continue to grow on a Y/Y basis, but less than we had expected and less than revenue growth, which explains the margin improvement. In particular, lower disc usage per subscriber was the primary driver of margin improvement, owing first, to the increased popularity of our $8.99 plan, and second, to substitution behavior which depressed disc usage.
3
On the 2008 Q4 earnings call, I said there were signs of DVD usage declines among early adopters of streaming. I said, other things being equal, Netflix profit margins would expand if streaming substitution became a mainstream consumer behavior, with postage and packaging expense replaced by streaming delivery expense.
Now, six quarters later, the data clearly suggests that the substitution behavior first exhibited by early adopters is also being exhibited by mainstream subscribers. As previously mentioned, disc shipments are still growing on a Y/Y basis, but at a slower rate than last quarter. As a result, we saw lower disc usage in Q2 than we expected. More on the margin implications for guidance in a moment.
Subscriber acquisition cost (SAC) of $24.37 increased sequentially and on a Y/Y basis. This was a managed outcome. As the quarter progressed, and it became apparent we would ship fewer discs than forecast and overshoot our gross profit targets, we increased marketing spending in marginally less efficient marketing channels.
Churn of 4% was down 50 bps on a Y/Y basis. Consumer engagement with streaming continues to explain the improvement. Sequentially, churn increased 20 bps, but the seasonal increase was 10 bps better than a year ago because of the consumer appeal of streaming.
Guidance
The upward revision in our full-year guidance reflects the momentum we currently see in the business, particularly with respect to subscriber growth.
As Reed mentioned, we continue to invest aggressively in streaming content. We have several new deals in the pipeline. If we close those new deals, as expected, streaming content expense will increase significantly over the next two quarters, which will decrease gross margin from Q2 levels. By making the Netflix service a better value proposition and better user experience than it is today, we expect to recoup our streaming investment through incremental subscriber growth, lower churn, lower SAC, and increased operating profit and cash flow. These expectations are incorporated in our Q3 and Q4 guidance.
4
Given the nature of the business, it’s possible we’ll license less streaming content than we’re currently forecasting. In that event, you should expect us to redeploy funds to marketing, in which case subscribers would likely grow faster than we’re currently forecasting, at slightly higher SAC and slightly higher churn.
Much has been written lately about the prospect of postal rate increases in 2011 and beyond. I believe the impact on our margin structure will be small. The substitution effects I spoke of earlier, where content consumption continues to marginally shift from DVD by mail to streamed movies and TV, will more than offset the impact of postal rate changes on our margin structure.
Buyback Update
We continued to repurchase Netflix shares in the second quarter, even at record high prices. In total, we spent $44 million repurchasing 0.4 million shares at an average cost of $108.24 per share in the second quarter.
Cumulatively, we have returned $776 million to shareholders by repurchasing 21.5 million Netflix shares at an average cost of $36.06 per share. This represents 40% of the 54.3 million average fully diluted share count in Q2.
We finished the quarter with $279 million in cash and short-term investments and $200 million in long term debt. The balance sheet remains strong, with very modest leverage. We plan to keep it that way for the foreseeable future, with no plans for additional debt.
Closing Thoughts
If you’ve watched the Netflix streaming ecosystem grow over the past three years and wondered about the implications for our business model, or perhaps been frustrated by our limited disclosure of streaming metrics (for competitive reasons), the financial results year-to-date and our guidance through 2010 should give you confidence that the business model is working well and our financial results are solid.
5
 1
Q2’10 Financial Highlights |
July 21, 2010 |
 This presentation contains forward-looking statements relating to
future
events
or
future
financial
performance
that
involve
risks
and
uncertainties. Actual results may differ materially from those anticipated
in these statements based on a number of factors, including those
identified in the company’s annual report on
Form 10-K filed with the SEC on February 22, 2010.
This presentation also contains references to non-GAAP financial
measures. A presentation of and reconciliation to the most directly
comparable GAAP financial measure, where such can be done
without
unreasonable
effort,
can
be
found
on
our
Web
site
at
http://ir.netflix.com.
Forward-Looking Statements and
Non-GAAP Financial Measurements |
 Netflix
Goals
>
Be a great Internet movie and TV show
service by
combining Internet
streaming with
DVD by mail
>
Materially grow
subscribers
and
EPS
every year |
 Q2
Results Actual
Q2’10 Guidance
$517m
$525m
14,700k
15,000k
$34m
$40m
15,001k
$519.8m
$43.5m
Subscribers
Revenue
GAAP Net Income |
 (in
thousands) Netflix Subscribers
Subscriber Growth |
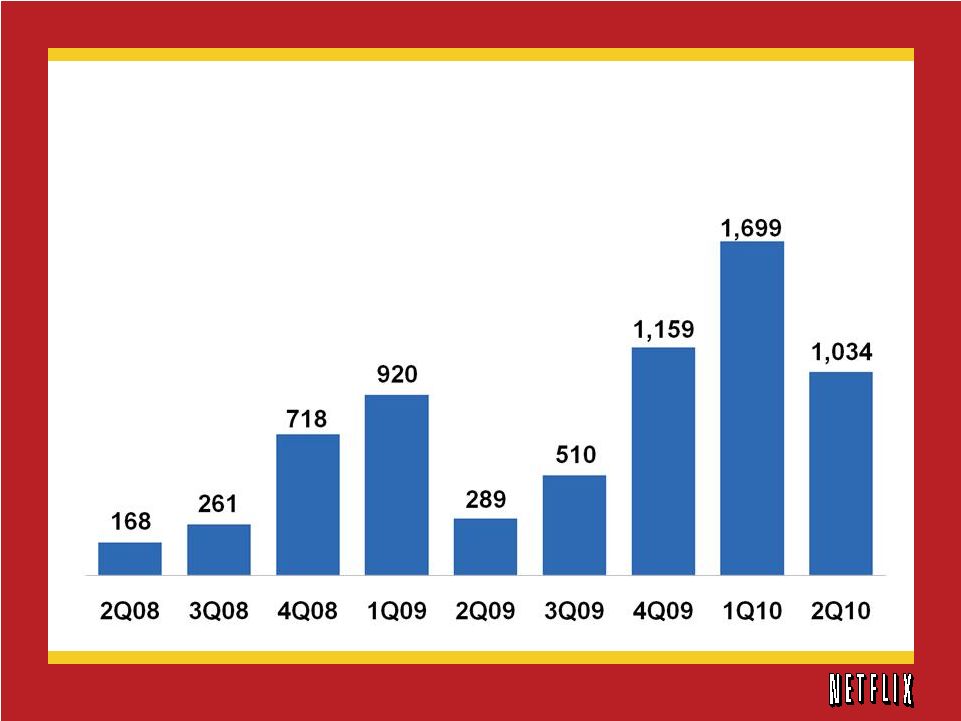 Net
Additions (in thousands)
Net Subscriber Additions |
 Note:
Netflix
implemented
price
reductions
in
July
2007
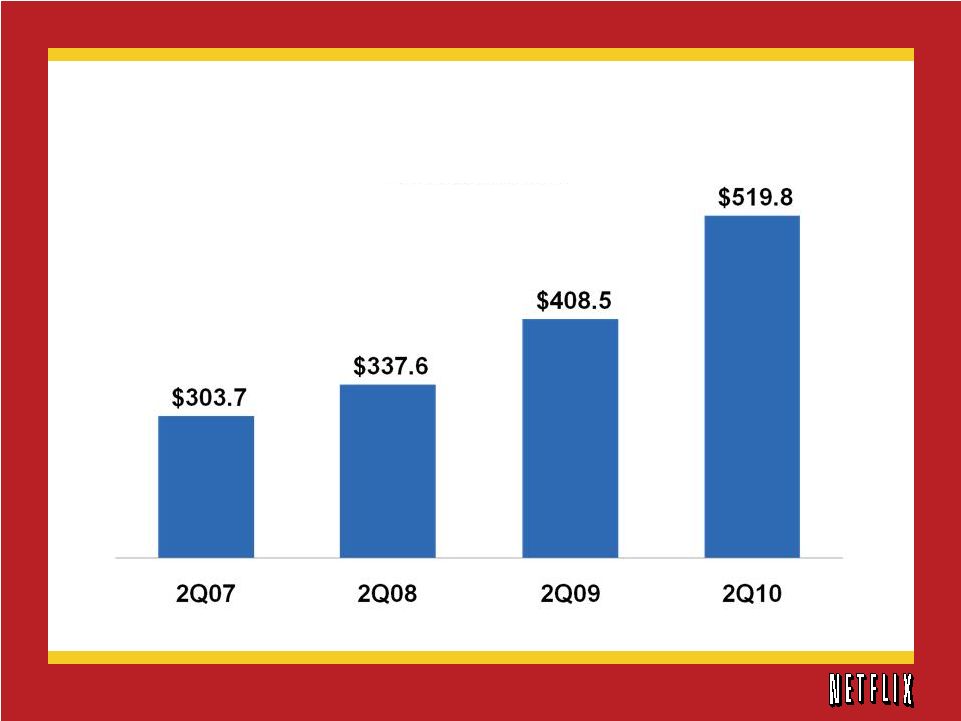
Q2 Revenue
(in millions)
Total Revenue |
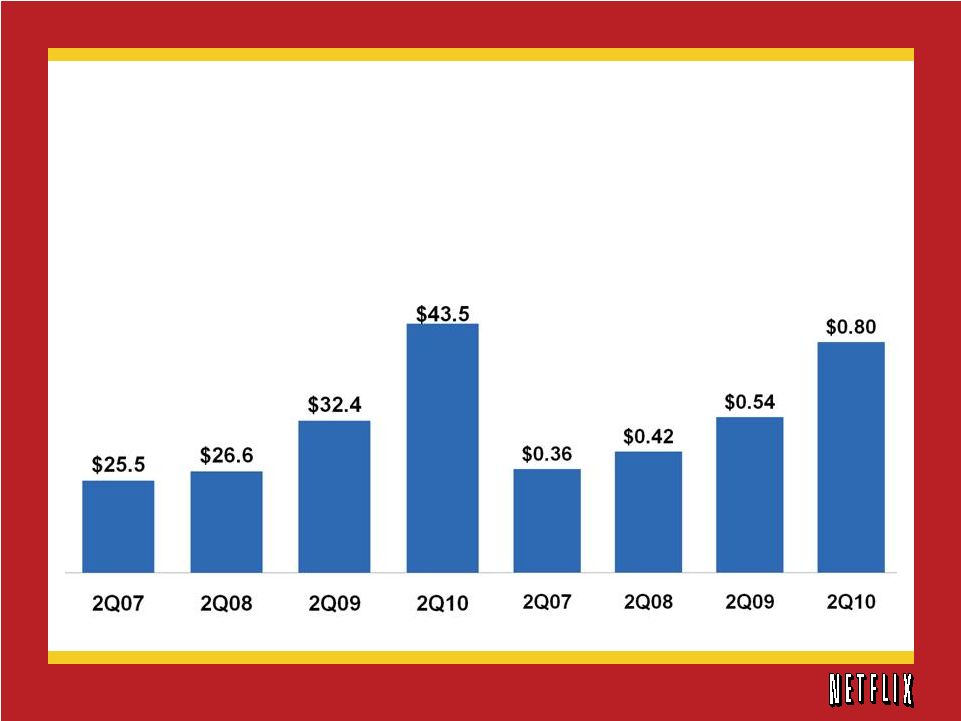 Q2
GAAP Net Income & Fully Diluted EPS (in millions)
Net Income
Earnings per Share |
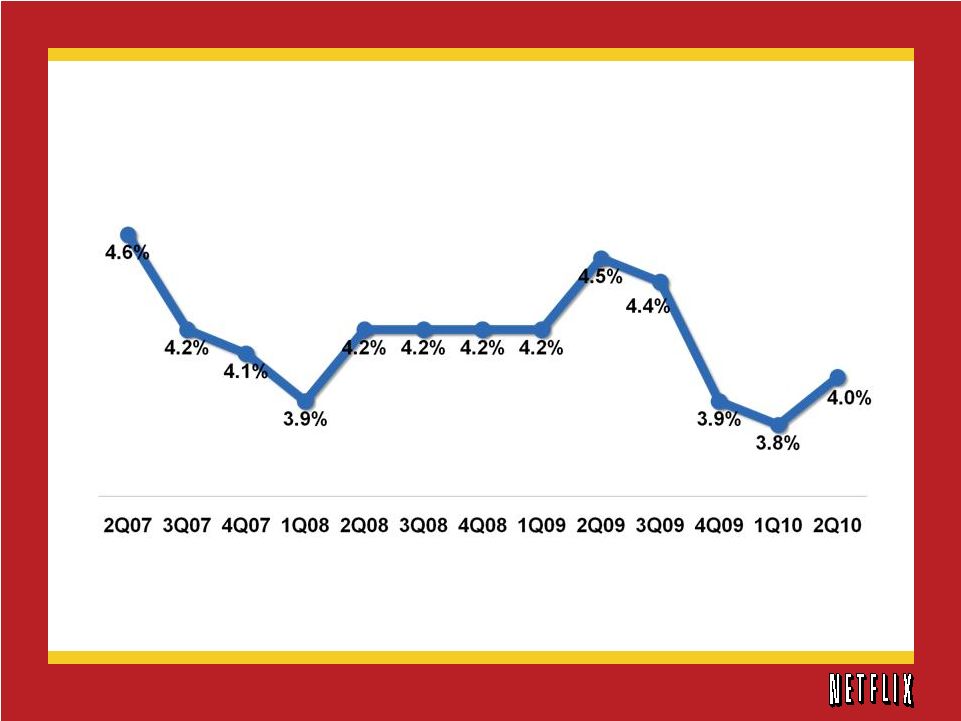 Churn |
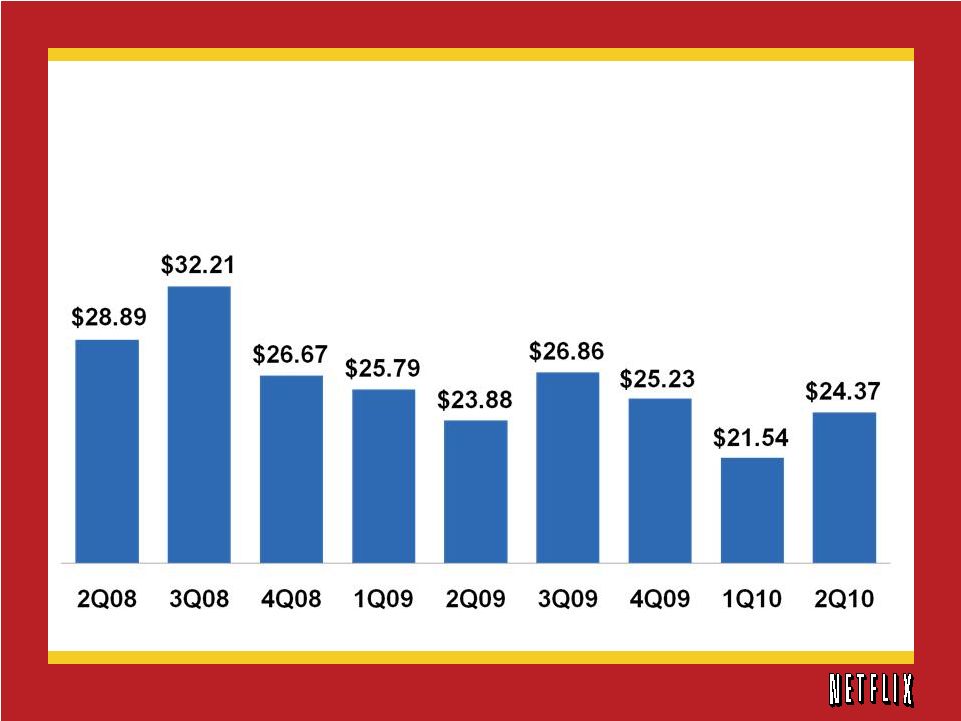 Subscriber Acquisition Cost |
 Free
Cash Flow 2Q09
3Q09
4Q09
1Q10
2Q10
Non-GAAP Free Cash Flow
Reconciliation:
Net cash provided by operating
activities
$75,302
$78,311
$105,817
$77,205
$60,252
Purchases of property and
equipment
(6,933)
(9,994)
(22,433)
(6,393)
(5,671)
Acquisition of intangible asset
-
-
-
(130)
-
Acquisitions of DVD content library
(43,224)
(46,273)
(57,048)
(36,902)
(24,191)
Proceeds from sale of DVDs
1,159
3,345
3,934
3,984
3,815
Other assets
11
134
(72)
(172)
10
Non-GAAP Free Cash Flow
$26,315
$25,523
$30,198
$37,592
$34,215
(in thousands) |
 3Q10
4Q10
FY ’10
Subscribers
16.3 –
16.7M
17.7 –
18.5M
17.7 –
18.5M
Revenue
$546 –
554M
$580 –
596M
$2.14 –
2.16B
GAAP Net
Income
$33 –
40M
$32 –
40M
$141 –
156M
GAAP EPS*
$0.61 –
0.74
$0.58 –
0.73
$2.58 –
2.86
*Fully Diluted
Business Outlook |
 1Q09
2Q09
3Q09
4Q09
1Q10
2Q10
Subscribers (M)
10.3
10.6
11.1
12.3
14.0
15.0
Y/Y Change
25%
26%
28%
31%
35%
42%
Revenue (M)
$394
$409
$423
$445
$494
$520
Y/Y Change
21%
21%
24%
24%
25%
27%
Operating Profit (M)
$36
$53
$49
$53
$58
$77
Y/Y Change
138%
54%
45%
41%
60%
47%
Net Income (M)
$22
$32
$30
$31
$32
$44
Y/Y Change
68%
22%
48%
36%
44%
34%
EPS*
$0.37
$0.54
$0.52
$0.56
$0.59
$0.80
Y/Y Change
76%
29%
58%
47%
59%
48%
% of Subscribers
Watching Instantly > 15
minutes
36%
37%
41%
48%
55%
61%
Quarterly Summary Financials
*Fully Diluted |
 2005
2006
2007
2008
2009
Mid-point of
Guidance
2010
Subscribers (M)
4.2
6.3
7.5
9.4
12.3
18.1
Y/Y Change
60%
51%
18%
26%
31%
47%
Revenue (M)
$682
$997
$1,205
$1,365
$1,670
$2,150
Y/Y Change
36%
46%
21%
13%
22%
29%
Operating Profit (M)
$3
$65
$92
$122
$192
--
Y/Y Change
-86%
2387%
41%
32%
58%
Net Income (M)
$42
$49
$67
$83
$116
$149
Y/Y Change
96%
17%
36%
25%
40%
28%
EPS*
$0.64
$0.71
$0.97
$1.32
$1.98
$2.72
Y/Y Change
94%
11%
37%
36%
50%
37%
% of Subscribers
Watching Instantly > 15
minutes
NA
NA
NA
28%
48%
--
Fiscal Year Summary Financials
*Fully Diluted |
 15
Q2’10 Financial Highlights |
July 21, 2010 |