Attached files
| file | filename |
|---|---|
| 8-K - 8-K - BEACON POWER CORP | a10-14370_18k.htm |
Exhibit 99.1
|
|
Beacon Power Corporation 2010 Annual Shareholder Meeting July 21, 2010 |
|
|
Safe Harbor Statement This presentation contains forward-looking statements, including the Company’s beliefs about its business prospects and future results of operations. These statements involve risks and uncertainties. Among the important additional factors that could cause actual results to differ materially from those forward-looking statements are risks associated with the overall economic environment, the successful execution of the Company’s plan of operation, changes in the Company’s anticipated earnings, continuation of current contracts, changes in energy and other applicable regulations, and other factors detailed in the company’s filings with the Securities and Exchange Commission, including its most recent Forms 10-K and 10-Q. In addition, the factors underlying Company forecasts are dynamic and subject to change and therefore those forecasts speak only as of the date they are given. The Company does not undertake to update them; however, it may choose from time to time to update them and if it should do so, it will disseminate the updates to the investing public. 2 |
|
|
DOE Loan Guarantee Final stages of closing process Legal teams “burning midnight oil” to finalize terms and conditions Stephentown construction still on schedule All efforts being made to close ASAP 3 |
|
|
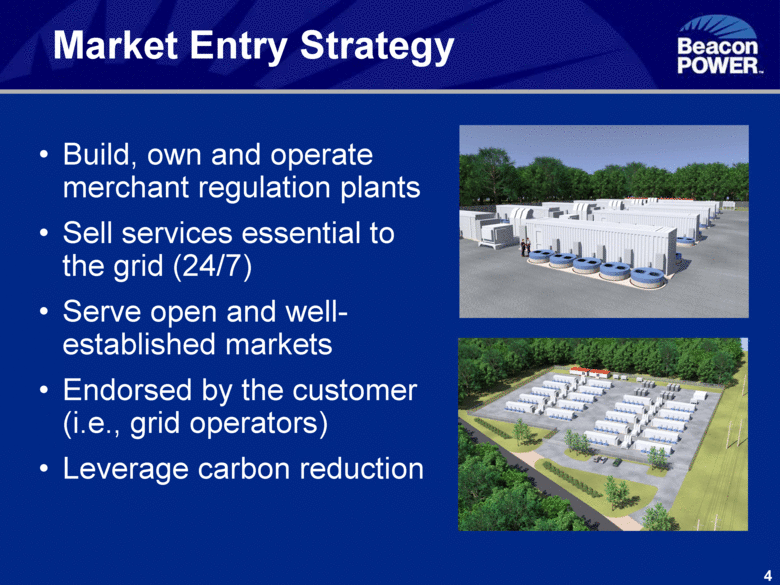
4 Market Entry Strategy Build, own and operate merchant regulation plants Sell services essential to the grid (24/7) Serve open and well-established markets Endorsed by the customer (i.e., grid operators) Leverage carbon reduction |
|
|
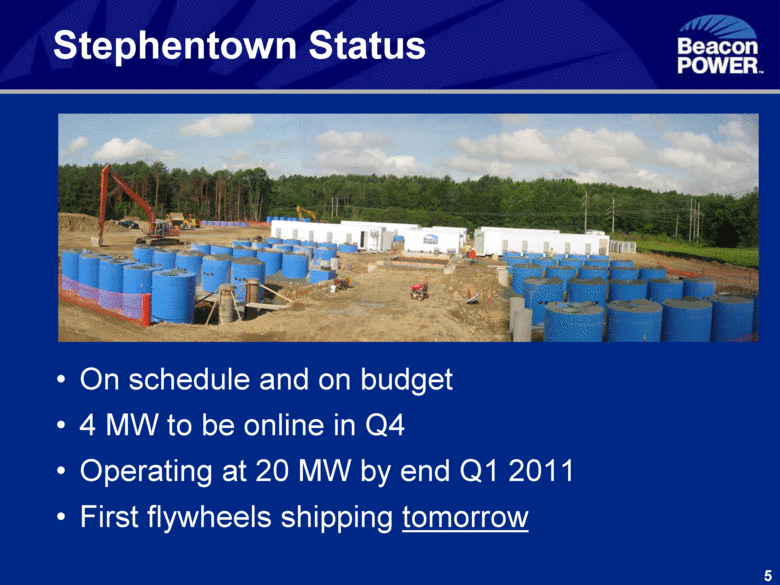
Stephentown Status On schedule and on budget 4 MW to be online in Q4 Operating at 20 MW by end Q1 2011 First flywheels shipping tomorrow 5 |
|
|
Frequency Regulation Pricing Electricity market prices are down from 2008 Regulation rates have tracked energy prices No observer believes this situation will persist As the overall economy recovers, energy and regulation pricing is expected to follow suit DOE loan program due diligence concluded that pricing will return and go higher Significant potential for higher prices 6 |
|
|
7 Favorable Market Trends Several studies have forecast a sizeable increase in regulation requirements as more wind and solar resources are deployed Pay-for-performance model proven in ISO-NE expected be used in more markets Establishing a price on carbon expected to increase regulation pricing |
|
|
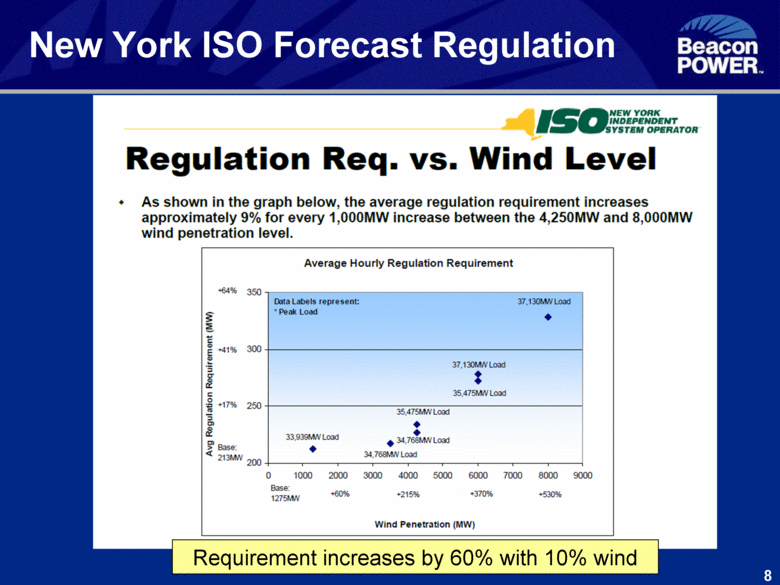
New York ISO Forecast Regulation Requirement increases by 60% with 10% wind 8 |
|
|
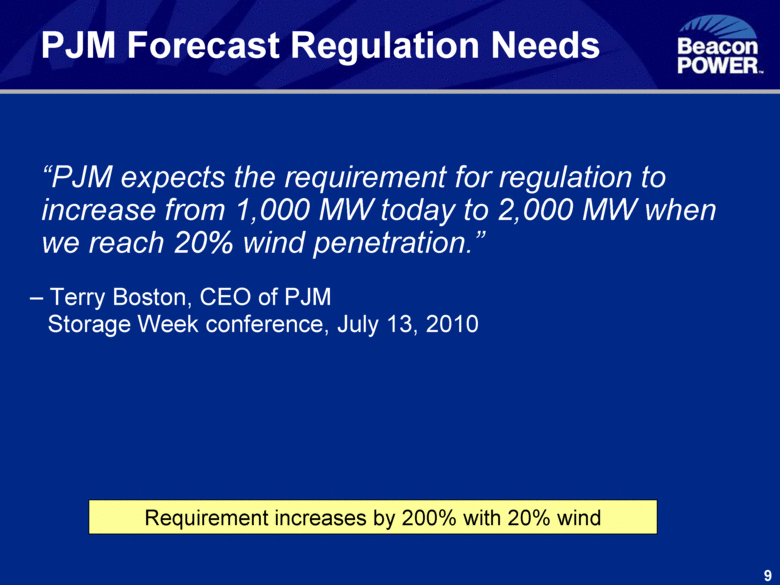
PJM Forecast Regulation Needs “PJM expects the requirement for regulation to increase from 1,000 MW today to 2,000 MW when we reach 20% wind penetration.” – Terry Boston, CEO of PJM Storage Week conference, July 13, 2010 Requirement increases by 200% with 20% wind 9 |
|
|
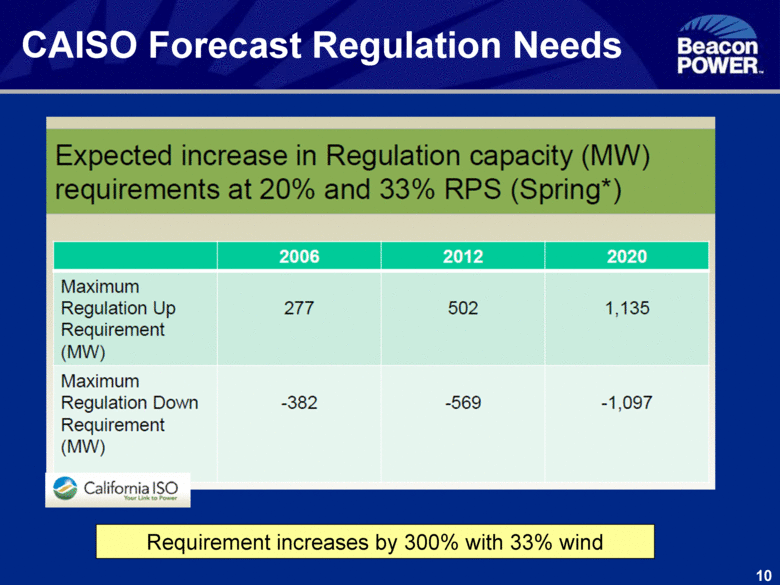
CAISO Forecast Regulation Needs Requirement increases by 300% with 33% wind 10 |
|
|
11 Favorable Market Trends Faster is better Pay-for-performance method proven in New England expected be used in more markets |
|
|
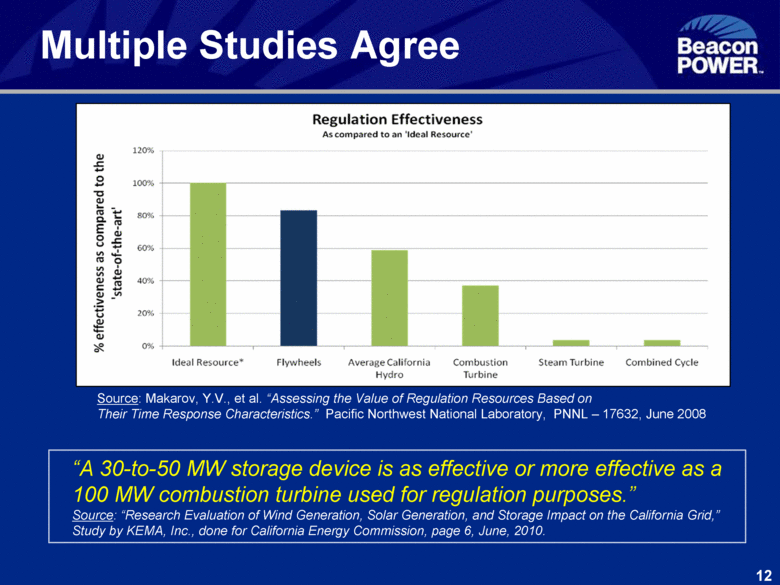
Multiple Studies Agree 12 “A 30-to-50 MW storage device is as effective or more effective as a 100 MW combustion turbine used for regulation purposes.” Source: “Research Evaluation of Wind Generation, Solar Generation, and Storage Impact on the California Grid,” Study by KEMA, Inc., done for California Energy Commission, page 6, June, 2010. Source: Makarov, Y.V., et al. “Assessing the Value of Regulation Resources Based on Their Time Response Characteristics.” Pacific Northwest National Laboratory, PNNL – 17632, June 2008 |
|
|
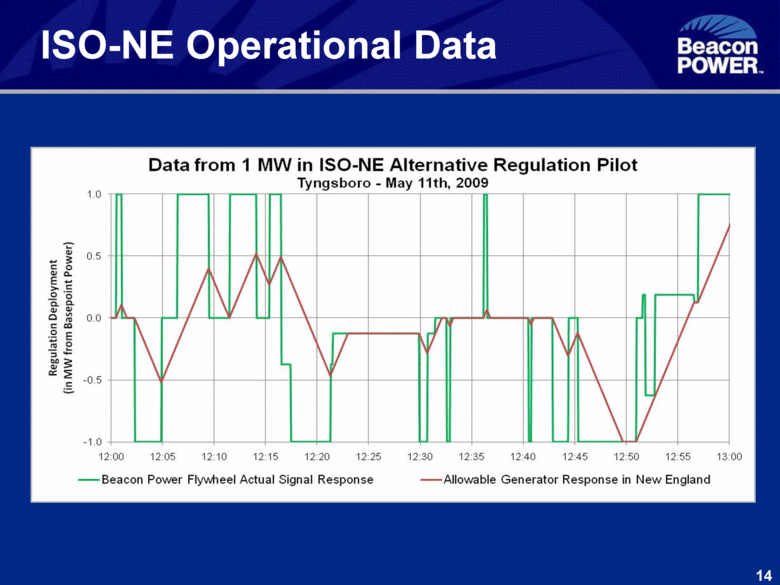
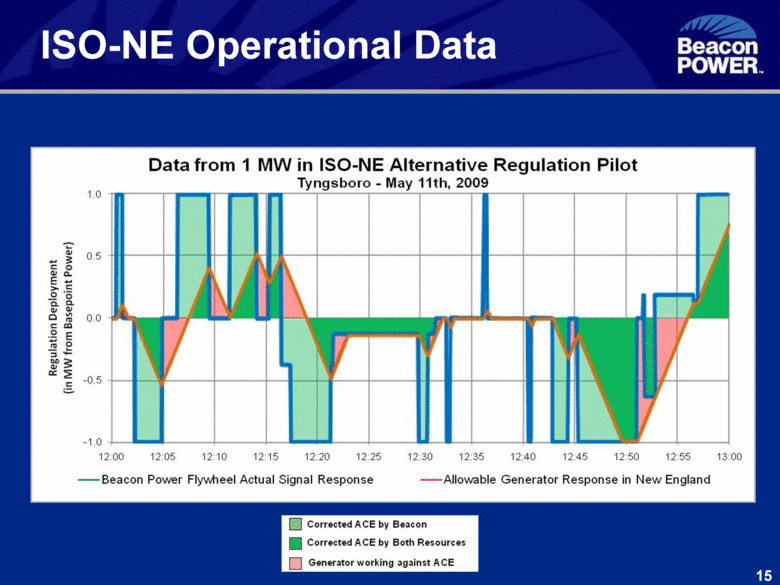
FERC is Focusing on Performance April 16th: “Something like a flywheel or a battery gets paid like a power generator but is a much more valuable service because it can respond much faster. The question is: Should they perhaps even get paid more? ... It's something that I hope to have our staff developing proposals on...” – Chairman Jon Wellinghoff May 26th: FERC asked all ISOs to participate in a technical conference solely about frequency regulation compensation for fast performance Beacon presented data on the value of fast response and the success of the ISO New England pay-for-performance tariff 13 |
|
|
ISO-NE Operational Data 14 |
|
|
ISO-NE Operational Data 15 |
|
|
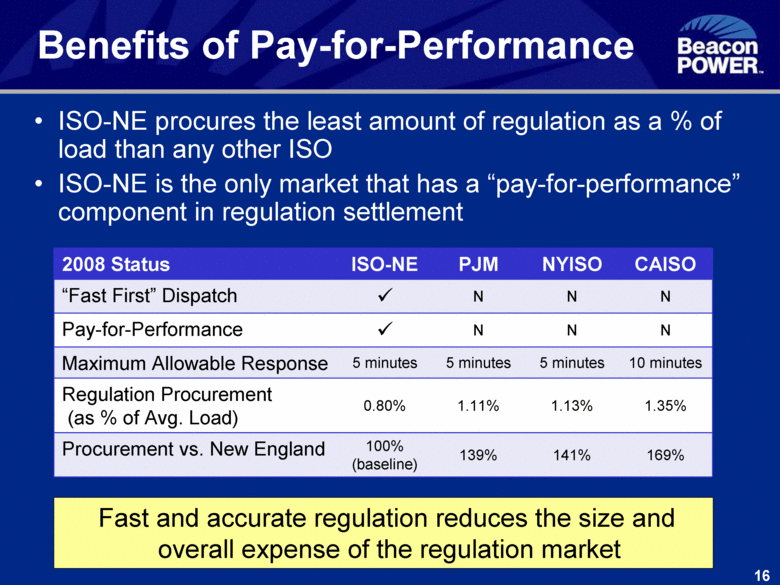
Benefits of Pay-for-Performance ISO-NE procures the least amount of regulation as a % of load than any other ISO ISO-NE is the only market that has a “pay-for-performance” component in regulation settlement 2008 Status ISO-NE PJM NYISO CAISO “Fast First” Dispatch N N N Pay-for-Performance N N N Maximum Allowable Response 5 minutes 5 minutes 5 minutes 10 minutes Regulation Procurement (as % of Avg. Load) 0.80% 1.11% 1.13% 1.35% Procurement vs. New England 100% (baseline) 139% 141% 169% Fast and accurate regulation reduces the size and overall expense of the regulation market 16 |
|
|
PJM Agrees “We have met with Chairman Wellinghoff and told him we need pay-for-performance.” Terry Boston, CEO of PJM Storage Week conference, July 13, 2010 17 |
|
|
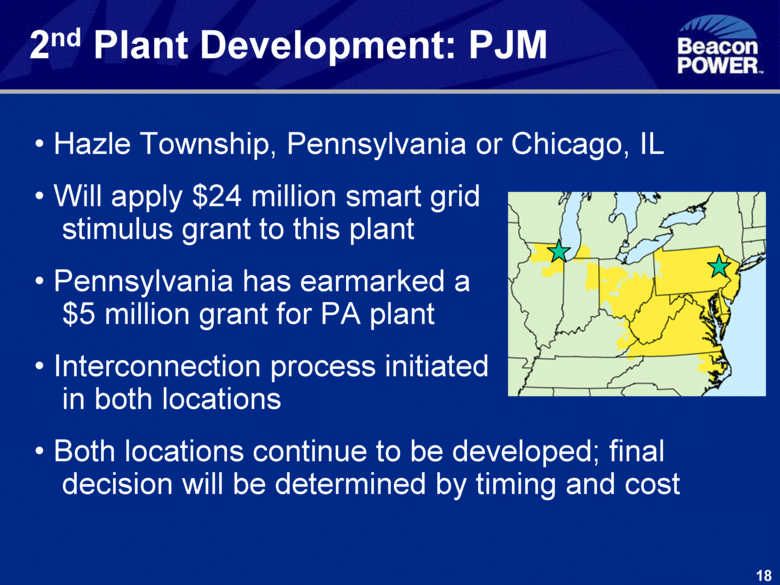
Hazle Township, Pennsylvania or Chicago, IL Will apply $24 million smart grid stimulus grant to this plant Pennsylvania has earmarked a $5 million grant for PA plant Interconnection process initiated in both locations Both locations continue to be developed; final decision will be determined by timing and cost 2nd Plant Development: PJM 18 |
|
|
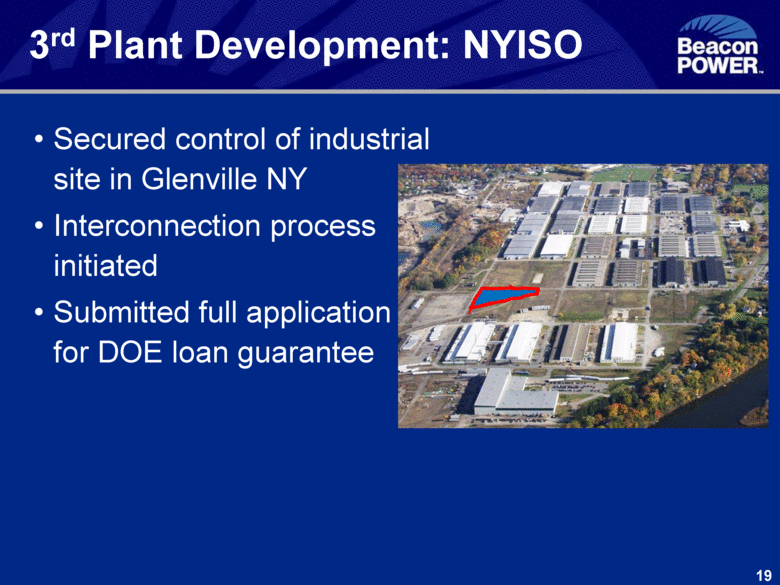
3rd Plant Development: NYISO Secured control of industrial site in Glenville NY Interconnection process initiated Submitted full application for DOE loan guarantee 19 |
|
|
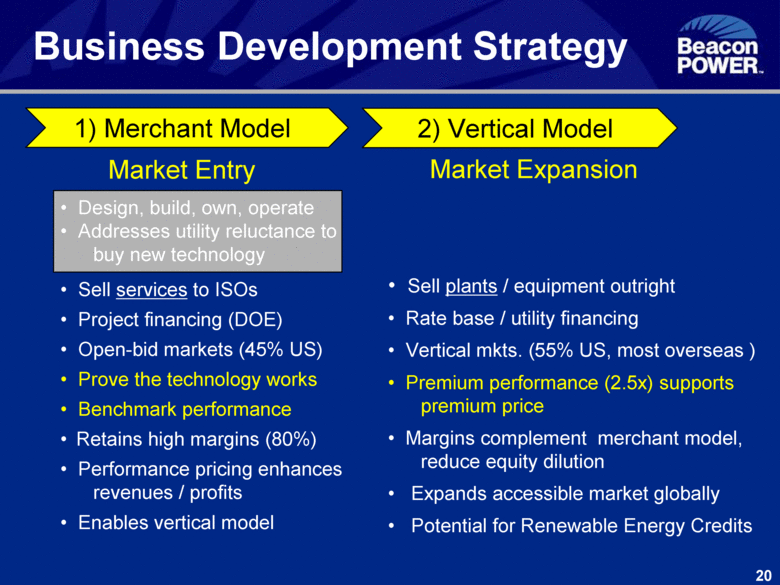
Business Development Strategy 2) Vertical Model 1) Merchant Model Market Entry Design, build, own, operate Addresses utility reluctance to buy new technology Sell services to ISOs Project financing (DOE) Open-bid markets (45% US) Prove the technology works Benchmark performance Retains high margins (80%) Performance pricing enhances revenues / profits Enables vertical model Market Expansion Sell plants / equipment outright Rate base / utility financing Vertical mkts. (55% US, most overseas ) Premium performance (2.5x) supports premium price Margins complement merchant model, reduce equity dilution Expands accessible market globally Potential for Renewable Energy Credits 20 |
|
|
Outlook Close on the DOE loan Earn revenues in Stephentown Develop 40 MW of additional merchant plants Sell plants/equipment in vertical market segments Expand “pay-for-performance” tariffs Extend Renewable Energy Credit qualification for flywheels to other states 20% ITC expected from the bill to be introduced by Senators Wyden, Bingaman, and Shaheen 21 |
|
|
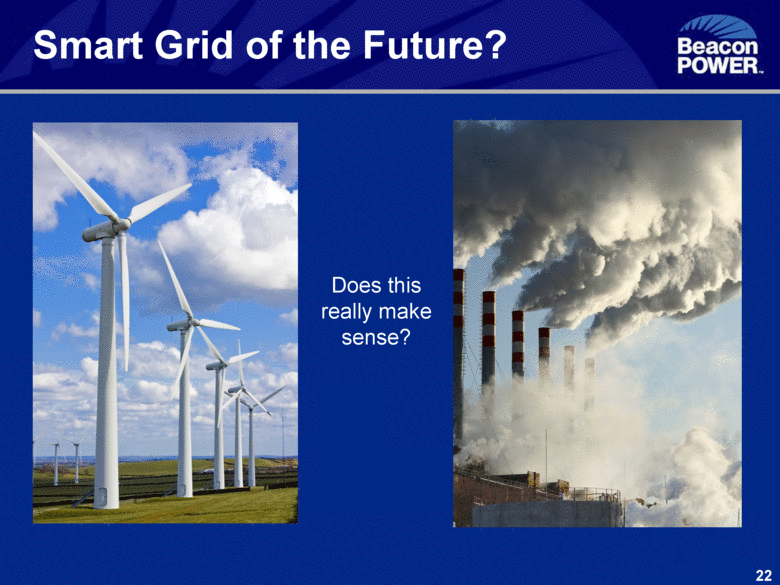
22 Smart Grid of the Future? Does this really make sense? |
|
|
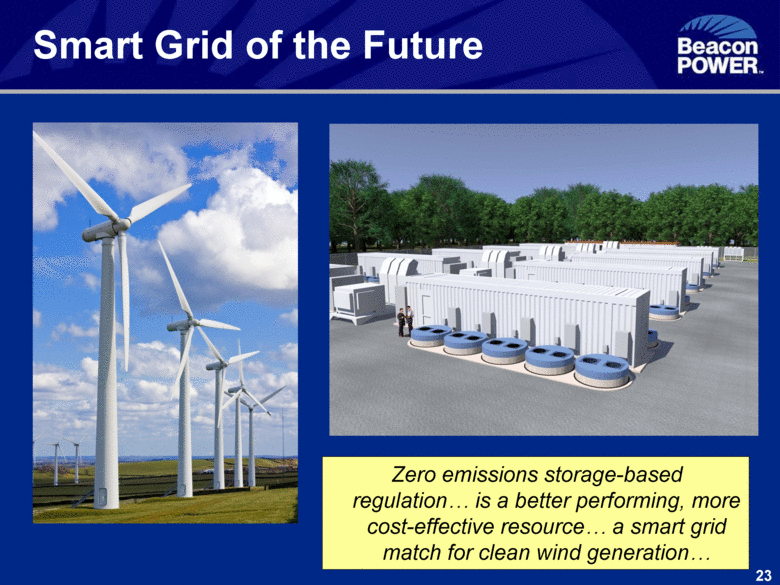
23 Smart Grid of the Future Zero emissions storage-based regulation... is a better performing, more cost-effective resource... a smart grid match for clean wind generation... |
|
|
Thank You (Q & A) |

