Attached files
| file | filename |
|---|---|
| 8-K - FORM 8-K - CONCHO RESOURCES INC | h74424e8vk.htm |
| EX-99.1 - EX-99.1 - CONCHO RESOURCES INC | h74424exv99w1.htm |
Exhibit 99.2

| COMMON STOCK PRIVATE PLACEMENT July 2010 |
| Forward-Looking Statement This presentation contains forward-looking statements within the meaning of Section 27A of the Securities Act of 1933 and Section 21E of the Securities Exchange Act of 1934. All statements, other than statements of historical facts, included in this presentation that address activities, events or developments that the Company expects, believes or anticipates will or may occur in the future, including, among others, statements and projections regarding the Company’s future financial position, operations, performance, business strategy, returns, budgets, reserves, levels of production and costs and statements regarding the plans and objectives of the Company’s management for future operations, are forward-looking statements. The words “believe,” “expect,” “anticipate,” “plan,” “intend,” “foresee,” “should,” “would,” “could,” or other similar expressions are intended to identify forward-looking statements, which generally are not historical in nature. However, the absence of these words does not mean that the statements are not forward-looking. Without limiting the generality of the foregoing, these statements are based on certain assumptions made by the Company based on management’s experience, expectations and perception of historical trends, current conditions, anticipated future developments and other factors believed to be appropriate. Forward-looking statements are not guarantees of performance. Although the Company believes the expectations reflected in its forward-looking statements are reasonable and are based on reasonable assumptions, no assurance can be given that these assumptions are accurate or that any of these expectations will be achieved (in full or at all) or will prove to have been correct. Moreover, such statements are subject to a number of assumptions, risks and uncertainties, many of which are beyond the control of the Company, which may cause actual results to differ materially from those implied or expressed by the forward-looking statements. These include the factors discussed or referenced in the “Risk Factors” section of the Company’s 10-K filed with the Securities and Exchange Commission (“SEC”) on February 26, 2010 and risks relating to sustained or further declines in the prices we receive for our oil and natural gas; uncertainties about the estimated quantities of oil and natural gas reserves, including uncertainties about the effects of the SEC’s new rules governing reserve reporting; the effects of government regulation, permitting and other legal requirements; drilling and operating risks; the adequacy of our capital resources and liquidity including, but not limited to, access to additional borrowing capacity under our credit facility; difficult and adverse conditions in the domestic and global capital and credit markets; risks related to the concentration of our operations in the Permian Basin of Southeast New Mexico and West Texas; potential financial losses or earnings reductions from our commodity price risk management program; shortages of oilfield equipment, services and qualified personnel and increases costs for such equipment, services and personnel; risks and liabilities associated with acquired properties or businesses; uncertainty regarding the exercise of preferential purchase rights on assets to be acquired in the Marbob acquisition; risks related to the integration of the Marbob assets and employees with our operations; uncertainties about our ability to successfully execute our business and financial plans and strategies; uncertainties about our ability to replace reserves and economically develop our current reserves; general economic and business conditions, either internationally or domestically or in the jurisdictions in which we operate; competition in the oil and natural gas industry; uncertainty concerning our assumed or possible future results of operations; our existing indebtedness; and ot her important factors that could cause actual results to differ materially from those projected. All forward-looking statements speak only as of the date on which such statements are made and the Company undertakes no obligation to correct or update any forward-looking statement, whether as a result of new information, future events or otherwise, except as required by applicable law. 2 |
| Cautionary Statement Regarding Oil and Gas Quantities The SEC requires oil and gas companies, in their filings with the SEC, to disclose proved reserves, which are those quantities of oil and gas, which, by analysis of geoscience and engineering data, can be estimated with reasonable certainty to be economically producible—from a given date forward, from known reservoirs, and under existing economic conditions (using unweighted average 12-month first day of the month prices), operating methods, and government regulations—prior to the time at which contracts providing the right to operate expire, unless evidence indicates that renewal is reasonably certain, regardless of whether deterministic or probabilistic methods are used for the estimation. The SEC also permits the disclosure of separate estimates of probable or possible reserves that meet SEC definitions for such reserves; however, we currently do not disclose probable or possible reserves in our SEC filings. In this presentation, proved reserves attributable to the Company as of December 31, 2009 are based upon proved reserves in accordance with SEC rules. Proved reserves estimated for the Marbob acquisition are internal estimates based on a price of $80.00 per barrel of oil and $6.00 per mcf of natural gas held flat over the life of the reserves, and are not determined in accordance with SEC rules. Accordingly, proved reserves actually booked for the Marbob acquisition in the Company’s SEC filings are expected to be lower than the internal estimates included in this presentation. We use the terms “unproved reserves,” “EUR” per well and “upside potential” to describe estimates of potentially recoverable hydrocarbons that the SEC rules prohibit from being included in filings with the SEC. These are the Company’s internal estimates of hydrocarbon quantities that may be potentially discovered through exploratory drilling or recovered with additional drilling or recovery techniques. These quantities may not constitute “reserves” within the meaning of the Society of Petroleum Engineer’s Petroleum Resource Management System or SEC rules and do not include any proved reserves. EUR estimates and drilling locations have not been risked by Company management. Actual locations drilled and quantities that may be ultimately recovered from the Company’s interests will differ substantially. There is no commitment by the Company to drill all of the drilling locations which have been attributed these quantities. Factors affecting ultimate recovery include the scope of our ongoing drilling program, which will be directly affected by the availability of capital, drilling and production costs, availability of drilling services and equipment, drilling results, lease expirations, transportation constraints, regulatory approvals and other factors; and actual drilling results, including geological and mechanical factors affecting recovery rates. Estimates of unproved reserves, per well EUR and upside potential may change significantly as development of the Company’s oil and gas assets provide additional data. In addition, certain of the assets in the Marbob acquisition are subject to preferential purchase rights of third parties. All estimates of proved reserves, unproved reserves, production and acreage related to the Marbob acquisition assume that such third parties do not exercise these preferential purchase rights, and to the extent such preferential purchase rights are exercised, our estimates of proved reserves, unproved reserves, production and acreage will be significantly lower than disclosed herein. Our production forecasts and expectations for future periods are dependent upon many assumptions, including estimates of production decline rates from existing wells and the undertaking and outcome of future drilling activity, which may be affected by significant commodity price declines or drilling cost increases. |
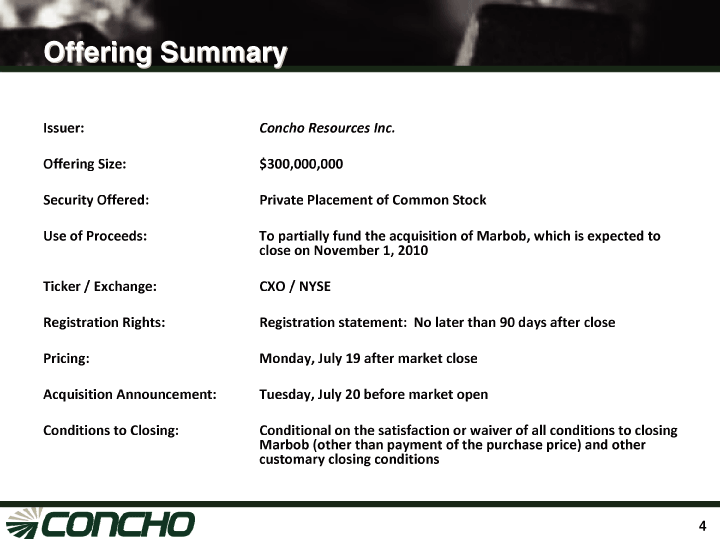
| Offering Summary Issuer: Concho Resources Inc. Offering Size: $300,000,000 Security Offered: Private Placement of Common Stock Use of Proceeds: To partially fund the acquisition of Marbob, which is expected to close on November 1, 2010 Ticker / Exchange: CXO / NYSE Registration Rights: Registration statement: No later than 90 days after close Pricing: Monday, July 19 after market close Acquisition Announcement: Tuesday, July 20 before market open Conditions to Closing: Conditional on the satisfaction or waiver of all conditions to closing Marbob (other than payment of the purchase price) and other customary closing conditions 4 |
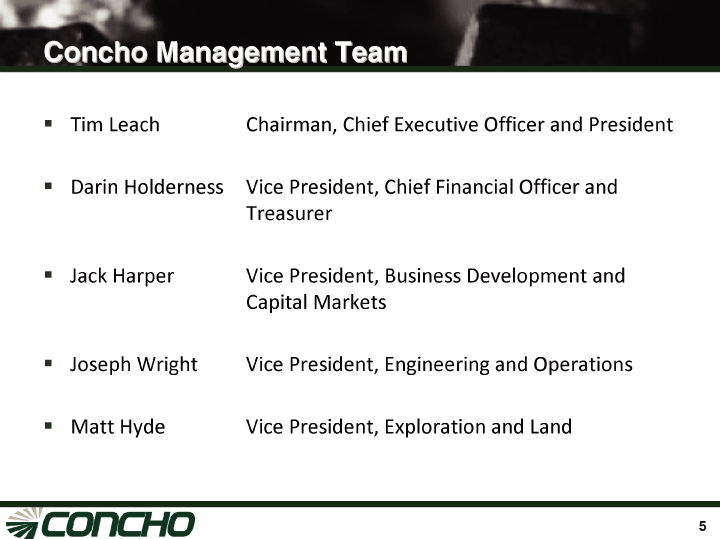
| Concho Management Team Tim Leach Chairman, Chief Executive Officer and President Darin Holderness Vice President, Chief Financial Officer and Treasurer Jack Harper Vice President, Business Development and Capital Markets Joseph Wright Vice President, Engineering and Operations Matt Hyde Vice President, Exploration and Land 5 |
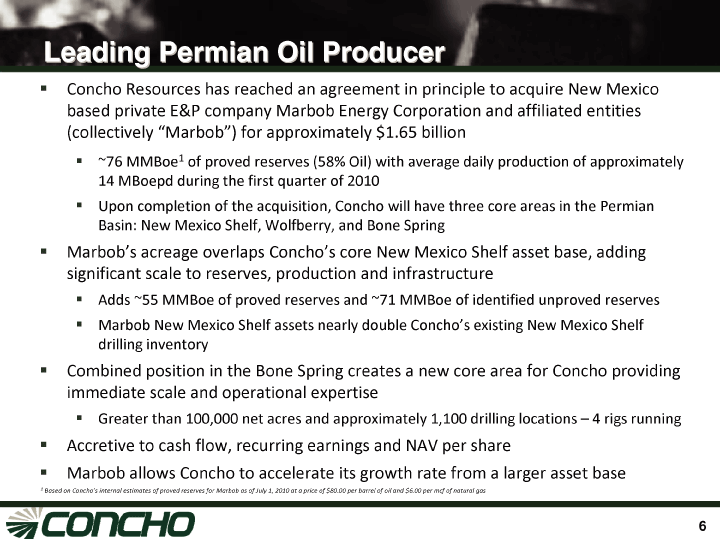
| Leading Permian Oil Producer Concho Resources has reached an agreement in principle to acquire New Mexico based private E&P company Marbob Energy Corporation and affiliated entities (collectively “Marbob”) for approximately $1.65 billion ~76 MMBoe1 of proved reserves (58% Oil) with average daily production of approximately 14 MBoepd during the first quarter of 2010 Upon completion of the acquisition, Concho will have three core areas in the Permian Basin: New Mexico Shelf, Wolfberry, and Bone Spring Marbob’s acreage overlaps Concho’s core New Mexico Shelf asset base, adding significant scale to reserves, production and infrastructure Adds ~55 MMBoe of proved reserves and ~71 MMBoe of identified unproved reserves Marbob New Mexico Shelf assets nearly double Concho’s existing New Mexico Shelf drilling inventory Combined position in the Bone Spring creates a new core area for Concho providing immediate scale and operational expertise Greater than 100,000 net acres and approximately 1,100 drilling locations — 4 rigs running Accretive to cash flow, recurring earnings and NAV per share Marbob allows Concho to accelerate its growth rate from a larger asset base 1 Based on Concho’s internal estimates of proved reserves for Marbob as of July 1, 2010 at a price of $80.00 per barrel of oil and $6.00 per mcf of natural gas 6 |
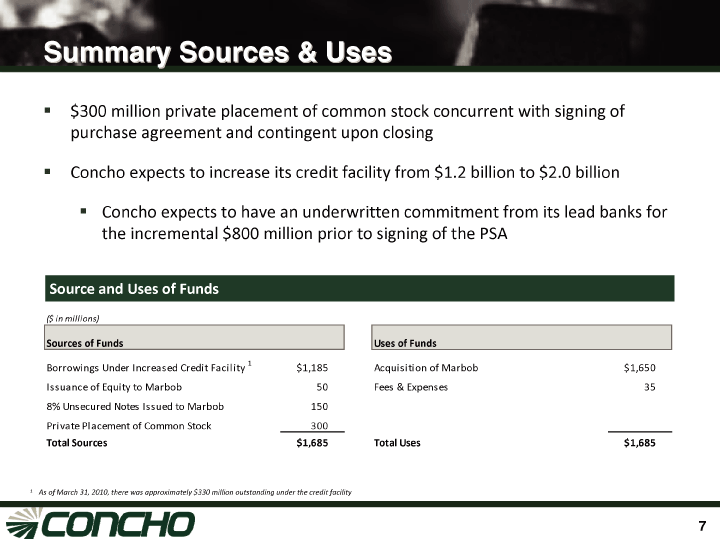
| Summary Sources & Uses $300 million private placement of common stock concurrent with signing of purchase agreement and contingent upon closing Concho expects to increase its credit facility from $1.2 billion to $2.0 billion Concho expects to have an underwritten commitment from its lead banks for the incremental $800 million prior to signing of the PSA Source and Uses of Funds Source and Uses of Funds ($ in millions) Sources of Funds Uses of Funds Borrowings Under Increased Credit Facility 1 $1,185 Acquisition of Marbob $1,650 Issuance of Equity to Marbob 50 Fees & Expenses 35 8% Unsecured Notes Issued to Marbob 150 Private Placement of Common Stock 300 Total Sources $1,685 Total Uses $1,685 1 As of March 31, 2010, there was approximately $330 million outstanding under the credit facility 7 |
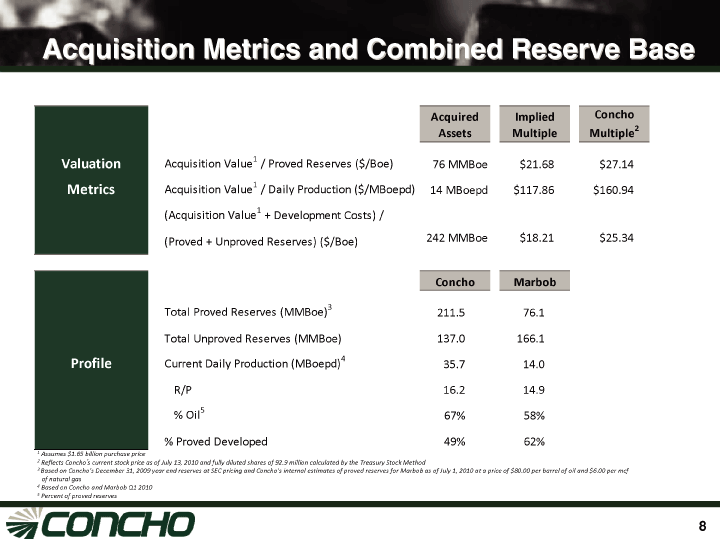
| Acquisition Metrics and Combined Reserve Base Acquired Implied Concho Assets Multiple Multiple2 Valuation Acquisition Value1 / Proved Reserves ($/Boe) 76 MMBoe $21.68 $27.14 Metrics Acquisition Value1 / Daily Production ($/MBoepd) 14 MBoepd $117.86 $160.94 (Acquisition Value1 + Development Costs) / (Proved + Unproved Reserves) ($/Boe) 242 MMBoe $18.21 $25.34 Concho Marbob Total Proved Reserves (MMBoe)3 211.5 76.1 Total Unproved Reserves (MMBoe) 137.0 166.1 Profile Current Daily Production (MBoepd)4 35.7 14.0 R/P 16.2 14.9% Oil5 67% 58% % Proved Developed 49% 62% 1 Assumes $1.65 billion purchase price 2 Reflects Concho’s current stock price as of July 13, 2010 and fully diluted shares of 92.9 million calculated by the Treasury Stock Method 3 Based on Concho’s December 31, 2009 year end reserves at SEC pricing and Concho’s internal estimates of proved reserves for Marbob as of July 1, 2010 at a price of $80.00 per barrel of oil and $6.00 per mcf of natural gas 4 Based on Concho and Marbob Q1 2010 5 Percent of proved reserves 8 |
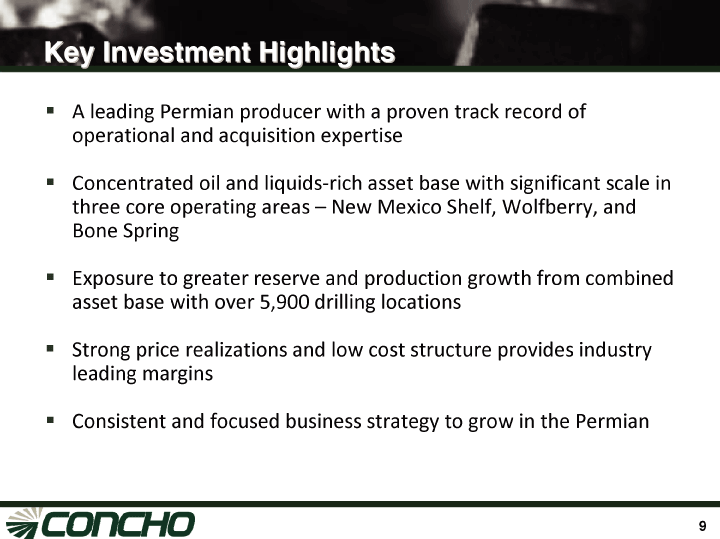
| Key Investment Highlights A leading Permian producer with a proven track record of operational and acquisition expertise Concentrated oil and liquids-rich asset base with significant scale in three core operating areas — New Mexico Shelf, Wolfberry, and Bone Spring Exposure to greater reserve and production growth from combined asset base with over 5,900 drilling locations Strong price realizations and low cost structure provides industry leading margins Consistent and focused business strategy to grow in the Permian 9 |
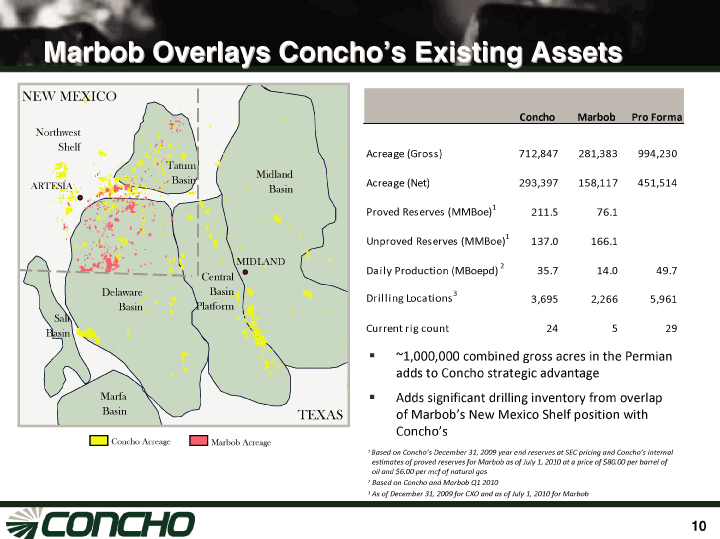
| Marbob Overlays Concho’s Existing Assets NEW MEXICO Concho Marbob Pro Forma Northwest Shelf Acreage (Gross) 712,847 281,383 994,230 Tatum Midland Basin Acreage (Net) 293,397 158,117 451,514 ARTESIA Basin Proved Reserves (MMBoe)1 211.5 76.1 Unproved Reserves (MMBoe)1 137.0 166.1 MIDLAND 2 Daily Production (MBoepd) 35.7 14.0 49.7 Central Delaware Basin Drilling Locations3 3,695 2,266 5,961 Basin Platform Salt Current rig count 24 5 29 Basin ~1,000,000 combined gross acres in the Permian adds to Concho strategic advantage Marfa Adds significant drilling inventory from overlap Basin TEXAS of Marbob’s New Mexico Shelf position with Concho’s Concho Acreage Marbob Acreage 1 Based on Concho’s December 31, 2009 year end reserves at SEC pricing and Concho’s internal estimates of proved reserves for Marbob as of July 1, 2010 at a price of $80.00 per barrel of oil and $6.00 per mcf of natural gas 2 Based on Concho and Marbob Q1 2010 3 As of December 31, 2009 for CXO and as of July 1, 2010 for Marbob 10 |
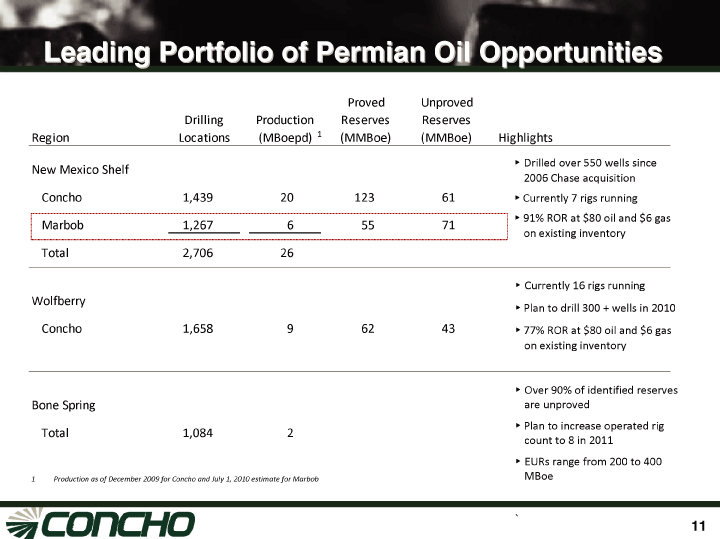
| Leading Portfolio of Permian Oil Opportunities Proved Unproved Drilling Production Reserves Reserves Region Locations (MBoepd) 1 (MMBoe) (MMBoe) Highlights Drilled over 550 wells since New Mexico Shelf 2006 Chase acquisition Concho 1,439 20 123 61 Currently 7 rigs running 91% ROR at $80 oil and $6 gas Marbob 1,267 6 55 71 on existing inventory Total 2,706 26 Currently 16 rigs running Wolfberry Plan to drill 300 + wells in 2010 Concho 1,658 9 62 43 77% ROR at $80 oil and $6 gas on existing inventory Over 90% of identified reserves Bone Spring are unproved Plan to increase operated rig Total 1,084 2 count to 8 in 2011 EURs range from 200 to 400 1 Production as of December 2009 for Concho and July 1, 2010 estimate for Marbob MBoe ` 11 |
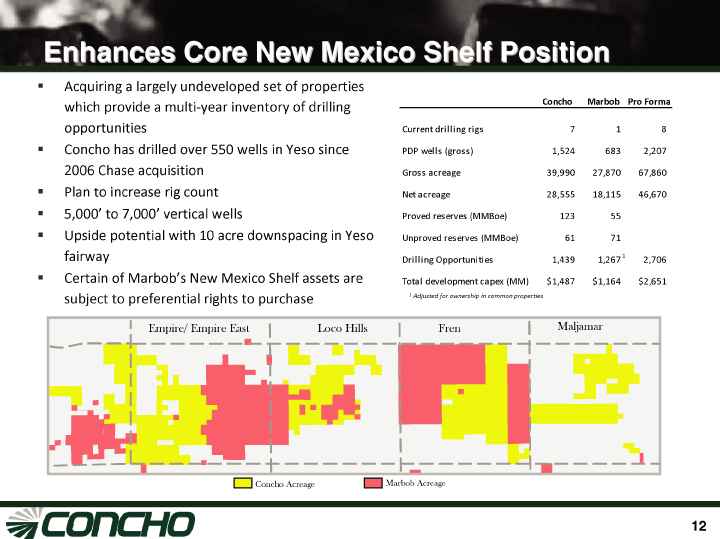
| Enhances Core New Mexico Shelf Position Acquiring a largely undeveloped set of properties which provide a multi-year inventory of drilling Concho Marbob Pro Forma opportunities Current drilling rigs 7 1 8 Concho has drilled over 550 wells in Yeso since PDP wells (gross) 1,524 683 2,207 2006 Chase acquisition Gross acreage 39,990 27,870 67,860 Plan to increase rig count Net acreage 28,555 18,115 46,670 5,000’ to 7,000’ vertical wells Proved reserves (MMBoe) 123 55 Upside potential with 10 acre downspacing in Yeso Unproved reserves (MMBoe) 61 71 fairway Drilling Opportunities 1,439 1,267 1 2,706 Certain of Marbob’s New Mexico Shelf assets are Total development capex (MM) $1,487 $1,164 $2,651 subject to preferential rights to purchase 1 Adjusted for ownership in common properties Empire/ Empire East Loco Hills Fren Maljamar Concho Acreage Marbob Acreage 12 |
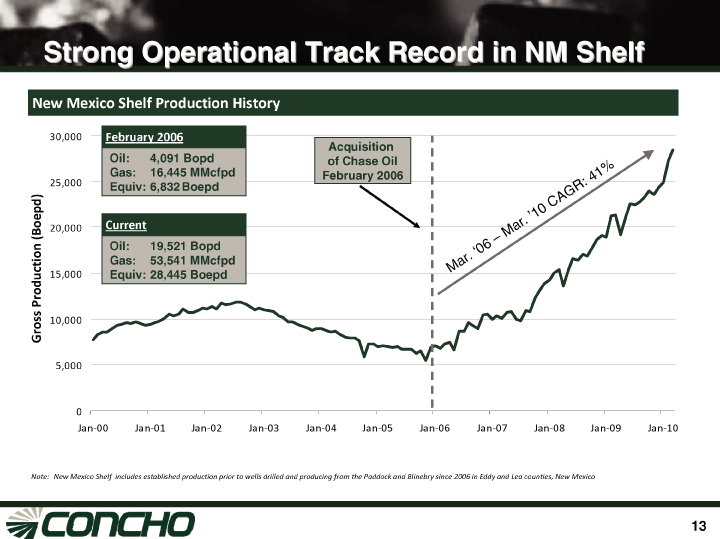
| Strong Operational Track Record in NM Shelf New Mexico Shelf Production History New Mexico Shelf Production History 30,000 February 2006 February 2006 Acquisition Oil: 4,091 Bopd of Chase Oil Gas: 16,445 MMcfpd 1 % February 2006 4 25,000 Equiv: 6,832Boepd : R A G (Boepd) C 1 0 .’ 20,000 Current a r Current M Oil: 19,521 Bopd 6 - Production ’ 0 Gas: 53,541 MMcfpd r . a 15,000 M Equiv: 28,445 Boepd Gross 10,000 5,000 0 Jan-00 Jan-01 Jan-02 Jan-03 Jan-04 Jan-05 Jan-06 Jan-07 Jan-08 Jan-09 Jan-10 Note: New Mexico Shelf includes established production prior to wells drilled and producing from the Paddock and Blinebry since 2006 in Eddy and Lea counties, New Mexico 13 |
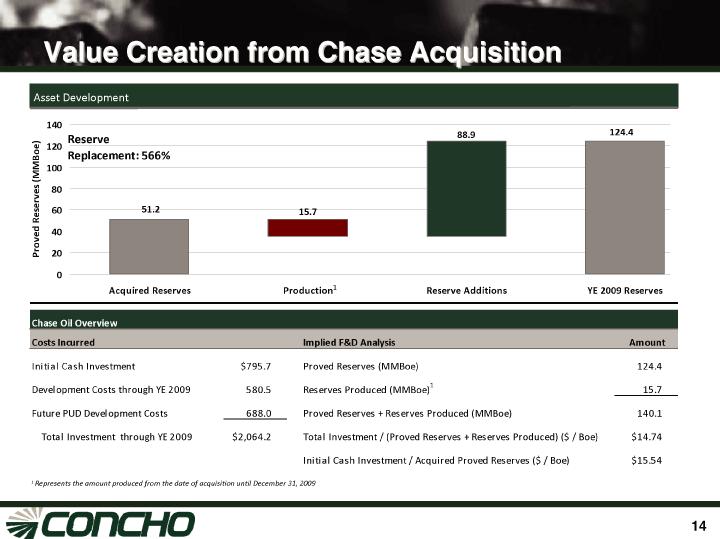
| Strong Operational Track Record in NM Shelf New Mexico Shelf Production History New Mexico Shelf Production History 30,000 February 2006 February 2006 Acquisition Oil: 4,091 Bopd of Chase Oil Gas: 16,445 MMcfpd 1 % February 2006 4 25,000 Equiv: 6,832Boepd : R A G (Boepd) C 1 0 .’ 20,000 Current a r Current M Oil: 19,521 Bopd 6 - Production ’ 0 Gas: 53,541 MMcfpd r . a 15,000 M Equiv: 28,445 Boepd Gross 10,000 5,000 0 Jan-00 Jan-01 Jan-02 Jan-03 Jan-04 Jan-05 Jan-06 Jan-07 Jan-08 Jan-09 Jan-10 Note: New Mexico Shelf includes established production prior to wells drilled and producing from the Paddock and Blinebry since 2006 in Eddy and Lea counties, New Mexico Value Creation from Chase Acquisition Asset Development Asset Development 140 88.9 124.4 Reserve (MMBoe) 120 Replacement: 566% 100 80 Reserves 60 51.2 15.7 Proved 40 20 0 Acquired Reserves Production1 Reserve Additions YE 2009 Reserves Chase Oil Overview Costs Incurred Implied F&D Analysis Amount Initial Cash Investment $795.7 Proved Reserves (MMBoe) 124.4 Development Costs through YE 2009 580.5 Reserves Produced (MMBoe)1 15.7 Future PUD Development Costs 688.0 Proved Reserves + Reserves Produced (MMBoe) 140.1 Total Investment through YE 2009 $2,064.2 Total Investment / (Proved Reserves + Reserves Produced) ($ / Boe) $14.74 Initial Cash Investment / Acquired Proved Reserves ($ / Boe) $15.54 1 Represents the amount produced from the date of acquisition until December 31, 2009 14 |
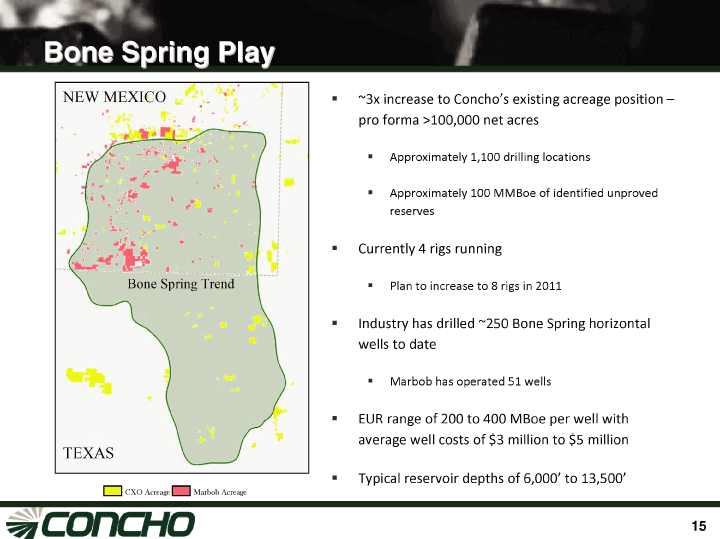
| Bone Spring Play NEW MEXICO ~3x increase to Concho’s existing acreage position -pro forma >100,000 net acres Approximately 1,100 drilling locations Approximately 100 MMBoe of identified unproved reserves Currently 4 rigs running Bone Spring Trend Plan to increase to 8 rigs in 2011 Industry has drilled ~250 Bone Spring horizontal wells to date Marbob has operated 51 wells EUR range of 200 to 400 MBoe per well with average well costs of $3 million to $5 million TEXAS Typical reservoir depths of 6,000’ to 13,500’ CXO Acreage Marbob Acreage 15 |
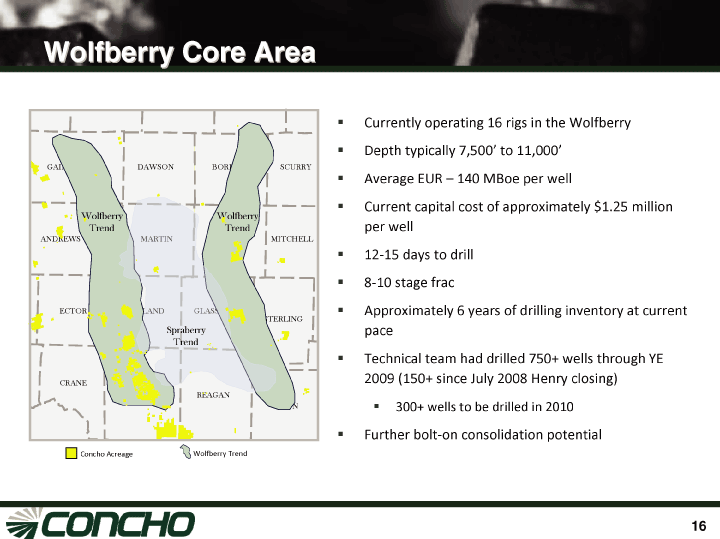
| Wolfberry Core Area Currently operating 16 rigs in the Wolfberry Depth typically 7,500’ to 11,000’ GAINES DAWSON BORDON SCURRY Average EUR — 140 MBoe per well Current capital cost of approximately $1.25 million Wolfberry Wolfberry Trend Trend per well ANDREWS MARTIN HOWARD MITCHELL 12-15 days to drill 8-10 stage frac ECTOR MIDLAND GLASSCOCK Approximately 6 years of drilling inventory at current STERLING Spraberry pace Trend Technical team had drilled 750+ wells through YE CRANE 2009 (150+ since July 2008 Henry closing) UPTON REAGAN IRION 300+ wells to be drilled in 2010 Further bolt-on consolidation potential Concho Acreage Wolfberry Trend 16 |
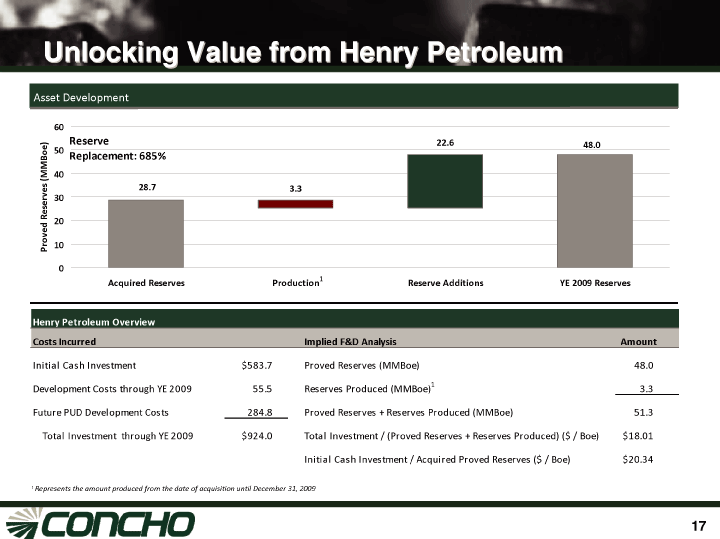
| Unlocking Value from Henry Petroleum Asset Development Asset Development 60 Reserve 22.6 48.0 (MMBoe) 50 Replacement: 685% 40 28.7 Reserves 3.3 30 20 Proved 10 0 Acquired Reserves Production1 Reserve Additions YE 2009 Reserves Henry Petroleum Overview Costs Incurred Implied F&D Analysis Amount Initial Cash Investment $583.7 Proved Reserves (MMBoe) 48.0 Development Costs through YE 2009 55.5 Reserves Produced (MMBoe)1 3.3 Future PUD Development Costs 284.8 Proved Reserves + Reserves Produced (MMBoe) 51.3 Total Investment through YE 2009 $924.0 Total Investment / (Proved Reserves + Reserves Produced) ($ / Boe) $18.01 Initial Cash Investment / Acquired Proved Reserves ($ / Boe) $20.34 1 Represents the amount produced from the date of acquisition until December 31, 2009 17 |
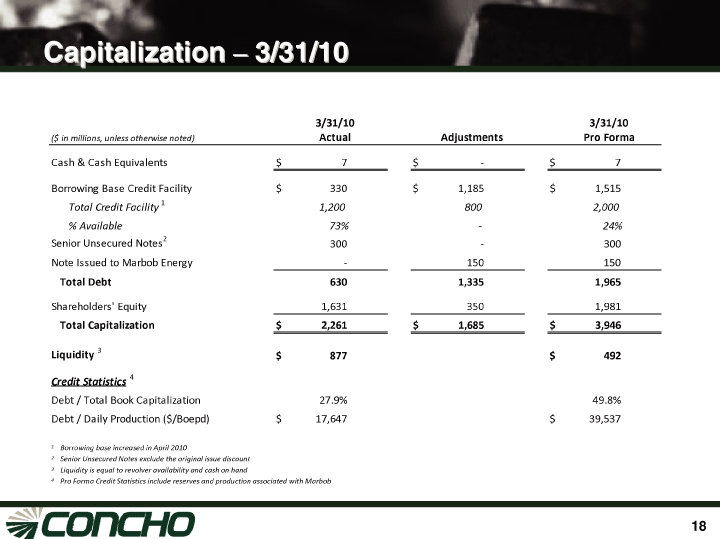
| Capitalization — 3/31/10 3/31/10 3/31/10 ($ in millions, unless otherwise noted) Actual Adjustments Pro Forma Cash & Cash Equivalents $7 $ — $7 Borrowing Base Credit Facility $330 $1,185 $1,515 Total Credit Facility 1 1,200 800 2,000% Available 73% — 24% Senior Unsecured Notes2 300 — 300 Note Issued to Marbob Energy — 150 150 Total Debt 630 1,335 1,965 Shareholders’ Equity 1,631 350 1,981 Total Capitalization $2,261 $1,685 $3,946 Liquidity 3 $877 $492 Credit Statistics 4 Debt / Total Book Capitalization 27.9% 49.8% Debt / Daily Production ($/Boepd) $17,647 $39,537 1 Borrowing base increased in April 2010 2 Senior Unsecured Notes exclude the original issue discount 3 Liquidity is equal to revolver availability and cash on hand 4 Pro Forma Credit Statistics include reserves and production associated with Marbob 18 |
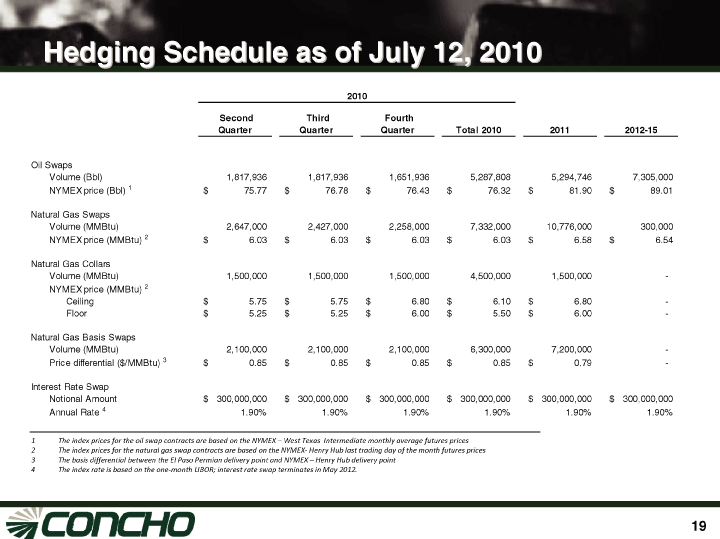
| Hedging Schedule as of July 12, 2010 2010 Second Third Fourth Quarter Quarter Quarter Total 2010 2011 2012-15 Oil Swaps Volume (Bbl) 1,817,936 1,817,936 1,651,936 5,287,808 5,294,746 7,305,000 NYMEX price (Bbl) 1 $75.77 $76.78 $76.43 $76.32 $81.90 $89.01 Natural Gas Swaps Volume (MMBtu) 2,647,000 2,427,000 2,258,000 7,332,000 10,776,000 300,000 NYMEX price (MMBtu) 2 $6.03 $6.03 $6.03 $6.03 $6.58 $6.54 Natural Gas Collars Volume (MMBtu) 1,500,000 1,500,000 1,500,000 4,500,000 1,500,000 -NYMEX price (MMBtu) 2 Ceiling $5.75 $5.75 $6.80 $6.10 $6.80 -Floor $5.25 $5.25 $6.00 $5.50 $6.00 - Natural Gas Basis Swaps Volume (MMBtu) 2,100,000 2,100,000 2,100,000 6,300,000 7,200,000 -Price differential ($/MMBtu) 3 $0.85 $0.85 $0.85 $0.85 $0.79 - Interest Rate Swap Notional Amount $300,000,000 $300,000,000 $300,000,000 $300,000,000 $300,000,000 $300,000,000 Annual Rate 4 1.90% 1.90% 1.90% 1.90% 1.90% 1.90% 1 The index prices for the oil swap contracts are based on the NYMEX — West Texas Intermediate monthly average futures prices 2 The index prices for the natural gas swap contracts are based on the NYMEX- Henry Hub last trading day of the month futures prices 3 The basis differential between the El Paso Permian delivery point and NYMEX — Henry Hub delivery point 4 The index rate is based on the one-month LIBOR; interest rate swap terminates in May 2012. 19 |
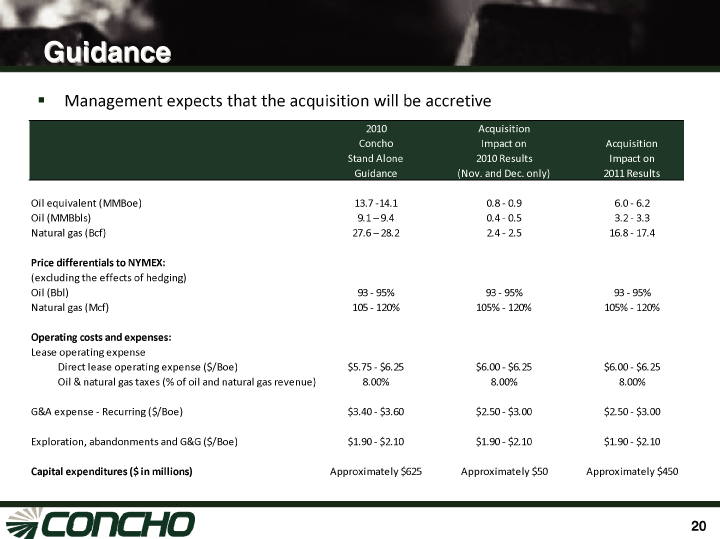
| Guidance Management expects that the acquisition will be accretive 2010 Acquisition Concho Impact on Acquisition Stand Alone 2010 Results Impact on Guidance (Nov. and Dec. only) 2011 Results Oil equivalent (MMBoe) 13.7 -14.1 0.8 — 0.9 6.0 — 6.2 Oil (MMBbls) 9.1 — 9.4 0.4 — 0.5 3.2 — 3.3 Natural gas (Bcf) 27.6 — 28.2 2.4 — 2.5 16.8 — 17.4 Price differentials to NYMEX: (excluding the effects of hedging) Oil (Bbl) 93 — 95% 93 — 95% 93 — 95% Natural gas (Mcf) 105 — 120% 105% — 120% 105% — 120% Operating costs and expenses: Lease operating expense Direct lease operating expense ($/Boe) $5.75 — $6.25 $6.00 — $6.25 $6.00 — $6.25 Oil & natural gas taxes (% of oil and natural gas revenue) 8.00% 8.00% 8.00% G&A expense — Recurring ($/Boe) $3.40 — $3.60 $2.50 — $3.00 $2.50 — $3.00 Exploration, abandonments and G&G ($/Boe) $1.90 — $2.10 $1.90 — $2.10 $1.90 — $2.10 Capital expenditures ($ in millions) Approximately $625 Approximately $50 Approximately $450 20 |
