Attached files
| file | filename |
|---|---|
| 8-K - FORM 8-K - SYNERGETICS USA INC | c58992e8vk.htm |
Exhibit 99.1

| QUALITY. PERFORMANCE. INNOVATION. Investor Presentation July 2010 |

| Safe Harbor Statement Certain statements made in this presentation are forward-looking within the meaning of the Private Securities Litigation Reform Act of 1995. Among other, statements concerning management's expectations of future financial results, potential business, acquisitions, government agency approvals, additional indications and therapeutic applications for medical devices, as well as their outcomes, clinical efficacy and potential markets are forward looking. Forward-looking statements involve risks and uncertainties that could cause actual results to differ materially from predicted results. For a discussion of such risks and uncertainties, please refer to the information set forth under "Risk Factors" included in Synergetics USA, Inc.'s Annual Report on Form 10-K for the year ended July 31, 2009 and information contained in subsequent filings with the Securities and Exchange Commission. These forward looking statements are made based upon our current expectations and we undertake no duty to update information provided in this presentation. |

| Overview Synergetics USA, Inc. was formed through a reverse merger of Synergetics, Inc. and Valley Forge Scientific in 2005Synergetics was founded in 1991 and Valley Forge was founded in 1980 and became a publicly-held company in November 1989Synergetics USA, Inc. (NASDAQ: SURG)Ophthalmic and Neurosurgical DevicesCorporate Headquarters: O'Fallon, MOManufacturing Facilities: O'Fallon, MO and King of Prussia, PAShares Outstanding: 24,687,05652 Week Range: $0.95 - $3.19Market Cap: $63.0mm |

| Sales Mix 2009/2010 Sales Mix 2009/2010 4 |

| Sales Mix 2009/2010 FY 2009 FY 2008 % Increase (Decrease) 9 Mos. 4/30/10 % Increase (Decrease) Disposables $36,659 $31,609 16.0% $26,648 7.8% Capital Equipment 16,306 18,454 (11.6%) 12,372 (18.7%) Total $52,965 $50,063 5.8% $39,020 (0.1%) FY 2009 FY 2008 % Increase (Decrease) 9 Mos. 4/30/10 % Increase (Decrease) U.S. (including OEM sales) $36,047 $35,838 0.6% $26,648 0.0% International (including Canada) 16,918 14,225 18.9% 12,372 (0.1%) Total $52,965 $50,063 5.8% $39,020 (0.1%) 5 |

| Recent Developments Stryker buys ultrasonic aspirator business from Mutoh Co. Ltd. and its affiliatesSynergetics enters into strategic agreements with Stryker to:sell certain assetssupply disposable ultrasonic instrument tipspursue development projects for aspiration products.Settlement of all litigation with Alcon generates $21.5 million in net cash for Synergetics |

| Project RestoreUmbrella project for the reorganization of the Synergetics' businessProject Lance (Stryker)Marketing Partners (for the balance of the neuro business)Product Code (SKU) RationalizationAssessment of R&D Project ListCompany ReorganizationRIF (Reduction in Force) Recent Developments |

| Overall Strategy Drive operational efficiencies to improve the platform's profitabilityLean ManufacturingInventory ReductionSelect OutsourcingElements of Project RestoreOphthalmology: Strategic GrowthRetina Fill gapsExpand offeringExpand into GlaucomaDevelop strategy for ASC dynamicDevelop strategy for emerging marketsOpportunistic acquisitionsNeurosurgery - Generate CashLeverage marketing partner's distribution networksFocus development on high margin electrosurgery productsSales Force Productivity |

| Markets |

| 2009 Anterior (Cataract) and Posterior (Retinal) Markets Compared (CHART) |

| (CHART) Total Market: M$770Estimated Yearly Growth: 5.4% Global Retinal Device Markets 2009 |

| Game Changers Anti-VEGF Therapies (i.e. Lucentis)Long Term Drug Delivery ImplantsArtificial VisionMicroplasmin Vitreous DisinsertionSite of Service Migration, e.g. ASC, Office |

| Product Review |

| Ophthalmology Products DDMS Quantel Laser Directional Laser Probes Endoilluminator - Awh Chandelier Photon II |
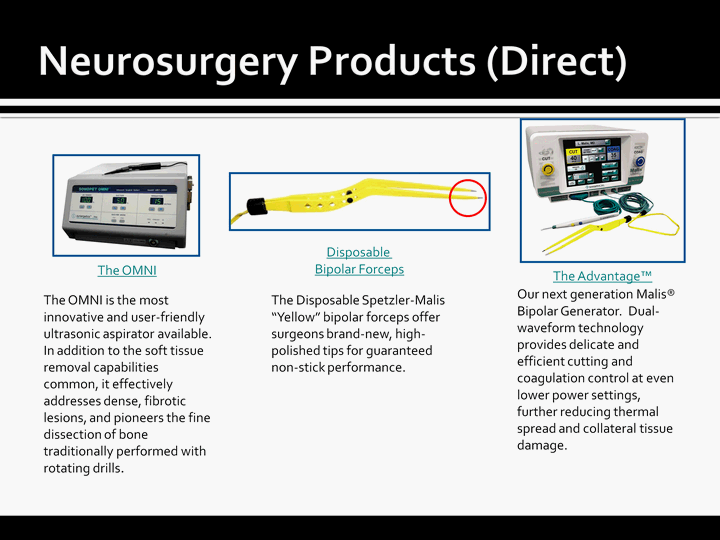
| Neurosurgery Products (Direct) The OMNI is the most innovative and user-friendly ultrasonic aspirator available. In addition to the soft tissue removal capabilities common, it effectively addresses dense, fibrotic lesions, and pioneers the fine dissection of bone traditionally performed with rotating drills. The OMNI The Disposable Spetzler-Malis "Yellow" bipolar forceps offer surgeons brand-new, high- polished tips for guaranteed non-stick performance. Disposable Bipolar Forceps Our next generation Malis(r) Bipolar Generator. Dual- waveform technology provides delicate and efficient cutting and coagulation control at even lower power settings, further reducing thermal spread and collateral tissue damage. The Advantage(tm) |

| OEM Products CMC III Codman Synergy Stryker Lesion Generator |

| Pinnacle 360^ 360^Approach from any angleReposition without removal from the eyeOptionsAll gauges, all typesLargest product line on the marketWhat you want when you need itErgonomic DesignGreat feelResponsive Reduces hand fatigueEasy RecognitionColor coded by gauge sizeStyle printed on the handle R&D Initiatives |

| Financials |

| Financial Highlights Sales were flat for the nine months ended April 30, 2010 with disposables sales up 7.8% and capital sales down 18.7%.Commercial Expenses were down 8.1% primarily due to our transition of our neurosurgery business to marketing partners.Net income from operations increased by 77% and earnings per share increased by 83%. Cash flow from operations increased from a negative $2.0 million to a positive $4.6 million (excluding one-time events impact) as compared to the nine month period ended May 4, 2009.Total interest bearing debt decreased $7.3 million from FYE 2009 to $6.0 million bringing our leverage down to 12.2%.Post Alcon transaction (including payment of taxes), Company will have a significant amount of cash on its balance sheet and will have significantly reduced its debt |

| Financial Overview - Income Statement FY 2009 FY 2009 FY 2008 Increase/(Decrease) Sales $52,965 $50,063 5.8% Gross Profit 29,415 29,962 (1.8%) R&D 2,998 2,654 13.0% Sales & Marketing 14,262 12,601 13.2% G&A 9,030 9,499 (4.9%) Operating Income 3,125 5,208 (40.0%) Net Income $1,595 $2,663 (40.1%) EPS $0.07 $0.11 (36.4%) |
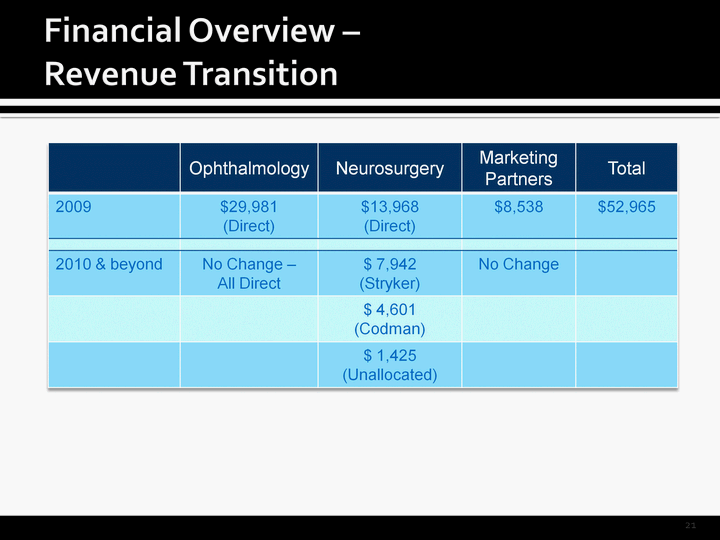
| Financial Overview - Revenue Transition Revenue Transition Revenue Transition 21 |

| Financial Overview - Balance Sheet FY 2009 FYE 2009 FYE 2008 Increase/(Decrease) Accounts Receivable $ 9,105 $ 8,593 6.0% Inventory 15,025 14,568 3.1% Other Current Assets 1,228 1,388 (11.5%) Total Assets $58,080 $58,396 (0.5%) Accounts Payable & Accrued Exp. 4,696 5,435 (13.6%) S/T Debt 7,140 5,359 33.2% L/T Debt 6,079 7,951 (23.5%) Stockholders' Equity $38,130 $36,357 4.9% |

| Financial Overview - Cash Flow Statement FY 2009 FYE 2009 FYE 2008 Increase/(Decrease) Net Income $ 1,595 $ 2,663 $(1,068) Depreciation & Amort. 1,960 1,990 (30) Changes In Assets & Liabilities (2,904) 1,237 (4,141) Cash Flows from Operations 492 5,735 (5,243) Cash Flows from Investing (816) (1,186) 370 Cash Flows from Financing (16) (4,216) 4,200 Net (decrease) Increase (340) 333 (673) Beginning Balance 500 167 333 Ending Balance 160 500 (340) |
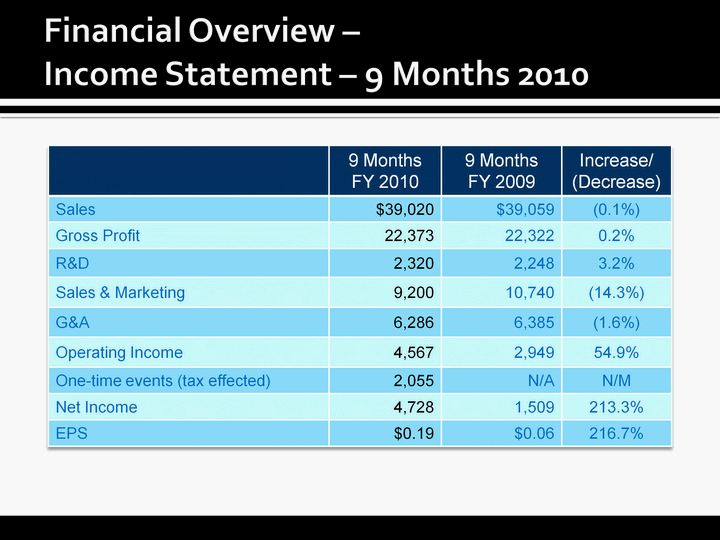
| Financial Overview - Income Statement - 9 Months 2010 9 MonthsFY 2010 9 MonthsFY 2009 Increase/(Decrease) Sales $39,020 $39,059 (0.1%) Gross Profit 22,373 22,322 0.2% R&D 2,320 2,248 3.2% Sales & Marketing 9,200 10,740 (14.3%) G&A 6,286 6,385 (1.6%) Operating Income 4,567 2,949 54.9% One-time events (tax effected) 2,055 N/A N/M Net Income 4,728 1,509 213.3% EPS $0.19 $0.06 216.7% |

| Financial Overview- EPS Reconciliation - 9 Months 2010 EPS Reconciliation - 9 Months 2010 EPS Reconciliation - 9 Months 2010 25 |

| Financial Overview - Balance Sheet - 9 Months 2010 9 Months FY 2010 9 Months FY 2009 Increase/ (Decrease) Cash $17,458* $603 2,795.2% Accounts Receivable 11,216* 8,499 32.0% Inventory 13,176 16,329 (19.3%) Other Current Assets 1,256 1,391 (9.7%) Total Assets 75,805 59,965 26.4% Accounts Payable & Accrued Exp. 3,661 3,710 (1.3%) S/T Debt 1,638 9,313 (82.4%) L/T Debt 4,331 6,388 (32.2%) Stockholders' Equity 43,096 38,062 13.2% 26 Includes $17.0m (net of revolver pay down) and $2.0m, respectively, from the Alcon settlement. The $2.0m in accounts receivable was received after April 30th, 2010. * |

| Financial Overview - Cash Flow Statement - 9 Months 2010 9 Months FY-2010 9 MonthsFY-2009 Increase/(Decrease) Net Income $4,728 $1,509 213.3% Depreciation & Amort. 1,451 1,366 6.2% Changes In Assets & Liabilities (1,615) (4,897) 67.0% Impact of One-Time Events 19,428 N/A N/M Cash Flows from Operations 23,992 (2,022) N/M Cash Flows from Investing 611 (662) N/M Cash Flows from Financing (7,313) 2,787 N/M Net (decrease) Increase 17,298 103 16,694.2% Beginning Balance 160 500 (68.0%) Ending Balance 17,458 603 2,795.2% N/M = Not Meaningful |

| 27 Management Team David M. Hable - CEO & President28 years of progressive responsibility in sales, marketing, new business development and general management in the medical device industry.Kurt Gampp - COO & EVPCo-founded Synergetics, Inc. 28 years of microsurgical instrument making experience.Pamela Boone -CFO & EVPPreviously served as CFO, VP, and Corporate Controller for Maverick Tube Corporation. 23 years of financial expertise.Jerry Malis, M.D. - Chief Scientific Officer & EVPServed as President, CEO, & Chairman of Valley Forge. Over 40 years of industry experience. Published over 50 articles in the biological science, electronics and engineering fields. Issued ten U.S. patents. |

| Investment Rationale Improved stability of the platformUnique, technically proficient worldwide distribution capabilityOpportunity to create "Fast Follower" that will be viewed as an attractive entry vehicle to ophthalmology |

| QUALITY. PERFORMANCE. INNOVATION. Investor Presentation July 2010 Synergetics USA, Inc. 3845 Corporate Centre Drive O'Fallon, MO 63368 (636) 939-5100 www.synergeticsusa.com |