Attached files
| file | filename |
|---|---|
| EX-23.1 - CONSENT OF ERNST & YOUNG LLP, INDEPENDENT REGISTERED PUBLIC ACCOUNTING FIRM - Univar Solutions Inc. | dex231.htm |
Table of Contents
As filed with the Securities and Exchange Commission on June 29, 2010
Registration No. 333-
SECURITIES AND EXCHANGE COMMISSION
Washington, D.C. 20549
FORM S-1
REGISTRATION STATEMENT
UNDER
THE SECURITIES ACT OF 1933
Univar Inc.
(Exact name of Registrant as specified in its charter)
| Delaware | 5169 | 26-1251958 | ||
| (State or other jurisdiction of incorporation or organization) |
(Primary Standard Industrial Classification Code Number) |
(I.R.S. Employer Identification No.) |
17425 NE Union Hill Road
Redmond, Washington 98052
(425) 889-3900
(Address, including zip code, and telephone number, including area code, of Registrant’s principal executive offices)
John J. Zillmer
Univar Inc.
17425 NE Union Hill Road
Redmond, Washington 98052
(425) 889-3900
(Name, address, including zip code, and telephone number, including area code, of agent for service)
Copies to:
| Scott D. Miller Sullivan & Cromwell LLP 1870 Embarcadero Road Palo Alto, California 94303-3308 (650) 461-5600 |
Peter D. Heinz Univar Inc. 17425 NE Union Hill Road Redmond, Washington 98052 (425) 889-3900 |
Leslie N. Silverman Michael J. Volkovitsch Cleary Gottlieb Steen & Hamilton LLP One Liberty Plaza New York, New York 10006 (212) 225-2000 |
Approximate date of commencement of proposed sale to the public:
As soon as practicable after the effective date of this Registration Statement.
If any of the securities being registered on this Form are being offered on a delayed or continuous basis pursuant to Rule 415 under the Securities Act of 1933, as amended (the “Securities Act”), check the following box. ¨
If this Form is filed to register additional securities for an offering pursuant to Rule 462(b) under the Securities Act, please check the following box and list the Securities Act registration number of the earlier effective registration statement for the same offering. ¨
If this Form is a post-effective amendment filed pursuant to Rule 462(c) under the Securities Act, check the following box and list the Securities Act registration number of the earlier effective registration statement for the same offering. ¨
If this Form is a post-effective amendment filed pursuant to Rule 462(d) under the Securities Act, check the following box and list the Securities Act registration number of the earlier effective registration statement for the same offering. ¨
Indicate by check mark whether the Registrant is a large accelerated filer, an accelerated filer, a non-accelerated filer, or a smaller reporting company. See the definitions of “large accelerated filer,” “accelerated filer” and “smaller reporting company” in Rule 12b-2 of the Exchange Act (Check one):
| Large accelerated filer | ¨ | Accelerated filer | ¨ | |||
| Non-accelerated filer | x (Do not check if a smaller reporting company) | Smaller reporting company | ¨ | |||
CALCULATION OF REGISTRATION FEE
| Title of Each Class of Securities to be Registered |
Proposed Maximum |
Amount of Fee | ||
| Common Stock, $0.01 par value per share |
$862,500,000 |
$61,497 | ||
| (1) | Estimated solely for the purpose of computing the amount of the registration fee pursuant to Rule 457(a) under the Securities Act of 1933. |
| (2) | Includes offering price of additional shares which the underwriters have the option to purchase. See “Underwriting.” |
The Registrant hereby amends this Registration Statement on such date or dates as may be necessary to delay its effective date until the Registrant shall file a further amendment which specifically states that this Registration Statement shall thereafter become effective in accordance with Section 8(a) of the Securities Act or until the Registration Statement shall become effective on such date as the Securities and Exchange Commission, acting pursuant to said Section 8(a), may determine.
Table of Contents
The information in this preliminary prospectus is not complete and may be changed. These securities may not be sold until the registration statement filed with the Securities and Exchange Commission is effective. This preliminary prospectus is not an offer to sell nor does it seek an offer to buy these securities in any jurisdiction where the offer or sale is not permitted.
Subject to Completion
Preliminary Prospectus dated June 29, 2010
P R O S P E C T U S

Shares
Univar Inc.
Common Stock
This is an initial public offering of shares of common stock of Univar Inc.
We are selling shares of our common stock and the selling stockholder is selling shares of our common stock. We will not receive any of the proceeds from the shares of our common stock sold by the selling stockholder.
Prior to this offering, there has been no public market for our common stock. The initial public offering price of our common stock is expected to be between $ and $ per share. We intend to apply to list our common stock on the under the symbol “ ”.
Investing in our common stock involves risks that are described in the “Risk Factors” section beginning on page 12 of this prospectus.
| Price to Public |
Underwriting Discounts and Commissions |
Proceeds to Univar Inc. |
Proceeds to Selling Stockholder | |||||
| Per Share |
$ | $ | $ | $ | ||||
| Total |
$ | $ | $ | $ |
The underwriters may also purchase up to an additional shares from the selling stockholder, at the public offering price less underwriting discounts and commissions, within 30 days from the date of this prospectus to cover overallotments, if any.
Neither the Securities and Exchange Commission nor any state securities commission has approved or disapproved of these securities or determined if this prospectus is truthful or complete. Any representation to the contrary is a criminal offense.
The shares will be ready for delivery on or about , 2010.
Joint Book-Running Managers
| Goldman, Sachs & Co. | BofA Merrill Lynch |
| Barclays Capital | Deutsche Bank Securities | |||
| J.P. Morgan |
Morgan Stanley |
Prospectus dated , 2010.
Table of Contents
ABOUT THIS PROSPECTUS
You should rely only on the information contained in this prospectus. We are responsible for the information contained in this prospectus. We have not, and the selling stockholder and the underwriters have not, authorized anyone to provide you with information that is different from that contained in this prospectus, and we take no responsibility for any other information that others may give you. We are offering to sell shares of our common stock and seeking offers to buy shares of our common stock only in jurisdictions where offers and sales are permitted. The information in this prospectus is accurate only as of the date of this prospectus, regardless of the time of delivery of this prospectus or of any sale of our common stock.
Except as otherwise indicated, market data and industry statistics used throughout this prospectus are based on independent industry publications and other publicly available information, including, without limitation, a publicly available industry report published by Boston Consulting Group in January 2010. We do not guarantee, and we have not independently verified, this information. Accordingly, investors should not place undue reliance on this information.
| Page | ||
| 1 | ||
| 12 | ||
| 29 | ||
| 31 | ||
| 32 | ||
| 33 | ||
| 34 | ||
| 35 | ||
| Management’s Discussion and Analysis of Financial Condition and Results of Operations |
38 | |
| 66 | ||
| 70 | ||
| 91 | ||
| 96 | ||
| 107 | ||
| 109 | ||
| 111 | ||
| 114 | ||
| 117 | ||
| Certain United States Tax Consequences to Non-U.S. Holders of Common Stock |
119 | |
| 123 | ||
| 126 | ||
| 130 | ||
| 130 | ||
| 130 | ||
| F-1 |
i
Table of Contents
This summary highlights information contained elsewhere in this prospectus. Before making an investment decision, you should read this entire prospectus carefully, including the section entitled “Risk Factors,” our consolidated financial statements and the related notes included elsewhere in this prospectus. Unless otherwise indicated, the terms “Univar,” the “Company,” “we,” “us,” “our,” “our company” and “our business” refer to Univar Inc. together with its consolidated subsidiaries.
Univar
Founded in 1924 and headquartered in Redmond, Washington, we are a leading global distributor of commodity and specialty chemicals. For the year ended December 31, 2009, we generated $7.2 billion in net sales from the distribution of approximately 5.4 million metric tons of chemicals, making us one of the world’s largest independent chemicals distributors, with a #1 market position in both the United States and Canada and a #2 market position in Europe. We operate a network of over 170 distribution facilities in North America, Europe, the Asia-Pacific region and Latin America, with additional sales offices located in Eastern Europe, the Middle East and Africa. We distribute over 11,000 products in more than 110,000 stockkeeping units, or SKUs, to over 80,000 customers with more than 250,000 customer delivery locations in over 100 countries. As we have grown over the last nine decades, we have refined our core competencies in the sales and marketing of chemicals, logistics, product stewardship and technical expertise to become a strategic resource to both our customers and the chemicals producers whose products we distribute.
Our extensive distribution network and comprehensive product portfolio enable us to offer customers a “one-stop shop” solution for their chemicals needs. Our extensive footprint of facilities and transportation assets dedicated to, and licensed and permitted for, the storage and transportation of chemicals in compliance with the extensive and complex safety, health and environmental regulations applicable throughout the regions in which we operate provides us with a competitive advantage. We also provide our customers with access to an industry-focused salesforce and the technical expertise to customize products and services to fit their particular needs. Our ability to offer customers value-added services, such as repackaging, blending and mixing, technical support, labeling, inventory management, “just-in-time” delivery and vendor rationalization programs, has enabled us to build a loyal customer base. We source chemicals from more than 2,500 producers, including many of the premier global chemicals manufacturers. Our scale, geographic reach, diversified distribution channels and industry expertise enable us to develop strong, long-term relationships with our suppliers, allowing us to integrate our service and logistics capabilities into their business processes and to promote collaboration on supply chain optimization, marketing and other revenue enhancement strategies. The producers we work with also benefit from the insight we provide into customer buying patterns and trends. Our scale and close relationships with chemicals producers often enable us to benefit from attractive pricing for our chemicals purchasing.
1
Table of Contents
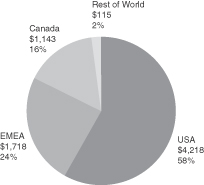
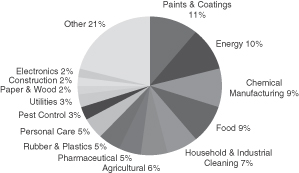
Our business sales strategy is focused on population-driven industries, including paints and coatings, energy, food, household and industrial cleaning, or HIC, pharmaceutical and personal care. We believe that this strategy, combined with our diversity across products, customers, suppliers and geography, allows us to mitigate the effects of volatility on our business in any one region or end market. The following charts illustrate the breakdown of our 2009 net sales to external customers by region and end market:
| 2009 Net Sales by Region (dollars in millions) |
2009 Net Sales by End Market | |||
|
|
Industry Opportunity
According to an independent study published by the Boston Consulting Group in January 2010, the global chemicals industry represents over $2.9 trillion in annual consumption. Approximately $170 billion of this demand in 2008 was channeled through independent chemicals distributors such as Univar. During the period from 2006 through 2008, our industry grew on average 1.5% per annum greater than the combined rate of growth in industrial output, chemicals consumption and underlying prices.
The chemicals production and distribution industries are both highly fragmented, with more than 100,000 chemicals producers, many of which produce only a limited range of products, and approximately 10,000 independent chemicals distributors, very few of which have a multi-national presence or multi-product sales and distribution capabilities. The 10 largest independent chemicals distributors worldwide comprise less than 25% of the global chemicals distribution market. The U.S. market is relatively less fragmented than Europe, Asia and the rest of the world.
We believe that the trend towards increased outsourcing of chemicals distribution and opportunities for consolidation suggest that independent chemicals distributors will be able to compete for a larger portion of the overall chemicals distribution market in the future and that businesses such as Univar, with our global scale and diverse customer, supplier and product portfolio, are well-positioned to capture a growing share of that market.
2
Table of Contents
Competitive Strengths
As our company has grown, we have continued to refine our business model, developing numerous competitive strengths and core competencies in sales and marketing, logistics, product stewardship and technical expertise, enabling us to become an important resource to both our suppliers and customers and to build and maintain leading market positions in many of the key regions and end markets that we serve. Our competitive strengths include:
| • | Leading global market positions. With $7.2 billion in net sales and 5.4 million metric tons of chemicals distributed in the year ended December 31, 2009, we are one of the world’s leading independent chemicals distribution companies with a #1 market position in both the United States and Canada and a #2 market position in Europe. Our extensive global footprint enables us to serve more than 80,000 customers with over 250,000 customer delivery locations in over 100 countries. We also continue to focus on increasing our market share through organic growth, marketing alliances and strategic acquisitions in established and high-growth emerging markets, such as the Asia-Pacific region and Latin America. |
| • | Extensive global distribution network. We operate one of the most extensive chemicals distribution networks in the world, comprised of over 170 distribution facilities, more than 80 million gallons of storage capacity, nearly 2,400 tractors, tankers and trailers, over 600 railcars, eight rail/barge terminals and six deep sea terminals. This broad footprint enables us to leverage best practices across multiple regions. Our purchasing power allows us to maintain a competitive advantage over local and regional chemicals distributors and efficiently serve customers throughout the world, including difficult to reach areas such as the oil sands regions of Northern Canada. Our global distribution platform also creates significant value for both our suppliers and customers through the combination of our comprehensive inventory, electronic ordering and shipment tracking, “just-in-time” delivery, centralized order handling and fulfillment and access to networked inventory sourcing. |
| • | Established scale and operational efficiencies. We believe that the scale of our global distribution network and the breadth and depth of our product offering and value-added service portfolio provide us with significant operational efficiencies, especially in our established markets. Our geographic reach also offers significant operational efficiencies in areas such as global procurement, purchasing scale and supplier relationships, which often enable us to realize volume-based discounts from our suppliers. As one of the world’s largest independent chemicals distributors, we are able to leverage our cost structure through developed logistical networks by aggregating demand and implementing best practices to operate with increasing efficiency as we expand into new markets. We also benefit from a “hub and spoke” distribution network in many of our markets, providing multiple touchpoints for efficient delivery. |
| • | Long-standing, strong relationships with major chemicals producers. We have developed and continue to cultivate strong, mutually beneficial relationships with more than 2,500 chemicals producers, including BASF, Dow Chemical, Dow Corning, DuPont, Eastman Chemical, ExxonMobil Chemical, LyondellBasell, Mitsubishi and Syngenta. We believe that chemicals producers value our distribution network, product stewardship and industry expertise, as we are able to provide them with more efficient and effective access to smaller customers whose purchasing patterns make them more difficult and costly for producers to serve directly. Our long-standing supplier relationships not only allow us often to purchase chemicals on favorable market terms but also often afford us preferred status, particularly during periods of market dislocation, helping to ensure that we are able to source scarce products from multiple producers. |
3
Table of Contents
| • | Broad product offering and value-added service portfolio. We provide a comprehensive portfolio of over 11,000 products, made up of more than 110,000 SKUs, to customers in a diverse range of industries. We also offer value-added services, including repackaging, blending and mixing chemicals in accordance with customer specifications, and procurement solutions that leverage our chemicals, supply chain and logistics expertise, networked inventory sourcing and supplier relationships. We provide our customers with a “one-stop shop” solution for their commodity and specialty chemicals needs and offer a reliable and stable source of quality products. |
| • | End market and product-specific expertise. Our end market and product-specific expertise enables us to work closely with our customers to identify and select chemicals to enhance the performance characteristics of our customers’ end products. For each of the principal end markets that we serve, we have dedicated teams that are composed of professionals with industry-specific expertise. We also have laboratory facilities that provide formulation support and analytical services for our customers. |
| • | Industry leading marketing supported by highly skilled salesforce. We operate one of the leading sales and marketing efforts in the chemicals distribution industry, focused on providing our customers with both regional and industry expertise. We believe our customers and suppliers value our sales and marketing teams, as we are able to help our suppliers and customers better tailor their product portfolios and purchases by providing them with insight into regional and local end market demand patterns and changing customer product preferences. Our highly trained salesforce of nearly 2,400 professionals has the technical expertise to assist customers in the selection and application of commodity and specialty chemicals for their products and processes. Our experienced product management teams focus on the global market dynamics for some of the higher-volume commodity chemicals that we supply. These teams provide our customers with insight into the key market drivers that impact pricing and availability, which is particularly important to our large purchasers of commodity chemicals whose operations often depend on the price and supply of these products. |
| • | Experienced management team with a proven track record. We are led by a committed and seasoned management team that has, on average, over 25 years of operating experience, including extensive experience in managing public companies. Our team has a proven track record of enhancing shareholder value by controlling costs, identifying and integrating strategic acquisitions and successfully operating throughout various economic cycles, including the recent global recession. John Zillmer, our Chief Executive Officer, has over 30 years of operating experience, most recently in the waste management industry, which, like the chemicals distribution industry, focuses on managing and achieving operational efficiencies in a sophisticated logistics environment. Our core team has successfully implemented sustainable operational initiatives and successfully integrated value-enhancing acquisitions, such as Chemcentral, despite challenging market conditions. |
Growth Strategy
We believe that we are well-positioned to capitalize on industry growth and market opportunities to increase our market share by focusing on expanding our scale and global infrastructure, while at the same time further cultivating our relationships with key suppliers and customers. We intend to capitalize on the growth of the global chemicals and chemicals distribution industries and to continue to implement strategies to improve our operating margins. The key elements of our growth strategy are to:
| • | Enhance offerings in key industry and product areas. We seek to position ourselves as the market leader in select industry and product markets, particularly to customers that produce and sell |
4
Table of Contents
| consumer goods or other population-driven products. Because many of our suppliers and customers look for distributors with specialized industrial or product knowledge, we will continue to strengthen our technical and industry-specific expertise by expanding our product lines and our laboratory and other value-added services to become the preferred distributor for a broader range of chemicals producers and end markets. We also seek to offer our suppliers attractive supplemental distribution channels, such as our ChemPoint business, a leading web-based distributor of specialty and fine chemicals to smaller customers, principally in North America and Europe. |
| • | Leverage scale to capitalize on market opportunities. We intend to leverage our scale to capitalize on market opportunities as major chemicals producers outsource an increasing portion of their distribution operations. We believe that we are well-positioned to capture additional sales volume and grow organically at the expense of smaller competitors as we reinforce our position as a “one-stop” provider of chemicals to customers and related supply chain management services for chemicals producers. Our scale also positions us to target markets and customers that large chemicals manufacturers typically find more difficult and costly to serve. |
| • | Build on long-standing customer relationships to enter new markets. As many of our major customers enter new geographic markets, our long-standing relationships position us well to expand our own footprint to serve their chemicals needs at their new locations and to leverage these strong customer relationships to develop or improve our ties with chemicals manufacturers in these locations. |
| • | Capitalize on shifting of chemicals production to lower-cost and higher growth regions. We intend to capitalize on our extensive geographic footprint and long-standing supplier relationships as our suppliers shift production to lower-cost and higher growth regions. In markets where we have a distribution foothold, we plan to expand our market share by offering these producers access to our existing customer base. As we expand into new geographic markets, we plan to grow through consolidation of smaller regional and local distributors, as well as deepen our existing producer relationships by distributing chemicals from new production locations to customers in established markets. |
| • | Expand and deepen our supplier relationships. We intend to develop and cultivate new and existing long-term relationships with key chemicals producers by using our industry experience and broad geographic footprint to target chemicals producers with substantial logistics and distribution needs. We believe we can strengthen our supplier relationships by demonstrating our ability to reduce their overall costs, risks and operating complexity. We also seek to become better integrated into our existing suppliers’ businesses by identifying opportunities to provide additional value-added services and distribute a larger share of their chemicals production globally. |
| • | Implement further operating margins and operational excellence initiatives. We intend to continue to implement our current initiatives designed to improve operating margins through price discipline and the use of product and customer profitability tools, while also targeting operational excellence and efficiency. Some of these key initiatives include: |
| • | expanding the use of our Economic Contribution Margin, or ECM, tool to identify pricing opportunities and profitability drivers; |
| • | optimizing our global sourcing and supply chain network; |
| • | leveraging our distribution network; |
5
Table of Contents
| • | increasing salesforce efficiency; |
| • | improving sales management, price discipline and implementing additional cost control measures; and |
| • | focusing on working capital improvements through management of terms of sale, collection efforts and inventory management. |
| • | Pursue strategic acquisitions. We intend to pursue strategic acquisitions that complement our organic growth initiatives. Specifically, we seek acquisition opportunities that will: |
| • | strengthen our distribution network in existing markets, such as North America and Western Europe—for example, our 2007 acquisition of Chemcentral allowed us to increase market share and improve operational efficiencies in North America. We believe our pending acquisition of Quaron Group will allow us to expand our regional distribution capabilities in Europe and enable us to improve regional efficiencies; |
| • | expand our geographic footprint by providing us with either the opportunity to extend the reach of our existing distribution network into markets that are contiguous to those we already serve—for example, by taking advantage of our growing network in Western Europe to expand into Central Europe; or |
| • | enable us to establish a presence in new geographic markets, particularly major emerging and rapidly growing markets, such as Brazil, China and India. |
Company History
Our history dates back to 1924 when George Van Waters and Nat Rogers began a brokerage business, buying and selling naval stores, paint, raw materials and cotton linters in the Pacific Northwest region of the United States. The Company progressed into the chemicals distribution business and grew through the West and into the Eastern United States. We entered the Canadian market in 1950. In 1986, we acquired McKesson Chemical, then the third largest U.S. chemicals distributor, solidifying our presence throughout the United States and making us the largest chemicals distributor in North America. In 2001, we continued the expansion of our European operations through the acquisition of Ellis & Everard, which specialized in distribution of chemicals in the United Kingdom and Ireland and had additional facilities in Europe and the Eastern United States. In 2007, we acquired Chemcentral, which enabled us to improve our market share and operational efficiencies in North America.
Univar was a public company listed on the New York Stock Exchange until it was acquired by a Dutch company in 1996. Univar was split off and re-established as an independent company organized under Dutch law in 2002 with its shares listed on Euronext, resuming its position as an independent global leader in chemicals distribution. In 2007, the outstanding shares of our parent and the selling stockholder in this offering, Univar N.V., were acquired by investment funds advised by CVC Capital Partners Advisory (U.S.), Inc., or CVC Capital Partners.
Recent Developments
In February 2010, we entered into an agreement to acquire Quaron Group, a chemicals distributor operating in Belgium, France and The Netherlands, for approximately $130 million in cash, subject to regulatory approvals and other customary closing conditions. With a strong presence in commodity chemicals distribution,
6
Table of Contents
we expect that our acquisition of Quaron Group will complement our strong European position in specialty chemicals, provide significant synergies and help reduce our capital expenditures. We expect to close the transaction in the third quarter of this year.
In connection with this offering, we are amending the terms of our credit facilities described under the headings “Description of Our Indebtedness” and “Management’s Discussion and Analysis of Financial Condition and Results of Operations—Long-term Debt.”
Risk Factors
Participating in this offering involves substantial risk. Our ability to execute our strategy is subject to certain risks. The risks described under the heading “Risk Factors” immediately following this summary may cause us not to realize the full benefits of our competitive strengths or may cause us to be unable to successfully execute all or part of our growth strategy. Before you participate in this offering, you should carefully consider all the information in this prospectus, including matters set forth under the heading “Risk Factors.”
Principal Stockholders
Our capital stock is indirectly held by Ulysses Luxembourg S.à.r.l., or Ulysses Luxembourg, and Ulysses Finance S.à.r.l., or Ulysses Finance, two Luxembourg private limited liability companies, the capital stock of which is principally held by investment funds advised by CVC Capital Partners. Upon completion of this offering, these stockholders will own beneficially approximately % of our outstanding shares, or % if the underwriters’ overallotment option is exercised in full.
CVC Capital Partners is a leading global private equity firm. It advises funds with committed capital of over $42 billion. Founded in 1981, CVC Capital Partners today has a network of 19 offices throughout Europe, Asia and the United States, and has completed over 250 investments across a wide range of industries and countries.
Our principal executive offices are located at 17425 NE Union Hill Road, Redmond, Washington 98052, and our telephone number at this address is (425) 889-3900. Our website is www.univarcorp.com. Information contained on our website is not part of this prospectus.
“Univar,” “ChemPoint,” “ChemCare” and the Univar logo are trademarks of Univar. All other trademarks appearing in this prospectus are the property of their respective owners.
We operate in an industry in which it is difficult to obtain precise industry and market information. We have obtained some industry data from a publicly available industry report published by Boston Consulting Group in 2010 and other third-party sources that we believe to be reliable. In certain cases we have based certain statements contained in this prospectus regarding our industry and our position in the industry on our estimates concerning our customers and competitors.
7
Table of Contents
The Offering
| Common stock offered by us |
shares |
| Common stock offered by the selling stockholder |
shares |
| Common stock to be outstanding after this offering |
shares |
| Use of proceeds |
We will receive net proceeds from our sale of common stock in this offering of approximately $ million, assuming an initial offering price of $ per share, the mid-point of the range of prices set forth on the cover of this prospectus, after deducting underwriting discounts and commissions and estimated offering expenses payable by us. We intend to use these proceeds to redeem or repay a portion of our outstanding indebtedness described under the headings “Description of Our Indebtedness” and “Management’s Discussion and Analysis of Financial Condition and Results of Operations—Long-term Debt” and for general corporate purposes. Certain of the underwriters or their affiliates are lenders under or holders of certain of our indebtedness and we intend to use these proceeds to redeem or repay a portion of that outstanding indebtedness. |
We will not receive any of the proceeds from sales of our common stock by the selling stockholder in this offering.
| Risk factors |
Please read “Risk Factors” and other information included in this prospectus for a discussion of factors you should carefully consider before deciding to invest in our common stock. |
| Dividends |
We have not declared or paid cash dividends on our capital stock in our most recent two full fiscal years. We currently expect to retain future earnings, if any, for use in the operation and expansion of our business and do not anticipate paying any cash dividends in the foreseeable future. See “Dividend Policy.” |
| Proposed trading symbol |
“ ” |
The number of shares of common stock to be outstanding after this offering is based on shares outstanding as of , 2010 and excludes any shares to be reserved for issuance under our stock option plans that may be adopted prior to the completion of this offering.
Except as otherwise indicated, all information in this prospectus:
| • | assumes no exercise of the underwriters’ overallotment option; |
| • | assumes the filing of our amended and restated certificate of incorporation and the adoption of our amended and restated bylaws concurrently with the completion of this offering; and |
| • | gives effect to the -for-one stock split of our common stock, which will occur prior to the completion of this offering. |
8
Table of Contents
Summary Consolidated Financial Data
The following summary consolidated financial data should be read together with our consolidated financial statements and the related notes included elsewhere in this prospectus and the discussion under “Management’s Discussion and Analysis of Financial Condition and Results of Operations.” The summary consolidated historical financial data set forth below are not necessarily indicative of the results of future operations. For additional information regarding the below financial data including our use of the terms “predecessor” and “successor,” see “Selected Consolidated Financial Data.”
| Predecessor(1) | Successor(1) | |||||||||||||||||||||||||||||||||
| Years Ended December 31, | Years Ended December 31, |
Three Months Ended March 31, |
||||||||||||||||||||||||||||||||
| (unaudited) | (unaudited) | |||||||||||||||||||||||||||||||||
| 2005 | 2006 | Period from January 1, 2007 to October 11, 2007 |
Period from October 12, 2007 to December 31, 2007 |
2008 | 2009 | 2009 | 2010 | |||||||||||||||||||||||||||
| (in millions) |
||||||||||||||||||||||||||||||||||
| Income Statement Data: |
||||||||||||||||||||||||||||||||||
| Net sales |
$ | 5,987.7 | $ | 6,617.0 | $ | 6,326.9 | $ | 1,790.1 | $ | 9,428.2 | $ | 7,194.5 | $ | 1,791.5 | $ | 1,810.2 | ||||||||||||||||||
| Cost of sales |
5,064.1 | 5,620.2 | 5,441.5 | 1,522.6 | 8,039.2 | 5,985.9 | 1,500.2 | 1,495.6 | ||||||||||||||||||||||||||
| 923.6 | 996.8 | 885.4 | 267.5 | 1,389.0 | 1,208.6 | 291.3 | 314.6 | |||||||||||||||||||||||||||
| Total operating expenses |
715.5 | 761.3 | 713.1 | 237.8 | 1,062.7 | 974.1 | 231.1 | 232.8 | ||||||||||||||||||||||||||
| Operating income |
208.1 | 235.5 | 172.3 | 29.7 | 326.3 | 234.5 | 60.2 | 81.8 | ||||||||||||||||||||||||||
| Other income (expense) |
(27.9 | ) | (31.0 | ) | (58.0 | ) | (37.7 | ) | (315.6 | ) | (307.3 | ) | (76.2 | ) | (73.8 | ) | ||||||||||||||||||
| Income (loss) before income taxes |
180.2 | 204.5 | 114.3 | (8.0 | ) | 10.7 | (72.8 | ) | (16.0 | ) | 8.0 | |||||||||||||||||||||||
| Income tax expense (benefit) |
58.9 | 71.2 | 53.0 | 6.6 | 18.7 | (30.1 | ) | (6.0 | ) | 4.4 | ||||||||||||||||||||||||
| Net income (loss) |
$ | 121.3 | $ | 133.3 | $ | 61.3 | $ | (14.6 | ) | $ | (8.0 | ) | $ | (42.7 | ) | $ | (10.0 | ) | $ | 3.6 | ||||||||||||||
| As of March 31, 2010 | ||||||
| Actual | As adjusted(2) | |||||
| (unaudited) | ||||||
| Balance Sheet Data: |
||||||
| Cash and cash equivalents |
$ | 114.7 | $ | |||
| Total assets |
5,357.3 | |||||
| Working capital(3) |
514.4 | |||||
| Long-term debt |
1,677.1 | |||||
| Total stockholders’ equity |
445.5 | |||||
9
Table of Contents
| Predecessor(1) | Successor (1) | |||||||||||||||||||
| Years Ended December 31, |
Three Months Ended March 31, | |||||||||||||||||||
| Period from January 1, 2007 to October 11, 2007 |
Period from October 12, 2007 to December 31, 2007 |
2008 | 2009 | 2009 | 2010 | |||||||||||||||
| (in millions) | ||||||||||||||||||||
| (unaudited) | ||||||||||||||||||||
| Other Data: |
||||||||||||||||||||
| Adjusted EBITDA(4) |
$ | 252.2 | $ | 80.6 | $ | 498.0 | $ | 427.7 | $ | 92.4 | $ | 118.1 | ||||||||
| Net cash flow from operating activities |
49.8 | 180.8 | 9.4 | 217.4 | 169.4 | 172.8 | ||||||||||||||
| Capital expenditures |
62.6 | 29.1 | 77.5 | 65.9 | 9.6 | 8.3 | ||||||||||||||
| (1) | Predecessor company was acquired on October 11, 2007 by investment funds advised by CVC Capital Partners, a private equity and investment advisory firm. Financial information presented reflects adjustment of assets and liabilities to then-fair value at October 11, 2007, which became the basis for amounts included in results of operations subsequent to October 11, 2007. |
| (2) | As adjusted to give effect to this offering and the application of a portion of the net proceeds therefrom to reduce our outstanding indebtedness. |
| (3) | Current assets, less current liabilities. |
| (4) | We believe that adjusted earnings before interest, income taxes, depreciation and amortization (Adjusted EBITDA) is a useful financial metric to assess our ability to generate cash from operations sufficient to pay taxes, to service debt and to undertake capital expenditures. We also believe that Adjusted EBITDA will provide investors with a useful tool for assessing the comparability between periods of our ability to generate cash from operations sufficient to pay taxes, to service debt and to undertake capital expenditures because, among other things, it eliminates depreciation and amortization expense attributable to our historically higher levels of capital expenditures. We define Adjusted EBITDA as our consolidated net income, plus the sum of: (1) total interest expense, net of interest income; (2) provisions for taxes; (3) depreciation, amortization and goodwill impairment charges; (4) extraordinary losses and unusual or non-recurring charges, including severance costs and relocation costs; (5) expenses incurred in connection with acquisition, investment, recapitalization, disposition and debt or equity issuance transactions; (6) other non-cash charges; and (7) any costs, including cash costs, incurred pursuant to management equity and stock option or other benefit plans; less (1) extraordinary and unusual, non-recurring gains; and (2) non-cash gains. The term Adjusted EBITDA is not defined under U.S. generally accepted accounting principles, or U.S. GAAP, and Adjusted EBITDA is not a measure of operating income, operating performance or liquidity presented in accordance with U.S. GAAP. In addition, Adjusted EBITDA is impacted by reorganization of businesses and other restructuring-related charges. When assessing our operating performance or our liquidity, you should not consider this data in isolation or as a substitute for our net cash from operating activities or other cash flow data that is calculated in accordance with U.S. GAAP. In addition, our Adjusted EBITDA may not be comparable to Adjusted EBITDA or similarly titled measures utilized by other companies since such other companies may not calculate Adjusted EBITDA in the same manner as we do. A reconciliation of net income (loss), the most directly comparable U.S. GAAP measure, to Adjusted EBITDA for each of the respective periods indicated is as follows. |
10
Table of Contents
| Predecessor | Successor | |||||||||||||||||||||||
| Years Ended December 31, |
Three Months Ended March 31, | |||||||||||||||||||||||
| Period from January 1, 2007 to October 11, 2007 |
Period
from October 12, 2007 to December 31, 2007 |
2008 | 2009 | 2009 | 2010 | |||||||||||||||||||
| (in millions) | ||||||||||||||||||||||||
| (unaudited) | ||||||||||||||||||||||||
| Net income (loss) |
$ | 61.3 | $ | (14.6 | ) | $ | (8.0 | ) | $ | (42.7 | ) | $ | (10.0 | ) | $ | 3.6 | ||||||||
| Provision (benefit) for income taxes |
53.0 | 6.6 | 18.7 | (30.1 | ) | (6.0 | ) | 4.4 | ||||||||||||||||
| Interest expense, net |
58.0 | 69.0 | 315.6 | 307.3 | 76.2 | 73.8 | ||||||||||||||||||
| Depreciation |
48.3 | 16.8 | 81.6 | 80.1 | 19.1 | 20.1 | ||||||||||||||||||
| Amortization |
5.6 | 10.9 | 50.8 | 46.3 | 12.0 | 11.2 | ||||||||||||||||||
| Extraordinary losses and unusual or non-recurring charges |
26.0 | 23.2 | 39.3 | 29.6 | 1.1 | — | ||||||||||||||||||
| Expenses incurred for acquisition, investment, recapitalization and disposition |
— | — | — | 1.2 | — | 1.4 | ||||||||||||||||||
| Other non-cash charges reducing net income |
— | — | — | 36.0 | — | 3.6 | ||||||||||||||||||
| Extraordinary gain and unusual or non-recurring gains |
— | (31.3 | ) | — | — | — | — | |||||||||||||||||
| Adjusted EBITDA |
$ | 252.2 | $ | 80.6 | $ | 498.0 | $ | 427.7 | $ | 92.4 | $ | 118.1 | ||||||||||||
11
Table of Contents
The purchase of our common stock involves significant investment risks, some of which are described below. You should consider the risks carefully before investing in our common stock. There may also be risks of which we are currently unaware, or that we currently regard as immaterial based on the information available to us, that later prove to be material. These risks may adversely affect our business, financial condition and operating results. As a result, the trading price of our common stock could decline, and you could lose some or all of your investment.
Risks Related to Our Business
We are affected by general economic conditions, particularly fluctuations in industrial production; and prolonged economic weakening could adversely affect our operations and financial results.
We are a leading global distributor of commodity and specialty chemicals. We sell chemicals that are used principally in industrial and manufacturing processes and our sales are correlated with and affected by fluctuations in the level of industrial production and manufacturing output and general economic activity. In particular, our suppliers, producers of commodity and specialty chemicals, are likely to reduce their output in periods of significant contraction in industrial and consumer demand, while demand for the products we distribute depends largely on trends in demand in the end markets that our customers serve, including consumer goods, as we seek to focus on chemicals sales to customers that produce and sell population driven products. A majority of our sales are in North America and Europe and our business is therefore susceptible to downturns in those economies as well as, to a lesser extent, the economies in the rest of the world. Our profit margins, as well as overall demand for our products, could decline as a result of a large number of factors outside our control, including economic recessions, changes in industrial production processes or consumer preferences, changes in laws and regulations affecting the chemicals industry and the manner in which they are enforced, inflation, fluctuations in interest and currency exchange rates and changes in the fiscal or monetary policies of governments in the areas in which we operate.
General economic conditions and macroeconomic trends could affect overall demand for chemicals, as well as the creditworthiness of our customers. Any overall decline in the demand for chemicals could significantly reduce our sales and profitability. If the creditworthiness of our customers declines, we would face increased credit risk with respect to our trade receivables. In addition, volatility and disruption in financial markets could adversely affect our sales and results of operations by limiting our customers’ ability to obtain financing necessary to maintain or expand their own operations.
Over the past two years, significant economic weakness has affected all regions of the world and all business sectors, especially industrial and manufacturing output. One feature of this economic weakness has been significant destocking of inventories, including inventories of chemicals used in industrial and manufacturing processes. Adverse economic conditions contributed to a 23.7% reduction in our net sales from 2008 to 2009 that was due in large part to lower sales volumes. Our customers reduced purchases because of lower demand from end users as well as inventory destocking. Although there have recently been signs of recovery in many regions, economic weakness could continue or worsen, as has occurred in certain regions of Europe due to concerns over the fiscal and monetary situation in a number of countries, including Greece, Portugal and Spain. The industrial and manufacturing end markets on which we depend may not return to former, higher levels of production in the near term or at all. In addition, it is possible that an improvement in our net sales in a particular period may be attributable in part to restocking of inventories by our customers and represent a level of sales or sales growth that will not be sustainable over the longer term. Further economic weakness could lead to insolvencies among our customers or our suppliers, as well as among financial institutions that are counterparties on financial instruments or accounts that we hold. Any of these developments could have a material adverse effect on our business, financial condition and results of operations.
12
Table of Contents
Disruptions in the supply of chemicals that we distribute or in the operations of our customers could adversely affect our business.
Our business depends on access to adequate supplies of the chemicals that our customers purchase from us. From time to time, we may be unable to access adequate quantities of certain chemicals because of supply disruptions due to natural disasters (including hurricanes and other extreme weather), industrial accidents, scheduled production outages, high demand leading to allocation, port closures and other transportation disruptions and other circumstances beyond our control, or we may be unable to purchase chemicals that we are obligated to deliver to our customers at prices that enable us to earn a profit. In addition, unpredictable events may have a significant impact on the industries in which many of our customers operate, reducing demand for products that we normally distribute in significant volumes. For example, the Gulf of Mexico oil disaster has had a major impact on our customers that manufacture and operate offshore drilling equipment. Significant disruptions of supply and in customer industries could have a material adverse effect on our business, financial condition and results of operations.
In 2005 and 2008, major hurricanes caused significant disruptions in operations of several of our suppliers and customers on the U.S. Gulf Coast, logistics across the region and the supply of certain raw materials, all of which had an adverse impact on the demand for and cost of some of the chemicals products we sell. In addition, adverse weather events may affect our distribution facilities, in particular at deep water ports. Future significant weather related events could negatively affect our results of operations.
Significant changes in the business strategies of our suppliers could also disrupt our supply. Large chemicals manufacturers may elect to distribute certain products (or products in certain regions) directly to end user customers, instead of relying on independent distributors such as us. While we do not believe that our results depend materially on access to any individual producer’s products, a reversal of the trend toward more outsourced distribution of chemicals would likely result in increasing margin pressure or products becoming unavailable to us. Any of these developments could have a material adverse effect on our business, financial condition and results of operations.
To the extent we have contracts with suppliers and customers, they are generally short term or terminable upon notice, and termination of our relationships with suppliers and customers contracts could negatively affect our business.
Our purchases and sales of chemicals are typically made pursuant to purchase orders rather than long-term contracts. While some of our relationships for the distribution and sale of specialty chemicals have exclusivity provisions, we may be unable to enforce these provisions effectively for legal or business reasons. Many of our contracts with both customers and suppliers are terminable without cause upon 30 days’ notice to us from the supplier or customer. Our business relationships and reputation may suffer if we are unable to meet our delivery obligations to customers which may occur because many of our suppliers are not subject to contracts or can terminate contracts on short notice. In addition, renegotiation of purchase or sales terms to our disadvantage could reduce our sales margins. Any of these developments could adversely affect our business, financial condition and results of operations.
We might not be able to pass through cost increases to our customers. We could experience financial losses if our inventories of one or more chemicals exceed our sales and the price of those chemicals decreases significantly or if they fall short of our sales and the purchase price of those chemicals increases significantly. In addition, we could lose customers and suffer damage to our reputation if we are unable to meet customer demand for a particular product.
We purchase and sell a wide variety of chemicals, the price and availability of which may fluctuate. Our business is exposed to these fluctuations, as well as to fluctuations in our costs for transportation and distribution due to rising fuel prices or increases in charges from common carriers, rail companies and other third-party
13
Table of Contents
transportation providers, as well as other factors. We have in the past generally been able to pass on chemicals and transportation price increases to our customers. Nevertheless, changes in chemicals prices affect our net sales and cost of goods sold, as well as our working capital requirements, levels of debt and financing costs. We might not always be able to reflect increases in our chemicals, transportation and other costs in our own pricing. Any inability to pass cost increases onto customers may adversely affect our business, financial condition and results of operations.
In order to meet customer demand, we typically maintain significant inventories and are therefore subject to a number of risks associated with our inventory levels, including the following:
| • | declines in the prices of chemicals; |
| • | the need to maintain significant inventory of chemicals that may be in limited supply and therefore difficult to procure; |
| • | buying chemicals in bulk for the best pricing; |
| • | responding to the unpredictable demand for chemicals; |
| • | cancellation of customer orders; and |
| • | responding to customer requests for quick delivery. |
In order to manage our inventories successfully, we must estimate demand from our customers and purchase chemicals on a regional basis that substantially corresponds to that demand. If we overestimate demand and purchase too much of a particular chemical, we face a risk that the price of that chemical will fall, leaving us with inventory that we cannot sell profitably and that we may have to write down if we are unable to sell it for its recorded value. If we underestimate demand and purchase insufficient quantities of a particular chemical and prices of that chemical rise, we could be forced to purchase that chemical at a higher price and forego profitability in order to meet customer demand. Our business, financial condition and results of operations could suffer a material adverse effect if either or both of these situations occur frequently or in large volumes.
We also face the risk of dissatisfied customers and damage to our reputation if we cannot meet customer demand for a particular chemical because we are short on inventories. In addition, particularly in cases of pronounced cyclicality in the end market, it can be difficult to anticipate our customers’ requirements for particular chemicals, and we could be asked to deliver larger-than-expected quantities of a particular chemical on short notice. If for any reason we experience widespread, systemic difficulties in filling customer orders, our customers may be dissatisfied and discontinue their relationship with us or we may be required to pay a higher price in order to obtain the needed chemical on short notice, thereby adversely affecting our margins.
We have in the past and intend in the future to make acquisitions and strategic investments, which will involve numerous risks. We may not be able to address these risks without substantial expense, delay or other operational or financial problems.
Part of our strategy is to acquire or make investments in related businesses. Acquisitions or investments involve various risks, such as:
| • | integrating the operations and personnel of any acquired business; |
| • | the potential disruption of our ongoing business, including the diversion of management attention; |
| • | the possible inability to obtain the desired financial and strategic benefits from the acquisition or investment; |
14
Table of Contents
| • | customer attrition arising from preferences to maintain redundant sources of supply; |
| • | assumption of contingent or unanticipated liabilities; |
| • | dependence on the retention and performance of existing management and work force of acquired businesses for the future performance of these businesses; and |
| • | the risks inherent in entering geographic or product markets in which we have limited prior experience. |
Future acquisitions and investments would likely need to be financed in part through additional financing from banks, through public offerings or private placements of debt or equity securities or other arrangements, and could result in substantial cash expenditures. The necessary acquisition financing may not be available to us on acceptable terms if and when required, particularly because our current high leverage may make it difficult or impossible for us to secure additional financing for acquisitions. We may also finance an acquisition by issuing equity securities or equity-linked securities that may have a dilutive effect on our stockholders.
To the extent that we make acquisitions that result in our recording significant goodwill or other intangible assets, the requirement to review goodwill and other intangible assets for impairment periodically may result in impairments that could have a material adverse effect on our financial condition and results of operations.
In connection with acquisitions or divestitures, we may inadvertently become subject to liabilities.
In connection with any acquisitions, we may acquire liabilities or defects such as legal claims, including but not limited to third-party liability and other tort claims; claims for breach of contract; employment-related claims; environmental liabilities, conditions or damage; hazardous materials or liability for hazardous materials; or tax liabilities. If we acquire any of these liabilities, and they are not adequately covered by insurance or an enforceable indemnity or similar agreement from a creditworthy counterparty, we may be responsible for significant out-of-pocket expenditures. These liabilities, if they materialize, could have a material adverse effect on our business, financial condition and results of operations.
We generate a significant portion of our net sales internationally and intend to continue to expand our international operations. We face particular challenges in emerging markets. Our results of operations could suffer if we are unable to manage our international operations effectively or as a result of various risks beyond our control.
During the year ended December 31, 2009, over 40% of our net sales were generated outside of the United States. We intend to continue to expand our penetration in certain foreign markets and to enter new foreign markets. Expansion of our international business will require significant management attention and resources. The profitability of our international operations will largely depend on our continued success in the following areas:
| • | securing key supplier relationships to help establish our presence in international markets; |
| • | hiring and training personnel capable of supporting our suppliers and customers and managing operations in foreign countries; |
| • | localizing our business processes to meet the specific needs and preferences of foreign suppliers and customers, which may differ in certain respects from our experience in the United States; |
| • | building our reputation and awareness of our services among foreign suppliers and customers; and |
15
Table of Contents
| • | implementing new financial, management information and operational systems, procedures and controls to monitor our operations in new markets effectively, without causing undue disruptions to our operations and customer relationships. |
In addition, we are subject to risks associated with operating in foreign countries, including:
| • | varying and often unclear legal and regulatory requirements that may be subject to inconsistent or disparate enforcement, particularly regarding environmental issues and security or other certification requirements, as well as other laws and business practices that favor local competitors, such as exposure to possible expropriation, nationalization, restrictions on investments by foreign companies or other governmental actions; |
| • | competition from existing market participants that may have a longer history in and greater familiarity with the foreign markets where we operate; |
| • | tariffs, export duties, quotas and other barriers to trade; as well as possible limitations on the conversion of foreign currencies into U.S. dollars or remittance of dividends and other payments by our foreign subsidiaries; |
| • | divergent labor regulations and cultural expectations regarding employment; |
| • | different cultural expectations regarding industrialization, international business and business relationships; |
| • | foreign taxes and related regulations, including foreign taxes that we may not be able to offset against taxes imposed upon us in the United States, and foreign tax and other laws limiting our ability to repatriate earnings to the United States; |
| • | extended payment terms and challenges in our ability to collect accounts receivable; and |
| • | changes in a specific country’s or region’s political or economic conditions. |
If we fail to address the challenges and risks associated with international expansion, we may encounter difficulties implementing our strategy, thereby impeding our growth and harming our operating results.
Our operations in the Asia-Pacific region and Latin America are at an early stage, and it may prove difficult to achieve our goals and take advantage of growth and acquisition opportunities in those or in other emerging markets due to a lack of comprehensive market knowledge and network and legal restrictions and other factors that often characterize emerging markets, such as significant government influence over local economies, substantial fluctuations in economic growth, high levels of inflation and volatility in currency values, exchange controls or restrictions on expatriation of earnings, high domestic interest rates, wage and price controls, changes in governmental economic or tax policies, imposition of trade barriers, unexpected changes in regulation, and overall political social and economic instability. In addition, the heightened exposure to terrorist attacks against or acts of war or civil unrest involving our facilities, if they occur, could result in damage to our facilities, substantial financial losses or injuries to our personnel.
Our operations are generally structured in a decentralized manner. Although we exercise what we believe to be an appropriate level of central control and active supervision of our operations around the world, our local subsidiaries retain significant operational flexibility. There is a risk that our operations around the world will experience problems that could damage our reputation, or that could otherwise have a material adverse effect on our business, financial condition and results of operations.
16
Table of Contents
Fluctuations in currency exchange rates may adversely affect our results of operations.
We sell products in over 100 countries and we generated over 40% of our 2009 net sales outside the United States. The revenues we receive from such foreign sales are often denominated in currencies other than the U.S. dollar. We enter into forward currency exchange contracts and other arrangements intended to hedge virtually all of our transactional exposure to adverse fluctuations in exchange rates with respect to our purchases and sales of inventory. Nevertheless, these arrangements may not always be effective, particularly in the context of sudden, severe or unexpected market movements. We do not hedge our foreign currency exposure with respect to our investment in and earnings from our foreign businesses. Accordingly, we might suffer significant losses if there is a significant adverse movement in exchange rates.
In addition, we report our consolidated results in U.S. dollars. The results of operations and the financial position of our local operations are generally reported in the relevant local currencies and then translated into U.S. dollars at the applicable exchange rates for inclusion in our consolidated financial statements, exposing us to currency translation risk. Consequently, any change in exchange rates between our foreign subsidiaries’ functional currencies and the U.S. dollar will affect our consolidated income statement and balance sheet when the results of those operating companies are translated into U.S. dollars for reporting purposes. Decreases in the value of our foreign subsidiaries’ functional currencies against the U.S. dollar will tend to reduce those operating companies’ contributions in dollar terms to our financial condition and results of operations. In 2009, our most significant currency exposures were to the euro, the Canadian dollar and the British pound sterling versus the U.S. dollar. The exchange rates between these and other foreign currencies and the U.S. dollar may fluctuate substantially, and such fluctuations have had a significant effect on our results in recent periods. For additional details on our currency exposure and risk management practices, see “Management’s Discussion and Analysis of Financial Condition and Results of Operations” and “—Quantitative and Qualitative Disclosures about Market Risk—Foreign currency risk.”
The markets in which we compete are highly competitive.
The markets for the chemicals we sell and distribute are highly competitive. Chemicals can be purchased from a variety of sources, including traders, brokers, wholesalers and other distributors, as well as directly from producers. Many of the products we distribute are made to industry standard specifications, and are essentially fungible with products offered by our competition. The competitive pressure we face is particularly strong in sectors and markets where local competitors have strong positions. Increased competition from distributors of products similar to or competitive with ours could result in price reductions, reduced margins and a loss of market share.
We expect to continue to experience significant and increasing levels of competition in the future. We must also compete with smaller companies that have been able to develop strong local or regional customer bases. In certain countries, some of our competitors are more established, benefit from greater name recognition and have greater resources within these countries than we do.
We rely on our computer and data processing systems, and a large-scale malfunction could disrupt our business.
Our ability to keep our business operating effectively depends on the functional and efficient operation of our enterprise resource planning and telecommunications systems, including our inventory tracking and billing systems. We rely on these systems to track transactions, billings, payments and inventory, as well as to make a variety of day-to-day business decisions. Our systems are susceptible to malfunctions and interruptions (including due to equipment damage, power outages, computer viruses and a range of other hardware, software and network problems) and we may experience such malfunctions or interruptions in the future. Although our systems are diversified, including multiple server locations and a range of software applications for different regions and functions, a significant or large-scale malfunction or interruption of our computer or data processing
17
Table of Contents
systems could adversely affect our ability to manage and keep our operations running efficiently, and damage our reputation if we are unable to track transactions and deliver products to our customers. A malfunction that results in a wider or sustained disruption to our business could have a material adverse effect on our business, financial condition and results of operations.
Our implementation of our enterprise resource planning project in Europe may cause interruptions in our business or impact our internal controls.
We are proceeding with a project to implement our enterprise resource planning, or ERP, system throughout our European operations. Implementation of the project carries a number of risks, including the risk of interruptions of our business activities such as ordinary sales, delivery and billing that would have an adverse impact on our business, financial condition and results of operations. In addition, we may need to modify or redesign our current internal controls to support implementation and operation of our ERP system. Deficiencies may occur in the design or operation of our internal control over financial reporting that could lead to a material weakness in our internal control over financial reporting.
We depend on transportation assets, some of which we do not own, in order to deliver products to our customers.
Although we maintain a significant portfolio of owned and leased transportation assets in North America, including trucks, trailers, railcars and barges, we also rely on transportation provided by third parties (including common carriers and rail companies) to deliver products to our customers, particularly outside the United States and Canada. Our access to third-party transportation is not guaranteed, and we may be unable to transport chemicals at economically attractive rates in certain circumstances, particularly in cases of adverse market conditions or disruptions to transportation infrastructure. We are also subject to increased costs that we may not always be able to recover from our customers, including rising fuel prices, as well as increases in the charges imposed by common carriers, leasing companies and other third parties involved in transportation. In particular, our U.S. operations rely to a significant extent on rail shipments, and we are therefore required to pay rail companies’ network access fees, which have increased significantly in recent periods, while bulk shipping rates have also recently been highly volatile. We are also subject to the risks normally associated with product delivery, including inclement weather, disruptions in the transportation infrastructure, disruptions in our lease arrangements and the availability of fuel, as well as liabilities arising from accidents to the extent we are not adequately covered by insurance. Our failure to deliver products in a timely and accurate manner could harm our reputation and brand, which could adversely affect our business, financial condition and results of operations.
Our business exposes us to significant risks associated with hazardous substances and activities, not of all which are covered by insurance.
Because we are engaged in the handling, storing, treating, selling and transporting of chemicals and chemical waste products, many of which are hazardous materials, product liability, health, fire damage, safety and environmental risks are a significant concern for us. We are also subject to federal legislation enforced by the Occupational Safety and Health Administration, or OSHA, as well as present and future claims with respect to workplace exposure; exposure of contractors on our premises, as well as other persons located nearby; workers’ compensation and other matters. We carry insurance to protect us against many accident-related risks involved in the conduct of our business and we maintain environmental damage and pollution insurance coverage in accordance with our assessment of the risks involved or ability to bear those risks and the cost and availability of insurance. Each of these insurance policies is subject to customary exclusions, deductibles and coverage limits that we believe are generally in accordance with industry standards and practices. We do not insure against all risks and may not be able to insure adequately against certain risks (whether relating to our activities or other matters) and may not have insurance coverage that will pay any particular claim. We also may be unable to obtain adequate insurance coverage for the risks we currently insure at commercially reasonable rates in the future, and certain risks could become completely uninsurable or eligible for coverage only to a reduced extent.
18
Table of Contents
In particular, more stringent environmental or safety and health regulations may increase our costs for, or impact the availability of, insurance against the risks of environmental damage or pollution. Our business, financial condition and results of operations could be materially impaired by accidents that substantially reduce our revenues, increase our costs or subject us to other liabilities in excess of available insurance.
Accidents, environmental damage, major or systemic delivery failures involving our distribution network or the products we carry, or adverse health effects or other harm related to hazardous materials that we carry or store could damage our reputation and result in substantial remedial obligations.
Our business depends to a significant extent on our customers’ and suppliers’ trust in our reputation for quality, safety and environmental responsibility. Actual or alleged instances of safety deficiencies, inferior product quality, exposure to hazardous materials resulting in illness, injury or other harm to persons or property, or of environmental damage caused by us or our products, could damage our reputation and lead to customers and suppliers curtailing the volume of business they do with us. Any of these events, outcomes or allegations could also subject us to substantial legal claims, and we could incur substantial expenses, including legal fees and other costs, in defending such legal claims.
Actual or alleged accidents or other incidents at our facilities or that otherwise involve our personnel or operations could also subject us to claims for damages by third parties. Because many of the chemicals that we handle, such as chlorine gas, are dangerous, we are subject to the ongoing risk of hazards, including explosions and fires that may cause property damage, illness, physical injury or death. Several of our distribution facilities, including our Los Angeles facility, one of our largest, are located relatively near high-density population centers. If such events occur, whether through our own fault, through preexisting conditions at our facilities, through the fault of a third party, or through a natural disaster, terrorist incident or other event outside our control, our reputation could be damaged significantly. We could also become responsible, as a result of environmental or other laws or by court order, for substantial monetary damages or expensive remedial obligations related to such accidents, including but not limited to those resulting from third-party lawsuits or environmental clean-up obligations on and off-site. The amount of any costs, including fines, damages and/or remedial obligations, that we may become obligated to pay under such circumstances could substantially exceed any insurance we have to cover such losses.
We depend to a significant extent on our customers’ and suppliers’ trust in our reputation for reliability, quality, safety and environmental responsibility. Actual or alleged safety deficiencies or inferior product quality, late delivery, or damage caused by us or our products, could damage our reputation and could lead to customers and suppliers curtailing the volume of business they do with us. Any of these risks, if they materialize, could significantly harm our reputation, expose us to substantial liabilities and have a material adverse effect on our business, financial condition and results of operations.
We are subject to extensive environmental, health and safety laws and regulations. Changes in these laws and regulations or in their interpretation could hurt our business by increasing our costs of doing business and reducing our profitability.
Because we store, handle, transport and arrange for the disposal of chemicals and waste materials, we are subject to extensive environmental, health and safety laws and regulations in multiple jurisdictions. These include laws and regulations governing our management, storage and transportation of chemicals; air, water and ground contamination; and the cleanup of contaminated sites, including any spills that may result from our transportation of chemicals. Aspects of our business require that we hold a number of permits and licenses. Compliance with these laws, regulations, permits and licenses requires that we expend significant amounts for ongoing compliance and remediation. If we fail to comply with such laws or regulations we may be subject to fines and other civil, administrative or criminal sanctions, including the revocation of permits and licenses necessary to continue our business activities. In addition, we may be required to pay damages or civil judgments in respect of third-party claims, including those relating to personal injury (including exposure to hazardous
19
Table of Contents
substances we store, handle, transport or dispose of), property damage or contribution to remedial obligations. Some environmental laws could impose on us the entire cost of clean-up of contamination present at a site even though we did not cause the contamination. These laws often identify parties that can be jointly and severally liable for remediation, regardless of fault or whether the original activity was legal at the time it occurred. We may be identified as a potentially responsible party with regard to additional sites beyond those for which we already have remedial obligations. Such developments could have a material adverse effect on our business, financial condition and results of operations. See “Business—Regulatory Matters—Environmental Matters.”
We believe that we comply in all material respects with applicable environmental laws and regulations. We have health and safety management programs in place to monitor compliance with applicable regulatory requirements and with internal policies and procedures, as appropriate. Previous operations (including those of acquired companies), however, carried out under then prevailing standards may have resulted in contamination at various sites, which must be remediated. In addition, we are subject to environmental liabilities for a share of remediation expenses required to address contamination of third-party sites. We have spent substantial sums on such remediation and we expect to continue to incur such expenditures in the future, which we have incorporated into our environmental accruals. Based on current estimates, we believe that none of these ongoing remediation costs will materially affect our business. There is no guarantee, however, that our estimates will be accurate, that new contamination will not be discovered or that new environmental laws or regulations will not require us to incur additional costs. Any such inaccuracies, discoveries or new laws or regulations could have a material adverse effect on our business, financial condition and results of operations. We also may incur substantial costs, including fines, damages, criminal or civil sanctions and remediation costs, or experience interruptions in our operations for violations under environmental, health and safety laws or permit requirements.
Concerns regarding the safety of chemicals in commerce and their potential impact on the environment reflect a growing trend in societal demands for increasing levels of product safety and environmental protection. These concerns could manifest themselves in pressure for more stringent regulatory intervention. In addition, these concerns could influence public perceptions, the viability of the products of certain of our suppliers, the cost to comply with regulations, which are becoming more complex, which could have a negative impact on our results of operations.
These laws and regulations vary significantly from country to country and change frequently. Future changes in laws and regulations could have an adverse effect on us by tightening restrictions, reducing our freedom to do business, increasing our costs of doing business and reducing our profitability.
Examples of past changes in laws and regulation include changes in storage regulations governing hazardous chemicals; requirements for end user documentation and authorizations for certain chemicals; and prohibitions on the manufacture or sale of certain chemicals following determinations that they are hazardous. In Europe, the proposed system for the registration, evaluation and authorization of chemicals (REACH) may increase costs, which may cause the withdrawal of some of the chemicals that fall within the scope of the proposed system from the marketplace. Findings by government agencies that chemicals pose especially great environmental or health risks may lead to their prohibition in some or all of the jurisdictions in which we operate.
Current and additional future climate change regulation in the United States and in other jurisdictions around the world could also have a material effect on our business. Increased energy costs or emissions associated with our customers’ products or development of alternative products having lower indirect emissions could materially affect demand for those products and indirectly affect our business. Changes in and introductions of regulations have in the past caused us to devote significant management and capital resources to compliance programs and measures, and future stricter regulations applicable to us would likely further increase these compliance costs and could have a material adverse effect on our business, financial condition and results of operations. Changes in laws and regulations or their interpretation, or a failure to comply with current laws or regulations, may have a material adverse effect on our business, financial condition and results of operations.
20
Table of Contents
Local, state and federal governments have begun a regulatory process that could lead to new regulations impacting the security of chemicals storage locations and the transportation of hazardous chemicals.
Growing public and political attention has been placed on protecting the chemicals industry and other critical infrastructure from security threats. International terrorism, natural disasters and political unrest in some areas of the world have increased concern regarding the security of chemicals production and distribution. In addition, local, state and federal governments have begun a regulatory process that could lead to new regulations impacting the security of chemicals production and storage locations and the transportation of hazardous chemicals. In the United States, several legislative initiatives could lead to new regulation in this area.
We are subject to asbestos claims.
In connection with our purchase of McKesson Chemical in 1986, we are obligated to indemnify McKesson Chemical for certain claims alleging injury from exposure to asbestos-containing products by McKesson Chemical. As of May 31, 2010, we were defending lawsuits by several hundred plaintiffs claiming asbestos related injuries. See “Business—Legal Proceedings—Asbestos Claims.” Although our costs of defense to date have not been material and we do not expect to incur material liability as a result of these cases, we cannot predict the ultimate outcome of these lawsuits, which, if determined adversely to us, may result in liability that would have a material adverse effect on our business, financial condition and results of operations.
Our business is subject to many operational risks for which we might not be adequately insured.
We are exposed to risks including, but not limited to, accidents, environmental damage, natural disasters, terrorism, acts of war and civil unrest and other events that could potentially interrupt our business operations and/or result in significant costs. Although we attempt to cover these risks with insurance policies to the extent that we consider appropriate, we may incur losses that are not covered by insurance or exceed the maximum amounts covered by our insurance policies. Damage to a major facility, whether or not insured, could impair our ability to operate our business in a geographic region and cause loss of business and related expenses. From time to time, various types of insurance for companies involved in chemicals distribution have not been available on commercially acceptable terms or, in some cases, available at all. In the future we may not be able to maintain our current coverages. In addition, premiums, which have increased significantly in the last several years, may continue to increase in the future. Increased insurance premiums or our incurrence of significant uncovered losses could have a material adverse effect on our business, financial condition and results of operations.
We are exposed to ongoing litigation and other legal and regulatory actions and risks in the ordinary course of our business, and we could incur significant liabilities and substantial legal fees.
We are subject to the risk of litigation, other legal claims and proceedings, and regulatory enforcement actions in the ordinary course of our business. The results of legal proceedings cannot be predicted with certainty. We cannot guarantee that the results of current or future legal proceedings will not materially harm our business, reputation or brand, nor can we guarantee that we will not incur losses in connection with current or future legal proceedings that exceed any provisions we may have set aside in respect of such proceedings or that exceed any applicable insurance coverage. The occurrence of any of these events could have a material adverse effect on our business, financial condition or results of operations.
Many of the products we sell have “long-tail” exposures, giving rise to liabilities many years after their sale and use. Insurance purchased at the time of sale may not be available when costs arise in the future and suppliers may no longer be available to provide indemnification.
21
Table of Contents
Our balance sheet includes significant intangible assets, which could become impaired.
We carry significant intangible assets on our balance sheet. As of March 31, 2010, our intangible assets totaled $1.9 billion, including approximately $1.5 billion in goodwill resulting from our 2007 acquisition by investment funds advised by CVC Capital Partners. Although we currently do not expect that these intangible assets will be impaired, we cannot guarantee that no impairment will occur, particularly in the event of a substantial deterioration in our future prospects either in total or in a particular reporting unit. If our intangible assets become impaired, it could have a material adverse effect on our share price, financial condition and results of operations.
We require significant working capital, and we expect our working capital needs to increase in the future, which could result in having lower cash available for, among other things, capital expenditures and acquisition financing.
We require significant working capital to purchase chemicals from chemicals producers and distributors and sell those chemicals efficiently and profitably to our customers. Our working capital needs also increase at certain times of the year, as our customers’ requirements for chemicals increase. For example, our customers in the agricultural sector require significant deliveries of chemicals within a growing season that can be very short and depend on weather patterns in a given year. We need inventory on hand to have product available to ensure timely delivery to our customers. If our working capital requirements increase and we are unable to finance our working capital on terms and conditions acceptable to us, we may not be able obtain chemicals to respond to customer demand, which could result in a loss of sales.
Additionally, the amount of working capital we require to run our business is expected to increase in the future. If our working capital needs increase, the amount of free cash we have at our disposal to devote to other uses will decrease. A decrease in free cash could, among other things, limit our flexibility, including our ability to make capital expenditures and to acquire suitable acquisition targets that we have identified. If increases in our working capital occur and have the effect of decreasing our free cash, it could have a material adverse effect on our business, financial condition and results of operations.
Our quarterly operating results may fluctuate significantly as a result of factors outside of our control, which could cause the market price of our common stock to decline.
We expect our revenues and operating results to vary from quarter to quarter. As a consequence, our operating results in any single quarter may fall below the expectations of securities analysts and investors, which could cause the price of our common stock to decline. Factors that may affect our operating results include:
| • | the type, timing and size of orders and shipments; |
| • | variations in product volumes, mix and cost during any period; |
| • | development of new relationships and maintenance and enhancement of existing relationships with customers and suppliers; |
| • | deferral of deliveries; |
| • | the fixed nature of certain of our expenses, and the fact that many of our expenses are not necessarily tied to our operating revenue; and |
| • | industry and economic conditions, including competitive pressures and inventory valuations. |
In addition, we may experience seasonality in our operating results. These seasonal variations may lead to fluctuations in our quarterly operating results and volatility in our stock price.
22
Table of Contents
We depend on a limited number of key personnel who would be difficult to replace. If we lose the services of these individuals, or are unable to attract new talent, our business will be adversely affected.
We depend upon the ability and experience of a number of our executive management and other key personnel who have substantial experience with our operations, the chemicals and chemicals distribution industries and the selected markets in which we operate. The loss of the services of one or a combination of our senior executives or key employees could have a material adverse effect on our results of operations. Our success also depends on our ability to continue to attract, manage and retain other qualified management and technical and clerical personnel as we grow. We may not be able to continue to attract or retain such personnel in the future.
A portion of our workforce is unionized and labor disruptions could decrease our profitability.
As of March 31, 2010, we had approximately 650 employees in the United States subject to various collective bargaining agreements, most of which have a three-year term. In addition, in several of our international facilities, particularly those in Europe, employees are represented by works councils appointed pursuant to local law consisting of employee representatives who have certain rights to negotiate working terms and to receive notice of significant actions. These arrangements grant certain protections to employees and subject us to employment terms that are similar to collective bargaining agreements. We cannot assure you that we will be able to negotiate these or other collective bargaining agreements or arrangements with works councils on the same or more favorable terms as the current agreements or arrangements, or at all, and without interruptions, including labor stoppages at the facility or facilities subject to any particular agreement or arrangement. A prolonged labor dispute, which could include a work stoppage, could have a material adverse effect on our business, financial condition and results of operations.
Negative developments affecting our pension plans may occur.
We operate a number of pension plans for our employees and have obligations with respect to several multi-employer pension plans sponsored by labor unions in the United States. The terms of these plans vary from country to country. Generally, our defined benefit pension plans are funded with trust assets invested in a diversified portfolio of debt and equity securities and other investments. Among other factors, changes in interest rates, investment returns, the market value of plan assets and actuarial assumptions can (1) affect the level of plan funding; (2) cause volatility in the net periodic pension cost; and (3) increase our future contribution requirements. In or following an economic environment characterized by declining investment returns and interest rates, we may be required to make additional cash contributions to our pension plan and recognize further increases in our net pension cost to satisfy our funding requirements. A significant decrease in investment returns or the market value of plan assets or a significant decrease in interest rates could increase our net periodic pension costs and adversely affect our results of operations.
Our pension plans in the United States and certain other countries are not fully funded. We estimate that the difference between the value of existing plan assets and total future pension liabilities of the pension funds was approximately $352.4 million at December 31, 2009. This amount could increase or decrease depending on factors such as those mentioned above. A requirement for additional funding would have a direct effect on our cash position and (after use of available provisions) on our profit and loss account. At this moment, there is no such immediate requirement to fund this deficit, but we could be required to do so in the coming years. The timing for any such requirement is uncertain given the implicit uncertainty regarding the future developments of factors mentioned above.
Consolidation of our competitors in the markets in which we operate could place us at a competitive disadvantage and reduce our profitability.
We operate in an industry which is highly fragmented on a global scale, but in which there has been a trend toward consolidation in recent years. Consolidations of our competitors may jeopardize the strength of our positions in one or more of the markets in which we operate and any advantages we currently enjoy due to the
23
Table of Contents
comparative scale of our operations. Losing some of those advantages could adversely affect our business, financial condition and results of operations, as well as our growth potential.
Risks Related to Our Capital Structure
Our substantial indebtedness could adversely affect our results of operations and financial condition and prevent us from fulfilling our obligations under our indebtedness.
We have a significant amount of indebtedness. As of March 31, 2010, we had long-term debt of $1,677.1 million, as described in more detail in “Description of Our Indebtedness.” Our existing indebtedness generally allows us to incur additional indebtedness, subject to our continued compliance with financial covenants. Our substantial indebtedness could have important consequences to our business, including the following:
| • | increase our vulnerability to general adverse economic and industry conditions; |
| • | require us to dedicate a substantial portion of our cash flow from operations to payments on our indebtedness, thereby reducing the availability of our cash flow to fund working capital, capital expenditures and other general corporate purposes, including to fund acquisitions; |
| • | limit our flexibility in planning for, or reacting to, changes in our business and the industry in which we operate; |
| • | place us at a competitive disadvantage compared to our competitors that have less debt; |
| • | decrease our attractiveness as a distributor for our suppliers; |
| • | limit our ability to borrow additional funds; and |
| • | limit our ability to pay dividends. |
The occurrence of any one of these events could have a materially adverse effect on our business, financial condition and results of operations.
Our financial instruments contain restrictive and financial covenants and, if we are unable to comply with these covenants, we will be in default. A default could result in the acceleration of our outstanding indebtedness, which would have an adverse effect on our business and stock price.
Our financial instruments contain customary covenants that require us to maintain certain specified financial ratios and restrict our ability to make certain distributions, prepay other debt, encumber assets, incur additional indebtedness, make capital expenditures above specified levels, engage in certain business combinations, or undertake various other business activities. See “Description of Our Indebtedness” for a more detailed description of the restrictive and financial covenants and other terms of the credit facility borrowings.
If we are unable to comply with any of these covenants, we will be in default, which could result in the acceleration of our outstanding indebtedness. If acceleration occurred, we would not be able to repay our debt and it is unlikely that we would be able to borrow sufficient additional funds to refinance our debt. Even if new financing is made available to us, it may not be available on acceptable terms.
We will continue to be controlled by our principal stockholder, which will limit your ability to influence corporate activities and may affect the market price of our common stock.
Upon completion of this offering, funds advised by CVC Capital Partners will own or control shares representing, in the aggregate, a % voting interest in our company, or % if the underwriters exercise their overallotment option in full, and will have three representatives on our 11-member board of directors. Accordingly, CVC Capital Partners will exercise control over our operations and business strategy. CVC Capital
24
Table of Contents
Partners will be able to control the outcome of votes on all matters requiring approval by our stockholders, including the election of directors and approval of significant corporate transactions. For example, CVC Capital Partners has the practical ability to sell our company in its sole discretion because CVC will control a majority of our shares following this offering. CVC Capital Partners’ ownership may have the effect of delaying or preventing a change in control of our company or discouraging others from making tender offers for our shares, which could prevent stockholders from receiving a premium for their shares.
We are a “controlled company” within the meaning of the rules of the exchange on which our equity securities are listed, and, as a result, will qualify for, and may rely on, exemptions from certain corporate governance requirements.
As a result of the ownership of our common stock by funds advised by CVC Capital Partners after this offering, we will be a “controlled company” within the meaning of the applicable rules of the . Under these rules, a company of which more than a certain percentage of the voting power is held by an individual, group or another company is a “controlled company” and may elect not to comply with certain corporate governance requirements. As a result, we may not have a majority of independent directors and may have nominating/corporate governance and compensation committees that do not consist entirely of independent directors, and we may not conduct an annual performance evaluation of the nominating/corporate governance and compensation committees. Accordingly, you may not have the same protections afforded to stockholders of companies that are subject to all of the exchange’s corporate governance requirements.
Conflicts of interest may arise because some of our directors are principals of our controlling stockholder.
Three principals of CVC Capital Partners serve on our 11-member board of directors. CVC Capital Partners and its affiliates may continue to invest in entities that directly or indirectly compete with us or companies in which they currently invest may begin competing with us. As a result of these relationships, when conflicts between the interests of CVC Capital Partners and the interests of our other stockholders arise, these directors may not be disinterested, to the detriment of our stockholders. Although our directors and officers have a duty of loyalty to us, under Delaware law and our amended and restated certificate of incorporation that will be adopted in connection with this offering, transactions that we enter into in which a director or officer has a conflict of interest are generally permissible so long as (1) the material facts relating to the director’s or officer’s relationship or interest as to the transaction are disclosed to our board of directors and a majority of our disinterested directors approves the transaction, (2) the material facts relating to the director’s or officer’s relationship or interest as to the transaction are disclosed to our stockholders and a majority of our disinterested stockholders approves the transaction, or (3) the transaction is otherwise fair to us.
Future sales of our common stock, or the perception in the public markets that these sales may occur, could depress our stock price.
Sales of substantial amounts of our common stock, or the possibility of such sales, may adversely affect the market price of our common stock. These sales may also make it more difficult for us to raise capital through the issuance of equity securities at a time and at a price we deem appropriate.
Upon completion of this offering, there will be shares of common stock outstanding. Of these shares, shares of common stock sold in this offering will be freely transferable without restriction or further registration under the Securities Act of 1933. The remaining shares of common stock available for future sale will be “restricted securities” within the meaning of Rule 144 under the Securities Act and will be eligible for resale subject to the volume, manner of sale, holding period and other limitations of Rule 144. See “Underwriting.” The selling stockholder has the right to require us to register its shares of our common stock, representing approximately shares of our common stock following completion of this offering.
25
Table of Contents
Accordingly, the number of shares subject to registration rights is substantial and the sale of these shares may have a negative impact on the market price for our common stock. These shares, and the shares held by our other stockholders, are subject to lock-up agreements and may not be sold to the public during the -day period following the date of this prospectus without the prior written consent of Goldman, Sachs & Co. and Merrill Lynch, Pierce, Fenner & Smith Incorporated.
Some provisions of our amended and restated certificate of incorporation and bylaws may delay or prevent transactions that many stockholders may favor.
Some provisions of our amended and restated certificate of incorporation and bylaws may have the effect of delaying, discouraging, or preventing a merger or acquisition that our stockholders may consider favorable, including transactions in which stockholders might receive a premium for their shares. These provisions include:
| • | any vacancy on our board of directors, however occurring, including a vacancy resulting from an enlargement of our board, may only be filled by vote of the directors then in office; |
| • | authorization of the issuance of “blank check” preferred stock without the need for action by stockholders; |
| • | the inability of stockholders to call special meetings of stockholders; and |
| • | advance notice requirements for board nominations and proposing matters to be acted on by stockholders at stockholder meetings. |
Some provisions of Delaware law may also discourage, delay or prevent someone from acquiring us or merging with us. See “Description of Our Capital Stock—Anti-Takeover Effects of Our Amended Certificate of Incorporation and Bylaws and Delaware Law” for a discussion of these provisions.
Our common stock has not been publicly traded, and the price of our common stock may fluctuate substantially.
There has not been a public market for our common stock prior to this offering. We cannot predict the extent to which a trading market will develop or how liquid that market might become. If you purchase shares of common stock in this offering, you will pay a price that was not established in the public trading markets. The initial public offering price will be determined by negotiations among the underwriters, the selling stockholder and us. You may not be able to resell your shares above the initial public offering price and may suffer a loss on your investment.
26
Table of Contents
Broad market and industry factors may adversely affect the market price of our common stock, regardless of our actual operating performance. Factors that could cause fluctuations in our stock price may include, among other things:
| • | actual or projected variations in quarterly operating results; |
| • | changes in financial estimates by us or by any securities analysts who might cover our stock, or our failure to meet the estimates made by securities analysts; |
| • | changes in the market valuations of other companies operating in our industry; |
| • | announcements by us or our competitors of significant acquisitions, strategic partnerships or divestitures; |
| • | changes in investor and securities analyst perception of our industry; |
| • | changes in macroeconomic conditions; |
| • | general market conditions and fluctuations of share prices and trading volumes generally, |
| • | changes in the statutory framework in which we operate; |
| • | additions or departures of key personnel; and |
| • | sales of our common stock, including sales of our common stock by our directors and officers or by the investment funds advised by CVC Capital Partners. |
You will suffer immediate and substantial dilution.
Prior investors have paid substantially less per share for our common stock than the price in this offering. The assumed initial public offering price of our common stock is substantially higher than the net tangible book value per share of outstanding common stock immediately after this offering. You will incur immediate and substantial dilution of $ per share in the net tangible book value of our common stock as of March 31, 2010, at the assumed initial public offering price of $ per share, the mid-point of the range of prices on the cover of this prospectus. You will incur additional dilution if holders of options to purchase or rights with respect to shares of common stock, whether currently outstanding or subsequently granted, exercise the options or rights following this offering. For additional information, see “Dilution.”
The payment of future dividends will depend on our financial condition and results of operations, as well as on our operating subsidiaries’ distributions to us.
Our board of directors will decide matters relating to the payment of future dividends. Such decisions are based on our particular situation at the time, including our earnings, our financial and investment needs and the availability of distributable funds. Because we operate through a holding company that conducts business mainly through subsidiaries, our ability to pay dividends depends directly on our operating subsidiaries’ distributions of earnings. The amount and timing of such distributions will depend on the laws of the operating companies’ respective jurisdictions. Any of these factors, individually or in combination, could restrict our ability to pay dividends. We do not expect to pay cash dividends for the foreseeable future.
27
Table of Contents
If we are unable to implement the requirements of Section 404 of the Sarbanes-Oxley Act in a timely manner, or if we conclude our internal controls are not effective in other areas, we may be subject to regulatory scrutiny and investors may react negatively.
We are currently performing the system and process evaluation of our internal controls over financial reporting in order to allow management to report on, and our independent auditors to attest to, our internal controls over financial reporting, as required by Section 404 of the Sarbanes-Oxley Act of 2002, which we refer to as Section 404. The requirements of Section 404 will initially apply to us in connection with the filing of our annual report on Form 10-K for the year ending December 31, 2011. We plan to begin the testing necessary to permit the management certification and auditor attestation required to comply with Section 404 in 2011. As we complete the evaluation and testing required by Section 404, we may identify conditions that may be categorized as significant deficiencies or material weaknesses in the future. If we are not able to implement the requirements of Section 404 in a timely manner, management will not be able to certify as to the effectiveness of our internal control over financial reporting and we may be subject to regulatory scrutiny, including from the SEC. In these circumstances, investors could lose confidence in the reliability of our financial statements which could adversely affect the value of our shares.
We will incur increased costs as a result of being a public company.
We will face increased legal, accounting, administrative and other costs and expenses as a public company that we do not incur as a private company. The Sarbanes-Oxley Act of 2002, including the requirements of Section 404, as well as rules and regulations implemented thereunder by the Securities and Exchange Commission, or the SEC, and the Public Company Accounting Oversight Board, impose additional reporting and other obligations on public companies. We expect that compliance with these public company requirements will increase our costs. A number of those requirements will require us to carry out activities we have not done previously. For example, we will adopt new internal controls and disclosure controls and procedures. In addition, we will incur additional expenses associated with our SEC reporting requirements. For example, under Section 404 of the Sarbanes-Oxley Act, for our annual report on Form 10-K for the year ending December 31, 2011, we will need to document and test our internal control procedures, our management will need to assess and report on our internal control over financial reporting and our independent accountants will need to issue an opinion on the effectiveness of those controls. Furthermore, if we identify any issues in complying with those requirements (for example, if we or our accountants identified a material weakness or significant deficiency in our internal control over financial reporting), we could incur additional costs rectifying those issues, and the existence of those issues could adversely affect us, our reputation or investor perceptions of us. We also expect that it will be expensive to obtain director and officer liability insurance, and we may be required to accept reduced policy limits and coverage or incur substantially higher costs to obtain the same or similar coverage. As a result, it may be more difficult for us to attract and retain qualified persons to serve on our board of directors or as executive officers. Advocacy efforts by stockholders and third parties may also prompt even more changes in governance and reporting requirements.
28
Table of Contents
This prospectus, including the section entitled “Management’s Discussion and Analysis of Financial Condition and Results of Operations,” contains forward-looking statements. These statements relate to future events or our future financial performance. In some cases, you can identify forward-looking statements by terminology such as “may,” “will,” “should,” “expect,” “plan,” “intend,” “target,” “project,” “guideline,” “anticipate,” “believe,” “estimate,” “predict,” “potential” or “continue,” the negative of such terms or comparable terminology. Forward-looking statements involve inherent risks and uncertainties. In evaluating these statements, you should specifically consider various factors, including the risks outlined in “Risk Factors.” We caution you that a number of important factors could cause our actual results to differ materially from the plans, objectives, expectations, estimates and intentions expressed in such forward-looking statements, or could contribute to such differences, including:
| • | general economic conditions, particularly fluctuations in industrial production; |
| • | the price and availability of chemicals, disruption in the supply of chemicals or a decline in the demand for chemicals; |
| • | our ability to pass through cost increases to our customers; |
| • | termination of contracts or relationships with customers or suppliers on short notice; |
| • | our ability to execute key strategies, including pursuing acquisitions and successfully integrating and operating acquired companies; |
| • | exposure to interest rate and currency fluctuations; |
| • | our substantial indebtedness and the restrictions imposed by our debt instruments and indenture; |
| • | competitive pressures in the chemicals distribution industry; |
| • | our ability to implement and efficiently operate the systems needed to manage our operations, including our enterprise resource planning and telecommunications systems; |
| • | increases in transportation costs and changes in the relationship with third-party carriers; |
| • | losses due to lawsuits arising out of environmental damage or personal injuries associated with chemicals distribution; |
| • | compliance with extensive environmental, health and safety laws that could require material expenditures or changes in our operations; |
| • | the risk of accidents that could disrupt our operations or expose us to significant losses or liabilities; |
| • | changes in state or federal laws or regulations affecting the chemicals industry; and |
| • | challenges associated with international operations, including securing suppliers and personnel, compliance with foreign laws and changes in economic or political conditions. |
29
Table of Contents
Although we believe that the expectations reflected in the forward-looking statements are reasonable, we cannot guarantee future results, events, levels of activity, performance or achievements. Moreover, neither we nor any other person assumes responsibility for the accuracy and completeness of the forward-looking statements.
Forward-looking statements speak only as of the date they are made. We are under no duty to update any of the forward-looking statements after the date of this prospectus to conform such statements to actual results or to changes in expectations.
You should evaluate any statements made by us in light of these important factors.
30
Table of Contents
We have not declared or paid cash dividends on our capital stock in our two most recent full fiscal years. We do not expect to pay any cash dividends for the foreseeable future. We currently intend to retain any future earnings to finance our operations and growth. Any future determination to pay cash dividends will be at the discretion of our board of directors and will be dependent on earnings, financial condition, operating results, capital requirements, any contractual restrictions and other factors that our board of directors deems relevant. In addition, our secured credit facilities contain limitations on our ability to declare and pay cash dividends. Pursuant to the terms of our ABL Facility, we may pay dividends on our stock so long as we are in compliance with the fixed charge coverage ratio covenant set forth therein and no event of default has occurred and is continuing thereunder, and provided that at the time of such payment of dividends, and after giving effect thereto, the combined U.S. availability and Canadian availability is greater than 15% of the combined U.S. borrowing base and Canadian borrowing base and U.S. availability is greater than 15% of the U.S. borrowing base. Pursuant to the terms of our Term Loan Facility, we may pay dividends on our stock so long as no event of default has occurred and is continuing thereunder and provided that at the time of such payment of dividends, and after giving effect thereto, our consolidated total leverage ratio does not exceed 4.00 to 1.00 and the amount of such dividends does not exceed $20 million in the aggregate. For a description of our ABL Facility, see “Description of Our Indebtedness—ABL Facility.” As a result of these restrictions, as of March 31, 2010, we would not have been able to pay dividends under the terms of our credit facilities.
31
Table of Contents
Our net proceeds from the sale of shares of common stock in this offering are estimated to be approximately $ million, based on an assumed initial offering price of $ per share, the mid-point of the range of prices on the cover of this prospectus, after deducting underwriting discounts and commissions and estimated offering expenses, which are payable by us. We will not receive proceeds from the sale of any of the shares sold by the selling stockholder. We intend to use these proceeds to redeem or repay a portion of our outstanding indebtedness described under the headings “Description of Our Indebtedness” and “Management’s Discussion and Analysis of Financial Condition and Results of Operations—Long-term Debt” and for general corporate purposes. Certain of the underwriters or their affiliates are lenders under or holders of certain of our indebtedness and we intend to use these proceeds to redeem or repay a portion of that outstanding indebtedness. See “Underwriting—Conflicts of Interest.”
32
Table of Contents
The following table sets forth our cash and cash equivalents and capitalization as of March 31, 2010:
| • | on an actual basis; and |
| • | on an as adjusted basis, reflecting the sale of shares of our common stock by us in this offering at an assumed initial public offering price of $ per share, the mid-point of the range of prices set forth on the cover of this prospectus, after deducting underwriting discounts and commissions and estimated offering expenses payable by us, and the application of such proceeds to redeem or repay a portion of our outstanding indebtedness described under the headings “Description of Our Indebtedness” and “Management’s Discussion and Analysis of Financial Condition and Results of Operations—Long-term Debt” and for general corporate purposes. |
You should read this table in conjunction with the sections of this prospectus entitled “Selected Consolidated Financial Data” and “Management’s Discussion and Analysis of Financial Condition and Results of Operations” and with our financial statements and related notes.
| As of March 31, 2010 | |||||||
| Actual | As adjusted | ||||||
| (Dollars in millions) | |||||||
| (unaudited) | |||||||
| Cash and cash equivalents |
$ | 114.7 | $ | ||||
| Long-term debt |
$ | 1,677.1 | $ | ||||
| Stockholders’ equity (deficit) |
|||||||
| Common stock, par value $0.01 per share; 1,000 shares authorized, 196 shares issued and outstanding, actual; shares authorized, shares issued and outstanding, as adjusted |
— | ||||||
| Additional paid-in capital |
888.8 | ||||||
| Accumulated other comprehensive loss |
(116.6 | ) | |||||
| Retained earnings |
(326.7 | ) | |||||
| Total stockholders’ equity |
$ | 445.5 | $ | ||||
| Total capitalization |
$ | 2,122.6 | $ | ||||
33
Table of Contents
If you invest in our common stock in this offering, your ownership interest will be diluted to the extent of the difference between the initial public offering price per share and the pro forma net tangible book value per share. Our pro forma net tangible book value as of March 31, 2010 was approximately $ million, or approximately $ per share. Dilution in pro forma net tangible book value per share represents the difference between the amount per share paid by purchasers of common stock in this offering and the pro forma net tangible book value per share of common stock immediately after the closing of this offering.
After giving effect to the sale of shares of common stock at an assumed initial public offering price of $ per share, the mid-point of the range of prices set forth on the cover of this prospectus, after deducting underwriting discounts and commissions and estimated offering expenses payable by us, our pro forma net tangible book value as of March 31, 2010 would have been approximately $ million, or $ per share of common stock. This represents an immediate increase in pro forma net tangible book value of $ per share to existing stockholders and an immediate dilution of $ per share to new investors purchasing shares of common stock in this offering at the initial offering price.
The following table illustrates this dilution on a per share basis:
| Assumed initial public offering price per share of common stock |
$ | ||
| Net tangible book value per share as of March 31, 2010 |
|||
| Increase in net tangible book value per share attributable to the offering |
|||
| Net tangible book value per share as of March 31, 2010 after giving effect to the offering |
|||
| Dilution in net tangible book value per share to new investors |
$ | ||
The following table summarizes as of March 31, 2010, on the pro forma basis described above, the number of shares of our common stock purchased from us, the total consideration paid to us and the average price per share paid to us by existing stockholders and to be paid by new investors purchasing shares of our common stock in this offering. The table assumes an initial public offering price of $ per share, the mid-point of the range of prices set forth on the cover of this prospectus, and the deduction of underwriting discounts and commissions and estimated offering expenses payable by us:
| Shares Purchased | Total Consideration | Average Price Per Share | ||||||||||||
| Number | Percent | Amount | Percent | |||||||||||
| Existing stockholders |
% | $ | % | $ | ||||||||||
| New investors |
% | $ | % | $ | ||||||||||
| Total |
100 | % | $ | 100 | % | |||||||||
34
Table of Contents
SELECTED CONSOLIDATED FINANCIAL DATA
The following table sets forth certain of our historical financial data. We have derived the selected historical consolidated financial data as of December 31, 2009 and 2008 and for the years ended December 31, 2009 and 2008 and the period from October 12, 2007 to December 31, 2007 from our audited consolidated financial statements and the related notes included elsewhere in this prospectus. We have derived the selected historical consolidated financial data for the period from January 1, 2007 to October 11, 2007 from the audited consolidated financial statements and related notes of our predecessor, which are included elsewhere in this prospectus. We have derived the selected historical financial data as of March 31, 2010 and 2009 and for the three months ended March 31, 2010 and 2009 from our unaudited consolidated financial statements and related notes included elsewhere in this prospectus. We have derived the selected historical consolidated data as of December 31, 2007 from our audited consolidated financial statements which are not included in this prospectus. We have derived the selected historical consolidated financial data as of December 31, 2005 and 2006 and for the years ended December 31, 2005 and 2006 from the unaudited consolidated financial statements of our predecessor which are not included in this prospectus. The selected consolidated historical financial data set forth below are not necessarily indicative of the results of future operations and should be read in conjunction with the discussion under the heading “Management’s Discussion and Analysis of Financial Condition and Results of Operations” and the historical consolidated financial statements and accompanying notes included elsewhere in this prospectus.
| Predecessor(1) | Successor(1) | |||||||||||||||||||||||||||||||||
| Years Ended December 31, |
Years Ended December 31, |
Three Months Ended March 31, |
||||||||||||||||||||||||||||||||
| (unaudited) | (unaudited) | |||||||||||||||||||||||||||||||||
| 2005 | 2006 | Period from January 1, 2007 to October 11, 2007 |
Period from October 12, 2007 to December 31, 2007 |
2008 | 2009 | 2009 | 2010 | |||||||||||||||||||||||||||
| (in millions, except share and per share data) | ||||||||||||||||||||||||||||||||||
| Consolidated Statement of Operations Data: |
||||||||||||||||||||||||||||||||||
| Net sales |
$ | 5,987.7 | $ | 6,617.0 | $ | 6,326.9 | $ | 1,790.1 | $ | 9,428.2 | $ | 7,194.5 | $ | 1,791.5 | $ | 1,810.2 | ||||||||||||||||||
| Cost of sales |
5,064.1 | 5,620.2 | 5,441.5 | 1,522.6 | 8,039.2 | 5,985.9 | 1,500.2 | 1,495.6 | ||||||||||||||||||||||||||
| 923.6 | 996.8 | 885.4 | 267.5 | 1,389.0 | 1,208.6 | 291.3 | 314.6 | |||||||||||||||||||||||||||
| Operating expenses: |
||||||||||||||||||||||||||||||||||
| Warehousing, selling and administrative expenses |
674.1 | 714.7 | 659.2 | 210.1 | 930.3 | 811.7 | 200.0 | 197.9 | ||||||||||||||||||||||||||
| Depreciation |
41.3 | 46.2 | 48.3 | 16.8 | 81.6 | 80.1 | 19.1 | 20.1 | ||||||||||||||||||||||||||
| Amortization |
0.1 | 0.4 | 5.6 | 10.9 | 50.8 | 46.3 | 12.0 | 11.2 | ||||||||||||||||||||||||||
| Impairment charges |
— | — | — | — | — | 36.0 | — | 3.6 | ||||||||||||||||||||||||||
| Total operating expenses |
715.5 | 761.3 | 713.1 | 237.8 | 1,062.7 | 974.1 | 231.1 | 232.8 | ||||||||||||||||||||||||||
| Operating income |
208.1 | 235.5 | 172.3 | 29.7 | 326.3 | 234.5 | 60.2 | 81.8 | ||||||||||||||||||||||||||
| Interest expense, net |
(27.9 | ) | (31.0 | ) | (58.0 | ) | (69.0 | ) | (315.6 | ) | (307.3 | ) | (76.2 | ) | (73.8 | ) | ||||||||||||||||||
| Other income (expense) |
— | — | — | 31.3 | — | — | — | — | ||||||||||||||||||||||||||
| Income before taxes |
180.2 | 204.5 | 114.3 | (8.0 | ) | 10.7 | (72.8 | ) | (16.0 | ) | 8.0 | |||||||||||||||||||||||
| Income tax expense (benefit) |
58.9 | 71.2 | 53.0 | 6.6 | 18.7 | (30.1 | ) | (6.0 | ) | 4.4 | ||||||||||||||||||||||||
| Net income (loss) |
121.3 | 133.3 | 61.3 | (14.6 | ) | (8.0 | ) | (42.7 | ) | (10.0 | ) | 3.6 | ||||||||||||||||||||||
| Net income (loss) per common share(2): |
||||||||||||||||||||||||||||||||||
| Basic and diluted |
$ | (40,701 | ) | $ | (218,001 | ) | $ | (51,088 | ) | $ | 18,339 | |||||||||||||||||||||||
| Weighted-average shares used in computing net income (loss) per common share(2): |
||||||||||||||||||||||||||||||||||
| Basic and diluted |
196 | 196 | 196 | 196 | ||||||||||||||||||||||||||||||
35
Table of Contents
| Predecessor(1) | Successor(1) | ||||||||||||||||||||||||
| As of December 31, | As of December 31, | March
31, 2010 | |||||||||||||||||||||||
| 2005 | 2006 | 2007 | 2008 | 2009 | |||||||||||||||||||||
| (in millions) | |||||||||||||||||||||||||
| (unaudited) | (unaudited) | ||||||||||||||||||||||||
| Consolidated Balance Sheet Data: |
|||||||||||||||||||||||||
| Cash and cash equivalents |
$ | 35.1 | $ | 48.5 | $ | 104.8 | $ | 223.1 | $ | 140.2 | $ | 114.7 | |||||||||||||
| Total assets |
2,628.9 | 2,900.1 | 6,200.0 | 5,657.6 | 5,191.7 | 5,357.3 | |||||||||||||||||||
| Working capital(3) |
598.4 | 681.7 | 818.9 | 949.8 | 695.3 | 514.4 | |||||||||||||||||||
| Long-term debt |
447.8 | 547.7 | 2,122.9 | 2,287.9 | 1,906.6 | 1,677.1 | |||||||||||||||||||
| Total stockholders’ equity |
729.6 | 793.2 | 872.3 | 220.6 | 433.0 | 445.5 | |||||||||||||||||||
| Predecessor(1) | Successor(1) | ||||||||||||||||||||||||
| Years Ended December 31, |
Three Months Ended March 31, | ||||||||||||||||||||||||
| (unaudited) | |||||||||||||||||||||||||
| Period from January 1, 2007 to October 11, 2007 |
Period from October 12, 2007 to December 31, 2007 |
2008 | 2009 | 2009 | 2010 | ||||||||||||||||||||
| (in millions) | |||||||||||||||||||||||||
| Other Data: |
|||||||||||||||||||||||||
| Adjusted EBITDA(4) |
252.2 | $ | 80.6 | $ | 498.0 | $ | 427.7 | $ | 92.4 | $ | 118.1 | ||||||||||||||
| Net cash provided by (used in) operating activities |
49.8 | 180.8 | 9.4 | 217.4 | 169.4 | 172.8 | |||||||||||||||||||
| Capital expenditures |
62.6 | 29.1 | 77.5 | 65.9 | 9.6 | 8.3 | |||||||||||||||||||
| (1) | Predecessor company was acquired on October 11, 2007 by investment funds advised by CVC Capital Partners, a private equity and investment advisory firm. Financial information presented reflects adjustment of assets and liabilities to then-fair value at October 11, 2007, which became the basis for amounts included in results of operations from October 12, 2007. |
| (2) | All share and per share amounts reflect a -for-one stock split of our common stock, which will occur prior to the consummation of this offering. |
| (3) | Current assets, less current liabilities. |
| (4) | We believe that adjusted earnings before interest, income taxes, depreciation and amortization (Adjusted EBITDA) is a useful financial metric to assess our ability to generate cash from operations sufficient to pay taxes, to service debt and to undertake capital expenditures. We also believe that Adjusted EBITDA will provide investors with a useful tool for assessing the comparability between periods of our ability to generate cash from operations sufficient to pay taxes, to service debt and to undertake capital expenditures because, among other things, it eliminates depreciation and amortization expense attributable to our historically higher levels of capital expenditures. We define Adjusted EBITDA as our consolidated net income, plus the sum of: (1) total interest expense, net of interest income; (2) provisions for taxes; (3) depreciation, amortization and goodwill impairment charges; (4) extraordinary losses and unusual or non-recurring charges, including severance costs and relocation costs; (5) expenses incurred in connection with acquisition, investment, recapitalization, disposition and debt or equity issuance transactions; (6) other non-cash charges; and (7) any costs, including cash costs, incurred pursuant to management equity and stock option or other benefit plans; less (1) extraordinary and unusual, non-recurring gains; and (2) non-cash gains. The term Adjusted EBITDA is not defined under U.S. generally accepted accounting principles, or U.S. GAAP, and Adjusted EBITDA is not a measure of operating income, operating performance or liquidity presented in accordance with U.S. GAAP. In addition, Adjusted EBITDA is impacted by reorganization of businesses and other restructuring-related charges. When assessing our operating performance or our liquidity, you should not consider this data in isolation or as a substitute for our net cash |
36
Table of Contents
| from operating activities or other cash flow data that is calculated in accordance with U.S. GAAP. In addition, our Adjusted EBITDA may not be comparable to Adjusted EBITDA or similarly titled measures utilized by other companies since such other companies may not calculate Adjusted EBITDA in the same manner as we do. A reconciliation of net income (loss), the most directly comparable U.S. GAAP measure, to Adjusted EBITDA for each of the respective periods indicated is as follows. |
| Predecessor | Successor | |||||||||||||||||||||||
| Period from January 1, 2007 to October 11, 2007 |
Period from October 12, 2007 to December 31, 2007 |
Years Ended December 31, |
Three Months Ended March 31, | |||||||||||||||||||||
| 2008 | 2009 | 2009 | 2010 | |||||||||||||||||||||
| (in millions) | ||||||||||||||||||||||||
| (unaudited) | ||||||||||||||||||||||||
| Net income (loss) |
$ | 61.3 | $ | (14.6 | ) | $ | (8.0 | ) | $ | (42.7 | ) | $ | (10.0 | ) | $ | 3.6 | ||||||||
| Provision (benefit) for income taxes |
53.0 | 6.6 | 18.7 | (30.1 | ) | (6.0 | ) | 4.4 | ||||||||||||||||
| Interest expense, net |
58.0 | 69.0 | 315.6 | 307.3 | 76.2 | 73.8 | ||||||||||||||||||
| Depreciation |
48.3 | 16.8 | 81.6 | 80.1 | 19.1 | 20.1 | ||||||||||||||||||
| Amortization |
5.6 | 10.9 | 50.8 | 46.3 | 12.0 | 11.2 | ||||||||||||||||||
| Extraordinary losses and unusual or non-recurring charges |
26.0 | 23.2 | 39.3 | 29.6 | 1.1 | — | ||||||||||||||||||
| Expenses incurred for acquisition, investment, recapitalization and disposition |
— | — | — | 1.2 | — | 1.4 | ||||||||||||||||||
| Other non-cash charges reducing net income |
— | — | — | 36.0 | — | 3.6 | ||||||||||||||||||
| Extraordinary gain and unusual or non-recurring gains |
— | (31.3 | ) | — | — | — | — | |||||||||||||||||
| Adjusted EBITDA |
$ | 252.2 | $ | 80.6 | $ | 498.0 | $ | 427.7 | $ | 92.4 | $ | 118.1 | ||||||||||||
37
Table of Contents
MANAGEMENT’S DISCUSSION AND ANALYSIS
OF FINANCIAL CONDITION AND RESULTS OF OPERATIONS
You should read the following information in conjunction with our consolidated financial statements and related notes, “Selected Consolidated Financial Data” and “Risk Factors” included elsewhere in this prospectus. This discussion and analysis contains forward-looking statements, which involve risks and uncertainties, including those described under the caption “Risk Factors” and elsewhere in this prospectus. Our actual results may differ materially from those anticipated in these forward-looking statements. We discuss certain of our results for the year ended December 31, 2007 by combining the period prior to the acquisition of our predecessor on October 11, 2007 with our post-acquisition results of operations. We believe that analyzing these results on a combined basis is the most meaningful way for investors to understand our results of operations. These combined amounts are for informational purposes only and do not purport to represent what our financial results would have been in 2007 if the acquisition had occurred at the beginning of the year.
Overview
We are a leading global distributor of commodity and specialty chemicals. For the year ended December 31, 2009, we generated $7.2 billion in net sales from the distribution of approximately 5.4 million metric tons of chemicals, making us one of the world’s largest independent chemicals distributors, with a #1 market position in both the United States and Canada and a #2 market position in Europe. We operate a network of over 170 distribution facilities in North America, Europe, the Asia-Pacific region and Latin America, with additional sales offices located in Eastern Europe, the Middle East and Africa. We distribute over 11,000 products in more than 110,000 stockkeeping units, or SKUs, to over 80,000 customers with more than 250,000 customer delivery locations in over 100 countries.
Our business depends on demand from customers for chemicals. Because the vast majority of the chemicals we sell are used in industrial production, the chemicals market has historically performed in line with broader industrial production trends as well as trends in end markets affecting industrial production such as consumer goods. As general economic conditions improve or deteriorate, industrial production generally and chemicals consumption more specifically tend to move correspondingly, particularly in those industry sectors or geographic areas most directly affected by the changed economic conditions. Although these changes in industrial production and economic activity also affect chemicals distribution, they tend to do so to a lesser extent as chemicals distribution trends have been affected by the continuing trend toward outsourcing of distribution by larger chemicals producers as well as specific strategies employed by independent chemicals producers. For example, we have focused to some extent on customers that produce and sell population-driven products as we seek to further mitigate the risks of industrial production trends on our results. During the period from 2006 through 2008, our industry grew on average 1.5% per annum greater than the combined rate of growth in industrial output, chemicals consumption and underlying prices. We believe increasing emphasis on outsourcing by chemicals producers as well as the increasing demand for the logistics expertise, local market insight and value-added services that we, along with other large independent chemicals distributors, provide to chemicals manufacturers and customers have contributed to this more rapid growth.
In addition to enjoying higher growth rates than the chemicals market as a whole, the chemicals distribution industry, and Univar in particular, have experienced somewhat more stable financial performance and less pronounced cyclicality than many chemicals producers. Several factors contribute to our relatively stable financial performance, including a more flexible asset base and lower fixed costs than large chemicals producers, which generally are required to invest in large production facilities. We also benefit from the diversification and flexibility attributable to the broad range of products we distribute and sell to the diverse end markets we serve.
We source chemicals from a range of chemicals producers, including a number of the premier global producers. In 2009, none of our suppliers accounted for more than 12% of our chemicals purchases and our 25 largest suppliers accounted for approximately 46%. Our customer base is highly diversified, with no customer
38
Table of Contents
accounting for more than 2% of our net sales in 2009 and our top 10 customers together accounting for less than 7% of our net sales. Our customer base principally comprises small-to-medium-sized companies, although we also sell significant volumes to large multi-national companies, operating multiple sites to which we deliver chemicals, but which we treat as a single customer in evaluating our customer concentration.
Key Factors Affecting Operating Results and Financial Condition
Volume-based pricing. We procure chemicals through purchase orders rather than under long-term contracts with firm commitments. Our arrangements with key producers are typically embodied in agreements that we refer to as framework supply agreements. We work to develop strong relationships with a select group of producers that we target based on a number of factors including price, breadth of product offering, quality, market recognition, delivery terms and schedules, continuity of supply and their strategic positioning. Our framework supply agreements with chemicals producers typically renew annually and, while they generally do not provide for specific product pricing, many include volume-based financial incentives that we earn by meeting or exceeding target purchase volumes. Our ability to earn these volume-based incentives is an important factor in improving our financial results. Throughout the year, we record these incentives based on our purchases to date and our estimates of purchases for the remainder of the year, although we receive these incentives in the form of rebates that are payable only when our sales equal or exceed the relevant target. As a result, our cost of goods sold may be affected if we earn an incentive toward the end of a year that we had not expected to earn in earlier periods or if we fail to earn an incentive that we had expected to earn and had recorded based on our prior estimates.
Resiliency of financial performance in the face of price fluctuations. As the prices of chemicals fluctuate, both our net sales and our cost of goods sold tend to show largely corresponding changes, even when the volume of the products we sell remains constant. As a result, an increase or decrease in our net sales attributable to price fluctuation does not necessarily indicate a corresponding change in our profitability, which is much more a function of the relationship between our net sales and cost of goods sold than it is a function of the total price of the goods we sell. Similarly, our flexible operating model helps as we seek to optimize profitability in the face of volatility in volumes, such as the significant volume declines that we experienced from late 2008 through 2009. Therefore, while our reported net sales depend significantly on the prices and volumes of the chemicals we distribute and have therefore been volatile over the past two years, our profitability has been relatively more stable. For example, between 2008 and 2009, as our principal markets experienced significant economic weakness, affecting both our sales volumes and prices, our net sales declined by $2.2 billion, or 23.7%, while our gross profit, which we define as net sales less cost of goods sold, declined by $180.4 million, or 13.0%.
Cash generation initiatives. Over the past several years we have focused on improving our financial performance through a number of key profitability initiatives. We have also focused on linking our operations to key financial metrics that drive profitability. We have done this by investing in information management tools, creating processes to align our sales, marketing and operations and by implementing workforce productivity improvements. As part of these efforts we have:
| • | pursued gross margin improvements by improving our analysis of profitability on a customer, supplier and product line basis by implementing our Economic Contribution Margin tool, which enables us to improve discipline on pricing and other key trade terms; |
| • | improved our cost structure and profitability through productivity enhancements and a reduction in controllable costs that enabled us to reduce staffing levels by nearly 10% in 2009; |
| • | enhanced administrative efficiency by collapsing corporate layers and expanding our shared services model for key support activities; |
| • | focused on working capital improvements through management of terms, collection efforts and inventory management allowing us to improve our working capital position even in a period of significantly reduced sales; and |
39
Table of Contents
| • | deleveraged our balance sheet by reducing our outstanding borrowings under our credit facilities by approximately $545 million from December 31, 2008 to March 31, 2010, reducing our annual cash interest expense by approximately $10 million. |
Working capital. In addition to affecting our net sales, fluctuations in chemicals prices tend to result in changes in our reported inventories, trade receivables and trade payables even when our sales volumes and our rate of turnover of these working capital items remain relatively constant. Our business is characterized by a relatively high level of reported working capital, the effects of which can be compounded by increases in chemicals prices which affect our reported working capital. Our initiatives to improve realization of receivables and inventory management have enabled us to improve our working capital position (represented by the number of days of sales in working capital) by nearly 15 days from year-end 2008 to March 31, 2010, notwithstanding the reductions in net sales we experienced throughout 2009. In addition, we believe our inventory management initiatives helped us mitigate the risks of inventory write-downs during 2009, notwithstanding significant economic weakness which led to material price declines on certain products during the year.
Foreign currencies. We operate an international business and deal in most major currencies. Although our multi-national operations provide some insulation against the effect of regional economic downturns, they also expose us to currency risk. In 2009, over 40% of our net sales came from outside the United States, most of which were foreign currency sales denominated in euro, Canadian dollars and British pounds sterling. The functional currency of our operations outside the United States is generally the local currency. Transactions in local markets are generally recorded in the local functional currency at the exchange rate prevailing on the date of transaction. Monetary assets and liabilities denominated in foreign currencies are retranslated at the functional currency rate of exchange prevailing at the balance sheet date. Fluctuations in exchange rates between the U.S. dollar and other currencies affect the translation of our financial results. We have not generally hedged this translation risk. In this Management’s Discussion and Analysis, we present certain income statement information on a currency-neutral basis, which we calculate by applying the average of the daily currency exchange rates for the prior year period to the current year’s local currency results. Fluctuations in exchange rates also affect our consolidated balance sheet. Changes in the U.S. dollar values of our consolidated assets and liabilities resulting from exchange rate movements may also cause us to record foreign currency gains and losses. See Note 1 to our consolidated financial statements included elsewhere in this prospectus.
In addition to currency translation risks, in some cases we incur costs in currencies other than those in which we record related net sales. Because of the local basis on which these exposures arise, however, and because they are typically of short duration, they tend not to be material to our results. In any event, we tend to hedge our transaction risk by using foreign-exchange forward contracts either through specific hedges for significant transactions or through hedging on a portfolio basis to address currency transaction mismatches imbedded in the large number of our smaller transactions.
Reporting Segments
We report in four segments that represent the geographic areas under which we operate and manage our business: (1) United States; (2) Canada; (3) Europe, the Middle East and Africa, or EMEA; and (4) Rest of World, which includes developing businesses in Latin America (including Mexico) and the Asia-Pacific region. Our measure of segment profitability in accordance with ASC 280, Segment Reporting (formerly SFAS No. 131) is Adjusted EBITDA, which we define as our consolidated net income, plus the sum of: (1) total interest expense, net of interest income; (2) provisions for taxes; (3) depreciation, amortization and goodwill impairment charges; (4) extraordinary losses and unusual or non-recurring charges, including severance costs and relocation costs; (5) expenses incurred in connection with acquisition, investment, recapitalization, disposition and debt or equity issuance transactions; (6) other non-cash charges; and (7) any costs, including cash costs, incurred pursuant to management equity and stock option or other benefit plans; less (1) extraordinary and unusual, non-recurring gains; and (2) non-cash gains. Segment net sales and Adjusted EBITDA reflect net sales generated within the
40
Table of Contents
segment, cost of goods sold related to these net sales and operating expenses allocated to that segment (typically consisting of those expenses that directly benefit that segment). All corporate operating expenses have been allocated to our operating segments. We allocate identified corporate operating expenses to our four operating segments on a basis that approximates our estimates of the use of these services. We typically base our estimates on a weighted distribution of margin, asset and headcount of the segments. Certain costs are specifically allocated based on the time spent on matters related to the various operating segments. See Note 16 to our consolidated financial statements included elsewhere in this prospectus. In the analysis of our results of operations below, we discuss operating segment results for each reporting period following our period-to-period comparison.
Results of Operations
The following tables set forth, for the periods indicated, certain statements of operations data first on the basis of reported data and then as a percentage of total net sales for the relevant period. For the purposes of this Management’s Discussion and Analysis only, our results for the year ended December 31, 2007 discussed below represent the combination of the statement of operations for the nine months prior to the acquisition of our predecessor on October 11, 2007 and the three months of our post-acquisition operations. The financial data set forth below are not necessarily indicative of the results of future operations and should be read in conjunction with our historical consolidated financial statements and accompanying notes included elsewhere in this prospectus.
| Predecessor(1) | Successor(1) | Combined | Successor(1) | ||||||||||||||||||
| Period from January 1, 2007 to October 11, 2007 |
Period from October 12, 2007 to December 31, 2007 |
Year Ended December 31, 2007 |
Years Ended December 31, |
Three Months Ended March 31, |
|||||||||||||||||
| 2008 | 2009 | 2009 | 2010 | ||||||||||||||||||
| (unaudited) | |||||||||||||||||||||
| Net sales |
100 | % | 100 | % | 100 | % | 100 | % | 100 | % | 100 | % | 100 | % | |||||||
| Cost of goods sold |
86.0 | 85.1 | 85.8 | 85.3 | 83.2 | 83.7 | 82.6 | ||||||||||||||
| 14.0 | 14.9 | 14.2 | 14.7 | 16.8 | 16.3 | 17.4 | |||||||||||||||
| Warehousing, selling and administrative expenses |
10.4 | 11.7 | 10.7 | 9.9 | 11.3 | 11.2 | 11.0 | ||||||||||||||
| Depreciation |
0.8 | 0.9 | 0.7 | 0.9 | 1.1 | 1.1 | 1.1 | ||||||||||||||
| Amortization |
0.1 | 0.6 | 0.3 | 0.5 | 0.6 | 0.6 | 0.6 | ||||||||||||||
| Asset impairment |
— | — | — | — | 0.5 | — | 0.2 | ||||||||||||||
| Total operating expenses |
11.3 | 13.2 | 11.7 | 11.3 | 13.5 | 12.9 | 12.9 | ||||||||||||||
| Operating income |
2.7 | 1.7 | 2.5 | 3.4 | 3.3 | 3.4 | 4.5 | ||||||||||||||
| Other income |
— | 1.8 | 0.4 | — | — | — | — | ||||||||||||||
| Interest expense, net |
(0.9 | ) | (3.9 | ) | (1.6 | ) | (3.3 | ) | (4.3 | ) | (4.3 | ) | (4.1 | ) | |||||||
| Income (loss) before income taxes |
1.8 | (0.4 | ) | 1.3 | 0.1 | (1.0 | ) | (0.9 | ) | 0.4 | |||||||||||
| Income tax expense (benefit) |
0.8 | 0.4 | 0.7 | 0.2 | (0.4 | ) | (0.3 | ) | 0.2 | ||||||||||||
| Net income (loss) |
1.0 | % | (0.8 | )% | 0.6 | % | (0.1 | )% | (0.6 | )% | (0.6 | )% | 0.2 | % | |||||||
| (1) | Predecessor company was acquired on October 11, 2007 by investment funds advised by CVC Capital Partners, a private equity and investment advisory firm. Financial information presented reflects adjustment of assets and liabilities to then-fair value at October 11, 2007, which became the basis for amounts included in results of operations from October 12, 2007. |
41
Table of Contents
Three Months Ended March 31, 2010 Compared to Three Months Ended March 31, 2009 (unaudited)
Net Sales
We generate net sales primarily through the sale of chemicals to our customers. Our net sales also include billings for freight and handling charges. We purchase and sell a broad range of commodity and specialty chemicals from over 2,500 chemicals producers around the world and offer a range of value-added services.
Our net sales and volumes sold for the three months ended March 31, 2009 and 2010 are summarized in the following table.
| Three Months Ended March 31, |
Variance | |||||||||||
| 2009 | 2010 | Amount | % | |||||||||
| (Dollars in millions) | ||||||||||||
| Net sales |
$ | 1,791.5 | $ | 1,810.2 | $ | 18.7 | 1.0 | % | ||||
| Volume (MT in thousands) |
1,333.4 | 1,378.0 | 44.6 | 3.3 | % | |||||||
We recorded net sales of $1,810.2 million in the three months ended March 31, 2010, compared with $1,791.5 million for the three months ended March 31, 2009, an increase of 1.0%. Net sales declined 3.2% on a currency-neutral basis, applying the prior period’s average exchange rate to the current period’s local currency denominated net sales. Net sales growth was primarily attributable to volume increases, as our volumes (measured by metric tons sold) increased approximately 3.3% in the three months ended March 31, 2010 as compared to the corresponding period of 2009. This volume improvement was partially offset by lower pricing, as net sales per metric ton sold declined 2.2%, or approximately 6.4% on a currency-neutral basis, between periods due in part to unusually high pricing on a number of key, high volume products which existed during the first quarter of 2009.
In end-markets, we recorded net sales increases in paints and coatings and rubber and plastics, as the housing market improved in North America, as well as in personal care. These increases were offset by declines in sales to customers in the energy, utilities, paper and wood and agriculture markets. Price declines, particularly in North America, impacted net sales. In particular, lower prices of caustic soda, our largest volume product, reduced reported net sales in North America by 4.6%.
Cost of Goods Sold
Our cost of goods sold includes the purchase price we pay for chemicals we acquire (net of supplier incentives earned by achieving targeted sales volumes) as well as transportation, and direct labor and other costs incurred in delivering chemicals as well as in direct labor and other costs involved in blending and repackaging chemicals for resale.
Our cost of goods sold for the three months ended March 31, 2009 and 2010 is summarized in the following table:
| Three Months Ended March 31, |
Variance | |||||||||||
| 2009 | 2010 | $ | % | |||||||||
| (Dollars in millions) | ||||||||||||
| Cost of goods sold |
$ | 1,500.2 | $ | 1,495.6 | $ | 4.6 | 0.3 | % | ||||
Our cost of goods sold was $1,495.6 million in the three months ended March 31, 2010, compared with $1,500.2 million for the three months ended March 31, 2009, a decline of 0.3%. Our cost of goods sold decreased 4.5% on a currency-neutral basis. As a percentage of net sales, cost of goods sold improved to 82.6% for the three months ended March 31, 2010 from 83.7% for the corresponding period of 2009. The chemicals purchase
42
Table of Contents
component of our cost of goods sold in the three months ended March 31, 2010 included a benefit of $7.1 million from settlement of an antitrust claim in which we were reimbursed for overpayment for chemicals purchased in prior periods.
Gross profit, which we define as net sales less cost of goods sold, was $314.6 million for the three months ended March 31, 2010, an 8.0% improvement over the $291.3 million gross profit recorded for the three months ended March 31, 2009. Gross profit as a percentage of net sales improved by approximately 110 basis points between quarterly periods. Approximately 40 basis points of this improvement was attributable to the antitrust settlement in the first quarter of 2010. The remaining improvement was principally attributable to our headcount reduction, price optimization and inventory management initiatives.
Operating Expenses
Our operating expenses consist of warehousing, selling and administrative expenses, depreciation and amortization and impairment charges. Warehousing, selling and administrative expenses include all indirect related operating expenses, except for depreciation and amortization, including occupancy, warehousing, marketing, selling, information technology and general and administrative expenses. All indirect labor costs (which consist of substantially all labor costs not related to blending, repackaging and delivering chemicals) are included in warehousing, selling and administrative expenses.
Our operating expenses for the three months ended March 31, 2009 and 2010 are summarized in the following table:
| Three Months Ended March 31, |
Variance | ||||||||||||
| 2009 | 2010 | $ | % | ||||||||||
| (Dollars in millions) | |||||||||||||
| Warehousing, selling and administrative expenses |
$ | 200.0 | $ | 197.9 | $ | (2.1 | ) | (1.1 | )% | ||||
| Depreciation |
19.1 | 20.1 | 1.0 | 5.2 | |||||||||
| Amortization |
12.0 | 11.2 | (0.8 | ) | (6.7 | ) | |||||||
| Impairment charges |
— | 3.6 | 3.6 | N/A | |||||||||
| Total operating expenses |
$ | 231.1 | $ | 232.8 | $ | 1.7 | 0.7 | % | |||||
Total operating expenses increased slightly to $232.8 million in the three months ended March 31, 2010 from $231.1 million in the three months ended March 31, 2009. On a currency-neutral basis, our total operating expenses decreased 3.5%. As a percentage of net sales, our total operating expenses remained flat at 12.9% for the three months ended March 31, 2010 and for the corresponding period of 2009. Total operating expenses in the first quarter of 2010 included a $3.6 million asset impairment charge, without which the improvement in operating expenses as a percentage of net sales would have been approximately 20 basis points higher.
Warehousing, selling and administrative expenses declined to $197.9 million for the three months ended March 31, 2010 from $200.0 million for the three months ended March 31, 2009. The year-over-year decline reflected a reduction in headcount, as well as a benefit from the modification of certain of our pension plans, the effect of which was partially offset by increases in pay rates and health and safety and environmental remediation expenses.
Our total of depreciation and amortization expenses increased to $31.3 million for the three months ended March 31, 2010 from $31.1 million for the three months ended March 31, 2009. Our depreciation expense largely consisted of depreciation on our warehouse and distribution facilities, including tank farms and related equipment. Most of our amortization expense is attributable to customer relationship intangibles, which had a remaining estimated useful life of approximately 14 years at the beginning of 2010. The lower amortization expense in 2010 was primarily attributable to certain purchased contract intangibles related to the 2007 CVC Capital Partners acquisition being fully amortized in October 2009.
43
Table of Contents
Interest Expense, Net
We recorded interest expense, net, of $73.8 million for the three months ended March 31, 2010, compared with $76.2 million for the three months ended March 31, 2009. Our interest expense in the first quarter of 2010 benefitted from lower outstanding debt balances, partially offset by the amortization expense associated with the prepayment of our interest rate swap in response to the lower outstanding debt balances. This amortization expense will affect interest expense through the end of 2010.
Income Tax Expense
We recorded income tax expense of $4.4 million in the three months ended March 31, 2010, compared with a tax benefit of $6.0 million in the corresponding period of 2009. Our effective tax rates were 55.0% and 37.5% from the first quarters of 2010 and 2009, respectively. The increase in the effective tax rate for the three months ended March 31, 2010 was attributable to the shift in mix of taxable earnings between jurisdictions, a higher portion of non-deductible interest and the expiration of tax legislation relating to U.S. taxation of foreign operations.
Net Income
For the reasons described above, our net income (loss) improved from a net loss of $10.0 million in the three months ended March 31, 2009 to net income of $3.6 million for the first quarter of 2010.
Adjusted EBITDA
Our Adjusted EBITDA by operating segment and in the aggregate for the three months ended March 31, 2009 and 2010 is summarized in the following table:
| Three Months Ended March 31, 2009 | Three Months Ended March 31, 2010 | ||||||||||||||||||||||||||||||||||||||
| U.S. | Canada | EMEA | ROW | Other | Total | U.S. | Canada | EMEA | ROW | Other | Total | ||||||||||||||||||||||||||||
| (in millions) | |||||||||||||||||||||||||||||||||||||||
| Adjusted EBITDA(1) |
$ | 57.9 | $ | 21.1 | $ | 12.7 | $ | 1.9 | $ | (1.2 | ) | $ | 92.4 | $ | 78.5 | $ | 24.2 | $ | 17.1 | $ | 1.3 | $ | (3.0 | ) | $ | 118.1 | |||||||||||||
| Adjustments: |
|||||||||||||||||||||||||||||||||||||||
| Depreciation |
12.4 | 2.5 | 4.1 | 0.1 | — | 19.1 | 13.1 | 2.1 | 4.6 | 0.1 | 0.2 | 20.1 | |||||||||||||||||||||||||||
| Amortization |
7.9 | 3.1 | 1.0 | — | — | 12.0 | 6.8 | 3.3 | 1.1 | — | — | 11.2 | |||||||||||||||||||||||||||
| Extraordinary losses and unusual or non-recurring charges |
1.1 | — | |||||||||||||||||||||||||||||||||||||
| Expenses incurred for acquisition, investment, recapitalization and disposition |
— | 1.4 | |||||||||||||||||||||||||||||||||||||
| Other non-cash charges reducing net income |
— | 3.6 | |||||||||||||||||||||||||||||||||||||
| Interest expense, net |
76.2 | 73.8 | |||||||||||||||||||||||||||||||||||||
| Income tax expense (benefit) |
(6.0 | ) | 4.4 | ||||||||||||||||||||||||||||||||||||
| Net income (loss) |
$ | (10.0 | ) | $ | 3.6 | ||||||||||||||||||||||||||||||||||
| (1) | Adjusted EBITDA is defined as our consolidated net income, plus the sum of (1) total interest expense, net of interest income; (2) provisions for taxes; (3) depreciation, amortization and goodwill impairment charges; (4) extraordinary losses and unusual or non-recurring charges, including severance costs and relocation costs; (5) expenses incurred in connection with acquisition, investment, recapitalization, disposition and debt or equity issuance transactions; (6) other non-cash charges; and (7) any costs, including cash costs, incurred pursuant to management equity and stock option or other benefit plans; less (1) extraordinary and unusual, non-recurring gains; and (2) non-cash gains. |
44
Table of Contents
Operating Segments
The following table reconciles segment net sales and Adjusted EBITDA to consolidated totals for the three-month periods ended March 31, 2009 and 2010.
| Three Months Ended March 31, 2009 | Three Months Ended March 31, 2010 | |||||||||||||||||||||
| Net Sales | Volume (kMT) |
Adjusted EBITDA(1) |
Net Sales | Volume (kMT) |
Adjusted EBITDA(1) |
|||||||||||||||||
| (Dollars in millions) | ||||||||||||||||||||||
| United States |
$ | 1,091.9 | 796.5 | $ | 57.9 | $ | 1,065.2 | 849.5 | $ | 78.5 | ||||||||||||
| Canada |
266.5 | 208.0 | 21.1 | 258.2 | 184.8 | 24.2 | ||||||||||||||||
| EMEA |
413.0 | 327.4 | 12.7 | 458.8 | 335.6 | 17.1 | ||||||||||||||||
| Rest of World |
25.2 | 11.8 | 1.9 | 31.8 | 14.7 | 1.3 | ||||||||||||||||
|
Other/Eliminations(2) |
(5.1 | ) | (10.3 | ) | (1.2 | ) | (3.8 | ) | (6.6 | ) | (3.0 | ) | ||||||||||
| Total |
$ | 1,791.5 | 1,333.4 | $ | 92.4 | $ | 1,810.2 | 1,378.0 | $ | 118.1 | ||||||||||||
| (1) | Adjusted EBITDA is defined as our consolidated net income, plus the sum of (1) total interest expense, net of interest income; (2) provisions for taxes; (3) depreciation, amortization and goodwill impairment charges; (4) extraordinary losses and unusual or non-recurring charges, including severance costs and relocation costs; (5) expenses incurred in connection with acquisition, investment, recapitalization, disposition and debt or equity issuance transactions; (6) other non-cash charges; and (7) any costs, including cash costs, incurred pursuant to management equity and stock option or other benefit plans; less (1) extraordinary and unusual, non-recurring gains; and (2) non-cash gains. |
| (2) | Other/Eliminations represents the elimination of intersegment transactions as well as unallocated corporate costs consisting of costs specifically related to parent company operations that do not directly benefit segments, either individually or collectively. |
United States. United States segment net sales in the three months ended March 31, 2010 were essentially flat compared to the same period in 2009. An approximate 6.7% volume improvement was offset by a similar decline in average prices. Segment volume increases included significantly higher volumes in the paints and coatings end market, and at ChemPoint, our web-based distributor of specialty and fine chemicals to smaller customers, principally in North America and Europe, as well as improvement in the personal care market, while significant price declines reduced our net sales from caustic soda by $59.9 million, or 5.5%, the effect of which was offset to some extent by an increase in volumes.
United States segment Adjusted EBITDA in the three months ended March 31, 2010 increased 35.6%, compared with the same period in 2009. The increase was attributable to higher gross margins as our gross profit as a percentage of net sales increased by 150 basis points between first quarters, including a $7.1 million benefit to cost of goods sold from the settlement of the antitrust claim discussed above. Excluding this claim, our gross margin percentage in the United States segment improved by 80 basis points. Operating expenses in the United States in the three months ended March 31, 2010 were $9.7 million, or 8.6%, lower as compared to the prior year, and benefitted in part from lower bad debt expense as we implemented initiatives to improve receivables collection, as well as the benefit of lower headcount.
Canada. Canada segment net sales in the three months ended March 31, 2010 declined $8.3 million, or 3.1%, as compared to the same period in 2009. On a currency-neutral basis, Canada segment net sales fell approximately 19.1% between first quarters. The lower net sales in our Canada segment were attributable both to lower volumes, which were down 11.2%, and lower prices, which declined 9.0%. Net sales in Western Canada were impacted particularly by lower demand from the energy and agriculture markets. Net sales of caustic soda declined approximately $15.8 million as a result of the significantly lower prices and lower volume due to decreased consumption and destocking. These factors were partially offset by a modest favorable shift in product mix. Canada segment Adjusted EBITDA increased 14.7% in the three months ended March 31, 2010, as compared to the same period in 2009. This increase was attributable to higher gross margins as our gross profit as a percentage of net sales increased by 180 basis points in U.S. dollars. Canada operating expenses declined 1.6% (15.1% on a currency-neutral basis) due to head count reduction and the implementation of certain IT-related projects in 2009.
45
Table of Contents
EMEA. EMEA segment net sales in the three months ended March 31, 2010 increased $45.8 million, or 11.1%, as compared to the same period in 2009. On a currency-neutral basis, EMEA net sales increased 3.1%. The increase in net sales was attributable both to higher volumes, as metric tons sold increased by 2.5%, and marginally improved pricing, which increased by 0.6% on a currency-neutral basis. EMEA segment Adjusted EBITDA increased 34.6% in the three months ended March 31, 2010 as compared to the same period in the prior year. The increase was principally attributable to the increased net sales as gross profit, as a percentage of net sales, was essentially flat in U.S. dollars and marginally lower on a currency-neutral basis.
Rest of World. Rest of World segment net sales in the three months ended March 31, 2010 increased $6.6 million, or 26.2%, as compared to the same period in 2009. On a currency-neutral basis, Rest of World net sales increased 19.9%. The increase in net sales was primarily attributable to higher volumes, as metric tons sold increased by 24.6%, offset by pricing declines of 1.3%, or 3.7% on a currency-neutral basis. Rest of World segment Adjusted EBITDA fell $0.6 million in the three months ended March 31, 2010 as compared to the same period in the prior year. The decline was principally attributable to the higher operating expenses as we pursued long-term growth initiatives in those markets.
Year Ended December 31, 2009 Compared to Year Ended December 31, 2008
Net Sales
Our net sales and volumes sold for the years ended December 31, 2008 and 2009 are summarized in the following table:
| Year Ended December 31, | Variance | ||||||||||||
| 2008 | 2009 | Amount | % | ||||||||||
| (Dollars in millions) | |||||||||||||
| Net sales |
$ | 9,428.2 | $ | 7,194.5 | $ | (2,233.7 | ) | (23.7 | )% | ||||
| Volume (MT in thousands) |
6,532.1 | 5,396.5 | 1,135.6 | (17.4 | )% | ||||||||
We recorded net sales of $7,194.5 million for the year ended December 31, 2009 compared to $9,428.2 million for the prior year, a decline of 23.7%. Net sales declined 21.1% on a currency-neutral basis, applying 2008’s (average) currency exchange rates to 2009’s local currency denominated net sales. The majority of the decline in net sales was attributable to lower volumes of chemicals we sold, as volumes (measured by metric tons sold) were 17.4% lower year-over-year. Compounding the declining volumes were lower prices, as net sales per metric ton sold declined 7.6%, or approximately 4.5% on a currency-neutral basis, year-over-year due in part to relatively high historical price levels in 2008. Most of our principal end-markets experienced lower volumes as a result of weak economic conditions in most of our significant markets. The most pronounced volume declines were experienced in the paints and coatings, household and industrial cleaning, or HIC, energy and chemical manufacturing end markets. More consumer-driven industries, such as personal care, pharmaceutical and food and beverage, were also impacted by the weaker economic conditions, but to a lesser degree.
Cost of Goods Sold
Our cost of goods sold for the years ended December 31, 2008 and 2009 is summarized in the following table:
| Year Ended December 31, | Variance | ||||||||||||
| 2008 | 2009 | $ | % | ||||||||||
| (Dollars in millions) | |||||||||||||
| Cost of goods sold |
$ | 8,039.2 | $ | 5,985.9 | $ | (2,053.3 | ) | (25.5 | )% | ||||
Cost of goods sold was $5,985.9 million for the year ended December 31, 2009, compared to $8,039.2 million for the prior year, a decline of 25.5%. The decline in cost of goods sold primarily reflects the
46
Table of Contents
purchase price of inventory sold, which fell 25.6% from 2008 to 2009, and also reflects a reduction in costs for personnel engaged in processing and delivery activities of $14.0 million (13.6%) from 2008 to 2009. As a percentage of net sales, our cost of goods sold improved from 85.3% in 2008 to 83.2% in 2009, reflecting our pricing and profitability initiatives, which began to achieve significant results in 2009 notwithstanding the substantial reduction in net sales we experienced in 2009 due to weakened general economic conditions.
Gross profit, defined as net sales less cost of goods sold, for year ended December 31, 2009 was $1,208.6 million, a 13.0% reduction from the $1,389.0 million recorded in 2008. Gross profit as a percentage of net sales increased to 16.8% in 2009 from 14.7% in 2008.
Operating Expenses
Our operating expenses for the years ended December 31, 2008 and 2009 are summarized in the following table:
| Year Ended December 31, | Variance | ||||||||||||
| 2008 | 2009 | $ | % | ||||||||||
| (Dollars in millions) | |||||||||||||
| Warehousing, selling and administrative expenses |
$ | 930.3 | $ | 811.7 | $ | (118.6 | ) | (12.7 | )% | ||||
| Depreciation |
81.6 | 80.1 | (1.5 | ) | (1.8 | ) | |||||||
| Amortization |
50.8 | 46.3 | (4.5 | ) | (8.9 | ) | |||||||
| Asset impairment |
— | 36.0 | 36.0 | N/A | |||||||||
| Total operating expenses |
$ | 1,062.7 | $ | 974.1 | $ | (88.6 | ) | (8.3 | )% | ||||
Total operating expenses declined from $1,062.7 million in the year ended December 31, 2008 to $974.1 million in 2009, a decline of 8.3%, principally due to lower personnel costs, as headcount and bonuses were reduced to reflect the lower level of activity. Operating expenses in 2009 also reflected a $36.0 million asset impairment charge comprised of write-downs of idle facilities of $18.7 million, $16.4 million of which was recorded in the United States, and $13.4 million related to railcars acquired with a caustic soda business. An additional impairment charge was recorded for goodwill and intangible assets related to the caustic soda sales business in Canada, amounting to $3.9 million in 2009 as a result of the deterioration of sales and cash flow in this business in Canada.
Warehousing, selling and administrative expenses declined $118.6 million, or 12.7%, from the year ended December 31, 2008 to 2009 reflecting a reduction in headcount and pension plan restructuring and other cost containment activities, as well the effect of costs we incurred in 2008 that were attributable to the integration of our Chemcentral acquisition in 2007.
We recorded depreciation and amortization expense of $132.4 million in the year ended December 31, 2008 and $126.4 million in 2009. Intangible assets have a remaining useful life of approximately 15 and 14 years at December 31, 2008 and 2009, respectively. The decrease in amortization primarily reflected that certain purchased contract intangibles were fully amortized in the fourth quarter of 2009.
Interest Expense, Net
Interest expense, net declined from $315.6 million for the year ended December 31, 2008 to $307.3 million for 2009. This decline was principally due to lower average debt balances, as we were able to realize a small benefit in interest expense on our $400 million lower average debt balances despite having a large portion of debt the rates payable on which are effectively fixed under a $1.2 billion interest rate swap at 5.145%. In December 2009, we prepaid the underwater portion of the interest rate swap and entered into a $500.0 million interest rate swap with a corresponding fixed rate of 1.78%. The new swap matures on December 31, 2012. The portion of the $1.2 billion interest rate swap that was prepaid will be amortized as interest expense over the period until original maturity of December 31, 2010.
47
Table of Contents
Income Tax Expense
We recorded a provision for income taxes of $18.7 million for the year ended December 31, 2008 which exceeded our income before taxes for the year resulting from an increase in our valuation allowance on our net operating loss (NOL) carryforwards that may not be realized in the future, non-deductible interest and other nondeductible expenses. For the year ended December 31, 2009, we recorded an income tax benefit of $30.1 million, representing an effective tax rate of 41.3%. The decrease in the effective tax rate from 2008 to 2009 was attributable to favorable audit settlements in the United Kingdom and France, as well as lower nondeductible interest and other nondeductible expenses.
Net Income
For the reasons described above, our net loss increased to $42.7 million for the year ended December 31, 2009 from $8.0 million for the year ended December 31, 2008.
Adjusted EBITDA
Our Adjusted EBITDA by operating segment and in the aggregate for the years ended December 31, 2008 and 2009 is summarized in the following table:
| Year Ended December 31, 2008 | Year Ended December 31, 2009 | ||||||||||||||||||||||||||||||||||||||
| U.S. | Canada | EMEA | ROW | Other | Total | U.S. | Canada | EMEA | ROW | Other | Total | ||||||||||||||||||||||||||||
| (in millions) | |||||||||||||||||||||||||||||||||||||||
| Adjusted EBITDA(1) |
$ | 292.5 | $ | 114.7 | $ | 82.5 | $ | 9.5 | $ | (1.2 | ) | $ | 498.0 | $ | 270.4 | $ | 90.1 | $ | 51.6 | $ | 6.2 | $ | 9.4 | $ | 427.7 | ||||||||||||||
| Adjustments: |
|||||||||||||||||||||||||||||||||||||||
| Depreciation |
48.5 | 12.4 | 20.2 | 0.3 | 0.2 | 81.6 | 50.6 | 9.8 | 19.1 | 0.3 | 0.3 | 80.1 | |||||||||||||||||||||||||||
| Amortization |
31.5 | 14.5 | 4.7 | 0.1 | — | 50.8 | 28.7 | 13.2 | 4.4 | — | — | 46.3 | |||||||||||||||||||||||||||
| Extraordinary losses and unusual or non-recurring charges |
39.3 | 29.6 | |||||||||||||||||||||||||||||||||||||
| Expenses incurred for acquisition, investment, recapitalization and disposition |
— | 1.2 | |||||||||||||||||||||||||||||||||||||
| Other non-cash charges reducing net income |
— | 36.0 | |||||||||||||||||||||||||||||||||||||
| Interest expense, net |
315.6 | 307.3 | |||||||||||||||||||||||||||||||||||||
| Income tax expense |
18.7 | (30.1 | ) | ||||||||||||||||||||||||||||||||||||
| Net loss |
$ | (8.0 | ) | $ | (42.7 | ) | |||||||||||||||||||||||||||||||||
| (1) | Adjusted EBITDA is defined as our consolidated net income, plus the sum of: (1) total interest expense, net of interest income; (2) provisions for taxes; (3) depreciation, amortization and goodwill impairment charges; (4) extraordinary losses and unusual or non-recurring charges, including severance costs and relocation costs; (5) expenses incurred in connection with acquisition, investment, recapitalization, disposition and debt or equity issuance transactions; (6) other non-cash charges and (7) any costs, including cash costs, incurred pursuant to management equity and stock option or other benefit plans; less (1) extraordinary and unusual, non-recurring gains; and (2) non-cash gains. |
48
Table of Contents
Operating Segments
The following table reconciles segment net sales and operating income to consolidated totals for the years ended December 31, 2008 and 2009.
| Year Ended December 31, 2008 | Year Ended December 31, 2009 | ||||||||||||||||||
| Net Sales | Volume (kMT) |
Adjusted EBITDA(1) |
Net Sales | Volume (kMT) |
Adjusted EBITDA(1) |
||||||||||||||
| (Dollars in millions) | |||||||||||||||||||
| United States |
$ | 5,459.8 | 3,997.5 | $ | 292.5 | $ | 4,229.1 | 3,379.9 | $ | 270.4 | |||||||||
| Canada |
1,436.4 | 915.8 | 114.7 | 1,152.0 | 745.1 | 90.1 | |||||||||||||
| EMEA |
2,408.2 | 1,563.8 | 82.5 | 1,718.8 | 1,305.6 | 51.6 | |||||||||||||
| Rest of World |
123.8 | 55.0 | 9.5 | 115.4 | 56.2 | 6.2 | |||||||||||||
|
Other/Eliminations(2) |
— | — | (1.2 | ) | (20.8 | ) | (90.3 | ) | 9.4 | ||||||||||
| Total |
$ | 9,428.2 | 6,532.1 | $ | 498.0 | $ | 7,194.5 | 5,396.5 | $ | 427.7 | |||||||||
| (1) | Adjusted EBITDA is defined as our consolidated net income, plus the sum of (1) total interest expense, net of interest income; (2) provisions for taxes; (3) depreciation, amortization and goodwill impairment charges; (4) extraordinary losses and unusual or non-recurring charges, including severance costs and relocation costs; (5) expenses incurred in connection with acquisition, investment, recapitalization, disposition and debt or equity issuance transactions; (6) other non-cash charges and (7) any costs, including cash costs, incurred pursuant to management equity and stock option or other benefit plans; less (1) extraordinary and unusual, non-recurring gains; and (2) non-cash gains. |
| (2) | Other/Eliminations represents the elimination of intersegment transactions as well as unallocated corporate costs consisting of costs specifically related to parent company operations that do not directly benefit segments, either individually or collectively. |
United States. United States segment net sales in the year ended December 31, 2009 declined $1,230.7 million, or 22.5%, as compared to 2008. The decline was primarily due to reduced volume, as metric tons sold in the United States declined 16.6%. Net sales were also affected by lower prices as price declines of approximately 7.1%, reflecting the unusually high price environment in 2008, were partially offset by a favorable shift in product mix. We experienced significant reductions in net sales in each region of the United States. The largest end market declines were in the paints and coatings and energy markets.
United States segment Adjusted EBITDA for the year ended December 31, 2009 decreased $22.1 million, or 7.6%, as compared to 2008. The decline was attributable to lower sales, offset by a higher gross profit as a percentage of net sales, which increased by 220 basis points notwithstanding that declines in sales volumes adversely impacted our ability to earn volume-based pricing incentives from our suppliers at the higher levels we earned in 2008. Our cost reduction initiatives enabled us to reduce operating expenses in the United States segment by $69.0 million, or 11.4%, as we reduced headcount by approximately 9% from year-end 2008 to year-end 2009 and reduced other controllable costs.
Canada. Canada segment net sales in the year ended December 31, 2009 declined $284.4 million, or 19.8%, as compared to 2008. On a currency-neutral basis, Canada segment net sales declined by approximately 14.2%. Net sales in Canada were primarily affected by lower demand as volumes in the year ended December 31, 2009 were approximately 18.6% lower than in 2008, principally due to an approximately 40% reduction in caustic soda sales. Volumes in Canada declined particularly later in 2009 due in part to lower demand from the energy and paper and wood end markets, which were impacted by falling demand and rapidly declining prices for commodities in the latter part of 2009 versus 2008. Lower methanol prices also negatively impacted net sales in Western Canada. Canada segment Adjusted EBITDA in the year ended December 31, 2009 was approximately 21.4% lower compared to 2008. The reduction was attributable to the lower net sales and was partially offset by higher gross profit as a percentage of net sales, which improved by 70 basis points in 2009 as compared to 2008 and improved performance in cost controls as our operating expenses in Canada in 2009 were 6.7% higher than in 2008, principally due to IT-related expenses.
49
Table of Contents
EMEA. EMEA segment net sales in the year ended December 31, 2009 declined $689.4 million, or 28.6%, as compared to 2008. On a currency-neutral basis net sales in EMEA declined 22.0%. The decline in net sales was attributable to lower demand as volumes were 16.5% lower in 2009 and prices, which declined 14.5%, or 6.5% on a currency-neutral basis, reflecting unusually high prices in 2008. The end markets with the most significant sales declines were chemicals manufacturing, rubber and plastics and paints and coatings, reflecting weakness in construction and manufacturing. EMEA segment Adjusted EBITDA was $30.9 million, or 37.5%, lower for the year ended December 31, 2009 as compared to 2008. This decline was largely due to the lower net sales offset by a higher profitability as gross profit as a percentage of net sales increased by 260 basis points in U.S. dollars. EMEA segment operating expenses were up 7.5% in U.S. dollars but were flat in local currencies. Headcount reductions were partially offset by higher pension and environmental remediation costs as well as costs incurred to consolidate our pan-European operational offices in Antwerp, Belgium.
Rest of World. Rest of World segment net sales for the year ended December 31, 2009 declined $8.4 million, or 6.8%, as compared to 2008. On a currency-neutral basis Rest of World sales declined 6.1%. The reduction was due to significantly lower pricing, which was down 8.8%, or 8.1% on a currency-neutral basis, reflecting unusually high prices in 2008 driven by escalating costs of chemical feedstocks. Rest of World segment Adjusted EBITDA for the year ended December 31, 2009 was also significantly down for 2009, reflecting mainly the lower pricing.
Year Ended December 31, 2008 Compared to Year Ended December 31, 2007 (combined)
Net Sales
Our net sales and volumes sold for the years ended December 31, 2007 (combined) and 2008 are summarized in the following table:
| Year Ended December 31, | Variance | |||||||||||
| 2007(1) | 2008 | Amount | % | |||||||||
| (Dollars in millions) | ||||||||||||
| Net sales |
$ | 8,117.0 | $ | 9,428.2 | $ | 1,311.2 | 16.2 | % | ||||
| Volume (MT in thousands) |
6,408.8 | 6,532.1 | 123.3 | 1.9 | % | |||||||
| (1) | Represents the combination of the results of the pre-acquisition period from January 1, 2007 to October 11, 2007 and the results of the post-acquisition period from October 12, 2007 to December 31, 2007. |
We recorded net sales of $9,428.2 million for the year ended December 31, 2008 compared to $8,117.0 million (combined) for the prior year, an increase of 16.2%. Net sales increased approximately 16% on a currency-neutral basis. The increase in net sales was attributable to higher prices, currency translation and product mix changes. Prices, in terms of net sales per metric ton sold, increased 14.1% from 2007 to 2008, or 13.4% on a currency-neutral basis. We experienced particularly high prices in caustic soda, our largest volume product, in 2008, with prices more than doubling at peak periods during the year. These price increases largely reflected significantly higher demand, particularly in the alumina and paper and wood end markets. Volumes (measured by metric tons sold) increased 1.9% year-over-year in part reflecting inclusion of a full year of operations of Chemcentral, which we acquired in April 2007, and the Dow caustic soda assets in Canada which we acquired in December 2007. Excluding the impact of the acquisitions of Chemcentral and Dow’s caustic soda sales business, volumes were down year-over-year due to de-stocking in some areas and management’s focus on product mix and profitability.
50
Table of Contents
Cost of Goods Sold
Our cost of goods sold for the years ended December 31, 2007 (combined) and 2008 is summarized in the following table:
| Year Ended December 31, | Variance | |||||||||||
| 2007(1) | 2008 | $ | % | |||||||||
| (Dollars in millions) | ||||||||||||
| Cost of goods sold |
$ | 6,964.1 | $ | 8,039.2 | $ | 1,075.1 | 15.4 | % | ||||
| (1) | Represents the combination of the results of the pre-acquisition period from January 1, 2007 to October 11, 2007 and the results of the post-acquisition period from October 12, 2007 to December 31, 2007. |
Cost of goods sold was $8,039.2 million for the year ended December 31, 2008 compared to $6,964.1 million (combined) for the prior year, an increase of 15.4%. Cost of goods sold primarily represents the purchase price of inventory sold. Rising chemicals prices were the primary reason for the increase. As a percentage of net sales, our cost of goods sold improved from 85.8% in 2007 to 85.3% in 2008, reflecting pricing discipline and our ability to capture fuel surcharges in connection with the significant chemicals and energy price increases during the period.
Gross profit, defined as net sales less cost of goods sold, for year ended December 31, 2008 was $1,389.0 million, a 20.5% increase from the $1,152.9 million recorded in 2007 (combined). Gross profit as a percentage of sales increased to 14.7% in 2008 from 14.2% in 2007. Gross profit as a percentage of net sales also benefitted from our ability to pass through price increases and fuel surcharges on a timely basis.
Operating Expenses
Our operating expenses for the years ended December 31, 2007 (combined) and 2008 are summarized in the following table:
| Year Ended December 31, | Variance | |||||||||||
| 2007(1) | 2008 | $ | % | |||||||||
| (Dollars in millions) | ||||||||||||
| Warehousing, selling and administrative expenses |
$ | 869.3 | $ | 930.3 | $ | 61.0 | 7.0 | % | ||||
| Depreciation |
65.1 | 81.6 | 16.5 | 25.3 | ||||||||
| Amortization |
16.5 | 50.8 | 34.3 | 207.9 | ||||||||
| Total operating expenses |
$ | 950.9 | $ | 1,062.7 | $ | 111.8 | 11.8 | % | ||||
| (1) | Represents the combination of the results of the pre-acquisition period from January 1, 2007 to October 11, 2007 and the results of the post-acquisition period from October 12, 2007 to December 31, 2007. |
Total operating expenses increased from $950.9 million in the year ended December 31, 2007 (combined) to $1,062.7 million in 2008, an increase of 11.8%, principally due to inclusion of a full year’s results from our 2007 acquisitions and the acquisition of our predecessor, Univar N.V., by CVC Capital Partners.
Warehousing, selling and administrative expenses increased $61.0 million, or 7.0%, from the year ended December 31, 2007 to 2008, principally reflecting inclusion of a full year of results for Chemcentral and the Dow caustic soda sales assets. This increase also reflected higher energy and utility costs driven by fuel prices, a pick up in bad debt write-offs due to economic factors, higher business taxes due to a change in the corporate structure and higher contract labor costs to support new IT initiatives.
We recorded depreciation and amortization expense of $81.6 million in the year ended December 31, 2007 (combined) and $132.4 million in 2008. The increased depreciation and amortization is related to the 2007
51
Table of Contents
acquisitions of Chemcentral and the Dow caustic soda sales assets as well as the acquisition of our predecessor by funds advised by CVC Capital Partners. The amortization expense is primarily related to customer relationships and had an estimated remaining useful life of 16 and 15 years at December 31, 2007 and December 31, 2008, respectively.
Interest Expense, Net
Interest expense, net more than doubled from $127.0 million for the year ended December 31, 2007 (combined) to $315.6 million for 2008. The increase reflected increased borrowings as we incurred acquisition debt to finance the 2007 Chemcentral acquisition as well as debt incurred through the acquisition of our predecessor by funds advised by CVC Capital Partners. In 2007, we recorded a gain of $31.3 million on the extinguishment of a related party loan.
Income Tax Expense
We have recorded provisions for income taxes of $59.6 million and $18.7 million for years ended December 31, 2007 (combined) and 2008, respectively. Our provisions for income taxes represented an effective tax rate of 56.1% for 2007 and exceeded our income before taxes for 2008. Income taxes in 2007 were affected by nondeductible interest and nondeductible compensation related expenses, and the adoption of FIN 48, which required a recognition threshold and measurement attributes for the financial statement, recognition and measurement of a tax position taken or expected to be taken in a tax return. The increase in the effective tax rate from 2007 to 2008 was due principally to an increase in our valuation allowance on our net operating loss (NOL) carryforwards that may not be realized in the future, and an increase in nondeductible interest and other nondeductible expenses.
Net Income
For the reasons above, our net loss for the year ended December 31, 2008 was $8.0 million. In connection with the 2007 acquisition, we incurred a net loss for the period from October 12, 2007 to December 31, 2007 of $14.6 million. During the predecessor period from January 1, 2007 to October 11, 2007, we recorded net income of $61.3 million.
52
Table of Contents
Adjusted EBITDA
Our Adjusted EBITDA by operating segment and in the aggregate for the period from January 1, 2007 through October 11, 2007 and for the year ended December 31, 2008 is summarized in the following tables
| The period from January 1, 2007 through October 11, 2007 |
The period from October 12, 2007 to December 31, 2007 |
Year Ended December 31, 2008 |
||||||||||||||||||||||||||||||||||||||||||||||||||||||||
| U.S. | Canada | EMEA | ROW | Other | Total | U.S. | Canada | EMEA | ROW | Other | Total | U.S. | Canada | EMEA | ROW | Other | Total | |||||||||||||||||||||||||||||||||||||||||
| (in millions) | ||||||||||||||||||||||||||||||||||||||||||||||||||||||||||
| Adjusted EBITDA(1) |
$ | 158.2 | $ | 68.1 | $ | 51.8 | $ | 2.6 | $ | (28.5 | ) | $ | 252.2 | $ | 39.6 | $ | 25.5 | $ | 11.1 | $ | 3.1 | $ | 1.3 | $ | 80.6 | $ | 292.5 | $ | 114.7 | $ | 82.5 | $ | 9.5 | $ | (1.2 | ) | $ | 498.0 | ||||||||||||||||||||
| Adjustments: |
||||||||||||||||||||||||||||||||||||||||||||||||||||||||||
| Depreciation |
26.4 | 7.8 | 13.7 | 0.1 | 0.3 | 48.3 | 10.6 | 2.1 | 4.0 | 0.1 | — | 16.8 | 48.5 | 12.4 | 20.2 | 0.3 | 0.2 | 81.6 | ||||||||||||||||||||||||||||||||||||||||
| Amortization |
4.6 | 0.1 | 0.6 | 0.2 | 0.1 | 5.6 | 6.7 | 3.1 | 1.1 | — | — | 10.9 | 31.5 | 14.5 | 4.7 | 0.1 | — | 50.8 | ||||||||||||||||||||||||||||||||||||||||
| Extraordinary losses and unusual or non-recurring charges |
26.0 | 23.2 | 39.3 | |||||||||||||||||||||||||||||||||||||||||||||||||||||||
| Extraordinary gain |
— | (31.3 | ) | — | ||||||||||||||||||||||||||||||||||||||||||||||||||||||
| Interest expense, net |
58.0 | 69.0 | 315.6 | |||||||||||||||||||||||||||||||||||||||||||||||||||||||
| Income tax expense |
53.0 | 6.6 | 18.7 | |||||||||||||||||||||||||||||||||||||||||||||||||||||||
| Net income (loss) |
$ | 61.3 | $ | (14.6 | ) | $ | (8.0 | ) | ||||||||||||||||||||||||||||||||||||||||||||||||||
| (1) | Adjusted EBITDA is defined as our consolidated net income, plus the sum of: (1) total interest expense, (2) provisions for taxes, (3) depreciation, amortization and goodwill impairment charges, (4) extraordinary losses and unusual or non-recurring charges, including severance costs and relocation costs, (5) expenses incurred in connection with acquisition, investment, recapitalization, disposition and debt or equity issuance transactions, (6) other non-cash charges and (7) any costs, including cash costs, incurred pursuant to management equity and stock option or other benefit plans; less (1) extraordinary and unusual, non-recurring gains; and (2) non-cash gains. |
Operating Segments
The following table reconciles segment net sales and operating income to consolidated totals for the period from January 1, 2007 through October 11, 2007, October 12, 2007 through December 31, 2007 and for the year ended December 31, 2008.
| The period from January 1, 2007 through October 11, 2007 |
The period from October 12, 2007 through December 31, 2007 |
Year Ended December 31, 2008 |
||||||||||||||||||||||
| Net Sales | Adjusted EBITDA(1) |
Net Sales | Adjusted EBITDA(1) |
2007 (combined) Volumes (kMT) |
Net Sales | Volumes (kMT) |
Adjusted EBITDA(1) |
|||||||||||||||||
| (Dollars in millions) | ||||||||||||||||||||||||
| United States |
$ | 3,444.1 | $ | 158.2 | $ | 998.7 | $ | 39.6 | 3,949.2 | $ | 5,459.8 | 3,997.5 | $ | 292.5 | ||||||||||
| Canada |
937.3 | 68.1 | 215.5 | 25.5 | 711.2 | 1,436.4 | 915.8 | 114.7 | ||||||||||||||||
| EMEA |
1,909.7 | 51.8 | 527.8 | 11.1 | 1,731.2 | 2,408.2 | 1,563.8 | 82.5 | ||||||||||||||||
| Rest of World |
35.8 | 2.6 | 48.1 | 3.1 | 17.2 | 123.8 | 55.0 | 9.5 | ||||||||||||||||
|
Other/Eliminations(2) |
— | (28.5 | ) | — | 1.3 | — | — | — | (1.2 | ) | ||||||||||||||
| Total |
$ | 6,326.9 | $ | 252.2 | $ | 1,790.1 | $ | 80.6 | 6,408.8 | $ | 9,428.2 | 6,532.1 | $ | 498.0 | ||||||||||
53
Table of Contents
| (1) | Adjusted EBITDA is defined as our consolidated net income, plus the sum of: (1) total interest expense, (2) provisions for taxes, (3) depreciation, amortization and goodwill impairment charges, (4) extraordinary losses and unusual or non-recurring charges, including severance costs and relocation costs, (5) expenses incurred in connection with acquisition, investment, recapitalization, disposition and debt or equity issuance transactions, (6) other non-cash charges and (7) any costs, including cash costs, incurred pursuant to management equity and stock option or other benefit plans; less (1) extraordinary and unusual, non-recurring gains; and (2) non-cash gains. |
| (2) | Other/Eliminations represents the elimination of intersegment transactions as well as unallocated corporate costs consisting of costs specifically related to parent company operations that do not directly benefit segments, either individually or collectively. |
United States. United States segment net sales for the year ended December 31, 2008 increased $1,017.0 million, or 22.9%, as compared to net sales for 2007 (on a combined basis). This increase was primarily due to a full year of net sales from Chemcentral, which was acquired in April 2007 and higher average selling prices, as volumes in the United States segment increased by only 1.2% in terms of metric tons sold due to lower demand and a change in product mix, particularly later in 2008. United States segment Adjusted EBITDA for the year ended December 31, 2008 increased $94.7 million, or 47.9%, as compared to 2007 (combined). The increase in adjusted EBITDA was attributable to higher sales and a slight improvement in gross profit as a percentage of net sales. Our cost control initiatives and continued focus on synergies enabled us to manage operating expenses in the United States segment to an increase of 17% despite rising fuel and utility costs and higher provisions for doubtful accounts as certain customers began to experience financial difficulties due to weakening economic conditions.
Canada. Canada segment net sales in the year ended December 31, 2008 increased $283.6 million, or 24.6%, as compared to 2007 (combined). On a currency-neutral basis, Canada net sales increased by 23.7%. Canada segment Adjusted EBITDA in the year ended December 31, 2008 was $21.1 million, or 22.5%, higher than in 2007 (combined). The Canadian results benefited from the inclusion of the Dow caustic soda sales business which was acquired in December 2007 and added approximately $150 million in segment net sales and $13 million in segment Adjusted EBITDA in 2008. Excluding the impact of the acquired caustic soda sales business, volumes decreased 6.5% and average selling prices were up approximately 18% over 2007 (combined). Gross profit as a percentage of net sales improved 20 basis points as compared to 2007 and operating expenses were held at a 13% increase over 2007 which contributed to the improvement in Adjusted EBITDA.
EMEA. EMEA segment net sales in the year ended December 31, 2008 declined $29.3 million, or 1.2% as compared to 2007 (combined). On a currency-neutral basis net sales in EMEA declined approximately 3%. The decline in net sales was attributable to lower demand as volumes were 9.7% lower in 2008 as compared to 2007. The reduction in volume was partially offset by higher pricing as prices determined by net sales per metric ton sold increased 7.7% on a currency-neutral basis reflecting unusually high prices in 2008. Despite the decline in net sales, EMEA segment Adjusted EBITDA was $19.6 million, or 31.2%, higher for the year ended December 31, 2008 as compared to 2007. This increase was largely due to a higher profitability as gross profit as a percentage of net sales increased by 130 basis points, reflecting the attention given to improving profitability during the year. EMEA segment operating expenses were up 2.9% in local currencies and only 5.2% once translated into US dollars thereby adding to the high level of profitability at Adjusted EBITDA.
Rest of World. Rest of World segment net sales for the year ended December 31, 2008 increased $39.9 million, or 47.6%, as compared to 2007 (combined). The increase is primarily due to higher sales in our emerging businesses in Mexico and China which was primarily driven by a 28.5% increase in volumes. Rest of World segment Adjusted EBITDA for the year ended December 31, 2008 increased $3.8 million, or 66.7%, compared to 2007 (combined) reflecting the higher sales volumes in these areas.
54
Table of Contents
Quarterly Results of Operations
The following table summarizes our unaudited quarterly results of operations.
| 2008 | 2009 | 2010 | ||||||||||||||||||||||||||||||||
| March 31 | June 30 | Sept. 30 | Dec. 31 | March 31 | June 30 | Sept. 30 | Dec. 31 | March 31 | ||||||||||||||||||||||||||
| (in millions) | ||||||||||||||||||||||||||||||||||
| Net sales |
$ | 2,306.9 | $ | 2,593.9 | $ | 2,582.9 | $ | 1,944.5 | $ | 1,791.5 | $ | 1,900.9 | $ | 1,825.3 | $ | 1,676.8 | $ | 1,810.2 | ||||||||||||||||
| Cost of sales |
1,985.2 | 2,231.8 | 2,199.2 | 1,623.0 | 1,500.2 | 1,588.0 | 1,513.2 | 1,384.5 | 1,495.6 | |||||||||||||||||||||||||
| $ | 321.7 | $ | 362.1 | $ | 383.7 | $ | 321.5 | $ | 291.3 | $ | 312.9 | $ | 312.1 | $ | 292.3 | $ | 314.6 | |||||||||||||||||
| Warehousing, selling and administrative expenses |
224.8 | 230.6 | 245.4 | 229.5 | 200.0 | 201.2 | 202.1 | 208.4 | 197.9 | |||||||||||||||||||||||||
| Depreciation expense |
20.7 | 20.9 | 20.0 | 20.0 | 19.1 | 19.9 | 20.4 | 20.7 | 20.1 | |||||||||||||||||||||||||
| Amortization expense |
9.0 | 9.2 | 12.8 | 19.8 | 12.0 | 12.3 | 12.5 | 9.5 | 11.2 | |||||||||||||||||||||||||
| Impairment of fixed assets |
3.9 | 3.9 | — | (7.8 | ) | 0.0 | 12.2 | 1.5 | 22.3 | 3.6 | ||||||||||||||||||||||||
| Total operating expenses |
258.4 | 264.6 | 278.2 | 261.5 | 231.1 | 245.6 | 236.5 | 260.9 | 232.8 | |||||||||||||||||||||||||
| Operating income |
63.3 | 97.5 | 105.5 | 60.0 | 60.2 | 67.3 | 75.6 | 31.4 | 81.8 | |||||||||||||||||||||||||
| Interest expense, net |
74.1 | 78.3 | 84.0 | 79.2 | 76.2 | 74.4 | 78.5 | 78.2 | 73.8 | |||||||||||||||||||||||||
| Earnings (loss) before taxation |
(10.8 | ) | 19.2 | 21.5 | (19.2 | ) | (16.0 | ) | (7.1 | ) | (2.9 | ) | (46.8 | ) | 8.0 | |||||||||||||||||||
| Income tax expense (benefit) |
4.2 | 11.0 | 32.5 | (29.0 | ) | (6.0 | ) | (4.9 | ) | (5.9 | ) | (13.3 | ) | 4.4 | ||||||||||||||||||||
| Net income (loss) |
$ | (15.0 | ) | $ | 8.2 | $ | (11.0 | ) | $ | 9.8 | $ | (10.0 | ) | $ | (2.2 | ) | $ | 3.0 | $ | (33.5 | ) | $ | 3.6 | |||||||||||
Quarterly Results/Seasonality. Seasonal changes may affect our business and results of operations. Our net sales are affected by the level of industrial production, which tends to decline in the fourth quarter of each year. Certain of our end markets also experience seasonal fluctuations, which also affect our net sales and results of operations. For example, our sales to the agricultural end market particularly in Canada tend to peak in the second and third quarters in each year, depending in part on weather-related variations in demand for agricultural chemicals. Sales to other end markets such as paints and coatings or water treatment may also be affected by changing seasonal weather conditions.
Liquidity and Capital Resources
Our primary liquidity and capital resource needs are to service our debt, finance working capital and make capital expenditures. Our primary source of liquidity is cash generated from our operations as well as borrowings under our credit facilities. We have significant working capital needs, although we have implemented several initiatives to improve our working capital and reduce the related financing requirements. The nature of our business, however, requires that we maintain inventories that enable us to deliver products to fill customer needs. At March 31, 2010, we maintained inventories of $708.1 million, equivalent to approximately 57 days of sales (which we calculate on the basis of net sales for the trailing 90-day period).
Historically, our maintenance capital expenditures have largely tracked our depreciation expense. As we execute our growth strategies, we expect that capital expenditures will increase somewhat and we estimate annual capital expenditures in the range of $75 million to $100 million over the 2010 to 2011 period. We have a number of significant projects in 2010, including IT projects such as the pan-European implementation of our SAP enterprise resource planning, or ERP, system and our global data management initiative, which is designed to improve our responsiveness to market changes and customer demand.
55
Table of Contents
The following table presents information regarding our cash flows, cash and cash equivalents as of and for the years ended December 31, 2008 and 2009 and the three months ended March 31, 2009 and 2010:
| Years Ended December 31, | Three Months Ended March 31, |
|||||||||||||||
| 2008 | 2009 | 2009 | 2010 | |||||||||||||
| (in millions) | ||||||||||||||||
| (unaudited) | ||||||||||||||||
| Net cash provided by (used for) |
||||||||||||||||
| Operating activities |
$ | 9.4 | $ | 217.4 | $ | 169.4 | $ | 172.8 | ||||||||
| Investing activities |
(71.9 | ) | (35.3 | ) | (9.4 | ) | (7.9 | ) | ||||||||
| Financing activities |
208.3 | (278.7 | ) | (159.8 | ) | (187.5 | ) | |||||||||
| Increase (decrease) in cash and cash equivalents |
118.3 | (82.9 | ) | 1.9 | (25.5 | ) | ||||||||||
| Cash and cash equivalents, end of period |
$ | 223.1 | $ | 140.2 | $ | 225.0 | $ | 114.7 | ||||||||
Our operations provided cash of $217.4 million in 2009 as compared to $9.4 million in 2008, despite our lower net sales recorded in 2009. The increase was principally due to improved working capital, as we improved inventory management and our collection of receivables in a more difficult operating environment.
We used $35.3 million in cash for investing activities in 2009 as compared to $71.9 million in 2008. Investing cash flows in 2009 benefitted from modestly lower capital expenditures in property, plant and equipment, as well as proceeds from the sale of our U.S.-based polymer business in 2009. We expect to expend more cash on investments over the next several years as we seek to expand our business in part through acquisitions and as we continue to invest in information and business intelligence systems that will facilitate profitable organic growth.
We used $278.7 million in cash for financing activities in 2009, principally payments of $344.9 million of the principal of our outstanding indebtedness, offset by a $106.8 million increase in loans payable to related parties primarily representing capitalized interest costs. In 2008, we added cash of $208.3 million from financing comprised of $215.4 million of the remaining 12% Senior Subordinated Notes, which were pushed down to Univar from its parent to finalize the restructuring process, and $90 million of net drawings under our ABL Facility. The funds from the $215.4 million borrowing were used to repay a similar amount of loans to related parties. Interest on certain related party loans was capitalized and a new loan was granted for $35 million.
Our net proceeds from this offering will be used to redeem or repay a portion of our outstanding indebtedness and for general corporate purposes. This will enable us to benefit from lower future interest expense. Based upon our current level of operations, we expect that our cash flow from operations, together with the amounts we are able to borrow under our ABL Facility, will be adequate to meet our anticipated needs for the foreseeable future.
Long-term Debt
In connection with our 2007 acquisition, we entered into several credit facilities and debt instruments under which we and a number of our subsidiaries were borrowers and/or guarantors. These include the following:
| • | A $1,100 million syndicated asset-based loan facility (ABL Facility) maturing on October 11, 2013, of which $67.4 million was outstanding at March 31, 2010; |
| • | A $1,250 million syndicated Term Loan Facility maturing on October 11, 2014, of which $1,134 million was outstanding at March 31, 2010; and |
| • | $600 million in aggregate principal amount of our 12% Senior Subordinated Notes due 2015, all of which was outstanding at March 31, 2010. |
Our ABL and Term Loan Facilities permit drawdowns of various terms and in multiple currencies.
56
Table of Contents
Our ABL Facility is divided into four tranches, a Tranche A revolving commitment and a Tranche A-1 revolving commitment in each of the United States and Canada. Our ABL Facility is secured by substantially all of the assets of our U.S. and Canadian subsidiaries. The amount we may borrow under our ABL Facility at any given time is calculated using a borrowing base derived from the value of certain eligible accounts and inventory. The aggregate amount available was $365.1 million and $703.5 million as of December 31, 2009 and March 31, 2010, respectively. In addition, our ability to borrow under our ABL Facility is subject to our compliance with customary conditions, including affirmative and negative covenants and a financial covenant to maintain a specified consolidated fixed charge coverage ratio. See “Description of Our Indebtedness.” As of December 31, 2009 and March 31, 2010, we believe we were in compliance with these covenants.
Our Term Loan Facility is divided into two tranches, a Term Loan A of $215 million and a Term Loan B of $1,035 million, of which $154.2 million and $979.7 million, respectively, were outstanding at March 31, 2010. The Term Loan is secured by substantially all of the assets of our U.S. and U.K. subsidiaries, but this lien, as it relates to collateral that is shared with our ABL Facility, ranks junior to our ABL Facility. Our Term Loan credit agreement includes customary affirmative and negative covenants, including financial covenants regarding leverage and interest coverage. See “Description of Our Indebtedness.” As of December 31, 2009 and March 31, 2010, we believe we were in compliance with these covenants.
Our Term Loan Facility requires prepayments of amounts based on excess cash flow in each year. Fifty percent of the excess cash flow as determined in the Term Loan Facility is required to be prepaid to Term Loan lenders on a pro rata basis before April 30 of the following year. These amounts for 2008 and 2009 were $49.2 million and $125.0 million, respectively, and are included in the current portion of long-term debt.
Our ABL and Term Loan Facilities provide that borrowings may only be used for the financing of certain acquisitions, for working capital and for general corporate purposes, that the net proceeds from certain disposals and capital market issues must be used as mandatory prepayments.
Our ABL and the Term Loan Facilities each bear interest at a rate equal to a margin over a selected benchmark rate, typically LIBOR. The applicable margin for any ABL loan depends on the average combined availability (U.S. and Canadian) for the most recent fiscal quarter ranging from 1.25% to 3.0%. The applicable margin for any Term Loan A loan depends on our consolidated total leverage ratio for the most recent fiscal quarter. The applicable margin for a LIBOR Term Loan A loan is 2.50% if our consolidated total leverage ratio is less than 4.75 to 1.00 and 2.75% if our consolidated total leverage ratio is greater than or equal to 4.75 to 1.00. As of June 30, 2010, our consolidated total leverage ratio was to 1.00 and the applicable margin was % on the outstanding Term Loan A loans ($215 million). The applicable margin for any Term Loan B loan that is a LIBOR loan is 3.0%, and is currently 3.0% on the outstanding Term Loan B loans ($1,035 million).
Our Senior Subordinated Notes mature in September 2015. Interest on the Senior Subordinated Notes is payable quarterly at a rate of 12% per annum. Prior to September 30, 2010, up to 40% of the Senior Subordinated Notes may be redeemed at a premium with the net cash proceeds of an offering of common stock. The indenture relating to the Senior Subordinated Notes contains, among others, customary covenants with respect to incurrence of indebtedness, restricted payments, dividend and other payment restrictions affecting subsidiaries, asset sales, transactions with affiliates, change of control and merger, consolidation and sale of certain assets.
57
Table of Contents
The following table sets forth the outstanding amounts under these instruments at the dates indicated.
| December 31, | March 31, | ||||||||
| 2008 | 2009 | 2010 | |||||||
| (in millions) | |||||||||
| (unaudited) | |||||||||
| ABL |
$ | 558.6 | $ | 290.7 | $ | 67.4 | |||
| U.S. dollars |
386.5 | 208.8 | 57.2 | ||||||
| Canadian dollars |
172.1 | 81.9 | 10.2 | ||||||
| Undrawn availability |
288.6 | 365.1 | 703.5 | ||||||
| Term Loan A |
164.0 | 161.2 | 154.2 | ||||||
| U.S. dollars |
59.4 | 54.7 | 54.7 | ||||||
| British pounds |
104.6 | 106.5 | 99.5 | ||||||
| Term Loan B |
1,024.6 | 979.7 | 979.7 | ||||||
| Senior Subordinated Notes |
600.0 | 600.0 | 600.0 | ||||||
We seek to maintain a portion of our debt in the form of fixed-rate obligations, either directly or through application of floating-to-fixed interest rate swap agreements that effectively fix the interest rate payable on all or a portion of our floating rate debt obligations. Based on our interest rate swaps, the effective interest rate for our ABL and Term Loans in aggregate was 6.6% at March 31, 2010, as compared to 6.1% at December 31, 2009, and 8.2% at December 31, 2008. At March 31, 2010, we had one interest rate swap contract in place with a notional amount of $500.0 million. Under this contract we paid a fixed rate of interest and received a variable rate of interest based on LIBOR on the notional amount. This interest rate swap expires on December 31, 2012. This swap replaced a $1,200.0 million swap that would have expired at December 31, 2010. We decided to terminate the earlier swap and pay off the $61.2 million balance on December 21, 2009. This amount, net of $22.0 million charged directly to retained earnings at the time the contract was transferred to us on October 11, 2007, is being amortized to interest expense over the remaining original term of the swap. Because debt balances fell below the swap notional principal, we recognized ineffectiveness related to this swap of $1.7 million during 2009. We also had a British pound swap with a notional amount of £55 million that expired on December 29, 2009.
Contractual Commitments
The following table summarizes our contractual obligations as of March 31, 2010 (unaudited):
| Total | Less than 1 year |
1-3 years | 4-5 years | After 5 years | ||||||||||||
| (in millions) | ||||||||||||||||
| Long-term debt |
$ | 1,802.1 | $ | 125.0 | $ | 64.7 | $ | 1,012.2 | $ | 600.2 | ||||||
| Interest expense |
647.8 | 122.8 | 245.3 | 243.6 | 36.1 | |||||||||||
| Long-term debt payable to stockholders |
878.2 | — | — | — | 878.2 | |||||||||||
| Interest expense payable to stockholders |
4.4 | 0.8 | 1.5 | 1.5 | 0.6 | |||||||||||
| Derivatives |
2.6 | 5.8 | (3.2 | ) | — | — | ||||||||||
| Lease and rental commitments |
223.8 | 53.9 | 68.0 | 40.5 | 61.4 | |||||||||||
| $ | 3,558.9 | $ | 308.3 | $ | 376.3 | $ | 1,297.8 | $ | 1,576.5 | |||||||
We expect that we will be able to fund our remaining obligations and commitments with cash flow from operations. To the extent we are unable to fund these obligations and commitments with cash flow from operations, we intend to fund these obligations and commitments with proceeds from available borrowing capacity under our ABL Facility or under future debt or equity financings.
58
Table of Contents
Off-Balance Sheet Arrangements
We have few off-balance sheet arrangements. In recent years, our principal off-balance sheet arrangements have consisted primarily of operating leases for facility space and some equipment leasing and we expect to continue these practices. For additional information on these leases, see Note 17 to our consolidated financial statements included elsewhere in this prospectus. We do not use any other type of joint venture or special purpose entities that would create off-balance sheet financing.
Income Taxes
We are subject to income taxes in the jurisdictions in which we sell products and earn revenues, including the United States, Canada and various European jurisdictions. By their nature, a number of our tax positions require us to apply significant judgment in order to properly evaluate and quantify our tax positions and to determine our provision for income taxes. ASC 740 (formerly Financial Interpretation No. 48 (FIN 48)) sets forth a two-step approach to recognizing and measuring uncertain tax positions accounted for in accordance with SFAS 109, Accounting for Income Taxes. The first step is to evaluate the tax position for recognition by determining if the weight of available evidence indicates that it is more likely than not that the position will be sustained on audit, including resolution of related appeals or litigation processes, if any. The second step is to measure the tax benefit as the largest amount that is more than 50% likely of being realized upon settlement. Reversal of a tax position previously recorded would occur if a subsequent determination is made that a tax position no longer meets the more likely than not threshold. FIN 48 specifically prohibits the use of a valuation allowance as a substitute for derecognition of tax positions and also requires expanded disclosures. We adopted FIN 48 effective January 1, 2007. See Note 13 to our consolidated financial statements included elsewhere in this prospectus.
Although we believe we have adequately reserved for our uncertain tax positions, the final outcome of these tax matters may be different than our provision. We adjust our reserves for tax positions in light of changing facts and circumstances, such as the closing of a tax audit, the refinement of an estimate or changes in tax laws. To the extent that the final tax outcome of these matters is different than the amounts recorded, the differences are recorded as adjustments to the provision for income taxes in the period in which such determination is made. The provision for income taxes includes the impact of reserve provisions and changes to reserves that are considered appropriate, as well as the related net interest.
In evaluating our ability to realize our deferred tax assets, in full or in part, we consider all available positive and negative evidence, including our past operating results, our forecast of future market growth, forecasted earnings, future taxable income and prudent and feasible tax planning strategies. The assumptions utilized in determining future taxable income require significant judgment and are consistent with the plans and estimates we are using to manage the underlying businesses. We believe it is more likely than not that the remaining deferred tax assets recorded on our balance sheet will ultimately be realized. In the event we were to determine that we would not be able to realize all or part of our net deferred tax assets in the future, an adjustment to the deferred tax assets would be charged to earnings in the period in which we make such determination.
Our effective tax rates have differed from the statutory tax rate primarily due to the tax impact of foreign operations, state taxes, foreign branch earning/losses, increases in valuation allowance and nondeductible interest and nondeductible expenses. The effective tax rates were 46.4%, (82.5)%, 174.8% and 41.4% for the period January 1, 2007 through October 11, 2007, the period October 12, 2007 through December 31, 2007 and the years ended December 31, 2008 and December 31, 2009, respectively. Our future effective tax rates could be adversely affected by changes in the valuation of our deferred tax assets or liabilities, or changes in tax laws, regulations, accounting principles or interpretations thereof. In addition, we are subject to examination of our income tax returns by various tax authorities, including the Internal Revenue Service. We regularly assess the likelihood of adverse outcomes resulting from these examinations to determine the adequacy of our provision for income taxes.
59
Table of Contents
Effects of Inflation
Our monetary assets, consisting primarily of cash and receivables, are not affected by inflation because they are short-term and in the case of cash are immaterial. Our non-monetary assets, consisting primarily of inventory, intangible assets and goodwill, have not been affected significantly by inflation. However, the rate of inflation affects our cost of goods sold and expenses, such as those for employee compensation, which may not be readily recoverable in the price of goods and services offered by us.
Quantitative and Qualitative Disclosures about Market Risk
Financial Risk Management Objectives and Policies
Our principal financial instruments, other than derivatives, comprise credit facilities and our Senior Subordinated Notes as well as cash and short-term deposits. We have various other financial instruments, such as accounts receivable and accounts payable, which arise directly from our operations. We make use of various financial instruments under a financial policy approved by our board of directors. We use derivative financial instruments to reduce exposure to fluctuations in foreign exchange rates and interest rates in certain limited circumstances described below. While these derivative financial instruments are subject to market risk, principally based on changes in currency exchange and interest rates, the impact of these changes on our financial position and results of operations is generally offset by a corresponding change in the financial or operating items we are seeking to hedge. We follow a strict policy that prohibits trading in financial instruments other than to acquire and manage these hedging positions.
The principal risks arising from our financial instruments are interest rate risk, liquidity risk, foreign currency risk and credit risk. Our board of directors reviews and approves policies designed to manage each of these risks, which are summarized below. We also monitor the market-price risk arising from all financial instruments. The interest rate risk to which we are subject at year end is discussed below. Our accounting policies for derivative financial instruments are set out in our summary of significant accounting policies at Note 1 to our consolidated financial statements included elsewhere in this prospectus.
Interest rate risk
Our exposure to market risk for changes in interest rates relates primarily to our long-term debt obligations.
Under our hedging policy, we seek to maintain approximately 40% to 60% of our debt in the form of fixed-rate obligations, either directly or through application of floating-to-fixed interest rate swap agreements that effectively fix the interest rate payable on all or a portion of our floating rate debt obligations.
The following table illustrates the sensitivity to a change of 100 basis points in interest rates, with all other variables held constant, of our earnings before tax (through the effect on floating rate borrowings).
| Year Ended December 31, | ||||||
| 2009 | 2008 | |||||
| (U.S. dollars in millions) | ||||||
| U.S. dollar ($) borrowings |
$ | 0.6 | $ | 2.4 | ||
| Canadian dollar (CAD) borrowings |
1.4 | 1.6 | ||||
| $ | 2.0 | $ | 4.0 | |||
Foreign currency risk
Because we conduct our business on an international basis in multiple currencies, we may be adversely affected by foreign exchange rate fluctuations. Although we report financial results in U.S. dollars, a substantial portion of our net sales and expenses are denominated in currencies other than the U.S. dollar, particularly the
60
Table of Contents
euro, the Canadian dollar and European currencies other than the euro, including British pounds sterling. Fluctuations in exchange rates could therefore significantly affect our reported results from period to period as we translate results in local currencies into U.S. dollars.
In addition, there are certain situations where we incur costs in currencies other than those currencies in which we sell products and services and record net sales; however, these exposures are typically of short duration and not material to our overall results. In any event, we tend to hedge this transaction risk either through specific hedges for significant transactions or through hedging on a portfolio basis to address currency transaction mismatches imbedded in the large number of smaller transactions. We have not used derivative instruments to hedge the translation risk related to equity, intercompany loans of a permanent nature, or earnings of foreign subsidiaries.
The following table illustrates the sensitivity to certain changes in the Euro and Canadian dollar exchange rate on the U.S. dollar with all other variables held constant, of our earnings before tax and equity. The rates used for this analysis are reviewed and updated each year. The rates represent the average exchange rate volatility experienced in the year, which we consider a reasonable benchmark for future volatility.
| Year ended December 31, |
Increase/decrease in U.S. dollar rate |
Effect on income before tax |
Effect on equity | ||||||||
| (Dollars in millions) | |||||||||||
| 2009 |
+8 | % | $ | 1.3 | $ | 57.2 | |||||
| -8 | % | (1.3 | ) | (57.2 | ) | ||||||
| 2008 |
+6 | % | $ | 0.4 | $ | 23.5 | |||||
| -6 | % | (0.4 | ) | (23.5 | ) | ||||||
Product price risk
Our business model is to buy and sell at “spot” prices in quantities approximately equal to estimated customer demand. We do not take significant “long” or “short” positions in the products we sell in an attempt to speculate on changes in product prices. As a result, we are not significantly exposed to changes in product selling prices or costs and our exposure to product price risk is not material. Because we maintain inventories in order to serve the needs of our customers, we are subject to the risk of reductions in market prices for chemicals we hold in inventory, but we actively manage this risk on a centralized basis and have reduced our exposure by reducing the number of days sales held in inventories by improving sales forecasting and reducing the period of projected sales for which inventories are held, as well as lowering the amount of slow moving and older inventories.
Credit risk
We have a credit policy in place and monitor exposure to credit risk on an ongoing basis. We perform credit evaluations on all customers requesting credit above a specified exposure level. We generally do not require collateral with respect to credit extended to customers but instead will not extend credit to customers about which we have substantial concerns and will deal with those customers on a cash basis. We typically have limited risk from a concentration of credit risk as no individual customer represents greater than 5% of the outstanding accounts receivable balance.
Investments, if any, are only in liquid securities and only with counterparties with appropriate credit ratings. Transactions involving derivative financial instruments are with counterparties with which we have a signed netting agreement and which have appropriate credit ratings. Management does not expect any counterparty to fail to meet its obligations.
Liquidity risk
Our objective is to maintain a balance between continuity of funding and flexibility through the use of bank overdrafts, short-term bank loans, and financing under the terms of our principal credit facilities.
61
Table of Contents
The tables below summarize the maturity profile of our financial liabilities based on contractual undiscounted payments.
| Total | Less than 1 year |
1 to 3 years |
4 to 5 years |
After 5 years | |||||||||||||
| (in millions) | |||||||||||||||||
| At December 31, 2009: |
|||||||||||||||||
| Long-term debt |
$ | 2,032.4 | $ | 125.8 | $ | 64.7 | $ | 1,241.7 | $ | 600.2 | |||||||
| Interest expense |
703.9 | 122.4 | 255.5 | 272.1 | 53.9 | ||||||||||||
| Long-term debt payable to stockholders |
848.1 | — | — | — | 848.1 | ||||||||||||
| Interest expense payable to stockholders |
4.6 | 0.8 | 1.5 | 1.5 | 0.8 | ||||||||||||
| Derivatives |
(2.6 | ) | 6.2 | (8.8 | ) | — | — | ||||||||||
| Lease and rental commitments |
229.3 | 50.4 | 71.9 | 40.4 | 66.6 | ||||||||||||
| Total |
$ | 3,815.7 | $ | 305.6 | $ | 384.8 | $ | 1,555.7 | $ | 1,569.6 | |||||||
| At December 31, 2008: |
|||||||||||||||||
| Long-term debt |
$ | 2,348.2 | $ | 60.3 | $ | 64.1 | $ | 657.2 | $ | 1,566.6 | |||||||
| Interest expense |
834.7 | 129.4 | 257.6 | 265.8 | 181.9 | ||||||||||||
| Long-term debt payable to stockholders |
734.5 | — | — | — | 734.5 | ||||||||||||
| Interest expense payable to stockholders |
6.5 | 0.9 | 1.9 | 1.9 | 1.8 | ||||||||||||
| Derivatives |
96.1 | 52.0 | 44.1 | — | — | ||||||||||||
| Lease and rental commitments |
195.5 | 45.2 | 63.8 | 32.4 | 54.1 | ||||||||||||
| Total |
$ | 4,215.5 | $ | 287.8 | $ | 431.5 | $ | 957.3 | $ | 2,538.9 | |||||||
Critical Accounting Policies
General
Our Management’s Discussion and Analysis is based on our consolidated financial statements, which have been prepared in accordance with U.S. GAAP. These financial statements reflect a number of significant estimates that we make based on historical experience and on other judgments and assumptions that we believe are reasonable under the circumstances. The results of these estimates, judgments and assumptions form the basis for our determinations as to the carrying values of assets and liabilities that are not readily apparent from other sources. Actual results may differ from these estimates under different assumptions or conditions.
We consider an accounting policy to be critical if that policy requires that we make an accounting estimate based on assumptions about matters that are highly uncertain at the time we make that estimate and if different estimates that we could reasonably have used or changes in accounting estimates that are reasonably likely to occur could materially affect our consolidated financial statements. We believe that the following critical accounting policies reflect our more significant estimates and assumptions used in the preparation of our consolidated financial statements. Our significant accounting policies are described in Note 1 to our consolidated financial statements included elsewhere in this prospectus.
Revenue Recognition
We generally recognize net sales when persuasive evidence of an arrangement exists, products are received by, or services are provided to, customers, the sales price is fixed or determinable and collectability is reasonably assured. Our net sales primarily include product sales, billings for freight and handling charges and fees earned for services provided, net of any discounts, returns and customer rebates. We recognize product sales and billings for freight and handling charges when they are considered delivered to the customer under the terms of the sale. Fee revenues are recognized when services are completed. Our sales, principally in Canada, to customers in the agriculture end-market often provide for a form of inventory protection through credit and
62
Table of Contents
re-bill as well as understandings pursuant to which certain price changes from chemicals producers may be passed through to the customer. These arrangements require us to make estimates of potential returns of unused chemicals as well as the extent to which pricing may vary over the course of the growing season in order to determine our net sales for a particular period.
Supplier Incentives
We have arrangements with a number of key suppliers that provide for financial incentives that we earn by meeting certain volume purchase thresholds. We account for these incentives as a reduction of our reported cost of goods sold. In order to record these incentives throughout the year, we estimate the amount of incentives we expect to receive in order to record our chemicals purchases at prices reflecting these estimates. Because our right to receive these incentives will depend on our sales for the entire year, our accounting estimates depend on our ability to forecast our annual purchases accurately which ultimately will vary depending on our customers’ demand and consumption patterns which may be independent of our performance as a distributor.
Goodwill Impairment
We review goodwill at least annually for impairment. In testing for a potential impairment of goodwill we (1) allocate goodwill to our reporting units to which the goodwill relates; (2) estimate the fair value of these reporting units; and (3) determine the carrying value of these reporting units. If the estimated value of a reporting unit is less than its carrying value, we then estimate the fair value of all identifiable assets and liabilities of the reporting unit in a similar manner to that used for a business acquisition. Only after this process can we determine the amount, if any, of goodwill impairment.
This process can be subjective and requires significant judgments at several points during the analysis. In estimating the fair value of a reporting unit for the purposes of our annual or other analysis, we make estimates and judgments about future cash flows of the reporting unit and these estimates and judgments are subject to significant variability based on expectations as to market conditions as well as our own ability to execute on our strategic plans.
Long-lived Assets
We review our long-lived assets, including property and equipment and identifiable intangibles, for impairment when changes in circumstances indicate that we may not realize indicated cash flows in excess of the carrying amounts of such assets. Determining that such events or changed circumstances have occurred is subjective and requires that we exercise judgment including as to the determination of estimated future cash flows and the allocation of those cash flows among the assets generating revenues. Although these estimates are based on assumptions consistent with our business and financial planning, we must still exercise significant judgment in estimating the cash flows attributable to a long-lived asset over its estimated remaining useful life. These estimates could change significantly in the future and, as a result the carrying amount of our long-lived assets could be reduced in the future through impairment charges. Changes in estimated future cash flows could also shorten the estimated useful lives of our long-lived assets.
Environmental Liabilities
We record environmental liabilities for obligations and losses principally related to compliance with various environmental laws and regulations that require environmental assessment or remediation efforts. We have a number of sites with active remediation obligations. These liability reserves typically represent estimated costs for investigation, clean up and remediation that we believe are probable and can be reasonably estimated. In addition, our determination as to whether a loss is probable may change, particularly as new facts emerge as to the nature or extent of any non-compliance and the costs of remediation. Our reserves are also subject to numerous uncertainties that affect our ability to accurately estimate our costs, or our share of costs if multiple
63
Table of Contents
parties are responsible. These uncertainties involve the legal, regulatory and enforcement parameters governing environmental assessment and remediation, the nature and extent of contamination at these sites, the extent of clean up and remediation efforts required, the choice of remediation and, in the case of sites with multiple responsible parties, the number and financial strength of other potentially responsible parties.
Accounts Receivable
We maintain allowances for doubtful accounts for estimated losses resulting from the inability of customers to pay our invoices in full. We regularly review the adequacy of our allowance for doubtful accounts based on updated information, including our customers’ prior payment practices. Certain accounts are assessed individually based on all relevant factors, including current ability to pay. Our judgments about our customers’ ability to pay amounts owed to us could change significantly if their financial conditions change or economic conditions deteriorate.
Income Taxes
We recognize deferred tax assets and liabilities for the expected tax consequences of temporary differences between the tax bases of assets and liabilities and their reported amounts using enacted tax rates in effect for the year the differences are expected to reverse. In evaluating our ability to recover our deferred tax assets we consider all available positive and negative evidence including our past operating results, the existence of cumulative losses in past fiscal years and our forecast of future taxable income in the jurisdictions in which we have operations.
We have placed a valuation allowance on certain deferred tax assets and our net operating loss carry forwards. We intend to maintain the valuation allowances until sufficient positive evidence exists to support the reversal of the valuation allowances. An increase in the valuation allowance would result in additional expense in such period. We make estimates and judgments about our future taxable income that are based on assumptions that are consistent with our plans and estimates. Should the actual amounts differ from our estimates, the amount of our valuation allowance could be materially impacted.
New Accounting Pronouncements
In January 2010, the Financial Accounting Standards Board, or FASB, issued new accounting guidance on improving disclosures about fair value measurements. The new accounting guidance requires additional disclosures for all levels of fair value measurements as well as clarification for existing disclosures. Except for the additional Level 3 activity disclosures, this statement is effective for interim and annual reporting periods beginning after December 15, 2009, which is the first quarter of 2010 for us. The additional Level 3 activity disclosures will be effective for years beginning after December 15, 2010, and for interim periods within those years, which will be the first quarter of 2011 for us. The provisions of this statement did not have a material impact on our consolidated financial statements.
In June 2009, the FASB issued a new accounting statement that is designed to address the potential impacts on the provisions and application of previously issued guidance on the consolidation of variable interest entities as a result of the elimination of the qualifying special purpose entity concept. The new statement was effective as of the beginning of each reporting entity’s first annual reporting period that begins after November 15, 2009, for interim periods within that first annual reporting period, and for interim and annual reporting periods thereafter, which is the first quarter of 2010 for us. The provisions of this statement did not have a material impact on our consolidated financial statements.
In June 2009, the FASB issued a new accounting statement that defines the new GAAP hierarchy and explains how the FASB will use its Accounting Standards Codification as the sole source for all authoritative guidance. We adopted the Codification beginning in the third quarter of 2009. The adoption of the new statement has changed how we reference various elements of GAAP when preparing our financial statement disclosures but did not have an impact on our consolidated financial statements.
64
Table of Contents
In May 2009, the FASB issued a new accounting statement on subsequent events. The objective of this statement is to provide further guidance for disclosures relating to the type of subsequent event (recognized versus non-recognized) and to modify the definition of when a subsequent event occurred and the date through which a subsequent event has been evaluated by management. Our management defines the evaluation period for subsequent events as events or transactions that occurred after the balance sheet date, but before the issuance of our consolidated financial statements. We adopted the new statement effective from the second quarter of 2009 and did not have a material impact on our condensed consolidated financial statements. This new guidance requires the disclosure of the date through which an entity has evaluated subsequent events. We have included this disclosure in Note 20 to our consolidated financial statements included elsewhere in this prospectus.
In April 2009, the FASB issued new accounting guidance on interim disclosures about the fair value of financial instruments. The guidance enhances consistency in financial reporting by requiring qualitative and quantitative information about fair value estimates of all financial instruments on a quarterly basis. We adopted the expanded disclosure provisions effective from the second quarter of 2009 and are included in Note 18 to our consolidated financial statements included elsewhere in this prospectus.
In April 2009, the FASB issued new accounting guidance related to contingencies in a business combination, which amends and clarifies previously issued accounting rules, that require measurement of fair value at the acquisition date if fair value can be reasonably determined and provides guidance on how to make that determination. It also amends the subsequent measurement and disclosure requirements for assets and liabilities arising from contingencies in a business combination. We adopted the new guidance effective from the beginning of 2009. The provisions of the new accounting guidance did not have a material impact on our consolidated financial statements.
In December 2008, the FASB issued new accounting guidance related to an employer’s disclosures about plan assets of a defined benefit pension or other postretirement plans. The new guidance includes a technical amendment that requires disclosure of the net periodic benefit cost for each annual period for which a statement of operations is presented. We adopted the new guidance effective from 2009 and the new disclosures are included in Note 14 to our consolidated financial statements included elsewhere in this prospectus.
In December 2007, the FASB issued a new accounting statement on business combinations. This statement establishes principles and requirements for how an acquirer recognizes and measures in its financial statements the identifiable assets acquired, the liabilities assumed, any non-controlling interest in the acquiree and the goodwill acquired. It also establishes disclosure requirements which will enable users to evaluate the nature and financial effects of the business combination. We adopted this statement effective as of the beginning of 2009. The provisions of this statement did not have a material impact on our consolidated financial statements.
In September 2006, the FASB issued new accounting and disclosure guidance which defines fair value, establishes a framework for measuring fair value in generally accepted accounting principles, and expands disclosures about fair value measurements. This guidance applies whenever other accounting standards require or permit assets or liabilities to be measured at fair value but does not expand the use of fair value to new accounting transactions and does not apply to pronouncements that address share-based payment transactions. We adopted the new guidance for our financial assets and liabilities effective from January 1, 2008 and for our nonfinancial assets and liabilities, which include those measured at fair value in goodwill and indefinite lived intangible asset impairment testing, and assets acquired and liabilities assumed in a business combination, on January 1, 2009. The adoption of the new guidance did not have a material impact on our consolidated financial statements; however, it did affect how we measured the fair value of goodwill and indefinite lived intangible assets during the annual impairment testing.
65
Table of Contents
According to an independent study published by the Boston Consulting Group in January 2010, the global chemicals industry represents over $2.9 trillion in annual consumption. Approximately $170 billion of this demand in 2008 was channeled through more than 10,000 independent chemicals distributors such as Univar, and during the period from 2006 through 2008, our industry grew on average 4% per annum greater than the rate of growth in chemicals consumption and underlying prices. The chemicals production and distribution industries are both highly fragmented, with more than 100,000 chemicals producers supplying chemicals utilized in manufacturing over 100,000 products in a diverse range of end markets. In order to supply the diversity of chemicals required in manufacturing these products, large chemicals producers typically utilize a combination of direct and independent distribution, depending on the chemical properties of their products and the requirements of the customer. Key distribution markets for chemicals are North America (the United States and Canada), Europe, Latin America and the Asia-Pacific region, with Asian markets having grown more rapidly in recent years, predominantly driven by demand from China and India coupled with the migration of chemicals production from North America and Europe to benefit from lower production costs and increasing demand in these regions. Growth in emerging markets, such as China and Brazil, underscores an increasing market trend as chemicals consumption is highly correlated with industrial development and increasing standards of living. With compound annual growth of 17.3% in the years 2006 through 2008, the Asia-Pacific region significantly outpaced Europe and North America, with compound annual growth of 6.3% and 8.4%, respectively, over the same period.
| Global Chemicals Demand | Chemicals Distribution Market | |
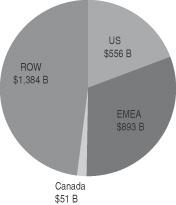
|
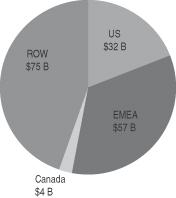
| |
| Source: Boston Consulting Group independent study (January 2010), converted at 2008 average exchange rate of 1.4708 USD/EUR. | ||
As measured by volume, most chemicals are delivered in bulk by pipeline, tank, ship or rail by chemicals producers directly to customers with direct supply accounting for 90% of total global chemicals distribution. Direct supply is likely to continue to be the predominant method of distribution for large customers of commodity chemicals, whose purchases account for the bulk of producers’ output and provides the necessary baseload for their plants. However, some chemicals producers find it difficult to efficiently and cost-effectively sell and deliver less than bulk delivery quantities, particularly where delivery is distant from their warehouses and production facilities; thus purchasing volumes from smaller customers are often insufficient to generate the required profitability for large producers. In addition, chemicals producers that produce relatively few products or at relatively few locations may not be able to support a geographically dispersed distribution network. Rapidly growing markets, such as China and Brazil, have a significantly larger share of smaller customers, so that differentiated distribution models are needed.
66
Table of Contents
The need for differentiated distribution models has provided independent chemicals distributors such as Univar with a growing market opportunity to serve small- and medium-sized customers. While customer size is an important factor globally, in mature markets such as North America and Europe, chemicals producers typically have been looking for greater cost efficiency by reducing and refocusing their direct sales efforts. In emerging markets, chemicals producers based in North America and Europe typically lack the critical scale in sales and purchasing volumes needed to justify direct sales. This outsourcing process, which provides independent chemicals distributors with an increasing share of distribution solutions, including value-added services, is expected to continue.
Chemicals production and end user markets continue to be both more highly fragmented than the chemicals distribution industry. This “hour-glass” structure creates an opportunity for a large and diverse group of chemicals producers to funnel distribution of a wide range of different chemicals through a small number of regional or global independent chemicals distributors to reach a larger number of end users than they could reach cost efficiently on their own. Customers are thus able to access a wider range of chemicals more efficiently through an independent distributor than they can access directly from producers. Independent chemicals distributors such as Univar provide a pivotal role in the middle of this supply chain and facilitate the distribution of chemicals products from chemicals producers by repackaging, aggregating demand for chemicals and providing other value-added services before ultimately selling products to a diverse range of customers looking for a “one-stop shop” coupled with specialized product expertise and value-add services. As a result, chemicals distributors have the opportunity to go beyond the conventional role of middleman and add significant value for both suppliers and customers by offering technical expertise and supply chain management.
Diversified, global independent distributors benefit from the overall stable demand for commodity and specialty chemicals despite any volatility in demand for particular products and have historically been able to maintain relatively stable gross profits per ton by passing through price changes to customers.
Significant Opportunities for Industry Growth and Market Share
In recent years, chemicals producers have increasingly outsourced more of their distribution and supply to independent chemicals distributors in an effort to reduce marketing, selling and technical support expenses, particularly in connection with the servicing of smaller customers, sales areas and countries, which allows producers to better focus their efforts on chemicals manufacturing. Chemicals producers, who have historically distributed chemicals directly to customers in close proximity to their production points, bulk terminals and warehouse sites, have also increasingly consolidated and shifted production to lower-cost regions around the world. In connection with establishing operations in these lower-cost locations, rather than developing their own customer contacts and distribution networks, chemicals producers are increasingly turning to independent chemicals distributors both to outsource their distribution and logistics in these new locations and to take over distribution to the customers they previously direct-serviced from their old locations. As a result of these two important trends. During the period from 2006 through 2008, our industry grew on average 1.5% per annum greater than the combined rate of growth in industrial output, chemicals consumption and underlying prices.
The fragmented nature of the chemicals distribution industry also serves as an opportunity and catalyst for growth. Currently, the chemicals distribution industry is highly fragmented, as the top ten companies accounted for less than 25% of the global independent chemicals distribution market in 2008, the most recent year for which data is available, although the United States is less fragmented than Europe, Asia and the rest of the world. Except for us and a handful of other large international companies, most independent chemicals distributors operate locally or regionally, and many of them specialize in a small number of specific products or product families which are sold in smaller quantities. As a result, opportunities for consolidation exist, particularly for well-established, global companies, who can leverage scale to further drive growth. Because smaller independent chemicals distributors may be less able to cope with increasing costs, environmental and other regulations and competition from larger global distributors, we believe that the longer-term structural
67
Table of Contents
trends emphasizing outsourcing and specialization on the supplier side and one-stop shopping on the customer side will reinforce the hour-glass market structure and enhance the value proposition of large, diversified global independent chemicals distributors.
Mergers and acquisitions play an important role within the chemicals distribution landscape. First, efficiencies in chemicals distribution are achieved by operating on a large scale and dense route structure. Second, chemicals suppliers increasingly expect independent chemicals distributors to have both strong regional and global capabilities, along with the critical mass to invest in market development, technical expertise and information-exchange systems. Third, customers increasingly expect chemicals distributors to offer broad product bundles and to set up and operate a global network for sourcing and delivery. We believe these factors create important opportunities for improving margins and profits through selective acquisitions.
Scale and Geographic Scope
Scale is an important driver of growth and catalyst for consolidation in the chemicals distribution market. Large-scale independent distributors can leverage significant relationships with both suppliers and customers in order to build the necessary geographic footprint, sales coverage and expertise required to cater to a global industry with diverse and specialized product offerings. Larger independent distributors can frequently better leverage economies of scale and cost structures compared to smaller players or new entrants to the market and typically are able to benefit from volume-based pricing with key suppliers.
Chemicals distribution is an increasingly global industry. However, trends in distribution vary by region. For example, in mature industrial manufacturing markets such as North America and Europe, the top five independent chemicals distributors had significantly higher market share in 2008 than in emerging markets such as Latin America or the Asia-Pacific region. In emerging market countries such as China and Brazil, a higher proportion of customers are small compared to mature economies.
| • | North America: By far the most mature and penetrated market for chemicals distributors and the least fragmented, the North American chemicals distribution market represented $36 billion of chemicals consumption in 2008. The top five independent chemicals distributors in this market collectively held an estimated market share of 48.4% in 2008. |
| • | United States: The U.S. chemicals distribution market represented $32 billion of chemicals consumption in 2008. Key end markets in the United States include household and industrial cleaning, or HIC, paints and coatings, energy, food, personal care and pharmaceutical. |
| • | Canada: In 2008, the Canadian chemicals distribution market represented over $4 billion of chemicals consumption. Key end markets in Canada include forestry, mining, energy and pharmaceutical. |
| • | Europe: The largest regional market for chemicals distributors, the European chemicals distribution market represented $54 billion of chemicals consumption in 2008. Within this highly fragmented market, the top five independent chemicals distributors collectively held an estimated market share of 25.8%. Key European end markets consist of paints and coatings, water treatment, chemicals manufacturing, food, pharmaceutical and personal care. |
| • | Rest of World: Emerging markets in particular are highly fragmented and are run by a large number of local companies and family owned businesses. Most independent chemicals distributors in these regions handle one or a few product lines and/or focus on a specific market. Countries and regions such as Brazil, Mexico and Southeast Asia represent key opportunities for potential growth where customers and suppliers alike are seeking independent chemicals distributors that have economies of scale, carry larger product portfolios, have product and industry expertise and are able to offer value-added services. |
68
Table of Contents
| • | Asia-Pacific: Accounting for one-third of global chemicals consumption, led by China, whose consumption is roughly equal to that of the United States, the Asia-Pacific chemicals distribution market represented $46 billion of chemicals consumption in 2008. Robust growth in industrial output and chemicals consumption coupled with a large number of small customers creates an attractive environment for independent chemicals distributors in the Asia-Pacific region, where the top five distributors are all local or regional rather than global players and had a collective market share of only 9.7% in 2008. With its rapid growth in consumption and highly fragmented and relatively underdeveloped distribution market, the Asia-Pacific region represents a significant opportunity for market penetration compared to other regions of the world. Key end markets in Asia-Pacific include paints and coatings, food, personal care, pharmaceutical and HIC. |
| • | Latin America: The Latin American chemicals distribution market represented $17 billion of chemicals consumption in 2008, with $7 billion of that consumption generated by Brazil. The independent chemicals distribution market in Brazil is very well established, but is highly fragmented, and is made up of a few large companies and many smaller, privately owned and family operated distributors. Key end markets in Latin America consist of paints and coatings, rubber and plastics, personal care and chemicals manufacturing. |
69
Table of Contents
Overview
Founded in 1924 and headquartered in Redmond, Washington, we are one of the world’s leading global distributors of commodity and specialty chemicals, with a #1 market position in both the United States and Canada and a #2 market position in Europe. For the year ended December 31, 2009, we generated $7.2 billion in net sales from the distribution of approximately 5.4 million metric tons of chemicals. We operate a network of over 170 distribution facilities in North America, Europe, the Asia-Pacific region and Latin America, with additional sales offices located in Eastern Europe, the Middle East and Africa. We distribute over 11,000 products in more than 110,000 stockkeeping units, or SKUs, to over 80,000 customers with more than 250,000 customer delivery locations in over 100 countries. As we have grown over the last nine decades, we have refined our core competencies in the sales and marketing of chemicals, logistics, product stewardship and technical expertise to become a strategic resource to both our customers and the chemicals producers whose products we distribute.
Our extensive distribution network and comprehensive product portfolio enables us to offer customers a “one-stop” resource for their chemicals needs. Our extensive footprint of facilities and transportation assets dedicated to, and licensed and permitted for, the storage and transportation of chemicals in compliance with the extensive and complex safety, health and environmental regulations applicable throughout the regions in which we operate provides a competitive advantage. We also provide our customers with access to an industry-focused salesforce and the technical expertise to customize products and services to fit our customers’ particular needs. Our ability to offer customers value-added services such as repackaging, blending and mixing, technical support, labeling, inventory management, “just-in-time” delivery and vendor rationalization programs has enabled us to build a loyal customer base. We source chemicals from more than 2,500 producers, including many of the premier global chemicals manufacturers. Our scale, geographic reach, diversified distribution channels and industry expertise enable us to develop strong, long-term relationships with our suppliers, allowing us to integrate our service and logistics capabilities into their business processes and to promote collaboration on supply chain optimization, marketing and other revenue enhancement strategies. The producers we work with also benefit from the insight we provide into customer buying patterns and trends. Our scale and close relationships with chemicals producers often enables us to benefit from attractive pricing for our chemicals purchasing.
Our sales strategy is focused on population-driven industries, including paints and coatings, energy, food, HIC, pharmaceutical and personal care, none of which accounts for more than 11% of our net sales. We believe that this strategy, combined with our diversity across products, customers, suppliers and geography, mitigates the effects on our business of volatility in any one region or end market. The following charts illustrate the breakdown of our 2009 net sales to external customers by region and end market:
| 2009 Net Sales by Region (dollars in millions) |
2009 Net Sales by End Market | |
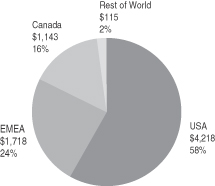
|
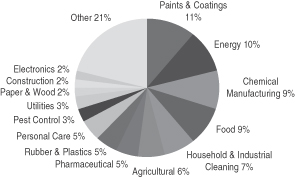
|
70
Table of Contents
We maintain strong relationships with a range of customers, from small and medium-sized businesses to global industrial customers, including 3M, Church & Dwight, Colgate, ConocoPhillips, Dow Corning, Halliburton, Henkel and Perrigo. No one customer accounted for more than 2% of our consolidated net sales for the year ended December 31, 2009.
Our business is organized and managed in four geographical segments: the United States, Canada, EMEA (Europe, the Middle East and Africa) and the Rest of World.
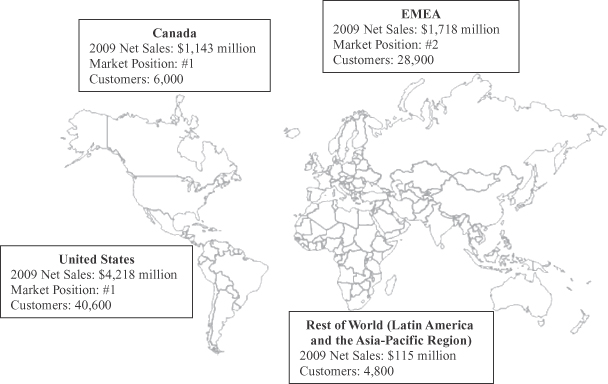
United States
With a #1 market position, our U.S. operations are comprised of 88 distribution facilities with nearly five million square feet of storage space, 29 million gallons of storage capacity, more than 2,100 tractors, tankers and trailers, seven rail/barge terminals and five deep sea terminals. We have built our U.S.-based business through a combination of organic growth and acquisitions. Key acquisitions in our history include McKesson Chemical in 1986, Ellis & Everard in 2001 and Chemcentral in 2007. We divide our U.S. operations into five regions—North Central, North East, South Central, South East and Western—while providing centrally managed services such as procurement, accounting, legal, finance and human resources. While the major end markets we serve vary based upon general economic conditions in the United States, in recent years strongest demand has come from HIC, paints and coatings, food, energy, personal care and pharmaceutical. Historically, we have supplied a significant amount of commodity and specialty chemicals to the construction and paper and wood products end markets. We expect all of these markets to benefit from any economic recovery in 2010 and beyond. Key products distributed in the United States in recent years include caustic soda, sodium hypochlorite, propylene glycol, isopropyl alcohol and performance polymers.
Canada
Our Canadian operations maintain the #1 market position, supported by 25 distribution facilities with over 1.3 million square feet of storage space, 21 million gallons of storage capacity, a fleet of 54 tractors, tankers and trailers, one deep sea terminal and one rail/barge terminal. We entered the Canadian market in 1950 by
71
Table of Contents
acquiring Industrial Materials Ltd. in Vancouver. In 1973, we acquired McArthur Chemicals, adding tank farms and warehouses in Winnipeg, Toronto, Montreal and the Atlantic provinces to provide nationwide coverage of the Canadian industrial market. We divide our Canadian operations in two regions: Western Canada, where we focus primarily on the energy and agriculture end markets, and Eastern Canada, where we focus primarily on the HIC, paints and coatings, food, energy, personal care and pharmaceutical end markets. Key products distributed in Canada include caustic soda, methanol, glycols, epoxy resins and crop protection.
EMEA
With the #2 market position in Europe, our operations include 56 distribution facilities with approximately 1.9 million square feet of storage space in 25 countries, 31 million gallons of tank storage capacity and 138 tractors, tankers and trailers. We established our European operations in 1991 with the acquisition of the chemicals distribution interests of the Swedish Beijer Group (Beijer Industrial Distribution), serving the United Kingdom, the Nordic countries, Switzerland and Italy. Between 1991 and 1996, we made a number of acquisitions of regional European distributors and our 2001 acquisition of Ellis & Everard brought us additional facilities in the United Kingdom and Ireland. We are currently implementing a pan-European strategy through organic initiatives and future acquisitions to consolidate our European operations, including our information technology systems, raw materials procurement, logistics, route operations and the management of supplier relationships in order to benefit from economies of scale and improve cost efficiency. We recently agreed to acquire Quaron Group, a chemicals distribution business operating in Belgium, France and The Netherlands, to expand our distribution capabilities throughout Europe and to provide us with the opportunity to improve regional efficiencies. Primary end markets in Europe include paints and coatings, food, rubber and plastics, chemicals manufacturing, pharmaceutical, personal care and HIC. Key products distributed in Europe include solvents, glycols, inorganics and surfactants.
In addition to our distribution network in Europe, our EMEA segment also includes five sales offices in the Middle East and Africa.
Rest of World
Our global footprint also includes five distribution sites in Central and South America and five distribution sites in the Asia-Pacific region, including three sales offices, four distribution warehouses and a blending facility in China, where we have had a presence and sourced product locally for over 30 years and acquired a small niche distributor in 2006. From our operations in China we export to South Korea, Japan, Taiwan, Hong Kong, the Philippines, Taiwan, Malaysia, Indonesia, Singapore and India. Our International Sourcing Group is based in Shanghai, China, with additional agents in India and Southeast Asia, and provides us with the capability to source chemicals from these regions as well as access to chemicals that are not produced in North America or Europe. Our Australia business consists primarily of the distribution of solvents and alcohols and ketones to the agriculture and paint and coatings markets.
Competitive Strengths
As our company has grown, we have continued to refine our business model, developing numerous competitive strengths and core competencies in sales and marketing, logistics, product stewardship, and technical expertise, enabling us to become an important resource to both our suppliers and customers and to build and maintain leading market positions in many of the key regions and end markets that we serve. Our competitive strengths include:
| • | Leading global market positions. With $7.2 billion in net sales and 5.4 million metric tons of chemicals distributed for the year ended December 31, 2009, we are one of the world’s leading independent chemicals distribution companies, with a #1 market position in both the United States |
72
Table of Contents
| and Canada and a #2 market position in Europe. Our extensive global footprint enables us to serve more than 80,000 customers with over 250,000 customer delivery locations in over 100 countries. We also continue to focus on increasing our market share through organic growth, marketing alliances and strategic acquisitions throughout established and high-growth emerging markets, such as the Asia-Pacific region and Latin America. |
| • | Extensive global distribution network. We operate one of the most extensive chemicals distribution networks in the world, comprised of over 170 distribution facilities, more than 80 million gallons of storage capacity, nearly 2,400 tractors, tankers and trailers, over 600 railcars, eight rail/barge terminals and six deep sea terminals. This broad footprint enables us to leverage best practices across multiple regions. Our purchasing power allows us to maintain a competitive advantage over local and regional chemicals distributors and efficiently serve customers in more than 100 countries throughout the world, including difficult to reach areas such as the oil sands regions of Northern Canada. Our global distribution platform also creates significant value for both our suppliers and customers through the combination of our comprehensive inventory, electronic ordering and shipment tracking, “just-in-time” delivery, centralized order handling and fulfillment and access to networked inventory sourcing. |
| • | Established scale and operational efficiencies. We believe that the scale of our global distribution network and the breadth and depth of our product offering and value-added service portfolio provide us with significant operational efficiencies, especially in our established markets. Our geographic reach also offers significant operational efficiencies in areas such as global procurement strategies, purchasing scale and supplier relationships, which often enable us to realize volume-based discounts from our suppliers. As one of the world’s largest independent chemicals distributors, we are able to leverage our cost structure through developed logistical networks by aggregating demand and implementing best practices to operate with increasing efficiency as we expand into new markets. We also benefit from a “hub and spoke” distribution network in many of our markets, providing multiple touchpoints for efficient delivery. |
| • | Long-standing, strong relationships with major chemicals producers. We have developed and continue to cultivate strong, mutually beneficial relationships with more than 2,500 chemicals producers, including BASF, Dow Chemical, Dow Corning, DuPont, Eastman Chemical, ExxonMobil Chemical, LyondellBasell, Mitsubishi and Syngenta. We believe that chemicals producers value our distribution network, product stewardship and industry expertise, as we are able to provide them with more efficient and effective access to smaller customers whose purchasing patterns make them more difficult and costly for producers to serve directly. Our long-standing supplier relationships not only allow us often to purchase chemicals on favorable market terms but also often afford us preferred status, particularly during periods of market dislocation, helping ensure that we are able to source scarce products from multiple producers. |
| • | Broad product offering and value-added service portfolio. We provide a comprehensive portfolio of over 11,000 products, made up of more than 110,000 SKUs, to customers in a diverse range of industries. We also offer value-added services, including blending, mixing and repackaging chemicals in accordance with customer specifications, and procurement solutions that leverage our chemicals, supply chain and logistics expertise, networked inventory sourcing and supplier relationships. We provide our customers with a “one-stop shop” solution for their commodity and specialty chemicals needs and offer a reliable and stable source of quality products. |
| • | End market and product-specific expertise. Our end market and product-specific expertise enables us to work closely with our customers to identify and select chemicals to enhance the performance characteristics of our customers’ end products. For each of the principal end markets that we serve, we have teams of professionals with industry-specific expertise. For example, we |
73
Table of Contents
| have a food and beverage research and development team of research technicians who keep current with trends and new end product innovations in the food and beverage industry so that they can make chemicals product recommendations and assist customers in the industry with their own end product development. Our laboratory facilities also provide formulation support and analytical services for our customers. |
| • | Industry leading marketing supported by highly skilled salesforce. We operate one of the leading sales and marketing efforts in the chemicals distribution industry, focused on providing our customers with both regional and industry expertise. We believe our customers and suppliers value our sales and marketing teams, as we are able to provide them with insight into regional and local end market demand patterns and changing customer product preferences, which help our suppliers and customers better tailor their product portfolios and purchases. Our highly trained salesforce of nearly 2,400 professionals has the technical expertise to assist customers in the selection and application of commodity and specialty chemicals for their products and processes. Our experienced product management teams focus on the global market dynamics for some of the high-volume commodities chemicals that we supply. These teams provide our customers with insight into the key market drivers that impact pricing and availability, which is particularly important to our large purchasers of commodity chemicals whose operations often depend on the price and supply of these products. |
| • | Experienced management team with a proven track record. We are led by a committed and seasoned management team that has, on average, over 25 years of operating experience, including extensive experience in managing public companies. Our team has a proven track record of enhancing shareholder value by controlling costs, identifying and integrating strategic acquisitions and successfully operating throughout various economic cycles, including the recent global recession. John Zillmer, our Chief Executive Officer, has over 30 years of operating experience, most recently in the waste management industry, which, like the chemicals distribution industry, focuses on managing and achieving operational efficiencies in a sophisticated logistics environment. Our core team has successfully implemented sustainable operational initiatives and successfully integrated value-enhancing acquisitions, such as Chemcentral, despite challenging market conditions. |
Growth Strategy
We believe that we are well-positioned to capitalize on industry growth and market opportunities to expand our market share by focusing on expanding our scale and global infrastructure, while at the same time further cultivating our relationships with key suppliers and customers. We intend to capitalize on the growth of the global chemicals and chemicals distribution industries, and to continue to implement strategies to improve our operating margins. The key elements of our growth strategy are to:
| • | Enhance offerings in key industry and product areas. We seek to position ourselves as the market leader in select industry and product markets, particularly to customers that produce and sell population-driven products, including consumer goods. Because many of our suppliers and customers look for distributors with specialized industrial or product-specific expertise, we will continue to strengthen our technical knowledge and industry-specific expertise by expanding our product lines and our laboratory services, to become the preferred distributor for a broader range of chemicals producers and end markets. We also seek to offer our suppliers attractive supplemental distribution channels, such as our ChemPoint business, a leading web-based distributor of specialty and fine chemicals to smaller customers, principally in North America and Europe. |
| • | Leverage scale to capitalize on market opportunities. We intend to leverage our scale to capitalize on market opportunities as major producers outsource an increasing portion of their |
74
Table of Contents
| distribution operations. We believe that we are well-positioned to capture additional sales volume and grow organically at the expense of smaller competitors as we reinforce our position as a “one-stop” provider of chemicals to customers and related supply chain management services for chemicals producers. Our scale also positions us to target markets and customers that large chemicals manufacturers typically find more difficult and costly to serve. |
| • | Build on long-standing customer relationships to enter new markets. As many of our major customers enter new geographic markets, our long-standing relationships position us well to expand our own footprint to serve their chemicals needs at their new locations and to leverage these strong customer relationships to develop or improve our ties with chemicals manufacturers in these locations. |
| • | Capitalize on shifting of chemicals production to lower-cost and higher growth regions. We intend to capitalize on our extensive geographic footprint and long-standing supplier relationships as our suppliers shift production to lower-cost and higher growth regions. In markets where we have a distribution foothold, we plan to expand our market share by offering these producers access to our existing customer base. As we expand into new geographic markets, we plan to grow through consolidation of smaller regional and local distributors, as well as deepening our existing producer relationships by distributing chemicals from new production locations to customers in established markets. |
| • | Expand and deepen our supplier relationships. We intend to develop and cultivate new and existing long-term relationships with key chemicals producers by using our industry experience and broad geographic footprint to target chemicals producers with substantial logistics and distribution needs. We believe we can strengthen our supplier relationships by demonstrating our ability to reduce their overall costs, risks and operating complexity. We also seek to become better integrated into our existing suppliers’ businesses by identifying opportunities to provide additional value-added services and distribute a larger share of their chemicals production globally. |
| • | Implement further operating margin and operational excellence initiatives. We intend to continue to implement our current initiatives designed to improve gross margins through price discipline and the use of product and customer profitability tools, while also targeting operational excellence and efficiency. Some of these key initiatives include: |
| • | expanding use of our Economic Contribution Margin, or ECM, tool to identify pricing opportunities and profitability drivers; |
| • | optimizing our global sourcing and supply chain network; |
| • | leveraging our distribution network; |
| • | increasing salesforce efficiency; |
| • | improving sales management, price discipline and implementing additional cost control measures; and |
| • | focusing on working capital improvements through management of terms of sale, collection efforts and inventory management. |
| • | Pursue strategic acquisitions. We intend to pursue strategic acquisitions that complement our organic growth initiatives. Specifically, we seek acquisition opportunities that will: |
| • | strengthen our distribution network in existing markets, such as North America and Western Europe—for example, our 2007 acquisition of Chemcentral allowed us to increase market share |
75
Table of Contents
| and improve operational efficiencies in North America. We believe our pending acquisition of Quaron Group will allow us to expand our regional distribution capabilities in Europe and enable us to improve regional efficiencies; |
| • | expand our geographic footprint by providing us with either the opportunity to extend the reach of our existing distribution network into markets that are contiguous to those we already serve—for example by taking advantage of our growing network in Western Europe to expand into Central Europe; or |
| • | enable us to establish a presence in new geographic markets, particularly major emerging markets, such as Brazil, China and India. |
Products and End Markets
The main focus of our marketing approach is to identify attractive end user markets and strive to provide customers in those markets all of their commodity and specialty chemicals needs. We also offer value-added services, including repackaging, blending and mixing chemicals in accordance with customer specifications, as well as procurement solutions that leverage our chemicals, supply chain and logistics expertise, networked inventory sourcing and supplier relationships. We provide our customers with a “one-stop shop” solution for their commodity and specialty chemicals needs and offer a reliable and stable source of quality products.
We buy and inventory chemicals in large quantities such as barge loads, railcars or full truck loads from chemicals suppliers and we sell and distribute smaller quantities to our customers. Approximately 30% of the chemicals we purchase are in bulk form, and we repackage them into various size containers for sale and distribution.
Commodity chemicals currently represent and have historically represented the largest portion of our business by sales and volume. Our commodity chemicals portfolio includes acids and bases, surfactants, glycols, inorganic compounds, alcohols and general chemicals used extensively throughout hundreds of end markets. Since our 2007 acquisition of Chemcentral, we have continued to increase our specialty chemicals sales, which are an important, high-value, higher growth portion of the chemicals distribution market. We typically sell specialty chemicals in lower volumes but at a higher profit than commodity chemicals. While many chemicals producers supply these products direct to customers, there is an increasing trend toward outsourcing the distribution of these specialized, lower volume products.
We serve a diverse set of end markets and regions, with no end market accounting for more than 11% of our net sales over the past three years. Our most significant end markets in recent years have included paints and coatings, energy, chemical manufacturing, food and HIC.
We focus on population-driven industries. Our key global end markets include:
| • | Paints & Coatings: The paints and coatings industry is also one of our largest customer end markets. We sell solvents, resins, pigments and other thickeners used to make paints, inks, glues and other binders. We have a large team of industry and product specialists offering a diverse line of commodity and specialty paints and coatings products. Our product line includes solvents, epoxy resins, polyurethanes, titanium dioxide, fumed silica, esters, plasticizers, silicones and specialty amines. |
| • | Energy: Our strength in the energy sector comes from our expert team of chemicals and petroleum engineers and other professionals with many years of experience in the oil and gas industry. Our industry expertise coupled with laboratory services and product lines that are designed for use in refineries and gas processing plants make us a leading distributor to this industry. In this sector, we |
76
Table of Contents
| distribute caustic soda, absorbents, catalysts, fuel additives, gas treating amines, lubricants and heat transfer fluids. |
| • | Food: For the food and beverage industry, we inventory a diverse portfolio of commodity and specialty products that are sold as processing aids or food additives. We sell food ingredients such as texturants, thickeners, sweeteners, preservatives, leavening agents and glycerine, as well as texturizer and fat replacement products that include xanthan gum, carrageenan, cellulosics and pectin, we distribute emulsifier products that include glycerine, propylene glycol and lecithin and we distribute citric acid, an acidulant product, as well as alkalis. The major food and beverage markets we serve are meat processing, baked goods, dairy, grain mill products, processed foods, carbonated soft drinks, fruit drinks and beer. We manage our product portfolio to ensure security of supply, quality standards and cost competitiveness. We refresh our product offering with products that meet the key trends impacting the food industry. Our industry experts have developed marketing tools that simplify the ingredient selection process for our customers and provide product performance information and solutions. Our food and beverage team has created five new beverages and two nutrition bars that feature eight to 12 ingredients from our supplier portfolio. |
| • | HIC: The household and industrial cleaning, or HIC, industry, is made up of thousands of large and small formulators that require a multitude of chemical ingredients to make cleaning products and detergents for home and industrial use. We distribute chemicals manufactured by many of the industry’s leading producers of surfactants, emulsifiers, phosphates, fillers, fabric softeners, bleaching aides, chelants, acids, alkalis and other chemicals that are used in cleaning products. |
| • | Pharmaceutical: We are uniquely positioned in the industry due to the combination of our product portfolio, logistics footprint and customized solutions to meet the needs of a highly regulated industry. We represent the world’s leading excipient, solvent and active pharmaceutical ingredient producers as well as producers of chemicals used to support water treatment, filtering and purification systems, thus offering our customers the broadest product offering in the pharmaceutical industry. We sell active ingredients such as aspirin, ascorbic acid, caffeine and ibuprofen and excipients that include polysorbates, methylcellulose, stearyl alcohol and glycerol stearates. |
| • | Personal Care: We are a full-line distributor in the personal care industry providing a full array of commodity and specialty chemicals used in moisturizing lotions, shampoos, conditioners, body washes, toning, coloring, styling and many other consumable products for cleansing and beautifying. The chemicals that we distribute serve as active ingredients with functional properties in the formulation of personal care products. Some of our key suppliers and products are Dow Corning silicones, BASF UV absorbers, Stepan Chemical surfactants and emulsifiers and CP Kelco hydrocolloids, respectively. Business development specialists and industry specialists work with our customer formulators and assist them with their product innovations. |
In some geographic regions we target other end user markets in addition to those described above. For example, the water treatment industry is an important end market for our European operations, where we sell and distribute algae control, coagulants, corrosion inhibitors, disinfectants, odor control and other water treatment chemicals. Agriculture is an important end market for our Canadian operations, where we are a leading wholesale distributor of crop protection products to independent retailers and specialty applicators. We store and distribute horticultural products, fungicides and feed. We distribute products for some of the leading chemicals producers, including BASF, Bayer CropScience, Dow AgroSciences, DuPont, Monsanto and Nufarm. We also provide storage and logistics services for major crop protection companies, storing chemicals, feed grade materials, seed, equipment and parts. We also have blending and packaging capabilities.
Our Professional Products and Services (PPS) business is the United States’ largest distributor of pest control products and equipment to the pest management industry, supplying products to licensed applicators in
77
Table of Contents
the United States, Mexico and the Caribbean. We are actively involved in serving the public health, hay production, post-harvest commodity storage, animal production and dairy as well as turf and ornamental sectors of the pest control market. We have 60 centers across North America with on-staff entomologists who help customers design tailored solutions to meet their needs.
Value-Added Services
In addition to selling and distributing chemicals, we use our transportation and warehousing infrastructure and broad knowledge of chemicals and hazardous materials handling to provide important value-added services for our customers and suppliers. This intermediary role is increasingly important, in particular due to the recent trend of increased outsourcing of distribution by chemicals producers to satisfy their need for supply chain efficiency. These services include:
| • | Product availability and inventory management: We manage our inventory in order to meet customer demands on short notice whenever possible. Our key role in the supply chain to chemicals producers also enables us to obtain access to chemicals in times of short supply, when smaller chemicals distributors may not able to obtain or maintain stock. Further, our global distribution network permits us to stock products locally to enhance “just-in-time” delivery, providing outsourced inventory management to our customers. |
| • | Product specification and technical expertise: We partner with our customers in their production processes by employing a team of food technologists and chemicals and petroleum engineers who have the technical expertise to assist in the formulation of chemicals to meet specific customer performance requirements and provide customers with aftermarket support and consultation. |
| • | Blending and repackaging services: We provide our customers with a full suite of blending and repackaging services. Leveraging our technical expertise, we are able to utilize our blending and mixing capabilities to create specialty chemical formulations to meet specific customer performance demands. Additionally, we can fulfill small orders through our repackaging services, enabling customers to maintain smaller inventories. |
| • | ChemCare: Our ChemCare® waste management service collects both hazardous and non-hazardous waste products at customer locations in the United States and Canada, and then works with select partners in the waste disposal business to safely transport these materials to licensed third-party treatment, storage and disposal facilities. ChemCare reviews each waste profile, recommends disposal alternatives to the customer and offers transportation of the waste to the appropriate waste disposal company. Hazardous and non-hazardous waste management technologies provided from our approved treatment storage and disposal facility partners include recycling, incineration, fuels blending, lab packing, landfill, deepwell injection and waste to energy. ChemCare also assists in the preparation of manifests, labels and reporting requirements and provides on-site project management for tank cleaning projects and site cleanups. |
Suppliers
We source chemicals from many of the premier global chemicals manufacturers. Our largest suppliers are BASF, Dow Chemical, Dow Corning, DuPont, Eastman Chemical, ExxonMobil Chemical, LyondellBassell, Mitsubishi and Syngenta. We have both exclusive and nonexclusive arrangements with our suppliers, depending on the type of chemicals involved. We typically maintain relationships with multiple suppliers of commodity chemicals to protect against disruption in supply and distribution logistics as well as to maintain pricing discipline in our supply. Specialty chemicals, which often require more in-depth technical application knowledge, tend to be sourced on an exclusive basis. Maintaining strong relationships with suppliers is important to our overall success. Our scale, geographic reach, diversified distribution channels and industry expertise
78
Table of Contents
enable us to develop strong, long-term relationships with our suppliers, allowing us to integrate our service and logistics capabilities into their business processes, promoting collaboration on supply chain optimization, marketing and other revenue enhancement strategies. The producers we work with also benefit from the insight we provide into customer buying patterns and trends. Our scale and close relationship with chemicals producers often enables us to receive more attractive pricing terms for our chemicals purchasing. Chemicals producers have been using fewer independent distributors in an effort to develop more efficient marketing channels and to reduce their overall costs. More and more, chemicals producers are depending on the salesforces and infrastructure of independent chemicals distributors to efficiently market, warehouse and deliver their chemicals to end users.
Our base of more than 2,500 chemicals suppliers is highly diversified, with only Dow Chemical representing 11.8% of our 2009 chemicals spend, and no other chemicals supplier accounting for more than 5% of the total. Our 25 largest suppliers accounted for approximately 46% of our total chemicals spend in 2009. Our relationship with Dow Chemical extends over 60 years and we buy hundreds of products from Dow Chemical’s 23 different business units and plants around the world. We also have long-standing relationships with many of our other major suppliers including an over 60-year relationship with DuPont and an over 30-year relationship with each of Eastman Chemical, ExxonMobil Chemical, Occidental Chemical, PPG and Stepan.
We typically purchase our inventory through purchase orders rather than long-term contracts, although we have exclusive supply arrangements for certain specialty chemicals. We typically enter into framework supply contracts with key suppliers. These framework agreements generally operate on an annual basis without fixed pricing terms, although these framework agreements often include financial incentives if we meet or exceed specified purchase volumes. Once we purchase products, we ship them either directly to a customer or, more commonly, to one of our distribution centers.
Sales and Marketing
We organize our salesforce regionally and also have industry-focused sales representatives who have developed industry-specific knowledge and technical expertise. We believe that our industry-focused model differentiates us in the market and provides superior technical support and innovation to meet customer needs, which increases our effectiveness as a sales channel for our suppliers. We believe this industry-focused model enables us to provide application support for our customers and encourages customers to consolidate chemicals purchasing with us, creating additional sales for us and our suppliers. To fully penetrate various markets and industries, we also use outside sales representatives, telesales representatives and technically trained telemarketing personnel. In addition to pursuing supplier diversification and volume-based pricing, we pursue discipline in pricing to customers in order to improve margins. We centrally establish and manage pricing guidelines for select products. Our product managers establish a price based on prices posted by chemicals producers plus freight, storage and handling charges. Our field management and sales teams price our products based on order volume and local competitive conditions. They are required to obtain authorization from the product manager to quote a price below the posted threshold.
Our industry-focused marketing groups are responsible for product management, account management, program marketing product portfolio management and corporate communication with an industry focus to provide superior value-added services. Our industry product management groups work to analyze and identify product and technology trends in the marketplace and develop programs to promote enhanced sales. We have established an international marketing group to focus on the European market and to enter into corporate contracts on behalf of local operating companies. We believe that our European presence and broad product portfolio position us better than our local competitors to meet the requirements of the European corporate market.
We generally do not have any long-term sales contracts with customers. We have framework agreements with larger customers that typically provide that we will supply a wide variety of chemicals products, deliver to multiple locations and provide supplemental logistical and other services related to such products.
79
Table of Contents
As of March 31, 2010, we had 2,398 sales and marketing professionals, representing 35% of our total workforce. Our sales and marketing professionals as of that date were located in the following regions: 1,288 in the United States, 265 in Canada, 758 in EMEA and 87 in Rest of World.
Distribution Channels
We continue to refine our distribution business model to provide our suppliers and customers with the highest level of service, reliability and timeliness of deliveries while offering cost competitive products. We have several channels to market including warehouse delivery, direct-to-consumer delivery and ChemPoint, our web-based distributor of specialty chemicals. The principal determinants of how a customer is serviced include the size, scale and level of customization of a particular order, the nature of the product and the customer, and the location of the product inventories. For the year ended December 31, 2009, warehouse distribution accounted for approximately three quarters of our net sales while direct distribution accounted for approximately one quarter of our net sales.
Warehouse Distribution
Our warehouse distribution business is the core of our operations. In our warehouse business, we purchase chemicals in truck load or larger quantities from chemicals suppliers based on contracted demands of our customers or our estimates of anticipated customer purchases based on our understanding of their likely requirements and other factors. Once received, chemicals are stored in one or more of our over 170 distribution facilities, depending on customer location, for sale and distribution in smaller, less-than-truckload quantities to our customers. Our warehouses have various facilities for services such as repackaging, blending and mixing to create specialized chemical solutions needed by our customers in ready-to-use formulations.
Our warehouse business connects large chemicals producers with smaller customers whose consumption patterns tend to make them uneconomical to be served directly by producers. Thus, the core customer for our warehouse business model is a small or medium volume consumer of commodity and specialty chemicals. Since chemicals comprise only a fraction of the input costs for many of our customers’ products, our warehouse customers typically value quality, reliability of supply and ease of service. Our breadth of chemicals product offerings also allows us to provide customers with complete management solutions for their chemicals needs as they are able to obtain small volumes of many different products from us more efficiently and economically than if they dealt directly with multiple chemicals producers. Our network of warehouses allows us to service most customers from multiple locations and also enables us to move products efficiently and economically throughout our own warehouse system to service customers on a real-time basis. We also continue to evaluate options to optimize our network footprint. Further, by leveraging our geographic footprint and state-of-the-art logistics platform we are able to combine multiple customer orders along the same distribution routes to reduce delivery costs and facilitate customer inventory management. For example, we combine less-than-truckload deliveries with deliveries for different customers along the same route to better utilize our delivery assets while at the same time minimizing our customers’ inventories.
With the leading market position in North America, our operations are capable of serving customers throughout the United States, including Hawaii and Alaska, and all major provinces and major manufacturing centers within Canada including remote areas such as the oil sands regions of Northern Canada. Our close proximity to major transportation arteries allows us to service customers in the most remote locations throughout the United States, particularly those niche markets that chemicals producers are not able to serve profitably. In North America, we rely mainly on our own fleet of distribution vehicles, while we primarily use third parties for the transportation of chemicals in Europe.
Our operations in China focus on domestic sales and export sales to South Korea, Japan, Taiwan, Hong Kong, Philippines, Malaysia, Indonesia, Singapore and India. Our operations in the region are supported by one warehouse in Shanghai, one in Dalian and two in Guangzhou, and a blending facility in Zibo located in Shandong province. We rely mainly on third parties for the transportation of chemicals in Asia.
80
Table of Contents
Direct Distribution
Our direct distribution business provides point-to-point logistics for full truckloads or larger quantities of chemicals between producers and customers. In direct distribution, we sell and service large quantity purchases that are shipped directly from producers through our logistics infrastructure, which provides customers with sourcing and logistics support services for inventory management and delivery, in many cases far more economically than a supplier can provide on its own. We believe that producers view us not as competitors but as providers of a valuable service, brokering these large orders through the utilization of our broad distribution network. We typically do not maintain inventory for direct distribution, but rather use our existing relationships and marketing expertise, ordering and logistics infrastructure to serve this demand, resulting in limited working capital investment for these sales. Our direct distribution service is valuable to major chemicals producers as it allows them to deliver larger orders to customers utilizing our existing ordering, delivery and payment systems. This distribution channel primarily distributes bulk commodity chemicals utilizing our own delivery vehicles in North America and third-party carriers in Europe.
ChemPoint
ChemPoint.com is our unique, web-based distribution platform, which facilitates the distribution of specialty and fine chemicals, principally in North America and Europe. Our ChemPoint platform is primarily focused on customers who periodically need small quantities of commodity or specialty chemicals that would not be cost effective to deliver through traditional warehouse or direct distribution channels. Through this platform, we also offer SureStock, our leading-edge inventory management system, which enables customers with recurring and predictable chemicals usage to outsource their inventory stocking to us by committing to designated volume levels. ChemPoint represents a rapidly growing method of distribution for us, with compound annual net sales growth of approximately 18% during the four-year period ended December 31, 2009, despite an 11.5% decline in 2009.
Business Information Services and Information Technology
Information technology, or IT, is an important tool for us, both in managing and optimizing our business internally and in our dealings with producers and customers. We believe that effective IT capabilities offer a strategic advantage for a large scale chemicals distributor like Univar. We have recently developed and adopted a global, business driven, long-range strategic business information services (BIS) plan to implement IT throughout our company. Our BIS plan guides our efforts to apply consistent, profitable business processes and to enable us to better assess and manage the profitability of different aspects of our business and our supplier and customer relationships.
The key initiatives under our BIS plan are to:
| • | transition the provision of IT to consistent, cost-effective, globally scaled commodity services; |
| • | implement the enhanced and extended core process automation and decision support services needed to efficiently operate a global chemicals distribution company; and |
| • | provide functionally rich IT capabilities and services that will differentiate us in the chemicals distribution industry. |
North America
In North America, we currently operate a cost-effective, stable and mature IT systems environment across our North American distribution network. This enables us to, among other things, manage our relationships with our suppliers and customers with a focused and timely exchange of information (for example, custom sales reports for customers and market analyses for suppliers). In addition, our BIS infrastructure includes an e-commerce platform which enables us to electronically handle basic transactions with customers such as electronic data interchange and in some cases active document collaboration and electronic invoicing.
81
Table of Contents
EMEA and Rest of World
In EMEA and Rest of World, we currently operate a number of different IT systems. We are proceeding with a project to implement our enterprise resource planning, or ERP, system throughout our European operations.
In addition, we are working to implement through our BIS a global data management system, which will provide us with increased e-commerce capabilities for more pervasive integration with our customers’ and suppliers’ processes. For information about the risks involved in implementing this project, see “Risk Factors—Risks Related to Our Business—Our implementation of our enterprise resource planning project in Europe may cause interruptions in our business or impact our internal controls.”
Insurance
We have insurance coverage at levels which we consider adequate for our worldwide facilities and activities. Our insurance policies cover the following categories of risk: property damage and business interruption; product and general liability; environmental liability; directors’ and officers’ liability; fraud; and crime/theft.
Competition
The chemicals production, distribution and sales markets are highly competitive. Most of the products that we distribute are made to industry standard specifications and are either produced by, or available from, multiple sources or the suppliers with which we work may also distribute directly or through multiple chemicals distributors. Even for products that are unique in formulation or other characteristics, there are typically other products available which are functional substitutes such that we face significant competition even where we are the exclusive distributors of a specialty product.
Independent chemicals distribution itself is a fragmented market in which only a small number of competitors have substantial international operations. Our principal large international competitor is Brenntag, with a particularly strong position in Europe. Brenntag has been the leading global chemicals distributor, providing a product portfolio of over 10,000 industrial and specialty chemicals. Brenntag has pursued a strategy similar to ours of expanding scale and geographic scope, both organically as well as through acquisitions.
Many other independent chemicals distributors operate on a regional, national or local basis and may have a strong relationship with local suppliers and customers that may give them a competitive advantage in the local market. Some of our competitors are either local or regional distributors with a broad product portfolio, while others are niche players which focus on a specific market segment, either industry or product-based.
Chemicals suppliers may also choose to limit their outsourcing of distribution, particularly with respect to higher margin products, or to partner with other chemicals suppliers for distribution, each of which could increase competition.
North America
The independent chemicals distribution market in North America is fragmented with just under 50% of the market serviced by the top five companies and more than half the market serviced by companies that have a share of less than 2% each. Our principal competitors in North America include Ashland Distribution, Brenntag, Helm America and ICC Chemicals. We also compete with a number of smaller companies in certain niche markets.
82
Table of Contents
Europe
The independent chemicals distribution market in Europe historically has been highly fragmented with most distributors operating on a regional basis and just over a quarter of the market serviced by the top five companies. Consolidation among independent chemicals distributors has increased, mirroring developments within the chemicals sector as a whole. As consolidation accelerates amongst chemicals producers and customers alike, they are increasingly looking to do business with fewer distributors that handle a range of key products across key geographic regions.
Brenntag is our leading competitor in Europe due to its strong market position in Germany, which is the largest European chemicals distribution market. We believe that we are the leading chemicals distributor in the United Kingdom and Ireland.
Regulatory Matters
Our business is subject to a wide range of regulatory requirements in the United States, Europe and Canada and in other jurisdictions in which we operate. These laws and regulations relate to environmental protection, anti-terrorism concerns, storage and transport of hazardous chemicals and other dangerous goods, and occupational health and safety issues. Changes in and introductions of regulations have in the past caused us to devote significant management and capital resources to compliance programs and measures, and future stricter regulations with which we must comply would likely further increase these compliance costs and could have a material adverse effect on our business, financial condition and results of operations. Changes in law, regulation or interpretation, or a failure to comply with current law, regulation or interpretation, may have a material adverse effect on our business, financial condition and results of operations. The following summary illustrates some of the significant regulatory and legal requirements applicable to our business.
Environmental Matters
We operate in a number of different jurisdictions and we are subject to and affected by various types of governmental regulation related to the protection of the environment, including national laws and regulations and international conventions regulating, among other things, discharges into the ground, air and water, managing, transporting and disposing of hazardous substances and remediation of contaminated properties. Some aspects of our business require that we hold a number of permits and licenses. The cost of complying with these environmental laws, regulations, permits, licenses, and orders for past events has, in some instances, been substantial.
We believe that we substantially comply with applicable environmental laws and regulations. Past operations (including those of acquired companies), however, carried out under then prevailing laws and regulations, have resulted in the contamination of various sites, which must be remediated. We have spent substantial sums on such remediation as agreed with appropriate authorities and expect to continue to incur such expenditure in the future, until remediation is deemed complete. Information on our environmental reserves is included in Note 17 to our consolidated financial statements included elsewhere in this prospectus.
Chemicals distribution is an environmentally sensitive business. We are addressing contamination at some of our facilities in the United States which have been subject to contaminants, principally solvents that are subject to remedial action. The federal Comprehensive Environmental Response, Compensation, and Liability Act, or CERCLA, also known as Superfund as well as a number of state laws govern the remediation of contaminated sites and establish liability for the release of hazardous wastes at such sites. A party that sent waste, or arranged for the shipment of waste, to a contaminated site can be liable for the cost of cleanup regardless of fault, the lawfulness of disposal or the actions of other parties. Under CERCLA, the EPA or a delegated state agency can oversee the remediation of sites which the site owners and operators are unable to fund (known as Superfund sites) and seek cost recovery from any parties who arranged for waste disposal at those sites. Our
83
Table of Contents
involvement in Superfund sites has generally been relatively minor, but we are parties to consent agreements with the EPA with respect to cleanup at a number of facilities. We may be identified as a potentially responsible party with regard to additional sites beyond those for which we already have remedial obligations.
The EPA also regulates the generation, transport, treatment, storage and disposal of hazardous waste and arranging for the disposal of hazardous waste under the federal Resource Conservation and Recovery Act of 1976, or RCRA. RCRA also sets forth a framework for managing non-hazardous waste. Most owners and operators of hazardous waste treatment, storage and disposal facilities must obtain an RCRA permit and RCRA also mandates certain recordkeeping and reporting for owners and operators of hazardous waste facilities. In addition, the EPA regulates air emissions of volatile organic compounds and imposes obligations on owners’ and operators’ to investigate and remediate hazardous waste releases and requires financial assurances that facilities have the financial resources to properly close at the end of their useful lives and to respond appropriately to any accidental release of hazardous waste, address waste minimization, phasing out of land disposal of hazardous waste and corrective action for releases of hazardous waste. Some of our facilities can generate various hazardous and non-hazardous wastes.
The Clean Air Act, as amended, or Clean Air Act, establishes a variety of air pollution control measures including limits for several airborne pollutants and the regulation of certain hazardous air pollutants. It also establishes controls for emissions from automobiles and trucks; authorizes the EPA to regulate hazardous air pollutants emitted from industrial sources; and phases out the production of substances that deplete stratospheric ozone. Under the Clean Air Act we are required periodically to certify compliance and may be subject to administrative sanctions and private legal actions for non-compliance. Owners and operators of facilities that handle certain quantities of flammable and toxic substances must implement and regularly update detailed risk management plans filed with and approved by the EPA. These risk management regulations do not apply to transportation or storage incident to transportation.
We are also subject to requirements to prepare and implement a spill prevention, control and countermeasure plan and training for the prevention of the discharge of certain oils and related substances into navigable waters and shorelines. We handle products that are subject to these requirements.
The EPA also regulates discharges of pollutants into U.S. waters and establishes quality standards for surface waters, such as streams, rivers and lakes under the Clean Water Act of 1977. The EPA sets wastewater standards for industry and water quality standards for all contaminants in surface waters. The discharge of any regulated pollutant from point sources (such as pipes and manmade ditches) into navigable waters is illegal without an EPA permit. Several of our facilities have obtained permits for discharges of treated process wastewater directly to surface waters. In addition, several of our facilities discharge to municipal wastewater treatment facilities and therefore are required to obtain pretreatment discharge permits from local agencies.
Current and additional future climate change regulation in the United States and in other jurisdictions around the world could also have a material effect on our business. Increased energy costs or emissions associated with customer products could materially affect demand for those products and indirectly affect our business. Demand for our customers’ products could also be affected by competing alternative products having lower indirect emissions.
Storage Requirements
Our warehouse facilities in the United States are required to comply with applicable permits and zoning requirements from federal, state and local agencies. These requirements, which differ based on type of facility and location, define structural specifications and establish limits on building usage and may include fire safety and other requirements. Regulators typically have the authority to address non-compliance with requirements.
84
Table of Contents
Chemical Facility Anti-Terrorism Standards
The Department of Homeland Security, or Homeland Security, regulates certain high-risk chemicals facilities through its Chemical-Facility Anti-Terrorism Standards. These standards establish a Chemical Security Assessment Tool, comprised of four elements including facility user registration, top-screen evaluation, security vulnerability assessment and site security planning. The site security plan must address any vulnerabilities identified in the security vulnerability assessment including access control, personnel credentialing, recordkeeping, employee training, emergency response, testing of security equipment, reporting of security incidents and suspicious activity, and deterring, detecting and delaying potential attacks. Homeland Security must review, and approve or deny, all security vulnerability assessments and site security plans. Facilities must keep detailed security records and Homeland Security is authorized to enter, inspect and audit the property, equipment, operations and records of such facilities. We handle several chemicals, including in particular chlorine, that are regulated by Homeland Security.
Growing public and political attention has been placed on protecting critical infrastructure, including the chemicals industry, from security threats. As a result, local, state and federal governments have begun a regulatory process that could lead to new regulations impacting the security of chemicals production and storage locations and the transportation of hazardous chemicals. In the United States, legislation is pending that could lead to new regulations in this area. The Hazardous Material Transportation Safety Act of 2009 contains provisions that could lead to additional restrictions on the transportation of Class 3 flammable liquids. The implementation of these types of regulations could interrupt our normal business operations and result in higher operating costs which we may not be able to recover from customers.
Emergency Planning and Community Right-To-Know Act
The Emergency Planning and Community Right-To-Know Act, or the EPCRA, establishes reporting rules for facilities that store or manage chemicals and requires such facilities to maintain certain safety data. EPCRA is intended to facilitate state and local planning for chemicals emergencies, notification of chemicals releases, and informing the public regarding toxic and hazardous chemicals. The EPCRA requires state and local emergency planning and response authorities to be informed of the presence of specified quantities of “extremely hazardous substances” at a facility as well as in the event of certain releases of hazardous substances. Certain facilities that store or use significant amounts of toxic chemicals must also submit annual toxic chemicals release reports containing information about the types and amounts of toxic chemicals that are released into the air, water, and land, as well as information on the quantities of toxic chemicals sent to other facilities for further waste management.
Toxic Substances
The Toxic Substances Control Act, or TSCA, is designed to ensure that certain chemicals do not pose unreasonable risks to human health or the environment. The TSCA registry, maintained by the EPA, lists over 83,000 covered chemicals; chemicals not listed on the TSCA registry cannot be imported into or sold in the United States until registered with the EPA. The TSCA sets forth specific reporting, record-keeping, and testing rules for chemicals (including requirements for the import and export of certain chemicals), as well as other restrictions relevant to our business. Pursuant to the TSCA, the EPA from time to time issues “Significant New Use Rules” when it identifies new uses of chemicals that could pose risks and also requires pre-manufacture notification of new chemical substances that do not appear on the TSCA registry. Any distributor of chemicals that has information reasonably suggesting a substantial risk of injury to health or the environment is required to notify the EPA immediately. We do not develop and manufacture new chemical products, limiting the effect of TSCA on our U.S. operations. However, when we import chemicals into the United States, we must ensure that chemicals appear on the TSCA registry prior to import and to periodically update EPA concerning names and quantities of imported chemicals.
85
Table of Contents
Regulations relating to pesticides
We have a significant operation in the distribution and sale of pesticides. The Federal Insecticide, Fungicide, and Rodenticide Act, or FIFRA, regulates the distribution and sale of pesticides and compounds used as pesticides to protect human health and the environment, and authorizes the EPA to oversee the manufacture, sale and use of pesticides. We are required to register with the EPA and certain state departments of agriculture as a seller of pesticides. The EPA may cancel registration of any pesticide that it concludes does not comply with FIFRA, effectively prohibiting the sale, distribution or use of such product in the United States.
The EPA has established procedures and standards for the design of pesticide containers, as well as the removal of pesticides from such containers prior to disposal, and applicable regulations also prescribe specific labeling requirements concerning instructions on proper cleaning of pesticide containers (including whether or not the container is refillable) and establishes standards to prevent leaks and spills of pesticides from containment structures at bulk storage sites and dispensing operations. These standards apply to dealers who repackage pesticides, commercial applicators and custom blenders.
Occupational Health and Safety Requirements
We attach great importance to the health and safety of our employees. We formulate health and safety standards for implementation across our business. The standards cover areas such as organizing and communicating procedures, training and education, reporting, assessment and controls, and change management. We seek to compare health and safety information across our business, to share best practices, to exchange product information and to standardize procedures. Updates on progress on health and safety issues are distributed regularly through newsletters and bulletins. We are also represented in various industry associations and regulatory bodies that deal with health and safety and other regulatory issues.
Each of our business units has an obligation to report its safety, health and environmental (SHE) risks and performance to an internal oversight function. SHE risks and performance are tracked through audits, evaluations and reporting. Recently, we have implemented an internal integrated risk management audit system, or IRMA, where risks to safety, environment and the surroundings are evaluated and improvement measures proposed. In addition, our sites undergo various external audits, including audits by governmental bodies and certification institutions.
We are subject to the Occupational Health and Safety Act of 1970, or OSHA, which addresses safety and health in workplace environments. OSHA establishes maximum workplace chemical exposure levels for indoor air quality. Chemicals manufacturers and importers must employ a hazard communication program utilizing labels and other forms of warnings, as well as MSDSs, setting forth safety and hazardous materials information to employees and customers. OSHA’s hazard communication standard covers both physical hazards (such as flammability or the potential for explosions) and health hazards. Employers must provide a certain level of training to ensure that relevant employees are equipped to properly handle chemicals.
We provide training to employees and visitors who have access to chemicals handling areas. OSHA requires the use of personal protective equipment when other controls are not feasible or effective in reducing the risk of exposure to serious workplace injuries or illnesses resulting from contact with hazardous substances (or other workplace hazards). Employers must conduct workplace assessments to determine what hazards are present that require the use of personal protective equipment, and must provide appropriate equipment to workers.
OSHA operates a process safety management rule, or the PSM Rule, that requires employers to compile written process safety information, operating procedures and facility management plans; conduct hazard analyses, and develop written action plans for employee participation in safety management, and certify every three years that they have evaluated their compliance with process safety requirements. Employees must have access to safety analyses and related information, and employers must maintain and provide process-specific
86
Table of Contents
training to relevant employees. We handle several chemicals that are highly hazardous chemicals listed under the PSM Rule, including chlorine and certain acids; the PSM Rule imposes extensive obligations on our handling of these chemicals and maintenance of PSM Rule compliance imposes significant costs on our operations.
OSHA’s Hazardous Waste Operations and Emergency Response rules require employers and employees to comply with certain safety standards when conducting operations involving the exposure or potential exposure to hazardous substances, including hazardous waste. These standards require hazardous substances preparedness training for employees and generally apply to individuals engaged in clean-up operations, facility operations entailing the treatment, storage and disposal of hazardous wastes, and emergency responses to uncontrolled releases of hazardous substances.
Various OSHA regulations require employers to develop and maintain an emergency action plan to direct employer and employee actions in the event of a workplace emergency. The plan must contain descriptions of the: (i) means for reporting fires and other emergencies; (ii) procedures for evacuations and routes for emergency escape; (iii) employee procedures for individuals who remain to operate critical plant operations during an evacuation; (iv) rescue and medical responsibilities for employees assigned such responsibilities; and (v) names and titles for individuals able to provide additional information regarding the plan. Under most circumstances, the plan must be maintained in writing, remain accessible at the workplace, and made available to employees for review.
Food and Drug Administration Regulations
Some of the products we distribute are subject to Food and Drug Administration (FDA) regulations governing the handling of chemicals used in food or food processing. Compliance with these regulations requires, in some cases, separate warehousing areas, additional record keeping and operational requirements and additional product quality requirements.
State and Local Regulation
We are subject to a variety of state and local regulations including those relating to fire protection standards, and local licensing and permitting of various aspects of our operations and facilities.
International Regulations
We are subject to similar regulation in other jurisdictions. In particular, Canada and various European jurisdictions regulate the use, transport and disposal of hazardous or potentially hazardous substances as well as specific employee health and safety requirements which generally obligate companies to provide for their employee’s safety regulation on explosion prevention, handling of chemicals or transport of dangerous goods.
In Europe, our business is affected by recent legislation dealing with the Registration, Evaluation, Authorization and Restriction of Chemicals, and is contained in Regulation (EC) 1907/2006, or REACH Regulation, which obligates manufacturers and importers of chemical substances to register these with ECHA, the European Chemicals Agency. It is accompanied by legislation on the classification, labeling and packaging of substances and mixtures.
The REACH system began in 2007 with voluntary participation. Beginning on June 1, 2008, registration of certain types of chemicals became compulsory. Subsequent obligations for registration will become effective in stages over the next few years. The REACH Regulation obligates manufacturers and importers of chemicals in certain quantities to register these chemicals with ECHA enabling European and national authorities to track the substance. Depending on the tonnage of substances to be manufactured or imported and of the specific risks of each substance, different sets of data need to be submitted with the registration. Registration of substances with ECHA imposes significant recordkeeping requirements that can impose significant financial obligations on chemicals distributors.
87
Table of Contents
Proprietary Rights
We rely primarily on trademarks and trade secret laws to establish and maintain our proprietary rights in our technology and products.
We currently hold trademark registrations in approximately 54 countries for UNIVAR. We currently hold trademark registration in the United States and a variety of other countries for product names and other marks.
Employees
As of March 31, 2010, we employed 6,842 persons on a full time equivalent basis worldwide, compared to 6,868, 7,542 and 7,706 persons at December 31, 2009, December 31, 2008 and December 31, 2007, respectively. Approximately 650 of our employees in the United States are represented by a labor union. We have experienced no recent work stoppages. In addition, in several of our facilities located outside the United States, particularly those in Europe, employees are represented by works councils appointed pursuant to local law consisting of employee representatives who have certain rights to negotiate working terms and to receive notice of significant actions. These arrangements grant certain protections to employees and subject us to employment terms that are similar to collective bargaining agreements. We believe our relationship with our employees continues to be good.
Facilities
Our principal executive offices are located in approximately 167,156 square feet of leased office space in two buildings in Redmond, Washington under leases expiring in August 2016 and February 2020. We also own or lease the following principal facilities in the United States:
| Use |
Location |
Approximate square footage |
Owned/Leased | Lease expiration date | ||||
| Warehouse/Office |
Tampa, Florida | 335,225 | Owned | N/A | ||||
| Warehouse/Office |
Los Angeles, California | 317,060 | Owned | N/A | ||||
| Warehouse/Office |
Chattanooga, Tennessee | 240,000 | Owned | N/A | ||||
| Warehouse/Office |
Salem, Massachusetts | 186,370 | Leased | December 31, 2011 | ||||
| Warehouse/Office |
Bedford Park, Illinois | 174,000 | Owned | N/A | ||||
| Warehouse/Office |
Cincinnati, Ohio | 172,650 | Owned | N/A | ||||
| Warehouse/Office |
Middletown, Pennsylvania | 167,000 | Leased | December 31, 2022 | ||||
| Warehouse/Office |
Morrisville, Pennsylvania | 161,840 | Owned | N/A | ||||
| Warehouse/Office |
San Jose, California | 150,000 | Owned | N/A | ||||
| Warehouse/Office |
Norcross, Georgia | 149,550 | Owned | N/A | ||||
| Warehouse/Office |
Kent, Washington | 137,050 | Owned | N/A | ||||
| Warehouse/Office |
Brisbane-Houston, Texas | 132,865 | Owned | N/A | ||||
| Warehouse/Office |
Bekay-Dallas, Texas | 114,790 | Owned | N/A | ||||
| Warehouse/Office |
Spartanburg, South Carolina | 103,050 | Owned | N/A | ||||
| Warehouse/Office |
Yeon-Portland, Oregon | 98,775 | Owned | N/A | ||||
| Warehouse/Office |
Altoona, Pennsylvania | 96,000 | Owned | N/A |
We also lease and occupy regional offices in various cities focused primarily on sales, service and application engineering.
88
Table of Contents
Outside the United States, we own or lease the following principal facilities:
| Use |
Location |
Approximate square footage (excluding tank capacity) |
Owned/Leased | Lease expiration date | ||||
| Warehouse/Office |
Dorval, Quebec, Canada | 185,993 | Owned | N/A | ||||
| Warehouse/Office |
Saskatoon, Saskatchewan, Canada | 184,235 | Owned | N/A | ||||
| Warehouse/Office |
Brussels, Belgium | 177,271 | Leased | August 31, 2012 | ||||
| Warehouse/Office |
Winnipeg, Manitoba, Canada | 154,946 | Owned | N/A | ||||
| Warehouse/Office |
Valleyfield, Quebec, Canada | 136,454 | Owned | N/A | ||||
| Warehouse/Office |
Weston, Ontario, Canada | 132,687 | Owned | N/A | ||||
| Warehouse/Office |
Edmonton, Alberta, Canada | 129,242 | Owned | N/A | ||||
| Warehouse/Office |
Göteborg, Sweden | 123,785 | Leased | December 31, 2020 | ||||
| Warehouse/Office |
Morolo, Lazio, Italy | 114,743 | Owned | N/A | ||||
| Warehouse/Office |
Lieusaint, France | 111,406 | Leased | September 2, 2015 | ||||
| Warehouse/Office |
Middlesbrough, United Kingdom | 105,300 | Owned | N/A | ||||
| Warehouse/Office |
Cusago, Milan, Italy | 102,258 | Owned | N/A | ||||
| Tanks/Office |
North Vancouver, British Columbia, Canada | 1,695 | Leased | November 30, 2016 |
We believe that our facilities are adequate for our current operations and, if necessary, can be replaced with little disruption.
Legal Proceedings
In the ordinary course of our business, we are subject to periodic lawsuits, investigations and claims. Although we cannot predict with certainty the ultimate resolution of lawsuits, investigations and claims asserted against us, we do not believe that any currently pending legal proceeding to which we are a party is likely to have a material adverse effect on our business, results of operations, cash flows or financial condition. See Note 17 to our consolidated financial statements included elsewhere in this prospectus.
Asbestos Claims
In connection with our purchase of McKesson Chemical in 1986, our predecessor entered into an indemnification agreement with McKesson Corporation. In 2007, McKesson Corporation initiated arbitration under this indemnification agreement. Pursuant to a settlement reached in 2009, we agreed to accept the tender of, and indemnify McKesson Corporation for, certain claims alleging injury from exposure to asbestos-containing products sold by McKesson Chemical. Our responsibilities are limited to liabilities in excess of any applicable insurance coverage purchased by McKesson Corporation.
As of May 31, 2010, we were defending McKesson Corporation in lawsuits with approximately 28 separate plaintiffs with asbestos-related claims in the State of Mississippi. These lawsuits all have multiple plaintiffs and a large number of defendants, with no specificity of the plaintiffs’ injuries or causation. To date the costs for defending these cases have not been material and we believe the future defense and liability costs for these cases will not be material.
As of May 31, 2010, Univar USA was defending McKesson Corporation in 370 asbestos-related lawsuits pending in the states of Alabama, California, Delaware, Illinois, Minnesota, Missouri and Texas. These cases are similar to the Mississippi cases except that they are single-plaintiff cases alleging substantial specific injuries from exposure to asbestos-containing products sold by McKesson Chemical. The costs for defending these cases have not been material to date and we do not expect that the outcome of these cases to be material to our financial condition or results of operations.
89
Table of Contents
Anti-competition Practices
In 2006, we concluded an internal investigation which revealed certain anti-competitive practices by certain employees in our European subsidiaries relating to a limited number of products in certain countries. We informed the relevant authorities of the result of our internal investigation promptly and are cooperating in the ongoing regulatory investigation. We have applied for leniency regarding potential penalties and have been granted a partial remission of any penalties by one authority. The estimated amount of the penalties has been reserved. See Note 17 of notes to our consolidated financial statements included elsewhere in this prospectus.
90
Table of Contents
Set forth below is information concerning the persons who will be our directors and executive officers.
| Name |
Age | Position | ||
| John Zillmer |
54 | President and Chief Executive Officer; Director | ||
| Gary E. Pruitt |
60 | Chairman of the Board | ||
| Richard P. Fox |
62 | Director | ||
| Robert ter Haar |
60 | Director | ||
| Claude S. Hornsby |
54 | Director | ||
| Richard Jalkut |
66 | Director | ||
| Paul Julian |
54 | Director | ||
| Rolly van Rappard |
49 | Director | ||
| Thomas Schmitt |
45 | Director | ||
| Chris Stadler |
45 | Director | ||
| Gijs Vuursteen |
36 | Director | ||
| Steven M. Nielsen |
55 | Senior Vice President, Chief Financial Officer | ||
| Terry Hill |
50 | Senior Vice President, Chief Commercial Officer | ||
| Randy D. Craddock |
49 | President of Univar Canada Ltd. | ||
| Edward A. Evans |
58 | Senior Vice President, Chief Human Resources Officer | ||
| Peter D. Heinz |
58 | Vice President, General Counsel and Secretary | ||
| David M. Strizzi |
56 | President of Univar USA Inc. | ||
| John van Osch |
48 | President of Univar Europe |
Executive officers are appointed by and serve at the pleasure of our board of directors. A brief biography of each person who serves as a director or executive officer follows below.
John Zillmer, age 54. Mr. Zillmer has served as our President and Chief Executive Officer and as a director since October 2009. Prior to joining Univar, Mr. Zillmer served as Chairman and Chief Executive Officer of Allied Waste Industries, a solid waste management business, from 2005 until the merger of Allied Waste with Republic Services, Inc. in December 2008. Before Allied Waste, Mr. Zillmer spent 30 years in the managed services industry, most recently as Executive Vice President of ARAMARK Corporation, a provider of food, uniform and support services. During his 18-year career with ARAMARK, Mr. Zillmer served as President of ARAMARK’s Business Services division, the International division and the Food and Support Services group. Prior to joining ARAMARK, Mr. Zillmer was employed by Szabo Food Services until Szabo was acquired by ARAMARK in 1986. Mr. Zillmer is also a director of Ecolab Inc. and Reynolds American, Inc.
Gary E. Pruitt, age 60. Mr. Pruitt has been a director since April 2008 and is our Chairman of the Board and formerly our Chief Executive Officer. Mr. Pruitt joined Univar in 1978 and held a variety of senior management positions until his appointment as our Chairman and Chief Executive Officer in 2002. Mr. Pruitt is also a director of Public Storage, Inc., Esterline Technologies Corporation, a specialized manufacturer, Itron, Inc., a provider of metering solutions, and Premera Blue Cross, a managed-care provider.
Richard P. Fox, age 62. Mr. Fox has been a director since April 2008. Mr. Fox has served as a consultant and outside board member since 2001 to entrepreneurs and the financial services industry. He was President and Chief Operating Officer of CyberSafe Corporation from 2000 to 2001, responsible for the overall financial services and operations of the company. Prior to joining CyberSafe, Mr. Fox was Chief Financial Officer and a member of the board of directors of Wall Data, Incorporated. Mr. Fox spent 28 years at Ernst & Young LLP, last serving as Managing Partner of its Seattle office. He serves on the board of directors of Premera Blue Cross, a managed-care provider, Orbitz Worldwide, an on line travel company, and Flow International, a machine tool manufacturer. In addition, he serves as a member of the Board of Trustees of the Seattle Foundation
91
Table of Contents
and is on the Board of Visitors of the Fuqua School of Business at Duke University. Mr. Fox previously served on the boards of aQuantive Inc. from 2003 to 2007 and Shurgard Storage Centers Inc. from 2004 to 2006. Mr. Fox received a Bachelor of Arts degree in Business Administration from Ohio University and an MBA from the Fuqua School of Business at Duke University. He is a Certified Public Accountant.
Robert ter Haar, age 60. Mr. ter Haar has been a director since April 2008. He is the former Chief Executive Officer of Hagemeyer N.V., a global trading and distribution company. Prior to this, he held the same position at DeBoer Unigro N.V., a European food and retail distribution group, a position he held from 1994 to 1996. He is a member of the Supervisory Board of Unibail-Rodamco S.E., Royal Friesland Campina N.V., Maxeda B.V., Parcom Capital B.V., Sperwer Holding and VVAA Groep B.V. Mr. ter Haar holds a masters degree in commercial and corporate law from the University of Leiden.
Claude S. Hornsby, age 54. Mr. Hornsby has been a director since April 2010. He is the former Chief Executive Officer of Wolseley PLC based in the United Kingdom and has spent over three decades in the distribution industry. He holds a B.A. degree from Virginia Tech and is a graduate of the Advanced Management Program at the Wharton School of Business. Mr. Hornsby currently serves on the boards of Virginia Company Bank and National Association of Wholesalers and is past Rector of Christopher Newport University.
Richard Jalkut, age 66. Mr. Jalkut has been a director since November 2009. He has been the President and Chief Executive Officer of U.S. TelePacific Corp., a telecommunications company, since 2002. From 1998 through 2001, Mr. Jalkut was the President and Chief Executive Officer of PathNet, a telecommunications company. He was also the President and Chief Executive Officer of the NYNEX Telephone Companies (now Verizon) from 1991 through 1998. Mr. Jalkut holds a B.A. from Boston College.
Paul Julian, age 54. Mr. Julian has been a director since April 2010. He has been Executive Vice President and Group President of McKesson Corporation since 2004. After joining McKesson in 1996 as executive vice president of McKesson Health Systems, the Company’s distribution business for hospitals, Mr. Julian went on to become president of McKesson’s medical-surgical business. Mr. Julian became president of McKesson’s distribution, retail automation, pharmacy outsourcing and services for payors in 2000. Previously, he held a variety of senior management positions in health care companies, notably Owens & Minor and Stuart Medical, Inc. Mr. Julian serves on the boards of NADRO, the International Federation of Pharmaceutical Wholesalers (IFPW), as past Chairman, and the Healthcare Distribution Management Association (HDMA), where he serves as Chairman. Mr. Julian holds a B.S. from Salem State College in Massachusetts.
Rolly van Rappard, age 49. Mr. Van Rappard has been a director since April 2008. He holds masters degrees from Columbia University in New York and the University of Utrecht in Holland and held positions at Citicorp prior to becoming a Managing Partner of CVC Capital Partners in 1989. He has extensive business experience due to his involvement with many investment companies. He is a member of the board of Formula One Limited, Smurfit Kappa and Volker Wessels B.V.
Thomas Schmitt, age 45. Mr. Schmitt has been a director since October 2008. He has led FedEx Solutions since 2003 as a Senior FedEx Officer. He also served as Chief Executive Officer of FedEx Global Supply Chain Services from 2006 to 2009. Mr. Schmitt chairs the Board of Directors of the Greater Memphis Chamber and is a Member of Global 50, an Association of Fortune 500 Companies Senior Executives. He holds an MBA with highest distinction from Harvard Business School and a B.A. with First Class Honors from Middlesex University, London (U.K.).
Christopher J. Stadler, age 45. Mr. Stadler has been a director since October 2007. He has been managing partner of CVC Capital Partners since March 2007. Prior to this, he served as Managing Director and Head of Corporate Investment North America of Investcorp International, Inc., an investment company, from 1996 through April 2008. Mr. Stadler serves as a director of Saks Incorporated. He holds a B.A. from Drew University and an MBA from Columbia University.
92
Table of Contents
Gijs Vuursteen, age 36. Mr. Vuursteen has been a director since April 2008. He is a Managing Director of CVC Capital Partners having joined CVC in 2000. Mr. Vuursteen holds a Masters Degree in Mathematics from the University of Groningen. He is a member of the Pilot Travel Center LLC board of directors.
Steven M. Nielsen, age 55, joined Univar in April 2008 as Senior Vice President, Chief Financial Officer. From 2003 through 2004, Mr. Nielsen was the Senior Vice President and Chief Financial Officer of the wireless division of Sprint PCS. As Chief Transition Officer for Sprint in 2005 and 2006, Mr. Nielsen was responsible for the merger integration of Sprint and Nextel. Mr. Nielsen also served as Senior Vice President for finance operations, leading the financial planning, business strategy and decision support for the Company and each of its business units in 2006 and 2007. From November 2007 to March 2008, Mr. Nielsen served as Executive Vice President and Chief Financial Officer for Corporate Initiatives at Sprint Nextel. Mr. Nielsen is a Certified Public Accountant and holds a Bachelor’s Degree in Accounting from Weber State University.
Terry Hill, age 50, began his career with Univar USA in 1985 when the Company operated as Van Waters & Rogers. He has held various sales and management positions including Sales Manager, Regional Vice President, Senior Vice President – Field Operations, and President of Univar USA. In 2007, Mr. Hill was appointed Senior Vice President and Chief Commercial Officer for Univar. Mr. Hill graduated from Texas Tech University with a Bachelor of Science degree in Microbiology and a minor in Chemistry. He is a member of the American Chemical Society and a board member of the Chemical Education Foundation.
Randy D. Craddock, age 49, began his career with the Company in 1981. During his tenure, he has served in a number of capacities including Regional Vice President—Western Canada, General Manager—Prairie Provinces, General Sales Manager—Southern Alberta, and Technical Sales Representative, first in Regina and then in Edmonton. Mr. Craddock has been President of Univar Canada Ltd. since January 2006. Mr. Craddock graduated from the British Columbia Institute of Technology in Marketing, Transportation and Distribution Management.
Edward A. Evans, age 58, joined Univar in January 2010 as Senior Vice President, Chief Human Resources Officer. Prior to Univar, Mr. Evans served as Executive Vice President and Chief Personnel Officer for Allied Waste Industries, Inc. from 2005 through its successful merger with Republic Services in 2009. Prior to joining Allied Waste, Mr. Evans spent 30 years in positions of increasing responsibilities in general management, human resources and organizational development. Immediately prior to his role with Allied, he served as the Founding Director for what is now the Leland C. and Mary M. Pillsbury Institute for Hospitality Entrepreneurship in Cornell University’s School of Hotel Administration. Mr. Evans spent 14 years with ARAMARK Corporation as a Vice President and Senior Vice President of Human Resources based in Philadelphia and then Los Angeles. Prior to ARAMARK, Mr. Evans spent 16 years with Saga Foodservice and Marriott Corporation in general management and human resources roles in Pennsylvania, New York, Texas, Oregon, and finally at Marriott headquarters in Washington, D.C. as Vice President of Human Resources, Residence Inns. Mr. Evans earned both his BS and his MBA from Cornell University.
Peter D. Heinz, age 58, joined Univar in 2002 as Vice President, General Counsel and Secretary. He has over 30 years of experience as a senior corporate officer in the chemicals industry with wide-ranging responsibilities in corporate law, management and governance. Prior to joining Univar, he was General Counsel and Secretary for BetzDearborn. Mr. Heinz manages the legal, risk management and U.S. property functions at Univar. Mr. Heinz graduated with a BA from Franklin & Marshall College, earned a JD from the University of Chicago School of Law, and an LLM from Temple University School of Law.
David M. Strizzi, age 56, joined Univar in April 2009 with over 30 years of progressive leadership and growth with three Fortune 100 companies. He began his career at Procter & Gamble. In 1986, Mr. Strizzi joined Pepsi Bottling Group where he held senior management positions responsible for all aspects of bottling operations: manufacturing, warehouse, logistics, sales and distribution, technology and customer service processes. In 1999, Mr. Strizzi joined Cardinal Health as the General Manager for the pharmaceutical division’s
93
Table of Contents
Midwest region. He rapidly advanced to become Executive Vice President leading the $70 billion pharmaceutical distribution business. In September 2006, the company combined the pharmaceutical and medical products divisions and moved to a functional structure. Mr. Strizzi assumed accountability for the entire warehouse and transportation operations as Senior Vice President of the Healthcare Supply Chain Solutions business. Mr. Strizzi earned a Bachelor of Science degree in Mechanical Engineering from Brown University.
John van Osch, age 48. In January 2009, Mr. van Osch assumed leadership for Univar’s business in Europe, Africa and the Middle East. Before joining Univar, Mr. van Osch was President and General Manager of DSM Composite Resins in Schaffhausen, Switzerland. Prior to joining DSM in 2006, he enjoyed a career of nearly 20 years with General Electric, primarily with GE Plastics. Mr. van Osch is a director and owner of Bom Reposch B.V.
Composition of Our Board of Directors
Our board of directors consists of 11 members. Our amended and restated certificate of incorporation and bylaws provide that the number of authorized directors may be changed only by our board of directors and that any vacancies or new directorships on our board may be filled only by vote of our board of directors. There are no family relationships among our directors or executive officers. Our board of directors has determined that Messrs. Fox, ter Haar, Hornsby, Jalkut, Julian and Schmitt will be independent under the rules and regulations of the .
Committees of Our Board of Directors
Audit Committee. The audit committee of our board of directors appoints, determines the compensation for and supervises our independent auditors, reviews our internal accounting procedures, systems of internal controls and financial statements, reviews and approves the services provided by our internal and independent auditors, including the results and scope of their audit, assists our board in overseeing the preparation of our financial statements and resolves disagreements between management and our independent auditors. Following the completion of this offering, the audit committee will consist of Messrs. Fox (Chairman), ter Haar and Jalkut. Mr. Fox qualifies as an “audit committee financial expert” as defined in the applicable SEC rules. We expect that upon the completion of this offering all of the members of our audit committee will be independent as determined in accordance with the rules of the and any relevant federal securities laws and regulations.
Compensation Committee. The Compensation Committee of our board of directors reviews and recommends to our board of directors the compensation and benefits of all of our executive officers, administers our equity incentive plans and establishes and reviews general policies relating to compensation and benefits of our employees. The Compensation Committee will also produce an annual report on executive compensation for inclusion in our proxy statement. Following the completion of this offering, the Compensation Committee will consist of Messrs. Stadler (Chairman), Schmitt, Julian and Vursteen.
Corporate Governance and Nominating Committee. The role of the corporate governance and nominating committee is to identify individuals qualified to become members of our board of directors, recommend that our board of directors select director nominees for the next annual meeting of stockholders, and to develop and recommend to our board of directors a set of sound corporate governance principles and practices. The corporate governance and nominating committee will also assist our board in assessing the independence of directors. Following the completion of this offering, the corporate governance and nominating committee will consist of Messrs. Pruitt (Chairman), Stadler and Hornsby.
94
Table of Contents
Limitation of Liability and Indemnification of Officers and Directors
Our amended and restated certificate of incorporation and bylaws require us to indemnify our directors and executive officers to the fullest extent permitted by Delaware law. As permitted by Delaware law, we have entered into indemnification agreements with each of our directors that require us to indemnify our directors against all expenses (including reasonable attorneys’, witness or other professional fees) and liabilities (including judgments, damages and amounts paid in settlement, including those arising out of the negligence or active or passive wrongdoing of such persons) incurred, suffered or paid by a director in connection with any threatened, pending or completed claim, action, suit, arbitration, alternate dispute resolution process, investigation, administrative hearing, appeal, or any other proceeding, to which any such director may be a party or threatened to be made a party or otherwise involved in as a witness by reason of such director’s status serving (i) as our director, (ii) in any capacity with respect to any of our employee benefit plans, or (iii) as a director, partner, trustee, officer, employee or agent of any other entity at our request, including one of our subsidiaries.
The indemnification agreements also require us to advance expenses incurred by such persons after receipt of a written request, provided that such persons undertake to repay such amounts if it is ultimately determined that they are not entitled to indemnification. Additionally, the agreements set forth certain procedures that will apply in the event of a claim for indemnification thereunder, including a presumption that such persons are entitled to indemnification under the agreements and that we have the burden of proof to overcome that presumption in reaching any contrary determination.
We are not required to provide indemnification under the agreements for certain matters, including: (i) indemnification and advancement of expenses for any action initiated by or on behalf of such person without the consent of our board of directors (except actions to enforce a right to indemnification or advancement of expenses under this agreement), and (ii) indemnification beyond that permitted by Delaware law. We believe that the terms of the agreements were reasonable and comparable to the terms of agreements negotiated on an arm’s length basis.
95
Table of Contents
Compensation Discussion and Analysis
Univar compensates its named executive officers through salary, bonus, perquisites and fringe benefit programs. Our annual bonus plan provides meaningful performance-based incentives for our management tied to key financial measures that drive shareholder value. As described further below, we intend to supplement these programs with appropriate long-term incentive plans that reward sustained achievement of our key financial goals. This Compensation Discussion and Analysis presents historical and current information and analysis related to the compensation programs for our named executive officers and is not directly relevant to the compensation that these officers will receive from the Company in the future. For purposes of this Compensation Discussion and Analysis, the Company’s named executive officers are Gary E. Pruitt, John J. Zillmer, Steven M. Nielsen, Warren T. Hill, John van Osch, Robert Riemath and Frank Mirabelli. These individuals are referred to collectively as named executive officers (NEOs).
This Compensation Discussion and Analysis describes the specific arrangements that the Company has in place for its named executive officers as well as a discussion of our compensation philosophy for the named executive officers in 2009. The compensation philosophy may be relevant to the future compensation philosophy because it is anticipated that the elements of our compensation will be similar in the future. However, the Compensation Committee of our board of directors (Compensation Committee), will review the impact of this offering and will review all aspects of compensation and make appropriate adjustments.
Compensation Philosophy
We seek to reward strong performance through recognition and rewards that are directly linked to the achievement of clear and measurable business objectives. We define business goals that support our key financial and operating objectives, supporting value creation for our stockholders.
Our annual bonus plan defines common goals for our management team tied to our consolidated global results on key financial measures. These goals are also applied after appropriate adjustments to our business units in Canada, Europe and the United States, and to their local operations. Our management has a significant portion of annual cash compensation tied to achieving these key financial results. Part of the bonus for participants in the plan is also tied to the financial goals of the next-higher level in our organization, so managers are encouraged to share resources and best practices across organization lines to drive our overall success.
We intend to further reinforce our results-oriented business focus by developing appropriate long-term incentive plans tied to sustained achievement of our key business goals and share price growth.
We believe that our total compensation must be competitive. In 2009, the Compensation Committee purchased the “2009 Top Management Compensation Report” by Towers Watson, a tailored analysis of executive compensation and benefits by industry, to provide a benchmark by which we established our market-based compensation targets for our NEOs. Until 2010, we had not engaged the services of a compensation consultant. However, in early 2010, the Compensation Committee retained Meridian Compensation Partners, LLC, or Meridian, to assist in determining whether the elements of Univar’s compensation program are reasonable and consistent with our objectives and that these programs remain competitive, Meridian advises the Compensation Committee on designing an executive compensation program and the reasonableness of individual compensation targets and awards. Meridian does not provide any other services for Univar.
Management completes a periodic review of our compensation programs for non-executive employees to ensure that these programs continue to be competitive and that the non-equity incentive plans are benchmarked to the appropriate performance measures. Our analysis of compensation considers base salaries, incentive compensation, long-term incentives and benefits. Our goal is to be competitive in each portion of our overall compensation and rewards package. Superior performance on our key financial measures in our short-term and long-term incentive plans will permit our compensation to lead the market.
96
Table of Contents
Role of the Compensation Committee
The Compensation Committee assists our board of directors in oversight of the compensation policies and practices of the Company. The Compensation Committee regularly reviews our compensation philosophy and programs with respect to the Company as a whole as well as the NEOs. With respect to the Company as a whole, the Compensation Committee reviews the structure and terms of the bonus plan, annual bonus plan targets and annual bonus plan payments and reviews from time to time the retirement and benefits plans and programs of the Company. With respect to the NEOs, the Compensation Committee reviews the recommendations of our Chief Executive Officer and our Senior Vice President – Human Resources related to the individual performance and any changes in the base or variable compensation of each NEO. It determines appropriate actions to maintain competitive pay practices for the leadership group and makes decisions regarding rewards for the accomplishment of performance goals related to profitable business growth. The Compensation Committee makes recommendations on significant changes to the full board for approval.
Role of the Board of Directors
The board of directors approves the structure, terms and targets of the annual cash incentive plans, reviews and approves material changes in benefit and retirement plans, approves the salary and bonus targets of the executive officers, and has overall responsibility for the compensation programs and practices of the Company.
Components of Direct Compensation
For 2009, our compensation program for named executives included the following two principal components: base salary and annual incentive-based compensation. In addition, each executive officer is also eligible to receive certain benefits, which are generally provided to all other eligible employees, and certain perquisites described below.
Base Salary
Employment agreements for our NEOs are established through negotiations with the officer. Decisions regarding compensation pursuant to these agreements are made based on the “2009 Top Management Compensation Report” by Towers Watson, and the officer’s background and experience. The Compensation Committee reviews the base salaries of all executive officers on an annual basis and determines if an increase is warranted based on individual performance, survey comparisons and the recommendations of the Chief Executive Officer. The individual performance of an NEO is a two pronged evaluation based on (1) achievement of the short- and long-term financial objectives of the Company and (2) demonstration of meaningful leadership and management that furthers the long-term viability of the Company. The Chief Executive Officer prepares and conducts all annual performance evaluations for our executive officers. The Compensation Committee prepares and conducts the annual performance evaluations for the Chief Executive Officer. Due to the decline in business volume during the 2009 recession, salaries were frozen for our executives and managers.
The recent base salary for each NEO is included in the Summary Compensation Table below.
Annual Incentive-Based Compensation
In 2009, bonuses for all regular full-time and part-time employees were paid pursuant to the terms of the annual Profit Sharing Plan (PSP). Starting in 2010, in order to establish diverse targeted annual at-risk incentive awards, bonuses for the NEOs and all other full-time exempt employees are paid pursuant to terms of the annual Management Incentive Plan (MIP). The MIP includes key performance goals, percent weighting for each goal, minimum performance thresholds for each performance measure and upside multiples for performance exceeding the key performance goals.
97
Table of Contents
For the 2010 performance year, the Compensation Committee approved the structure and terms of the MIP. Our MIP is designed to reward business achievement, with significant upside for exceeding our goals and delivering significant value for our owners. No payout is earned for performance that falls below threshold. The Compensation Committee approved management’s recommendation to raise the threshold performance level from 75% of goal in 2009 to 89.5% of goal in 2010. Raising the threshold level requires employees to meet a higher performance level before they are eligible to receive any bonus under the MIP, underscoring management’s commitment to use incentive compensation to reward successful business results. The earned bonus for each executive will be 5% of his or her target bonus for 89.5% of target goal attainment. Each executive’s target bonus amount would be paid for 100% of target goal attainment. The earned bonus will increase to a maximum payout of 200% of target bonus for 110.5% of target goal attainment. Bonuses under the MIP are tied to the Company’s financial performance by two key financial measures. Sixty percent (60%) weighting is placed on achieving or exceeding our goal for Adjusted EBITDA. The remaining forty percent (40%) is based on achieving or exceeding our goal for Return on Capital Employed (ROCE). ROCE is the Adjusted EBITDA less depreciation divided by the related total Capital Employed by the Company or business unit. Capital Employed is the respective total Company or business unit’s total assets (including cash), minus non-interest bearing current liabilities (investments in group companies and long-term inter-company balances are excluded).
For the 2009 performance year, annual incentive-based bonuses were paid pursuant to the PSP. In accordance with their employment agreements, Messrs. Zillmer, Hill, Nielsen and van Osch are eligible to receive annual performance bonuses with a target amount of 115%, 100%, 100% and 60%, respectively, and Messrs. Pruitt, Mirabelli and Riemath are eligible to receive 57%, 60% and 45%, respectively. A summary of Messrs. Zillmer, Hill, Nielsen and van Osch’s employment agreements is included below under “—Employment Agreements and Severance Benefits.” The earned bonus for each executive will be 25% of his or her target bonus for 75% of target goal attainment. Each executive’s target bonus amount would be paid for 100% of target goal attainment. The earned bonus will increase to a maximum payout of 200% of target bonus for 109% of target goal attainment. The PSP included key performance measures, percent weighting for each performance measures, minimum performance thresholds and targets and upside multiples for performance exceeding applicable thresholds and targets. Bonuses under the PSP are tied to the Company’s financial performance by three key financial measures. Fifty percent (50%) weighting is placed on achieving or exceeding our Economic Operating Margin (total Company or business unit’s Adjusted EBITDA less carrying cost of capital), twenty-five percent (25%) is based on achieving or exceeding our Economic Margin (total Company or business unit’s gross margin less the carrying cost of capital) and the remaining twenty-five (25%) is based on achieving or exceeding our ROCE.
The 2009 bonus award pool was, in the aggregate, 32.9% of the target pool size that would have been realized for meeting the budget. The economic downturn in 2009 led to a significant drop in business volume. The steps management implemented in 2009 mitigated the impact on our financial results to a significant degree, but the overall result was still below our expectation. As a result, in the first quarter of 2010, based upon the 2009 performance pursuant to the three key financial measures in the PSP, the annual incentive payments were paid 67.1% below target.
The Company also has three additional cash incentive plans that the NEOs do not participate in: the Long-Term Incentive Plan, the Annual Incentive Plan and the Sales Incentive Plan.
Other Benefits and Perquisites
Our executive compensation program includes other benefits and perquisites as more fully outlined in the All Other Compensation table below. These benefits and perquisites are reviewed periodically by the Compensation Committee. For 2009, our NEOs received car allowances; relocation assistance (Mr. Zillmer); membership dues (Mr. Hill); matching contributions and retirement contributions into the 401(k) plan (each NEO other than Mr. van Osch); and matching contributions and retirement contributions into the supplemental retirement plan (each NEO other than Mr. van Osch).
98
Table of Contents
Univar USA Inc. Valued Investment Plan
We maintain a defined contribution plan, the Univar USA Inc. Valued Investment Plan (VIP), which is intended to qualify as a 401(k) plan. All of our eligible U.S. employees, including our NEOs, can receive a matching contribution from Univar if they contribute into their retirement account in our VIP. We match employee contributions up to 4% of eligible pay for a maximum match of 4%. Executives not accruing benefits under the Univar Retirement Plan (Pension Plan) are eligible to receive an additional retirement contribution from us into the VIP account. There is three-year cliff vesting on this contribution.
Supplemental Valued Investment Plan
We maintain an unfunded supplemental defined contribution plan, the Univar USA Inc. Supplemental Valued Investment Plan (SVIP). The purpose of the supplemental investment plan is to provide a select group of management or highly compensated employees of Univar USA Inc. and certain affiliated companies with a plan benefit in amounts greater than the limits imposed under the VIP. Because our NEOs are limited by U.S. federal law in the amount they can contribute to our 401(k) plan, which in 2009 was generally limited to $16,500 per year or $22,000 per year for persons age 50 or older, we established a non-qualified supplemental savings plan to offer more tax advantaged savings. Participants can make before-tax contributions into the supplemental plan that are over the IRS deferral limit. Contributions can also be made for compensation earned above the annual compensation limit. If a participant’s 401(k) matching contribution was limited because they met the IRS deferral limit or compensation limit, matching contributions are continued in the supplemental plan. The employer match continues at $1 on the dollar up to 4% of eligible earnings contributed into the supplemental plan.
Univar USA Inc. Retirement Plan
Messrs. Pruitt, Hill, Riemath and Mirabelli participate in a tax-qualified defined benefit plan that we maintain, the Univar USA Inc. Retirement Plan. This retirement plan was closed to new entrants as of June 30, 2004 and benefit service was frozen as of June 30, 2004 for participants who had less than five years of benefit service as of that date. Effective December 31, 2009, all accrued benefits under the retirement plan were frozen and no further benefits will be accrued by any participant after such date. All participants are vested in the retirement plan. Upon normal retirement, a participant will receive an accrued benefit in the form of a monthly benefit payable as a single life annuity equal to the greater of (i) $20 multiplied by the participant’s credited service or (ii) 1.2 percent of the participant’s average monthly compensation during the highest five consecutive calendar years plus 0.5 percent of such average in excess of the integration level multiplied by the participant’s years of credited service up to a maximum of 25 years.
Univar USA Inc. Supplemental Retirement Plan
Messrs. Pruitt, Hill, Riemath and Mirabelli also participate in a non-qualified supplemental defined benefit plan that we maintain, the Univar USA Inc. Supplemental Retirement Plan. This supplemental retirement plan provides benefits to management or highly compensated employees who are eligible to participate in the Univar USA Inc. Retirement Plan and who have earnings or benefits in excess of the tax limits applicable to such plan. Effective June 30, 2004, benefit accruals under this supplemental retirement plan were frozen for those participants whose benefits under the Univar USA Inc. Retirement Plan were frozen. Effective December 31, 2009, all accrued benefits under the supplemental retirement plan were frozen for those participants whose benefits under the USA Inc. Retirement Plan were frozen as of December 31, 2009.
Univar USA Inc. Postretirement Medical Bridge and Supplemental Plan
The NEOs are eligible to participate in a retiree medical plan that we maintain, the Univar USA Inc. Postretirement Medical Bridge and Supplemental Plan (Retiree Medical Plan). The Retiree Medical Plan provides benefits to employees who are at least 55 years of age and have at least 15 years of service with the Company upon termination of employment. Eligible retirees must also be vested in the Univar USA Inc.
99
Table of Contents
Retirement Plan and be eligible to participate in a Univar medical plan at the time of termination. The Bridge portion of the Retiree Medical Plan is offered to pre-Medicare participants. The Supplemental portion of the Retiree Medical Plan is offered for Medicare eligible participants. The Supplemental portion of the Retiree Medical Plan will no longer be offered beginning in 2015. The Retiree Medical Plan is available for the following eligible dependents: the spouse of the retiree, widow of retiree and widow of an active employee who had at least 15 years of service.
Equity Ownership
Certain of our directors, officers and other senior employees have purchased ordinary and preferred shares in our indirect parent companies pursuant to our management equity plan, or MEP. The principal terms of the MEP are set forth in the Stockholders Agreements described under “Certain Relationships and Related Party Transactions—Agreements Related to the 2007 Acquisition—Stockholders Agreements.” Equity purchased under the MEP is subject to certain call rights in the event of a termination of employment, as discussed under “Principal and Selling Stockholders.”
Our Compensation Committee believes that the direct, personal investment of our management in the equity of our indirect parent companies under the MEP serves a valuable retention and incentive function.
Compensation Program as it Relates to Risk Management
We do not believe that the compensation programs for our NEOs, managers or employees encourage excessive or inappropriate risk taking. We believe our compensation programs align incentives with the corporate goals from senior management through to local management and sales team goals. Our goals focus on improving our margins, Adjusted EBITDA and ROCE. In addition, we tie each level of management’s bonus in part to the next higher level of the organization. This encourages appropriate resource sharing and support of the broader Univar business objective and strategy.
As outlined above under “Compensation Philosophy,” we intend to develop and implement appropriate long-term incentive plans which will include executive officers through to local management. These plans will focus on key financial goal attainment over three-year performance periods; thereby reinforcing a longer-term focus in our business. This will further reduce the likelihood of inappropriate risk taking.
All of our cash incentive plans contain maximum payout limits or terms that preserve the Chief Executive Officer’s ability to use negative discretion to decrease payouts equitably to avoid rewarding individuals for windfall gains in business outcomes. These provisions help mitigate undue management risk.
Components of Post-Employment Compensation
Employment Agreements and Severance Benefits
Messrs. Pruitt, Zillmer, Nielsen, Hill and van Osch have employment agreements that are designed to attract, retain, motivate and reward the talented executives who are essential to the Company’s success. Mr. Pruitt’s agreement includes a non-compete provision for a period of three years following the termination of employment in December 31, 2009. He was not entitled to severance benefits upon termination of his employment as of December 31, 2009. Messrs. Zillmer, Nielsen and Hill’s agreements include a non-compete provision for a period of 18 months following termination of employment. Upon termination without “cause” or for “good reason”, each of Messrs. Zillmer and Hill is entitled to a lump sum payment equal to (i) two times the sum of his respective annual base salary and target bonus, (ii) prorated target bonus for the year of termination and (iii) accelerated vesting of stock options and long-term incentive awards (of which no such awards have been granted or are outstanding). Mr. Zillmer will also be entitled to $4,000,000 worth of restricted shares upon an initial public offering of ordinary shares of Ulysses Luxembourg S.à.r.l., or Ulysses Luxembourg, or Ulysses Finance S.à.r.l., or Ulysses Finance, or if a change in control (as defined in his employment agreement) of
100
Table of Contents
Ulysses Luxembourg or Ulysses Finance occurs prior to either such initial public offering, Mr. Zillmer is entitled to certain preferred and ordinary shares of Ulysses Luxembourg and ordinary shares of Ulysses Finance, as well as a cash amount equal to any distributions that would have been paid on any such shares from and after the date of Mr. Zillmer’s employment agreement. Upon termination without “cause” or for “good reason”, Mr. Nielsen is entitled to a lump sum payment equal to (i) one and a half times the sum of his annual base salary and target bonus, (ii) prorated target bonus for the year of termination and (iii) accelerated vesting of stock options and long-term incentive awards (of which no such awards have been granted or are outstanding). Mr. van Osch’s agreement includes a non-compete provision for one year following termination of employment. Mr. van Osch is entitled to a lump sum payment equal to (i) the sum of his annual base salary and target bonus and (ii) prorated target bonus for the year of termination. Messrs. Reimath and Mirabelli do not have employment agreements and were not otherwise entitled to any specific severance benefits.
2009 Summary Compensation Table
The following table sets forth certain information concerning annual compensation for our NEOs during the year ended December 31, 2009. Please note that Mr. Pruitt retired from his position as Chief Executive Officer in October 2009; however, Mr. Pruitt continues to serve as the Chairman. Mr. Reimath retired from his position as Chief Information Officer on September 30, 2009. Mr. Zillmer joined Univar in October 2009 as President and Chief Executive Officer.
| Name and Principal Position |
Year | Salary ($) |
Stock Awards ($)(1) |
Non-Equity Incentive Plan Compensation ($)(2) |
Change in Pension Value and Non-Qualified Deferred Compensation Earnings ($)(3) |
All
Other Compensation ($)(4) |
Total ($) | ||||||||||||
| John Zillmer Chief Executive Officer |
2009 | $ | 173,077 | $ | — | $ | — | $ | 308,131 | $ | 481,208 | ||||||||
| Gary Pruitt former Chairman & CEO |
2009 | $ | 1,738,861 | $ | 2,000,000 | $ | — | $ | 155,965 | $ | 3,894,826 | ||||||||
| Steven M. Nielsen Chief Financial Officer |
2009 | $ | 575,000 | $ | 816,940 | $ | — | $ | 70,528 | $ | 1,462,468 | ||||||||
| Terry Hill Chief Commercial Officer |
2009 | $ | 527,030 | $ | 1,054,060 | $ | 798,771 | $ | 60,549 | $ | 2,440,410 | ||||||||
| John van Osch President-Univar Europe(5) |
2009 | $ | 486,321 | $ | 209,111 | $ | 72,948 | $ | 48,683 | $ | 817,063 | ||||||||
| Robert Riemath former Chief Information Officer |
2009 | $ | 220,926 | $ | 197,652 | $ | 179,033 | $ | 370,002 | $ | 967,613 | ||||||||
| Frank Mirabelli SVP-Performance Management |
2009 | $ | 270,000 | $ | 243,000 | $ | 498,816 | $ | 28,770 | $ | 1,040,586 | ||||||||
| (1) | As a privately-owned company, Univar did not issue stock awards to executives in 2009. Executives are offered an opportunity to invest in Univar’s parent company so that their interests are aligned more closely with other owners. |
| (2) | Executives participated in the Univar Profit Sharing Plan, which provided annual incentive compensation if corporate goals are achieved on Economic Margin, Economic Operating Margin and ROCE. |
| (3) | The Change in Pension Value for Mr. Pruitt was a decrease of $80,859. Mr. Pruitt elected to begin receiving benefits after the date at which he was eligible for an unreduced benefit, resulting in a decrease in Pension Value. |
101
Table of Contents
| (4) | See table captioned “2009 All Other Compensation Table” for details regarding amounts disclosed in the “All Other Compensation” column for fiscal year 2009. |
| (5) | Mr. van Osch is paid in euro; however, for the purposes of each of the tables in this section, all amounts have been converted from euro to U.S. dollars using a currency exchange rate of 1.389 U.S. dollars per euro. This conversion rate is the average daily exchange rate for 2009. |
2009 All Other Compensation Table
| Name and Principal Position |
Year | Auto Allowance ($)(1) |
Contributions to Defined Contribution Savings Plan ($)(2) |
Severance ($) |
Relocation Assistance ($)(3) |
Total ($) | |||||||||||
| John Zillmer |
2009 | $ | 1,785 | $ | 6,346 | — | $ | 300,000 | $ | 308,131 | |||||||
| Gary Pruitt |
2009 | $ | 43,799 | $ | 112,166 | — | — | $ | 155,965 | ||||||||
| Steven M. Nielsen |
2009 | $ | 21,420 | $ | 49,108 | — | — | $ | 70,528 | ||||||||
| Terry Hill |
2009 | $ | 13,116 | $ | 47,433 | — | — | $ | 60,549 | ||||||||
| John van Osch |
2009 | $ | 48,683 | — | — | — | $ | 48,683 | |||||||||
| Robert Riemath |
2009 | $ | 11,554 | $ | 12,557 | $ | 345,891 | — | $ | 370,002 | |||||||
| Frank Mirabelli |
2009 | $ | 21,420 | $ | 7,350 | — | — | $ | 28,770 | ||||||||
| (1) | The auto allowance payments shown for Messrs. Pruitt, Hill, Riemath and van Osch include vehicle lease fees and tax gross-up for personal use of a company vehicle. The car allowance payments for Messrs. Zillmer, Nielsen and Mirabelli are taxable allowances to offset the cost of personal vehicles. |
| (2) | Executives who are U.S. employees are eligible to receive matching and retirement contributions in the VIP and the SVIP. |
| (3) | Mr. Zillmer received a relocation lump sum as the sole and exclusive payment for his relocation to the Seattle, WA area. |
2009 Grant of Plan-Based Awards Table
| Estimated Future Payouts
Under Non-Equity Incentive Plan Awards | |||||||||||
| Name and Principal Position |
Year | Grant Date |
Threshold ($) |
Target ($) |
Maximum ($) | ||||||
| John Zillmer(2) |
2009 | 1/09 | (1) | 287,500 | 1,150,000 | 2,300,000 | |||||
| Gary Pruitt |
2009 | 1/09 | (1) | 250,000 | 1,000,000 | 2,000,000 | |||||
| Steven M. Nielsen |
2009 | 1/09 | (1) | 143,750 | 575,000 | 1,150,000 | |||||
| Terry Hill |
2009 | 1/09 | (1) | 131,758 | 527,030 | 1,054,060 | |||||
| John van Osch |
2009 | 1/09 | (1) | 72,948 | 291,793 | 583,586 | |||||
| Robert Riemath |
2009 | 1/09 | (1) | 24,854 | 99,417 | 198,834 | |||||
| Frank Mirabelli |
2009 | 1/09 | (1) | 40,500 | 162,000 | 320,000 | |||||
| (1) | This row reflects the future payouts with respect to the performance awards that were granted under our PSP with respect to performance in the 2009 calendar year. Each performance award was granted with a target amount, subject to actual payment based on a sliding scale ranging from zero to two times the target amount. These performance awards were paid in the first quarter of 2010 as specified in our 2009 Summary Compensation Table above. For more information on the terms of these performance awards, please see “—Compensation Discussion and Analysis—Annual Incentive-Based Compensation.” |
| (2) | This row reflects the payouts Mr. Zillmer would have been eligible to receive if he had been employed with the Company for the full 2009 calendar year. However, Mr. Zillmer was only eligible to receive a prorated bonus in 2009. |
102
Table of Contents
2009 Pension Benefits Table
The following table sets forth certain information concerning pension benefits for our NEOs who participated in pension schemes maintained for our Executives (as described above under “Univar USA Inc. Retirement Plan” and “Univar USA Inc. Supplemental Retirement Plan”). Messrs. Zillmer, Nielsen and van Osch did not participate in these pension schemes.
| Name and Principal Position |
Plan Name |
Number of Years of Credited Service (#) |
Present Value of Accumulated Benefit ($)(1) |
Payments During the Last Fiscal Year ($) | ||||||
| Gary Pruitt |
Univar USA Inc. Retirement Plan Univar USA Inc. Supplemental Retirement Plan |
31.0000 31.0000 |
$ $ |
1,245,393 10,621,623 |
$ $ |
14,877 — | ||||
| Terry Hill |
Univar USA Inc. Retirement Plan Univar USA Inc. Supplemental Retirement Plan |
24.5000 24.5000 |
$ $ |
572,570 2,104,668 |
$ $ |
— — | ||||
| Robert Riemath |
Univar USA Inc. Retirement Plan Univar USA Inc. Supplemental Retirement Plan |
20.8333 20.8333 |
$ $ |
934,716 719,504 |
$ $ |
16,602 12,780 | ||||
| Frank Mirabelli |
Univar USA Inc. Retirement Plan Univar USA Inc. Supplemental Retirement Plan |
30.8333 30.8333 |
$ $ |
1,241,282 1,270,065 |
$ $ |
— — | ||||
2009 Non-Qualified Deferred Compensation Table
| Name and Principal Position |
Executive Contributions in Last FY |
Company Contributions in Last FY(1) |
Aggregate Earnings in Last Fiscal Year |
Aggregate Withdrawals/ Distributions |
Aggregate Balance at Last Fiscal Year End | ||||||||||
| John Zillmer |
$ | — | $ | — | $ | — | $ | — | $ | — | |||||
| Gary Pruitt |
$ | 365,348 | $ | 109,604 | $ | 18,698 | $ | — | $ | 3,263,232 | |||||
| Steven M. Nielsen |
$ | — | $ | 34,408 | $ | 1,160 | $ | — | $ | 45,779 | |||||
| Terry Hill |
$ | 236,474 | $ | 44,339 | $ | 27,143 | $ | — | $ | 1,092,206 | |||||
| John van Osch(2) |
$ | — | $ | — | $ | — | $ | — | $ | — | |||||
| Robert Riemath |
$ | 33,133 | $ | 8,283 | $ | 11,213 | $ | — | $ | 353,180 | |||||
| Frank Mirabelli |
$ | — | $ | — | $ | 873 | $ | — | $ | 42,194 | |||||
| (1) | Executives who are U.S. employees are eligible to receive matching and retirement contributions in the VIP and the SVIP. The combined company contribution amount in 2009 is shown in the Contributions to Defined Savings Plans column in the 2009 All Other Compensation table. The portion of this contribution that went into the non-qualified SVIP plan is highlighted in the table above. |
| (2) | Mr. van Osch, who is not a U.S. employee, was not eligible to participate in our deferred compensation plans. |
Potential Payments Upon Termination or Change in Control
The following descriptions set forth the estimated value of payments and benefits that our NEOs would be entitled to receive assuming certain terminations of employment and/or a change in control of Univar Inc., in each case, occurring on December 31, 2009. The amounts set forth below are in addition to the amounts they would be entitled to receive pursuant to the pension plan benefits for each of the NEOs and early entitlement to retiree medical insurance for Messrs. Zillmer and Hill and any other generally available employee benefit plans (such as disability, life insurance and accidental death).
103
Table of Contents
Gary E. Pruitt
Gary E. Pruitt retired as Chief Executive Officer on October 30, 2009 and is serving as our non-executive Chairman. Under Mr. Pruitt’s January 30, 2009 employment agreement with Univar, upon termination of his employment as of December 31, 2009, Mr. Pruitt is not entitled to severance benefits. If Mr. Pruitt’s termination of employment was without “cause” and occurred prior to December 31, 2009, he would have been entitled to (i) a lump sum payment equal to $1,000,000 in connection with the termination of his position as Chief Executive Officer, and (ii) a lump sum payment equal to $1,000,000 (less the aggregate gross amount of Chairman fees paid in 2010 and 2011) in connection with the termination of his position as Chairman of the Board. Mr. Pruitt did not receive a severance benefit upon his retirement as Chief Executive Officer and Mr. Pruitt did not receive any Chairman fees in 2009. Under his employment agreement “cause” is defined as willful failure to perform material duties; conviction of a felony or any misdemeanor involving moral turpitude; willful and gross misconduct; or material breach of any applicable non-competition, non-solicitation or confidentiality covenants. For the three year period following termination of his employment agreement, Mr. Pruitt is subject to non-solicitation of employees and customers restrictions.
John J. Zillmer
Under the terms of John J. Zillmer’s October 19, 2009 employment agreement with Univar, in the event Mr. Zillmer’s employment is terminated by Univar without “cause” or Mr. Zillmer terminates his employment for “good reason”, he will be entitled to receive severance benefits equal to (i) a lump sum payment equal to two times the sum of his annual base salary and target bonus, (ii) a prorated bonus based on his target bonus for the year of termination payable in a lump sum, (iii) accelerated vesting of unvested stock options and long-term incentive awards (of which no such awards have been granted or are outstanding) and (v) entitlements to $4,000,000 worth of restricted shares upon an initial public offering of ordinary shares of Ulysses Luxembourg or Ulysses Finance, or if a change in control occurs prior to either such initial public offering, Mr. Zillmer is entitled to certain preferred and ordinary shares of Ulysses Luxembourg and ordinary shares of Ulysses Finance, as well as a cash amount equal any distributions that would have been paid on any such shares from and after the date of Mr. Zillmer’s employment agreement (as described in the succeeding paragraph). In addition, Univar will waive the 55 years of age requirement and allow Mr. Zillmer to elect participation in the Retiree Medical Plan. Such severance benefits will be contingent upon the execution by Mr. Zillmer of a release in favor of Univar and its affiliates. If Mr. Zillmer’s employment is terminated by Univar with “cause” or Mr. Zillmer terminates his employment without “good reason”, he will not be entitled to severance benefits. Under his employment agreement, “cause” is defined as failure to perform his material duties; conviction of a felony or any misdemeanor involving moral turpitude; willful and gross misconduct; or material breach of any applicable non-competition, non-solicitation or confidentiality covenants; and “good reason” means a reduction in his base salary or target bonus percentage that is not cured within 30 days; a diminution in his title, duties and responsibilities that is not cured within 30 days; a transfer of his primary workplace by more than 35 miles; or the failure of a successor to have assumed his employment agreement. For the 18 month period following a termination of his employment for any reason, Mr. Zillmer is subject to non-competition and non-solicitation of employees and customers restrictions.
Under the terms of Mr. Zillmer’s October 19, 2009 employment agreement, in the event of a “change in control” of Ulysses Luxembourg or Ulysses Finance prior to an initial public offering of ordinary shares of either such company, Mr. Zillmer will be entitled to approximately 16,000,000 preferred and 7,000,000 ordinary shares of Ulysses Luxembourg and 65,000,000 ordinary shares of Ulysses Finance, as well as a cash amount equal to any distribution that would have been paid on any such shares or redemption of such shares on and after the date of Mr. Zillmer’s employment agreement. Under his employment agreement, “change in control” is defined as the sale or disposition of the assets of Ulysses Luxembourg or Ulysses Finance, as applicable, or any person becoming the beneficial owner, directly or indirectly, of more than 50 percent of the voting securities of the applicable company, or the disposition of securities of the applicable company such that CVC Capital Partners is no longer the single largest shareholder of the applicable company or CVC Capital Partners holds less than 25 percent of the total voting securities of the applicable company.
104
Table of Contents
Steven M. Nielsen
Under the terms of Steven M. Nielsen’s April 14, 2008 employment agreement with Univar, in the event Mr. Nielsen’s employment is terminated by Univar without “cause” or Mr. Nielsen terminates his employment for “good reason”, he will be entitled to receive severance benefits equal to (i) a lump sum payment equal to the sum of one and a half times the sum of his annual base salary and target bonus for the year in which the termination occurs, (ii) a prorated bonus based on his target bonus for the year of termination payable in a lump sum and (iii) accelerated vesting of unvested stock options and long-term incentive awards (of which no such awards have been granted or are outstanding). Such severance benefits will be contingent upon the execution by Mr. Nielsen of a release in favor of Univar and its affiliates. If Mr. Nielsen’s employment is terminated by Univar with “cause” or Mr. Nielsen terminates his employment without “good reason”, he will not be entitled to receive severance benefits. Under his employment agreement, “cause” is defined as failure to perform his material duties; conviction of a felony or any misdemeanor involving moral turpitude; willful and gross misconduct; or material breach of any applicable non-competition, non-solicitation or confidentiality covenants; and “good reason” means a material reduction in his base salary or material reduction in annual incentive compensation opportunity that is not cured within 30 days; a diminution in his title, duties and responsibilities that is not cured within 30 days; a transfer of his primary workplace by more than 35 miles; or the failure of a successor to have assumed his employment agreement. For the 18 month period following a termination of his employment for any reason, Mr. Nielsen is subject to non-solicitation of employees and customers restrictions.
Warren T. Hill
Under the terms of Warren T. Hill’s May 31, 2007 employment agreement with Univar, in the event Mr. Hill’s employment is terminated by Univar without “cause” or Mr. Hill terminates his employment for “good reason”, he will be entitled to receive severance benefits equal to (i) a lump sum payment equal to two times the sum of his annual base salary and his most recent target bonus, (ii) accelerated vesting of unvested stock options and long-term incentive awards (of which no such awards have been granted or are outstanding) and (iii) relocation expenses. In addition, Univar will waive the 55 years of age requirement and allow Mr. Hill to elect participation in the Retiree Medical Plan. Such severance benefits will be contingent upon the execution by Mr. Hill of a release in favor of Univar Inc. and its affiliates. If Mr. Hill’s employment is terminated by Univar with “cause” or Mr. Hill terminates his employment without “good reason”, he will not be entitled to receive severance benefits. Under his employment agreement, “cause” is defined as material breach of his employment agreement that is not cured within 20 days; unauthorized use or disclosure of confidential information; continued willful and intentional failure to satisfactorily perform his essential responsibilities; material failure to comply with rules, policies or procedures of Univar; dishonesty, fraud or gross negligence related to the business; personal conduct that is materially detrimental to the business; or conviction of a felony; and “good reason” means a material breach by Univar of his employment agreement that is not cured within 20 days; assignment of Mr. Hill to a position that is not a senior executive position; a material reduction in Mr. Hill’s authority or responsibility; or relocation to a place outside of the metropolitan Seattle area. For the 18 month period following a termination of his employment for any reason, Mr. Hill is subject to non-solicitation of employees and customers restrictions.
John van Osch
Under the terms of John van Osch’s January 1, 2009 employment agreement with Univar Europe Holdings B.V., in the event Mr. van Osch’s employment is terminated by us before Mr. van Osch reaches age 65 for any reason other than an “urgent reason” as defined in the Dutch Civil Code or “substantial blame”, he will be entitled to receive severance benefits in an amount equal to (i) a prorated bonus for the year of termination paid payable in a lump sum and (ii) the greater of (y) a lump sum payment equal to the sum of his annual base salary and target bonus for the year of termination, or (z) court awarded severance payments. Acceptance of such severance benefits by Mr. van Osch will constitute a release in favor of Univar and its affiliates. The total amount of severance that Mr. van Osch will receive may not exceed the gross salary
105
Table of Contents
otherwise payable to Mr. van Osch through age 65, including perquisites and less any income from social insurance, pre-early retirement plans, disablement pension or other income made available to him by the government or by us. Under his employment agreement, “substantial blame” exists if Mr. van Osch is substantially to blame for the termination of his employment or if the reason for termination is at the sphere of risk of Mr. van Osch. For the one year period following a termination of his employment for any reason, Mr. van Osch is subject to non-competition and non-solicitation of employees and customers restrictions.
Robert Riemath
Robert Riemath did not have an employment agreement with Univar. At the time Mr. Riemath’s employment was terminated on September 30, 2009, consistent with the Company practice for executives at Mr. Riemath’s level of seniority, he was eligible to receive severance benefits equal to the sum of his annual base salary and his target bonus. The severance benefits were awarded at the discretion of the Company and were contingent upon the execution by Mr. Riemath of a release in favor of Univar and its affiliates.
Frank Mirabelli
Frank Mirabelli did not have an employment agreement with Univar. At the time Mr. Mirabelli’s employment was terminated on April 9, 2010, he was eligible to receive one week of severance for every year of service at the Company and benefit enhancement under our supplemental pension plan. The severance benefits were awarded at the discretion of the Company and were contingent upon the execution by Mr. Mirabelli of a release in favor of Univar and its affiliates.
106
Table of Contents
CERTAIN RELATIONSHIPS AND RELATED PARTY TRANSACTIONS
Since January 1, 2007, there has not been, nor is there currently planned, any transaction or series of similar transactions to which we were or are a party in which the amount involved exceeds $120,000 and in which any director, executive officer or holder of more than 5% of our capital stock or any member of such persons’ immediate families had or will have a direct or indirect material interest, other than agreements which are described under the caption “Management” and the transactions described below.
Transactions with Certain Beneficial Owners
We have a service level agreement with Univar N.V. whereby it allocates to its subsidiaries the costs it incurs which benefit those subsidiaries. These costs include financial, legal and managerial advice and advice with respect to other matters and transactions. For the year ended December 31, 2009, this fee was $1.4 million, and for the three months ended March 31, 2010, this fee was $0.6 million.
We have granted three loans to Univar N.V. and Ulixes B.V., our indirect parent, amounting to $86.2 million at December 31, 2009. See Note 19 to our consolidated financial statements included elsewhere in this prospectus.
Transactions with Certain Employees
We have granted 17 loans amounting to $5.2 million at December 31, 2009 to certain employees to acquire shares of an indirect parent company as a management equity program. The loan terms provide for 0% to 5.5% interest to be accrued on unpaid principal per annum, in line with local tax guidance, and for repayment of the loan plus interest on the ninth anniversary of the loan. The terms of nine loans provide that a portion of the employee’s annual profit sharing bonus be used to repay the loan. During 2009, $0.2 million was repaid under this provision. The average remaining term of the loans at December 31, 2009 was 8.0 years. The shares acquired with the loans are pledged to repay the loans and the loans are with recourse against the individuals. None of the outstanding loans were made to any of our named executive officers.
Agreements Related to the 2007 Acquisition
In connection with our 2007 acquisition by Ulysses Luxembourg and Ulysses Finance, two Luxembourg private limited liability companies, the capital stock of which is principally held by investment funds advised by CVC Capital Partners, these companies, our parent company and certain of our current and former senior executive officers entered into several agreements that include provisions affecting us.
Stockholders Agreements
Each of Ulysses Luxembourg and Ulysses Finance is a party to a Stockholders Agreement with Ulysses Participation S.à.r.l., a private limited liability company held by investment funds advised by CVC Capital Partners, Parcom Ulysses 2 S.à.r.l., or ING Investor, GSMP V Onshore US, Ltd, GSMP V Offshore US, Ltd. and GSMP V Institutional US, Ltd., or collectively, Goldman Sachs Investors, Société Générale Bank & Trust, as fiduciary for the Managers, or Société Générale and, collectively with CVC Capital Partners, the ING Investor and the Goldman Sachs Investors, the Stockholders, and certain of our current and former senior executive officers, or Managers. The Stockholders agreed to cause the election to our board of directors of (1) at least one of every six directors, as designated by Société Générale as fiduciary for the Managers, (2) at least one of every six directors, as designated by the ING Investor, (3) at least one of every six directors, an individual independent of each of the Stockholders and their affiliates and (4) all remaining directors, as designated by CVC Capital Partners. Each Stockholders Agreement provides that unless otherwise required by the Stockholders Agreement or applicable law, all matters arising for the determination of our board of directors shall be decided by a majority of directors voting and, in the event of a tie, one of the directors designated by CVC Capital Partners shall have a casting vote. Each Stockholder which, together with its related persons, owns at least 15% of the
107
Table of Contents
ordinary shares of one of our two indirect stockholders, shall have the right to send one representative on its behalf to attend all meetings of our board of directors as a non-voting observer.
Each Stockholders Agreement provides for certain tag-along, drag-along, pre-emptive and exchange rights as among the Stockholders and for the distribution of our capital stock to the Stockholders in the event of our initial public offering and for us to become party to the Stockholders Agreement in connection with our initial public offering. The Stockholders intend to amend the Stockholders Agreement in connection with this offering.
Under the Stockholders Agreements, Ulysses Luxembourg and Ulysses Finance agreed to cause Univar N.V. to honor certain employment agreements, letters of credit, investment and benefits plans and trust agreements entered into by the Managers and Univar N.V. and its affiliates. The Managers agreed not to compete with the chemicals distribution business, solicit for employment the employees or solicit business relationships with customers of Ulysses Luxembourg and Ulysses Finance during the period of their employment. The Managers must also disclose all inventions they make during their employment, return the documents of Ulysses Luxembourg and Ulysses Finance in the event of a termination of their employment and not disclose their confidential information.
Note Purchase Agreement
Pursuant to a Note Purchase Agreement, Ulixes Acquisition B.V., our indirect parent, issued and sold to Goldman Sachs Investments Ltd and certain related parties, or GSMP Purchasers, $600,000,000 of its 12% Senior Subordinated Notes due 2015 described in “Description of Our Indebtedness.” The Note Purchase Agreement requires us to provide to the GSMP Purchasers and GS Mezzanine Partners Institutional, L.P. monthly, quarterly and annual financial statements, opportunities to consult with and advise our management and access to our books of account and records, facilities, properties, documents, reports and financial data.
Registration Rights Agreement
The registration rights agreement related to the issuance of the Senior Subordinated Notes contains a provision regarding piggyback rights stating that if we file a registration statement for the registration of debt securities, we must offer to holders of the Senior Subordinated Notes to include in the filing the amount of Senior Subordinated Notes that the holders request.
Review and Approval of Related Person Transactions
Our audit committee is responsible for the review and approval of all related-party transactions; however, the audit committee does not have written policy regarding the approval of related person transactions. As part of its review and approval of a related person transaction, the audit committee considers:
| • | the nature of the related-person’s interest in the transaction; |
| • | the material terms of the transaction, including the amount involved and type of transaction; |
| • | the importance of the transaction to the related person and to us; |
| • | whether the transaction would impair the judgment of a director or executive officer to act in our best interest; and |
| • | any other matters the audit committee deems appropriate. |
108
Table of Contents
PRINCIPAL AND SELLING STOCKHOLDERS
We are wholly owned by the selling stockholder, Univar N.V., which is itself indirectly wholly-owned by Ulixes B.V. Ulixes B.V. is directly owned by two investment funds, Ulysses Luxembourg and Ulysses Finance.
For purposes of this section, beneficial ownership is determined under the rules of the SEC and generally includes voting or investment power over securities. Unless indicated below, the address of each stockholder is c/o Univar Inc., 17425 NE Union Hill Road, Redmond, WA 90052.
The following table sets forth our direct stockholders immediately prior to this offering and the expected ownership shares upon completion of this offering.
| Shares beneficially owned | |||||||||||||||||
| Name and address of Beneficial Owner |
Immediately prior to the offering |
Shares Offered Hereby |
Upon completion of the offering (without exercise of option) |
Upon completion of the offering (assuming full exercise of option) |
|||||||||||||
| Number | Percent | Number | Percent | Number | Percent | ||||||||||||
| Univar N.V. |
100 | % | % | % | |||||||||||||
| Investors |
0 | 0 | % | — | |||||||||||||
The following table sets forth the beneficial ownership of Ulysses Luxembourg and Ulysses Finance, our indirect parent companies, immediately prior to this offering and the expected ownership shares upon completion of this offering.
| Beneficial Ownership, in % | ||||
| Beneficial Stockholder |
Immediately prior to the offering |
Upon completion of the offering | ||
| Ulysses Participation S.à.r.l.(1) |
74.3 | |||
|
Parcom(2) WTC Schiphol Airport Tower D - 7th Floor 1118 BJ Schiphol Airport Netherlands |
12.1 | |||
| Goldman Sachs Group(3) 200 West Street New York, New York 10282 |
4.7 | |||
| Management of Univar Inc.(4) |
8.8 | |||
| (1) | Ulysses Participation S.à.r.l. is controlled by investment funds advised by CVC Capital Partners. |
| (2) | Includes Parcom Buy Out Fund II B.V. and Parcom Ulysses 2 S.à.r.l. |
| (3) | Includes GSMP V Onshore US, Ltd., GSMP V Offshore US, Ltd. and GSMP V Institutional US, Ltd. |
| (4) | At the time our predecessor was acquired in the 2007 Acquisition, a portion of the equity in our indirect parent companies was set aside for purchase by our directors, officers and other senior employees, or MEP Investors, pursuant to a management equity plan, or MEP. Under the MEP, 8.8% of the equity in each of our indirect parents was issued to an affiliate of CVC Capital Partners and reserved for purchase from time to time at fair market value by eligible MEP Investors. Approximately 89% of the equity set aside for the MEP has been purchased by our MEP Investors. |
| Eligible MEP Investors generally do not have the right to sell the equity acquired through the MEP other than on terms that apply equally to all equity owners of our indirect parents. The equity held by an individual participating in the MEP is subject to a call right by the indirect parents in the event the |
109
Table of Contents
| individual is no longer serving as a director, officer or employee. The price to be paid upon exercise of the call varies based on the circumstances giving rise to the call right, with individuals who voluntarily terminate their employment being entitled to receive the lower of their original investment cost plus 3% per annum or fair market value for their equity, and individuals whose employment we have terminated without cause being entitled to receive fair market value for their equity. If the equity is not called following termination of employment, the MEP Investors may have a right to sell the shares to the indirect parents at a price equal to the lower of their original investment cost plus 3% per annum or fair market value. None of the MEP Investors whose employment has terminated has executed a put right. |
110
Table of Contents
DESCRIPTION OF OUR INDEBTEDNESS
The following descriptions summarize certain material terms and provisions of our ABL Facility, Term Loan Facility and Senior Subordinated Notes. The summaries may not contain all of the information that is important to you. To understand them fully, you should read our ABL Facility, Term Loan Facility, as amended, and our Senior Subordinated Notes and the related indenture, copies of which have been filed as exhibits to the registration statement of which this prospectus is a part. The following descriptions are subject to and qualified in their entirety by reference to our ABL Facility, Term Loan Facility and Senior Subordinated Notes.
ABL Facility
We have a $1,100 million syndicated asset-based loan facility maturing on October 11, 2013. Of this amount, $67.4 million was outstanding and $703.5 million was available to be drawn at March 31, 2010.
Under our ABL Facility, the lenders have agreed to make loans to us (the “ABL Loans”), on a revolving basis, in the aggregate principal amount not to exceed $1,100 million outstanding at any time. Our ABL Facility is divided into two credit facilities, a U.S. Revolving Facility, composed of a Tranche A line of credit with an aggregate maximum amount of $700 million and a Tranche A-1 line of credit with an aggregate maximum amount of $65 million, and a Canadian Revolving Facility, composed of a Tranche A line of credit with an aggregate maximum amount of $300 million and a Tranche A-1 line of credit with an aggregate maximum amount of $35 million. We may request increases in the aggregate commitments under our ABL Facility up to a maximum of $300 million in the aggregate. Subject to the other terms and conditions in our ABL credit agreement, the amount we may borrow under our ABL Facility at any given time is calculated using a borrowing base derived from the value of certain eligible accounts and inventory. The borrowing base of our ABL Facility is an amount equal to a percentage of eligible accounts plus a percentage of eligible inventory, less any reserves, determined in accordance with our ABL Facility. At March 31, 2010, $57.2 million and $10.2 million, respectively, were outstanding under the U.S. Revolving Facility Tranche A-1 and Canadian Revolving Facility Tranche A-1. Our ability to borrow funds under our ABL Facility is subject to compliance with certain operating covenants set forth therein.
Revolving credit borrowings under our ABL Facility bear interest at a rate equal to a margin over a selected benchmark rate, typically LIBOR. The applicable margin for any loan under our ABL Facility depends on the average combined availability (U.S. and Canadian) for the most recent fiscal quarter ranging from 1.25% to 3.0%, and the current margin is 2.50%.
Our ABL Facility contains affirmative covenants requiring that we maintain properties, comply with laws, maintain insurance, pay taxes, establish and maintain cash management systems and deliver financial and other information. Our ABL Facility requires that our consolidated fixed charge coverage ratio (as defined in our ABL Facility) not be less than 1.00 to 1.00. As of December 31, 2009 and March 31, 2010, we believe we were in compliance with this financial covenant. Our ABL Facility also contains negative covenants which restrict and/or limit our operations and activities, including, among others, the incurrence of indebtedness, the creation or incurrence of liens, the sale of assets, investments and acquisitions, mergers, declarations or payment of dividends on or other payments or distributions to stockholders and certain transactions with an affiliate on terms materially more favorable than those we could obtain from a non-affiliate. As of December 31, 2009 and March 31, 2010, we believe we were in compliance with these covenants.
Our ABL Facility provides for various events of default, including interest and payment defaults, breach of covenants, agreements, representations and warranties under our ABL Facility, cross defaults to other indebtedness in excess of $25 million, judgments in excess of $25 million which remain discharged for a period of 60 days and certain events relating to bankruptcy or insolvency. Our ABL Facility also includes a change-in-control event of default in which the acquisition of direct or indirect beneficial ownership of our stock by any person, entity or “group” that exceeds 35% of our outstanding voting stock and exceeds the percentage of
111
Table of Contents
our voting stock beneficially owned, in the aggregate, by any collective investment vehicle sponsored, advised, managed or formed by CVC Capital Partners and its affiliates would be an event of default.
Our ABL Facility is secured by the grant of a security interest in substantially all of the assets of our U.S. and Canadian subsidiary companies.
Term Loan Facility
We have a $1,250 million syndicated Term Loan Facility maturing on October 11, 2014, of which $1,134 million was outstanding at March 31, 2010.
Our Term Loan Facility is divided into two tranches, a Term Loan A of $215 million and a Term Loan B of $1,035 million, of which $154.2 million and $979.7 million, respectively, were outstanding at March 31, 2010.
Term Loan A loans bear interest at a rate equal to a margin over a selected benchmark rate, typically LIBOR, based upon our consolidated total leverage ratio (as defined in our Term Loan Facility). The applicable margin for a LIBOR Term Loan A loan is 2.50% if our consolidated total leverage ratio is less than 4.75 to 1.00 and 2.75% if our consolidated total leverage ratio is greater than or equal to 4.75 to 1.00. The applicable margin for a LIBOR Term Loan B loan is 3.0%. Under our Term Loan Facility, the margin is 2.5% on the Term Loan A and 3.0% on the Term Loan B.
Our Term Loan Facility contains affirmative covenants of the Company, including, among others, maintenance of properties, compliance with laws, maintenance of insurance, payment of taxes and delivery of financial and other information. Our Term Loan Facility requires that through June 30, 2010 our consolidated total leverage ratio be greater than 6.50 to 1.00 after which it decreases over time reaching 5.00 to 1.00 as of December 31, 2012. Our Term Loan Facility further requires that through June 30, 2010 our consolidated interest coverage ratio, which is Adjusted EBITDA to consolidated interest expense, not be less than 1.65 to 1.00 after which it increases over time reaching 2.15 to 1.00 as of December 31, 2012. In addition, the Company is required to make certain repayments of our Term Loan Facility from certain asset sales and excess cash flow. One hundred percent of the gross cash proceeds of certain asset sales, less the amount of such proceeds that we reinvest in our business, are required to be applied to the repayment of the Term Loan Facility. Fifty percent of the excess cash flow, as determined in our Term Loan Facility, is required to be prepaid to Term Loan Facility lenders on a pro rata basis before April 30 of the following year. Our Term Loan Facility also contains restrictive covenants which impose restrictions and/or limitations on the operations and activities of the Company and its subsidiaries, including, among others, the incurrence of indebtedness, the creation or incurrence of liens, the sale of assets, investments and acquisitions, mergers, declarations or payment of dividends on or other payments or distributions to stockholders, capital expenditures and certain transactions with an affiliate on terms materially more favorable than those obtainable by a non-affiliate. As of December 31, 2009 and March 31, 2010, we believe we were in compliance with these covenants. As of June 30, 2010, after giving effect to this offering, our consolidated leverage ratio would be and our consolidated interest coverage ratio would be .
Our Term Loan Facility provides for the same events of default as our ABL Facility. See “—ABL Facility.”
The Term Loan is secured by the grant of a security interest in substantially all of the assets of our U.S. and U.K. operating companies, but this lien, as it relates to U.S. collateral, which is shared with our ABL Facility, ranks junior to our ABL Facility.
12% Senior Subordinated Notes due 2015
We had $600 million of our 12% Senior Subordinated Notes due 2015, or the Senior Subordinated Notes, outstanding as of March 31, 2010. The Senior Subordinated Notes mature in September 2015. Interest on the Senior Subordinated Notes is payable quarterly at a rate of 12% per annum. Prior to September 30, 2010,
112
Table of Contents
(1) up to 40% of the Senior Subordinated Notes can be redeemed at a price of 116% of their principal amount, plus accrued and unpaid interest, with the net cash proceeds of an offering of common stock or (2) the entire outstanding principal amount may be redeemed in whole at a price of 100% plus the applicable premium. The applicable premium is calculated by dividing (1) 106% of the amount of the Senior Subordinated Notes, plus interest, discounted at a rate equal to the yield of U.S. Treasury securities plus 50 basis points, by (2) the principal amount of the Senior Subordinated Notes. After September 30, 2010, the Senior Subordinated Notes may be redeemed at any time at a price of 106% in 2010, decreasing over time to 100% in 2013 and thereafter. Except for certain required repurchase offers and mandatory redemption upon a securities exchange, there is no sinking fund or mandatory redemption applicable to the Senior Subordinated Notes.
The indenture relating to the Senior Subordinated Notes contains, among others, customary covenants with respect to incurrence of indebtedness, restricted payments, dividend and other payment restrictions affecting subsidiaries, asset sales, transactions with affiliates, change of control and merger, consolidation and sale of certain assets. Pursuant to the indenture, we and our subsidiaries cannot incur indebtedness unless our consolidated fixed charge coverage ratio for the last four fiscal quarters would have been at least 2.00 to 1.00 and the indebtedness incurred by certain subsidiaries that are not guarantors does not exceed $100 million. This limitation does not, however, prohibit, among other exceptions, our incurrence of indebtedness under our credit facilities in an aggregate amount not to exceed $2.3 billion. As of December 31, 2009 and March 31, 2010, we believe we were in compliance with these covenants.
The Senior Subordinated Notes are subordinate in right of payment to our credit facilities.
The registration rights agreement related to the issuance of the Senior Subordinated Notes contains a provision regarding piggyback rights stating that if we file a registration statement for the registration of debt securities, we must offer to holders of the Senior Subordinated Notes to include in the filing the amount of Senior Subordinated Notes that the holders request.
113
Table of Contents
DESCRIPTION OF OUR CAPITAL STOCK
The following descriptions are summaries of material terms of our amended and restated certificate of incorporation and bylaws as each will be in effect upon the closing of this offering. They may not contain all of the information that is important to you. To understand them fully, you should read our amended and restated certificate of incorporation and bylaws, copies of which are filed with the SEC as exhibits to the registration statement of which this prospectus is a part. The following descriptions are qualified in their entirety by reference to our amended and restated certificate of incorporation and bylaws and applicable law.
Upon the closing of this offering, our authorized capital stock will consist of shares of common stock, par value $0.01 per share, and shares of preferred stock, par value $0.01 per share. As of June 28, 2010, there were 196 shares of common stock outstanding and no shares of preferred stock outstanding. Upon the closing of this offering, we will have shares of common stock and no shares of preferred stock outstanding. In addition, as of , 2010, shares of our common stock were reserved for issuance under equity plans or other relevant commitments, and options to purchase shares of our common stock were outstanding.
Common Stock
Upon the closing of this offering, we will be authorized to issue one class of common stock. Stockholders will be entitled to one vote for each share of our common stock held of record on all matters on which stockholders are entitled or permitted to vote. Our common stock does not have cumulative voting rights in the election of directors. As a result, holders of a majority of the shares of our common stock voting for the election of directors can elect all the directors standing for election. Upon the closing of this offering, funds advised by CVC Capital Partners will indirectly own a majority of the shares of our outstanding common stock. See “Principal and Selling Stockholders” and “Risk Factors—Risks Related to Our Capital Structure.”
Holders of our common stock will be entitled to receive dividends, if any, out of legally available funds when and if declared from time to time by our board of directors. See “Dividend Policy.” In the event of our liquidation, dissolution or winding-up, the holders of our common stock will be entitled to share ratably in all assets remaining after payment of liabilities, subject to the rights of any then outstanding preferred stock. Our common stock will have no preemptive, subscription or conversion rights, and there are no redemption or sinking fund provisions applicable to our common stock. The rights, preferences and privileges of holders of our common stock will be subject to, and may be adversely affected by, the rights of holders of shares of any series of preferred stock that we may designate and issue in the future. All outstanding shares of our common stock are fully paid and nonassessable and the shares of common stock offered hereby will be fully paid and nonassessable.
Preferred Stock
Our board of directors is authorized to issue preferred stock in one or more series, to establish the number of shares to be included in each such series and to fix the designation and powers, preferences and rights of such shares, and the qualifications, limitations and restrictions thereof. The issuance of preferred stock, while providing flexibility in connection with possible acquisitions and other corporate purposes, could have the effect of delaying or preventing our change in control, and may cause the market price of our common stock to decline or impair the voting and other rights of the holders of our common stock. We have no current plans to issue any shares of preferred stock.
Anti-Takeover Effects of Our Amended and Restated Certificate of Incorporation and Bylaws and Delaware Law
Some provisions of Delaware law and our amended and restated certificate of incorporation and bylaws could make the acquisition of our company or the removal of our incumbent directors and management more
114
Table of Contents
difficult. These provisions are designed to encourage persons seeking to acquire control of our company to first negotiate with our board of directors. However, these provisions could have the effect of delaying, discouraging or preventing attempts to acquire us, which could deprive our stockholders of opportunities to sell their shares of common stock at prices higher than prevailing market prices.
Our amended and restated certificate of incorporation provides that stockholder action can be taken only at an annual or special meeting of stockholders and cannot be taken by written consent in lieu of a meeting. Our bylaws provide that, except as otherwise required by law, annual or special meetings of stockholders can only be called pursuant to a resolution adopted by a majority of the total number of directors then in office or by the chairman of the board. Stockholders are not permitted to call a special meeting or to require the board of directors to call a special meeting. Our bylaws establish an advance notice procedure for stockholder proposals to be brought before an annual or special meeting of stockholders, including proposed nominations of persons for election to the board of directors. Stockholders at an annual or special meeting may only consider proposals or nominations specified in the notice of meeting or brought before the meeting by or at the direction of the board of directors or by a stockholder who was a stockholder of record on the record date for the meeting, who is entitled to vote at the meeting and who has given timely written notice, in proper form, of the stockholder’s intention to bring that business before the meeting.
Delaware Anti-Takeover Law. Following completion of this offering, we will be subject to the business combination provisions of Section 203 of the Delaware General Corporation Law. In general, these provisions prohibit a publicly held Delaware corporation from engaging in various business combination transactions with any interested stockholder for a period of three years after the date of the transaction in which the person became an interested stockholder, unless:
| • | the business combination transaction or the transaction resulting in a stockholder becoming an interested stockholder is approved by the board of directors prior to the date the interested stockholder obtained such status; |
| • | upon consummation of the transaction that resulted in the stockholder becoming an interested stockholder, the stockholder owned at least 85% of the voting stock of the corporation outstanding at the time the transaction commenced; or |
| • | on or subsequent to such date, the business combination is approved by the board of directors and authorized at an annual or special meeting of stockholders by the affirmative vote of at least two-thirds of the outstanding voting stock that is not owned by the interested stockholder. |
A “business combination” is defined to include mergers, asset sales and other transactions resulting in financial benefit to a stockholder. In general, an “interested stockholder” is a person who, together with affiliates and associates, owns (or within three years, did own) 15% or more of a corporation’s voting stock. The statute could prohibit or delay mergers or other takeover or change in control attempts with respect to us and, accordingly, may discourage attempts to acquire us even though such a transaction may offer our stockholders the opportunity to sell their stock at a price above the prevailing market price.
Undesignated Preferred Stock. The authorization of undesignated preferred stock makes it possible for our board of directors to issue preferred stock with voting or other rights or preferences that could deter or make more difficult an attempt to gain control of our company.
Election and Removal of Directors. Our amended and restated certificate of incorporation and bylaws contain provisions that establish specific procedures for appointing and removing members of our board of directors. Our amended and restated certificate of incorporation and bylaws provide that vacancies and newly created directorships on our board of directors may be filled only by a majority of the directors then serving on our board or by the sole remaining director. Under our amended and restated certificate of incorporation and
115
Table of Contents
bylaws, directors may be removed only for cause. Our bylaws provide that the size of the board of directors will be fixed from time to time by our board of directors.
Limitations on Stockholder Action. Under our amended and restated certificate of incorporation and bylaws, only our chairman of the board, our chief executive officer or our board of directors may call special meetings of stockholders. Under our amended and restated certificate of incorporation and bylaws, stockholders may not act by written consent. Our bylaws establish advance notice procedures with respect to stockholder proposals and the stockholder nomination of candidates for election as directors.
Amendment of Certain Provisions in Bylaws. Amendments of the provisions in our bylaws with respect to the advance notice provisions for stockholder nominations or proposals and the provisions with respect to the size of our board of directors require approval by holders of at least two-thirds of our outstanding capital stock entitled to vote generally in the election of directors.
Transfer Agent and Registrar
The transfer agent and registrar for our common stock is .
Listing
We intend to apply to list our common stock on the under the symbol “ ”.
116
Table of Contents
SHARES ELIGIBLE FOR FUTURE SALE
Prior to this offering, there has been no public market for our common stock. Future sales of substantial amounts of our common stock in the public market, or the perception that such sales may occur, could adversely affect the prevailing market price of our common stock. Upon completion of this offering, there will be shares of our common stock outstanding, excluding approximately shares of common stock underlying outstanding stock options and rights. Of these shares, shares of common stock expected to be sold in this offering will be freely transferable without restriction or further registration under the Securities Act of 1933. The remaining shares of common stock held by us, our executive officers, directors and stockholders will be subject to the lock-up arrangements described below and will be eligible for resale pursuant to Rule 144 as described below, after the expiration of the lock-up arrangements.
The following table shows when the shares of our common stock that are not being sold in this offering, but which will be outstanding when this offering is complete, will be eligible for sale in the public market:
| Date |
Shares Eligible for Sale | |
| On the date of this prospectus |
||
| days after the date of this prospectus |
||
| At various times beginning days or more after the date of this prospectus |
Lock-Up Agreements
In connection with this offering, we, our executive officers, directors and stockholders will enter into -day lock-up agreements with the underwriters of this offering under which neither we nor they may, for a period of days after the date of this prospectus, directly or indirectly sell or dispose of any shares of common stock or any securities convertible into or exchangeable or exercisable for shares of common stock without the prior written consent of the representatives. See “Underwriting.”
Rule 144
In general, under Rule 144, a person (or persons whose shares are required to be aggregated), including an affiliate, who has beneficially owned shares for at least one year is entitled to sell, within any three-month period commencing 90 days after the date of this prospectus, a number of shares that does not exceed the greater of:
| • | 1% of the number of shares of common stock then outstanding, which will equal approximately shares after the closing of this offering; or |
| • | the average weekly trading volume of the common stock during the four calendar weeks preceding the filing of a notice on Form 144 with respect to such sale. |
In addition to this volume limitation, sales under Rule 144 also are subject to manner-of-sale restrictions, notice requirements and the availability of current public information about us.
Stock Options
As of , 2010, employee stock options to purchase and rights with respect to a total of approximately shares of common stock were outstanding. We intend to file a registration statement on Form S-8 under the Securities Act to register the issuance and resale of those shares issuable under our stock option plan. That registration statement automatically becomes effective upon filing. As a result, when the
117
Table of Contents
options or rights are exercised, such shares issuable on exercise thereof will be freely tradable under the Securities Act, except that any shares purchased by “affiliates,” as that term is defined in Rule 144, would be subject to limitations and restrictions that are described above. For a discussion of key terms of the Company’s stock option and stock purchase plans, see “Management—Benefit Plans.”
Registration Rights
The selling stockholder has the right to require us to register its shares of our common stock, representing approximately shares of our common stock following completion of this offering. Registration of such shares under the Securities Act would result in such shares becoming freely tradable without restriction under the Securities Act, except for shares purchased by “affiliates,” as that term is defined in Rule 144, immediately upon the effectiveness of such registration.
118
Table of Contents
CERTAIN UNITED STATES TAX CONSEQUENCES
TO NON-U.S. HOLDERS OF COMMON STOCK
This section summarizes certain U.S. federal income and estate tax consequences of the ownership and disposition of common stock by a non-U.S. holder. You are a non-U.S. holder if you are, for U.S. federal income tax purposes:
| • | a nonresident alien individual, |
| • | a foreign corporation, or |
| • | an estate or trust that in either case is not subject to U.S. federal income tax on a net income basis on income or gain from common stock. |
This section does not consider the specific facts and circumstances that may be relevant to a particular non-U.S. holder and does not address the treatment of a non-U.S. holder under the laws of any state, local or foreign taxing jurisdiction. This section is based on the tax laws of the United States, including the Internal Revenue Code of 1986, as amended, existing and proposed regulations, and administrative and judicial interpretations, all as currently in effect. These laws are subject to change, possibly on a retroactive basis.
If a partnership holds the common stock, the U.S. federal income tax treatment of a partner will generally depend on the status of the partner and the tax treatment of the partnership. A partner in a partnership holding the common stock should consult its tax advisor with regard to the U.S. federal income tax treatment of an investment in the common stock.
You should consult a tax advisor regarding the U.S. federal tax consequences of acquiring, holding and disposing of common stock in your particular circumstances, as well as any tax consequences that may arise under the laws of any state, local or foreign taxing jurisdiction.
Dividends
As discussed under the section entitled “Dividend Policy” above, we do not currently anticipate paying any cash dividends in the foreseeable future. In the event that we do pay dividends, except as described below, if you are a non-U.S. holder of common stock, dividends paid to you are subject to withholding of U.S. federal income tax at a 30% rate or at a lower rate if you are eligible for the benefits of an income tax treaty that provides for a lower rate. Even if you are eligible for a lower treaty rate, we and other payors will generally be required to withhold at a 30% rate (rather than the lower treaty rate) on dividend payments to you, unless you have furnished to us or another payor:
| • | a valid Internal Revenue Service Form W-8BEN or an acceptable substitute form upon which you certify, under penalties of perjury, your status as a non-U.S. person and your entitlement to the lower treaty rate with respect to such payments, or |
| • | in the case of payments made outside the United States to an offshore account (generally, an account maintained by you at an office or branch of a bank or other financial institution at any location outside the United States), other documentary evidence establishing your entitlement to the lower treaty rate in accordance with U.S. Treasury regulations. |
If you are eligible for a reduced rate of U.S. withholding tax under a tax treaty, you may obtain a refund of any amounts withheld in excess of that rate by filing a refund claim with the United States Internal Revenue Service.
If dividends paid to you are “effectively connected” with your conduct of a trade or business within the United States, and, if required by a tax treaty, the dividends are attributable to a permanent establishment that
119
Table of Contents
you maintain in the United States, we and other payors generally are not required to withhold tax from the dividends, provided that you have furnished to us or another payor a valid Internal Revenue Service Form W-8ECI or an acceptable substitute form upon which you represent, under penalties of perjury, that:
| • | you are a non-U.S. person, and |
| • | the dividends are effectively connected with your conduct of a trade or business within the United States and are includible in your gross income. |
“Effectively connected” dividends are taxed at rates applicable to U.S. citizens, resident aliens and domestic U.S. corporations.
If you are a corporate non-U.S. holder, “effectively connected” dividends that you receive may, under certain circumstances, be subject to an additional “branch profits tax” at a 30% rate or at a lower rate if you are eligible for the benefits of an income tax treaty that provides for a lower rate.
Gain on Disposition of Common Stock
If you are a non-U.S. holder, you generally will not be subject to U.S. federal income tax on gain that you recognize on a disposition of common stock unless:
| • | the gain is “effectively connected” with your conduct of a trade or business in the United States, and the gain is attributable to a permanent establishment that you maintain in the United States, if that is required by an applicable income tax treaty as a condition for subjecting you to United States taxation on a net income basis, |
| • | you are an individual, you hold the common stock as a capital asset, you are present in the United States for 183 or more days in the taxable year of the sale and certain other conditions exist, or |
| • | we are or have been a U.S. real property holding corporation for federal income tax purposes and you held, directly or indirectly, at any time during the five-year period ending on the date of disposition, more than 5% of the common stock and you are not eligible for any treaty exemption. |
If you are a corporate non-U.S. holder, “effectively connected” gains that you recognize may also, under certain circumstances, be subject to an additional “branch profits tax” at a 30% rate or at a lower rate if you are eligible for the benefits of an income tax treaty that provides for a lower rate.
We have not been, are not and do not anticipate becoming a U.S. real property holding corporation for United States federal income tax purposes.
Withholdable Payments to Foreign Financial Entities and Other Foreign Entities
Under recently enacted legislation, a 30% withholding tax would be imposed on certain payments that are made after December 31, 2012 to certain foreign financial institutions, investment funds and other non-U.S. persons that fail to comply with information reporting requirements in respect of their direct and indirect U.S. stockholders and/or U.S. accountholders. Such payments would include U.S.-source dividends and the gross proceeds from the sale or other disposition of stock that can produce U.S.-source dividends.
Federal Estate Taxes
Common stock held by a non-U.S. holder at the time of death will be included in the holder’s gross estate for U.S. federal estate tax purposes, unless an applicable estate tax treaty provides otherwise.
120
Table of Contents
Backup Withholding and Information Reporting
If you are a non-U.S. holder, you are generally exempt from backup withholding and information reporting requirements with respect to:
| • | dividend payments and |
| • | the payment of the proceeds from the sale of common stock effected at a United States office of a broker, |
as long as:
| • | the payor or broker does not have actual knowledge or reason to know that you are a U.S. person and you have furnished to the payor or broker: |
| • | a valid Internal Revenue Service Form W-8BEN or an acceptable substitute form upon which you certify, under penalties of perjury, that you are a non-U.S. person, or |
| • | other documentation upon which it may rely to treat the payments as made to a non-U.S. person in accordance with U.S. Treasury regulations, or |
| • | you otherwise establish an exemption. |
Payment of the proceeds from the sale of common stock effected at a foreign office of a broker generally will not be subject to information reporting or backup withholding. However, a sale of common stock that is effected at a foreign office of a broker will be subject to information reporting and backup withholding if:
| • | the proceeds are transferred to an account maintained by you in the United States, |
| • | the payment of proceeds or the confirmation of the sale is mailed to you at a U.S. address, or |
| • | the sale has some other specified connection with the United States as provided in U.S. Treasury regulations, |
unless the broker does not have actual knowledge or reason to know that you are a United States person and the documentation requirements described above are met or you otherwise establish an exemption.
In addition, a sale of common stock will be subject to information reporting if it is effected at a foreign office of a broker that is:
| • | a U.S. person, |
| • | a controlled foreign corporation for U.S. tax purposes, |
| • | a foreign person 50% or more of whose gross income is effectively connected with the conduct of a United States trade or business for a specified three-year period, or |
| • | a foreign partnership, if at any time during its tax year: |
| • | one or more of its partners are “U.S. persons,” as defined in U.S. Treasury regulations, who in the aggregate hold more than 50% of the income or capital interest in the partnership, or |
| • | such foreign partnership is engaged in the conduct of a U.S. trade or business, |
121
Table of Contents
unless the broker does not have actual knowledge or reason to know that you are a U.S. person and the documentation requirements described above are met or you otherwise establish an exemption. Backup withholding will apply if the sale is subject to information reporting and the broker has actual knowledge that you are a U.S. person.
You generally may obtain a refund of any amounts withheld under the backup withholding rules that exceed your income tax liability by filing a refund claim with the Internal Revenue Service.
122
Table of Contents
Goldman, Sachs & Co. and Merrill Lynch, Pierce, Fenner & Smith Incorporated are acting as representatives of each of the underwriters named below. Subject to the terms and conditions set forth in an underwriting agreement among us, the selling stockholder and the underwriters, we and the selling stockholder have agreed to sell to the underwriters, and each of the underwriters has agreed, severally and not jointly, to purchase from us and the selling stockholder, the number of shares of common stock set forth opposite its name below.
| Underwriter | Number of Shares | |
| Goldman, Sachs & Co. |
||
| Merrill Lynch, Pierce, Fenner & Smith |
||
| Barclays Capital Inc. |
||
| Deutsche Bank Securities Inc. |
||
| J.P. Morgan Securities Inc. |
||
| Morgan Stanley & Co. Incorporated |
||
| Total |
||
Subject to the terms and conditions set forth in the underwriting agreement, the underwriters have agreed, severally and not jointly, to purchase all of the shares sold under the underwriting agreement if any of these shares are purchased, other than the shares covered by the option described below unless and until this option is exercised. If an underwriter defaults, the underwriting agreement provides that the purchase commitments of the nondefaulting underwriters may be increased or the underwriting agreement may be terminated.
We and the selling stockholder have agreed to indemnify the underwriters against certain liabilities, including liabilities under the Securities Act, or to contribute to payments the underwriters may be required to make in respect of those liabilities.
The underwriters are offering the shares, subject to prior sale, when, as and if issued to and accepted by them, subject to approval of legal matters by their counsel, including the validity of the shares, and other conditions contained in the underwriting agreement, such as the receipt by the underwriters of officer’s certificates and legal opinions. The underwriters reserve the right to withdraw, cancel or modify offers to the public and to reject orders in whole or in part.
Commissions and Discounts
The representatives have advised us and the selling stockholder that the underwriters propose initially to offer the shares to the public at the public offering price set forth on the cover page of this prospectus and to dealers at that price less a concession not in excess of $ per share. After the initial offering, the public offering price, concession or any other term of the offering may be changed.
123
Table of Contents
The following table shows the public offering price, underwriting discounts and commissions and proceeds before expenses to us and the selling stockholder. The information assumes either no exercise or full exercise by the underwriters of their overallotment option.
| Per Share | Without Option | With Option | ||||
| Public offering price |
$ | $ | $ | |||
| Underwriting discounts and commissions |
$ | $ | $ | |||
| Proceeds, before expenses, to Univar |
$ | $ | $ | |||
| Proceeds, before expenses, to the selling stockholder |
$ | $ | $ |
The expenses of this offering, not including underwriting discounts and commissions, are estimated at $ and are payable by us.
Overallotment Option
The selling stockholder has granted an option to the underwriters to purchase up to additional shares at the public offering price, less underwriting discounts and commissions. The underwriters may exercise this option for 30 days from the date of this prospectus solely to cover overallotments, if any. If the underwriters exercise this option, each will be obligated, subject to conditions contained in the underwriting agreement, to purchase a number of additional shares proportionate to that underwriter’s initial amount reflected in the above table.
No Sales of Similar Securities
We and the selling stockholder, our executive officers and our directors have agreed not to sell or transfer any common stock or securities convertible into, exchangeable for, exercisable for, or repayable with common stock, for days after the date of this prospectus without first obtaining the written consent of the representatives. Specifically, we and these other persons have agreed, with certain limited exceptions, not to directly or indirectly:
| • | offer, pledge, sell or contract to sell any common stock, |
| • | sell any option or contract to purchase any common stock, |
| • | purchase any option or contract to sell any common stock, |
| • | grant any option, right or warrant for the sale of any common stock, |
| • | lend or otherwise dispose of or transfer any common stock, |
| • | request or demand that we file a registration statement related to the common stock, or |
| • | enter into any swap or other agreement that transfers, in whole or in part, the economic consequence of ownership of any common stock whether any such swap or transaction is to be settled by delivery of shares or other securities, in cash or otherwise. |
This lock-up provision applies to common stock and to securities convertible into or exchangeable or exercisable for or repayable with common stock. It also applies to common stock owned now or acquired later by the person executing the agreement or for which the person executing the agreement later acquires the power of disposition. In the event that either (x) during the last 17 days of the lock-up period referred to above, we issue an earnings release or material news or a material event relating to us occurs or (y) prior to the expiration of the lock-up period, we announce that we will release earnings results or become aware that material news or a
124
Table of Contents
material event will occur during the 16-day period beginning on the last day of the lock-up period, the restrictions described above shall continue to apply until the expiration of the 18-day period beginning on the issuance of the earnings release or the occurrence of the material news or material event.
Listing
We intend to apply to list our common stock on the under the symbol “ ”. In order to meet the requirements for listing on that exchange, the underwriters have undertaken to sell a minimum number of shares to a minimum number of beneficial owners as required by that exchange.
Before this offering, there has been no public market for our common stock. The initial public offering price will be determined through negotiations among us, the selling stockholder and the representatives. In addition to prevailing market conditions, the factors to be considered in determining the initial public offering price are
| • | the valuation multiples of publicly traded companies that the representatives believe to be comparable to us, |
| • | our financial information, |
| • | the history of, and the prospects for, our company and the industry in which we compete, |
| • | an assessment of our management, its past and present operations, and the prospects for, and timing of, our future revenues, |
| • | the present state of our development, and |
| • | the above factors in relation to market values and various valuation measures of other companies engaged in activities similar to ours. |
An active trading market for the shares may not develop. It is also possible that after the offering the shares will not trade in the public market at or above the initial public offering price.
The underwriters do not expect to sell more than 5% of the shares in the aggregate to accounts over which they or their affiliates exercise discretionary authority.
Price Stabilization, Short Positions and Penalty Bids
Until the distribution of the shares is completed, SEC rules may limit underwriters and selling group members from bidding for and purchasing our common stock. However, the representatives may engage in transactions that stabilize the price of the common stock, such as bids or purchases to peg, fix or maintain that price.
In connection with the offering, the underwriters may purchase and sell our common stock in the open market. These transactions may include short sales, purchases on the open market to cover positions created by short sales and stabilizing transactions. Short sales involve the sale by the underwriters of a greater number of shares than they are required to purchase in the offering. “Covered” short sales are sales made in an amount not greater than the underwriters’ overallotment option described above. The underwriters may close out any covered short position by either exercising their overallotment option or purchasing shares in the open market. In determining the source of shares to close out the covered short position, the underwriters will consider, among other things, the price of shares available for purchase in the open market as compared to the price at which they may purchase shares through the overallotment option. “Naked” short sales are sales in excess of the
125
Table of Contents
overallotment option. The underwriters must close out any naked short position by purchasing shares in the open market. A naked short position is more likely to be created if the underwriters are concerned that there may be downward pressure on the price of our common stock in the open market after pricing that could adversely affect investors who purchase in the offering. Stabilizing transactions consist of various bids for or purchases of shares of common stock made by the underwriters in the open market prior to the completion of the offering.
The underwriters may also impose a penalty bid. This occurs when a particular underwriter repays to the underwriters a portion of the underwriting discounts and commissions received by it because the representatives have repurchased shares sold by or for the account of such underwriter in stabilizing or short covering transactions.
Similar to other purchase transactions, the underwriters’ purchases to cover the syndicate short sales and stabilizing transactions may have the effect of raising or maintaining the market price of our common stock or preventing or retarding a decline in the market price of our common stock, and together with the imposition of a penalty bid, may stabilize, maintain or otherwise affect the market price of our common stock. As a result, the price of our common stock may be higher than the price that might otherwise exist in the open market. If these activities are commenced, they may be discontinued at any time. The underwriters may conduct these transactions on the , in the over-the-counter market or otherwise.
Neither we nor any of the underwriters make any representation or prediction as to the direction or magnitude of any effect that the transactions described above may have on the price of our common stock. In addition, neither we nor any of the underwriters make any representation that the representatives will engage in these transactions or that these transactions, once commenced, will not be discontinued without notice.
Electronic Offer, Sale and Distribution of Shares
In connection with the offering, certain of the underwriters or securities dealers may distribute prospectuses by electronic means, such as e-mail. In addition, Goldman, Sachs & Co. and Merrill Lynch, Pierce, Fenner & Smith Incorporated may facilitate Internet distribution for this offering to certain of their Internet subscription customers. Goldman, Sachs & Co. and Merrill Lynch, Pierce, Fenner & Smith Incorporated may allocate a limited number of shares for sale to their online brokerage customers. An electronic prospectus is available on the Internet web site maintained by Goldman, Sachs & Co. and Merrill Lynch, Pierce, Fenner & Smith Incorporated. Other than the prospectus in electronic format, the information on each of the Goldman, Sachs & Co. and Merrill Lynch, Pierce, Fenner & Smith Incorporated Internet web sites is not part of this prospectus.
Certain of the underwriters or their affiliates are lenders under certain of our indebtedness. We intend to repay certain of our outstanding indebtedness using the net proceeds of this offering received by us and will pay such amounts to the underwriters or their respective affiliates in proportion to their respective current commitments under certain of our indebtedness. Because of the manner in which the proceeds will be used, the offering will be conducted in accordance with FINRA Rule 2720. This rule requires, among other things, that a qualified independent underwriter has participated in the preparation of, and has exercised the usual standards of “due diligence” in respect to, the registration statement and this prospectus. has agreed to act as qualified independent underwriter for the offering and to undertake the legal responsibilities and liabilities of an underwriter under the Securities Act of 1933, specifically including those inherent in Section 11 of the Securities Act.
Other Relationships
The underwriters and their respective affiliates are full service financial institutions engaged in various activities, which may include securities trading, commercial and investment banking, financial advisory, investment management, investment research, principal investment, hedging, financing and brokerage activities.
126
Table of Contents
Certain of the underwriters and their respective affiliates have, from time to time, performed, and may in the future perform, various financial advisory and investment banking services for the Company, for which they received or will receive customary fees and expenses.
In the ordinary course of their various business activities, the underwriters and their respective affiliates may make or hold a broad array of investments and actively trade debt and equity securities (or related derivative securities) and financial instruments (including bank loans) for their own account and for the accounts of their customers, and such investment and securities activities may involve securities and/or instruments of the Company. The underwriters and their respective affiliates may also make investment recommendations and/or publish or express independent research views in respect of such securities or instruments and may at any time hold, or recommend to clients that they acquire, long and/or short positions in such securities and instruments.
Notice to Prospective Investors in the EEA
In relation to each Member State of the European Economic Area which has implemented the Prospectus Directive (each, a “Relevant Member State”) an offer to the public of any shares which are the subject of the offering contemplated by this prospectus may not be made in that Relevant Member State, except that an offer to the public in that Relevant Member State of any shares may be made at any time under the following exemptions under the Prospectus Directive, if they have been implemented in that Relevant Member State:
| (a) | to legal entities which are authorized or regulated to operate in the financial markets or, if not so authorized or regulated, whose corporate purpose is solely to invest in securities; |
| (b) | to any legal entity which has two or more of (1) an average of at least 250 employees during the last financial year; (2) a total balance sheet of more than €43,000,000 and (3) an annual net turnover of more than €50,000,000, as shown in its last annual or consolidated accounts; |
| (c) | by the underwriters to fewer than 100 natural or legal persons (other than “qualified investors” as defined in the Prospectus Directive) subject to obtaining the prior consent of the representatives for any such offer; or |
| (d) | in any other circumstances falling within Article 3(2) of the Prospectus Directive; |
provided that no such offer of shares shall result in a requirement for the publication by us or any representative of a prospectus pursuant to Article 3 of the Prospectus Directive.
Any person making or intending to make any offer of shares within the EEA should only do so in circumstances in which no obligation arises for us or any of the underwriters to produce a prospectus for such offer. Neither we nor the underwriters have authorized, nor do they authorize, the making of any offer of shares through any financial intermediary, other than offers made by the underwriters which constitute the final offering of shares contemplated in this prospectus.
For the purposes of this provision, and your representation below, the expression an “offer to the public” in relation to any shares in any Relevant Member State means the communication in any form and by any means of sufficient information on the terms of the offer and any shares to be offered so as to enable an investor to decide to purchase any shares, as the same may be varied in that Relevant Member State, by any measure implementing the Prospectus Directive in that Relevant Member State and the expression “Prospectus Directive” means Directive 2003/71/EC and includes any relevant implementing measure in each Relevant Member State.
Each person in a Relevant Member State who receives any communication in respect of, or who acquires any shares under, the offer of shares contemplated by this prospectus will be deemed to have represented, warranted and agreed to and with us and each underwriter that:
| (A) | it is a “qualified investor” within the meaning of the law in that Relevant Member State implementing Article 2(1)(e) of the Prospectus Directive; and |
127
Table of Contents
| (B) | in the case of any shares acquired by it as a financial intermediary, as that term is used in Article 3(2) of the Prospectus Directive, (i) the shares acquired by it in the offering have not been acquired on behalf of, nor have they been acquired with a view to their offer or resale to, persons in any Relevant Member State other than “qualified investors” (as defined in the Prospectus Directive), or in circumstances in which the prior consent of the representatives has been given to the offer or resale; or (ii) where shares have been acquired by it on behalf of persons in any Relevant Member State other than qualified investors, the offer of those shares to it is not treated under the Prospectus Directive as having been made to such persons. |
Notice to Prospective Investors in the United Kingdom
In addition, in the United Kingdom, this document is being distributed only to, and is directed only at, and any offer subsequently made may only be directed at persons who are “qualified investors” (as defined in the Prospectus Directive) (i) who have professional experience in matters relating to investments falling within Article 19 (5) of the Financial Services and Markets Act 2000 (Financial Promotion) Order 2005, as amended (the “Order”) and/or (ii) who are high net worth companies (or persons to whom it may otherwise be lawfully communicated) falling within Article 49(2)(a) to (d) of the Order (all such persons together being referred to as “relevant persons”). This document must not be acted on or relied on in the United Kingdom by persons who are not relevant persons. In the United Kingdom, any investment or investment activity to which this document relates is only available to, and will be engaged in with, relevant persons.
Notice to Prospective Investors in Hong Kong
The shares may not be offered or sold by means of any document other than (i) in circumstances which do not constitute an offer to the public within the meaning of the Companies Ordinance (Cap.32, Laws of Hong Kong), or (ii) to “professional investors” within the meaning of the Securities and Futures Ordinance (Cap.571, Laws of Hong Kong) and any rules made thereunder, or (iii) in other circumstances which do not result in the document being a “prospectus” within the meaning of the Companies Ordinance (Cap.32, Laws of Hong Kong), and no advertisement, invitation or document relating to the shares may be issued or may be in the possession of any person for the purpose of issue (in each case whether in Hong Kong or elsewhere), which is directed at, or the contents of which are likely to be accessed or read by, the public in Hong Kong (except if permitted to do so under the laws of Hong Kong) other than with respect to shares which are or are intended to be disposed of only to persons outside Hong Kong or only to “professional investors” within the meaning of the Securities and Futures Ordinance (Cap. 571, Laws of Hong Kong) and any rules made thereunder.
Notice to Prospective Investors in Singapore
This prospectus has not been registered as a prospectus with the Monetary Authority of Singapore. Accordingly, this prospectus and any other document or material in connection with the offer or sale, or invitation for subscription or purchase, of the shares may not be circulated or distributed, nor may the shares be offered or sold, or be made the subject of an invitation for subscription or purchase, whether directly or indirectly, to persons in Singapore other than (i) to an institutional investor under Section 274 of the Securities and Futures Act, Chapter 289 of Singapore, or the SFA, (ii) to a relevant person, or any person pursuant to Section 275(1A), and in accordance with the conditions, specified in Section 275 of the SFA or (iii) otherwise pursuant to, and in accordance with the conditions of, any other applicable provision of the SFA.
Where the shares are subscribed or purchased under Section 275 by a relevant person which is: (a) a corporation (which is not an accredited investor as defined in Section 4A of the SFA) the sole business of which is to hold investments and the entire share capital of which is owned by one or more individuals, each of whom is an accredited investor; or (b) a trust (where the trustee is not an accredited investor) whose sole purpose is to hold investments and each beneficiary is an accredited investor, shares, debentures and units of shares and debentures of that corporation or the beneficiaries’ rights and interest in that trust shall not be transferable for
128
Table of Contents
6 months after that corporation or that trust has acquired the shares under Section 275 except: (1) to an institutional investor under Section 274 of the SFA or to a relevant person, or any person pursuant to Section 275(1A), and in accordance with the conditions, specified in Section 275 of the SFA; (2) where no consideration is or will be given for the transfer; or (3) where the transfer is by operation of law.
Notice to Prospective Investors in Japan
The shares have not been and will not be registered under the Financial Instruments and Exchange Law of Japan (the “Financial Instruments and Exchange Law”) and the underwriters have agreed that they will not offer or sell any shares, directly or indirectly, in Japan or to, or for the benefit of, any resident of Japan (which term as used herein means any person resident in Japan, including any corporation or other entity organized under the laws of Japan), or to others for re-offering or resale, directly or indirectly, in Japan or to a resident of Japan, except pursuant to an exemption from the registration requirements of, and otherwise in compliance with, the Financial Instruments and Exchange Law and any other applicable laws, regulations and ministerial guidelines of Japan.
Notice to Prospective Investors in Switzerland
This document, as well as any other material relating to the shares which are the subject of the offering contemplated by this prospectus, do not constitute an issue prospectus pursuant to Article 652a and/or 1156 of the Swiss Code of Obligations. The shares will not be listed on the SIX Swiss Exchange and, therefore, the documents relating to the shares, including, but not limited to, this document, do not claim to comply with the disclosure standards of the listing rules of the SIX Swiss Exchange and corresponding prospectus schemes annexed to the listing rules of the SIX Swiss Exchange. The shares are being offered in Switzerland by way of a private placement, i.e., to a small number of selected investors only, without any public offer and only to investors who do not purchase the shares with the intention to distribute them to the public. The investors will be individually approached by the Company from time to time. This document, as well as any other material relating to the shares, is personal and confidential and does not constitute an offer to any other person. This document may only be used by those investors to whom it has been handed out in connection with the offering described herein and may neither directly nor indirectly be distributed or made available to other persons without the express consent of the Company. It may not be used in connection with any other offer and shall in particular not be copied and/or distributed to the public in (or from) Switzerland.
Notice to Prospective Investors in the Dubai International Financial Centre
This document relates to an exempt offer in accordance with the Offered Securities Rules of the Dubai Financial Services Authority. This document is intended for distribution only to persons of a type specified in those rules. It must not be delivered to, or relied on by, any other person. The Dubai Financial Services Authority has no responsibility for reviewing or verifying any documents in connection with exempt offers. The Dubai Financial Services Authority has not approved this document nor taken steps to verify the information set out in it, and has no responsibility for it. The shares which are the subject of the offering contemplated by this prospectus may be illiquid and/or subject to restrictions on their resale. Prospective purchasers of the shares offered should conduct their own due diligence on the shares. If you do not understand the contents of this document you should consult an authorized financial adviser.
129
Table of Contents
The validity of the common stock offered hereby will be passed upon for us by Sullivan & Cromwell LLP, Palo Alto, California, and for the underwriters by Cleary Gottlieb Steen & Hamilton LLP, New York, New York.
The consolidated financial statements of Univar Inc. at December 31, 2009 and 2008 and for the years ended December 31, 2009 and 2008, and for the period from October 12, 2007 through December 31, 2007 (successor), and the period from January 1, 2007 through October 11, 2007 (predecessor), appearing in this prospectus and the registration statement have been audited by Ernst & Young LLP, independent registered public accounting firm, as set forth in their report thereon appearing elsewhere herein, and are included in reliance upon such report given on the authority of such firm as experts in accounting and auditing.
WHERE YOU CAN FIND MORE INFORMATION
We have filed with the SEC a registration statement on Form S-1 under the Securities Act that registers the shares of our common stock to be sold in this offering. The registration statement, including the attached exhibits and schedule, contains additional relevant information about us and our capital stock. The rules and regulations of the SEC allow us to omit from this document certain information included in the registration statement.
You may read and copy the reports and other information we file with the SEC at the SEC’s Public Reference Room at 450 Fifth Street, N.W., Washington, D.C. 20549. You may also obtain copies of this information by mail from the public reference section of the SEC, 450 Fifth Street, N.W., Washington, D.C. 20549, at prescribed rates. You may obtain information regarding the operation of the public reference room by calling 1(800) SEC-0330. The SEC also maintains a website that contains reports, proxy statements and other information about issuers, like us, who file electronically with the SEC. The address of that website is http://www.sec.gov. This reference to the SEC’s website is an inactive textual reference only, and is not a hyperlink.
Upon completion of this offering, we will become subject to the reporting and informational requirements of the Securities Exchange Act of 1934, as amended, and as a result will file periodic reports, proxy statements and other information with the SEC. These periodic reports, proxy statements and other information will be available for inspection and copying at the SEC’s public reference room and the website of the SEC referred to above.
We intend to furnish our stockholders with annual reports containing audited financial statements, and make available to our stockholders quarterly reports for the first three quarters of each year containing unaudited interim financial information.
130
Table of Contents
INDEX TO CONSOLIDATED FINANCIAL STATEMENTS
Univar Inc.
| Page | ||
| F-2 | ||
| Consolidated Balance Sheets as of December 31, 2008 and 2009 and March 31, 2010 (unaudited) |
F-3 | |
| F-4 | ||
| F-5 | ||
| F-7 | ||
| F-8 | ||
F-1
Table of Contents
REPORT OF INDEPENDENT REGISTERED PUBLIC ACCOUNTING FIRM
The Board of Directors and shareholder of Univar Inc.
We have audited the accompanying consolidated balance sheets of Univar Inc. (the Company) as of December 31, 2009 and 2008, and the related consolidated statements of operations, shareholder’s equity, and cash flows for the years ended December 31, 2009 and 2008, and for the period from October 12, 2007 through December 31, 2007 (successor), and the period from January 1, 2007 through October 11, 2007 (predecessor). These financial statements are the responsibility of the Company’s management. Our responsibility is to express an opinion on these financial statements based on our audits.
We conducted our audits in accordance with the standards of the Public Company Accounting Oversight Board (United States). Those standards require that we plan and perform the audit to obtain reasonable assurance about whether the financial statements are free of material misstatement. We were not engaged to perform an audit of the Company’s internal control over financial reporting. Our audits included consideration of internal control over financial reporting as a basis for designing audit procedures that are appropriate in the circumstances, but not for the purpose of expressing an opinion on the effectiveness of the Company’s internal control over financial reporting. Accordingly, we express no such opinion. An audit also includes examining, on a test basis, evidence supporting the amounts and disclosures in the financial statements, assessing the accounting principles used and significant estimates made by management, and evaluating the overall financial statement presentation. We believe that our audits provide a reasonable basis for our opinion.
In our opinion, the financial statements referred to above present fairly, in all material respects, the consolidated financial position of the Company as of December 31, 2009 and 2008, and the consolidated results of its operations and its cash flows for the years ended December 31, 2009 and 2008 and for the period from October 12, 2007 through December 31, 2007 (successor), and the period from January 1, 2007 through October 11, 2007 (predecessor), in conformity with U.S. generally accepted accounting principles.
/s/ ERNST & YOUNG LLP
Seattle, Washington
June 29, 2010
F-2
Table of Contents
CONSOLIDATED BALANCE SHEETS
| December 31, | March 31, | |||||||||||
| (in US$ millions, except share data) |
2008 | 2009 | 2010 | |||||||||
| (unaudited) | ||||||||||||
| Assets |
||||||||||||
| Current assets: |
||||||||||||
| Cash and cash equivalents |
$ | 223.1 | $ | 140.2 | $ | 114.7 | ||||||
| Trade accounts receivable, net |
1,060.0 | 870.6 | 982.4 | |||||||||
| Inventories |
789.6 | 623.3 | 708.1 | |||||||||
| Prepaid expenses and other current assets |
107.7 | 111.6 | 127.4 | |||||||||
| Income tax receivable |
16.6 | 7.7 | 3.4 | |||||||||
| Deferred tax asset, net |
44.3 | 41.5 | 41.6 | |||||||||
| Total current assets |
2,241.3 | 1,794.9 | 1,977.6 | |||||||||
| Property, plant and equipment, net |
988.4 | 962.7 | 943.0 | |||||||||
| Goodwill |
1,380.2 | 1,464.5 | 1,471.6 | |||||||||
| Intangible assets, net |
511.0 | 486.1 | 477.8 | |||||||||
| Deferred tax asset, net |
378.2 | 317.1 | 335.9 | |||||||||
| Receivables from related parties |
84.6 | 91.4 | 87.8 | |||||||||
| Other assets |
73.9 | 75.0 | 63.6 | |||||||||
| Total assets |
$ | 5,657.6 | $ | 5,191.7 | $ | 5,357.3 | ||||||
| Liabilities and shareholder’s equity |
||||||||||||
| Current liabilites: |
||||||||||||
| Short-term financing |
$ | 53.7 | $ | 21.4 | $ | 23.8 | ||||||
| Trade accounts payable |
721.1 | 566.4 | 924.5 | |||||||||
| Current portion of long-term debt |
60.3 | 125.8 | 125.0 | |||||||||
| Accrued compensation |
82.8 | 49.3 | 56.2 | |||||||||
| Other accrued expenses |
297.1 | 265.2 | 253.3 | |||||||||
| Deferred tax liabilities |
75.3 | 61.4 | 61.5 | |||||||||
| Income taxes payable |
1.2 | 10.1 | 18.9 | |||||||||
| Total current liabilities |
1,291.5 | 1,099.6 | 1,463.2 | |||||||||
| Long-term debt |
2,287.9 | 1,906.6 | 1,677.1 | |||||||||
| Pension and other post-retirement benefit liabilities |
476.9 | 361.1 | 351.1 | |||||||||
| Deferred tax liabilities |
347.4 | 344.2 | 349.3 | |||||||||
| Payable to shareholders |
734.5 | 848.1 | 878.2 | |||||||||
| Other long-term liabilities |
298.8 | 199.1 | 192.9 | |||||||||
| Commitments and contingencies |
||||||||||||
| Shareholder’s equity: |
||||||||||||
| Common stock, $0.01 par value; 1,000 shares authorized; 196 shares issued and outstanding at December 31, 2008 and 2009 and March 31, 2010 |
— | — | — | |||||||||
| Additional paid-in capital |
888.8 | 888.8 | 888.8 | |||||||||
| Accumulated other comprehensive loss |
(380.6 | ) | (125.5 | ) | (116.6 | ) | ||||||
| Accumulated deficit |
(287.6 | ) | (330.3 | ) | (326.7 | ) | ||||||
| Total shareholder’s equity |
220.6 | 433.0 | 445.5 | |||||||||
| Total liabilities and shareholder’s equity |
$ | 5,657.6 | $ | 5,191.7 | $ | 5,357.3 | ||||||
The accompanying notes are an integral part of these consolidated financial statements.
F-3
Table of Contents
CONSOLIDATED STATEMENTS OF OPERATIONS
| Predecessor | Successor | |||||||||||||||||||||||||
| Period from Jan. 1, 2007 through Oct. 11, 2007 |
Period from Oct. 12, 2007 through Dec. 31, 2007 |
Year Ended December 31, |
Three Months Ended March 31, |
|||||||||||||||||||||||
| (in US$ millions, except share and per share data) |
2008 | 2009 | 2009 | 2010 | ||||||||||||||||||||||
| (unaudited) | ||||||||||||||||||||||||||
| Net sales |
$ | 6,326.9 | $ | 1,790.1 | $ | 9,428.2 | $ | 7,194.5 | $ | 1,791.5 | $ | 1,810.2 | ||||||||||||||
| Cost of goods sold |
5,441.5 | 1,522.6 | 8,039.2 | 5,985.9 | 1,500.2 | 1,495.6 | ||||||||||||||||||||
| 885.4 | 267.5 | 1,389.0 | 1,208.6 | 291.3 | 314.6 | |||||||||||||||||||||
| Operating expenses: |
||||||||||||||||||||||||||
| Warehousing, selling and administrative |
659.2 | 210.1 | 930.3 | 811.7 | 200.0 | 197.9 | ||||||||||||||||||||
| Depreciation |
48.3 | 16.8 | 81.6 | 80.1 | 19.1 | 20.1 | ||||||||||||||||||||
| Amortization |
5.6 | 10.9 | 50.8 | 46.3 | 12.0 | 11.2 | ||||||||||||||||||||
| Impairment charges |
— | — | — | 36.0 | — | 3.6 | ||||||||||||||||||||
| Total operating expenses |
713.1 | 237.8 | 1,062.7 | 974.1 | 231.1 | 232.8 | ||||||||||||||||||||
| Operating income |
172.3 | 29.7 | 326.3 | 234.5 | 60.2 | 81.8 | ||||||||||||||||||||
| Other income (expense): |
||||||||||||||||||||||||||
| Interest income |
5.0 | 1.0 | 10.0 | 7.7 | 2.2 | 2.0 | ||||||||||||||||||||
| Interest expense |
(63.0 | ) | (70.0 | ) | (325.6 | ) | (315.0 | ) | (78.4 | ) | (75.8 | ) | ||||||||||||||
| Gain on extinguishment of related party loan |
— | 31.3 | — | — | — | — | ||||||||||||||||||||
| Total other expense |
(58.0 | ) | (37.7 | ) | (315.6 | ) | (307.3 | ) | (76.2 | ) | (73.8 | ) | ||||||||||||||
| Income (loss) before income taxes |
114.3 | (8.0 | ) | 10.7 | (72.8 | ) | (16.0 | ) | 8.0 | |||||||||||||||||
| Income tax expense (benefit) |
53.0 | 6.6 | 18.7 | (30.1 | ) | (6.0 | ) | 4.4 | ||||||||||||||||||
| Net income (loss) |
$ | 61.3 | $ | (14.6 | ) | $ | (8.0 | ) | $ | (42.7 | ) | $ | (10.0 | ) | $ | 3.6 | ||||||||||
| Earnings (loss) per common share: |
||||||||||||||||||||||||||
| Basic and diluted |
$ | (40,701 | ) | $ | (218,001 | ) | $ | (51,088 | ) | $ | 18,339 | |||||||||||||||
| Weighted average common shares outstanding: |
||||||||||||||||||||||||||
| Basic and diluted |
196 | 196 | 196 | 196 | ||||||||||||||||||||||
The accompanying notes are an integral part of these consolidated financial statements.
F-4
Table of Contents
CONSOLIDATED STATEMENTS OF SHAREHOLDER’S EQUITY
| (in US$ millions, except number of outstanding |
Shares | Amount | Treasury Shares |
Additional Paid-in Capital |
Accumulated Other Comprehensive Income (Loss), net |
Retained Earnings (Accumulated Deficit) |
Total | ||||||||||||||||||||
| Predecessor |
|||||||||||||||||||||||||||
| Balance at January 1, 2007 |
28,226,237 | $ | 35.4 | $ | (61.0 | ) | $ | 565.9 | $ | (36.4 | ) | $ | 289.3 | $ | 793.2 | ||||||||||||
| Cumulative effect from the adoption of FASB Interpretation No. 48 |
(0.3 | ) | (0.3 | ) | |||||||||||||||||||||||
| Adjusted balance |
28,226,237 | $ | 35.4 | $ | (61.0 | ) | $ | 565.9 | $ | (36.4 | ) | $ | 289.0 | $ | 792.9 | ||||||||||||
| Net income |
61.3 | 61.3 | |||||||||||||||||||||||||
| Net pension and post-employment benefit adjustment, net of income taxes of $(21.8) |
— | — | — | — | 40.6 | — | 40.6 | ||||||||||||||||||||
| Foreign currency translation adjustment, net of income taxes of $0.4 |
— | — | — | — | 43.9 | — | 43.9 | ||||||||||||||||||||
| Comprehensive income |
84.5 | 61.3 | 145.8 | ||||||||||||||||||||||||
| Treasury shares issued |
119,250 | — | 4.2 | (2.3 | ) | — | — | 1.9 | |||||||||||||||||||
| Stock-based compensation expense |
— | — | — | — | — | 10.5 | 10.5 | ||||||||||||||||||||
| Exercise of stock options |
— | — | — | (52.4 | ) | — | — | (52.4 | ) | ||||||||||||||||||
| Excess tax benefit from stock options exercised |
— | — | — | 8.6 | — | — | 8.6 | ||||||||||||||||||||
| Dividend paid on common stock |
— | — | — | — | — | (41.3 | ) | (41.3 | ) | ||||||||||||||||||
| Balance at October 11, 2007 |
28,345,487 | $ | 35.4 | $ | (56.8 | ) | $ | 519.8 | $ | 48.1 | $ | 319.5 | $ | 866.0 | |||||||||||||
| Successor |
|||||||||||||||||||||||||||
| Elimination of predecessor equity structure |
(28,345,487 | ) | (35.4 | ) | 56.8 | (519.8 | ) | (48.1 | ) | (319.5 | ) | (866.0 | ) | ||||||||||||||
| Investment in successor |
196 | — | — | 910.8 | — | — | 910.8 | ||||||||||||||||||||
| Balance at October 12, 2007 |
196 | $ | — | $ | — | $ | 910.8 | $ | — | $ | — | $ | 910.8 | ||||||||||||||
| Net loss |
— | — | — | — | — | (14.6 | ) | (14.6 | ) | ||||||||||||||||||
| Net changes in fair value of derivative instruments, net of income taxes of $11.6 |
— | — | — | — | (19.3 | ) | — | (19.3 | ) | ||||||||||||||||||
| Net pension and post-employment benefit adjustment, net of income taxes of $4.1 |
— | — | — | — | (8.8 | ) | — | (8.8 | ) | ||||||||||||||||||
| Foreign currency translation adjustment, net of income taxes of $0.3 |
— | — | — | — | 26.2 | — | 26.2 | ||||||||||||||||||||
| Comprehensive loss |
(1.9 | ) | (14.6 | ) | (16.5 | ) | |||||||||||||||||||||
| Deemed dividend distribution from transfer of interest rate swap |
— | — | — | (22.0 | ) | — | — | (22.0 | ) | ||||||||||||||||||
| Balance at December 31, 2007 |
196 | $ | — | $ | — | $ | 888.8 | $ | (1.9 | ) | $ | (14.6 | ) | $ | 872.3 | ||||||||||||
| Net loss |
— | — | — | — | — | (8.0 | ) | (8.0 | ) | ||||||||||||||||||
| Net changes in fair value of derivative instruments, net of income taxes of $22.4 |
— | — | — | — | (21.7 | ) | — | (21.7 | ) | ||||||||||||||||||
| Net pension and post-employment benefit adjustment, net of income taxes of $93.4 |
— | — | — | — | (185.6 | ) | — | (185.6 | ) | ||||||||||||||||||
| Foreign currency translation adjustment, net of income taxes of $29.4 |
— | — | — | — | (171.4 | ) | — | (171.4 | ) | ||||||||||||||||||
| Comprehensive loss |
(378.7 | ) | (8.0 | ) | (386.7 | ) | |||||||||||||||||||||
| Dividend paid |
— | — | — | — | — | (265.0 | ) | (265.0 | ) | ||||||||||||||||||
| Balance at December 31, 2008 |
196 | $ | — | $ | — | $ | 888.8 | $ | (380.6 | ) | $ | (287.6 | ) | $ | 220.6 | ||||||||||||
F-5
Table of Contents
UNIVAR INC.
CONSOLIDATED STATEMENTS OF SHAREHOLDER’S EQUITY—(Continued)
| (in US$ millions, except number of outstanding |
Shares | Amount | Treasury Shares |
Additional Paid-in Capital |
Accumulated Other Comprehensive Income (Loss), net |
Retained Earnings (Accumulated Deficit) |
Total | ||||||||||||||||
| Balance at December 31, 2008 |
196 | $ | — | $ | — | $ | 888.8 | $ | (380.6 | ) | $ | (287.6 | ) | $ | 220.6 | ||||||||
| Net loss |
— | — | — | — | — | (42.7 | ) | (42.7 | ) | ||||||||||||||
| Net changes in fair value of derivative instruments, net of income taxes of $(16.2) |
— | — | — | — | 28.9 | — | 28.9 | ||||||||||||||||
| Net pension and post-employment benefit adjustment, net of income taxes of $(54.8) |
— | — | — | — | 100.6 | — | 100.6 | ||||||||||||||||
| Foreign currency translation adjustment, net of income taxes of $(5.6) |
— | — | — | — | 125.6 | — | 125.6 | ||||||||||||||||
| Comprehensive income (loss) |
255.1 | (42.7 | ) | 212.4 | |||||||||||||||||||
| Balance at December 31, 2009 |
196 | $ | — | $ | — | $ | 888.8 | $ | (125.5 | ) | $ | (330.3 | ) | $ | 433.0 | ||||||||
| Net income (unaudited) |
— | — | — | — | — | 3.6 | 3.6 | ||||||||||||||||
| Net changes in fair value of derivative instruments, net of income taxes of $(1.0) (unaudited) |
— | — | — | — | 1.9 | — | 1.9 | ||||||||||||||||
| Foreign currency translation adjustment, net of income taxes of $2.8 (unaudited) |
— | — | — | — | 7.0 | — | 7.0 | ||||||||||||||||
| Comprehensive income (unaudited) |
8.9 | 3.6 | 12.5 | ||||||||||||||||||||
| Balance at March 31, 2010 (unaudited) |
196 | $ | — | $ | — | $ | 888.8 | $ | (116.6 | ) | $ | (326.7 | ) | $ | 445.5 | ||||||||
The accompanying notes are an integral part of these consolidated financial statements.
F-6
Table of Contents
CONSOLIDATED STATEMENTS OF CASH FLOWS
| Predecessor | Successor | |||||||||||||||||||||||||
| Period from Jan. 1, 2007 through Oct. 11, 2007 |
Period from Oct. 12, 2007 through Dec. 31, 2007 |
Year Ended December 31, |
Three Months Ended March 31, |
|||||||||||||||||||||||
| (in US$ millions) |
2008 | 2009 | 2009 | 2010 | ||||||||||||||||||||||
| (unaudited) | ||||||||||||||||||||||||||
| Operating activities |
||||||||||||||||||||||||||
| Net income (loss) |
$ | 61.3 | $ | (14.6 | ) | $ | (8.0 | ) | $ | (42.7 | ) | $ | (10.0 | ) | $ | 3.6 | ||||||||||
| Adjustments to reconcile net income to net cash provided by operating activities: |
||||||||||||||||||||||||||
| Depreciation and amortization |
53.9 | 27.7 | 132.4 | 126.4 | 31.1 | 31.3 | ||||||||||||||||||||
| Impairment charges |
— | — | — | 36.0 | — | 3.6 | ||||||||||||||||||||
| Amortization of deferred financing fees |
3.1 | 2.3 | 8.3 | 9.4 | 2.3 | 2.4 | ||||||||||||||||||||
| Amortization of interest rate swap |
— | — | — | — | — | 8.8 | ||||||||||||||||||||
| Loss (gain) on sale of property, plant and equipment |
(1.1 | ) | (0.3 | ) | (0.8 | ) | 3.9 | (0.1 | ) | — | ||||||||||||||||
| Deferred income taxes |
13.1 | (23.3 | ) | (20.5 | ) | (49.0 | ) | (6.0 | ) | (15.8 | ) | |||||||||||||||
| Stock-based compensation expense |
10.5 | — | — | — | — | — | ||||||||||||||||||||
| Pensions and post-employment benefit plans |
12.6 | (0.5 | ) | (10.5 | ) | 22.5 | 5.2 | (4.7 | ) | |||||||||||||||||
| Loss on sale of operations |
— | — | — | 1.2 | — | — | ||||||||||||||||||||
| Changes in operating assets and liabilities: |
||||||||||||||||||||||||||
| Trade accounts receivable, net |
(106.8 | ) | 154.3 | 66.2 | 212.0 | 90.2 | (128.0 | ) | ||||||||||||||||||
| Inventories |
(2.4 | ) | (45.3 | ) | 0.7 | 188.5 | 44.8 | (84.3 | ) | |||||||||||||||||
| Prepaid expenses and other current assets |
(11.0 | ) | (38.5 | ) | 41.5 | 1.1 | 16.2 | (16.5 | ) | |||||||||||||||||
| Trade accounts payable |
(12.2 | ) | 0.2 | (189.2 | ) | (181.0 | ) | 65.8 | 363.8 | |||||||||||||||||
| Other, net |
28.8 | 118.8 | (10.7 | ) | (110.9 | ) | (70.1 | ) | 8.6 | |||||||||||||||||
| Net cash provided by operating activities |
49.8 | 180.8 | 9.4 | 217.4 | 169.4 | 172.8 | ||||||||||||||||||||
| Investing activities |
||||||||||||||||||||||||||
| Purchases of property, plant and equipment |
(62.6 | ) | (29.1 | ) | (77.5 | ) | (65.9 | ) | (9.6 | ) | (8.3 | ) | ||||||||||||||
| Purchase of business, net of cash acquired |
(657.0 | ) | (44.3 | ) | (8.0 | ) | — | — | — | |||||||||||||||||
| Proceeds from sale of property, plant and equipment |
6.6 | 0.8 | 1.6 | 6.3 | 0.2 | 0.4 | ||||||||||||||||||||
| Proceeds from disposal of businesses |
— | — | 12.0 | 24.3 | — | — | ||||||||||||||||||||
| Net cash used by investing activities |
(713.0 | ) | (72.6 | ) | (71.9 | ) | (35.3 | ) | (9.4 | ) | (7.9 | ) | ||||||||||||||
| Financing activities |
||||||||||||||||||||||||||
| Proceeds from debt |
1,367.9 | 2,061.0 | 305.4 | 0.1 | — | — | ||||||||||||||||||||
| Payments on debt |
(694.3 | ) | (323.0 | ) | (20.4 | ) | (344.9 | ) | (165.7 | ) | (224.5 | ) | ||||||||||||||
| Loans to related parties, net |
— | (1,736.3 | ) | (81.3 | ) | 106.8 | 25.3 | 33.7 | ||||||||||||||||||
| Proceeds from share issuance, net |
1.9 | — | — | — | — | — | ||||||||||||||||||||
| Settlement of share-based payments |
(52.4 | ) | — | — | — | — | — | |||||||||||||||||||
| Dividends paid |
(41.3 | ) | — | — | — | — | — | |||||||||||||||||||
| Short-term financing, net |
62.5 | (4.8 | ) | 4.6 | (40.7 | ) | (19.4 | ) | 3.3 | |||||||||||||||||
| Excess tax benefit as a result of stock option exercises |
8.6 | — | — | — | — | — | ||||||||||||||||||||
| Net cash provided (used) by financing activities |
652.9 | (3.1 | ) | 208.3 | (278.7 | ) | (159.8 | ) | (187.5 | ) | ||||||||||||||||
| Net cash flow |
(10.3 | ) | 105.1 | 145.8 | (96.6 | ) | 0.2 | (22.6 | ) | |||||||||||||||||
| Effect of exchange rate changes on cash |
(6.0 | ) | (0.3 | ) | (27.5 | ) | 13.7 | 1.7 | (2.9 | ) | ||||||||||||||||
| Net increase (decrease) in cash and cash equivalents |
(16.3 | ) | 104.8 | 118.3 | (82.9 | ) | 1.9 | (25.5 | ) | |||||||||||||||||
| Cash and cash equivalents at beginning of period |
48.5 | — | 104.8 | 223.1 | 223.1 | 140.2 | ||||||||||||||||||||
| Cash and cash equivalents at end of period |
$ | 32.2 | $ | 104.8 | $ | 223.1 | $ | 140.2 | $ | 225.0 | $ | 114.7 | ||||||||||||||
| Supplemental disclosures of cash flow information |
||||||||||||||||||||||||||
| Cash paid during the period for: |
||||||||||||||||||||||||||
| Income taxes |
$ | 54.1 | $ | 8.0 | $ | 33.2 | $ | 21.7 | $ | 4.1 | $ | 7.9 | ||||||||||||||
| Interest |
53.6 | 10.6 | 236.5 | 243.6 | 49.3 | 30.1 | ||||||||||||||||||||
| Non-cash activities: |
||||||||||||||||||||||||||
| Transfer of assets and loans to Univar Inc. from Univar N.V. |
$ | — | $ | 959.6 | $ | — | $ | — | $ | — | $ | — | ||||||||||||||
| Fair value adjustment at acquisition |
— | 1,274.2 | — | — | — | — | ||||||||||||||||||||
| Deemed dividend from restructuring |
— | 1,323.0 | — | — | — | — | ||||||||||||||||||||
| UK dividend offsetting intercompany receivable from Univar N.V. |
— | — | 265.0 | — | — | — | ||||||||||||||||||||
The accompanying notes are an integral part of these consolidated financial statements.
F-7
Table of Contents
NOTES TO THE CONSOLIDATED FINANCIAL STATEMENTS
| 1 | Operations and significant accounting policies |
Univar Inc. (“Univar” or “the Company”) was incorporated on October 12, 2007 as part of a restructuring plan to facilitate the acquisition of Univar N.V. On October 11, 2007, Ulixes B.V. acquired substantially all of the capital stock of Univar N.V., a public company listed on the Euronext exchange in Amsterdam. Prior to its acquisition of Univar N.V., Ulixes did not engage in any commercial activities. As a result of the acquisition, the business of Univar N.V. became the business of Ulixes. Univar Inc. is a wholly-owned subsidiary of Univar N.V. Univar’s capital stock is indirectly held by two Luxembourg limited liability companies (“Luxcos”), the capital stock of which is principally held by investment funds advised by CVC Capital Partners as well as investment funds associated with Goldman Sachs and Parcom. The Company’s directors and management have also had the opportunity to acquire equity in the Luxcos, at prices equivalent to fair market value at the time of their investment. This equity is subject to certain call rights in the event that the Company no longer employs the individual. The Company believes that these investments serve a valuable management retention and incentive function.
Headquartered in Redmond, Washington, Univar is a leading global distributor of commodity and specialty chemicals. The Company is the largest independent chemicals distributor in the United States as well as in Canada and the second largest in Europe, with additional distribution sites in Asia-Pacific and Latin America and sales offices located in Eastern Europe, the Middle East and Africa. The Company’s operations are structured into four reporting segments that represent the geographic areas under which the Company manages its business:
| • | Univar USA |
| • | Univar Canada |
| • | Univar Europe, the Middle East and Africa (“EMEA”) |
| • | Rest of World |
Rest of World includes certain developing businesses in Latin America (including Mexico) and the Asia-Pacific region. See Note 16 to the consolidated financial statements for additional information on reporting segment results.
Univar distributes over 11,000 products in more than 110,000 stockkeeping units, or SKUs, to over 80,000 customers with more than 250,000 customer delivery locations in over 100 countries. As the Company has grown over the last nine decades, it has refined its core competencies in the sales and marketing of chemicals, logistics, product stewardship and technical expertise to become a strategic resource to both the customers and the chemicals producers whose products the Company distributes.
Univar’s extensive distribution network and comprehensive product portfolio enable the Company to offer customers a “one-stop shop” solution for their chemicals needs. Extensive experience in the storage and transportation of chemicals in accordance with the extensive and complex safety, health and environmental regulations applicable throughout the regions in which the Company operates provides a competitive advantage. Univar also provides customers with access to an industry-focused salesforce and the technical expertise to customize products and services to fit their particular needs. The ability to offer customers value-added services, such as repackaging, blending and mixing, technical support, labeling, inventory management, “just-in-time” delivery and vendor rationalization programs has enabled Univar to build a loyal customer base. The Company sources chemicals from more than 2,500 producers, including many of the premier global chemicals manufacturers. The Company’s scale, geographic reach, diversified distribution channels and industry expertise enables development of strong, long-term relationships with suppliers, allowing integration of service and logistics capabilities into their business processes and promotes collaboration on supply chain optimization, marketing and other revenue enhancement strategies. The producers that Univar works with also benefit from the insight provided by the Company into customer buying patterns and trends. The Company’s scale and close relationships with chemicals producers often enable more attractive pricing terms for chemicals purchasing.
F-8
Table of Contents
UNIVAR INC.
NOTES TO THE CONSOLIDATED FINANCIAL STATEMENTS—(Continued)
Basis of presentation
As a result of the acquisition of Univar N.V. (“the predecessor”) on October 11, 2007 (“transaction date”), the recorded assets, liabilities and shareholder’s equity reflected in the financial statements prior to and subsequent to the transaction date are not necessarily comparable. Periods prior to October 12, 2007 reflect the accounts and activity of the predecessor which are presented at its historical cost basis. Periods subsequent to October 12, 2007 reflect the accounts of Univar Inc. (“the successor”) stated at their fair value in accordance with the purchase method of accounting. The consolidated financial statements include the accounts of the Company and its wholly owned subsidiaries. Intercompany balances and transactions have been eliminated in consolidation.
Hereinafter, references to “Univar” or “the Company” refers to both the predecessor and successor.
The consolidated financial statements of Univar Inc. have been prepared in accordance with US generally accepted accounting principles (“US GAAP”).
Unaudited interim financial information
The accompanying consolidated statements of operations and cash flows for the three month periods ended March 31, 2009 and 2010, the consolidated statement of shareholder’s equity for the three months ended March 31, 2010, and the interim consolidated balance sheet at March 31, 2010 are unaudited. These unaudited interim consolidated financial statements have been prepared in accordance with US GAAP on the same basis as the audited consolidated financial statements and, in the opinion of management, reflect all adjustments consisting of normal recurring accruals considered necessary to present fairly the company’s financial position, results of its operations and cash flows for the three month periods ended March 31, 2009 and 2010. The results of operations for the three months ended March 31, 2010 are not necessarily indicative of the results that may be expected for the year ending December 31, 2010. These unaudited interim consolidated financial statements should be read in conjunction with the audited consolidated financial statements and accompanying notes for the period from January 1, 2007 through October 11, 2007, the period from October 12, 2007 through December 31, 2007 and the years ended December 31, 2008 and December 31, 2009.
Basis of consolidation
The consolidated financial statements include the financial statements of Univar and its subsidiaries. Subsidiaries are those enterprises that are controlled by Univar. Control exists when Univar has the power, directly or indirectly, to govern the financial and operating policies of an enterprise so as to obtain benefits from its activities. The financial statements of subsidiaries are prepared for the same reporting year as those of the parent company, using consistent accounting policies. All intercompany balances and transactions are eliminated in consolidation. Subsidiaries are consolidated from the date on which control is transferred to Univar and cease to be consolidated from the date on which control is transferred to a person or entity outside the control of Univar. A change in the ownership interest of a subsidiary, without a change of control, is accounted for as an equity transaction.
Use of estimates
The preparation of consolidated financial statements in conformity with US GAAP requires management to make estimates and assumptions that affect the amounts reported and disclosed in the financial statements and accompanying notes. The Company evaluates its estimates continually to determine their appropriateness, including impairment of goodwill and intangible assets, asset impairments, environmental liabilities, pension and
F-9
Table of Contents
UNIVAR INC.
NOTES TO THE CONSOLIDATED FINANCIAL STATEMENTS—(Continued)
other post-employment benefits, fair value of business combinations and loss contingencies. The Company bases its estimates on historical experience and on various assumptions that are believed to be reasonable, the results of which form the basis for the amounts recorded within the consolidated financial statements. Actual results could differ materially from these estimates.
Discussed below are the key assumptions concerning the future and other key sources of estimation uncertainty at the balance sheets dates that may have a risk of causing a material adjustment to the carrying amounts of assets and liabilities within the next financial year.
Impairment of goodwill and intangible assets
The Company determines whether goodwill is impaired on an annual basis, or more frequently when events or changes in circumstances indicate it may be impaired. This requires an estimate of the fair value less costs to sell of the reporting units to which the goodwill is allocated. Estimating the fair value requires the Company to estimate the expected future cash flows from the individual reporting units and also to choose a suitable discount rate in order to calculate the present value of those cash flows. For additional information on goodwill and intangible assets, see Note 8 to the consolidated financial statements.
Asset impairment
Judgments made by the Company related to the expected useful lives of long-lived assets and the ability of the Company to realize undiscounted cash flows in excess of the carrying amounts of such assets are affected by factors such as the ongoing maintenance and improvements of the assets, changes in economic conditions and changes in operating performance. As the Company assesses the ongoing expected cash flows and carrying amounts of its long-lived assets, these factors could cause the Company to realize material impairment charges.
Environmental liabilities
Environmental liabilities are recorded for obligations (constructive or legally enforceable) and losses when amounts, though uncertain, can be reasonably estimated and where it is probable that settlement will entail an outflow of funds. Liabilities for environmental remediation costs represent the investigation, clean-up and remediation costs that are probable and can be reasonably estimated. Expected cash outflows related to environmental remediation for the next 12 months are reported as current.
Environmental costs are capitalized if the costs extend the life of the property, increase its capacity and/or mitigate or prevent contamination from future operations. For additional information on environmental liabilities, see Note 17 to the consolidated financial statements.
Pension and other post-employment benefits
The cost of defined benefit pension plans and other post-employment benefits is determined using actuarial valuations. The actuarial valuation involves making assumptions about discount rates, expected rates of return on assets, future salary increases, future health care costs, mortality rates and future pension increases. Due to the long-term nature of these plans, such estimates are subject to significant uncertainty. The assumptions used in the calculation of the net pension obligation are shown in Note 14 to the consolidated financial statements.
F-10
Table of Contents
UNIVAR INC.
NOTES TO THE CONSOLIDATED FINANCIAL STATEMENTS—(Continued)
Fair values for business combinations
Business combinations have been accounted for using the purchase method of accounting. Allocations of the purchase price have been made to the assets acquired and liabilities assumed based on estimated fair value assessments which may change as better information becomes available within an acceptable period after acquisition.
Cash and cash equivalents
Cash and cash equivalents include all bank balances and short-term, highly liquid investments with an original maturity of three months or less that are readily convertible into known amounts of cash and are stated at face value.
Accounts and other receivables
Accounts receivable are stated net of an allowance for doubtful accounts. Receivables are written off and deducted from the allowance account when the receivables are deemed uncollectible. The risk of uncollectability of accounts receivable is primarily estimated based on prior experience. Certain accounts are assessed individually based on factors that include current ability to pay, bankruptcy and payment history.
Inventories
Inventories consist primarily of merchandise purchased for resale and are initially recognized at cost. Inventory cost is net of supplier incentive rebates and includes direct labor and other costs incurred to blend and repackage product. The inventories are subsequently carried at the lower of cost (on the basis of the weighted average cost formula) or market.
Supplier incentives
The Company has arrangements with certain suppliers that provide discounts when certain measures are achieved, generally related to purchasing volume. Supplier incentives are accounted for as a reduction of the cost of inventory. Throughout the year, the amount of incentives are recorded based on purchases to date and estimates of purchases for the remainder of the year. Discretionary rebates are recorded when earned.
Income taxes
The Company is subject to income taxes in the United States and numerous foreign jurisdictions. Significant judgment in the forecasting of taxable income using historical and projected future operating results is required in determining the Company’s provision for income taxes and the related assets and liabilities. The provision for income taxes includes income taxes paid, currently payable or receivable and those deferred.
Except as required under US tax law, the Company does not provide for US taxes on undistributed earnings of foreign subsidiaries that have not been previously taxed since the Company intends to invest such undistributed earnings indefinitely outside of the US. Determination of the unrecognized deferred tax liability that would be incurred if such amounts were not indefinitely reinvested is not practicable.
In the event that the actual outcome of future tax consequences differs from the Company’s estimates and assumptions due to changes or future events such as tax legislation, geographic mix of the earnings, completion of tax audits or earnings repatriation plans, the resulting change to the provision for income taxes could have a material effect on the consolidated statements of operations and consolidated balance sheets.
F-11
Table of Contents
UNIVAR INC.
NOTES TO THE CONSOLIDATED FINANCIAL STATEMENTS—(Continued)
Deferred tax assets and liabilities are determined based on differences between financial reporting and tax basis of assets and liabilities, and are measured using enacted tax rates and laws that are expected to be in effect when the differences reverse. Deferred tax assets are also recognized for the estimated future effects of tax loss carryforwards. The effect on deferred taxes of changes in tax rates is recognized in the period in which the enactment date changes. Valuation allowances are established when necessary on a jurisdictional basis to reduce deferred tax assets to the amounts expected more likely than not to be realized. For additional information on income taxes see Note 13 to the consolidated financial statements.
The Company recognizes interest and penalties related to unrecognized tax benefits within the interest expense line and other expense line, respectively, in the accompanying consolidated statements of operations. Accrued interest and penalties are included within the related liability lines in the consolidated balance sheets.
Goodwill and intangible assets
Goodwill and intangible assets have resulted from Univar’s acquisitions. The Company uses estimates in determining and assigning the fair value of goodwill and intangible assets, including estimates of useful lives of intangible assets, the amount and timing of related future cash flows, and fair values of the related operations. Intangible assets have finite lives and are amortized over their respective useful life of 2-20 years, a weighted average of 14 years at December 31, 2009. Amortization of intangible assets is based on the pattern in which the economic benefits of the intangible assets are consumed or otherwise used up which is normally based on the undiscounted cash flows; or when not reliably determined, on a straight-line basis. The assets are tested for impairment when events or changes in circumstances indicate the carrying value may not be recoverable.
Goodwill is assigned to reporting units based on the expected benefit from the synergies arising from each business combination, determined by using certain financial metrics, including the forecasted discounted cash flows associated with each reporting unit. Goodwill is tested for impairment as of October 1 of each year, or more frequently if a significant impairment indicator occurs. Determining the fair value of a reporting unit requires judgment and involves the use of significant estimates and assumptions. The Company forecasts discounted future cash flows at the reporting unit level using risk-adjusted discount rates and estimated future revenues and operating costs. The Company also identifies similar publicly traded companies and develops a correlation, referred to as a multiple, to apply to the operating results of the reporting units.
As discussed in Note 8 to the consolidated financial statements, Univar recorded an impairment charge in 2009 of $1.5 million to goodwill and $2.4 million to intangible assets which were recorded in connection with the 2007 acquisition of the assets of Dow Chemicals’ Western Canada caustic soda distribution business (“NVDC”). Otherwise, there were no impairments of goodwill or intangible assets for any of the periods presented. There were no events or circumstances from the date of the assessment through March 31, 2010 that would affect this conclusion.
Property, plant and equipment
Property, plant and equipment are carried at historical cost, net of straight-line depreciation, based on the expected useful economic lives of the assets and taking into account any expected residual value. Significant components of an item of property, plant and equipment are separately identified and depreciated over their respective useful economic lives.
F-12
Table of Contents
UNIVAR INC.
NOTES TO THE CONSOLIDATED FINANCIAL STATEMENTS—(Continued)
The depreciation periods of the main assets are as follows:
| Buildings |
10-50 years | |
| Main components of tank farms |
5-40 years | |
| Containers |
2-15 years | |
| Machinery and equipment |
5-20 years | |
| Furniture, fixtures and others |
5-20 years | |
| Information technology |
3-10 years |
The carrying value of property, plant and equipment is reviewed for impairment when events or changes in circumstances indicate the carrying value may not be recoverable. Conditions that would necessitate an impairment assessment include a significant decline in the observable fair value of an asset, a significant change in the extent or manner in which an asset is used or any other significant adverse change that would indicate that the carrying amount of an asset or group of assets may not be recoverable.
Impairment losses for long-lived assets are only recorded if the asset’s carrying amount is not recoverable through its undiscounted, probability-weighted future cash flows. The Company measures the impairment loss based on the difference between the carrying amount and estimated fair value.
An item of property, plant and equipment is classified as held for sale when certain criteria are met, including when management has committed to a plan to sell the asset, the asset is available for sale in its immediate condition and the sale is probable within one year of the reporting date. The item is carried at the lower of its previous carrying amount or fair value less costs to sell, and depreciation ceases. Assets held for sale were not material at December 31, 2008 and 2009 or at March 31, 2010.
Leasehold improvements are capitalized and amortized over the lesser of the term of the applicable lease, including renewable periods if reasonably assured, or over the useful life of the improvement.
Borrowing (interest) costs are capitalized, as an increase to property, plant and equipment, on significant capital projects during construction.
Routine repair and maintenance costs are expensed as incurred.
Receivables from related parties
Loans receivable from related parties consist of loans with original maturities greater than one year. Interest is accrued under contract terms, which may allow for capitalization of interest. Loan fees generally are not received from related parties.
Short-term financing
Short-term financing includes bank overdrafts and short-term lines of credit.
Long-term debt
Long-term debt consists of loans with original maturities greater than one year. Fees paid to secure financing are included in other assets and are amortized using the effective interest method over the lives of the facilities.
Environmental liabilities
Environmental liabilities are recorded for obligations (constructive or legally enforceable) and losses when amounts, though uncertain, can be reasonably estimated and where it is probable that settlement will entail an outflow of funds. Liabilities for environmental remediation costs represent the investigation, clean-up and
F-13
Table of Contents
UNIVAR INC.
NOTES TO THE CONSOLIDATED FINANCIAL STATEMENTS—(Continued)
remediation costs that are probable and can be reasonably estimated. Expected cash outflows related to environmental remediation for the next 12 months are reported as current under other accrued expenses with the remaining amounts included under other long-term liabilities.
Environmental costs are capitalized if the costs extend the life of the property, increase its capacity and/or mitigate or prevent contamination from future operations. For additional information on environmental liabilities, see Note 17 to the consolidated financial statements.
Employee benefit plans
Obligations for contributions to defined contribution pension plans are recognized as an expense in the statements of operations as incurred.
The Company also sponsors both funded and unfunded US and foreign defined benefit pension plans and a US post-employment benefit plan. A liability is recognized on the balance sheet for the projected benefit obligation in excess of plan assets or an asset is recorded for plan assets in excess of the projected benefit obligation. Univar recognizes the actuarial gains or losses and prior service costs or credits that arise during the period, but that are not recognized as components of net periodic benefit cost, in other comprehensive income, net of tax.
The net obligations with respect to defined benefit pension and post-employment benefit plans are calculated separately for each plan by estimating the amount of future benefit employees have earned in return for their service in the current and prior period; that benefit is discounted to determine the present value using the projected unit-credit method, and the fair value of any related assets is deducted. The measurement of the benefit obligation is based on the Company’s estimates and actuarial valuations. The discount rate is based on the calculated yield curve of a select bond universe comprising corporate bonds rated AA by Moody’s (or an equivalent rating by a non-US rating agency) that have cash flows similar to the terms of Univar’s obligations. Other assumptions with respect to defined benefit pension plans include participant information such as compensation, age and years of service as well as assumptions related to the expected return on plan assets and mortality rates.
Several of the Company’s defined benefit pension and post-employment benefit plans share risks between various entities within the group. Information about the plans is measured as a whole and the net defined benefit cost is allocated to the individual group companies based on percentage of salary expense. The defined benefit obligation resides on the balance sheets of the sponsoring employer of the plan.
Share-based payments
Prior to October 11, 2007, Univar N.V. awarded stock options to certain company executives based on their position and responsibilities pursuant to an option plan adopted each year. On October 11, 2007, upon change of control arising from Ulixes B.V. acquiring substantially all of the capital stock of Univar N.V., all outstanding stock options were vested and settled.
During the predecessor period, employees received remuneration in the form of share-based payment transactions, whereby employees rendered services in exchange for shares or rights over shares. These share-based payments were expensed on the basis of their fair value determined using an options pricing model and qualified as equity-settled transactions. Accordingly, the fair value of the options at grant date was expensed as an operating cost, based on the expected number of options that were to vest over the vesting period.
F-14
Table of Contents
UNIVAR INC.
NOTES TO THE CONSOLIDATED FINANCIAL STATEMENTS—(Continued)
The cost of equity-settled transactions was recognized, together with a corresponding increase in equity, over the period in which the performance conditions were fulfilled, ending on the date on which the relevant employees became fully entitled to the award (“vesting date”). The cumulative expense recognized for equity-settled transactions at each reporting date until the vesting date reflects the extent to which the vesting period had expired and the expected number of awards that would ultimately vest.
In determining the fair value of the stock options, a Monte Carlo simulation was used as the options pricing model. Inputs to the model for the 2007 options included:
| a) | expected volatility, which was based on historical stock prices of Univar N.V. as well as consideration of future trends, was 29%; |
| b) | expected dividends, which was based on past and projected dividend yields, was 2.8%; |
| c) | the risk-free interest rate, based on the seven-year euro-area government benchmark bond yield, was 4.2%; |
| d) | involuntary post-vest withdrawal, based on market conditions and estimated forfeitures, was 1.5% per year; |
| e) | expected life of options was 4.6 years; and |
| f) | market conditions applicable to each option grant. |
The successor had no stock incentive plans in effect for periods subsequent to October 11, 2007 up to and including at March 31, 2010. For the period ending October 11, 2007, the predecessor, Univar N.V., recorded compensation expense related to stock option awards of $10.3 million.
Revenue recognition
Net sales are generally recognized when persuasive evidence of an arrangement exists, products are received by, or services are provided to customers, the sales price is fixed or determinable and collectibility is reasonably assured. Net sales primarily include product sales, billings for freight and handling charges and fees earned for services provided, net of any discounts, returns, customer rebates and sales or other revenue-based tax. The Company recognizes product sales and billings for freight and handling charges when they are considered delivered to the customer under the terms of the sale. Fee revenues are recognized when services are completed. The Company’s sales, principally in Canada, to customers in the agriculture end-market often provide for a form of inventory protection through credit and re-bill as well as understandings pursuant to which certain price changes from chemical producers may be passed through to the customer. These arrangements require us to make estimates of potential returns of unused chemicals as well as the extent to which pricing may vary over the course of the growing season to determine our net sales. Sales to the agriculture end-market typically peak in the second and third quarters of the year.
Cost of goods sold
Cost of goods sold includes all inventory costs such as purchase price (net of supplier incentive discounts) and transportation cost of the product sold, as well as direct labor and other costs incurred to blend, repackage and deliver the product.
Leases
Leases where the lessor does not transfer substantially all the risks and benefits of ownership of the asset are classified as operating leases. Operating lease payments are recognized as an expense in the statements of operations on a straight-line basis over the lease term. During the periods presented, the Company had no material capital lease commitments.
F-15
Table of Contents
UNIVAR INC.
NOTES TO THE CONSOLIDATED FINANCIAL STATEMENTS—(Continued)
Contingencies
A loss contingency is recorded if it is probable that an asset has been impaired or a liability has been incurred and the amount of the loss can be reasonably estimated. The Company evaluates, among other factors, the degree of probability of an unfavorable outcome and the ability to make a reasonable estimate of the amount of the ultimate loss. Changes in these factors and related estimates could materially affect the Company’s financial position and results of operations.
Financial instruments
Fair value
As discussed in Note 18 to the consolidated financial statements, fair value is defined as the price that would be received to sell an asset or paid to transfer a liability in an orderly transaction between market participants at the measurement date. To increase the comparability of fair value measures, the following hierarchy prioritizes the inputs to valuation methodologies used to measure fair value:
| Level 1 – | Valuations based on quoted prices for identical assets and liabilities in active markets. |
| Level 2 – | Valuations based on observable inputs other than quoted prices included in Level 1, such as quoted prices for similar assets and liabilities in active markets, quoted prices for identical or similar assets and liabilities in markets that are not active, or other inputs that are observable or can be corroborated by observable market data. |
| Level 3 – | Valuations based on unobservable inputs reflecting the Company’s own assumptions, consistent with reasonably available assumptions made by other market participants. These valuations require significant judgement. |
Derivatives
The Company uses derivative financial instruments, such as foreign currency contracts and interest rate swaps, to manage its risks associated with foreign currency and interest rate fluctuations. Such derivative financial instruments are recorded at fair value. The fair value of forward exchange contracts is calculated by reference to current forward exchange rates for contracts with similar maturity profiles. The fair value of interest rate swap contracts is determined by estimating the net present value of amounts to be paid under the agreement offset by the net present value of the expected cash inflows based on market rates and associated yield curves.
For the purpose of hedge accounting, hedges are classified as either fair value hedges, when they hedge the exposure to changes in the fair value of a recognized asset or liability, or cash flow hedges, where they hedge exposure to variability in cash flows that is either attributable to a particular risk associated with a recognized asset or liability or a highly probable forecasted transaction.
In relation to fair value hedges used to manage the exposure to changes in the fair value of a recognized asset or liability that meets the conditions for hedge accounting, any gain or loss from remeasuring the hedging instrument at fair value is recognized immediately in the statements of operations. Any gain or loss on the hedged item attributable to the hedged risk is adjusted against the carrying amount of the hedged items and recognized immediately in the statements of operations.
In relation to cash flow hedges used to hedge highly probable forecasted transactions that meet the conditions for hedge accounting, the portion of the gain or loss on the hedging instrument that is determined to be an effective hedge is recognized in other comprehensive income and the ineffective portion is recognized immediately in the statements of operations.
F-16
Table of Contents
UNIVAR INC.
NOTES TO THE CONSOLIDATED FINANCIAL STATEMENTS—(Continued)
When the hedged forecasted transaction results in the recognition of an asset or liability, then, at the time the asset or liability is recognized, the associated gains or losses that had previously been recognized in other comprehensive income are included in the initial measurement of the acquisition cost or other carrying amount of the asset or liability.
For derivatives that do not qualify for hedge accounting, any gains or losses arising from changes in fair value are recognized in the statements of operations.
Hedge accounting is discontinued when the hedging instrument is sold, expired, terminated or exercised, or no longer qualifies for hedge accounting. At that point, any cumulative gain or loss on the hedging instrument recognized in other comprehensive income is reclassified into earnings in the same period during which the hedged transaction affects earnings. If it becomes probable that a hedged transaction will no longer occur, the net cumulative gain or loss recognized in other comprehensive income is reclassified into earnings immediately.
Foreign currency translation
The functional currency of foreign operations is generally the local currency, unless the primary economic environment requires the use of another currency. Transactions denominated in foreign currencies are translated into the functional currency of the local entity at the rate of exchange ruling at the date of transaction. Monetary assets and liabilities denominated in foreign currencies are retranslated at the functional currency rate of exchange prevailing at the balance sheet date. All differences are taken to the consolidated statements of operations with the exception of differences on foreign currency borrowings that are considered part of the investment in a foreign operation. These are taken directly to other comprehensive income until repayment of the borrowing at which time they are recognized in the consolidated statements of operations. Tax charges and credits attributable to exchange differences on those borrowings are also recorded in shareholder’s equity.
Assets and liabilities of group companies denominated in foreign currencies are translated into US dollars at the exchange rates prevailing on the balance sheet date and their statements of operations are translated at the average exchange rates for the period. The exchange differences arising on the translation are taken directly to a separate component of shareholder’s equity. On disposal of a foreign entity, the deferred cumulative amount recognized in equity related to that particular foreign operation will be recognized in the statements of operations.
Recently issued and adopted accounting pronouncements
In January 2010, the Financial Accounting Standards Board (“FASB”) issued new accounting guidance on improving disclosures about fair value measurements. The new accounting guidance requires additional disclosures for all levels of fair value measurements as well as clarification for existing disclosures. Except for the additional Level 3 activity disclosures, this statement is effective for interim and annual reporting periods beginning after December 15, 2009, which is the first quarter of 2010 for the Company. The additional Level 3 activity disclosures will be effective for years beginning after December 15, 2010, and for interim periods within those years, which will be the first quarter of 2011 for the Company. The provisions of this statement will not have a material impact on the consolidated financial statements. For the Company’s fair value disclosures, see Note 18 to the consolidated financial statements.
In June 2009, the FASB issued a new accounting statement that is designed to address the potential impacts on the provisions and application of previously issued guidance on the consolidation of variable interest entities as a result of the elimination of the qualifying special purpose entity concept. The new statement was effective as of the beginning of each reporting entity’s first annual reporting period that begins after November 15, 2009, for
F-17
Table of Contents
UNIVAR INC.
NOTES TO THE CONSOLIDATED FINANCIAL STATEMENTS—(Continued)
interim periods within that first annual reporting period, and for interim and annual reporting periods thereafter, which is the first quarter of 2010 for the Company. The provisions of this statement did not have a material impact on the consolidated financial statements.
In June 2009, the FASB issued a new accounting statement that defines the new US GAAP hierarchy and explains how the FASB will use its Accounting Standards Codification as the sole source for all authoritative guidance. The Company adopted the Codification beginning in the third quarter of 2009. The adoption of the new statement did not have an impact on the consolidated financial statements.
In May 2009, the FASB issued a new accounting statement on subsequent events. The objective of this statement is to provide further guidance for disclosures relating to the type of subsequent event (recognized versus non-recognized) and to modify the definition of when a subsequent event occurred and the date through which a subsequent event has been evaluated by management. The Company’s management defines the evaluation period for subsequent events as events or transactions that occurred after the balance sheet date, but before the issuance of the consolidated financial statements. The provisions of the new statement were effective for the Company beginning in the second quarter of 2009 and did not have a material impact on the consolidated financial statements. This new guidance requires the disclosure of the date through which an entity has evaluated subsequent events. The Company has included this disclosure in Note 20 to the consolidated financial statements.
In April 2009, the FASB issued new accounting guidance on interim disclosures about the fair value of financial instruments. The guidance enhances consistency in financial reporting by requiring qualitative and quantitative information about fair value estimates of all financial instruments on a quarterly basis. The expanded disclosure provisions were effective for the Company beginning in the second quarter of 2009 and are included in Note 18 to the consolidated financial statements.
In April 2009, the FASB issued new accounting guidance related to contingencies in a business combination, which amends and clarifies previously issued accounting rules, that require measurement of fair value at the acquisition date if fair value can be reasonably determined and provides guidance on how to make that determination. It also amends the subsequent measurement and disclosure requirements for assets and liabilities arising from contingencies in a business combination. The new guidance was effective as of the beginning of 2009 for the Company. The provisions of the new accounting guidance did not have a material impact on the consolidated financial statements.
In December 2008, the FASB issued new accounting guidance related to an employer’s disclosures about plan assets of a defined benefit pension or other postretirement plans. The guidance includes a technical amendment that requires disclosure of the net periodic benefit cost for each annual period for which a statement of operations is presented. The new guidance was effective for the Company for its 2009 annual reporting period and the disclosures are included in Note 14 to the consolidated financial statements.
In December 2007, the FASB issued a new accounting statement on business combinations. This statement establishes principles and requirements for how an acquirer recognizes and measures in its financial statements the identifiable assets acquired, the liabilities assumed, any non-controlling interest in the acquiree and the goodwill acquired. It also establishes disclosure requirements which will enable users to evaluate the nature and financial effects of the business combination. This statement was effective as of the beginning of year 2009 for the Company. The provisions of this statement did not have a material impact on the consolidated financial statements, but will change the method of accounting for certain costs related to acquisitions occurring after the effective date.
F-18
Table of Contents
UNIVAR INC.
NOTES TO THE CONSOLIDATED FINANCIAL STATEMENTS—(Continued)
In September 2006, the FASB issued new accounting and disclosure guidance which defines fair value, establishes a framework for measuring fair value in generally accepted accounting principles, and expands disclosures about fair value measurements. This guidance applies whenever other accounting standards require or permit assets or liabilities to be measured at fair value but does not expand the use of fair value to new accounting transactions and does not apply to pronouncements that address share-based payment transactions. Univar adopted the guidance for its financial assets and liabilities on January 1, 2008 and for its nonfinancial assets and liabilities measured at fair value on a nonrecurring basis on January 1, 2009. The nonfinancial assets and liabilities measured at fair value on a nonrecurring basis include goodwill and indefinite lived intangibles, as well as assets acquired and liabilities assumed in a business combination. The adoption of the guidance did not not have a material impact on the consolidated financial statements; however, it did affect how Univar measured the fair value of goodwill and indefinite lived intangible assets during the annual impairment testing.
In July 2006, the FASB issued guidance which clarifies the accounting for uncertainty in income taxes recognized in the financial statements. This guidance provides that a tax benefit from an uncertain tax position may be recognized when it is more likely than not that the position will be sustained upon examination, including resolutions of any related appeals or litigation processes, based on the technical merits. Income tax positions must meet a more-likely-than-not recognition threshold at the effective date to be recognized upon the adoption of this guidance and in subsequent periods. This guidance also provides for measurement, derecognition, classification, interest and penalties, accounting in interim periods, disclosure and transition. The Company adopted this guidance on January 1, 2007. As a result, the Company recognized a $0.3 million increase in liability for unrecognized tax benefits, which was accounted for as a reduction to the January 1, 2007 balance of retained earnings.
F-19
Table of Contents
UNIVAR INC.
NOTES TO THE CONSOLIDATED FINANCIAL STATEMENTS—(Continued)
| 2 | Business combinations |
Acquisition of Chemcentral Corporation
On April 19, 2007 the predecessor acquired 100% of the voting shares of Chemcentral, based in Chicago, Illinois, for $659.6 million. The predecessor acquired Chemcentral primarily to broaden its product lines and enhance its supplier and customer relationships in several important customer segments, such as paints and coatings, household and industrial and personal care. The acquisition was accounted for using the purchase method of accounting. The predecessor financial statements include the results of Chemcentral for the period from the acquisition date. The purchase price was allocated to the assets acquired and liabilities assumed based on their estimated fair value.
| (in US$ millions) |
Allocation of Purchase Price | ||
| Cash |
$ | 4.1 | |
| Trade accounts receivable |
198.7 | ||
| Inventories |
113.1 | ||
| Prepaid expenses and other current assets |
6.1 | ||
| Income tax receivable |
10.7 | ||
| Property, plant and equipment |
205.0 | ||
| Intangible assets |
140.5 | ||
| Deferred tax asset, net |
34.4 | ||
| Other assets |
10.9 | ||
| Assets |
723.5 | ||
| Short-term financing |
2.1 | ||
| Trade accounts payable |
138.8 | ||
| Income taxes payable |
1.3 | ||
| Deferred tax liabilities |
131.7 | ||
| Pension and other long-term liabilities |
92.7 | ||
| Liabilities |
366.6 | ||
| Net assets |
356.9 | ||
| Goodwill arising on acquisition |
302.7 | ||
| Total acquisition cost |
$ | 659.6 | |
The total acquisition cost included costs of $9.6 million directly attributable to the acquisition, consisting primarily of legal and consultancy fees.
Cash paid for acquisition:
| (in US$ millions) |
||||
| Net cash acquired with the subsidiary |
$ | 4.1 | ||
| Cash paid |
(659.6 | ) | ||
| Net cash paid |
$ | (655.5 | ) | |
F-20
Table of Contents
UNIVAR INC.
NOTES TO THE CONSOLIDATED FINANCIAL STATEMENTS—(Continued)
If the combination had taken place on January 1, 2007, the net sales for the predecessor period ended October 11, 2007 would have been $6,868.2 million (unaudited) and net income would have been $79.3 million (unaudited). Due to the rapid integration of Chemcentral and Univar operations, the Company cannot reasonably determine the amount Chemcentral contributed to the net income of Univar from the date of acquisition. Chemcentral had approximately 950 employees at the time of acquisition.
The goodwill recognized above was attributed to the expected synergies from combining the assets and activities of Chemcentral with those of the Company’s USA segment. Chemcentral was legally merged into Univar USA Inc. on October 1, 2007.
Also during the predecessor period, $1.5 million was paid to acquire exclusive product distribution rights.
Business Combination with Ulixes B.V.
On October 11, 2007, Ulixes B.V. acquired substantially all of the voting shares of Univar N.V., the predecessor, for $2,165.4 million. The acquisition was accounted for using the purchase method of accounting and the purchase price was allocated based on the estimated fair value of the assets acquired and liabilities assumed. The predecessor financial statements reflect the operations of Univar N.V. up to this acquisition, at which time the business was restructured. The successor financial statements reflect the operations of the subsidiaries transferred to Univar Inc. which represent substantially all of the operations of Univar N.V.
| (in US$ millions) |
Allocation of Purchase Price | ||
| Cash and cash equivalents |
$ | 32.2 | |
| Trade accounts receivable |
1,349.4 | ||
| Inventories |
794.6 | ||
| Prepaid expenses and other current assets |
135.6 | ||
| Income tax receivable |
34.8 | ||
| Total current assets |
2,346.6 | ||
| Property, plant and equipment |
1,020.9 | ||
| Intangible assets |
615.5 | ||
| Deferred tax assets, net |
238.3 | ||
| Other assets |
28.9 | ||
| Total assets |
4,250.2 | ||
| Short-term financing |
116.1 | ||
| Trade accounts payable |
955.7 | ||
| Current portion of long-term debt |
0.1 | ||
| Other accrued expenses |
352.8 | ||
| Income taxes payable |
12.8 | ||
| Total current liabilities |
1,437.5 | ||
| Long-term debt |
1,238.0 | ||
| Pension and other post-retirement benefit liabilities |
245.6 | ||
| Deferred tax liabilities |
435.7 | ||
| Other long-term liabilities |
236.9 | ||
| Total liabilities |
3,593.7 | ||
| Net assets |
656.5 | ||
| Goodwill arising on acquisition |
1,508.9 | ||
| Total acquisition cost |
$ | 2,165.4 | |
F-21
Table of Contents
UNIVAR INC.
NOTES TO THE CONSOLIDATED FINANCIAL STATEMENTS—(Continued)
The total acquisition cost includes $17.3 million of costs directly attributable to the acquisition, consisting primarily of legal and consultancy fees.
Cash paid for acquisition:
| (in US$ millions) |
||||
| Net cash acquired with the subsidiary |
$ | 32.2 | ||
| Cash paid |
(2,165.4 | ) | ||
| Net cash paid |
$ | (2,133.2 | ) | |
Other acquisitions
In December 2007, the Company acquired the assets of Dow Chemicals’ Western Canada caustic soda distribution business (“NVDC”), for $44.3 million. NVDC is a significant distributor of caustic soda in Western Canada. The assets acquired consisted of inventory of $6.5 million, property, plant and equipment of $33.4 million and goodwill and intangible assets of $5.2 million. If the combination had taken place on January 1, 2007, the net income for 2007 for the period to October 11, 2007 would have been $67.2 million (unaudited) and net sales would have been $6,448.2 million (unaudited) and the net loss for the period from October 12, 2007 to December 31, 2007 would have been $13.3 million (unaudited) and net sales would have been $1,817.1 million (unaudited).
In April 2008, the Company acquired Marnic Plc, an independent niche supplier of tape and protection materials to construction, agriculture, audio visual and aerospace sectors based in London, UK. The total cost of acquisition of $13.6 million includes $5.6 million of net cash acquired with the subsidiary and $6.2 million of intangible assets. If the combination had taken place on January 1, 2008, the net loss for 2008 would have been $7.8 million (unaudited) and net sales would have been $9,429.5 million (unaudited). If the combination had taken place on January 1, 2007, the net income for the period to October 11, 2007 would have been $59.9 million (unaudited) and net sales would have been $6,334.0 million (unaudited) and the net loss for the period from October 12, 2007 to December 31,2007 would have been $15.1 million (unaudited) and net sales would have been $1,792.5 million (unaudited).
Goodwill and intangible assets from the NVDC acquisition were allocated to Univar Canada and goodwill and intangible assets from the Marnic acquisition were allocated to Univar EMEA.
Sale of operations
On September 11, 2008, the Company sold the Mozel packaging business for $10.2 million as part of Univar’s strategic decision to focus on its core business of chemical distribution. This resulted in a loss on disposal of $2.4 million. For the eight months of the year that Mozel operated, it had sales and a net income of $22.4 million and $0.5 million, respectively. In addition, the Company’s share in several minor investments acquired with the Chemcentral business were exchanged for full investments in a Chinese business. These transactions generated $1.8 million of cash.
On June 26, 2009, the Company sold the operations of its US based polymers business, Performance Polymers Inc. (“PPI”), for $24.3 million which resulted in a loss on disposal of $1.2 million. For the six months of the year that PPI was owned by the Company, it had sales and a net loss of $38.5 million and $3.0 million, respectively.
F-22
Table of Contents
UNIVAR INC.
NOTES TO THE CONSOLIDATED FINANCIAL STATEMENTS—(Continued)
| 3 | Earnings per common share |
Basic earnings per common share is computed using the weighted-average number of outstanding shares of common stock during the period. Diluted earnings per common share is computed using the weighted-average number of outstanding shares of common stock and, when dilutive, potential common shares outstanding during the period. For all periods presented, no dilutive potential common shares were outstanding.
| Year
Ended December 31, |
Three Months Ended March 31, | ||||||||||||||
| (in US$ millions, except share and per share data) |
2008 | 2009 | 2009 | 2010 | |||||||||||
| (unaudited) | |||||||||||||||
| Basic earnings (loss) per common share |
|||||||||||||||
| Net income (loss) |
$ | (8.0 | ) | $ | (42.7 | ) | $ | (10.0 | ) | $ | 3.6 | ||||
| Shares used in computation: |
|||||||||||||||
| Weighted-average common shares outstanding |
196 | 196 | 196 | 196 | |||||||||||
| Basic earnings (loss) per common share |
$ | (40,701 | ) | $ | (218,001 | ) | $ | (51,088 | ) | $ | 18,339 | ||||
As a result of the acquisition by Ulixes B.V., the capital structure of the predecessor is not comparable to that of the successor. Accordingly, net income per common share is not comparable or meaningful for periods prior to 2008 and is therefore not presented.
| 4 | Cash and cash equivalents |
Cash and cash equivalents consisted of the following:
| December 31, | March 31, 2010 | ||||||||
| (in US$ millions) |
2008 | 2009 | |||||||
| (unaudited) | |||||||||
| Cash at bank and on-hand |
$ | 183.3 | $ | 134.0 | $ | 107.1 | |||
| Deposits |
39.8 | 6.2 | 7.6 | ||||||
| Total |
$ | 223.1 | $ | 140.2 | $ | 114.7 | |||
Cash at bank earns interest at floating rates based on daily bank deposit rates. Short-term deposits are made for varying periods of between one day and one month depending on the immediate cash requirements of the group, and earn interest at the respective short-term deposit rates. The carrying value of cash and short-term deposits equals fair value.
| 5 | Trade accounts receivable, net |
Trade accounts receivable are stated net of an allowance for doubtful accounts. The allowance for doubtful accounts was $15.2 million, $18.3 million, and $17.1 million at December 31, 2008, December 31, 2009, and March 31, 2010 (unaudited), respectively. As of December 31, 2008 and 2009, accounts receivable balances within 30 days of their due date was 97% and 96%, respectively, of the total outstanding trade accounts
F-23
Table of Contents
UNIVAR INC.
NOTES TO THE CONSOLIDATED FINANCIAL STATEMENTS—(Continued)
receivable. As of March 31, 2010 (unaudited), accounts receivable balances within 30 days of their due date was 98% of the total outstanding trade accounts receivable. The Company has completed a thorough review of past due balances and has reserved for those that are considered uncollectible. Any change in the allowance reflects current market conditions and specific customer accounts which may be under duress.
| 6 | Prepaid expenses and other current assets |
Prepaid expenses represent upfront payments for typically yearly expenses such as insurance, service contracts and subscriptions which are expensed over the period in which the benefit or service is received. Receivables related to supplier incentives represent the unpaid portion of rebates due from suppliers based upon the Company’s achievement of certain measures, generally related to purchasing volumes.
Prepaid expenses and other current assets consisted of the following:
| December 31, | March 31, 2010 | ||||||||
| (In US$ millions) |
2008 | 2009 | |||||||
| (unaudited) | |||||||||
| Prepaid expenses |
$ | 33.0 | $ | 26.7 | $ | 58.5 | |||
| Supplier incentives |
30.2 | 37.6 | 22.9 | ||||||
| Other tax receivable |
8.0 | 8.0 | 7.5 | ||||||
| Derivative contracts |
1.0 | 0.1 | 0.8 | ||||||
| Other receivables |
35.5 | 39.2 | 37.7 | ||||||
| Total |
$ | 107.7 | $ | 111.6 | $ | 127.4 | |||
| 7 | Property, plant and equipment |
Property, plant and equipment consisted of the following:
| December 31, | March 31, 2010 |
|||||||||||
| (In US$ millions) |
2008 | 2009 | ||||||||||
| (unaudited) | ||||||||||||
| Land and buildings |
$ | 684.9 | $ | 710.2 | $ | 710.0 | ||||||
| Tank farms |
153.3 | 167.3 | 169.5 | |||||||||
| Machinery, equipment and other |
199.1 | 261.8 | 261.7 | |||||||||
| Less: Accumulated depreciation |
(82.8 | ) | (191.9 | ) | (213.5 | ) | ||||||
| Subtotal |
954.5 | 947.4 | 927.7 | |||||||||
| Work in progress |
33.9 | 15.3 | 15.3 | |||||||||
| Property, plant and equipment, net |
$ | 988.4 | $ | 962.7 | $ | 943.0 | ||||||
At the time of the NVDC asset acquisition in December 2007, there was a shortage of railcars in Canada. With the deterioration of the economy in general and in particular the caustic soda market since that time, the availability of railcars has increased which has driven down their value. Consistent with the impairment recognized on the NVDC intangible assets discussed in Note 8 to the consolidated financial statements, an impairment charge of $13.4 million relating to the 374 railcars acquired in the 2007 acquisition was also recorded in 2009. The fair value of these assets and the related impairment charge was determined by a review of similar third party transactions (Level 2 fair value measurement). The Company is actively redeploying these assets within the organization where possible and may look to sell excess railcars in the coming year.
F-24
Table of Contents
UNIVAR INC.
NOTES TO THE CONSOLIDATED FINANCIAL STATEMENTS—(Continued)
The Company performs a valuation on properties that become idle and impairs assets where the carrying value exceeds the estimated fair value of the property. The fair value of the property was determined by a market or income approach (Level 3 fair value measurement). During 2009 and 2010, the Company has taken an impairment charge on several properties which have become idle during the respective periods. The impairments amounted to $18.7 million and $3.6 million for the year ended December 31, 2009 and the three months ended March 31, 2010, respectively, and reflected the change in the real estate market compared to that at the time of the Ulixes B.V. acquisition in October 2007.
Depreciation expense was $65.1 million, $81.6 million, and $80.1 million for the combined period 2007 and the years ended December 31, 2008 and 2009, respectively and $19.1 million (unaudited) and $20.1 million (unaudited) for the three months ended March 31, 2009 and 2010 respectively.
Capitalized interest costs on capital projects amounted to $0.8 million in 2008 and $0.2 million in 2009. Fully depreciated assets included in the gross cost and accumulated depreciation amounted to $45.3 million and $82.0 million at December 31, 2008 and 2009, respectively. The net book value of idle assets is $17.5 million and $35.8 million at December 31, 2008 and 2009, respectively.
| 8 | Goodwill and intangible assets |
Changes in goodwill and intangible assets are as follows:
| 2008 | 2009 | |||||||||||||||||||||||
| (in US$ millions) |
Goodwill | Intangible | Total | Goodwill | Intangible | Total | ||||||||||||||||||
| Net book value at January 1, |
$ | 1,519.5 | $ | 609.6 | $ | 2,129.1 | $ | 1,380.2 | $ | 511.0 | $ | 1,891.2 | ||||||||||||
| Additions |
5.5 | 3.1 | 8.6 | — | — | — | ||||||||||||||||||
| Reclassifications |
0.5 | (0.8 | ) | (0.3 | ) | — | — | — | ||||||||||||||||
| Impairment |
— | — | — | (1.5 | ) | (2.4 | ) | (3.9 | ) | |||||||||||||||
| Disposal from sale |
— | — | — | — | (4.1 | ) | (4.1 | ) | ||||||||||||||||
| Amortization |
— | (50.8 | ) | (50.8 | ) | — | (46.3 | ) | (46.3 | ) | ||||||||||||||
| Exchange differences |
(145.3 | ) | (50.1 | ) | (195.4 | ) | 85.8 | 27.9 | 113.7 | |||||||||||||||
| Net book value at December 31, |
$ | 1,380.2 | $ | 511.0 | $ | 1,891.2 | $ | 1,464.5 | $ | 486.1 | $ | 1,950.6 | ||||||||||||
During 2009, impairment charges of $1.5 million of goodwill and $2.4 million of intangible assets relating to the 2007 acquisition of NVDC assets were taken due to the deterioration of the economy in general and increased competition in the caustic soda distribution market in Canada. These impairments were determined to be a Level 3 fair value measurement. Intangible assets were reduced due to the sale of the Company’s US-based polymers business, Performance Polymers, resulting in the disposal of customer relationships and trademark intangible assets with a net book value of $4.1 million.
Additions to goodwill and intangible assets in 2008 related to the acquisition of Marnic Plc. Reclassifications of goodwill in 2008 resulted from the completion of the purchase accounting allocation after the acquisition by Ulixes B.V.
F-25
Table of Contents
UNIVAR INC.
NOTES TO THE CONSOLIDATED FINANCIAL STATEMENTS—(Continued)
Total goodwill was allocated to reporting units in local currency. The balances as translated at the exchange rates of the prevailing balance sheet dates are as follows:
| December 31, | March 31, | ||||||||
| (in US$ millions) |
2008 | 2009 | 2010 | ||||||
| Univar USA |
$ | 711.4 | $ | 711.4 | $ | 711.4 | |||
| Univar Canada |
466.8 | 539.7 | 559.7 | ||||||
| Univar EMEA |
201.3 | 212.5 | 199.6 | ||||||
| Rest of World |
0.7 | 0.9 | 0.9 | ||||||
| Total |
$ | 1,380.2 | $ | 1,464.5 | $ | 1,471.6 | |||
Intangible assets relating to customer relationships comprised approximately $428 million and $419 million of the net book value at December 31, 2008 and 2009, respectively, and had an average remaining estimated useful life of 15 and 14 years at December 31, 2008 and 2009, respectively.
| (in US$ millions) For the Years Ended December 31, |
Estimated Amortization Expense | ||
| 2010 |
$ | 46.0 | |
| 2011 |
46.5 | ||
| 2012 |
45.5 | ||
| 2013 |
43.2 | ||
| 2014 |
42.5 | ||
Goodwill and intangible assets acquired through business combinations have been allocated to each reporting unit for impairment testing. The calculation of fair value for these assets is most sensitive to the following assumptions:
| • | Earnings before interest, taxes, depreciation, amortization and unusual, nonrecurring items (adjusted EBITDA) |
| • | Discount rates |
| • | Market share during the budget period |
| • | Growth rate used to extrapolate cash flows beyond the budget period |
To calculate fair value, cash flow projections were based on adjusted EBITDA from financial projections approved by senior management covering a five-year period. The discount rates applied to cash flow projections for testing the impairment of goodwill was 11.0% in 2008 and ranged from 9.5% to11.0% in 2009. These rates represented the after-tax cost of capital rate reflecting macroeconomic, industry and company specific factors in determining the degree of perceived risk associated with the projected cash flows. Discount rates applied to cash flow projections for testing definite lived intangible assets ranged from 10.5% to 12.0% as deemed appropriate for each of the individual assets.
F-26
Table of Contents
UNIVAR INC.
NOTES TO THE CONSOLIDATED FINANCIAL STATEMENTS—(Continued)
| 9 | Trade accounts payable |
Trade accounts payable consisted of the following:
| December 31, | March 31, 2010 | ||||||||
| (in US$ millions) |
2008 | 2009 | |||||||
| (unaudited) | |||||||||
| Trade accounts payable |
$ | 639.0 | $ | 528.4 | $ | 863.8 | |||
| Drafts payable |
82.1 | 38.0 | 60.7 | ||||||
| Total |
$ | 721.1 | $ | 566.4 | $ | 924.5 | |||
Drafts payable are checks written in excess of bank balances to be funded upon clearing the bank.
| 10 | Other accrued expenses |
Other accrued expenses included in current liabilities consisted of the following:
| December 31, | March 31, 2010 | ||||||||
| (In US$ millions) |
2008 | 2009 | |||||||
| (unaudited) | |||||||||
| Environmental liabilities |
$ | 25.3 | $ | 48.3 | $ | 46.8 | |||
| Customer prepayments and deposits |
53.8 | 67.5 | 62.8 | ||||||
| Other taxes payable |
19.4 | 23.0 | 27.8 | ||||||
| Derivative contracts |
53.0 | 6.3 | 6.6 | ||||||
| Pension liabilities |
6.4 | 7.0 | 7.4 | ||||||
| Other accrued expenses |
139.2 | 113.1 | 101.9 | ||||||
| Total |
$ | 297.1 | $ | 265.2 | $ | 253.3 | |||
| 11 | Other long-term liabilities |
Other long-term liabilities, net of any current portion, consisted of the following:
| December 31, | March 31, 2010 | ||||||||
| (In US$ millions) |
2008 | 2009 | |||||||
| (unaudited) | |||||||||
| Environmental liabilities |
$ | 184.2 | $ | 152.1 | $ | 150.8 | |||
| Income tax contingencies |
49.0 | 19.0 | 18.3 | ||||||
| Derivative contracts |
44.2 | — | — | ||||||
| Other liabilities |
21.4 | 28.0 | 23.8 | ||||||
| Total |
$ | 298.8 | $ | 199.1 | $ | 192.9 | |||
F-27
Table of Contents
UNIVAR INC.
NOTES TO THE CONSOLIDATED FINANCIAL STATEMENTS—(Continued)
| 12 | Long-term debt |
Components of long-term debt are as follows:
| December 31, | March 31, 2010 |
|||||||||||
| (in US$ millions) |
2008 | 2009 | ||||||||||
| (unaudited) | ||||||||||||
| Credit facility loans |
$ | 2,347.2 | $ | 2,031.6 | $ | 1,801.3 | ||||||
| Other loans |
1.0 | 0.8 | 0.8 | |||||||||
| 2,348.2 | 2,032.4 | 1,802.1 | ||||||||||
| Current portion |
(60.3 | ) | (125.8 | ) | (125.0 | ) | ||||||
| Total |
$ | 2,287.9 | $ | 1,906.6 | $ | 1,677.1 | ||||||
The weighted average interest rates on credit facility loans was 8.5% and 9.0% for the years ended December 31, 2008 and 2009, respectively and 6.1% for the three months ended March 31, 2010 (unaudited).
The average term of credit facility loans was 5.8 years and 4.9 years at December 31, 2008 and 2009, respectively, and 4.9 years at March 31, 2010 (unaudited).
Future contractual maturities of the long-term debt are as follows:
| (in US$ millions) |
December 31, 2009 |
March 31, 2010 | ||||
| (unaudited) | ||||||
| 2010 |
$ | 125.8 | $ | 125.0 | ||
| 2011 |
27.7 | 27.7 | ||||
| 2012 |
37.0 | 37.0 | ||||
| 2013 |
336.9 | 107.4 | ||||
| 2014 and after |
1,505.0 | 1,505.0 | ||||
| Total |
$ | 2,032.4 | $ | 1,802.1 | ||
On October 11, 2007, loan facilities were entered into between Ulixes Acquisition BV, the Company and a number of subsidiary companies as borrowers and guarantors. These loan facilities were structured as a syndicated asset-based Loan facility (ABL Facility) in the amount of $1,100 million which expires on October 11, 2013; a syndicated $1,250 million Term Loan Facility which expires on October 11, 2014, and $600 million 12% unsecured Senior Subordinated Notes (Senior Subordinated Notes) which are due to be repaid on September 30, 2015. The Senior Subordinated Notes are held by an indirect shareholder of the Company. Accordingly, $600 million is due to a related party. The Term Loan Facility is subdivided into Term Loan A for $215 million and Term Loan B for $1,035 million. The ABL Facility and Term Loan Facility each provide for floating rate loans of various maturities and currencies.
The ABL Facility is secured by substantially all of the assets of the US and Canadian operating companies. The Term Loan Facility is secured by substantially all of the assets of the US and UK operating companies. With respect to shared collateral securing the ABL Facility and the Term Loan Facility consisting of accounts receivable and inventory, the obligations under the ABL Facility are secured by a first priority lien on such accounts receivable and inventory, and the obligations under the Term Loan Facility are secured by a second priority lien on such accounts receivable and inventory. Under the ABL Facility, security provided by the
F-28
Table of Contents
UNIVAR INC.
NOTES TO THE CONSOLIDATED FINANCIAL STATEMENTS—(Continued)
Canadian entities secures the obligations of the Canadian borrower. Under the Term Loan Facility, security provided by the UK entities secures the obligations of the UK borrower. In addition, 65% of the shares of all first-tier foreign subsidiaries owned by the US subsidiaries have been pledged as security to the lenders in respect of all obligations. The assets pledged under the ABL Facility and the Term Loan Facility are as follows:
| December 31, | March 31, 2010 | ||||||||
| (in US$ millions) |
2008 | 2009 | |||||||
| (unaudited) | |||||||||
| Cash |
$ | 174.2 | $ | 44.3 | $ | 40.9 | |||
| Inventories |
652.2 | 516.9 | 600.1 | ||||||
| Trade accounts receivable |
743.7 | 615.0 | 701.9 | ||||||
| Property, plant and equipment |
865.9 | 834.4 | 821.7 | ||||||
| Other assets |
92.3 | 78.4 | 58.4 | ||||||
| Total |
$ | 2,528.3 | $ | 2,089.0 | $ | 2,223.0 | |||
Interest rates for each drawdown under the ABL Facility and Term Loan Facility are a function of the then-current benchmark rate (USD LIBOR, LIBOR, etc.) and a credit spread. Under the terms of the ABL Facility the credit spread is 2.75% on the first $100 million and 1.5% on the remainder. Under the terms of the Term Loan Facility the credit spread is 2.5% on the Term Loan A and 3.0% on the Term Loan B. Based on interest rate swap contracts and the applicable credit margins, the effective interest rate for the long-term loans was 8.2% and 6.1% at December 31, 2008 and 2009, respectively, and 6.6% (unaudited) at March 31, 2010. The following were the advances outstanding under the various facilities:
| December 31, | March 31, 2010 | ||||||||
| (in US$ millions) |
2008 | 2009 | |||||||
| (unaudited) | |||||||||
| ABL |
$ | 558.6 | $ | 290.7 | $ | 67.4 | |||
| Term Loan A |
164.0 | 161.2 | 154.2 | ||||||
| Term Loan B |
1,024.6 | 979.7 | 979.7 | ||||||
| Senior Subordinated Notes with related party |
600.0 | 600.0 | 600.0 | ||||||
| Total |
$ | 2,347.2 | $ | 2,031.6 | $ | 1,801.3 | |||
The following were the advances outstanding under the various facilities in their local currency:
| December 31, | March 31, 2010 | ||||||||
| (in millions) |
2008 | 2009 | |||||||
| (unaudited) | |||||||||
| US dollar ($) |
$ | 2,070.5 | $ | 1,843.2 | $ | 1,691.6 | |||
| British pound (GBP) |
£ | 71.3 | £ | 65.6 | £ | 65.6 | |||
| Canadian dollar (CAD) |
C$ | 210.0 | C$ | 86.2 | C$ | 10.3 | |||
Based on the available qualifying capital at December 31, 2009 and at March 31, 2010, the undrawn balance available for borrowing on the ABL was $365.1 million and $703.5 million (unaudited), respectively.
The companies noted as borrowers and guarantors under the credit facilities are subject to a number of financial covenants. The covenants are calculated based on the consolidated financial results of Ulixes Acquisition B.V., an indirect parent company of Univar.
F-29
Table of Contents
UNIVAR INC.
NOTES TO THE CONSOLIDATED FINANCIAL STATEMENTS—(Continued)
As of December 31, 2009 and and March 31, 2010 (unaudited), the Company, through Ulixes Acquisition B.V., was in compliance with all covenants.
The Term Loan Facility requires repayment of principal on the Term Loan A in semi-annual installments beginning on December 31, 2008, and ending on October 11, 2014. The Term Loan Facility also requires repayment, in part, of the principal on the Term Loan B in installments of 0.25% per quarter beginning on March 31, 2008.
The Term Loan Facility includes a requirement for prepayments associated with excess cash flow in each year. The amount of the prepayment is specifically prescribed in the credit agreements and approximates the statement of cash flows. Fifty-percent of the resulting cash flow figure is then required to be prepaid to Term Loan lenders on a pro-rata basis before April 30 of the following year. The amounts paid for excess cash flow in 2008 and 2009 were $49.2 million and $125.0 million, respectively. An estimate of the payment is included in the current portion of long-term debt each year at December 31.
There are certain restrictions that apply to the use of the ABL, Term Loan and Senior Subordinated Notes facilities. These restrictions include provisions which provide that borrowings under the facilities may only be used for the financing of certain acquisitions, for working capital and for general corporate purposes, that the net proceeds from certain disposals and capital market issues must be used as mandatory prepayments. Such restrictions also restrict the creation of certain security interests and incurrence of financial indebtedness outside of these facilities.
Breakdown of all loans by currency:
| Local Currency | US Dollars | |||||||||||||||||
| December 31, | March
31, 2010 |
December 31, | March
31, 2010 | |||||||||||||||
| 2008 | 2009 | 2008 | 2009 | |||||||||||||||
| (in millions) |
(unaudited) | (unaudited) | ||||||||||||||||
| US dollar ($) |
US$ | 2,071.5 | US$ | 1,844.0 | US$ | 1,692.4 | $ | 2,071.5 | $ | 1,844.0 | $ | 1,692.4 | ||||||
| British pound (GBP) |
£ | 71.3 | £ | 65.6 | £ | 65.6 | 104.6 | 106.5 | 99.5 | |||||||||
| Canadian dollar (CAD) |
C$ | 210.0 | C$ | 86.2 | C$ | 10.3 | 172.1 | 81.9 | 10.2 | |||||||||
| Total |
$ | 2,348.2 | $ | 2,032.4 | $ | 1,802.1 | ||||||||||||
F-30
Table of Contents
UNIVAR INC.
NOTES TO THE CONSOLIDATED FINANCIAL STATEMENTS—(Continued)
| 13 | Income taxes |
The expense (benefit) for income taxes is summarized as follows:
| Predecessor | Successor | |||||||||||||||
| Period from Jan. 1, 2007 through Oct. 11, 2007 |
Period
from Oct. 12, 2007 through Dec. 31, 2007 |
December 31, | ||||||||||||||
| 2008 | 2009 | |||||||||||||||
| (in US$ millions) |
||||||||||||||||
| Current: |
||||||||||||||||
| Federal |
$ | 21.5 | $ | 8.8 | $ | 17.3 | $ | 0.2 | ||||||||
| State |
5.6 | 1.7 | 6.0 | 7.6 | ||||||||||||
| Foreign |
12.8 | 19.4 | 15.9 | 11.1 | ||||||||||||
| Total current |
39.9 | 29.9 | 39.2 | 18.9 | ||||||||||||
| Deferred: |
||||||||||||||||
| Federal |
(2.1 | ) | 3.9 | (20.7 | ) | (22.7 | ) | |||||||||
| State |
(0.7 | ) | 0.6 | (1.1 | ) | (2.6 | ) | |||||||||
| Foreign |
15.9 | (27.8 | ) | 1.3 | (23.7 | ) | ||||||||||
| Total deferred |
13.1 | (23.3 | ) | (20.5 | ) | (49.0 | ) | |||||||||
| Total income tax expense (benefit) |
$ | 53.0 | $ | 6.6 | $ | 18.7 | $ | (30.1 | ) | |||||||
The Company reduced current income tax payable by $11.8 million for the period ended October 11, 2007, for tax deductions attributable to stock-based compensation. Of the $11.8 million benefit, the Company recorded $8.6 million to equity as excess stock-based compensation benefits.
For financial reporting purposes, income before income taxes includes the following components:
| Predecessor | Successor | |||||||||||||||
| Period from Jan. 1, 2007 through Oct. 11, 2007 |
Period from Oct. 12, 2007 through Dec. 31, 2007 |
December 31, | ||||||||||||||
| 2008 | 2009 | |||||||||||||||
| (in US$ millions) |
||||||||||||||||
| Income (loss) before income taxes |
||||||||||||||||
| United States |
$ | 42.7 | $ | (18.0 | ) | $ | 11.7 | $ | (20.9 | ) | ||||||
| Foreign |
71.6 | 10.0 | (1.0 | ) | (51.9 | ) | ||||||||||
| Total income(loss) before income taxes |
$ | 114.3 | $ | (8.0 | ) | $ | 10.7 | $ | (72.8 | ) | ||||||
F-31
Table of Contents
UNIVAR INC.
NOTES TO THE CONSOLIDATED FINANCIAL STATEMENTS—(Continued)
The reconciliation between the Company’s effective tax rate on income and the statutory tax rate is as follows:
| Predecessor | Successor | |||||||||||||||
| Period from Jan. 1, 2007 through Oct. 11, 2007 |
Period from Oct. 12, 2007 through Dec. 31, 2007 |
December 31, | ||||||||||||||
| 2008 | 2009 | |||||||||||||||
| (in US$ millions) |
||||||||||||||||
| Expected US federal statutory income tax expense (benefit) applied to income before income taxes |
$ | 40.0 | $ | (2.8 | ) | $ | 3.7 | $ | (25.5 | ) | ||||||
| State income taxes, net of federal benefit |
1.9 | 0.1 | 2.2 | 0.2 | ||||||||||||
| Foreign tax rate differential |
0.9 | (14.9 | ) | (6.2 | ) | (5.4 | ) | |||||||||
| Uncertain tax positions |
5.1 | 6.0 | 7.9 | 1.8 | ||||||||||||
| Impact of loss carryforward recognition |
(7.2 | ) | 1.6 | 7.5 | 9.7 | |||||||||||
| Deemed dividends from foreign subsidiaries |
— | — | — | 2.1 | ||||||||||||
| Compensation limitation |
4.2 | 1.8 | 3.0 | — | ||||||||||||
| Change in statutory tax rates |
2.8 | (0.6 | ) | — | — | |||||||||||
| Non-deductible interest |
0.3 | 10.1 | 6.8 | 3.7 | ||||||||||||
| Non-deductible expenses |
7.8 | 2.5 | 10.9 | 2.6 | ||||||||||||
| Effect of flow-through entities |
— | — | (15.5 | ) | (17.8 | ) | ||||||||||
| Adjustment to tax of previous years |
0.8 | — | (3.0 | ) | 3.7 | |||||||||||
| Non-taxable interest income |
— | — | (0.8 | ) | (4.7 | ) | ||||||||||
| Other |
(3.6 | ) | 2.8 | 2.2 | (0.5 | ) | ||||||||||
| Total income tax expense (benefit) |
$ | 53.0 | $ | 6.6 | $ | 18.7 | $ | (30.1 | ) | |||||||
F-32
Table of Contents
UNIVAR INC.
NOTES TO THE CONSOLIDATED FINANCIAL STATEMENTS—(Continued)
The consolidated deferred tax assets and liabilities are detailed as follows:
| December 31, | ||||||||
| 2008 | 2009 | |||||||
| (in US$ millions) |
||||||||
| Deferred tax assets |
||||||||
| Foreign net operating loss carryforwards |
$ | 57.8 | $ | 51.5 | ||||
| Environmental reserves |
80.0 | 76.2 | ||||||
| Interest |
27.9 | 77.9 | ||||||
| Foreign currency |
60.8 | 8.7 | ||||||
| Foreign tax credits |
25.6 | 16.7 | ||||||
| Pension |
175.7 | 130.5 | ||||||
| Depreciation |
8.5 | 15.8 | ||||||
| Flow-through entities |
2.0 | 15.2 | ||||||
| Other temporary differences |
43.9 | 18.3 | ||||||
| Gross deferred tax assets |
482.2 | 410.8 | ||||||
| Valuation allowance |
(59.7 | ) | (52.2 | ) | ||||
| Deferred tax assets, net of valuation allowance |
422.5 | 358.6 | ||||||
| Deferred tax liabilities |
||||||||
| Inventory |
(62.0 | ) | (40.9 | ) | ||||
| Depreciation |
(175.7 | ) | (187.7 | ) | ||||
| Intangible assets |
(175.1 | ) | (161.7 | ) | ||||
| Other temporary differences |
(9.9 | ) | (15.3 | ) | ||||
| Deferred tax liabilities |
(422.7 | ) | (405.6 | ) | ||||
| Net deferred tax liability |
$ | (0.2 | ) | $ | (47.0 | ) | ||
The net deferred tax liability is classified as follows:
| December 31, | ||||||||
| 2008 | 2009 | |||||||
| (in US$ millions) |
||||||||
| Current deferred tax assets |
$ | 44.3 | $ | 41.5 | ||||
| Noncurrent deferred tax assets |
378.2 | 317.1 | ||||||
| Current deferred tax liabilities |
(75.3 | ) | (61.4 | ) | ||||
| Noncurrent deferred tax liabilities |
(347.4 | ) | (344.2 | ) | ||||
| Net deferred tax liability |
$ | (0.2 | ) | $ | (47.0 | ) | ||
F-33
Table of Contents
UNIVAR INC.
NOTES TO THE CONSOLIDATED FINANCIAL STATEMENTS—(Continued)
The changes in the valuation allowance were as follows:
| December 31, | |||||||
| 2008 | 2009 | ||||||
| (in US$ millions) |
|||||||
| Beginning balance |
$ | 52.1 | $ | 59.7 | |||
| Increase related to foreign net operating loss carryforwards |
7.0 | 1.5 | |||||
| Increase (decrease) related to other items |
0.6 | (9.0 | ) | ||||
| Ending balance |
$ | 59.7 | $ | 52.2 | |||
The Company records valuation allowances to reduce deferred tax assets to the extent it believes more likely than not that a portion of such assets will not be realized. In making such determinations, the Company considers all available positive and negative evidence, including scheduled reversals of deferred tax liabilities, projected future taxable income, tax planning strategies, and the ability to carry back losses to prior years. Realization is dependent upon generating sufficient taxable income prior to expiration of tax attribute carryforwards. Although realization is not assured, management believes it is more likely than not that all of the deferred tax assets will be realized, or if not, a valuation allowance has been recorded. The amount of the deferred tax assets considered realizable, however, could be reduced in the near term if estimates of future taxable income during the carryforward periods are reduced, or current tax planning strategies are not implemented.
In 2007, Univar N.V.’s stock was substantially acquired by Ulixes B.V. and its stock was delisted. Immediately subsequent to the acquisition, a legal entity restructuring was mandated in order to meet the security requirements of the new credit facilities entered into by Ulixes and its subsidiaries, certain aspects of which may ultimately result in potential tax liabilities to the Company.
As of December 31, 2009, the total remaining tax benefit of available foreign net operating loss carryforwards recognized on the balance sheet amounted to $16.5 million (gross net tax benefit of operating losses of $51.5 million reduced by a valuation allowance of $35.0 million). Total foreign net operating losses at December 31, 2008 and 2009 amounted to $195.6 million and $180.0 million, respectively. If not utilized, $13.1 million of the available loss carryforwards will expire between 2010 and 2014; subsequent to 2014, approximately $66.0 million will expire. The remaining losses of $100.9 million have an unlimited life.
As the result of intercompany dividend payments from Canada to the United States in prior years, the Company has carryforward foreign tax credits. These foreign tax credits are subject to a ten-year carryforward life. As of December 31, 2009, the amount of unused foreign tax credits total $16.7 million, with $5.5 million subject to expiration if not used by December 31, 2010. Within the next two to five years, another $7.3 million of the unused foreign tax credits will be subject to expiration. Within the following six to ten years, the remaining $3.9 million will be subject to expiration if not used. No benefit relating to the future utilization of the foreign tax credits was recorded during the period ended December 31, 2009.
US GAAP prescribes a recognition threshold and measurement attribute for the accounting and financial statement disclosure of tax positions taken or expected to be taken in a tax return. The evaluation of a tax position is a two step process. The first step requires the Company to determine whether it is more likely than not that a tax position will be sustained upon examination based on the technical merits of the position. The second step requires the Company to recognize in the financial statement each tax position that meets the more likely than not criteria, measured at the amount of benefit that has a greater than fifty percent likelihood of being realized.
F-34
Table of Contents
UNIVAR INC.
NOTES TO THE CONSOLIDATED FINANCIAL STATEMENTS—(Continued)
The changes in the liability for unrecognized tax benefits, excluding interest and penalties, are as follows:
| December 31, | ||||||||
| 2008 | 2009 | |||||||
| (in US$ millions) |
||||||||
| Beginning balance |
$ | 38.1 | $ | 51.4 | ||||
| Additions based on tax positions related to the current year |
2.0 | (0.4 | ) | |||||
| Additions for tax positions of prior years |
12.7 | 0.4 | ||||||
| Reductions for tax positions of prior years |
(0.9 | ) | (17.2 | ) | ||||
| Reductions due to lapse in statute |
(0.6 | ) | (1.2 | ) | ||||
| Reduction due to audit settlement |
— | (19.7 | ) | |||||
| Foreign exchange |
0.1 | (0.3 | ) | |||||
| Ending balance |
$ | 51.4 | $ | 13.0 | ||||
The Company’s unrecognized tax benefits largely include foreign flow-through entity liabilities as of December 31, 2009. The Company believes it is unlikely a decrease in its unrecognized tax benefit related to foreign flow-through entity liabilities may be necessary within the coming year. In addition, the Company believes that it is reasonably possible that approximately $0.6 million of its currently other remaining unrecognized tax benefits, each of which are individually insignificant, may be recognized by the end of 2010 as a result of a lapse of the statute of limitations. As of December 31, 2008, the Company believed that it was reasonably possible that a decrease of up to $38.1 million in unrecognized tax benefits related to reductions in tax positions in prior years of $17.2 million, in statute of limitations of $1.2 million and audit settlements of $19.7 million would have occurred during the year ended December 31, 2009. During the year ended December 31, 2009, unrecognized tax benefits related to reductions in tax positions in prior years, lapse in statute of limitations and audit settlements actually decreased by $38.1 million as illustrated in the above table.
The Company classifies the liability for unrecognized tax benefits in other long term liabilities, as applicable, in the consolidated balance sheets. The Company has $51.4 million and $13.0 million of unrecognized tax benefits at December 31, 2008 and December 31, 2009, respectively. Included in the December 31, 2008 unrecognized tax benefit, the Company identified $8.3 million of uncertain tax positions recorded net of deferred tax assets. As of December 31, 2009, the total amount of unrecognized tax benefits that, if recognized, would affect the tax rate for continuing and discontinued operations was $12.0 million. The remaining unrecognized tax benefits relate to tax positions for which ultimate deductibility is highly certain, but for which there is uncertainty as to the timing of such deductibility. Recognition of these tax benefits would not have an impact on the effective tax rate.
The Company recognizes interest and penalties related to uncertain tax positions as a component of interest expense and other expense, respectively, in the statement of consolidated income. The interest and penalties totaled $4.6 million, $6.2 million and $6.0 million in 2007, 2008 and 2009, respectively. The Company recorded $1.9 million, $1.7 million and $1.4 million in interest and penalties related to unrecognized tax benefits for the years 2007, 2008 and 2009, respectively.
The Company files income tax returns in the US and various state and foreign jurisdictions. As of December 31, 2009, the Company’s tax years for 2006, 2007 and 2008 are subject to examination by the tax authorities. With few exceptions, as of December 31, 2009, the Company is no longer subject to US federal, state, local or foreign examinations by tax authorities for years before 2004.
F-35
Table of Contents
UNIVAR INC.
NOTES TO THE CONSOLIDATED FINANCIAL STATEMENTS—(Continued)
| 14 | Employee benefit plans |
Univar makes contributions to 15 company-sponsored defined benefit plans that provide pension benefits for employees upon retirement. The Company has two types of defined benefit plans, final salary plans and average salary plans, covering a significant number of its employees. For funded plans, contributions are required to be made to separately administered funds which then pay benefits to plan participants. For unfunded plans, the Company pays benefits directly to plan participants.
The main defined benefit plans are located in the United States, the United Kingdom and Canada. The United States and United Kingdom plans are closed to new entrants. During 2009, an amendment was made to the United States plans which froze the benefits accrued by participants as of December 31, 2009 in the defined benefit plan. This amendment was made in conjunction with a benefit plan review which provides for enhanced benefits under a defined contribution plan available to all employees in the U.S. A curtailment gain of $25.4 million resulted representing the effect of the reduction in future service. This gain served to partially offset the actuarial losses in accumulated other comprehensive income and will reduce the loss amortization to the consolidated income statement over future periods. The expected weighted average remaining working lives of the employees participating in all the defined benefit plans for 2008 and 2009 were 11.9 years and 10.6 years, respectively.
Post-employment benefits other than pensions relate to health care for retired employees in the United States. In 2009, the Company approved a plan to phase out the benefits provided under this plan by 2020. As a result of this change, the benefit obligation was reduced by $76.9 million. This reduction was recognized in accumulated other comprehensive income and will be amortized to the consolidated income statement over the average future service period which is expected to be approximately six years.
Actuarial valuations are performed for each defined benefit pension plan and other post-employment benefit plan to determine the net periodic benefit cost to be recognized in the Company’s consolidated income statements, amounts to be recognized in other comprehensive income and the net benefit obligation for each plan to be recognized as a liability on the Company’s consolidated balance sheets. Detail on these items is shown in the sections below.
F-36
Table of Contents
UNIVAR INC.
NOTES TO THE CONSOLIDATED FINANCIAL STATEMENTS—(Continued)
Components of net periodic benefit costs
The following tables summarize the components of net periodic benefit cost recognized in the consolidated income statement:
| Defined Benefit Pension Plans | Post-Employment Benefits Other Than Pensions | ||||||||||||||||||||||||||||||
| Predecessor | Successor | Predecessor | Successor | ||||||||||||||||||||||||||||
| Period from Jan. 1, 2007 through Oct. 11, 2007 |
Period
from Oct. 12, 2007 through Dec. 31, 2007 |
December 31, | Period
from Jan. 1, 2007 through Oct. 11, 2007 |
Period
from Oct. 12, 2007 through Dec. 31, 2007 |
December 31, | ||||||||||||||||||||||||||
| (in US$ millions) |
2008 | 2009 | 2008 | 2009 | |||||||||||||||||||||||||||
| Service cost |
$ | 20.2 | $ | 5.4 | $ | 22.8 | $ | 21.3 | $ | 2.3 | $ | 0.6 | $ | 2.7 | $ | 2.5 | |||||||||||||||
| Interest cost |
36.9 | 11.9 | 52.3 | 52.8 | 3.3 | 1.1 | 4.7 | 4.3 | |||||||||||||||||||||||
| Expected return on plan assets |
(41.3 | ) | (12.4 | ) | (54.7 | ) | (38.0 | ) | — | — | — | — | |||||||||||||||||||
| Amortization of unrecognized prior service costs |
0.2 | — | 0.1 | 0.2 | (0.6 | ) | — | (0.4 | ) | (2.3 | ) | ||||||||||||||||||||
| Amortization of net actuarial (gain) loss |
0.3 | — | — | 14.8 | — | — | — | — | |||||||||||||||||||||||
| Amortization of net transition (obligation) asset |
1.0 | — | — | — | — | — | — | — | |||||||||||||||||||||||
| Settlement (gain) loss |
(0.5 | ) | — | (0.1 | ) | — | — | — | — | — | |||||||||||||||||||||
| Curtailment (gain) loss |
— | — | (0.3 | ) | 2.3 | — | — | — | (3.7 | ) | |||||||||||||||||||||
| Special termination benefits |
— | — | 0.5 | 0.1 | — | — | 0.3 | — | |||||||||||||||||||||||
| Net periodic benefit cost |
$ | 16.8 | $ | 4.9 | $ | 20.6 | $ | 53.5 | $ | 5.0 | $ | 1.7 | $ | 7.3 | $ | 0.8 | |||||||||||||||
| Defined Benefit Pension Plans | Post-Employment Benefits Other Than Pensions | |||||||||||||||
| Three Months Ended March 31, |
Three
Months Ended March 31, |
|||||||||||||||
| (in US$ millions) |
2009 | 2010 | 2009 | 2010 | ||||||||||||
| (unaudited) | (unaudited) | |||||||||||||||
| Service cost |
$ | 5.3 | $ | 2.9 | $ | 0.6 | $ | 0.1 | ||||||||
| Interest cost |
13.2 | 13.5 | 1.1 | 0.1 | ||||||||||||
| Expected return on plan assets |
(9.5 | ) | (10.5 | ) | — | — | ||||||||||
| Amortization of unrecognized prior service costs |
0.1 | — | (0.6 | ) | (3.0 | ) | ||||||||||
| Amortization of net actuarial (gain) loss |
3.7 | 1.4 | — | — | ||||||||||||
| Curtailment (gain) loss |
0.6 | — | (0.9 | ) | — | |||||||||||
| Net periodic benefit cost |
$ | 13.4 | $ | 7.3 | $ | 0.2 | $ | (2.8 | ) | |||||||
F-37
Table of Contents
UNIVAR INC.
NOTES TO THE CONSOLIDATED FINANCIAL STATEMENTS—(Continued)
Amounts recognized in accumulated other comprehensive income
The following table shows other changes in plan assets and benefit obligations recognized in accumulated other comprehensive income:
| Defined Benefit Pension Plans | Post-Employment Benefits Other Than Pensions |
|||||||||||||||||||||||||||||||||||||
| Predecessor | Successor | Predecessor | Successor | |||||||||||||||||||||||||||||||||||
| Period from Jan. 1, 2007 through Oct. 11, 2007 |
Period from Oct. 12, 2007 through Dec. 31, 2007 |
December 31, | Period from Jan. 1, 2007 through Oct. 11, 2007 |
Period from Oct. 12, 2007 through Dec. 31, 2007 |
December 31, | |||||||||||||||||||||||||||||||||
| (in US$ millions) |
2008 | 2009 | 2008 | 2009 | ||||||||||||||||||||||||||||||||||
| New prior service cost |
$ | 1.3 | $ | 0.5 | $ | 1.2 | $ | 0.9 | $ | — | $ | (5.2 | ) | $ | — | $ | (76.8 | ) | ||||||||||||||||||||
| Net (gain) loss arising during the year |
(53.8 | ) | 17.5 | 274.0 | (69.3 | ) | (9.5 | ) | 0.1 | 3.1 | (0.7 | ) | ||||||||||||||||||||||||||
| Recognition in net periodic benefit cost of: |
||||||||||||||||||||||||||||||||||||||
| Prior service credit (cost) |
(0.2 | ) | — | 0.2 | (0.7 | ) | 0.6 | — | 0.4 | 6.0 | ||||||||||||||||||||||||||||
| Net gain (loss) |
0.2 | — | 0.1 | (14.8 | ) | — | — | — | — | |||||||||||||||||||||||||||||
| Amortization of net transition asset (obligation) |
(1.0 | ) | — | — | — | — | — | — | — | |||||||||||||||||||||||||||||
| Foreign currency exchange rate changes |
0.4 | 0.4 | (23.7 | ) | 9.9 | — | — | — | — | |||||||||||||||||||||||||||||
| Total |
$ | (53.1 | ) | $ | 18.4 | $ | 251.8 | $ | (74.0 | ) | $ | (8.9 | ) | $ | (5.1 | ) | $ | 3.5 | $ | (71.5 | ) | |||||||||||||||||
The following table shows the amounts in accumulated other comprehensive income at December 31, 2009 that are expected to be recognized as components of net periodic benefit (cost) income during the next fiscal year.
| (In US$ millions) |
Defined Benefit Pension Plans | Post-Employment Benefits Other Than Pensions |
||||||
| Prior service (cost) credit |
$ | (0.2 | ) | $ | 11.9 | |||
| Net actuarial (loss) gain |
(5.5 | ) | (0.1 | ) | ||||
| Total |
$ | (5.7 | ) | $ | 11.8 | |||
F-38
Table of Contents
UNIVAR INC.
NOTES TO THE CONSOLIDATED FINANCIAL STATEMENTS—(Continued)
Changes in the present value of the defined benefit obligations
| Defined Benefit Pension Plans |
Post-Employment Benefits Other Than Pensions |
|||||||||||||||
| (in US$ millions) |
2008 | 2009 | 2008 | 2009 | ||||||||||||
| Defined benefit obligations at January 1, |
$ | 913.3 | $ | 880.9 | $ | 74.9 | $ | 83.8 | ||||||||
| Service cost |
22.8 | 21.3 | 2.6 | 2.5 | ||||||||||||
| Interest cost |
52.3 | 52.8 | 4.7 | 4.3 | ||||||||||||
| Contributions by participants |
0.7 | 0.7 | 1.4 | 1.5 | ||||||||||||
| Benefits paid |
(34.4 | ) | (33.3 | ) | (3.1 | ) | (2.9 | ) | ||||||||
| Premiums paid |
(0.4 | ) | (0.4 | ) | — | — | ||||||||||
| Actuarial (gain) loss |
37.4 | 20.1 | 3.0 | (0.7 | ) | |||||||||||
| Plan amendments |
1.3 | 0.9 | — | (76.9 | ) | |||||||||||
| Plan settlements |
(0.2 | ) | — | — | — | |||||||||||
| Curtailments |
— | (25.4 | ) | — | — | |||||||||||
| Special termination benefits |
0.5 | 0.1 | 0.3 | — | ||||||||||||
| Foreign currency exchange rate changes |
(112.4 | ) | 44.5 | — | — | |||||||||||
| Defined benefit obligations at December 31, |
$ | 880.9 | $ | 962.2 | $ | 83.8 | $ | 11.6 | ||||||||
Changes in the fair value of plan assets
| Defined Benefit Pension Plans |
Post-Employment Benefits Other Than Pensions |
|||||||||||||||
| (in US$ millions) |
2008 | 2009 | 2008 | 2009 | ||||||||||||
| Plan assets at January 1, |
$ | 739.0 | $ | 486.3 | $ | 0.2 | $ | — | ||||||||
| Actual return (loss) on plan assets |
(181.9 | ) | 100.1 | (0.1 | ) | — | ||||||||||
| Contributions by employer |
29.6 | 29.9 | 1.6 | 1.4 | ||||||||||||
| Contributions by participants |
0.7 | 0.7 | 1.4 | 1.5 | ||||||||||||
| Benefits paid |
(34.4 | ) | (33.3 | ) | (3.1 | ) | (2.9 | ) | ||||||||
| Plan settlements |
(0.2 | ) | — | — | — | |||||||||||
| Premiums paid |
(0.4 | ) | (0.4 | ) | — | — | ||||||||||
| Foreign currency exchange rate changes |
(66.1 | ) | 26.5 | — | — | |||||||||||
| Plan assets at December 31, |
$ | 486.3 | $ | 609.8 | $ | — | $ | — | ||||||||
Reconciliation of funded status
| Defined Benefit Pension Plans |
Post-Employment Benefits Other Than Pensions |
|||||||||||||||
| (in US$ millions) |
2008 | 2009 | 2008 | 2009 | ||||||||||||
| Fair value of plan assets |
$ | 486.3 | $ | 609.8 | $ | — | $ | — | ||||||||
| Defined benefit obligation |
880.9 | 962.2 | 83.8 | 11.6 | ||||||||||||
| Funded status |
$ | (394.6 | ) | $ | (352.4 | ) | $ | (83.8 | ) | $ | (11.6 | ) | ||||
F-39
Table of Contents
UNIVAR INC.
NOTES TO THE CONSOLIDATED FINANCIAL STATEMENTS—(Continued)
Amounts recognized on the consolidated balance sheets
| Defined Benefit Pension Plans |
Post-Employment Benefits Other Than Pensions |
|||||||||||||||
| (in US$ millions) |
2008 | 2009 | 2008 | 2009 | ||||||||||||
| Plan assets in other long term assets |
$ | 4.9 | $ | 4.1 | $ | — | $ | — | ||||||||
| Current portion of net benefit obligation in other accrued expenses |
(4.3 | ) | (4.7 | ) | (2.1 | ) | (2.3 | ) | ||||||||
| Long-term portion of net benefit obligation |
(395.2 | ) | (351.8 | ) | (81.7 | ) | (9.3 | ) | ||||||||
| Net accumulated benefit obligation |
$ | (394.6 | ) | $ | (352.4 | ) | $ | (83.8 | ) | $ | (11.6 | ) | ||||
The Company has reduced its post-employment benefits other than pensions obligation by the amount of $19.5 million and $0.4 million in 2008 and 2009, respectively, representing the net present value of Medicare Part D subsidy reimbursements to be received as part of the post-employment benefit health care plan for employees in the US.
Amounts recognized in accumulated other comprehensive income (pre-tax) translated at year-end exchange rates consist of:
| Defined Benefit Pension Plans |
Post-Employment Benefits Other Than Pensions |
|||||||||||||||
| (in US$ millions) |
2008 | 2009 | 2008 | 2009 | ||||||||||||
| Net prior service (cost) credit |
$ | (1.7 | ) | $ | (2.0 | ) | $ | 4.8 | $ | 75.6 | ||||||
| Net actuarial loss |
(268.5 | ) | (194.2 | ) | (3.2 | ) | (2.5 | ) | ||||||||
| Accumulated other comprehensive income |
$ | (270.2 | ) | $ | (196.2 | ) | $ | 1.6 | $ | 73.1 | ||||||
Plan assets
Plan assets are invested in global equity and debt securities through professional investment managers with the objective to achieve targeted risk adjusted returns and to maintain liquidity sufficient to fund current benefit payments. Typically, each defined benefit plan has an investment policy that is administered by plan trustees with the objective of meeting targeted asset allocations based on the circumstances of that particular plan. Recently, the trustees have adopted investment allocations which provide greater weighting to interest bearing assets which have the benefit of better matching the expected return characteristics to the related liabilities providing a natural hedge against plan risk. The Company’s largest plan has adopted a dynamic investment strategy whereby as the plan funded status improves, the investment strategy is migrated to more liability matching assets, and return seeking assets are reduced. Other of the Company’s defined benefit plans are considering similar arrangements suitable to the individual plans’ circumstances. Plan assets are measured using quoted prices in active markets, which is a Level 1 fair value measurement. Univar does not invest plan assets in property occupied by the Company or in its own equities.
The major categories of plan assets as a percentage of the fair value of the total plan assets are as follows:
| At December 31, | |||||||||
| Target | 2008 | 2009 | |||||||
| Equities |
45-60 | % | 59 | % | 55 | % | |||
| Bonds |
40-50 | % | 38 | % | 42 | % | |||
| Other |
0-10 | % | 3 | % | 3 | % | |||
| Total |
100 | % | 100 | % | |||||
F-40
Table of Contents
UNIVAR INC.
NOTES TO THE CONSOLIDATED FINANCIAL STATEMENTS—(Continued)
Additional benefit obligation information
The information below includes all plans.
| Defined Benefit Pension Plans |
Post-Employment Benefits Other Than Pensions | |||||||||||
| (in US$ millions) |
2008 | 2009 | 2008 | 2009 | ||||||||
| Accumulated benefit obligation |
$ | 800.9 | $ | 930.1 | $ | — | $ | — | ||||
The information below relates to plans with accumulated benefit obligations in excess of plan assets
| Defined Benefit Pension Plans |
Post-Employment Benefits Other Than Pensions | |||||||||
| (in US$ millions) |
2008 | 2009 | 2008 | 2009 | ||||||
| Projected benefit obligation |
$ | 781.3 | $ | 927.7 | N/A | N/A | ||||
| Accumulated benefit obligation |
714.8 | 898.7 | N/A | N/A | ||||||
| Fair value of plan assets |
391.6 | 572.0 | N/A | N/A | ||||||
The information below relates to plans with projected benefit obligations in excess of plan assets
| Defined Benefit Pension Plans |
Post-Employment Benefits Other Than Pensions | |||||||||||
| (in US$ millions) |
2008 | 2009 | 2008 | 2009 | ||||||||
| Projected benefit obligation |
$ | 851.8 | $ | 931.6 | $ | 83.8 | $ | 11.6 | ||||
| Fair value of plan assets |
452.3 | 575.1 | — | — | ||||||||
Actuarial assumptions
The significant actuarial weighted average assumptions used in determining the benefit obligations and net periodic benefit cost for the benefit plans are as follows:
| At December 31, | |||||||||
| 2007 | 2008 | 2009 | |||||||
| Actuarial assumptions used to determine benefit obligations at end of period: |
|||||||||
| Discount rate |
6.1 | % | 6.0 | % | 5.7 | % | |||
| Expected annual rate of compensation increase |
4.1 | % | 4.3 | % | 4.1 | % | |||
| Health care cost increase rate for following period |
10.0 | % | 10.0 | % | N/A | ||||
| Ultimate health care cost increase rate |
5.0 | % | 5.0 | % | N/A | ||||
| Year health care cost increase rate reaches ultimate level |
2015 | 2016 | N/A | ||||||
| Actuarial assumptions used to determine net periodic benefit cost for the period: |
|||||||||
| Discount rate |
6.1 | % | 6.1 | % | 6.0 | % | |||
| Expected rate of return on plan assets |
7.8 | % | 7.8 | % | 7.7 | % | |||
| Expected annual rate of compensation increase |
4.1 | % | 4.1 | % | 4.4 | % | |||
| Health care cost |
|||||||||
| Health care cost increase for current period |
10.0 | % | 10.1 | % | 10.1 | % | |||
| Ultimate health care cost increase rate |
5.0 | % | 5.0 | % | 5.0 | % | |||
| Year health care cost increase rate reaches ultimate level |
2015 | 2015 | 2016 | ||||||
F-41
Table of Contents
UNIVAR INC.
NOTES TO THE CONSOLIDATED FINANCIAL STATEMENTS—(Continued)
The discount rate is determined using a yield curve approach. The expected future benefit payments which underly the plan’s obligations are matched with a yield curve derived from high quality corporate bonds available in the plan sponsor’s country and discounted to a present value at the valuation date. The discount rate is the single equivalent interest rate that produces the same present value as the yield curve calculation.
Long-term rate of return assumptions for pension accounting are reviewed at least annually to ensure the appropriateness of the discount rates employed. Target asset mix and forecast long-term rates of return by asset category are considered in determining the assumed long-term rates of return, along with historical trending data. Assumptions reflect the expected rates of return at the beginning of the year.
The following sensitivity analysis relates to the post-employment benefit medical plan in the US which, due to a plan amendment in 2009, will be phased out by 2020. As a result of this change, health care cost increases will not have a material impact on the plan’s benefit obligation or net periodic benefit cost through the phase out period. Therefore only 2007 and 2008 sensitivity information is presented.
At December 31, 2007, a one percent increase in health care costs would increase the current service and interest cost components of net periodic benefit cost by $0.4 million and the plan’s benefit obligation by $14.7 million. A one percent decrease in health care costs would reduce the current service and interest cost components of net periodic benefit cost by $0.3 million and the plan’s benefit obligation by $11.6 million. At December 31, 2008, a one percent increase in health care costs would increase the current service and interest cost components of net periodic benefit cost by $1.8 million and the plan’s benefit obligation by $16.3 million. A one percent decrease in health care costs would reduce the current service and interest cost components of benefit expense by $1.3 million and the plan’s benefit obligation by $12.9 million.
Cash flows
The Company expects to contribute $38.8 million to its defined benefit pension plans and $2.3 million to its post-employment benefits other than pension plans in 2010, which includes direct payments to plan participants in unfunded plans. In many countries, local pension protection laws have been put in place which have introduced minimum funding requirements for qualified pension plans. As a result, the Company’s required contributions to its non-US and US pension plans may vary in the future.
The following table shows benefit payments, which reflect future service expectations, that are projected to be paid in each of the next five years and in aggregate for five years thereafter.
| Post-Employment Benefits Other Than Pensions | |||||||||
| (In US$ millions) |
Defined benefit pension plans |
With Medicare Part D subsidy |
Without Medicare Part D subsidy | ||||||
| 2010 |
$ | 34.6 | $ | 2.3 | $ | 1.9 | |||
| 2011 |
36.4 | 1.3 | 1.3 | ||||||
| 2012 |
39.1 | 1.3 | 1.3 | ||||||
| 2013 |
42.0 | 1.3 | 1.3 | ||||||
| 2014 |
45.1 | 1.3 | 1.3 | ||||||
| 2015-2019 |
271.7 | 7.1 | 7.1 | ||||||
F-42
Table of Contents
UNIVAR INC.
NOTES TO THE CONSOLIDATED FINANCIAL STATEMENTS—(Continued)
Defined contribution plans
The Company sponsors qualified savings plans to assist eligible employees in providing for retirement or other future needs. Under such plans, company contributions amounted to $12.0 million in combined 2007, $13.1 million in 2008 and $12.3 million in 2009, and $3.1 million and $5.5 million during the three months ended 2009 (unaudited) and 2010 (unaudited).
Multi-employer plans
Univar Inc. has 19 union bargaining agreements in the United States that stipulate contributions to one of three pension trusts. The union pension plans are: Central States Pension, Western Conference of Teamsters Fund and New England Teamster & Trucking Industry Pension. These bargaining agreements are generally negotiated on three year cycles and cover employees in driver and material handler positions at 16 represented locations. In addition, the Company has six plans in Europe which cover approximately 420 employees. Under these plans, Company contributions amounted to $4.3 million, $6.1 million and $4.9 million during the years 2007, 2008 and 2009, respectively, and $1.3 million during each of the three months ended March 31, 2009 (unaudited) and 2010 (unaudited), respectively. In 2007, the Company requested a decertification of the Dallas facility, which resulted in a partial withdrawal of the Central States Pension Fund. The Company recorded a liability for the estimated withdrawal payment of $5.5 million. Final decertification is still pending at March 31, 2010.
| 15 | Accumulated other comprehensive income (loss) |
Accumulated other comprehensive income (loss) is comprised of the following:
| December 31, | March
31, 2010 |
|||||||||||
| (in US$ millions) |
2008 | 2009 | ||||||||||
| (unaudited) | ||||||||||||
| Changes in fair value of derivative instruments, net of tax |
$ | (41.0 | ) | $ | (12.1 | ) | $ | (10.2 | ) | |||
| Pension and post-employment benefit adjustments, net of tax |
(194.4 | ) | (93.8 | ) | (93.8 | ) | ||||||
| Foreign currency translation, net of tax |
(145.2 | ) | (19.6 | ) | (12.6 | ) | ||||||
| Total accumulated other comprehensive income (loss) |
$ | (380.6 | ) | $ | (125.5 | ) | $ | (116.6 | ) | |||
F-43
Table of Contents
UNIVAR INC.
NOTES TO THE CONSOLIDATED FINANCIAL STATEMENTS—(Continued)
Amounts recognized in other comprehensive income (loss) are as follows:
Amounts recognized in other comprehensive income (loss)
| Predecessor | Successor | |||||||||||||||||||
| Period from Jan. 1, 2007 through Oct. 11, 2007 |
Period from Oct. 12, 2007 through Dec. 31, 2007 |
December 31, | March
31, 2010 |
|||||||||||||||||
| 2008 | 2009 | |||||||||||||||||||
| (in US$ millions) |
(unaudited) | |||||||||||||||||||
| Unrealized (losses) gains on derivative instruments |
||||||||||||||||||||
| Gain (loss) arising during the period |
$ | 0.8 | $ | (30.8 | ) | $ | (66.2 | ) | $ | (14.7 | ) | $ | (7.8 | ) | ||||||
| Reclassification adjustment |
(0.8 | ) | (0.1 | ) | 22.1 | 59.8 | 10.7 | |||||||||||||
| Tax effect |
— | 11.6 | 22.4 | (16.2 | ) | (1.0 | ) | |||||||||||||
| Other comprehensive income, derivatives, qualifying as hedges, net of tax, total |
— | (19.3 | ) | (21.7 | ) | 28.9 | 1.9 | |||||||||||||
| Defined benefit and postretirement benefits |
||||||||||||||||||||
| Net gain (loss) arising during period |
62.0 | (12.9 | ) | (278.4 | ) | 146.0 | — | |||||||||||||
| Reclassification to net periodic benefit cost |
0.4 | — | (0.6 | ) | 9.4 | — | ||||||||||||||
| Tax effect |
(21.8 | ) | 4.1 | 93.4 | (54.8 | ) | — | |||||||||||||
| Other comprehensive income, defined benefit plans adjustment, net of tax, total |
40.6 | (8.8 | ) | (185.6 | ) | 100.6 | — | |||||||||||||
| Foreign currency translation gains (losses) |
43.9 | 26.2 | (171.4 | ) | 125.6 | 7.0 | ||||||||||||||
| Total other comprehensive income (loss) |
84.5 | $ | (1.9 | ) | $ | (378.7 | ) | $ | 255.1 | $ | 8.9 | |||||||||
Unrealized gains and losses on derivative instruments reflects the change in the fair value of a derivative instrument that is determined to be an effective cash flow hedge.
Foreign currency translation reflects the exchange rate differences arising from the translation of the financial statements of foreign subsidiaries.
Actuarial pension gains and losses are recognized in other comprehensive income (loss) in the year incurred.
| 16 | Segment information |
The Company’s operations are structured into four reporting segments that represent the geographic areas under which the Company manages its business:
| • | Univar USA |
| • | Univar Canada |
| • | Univar Europe, the Middle East and Africa (EMEA) |
| • | Rest of World |
Rest of World includes certain developing businesses in Latin America (including Mexico) and the Asia-Pacific region.
F-44
Table of Contents
UNIVAR INC.
NOTES TO THE CONSOLIDATED FINANCIAL STATEMENTS—(Continued)
Management monitors the operating results of its business units separately for the purpose of making decisions about resource allocation and performance assessment. Management evaluates performance on the basis of adjusted EBITDA. Management considers adjusted EBITDA, a useful financial metric to assess the ability to generate cash from operations sufficient to pay taxes, to service debt and to make investments and capital expenditures to support the Company’s businesses. Adjusted EBITDA, is calculated by adjusting net income (loss) for income tax expense (benefit), interest expense, net, unusual and nonrecurring items, depreciation expense and amortization expense.
Transfer prices between business segments are set on an arms-length basis in a similar manner to transactions with third parties. Corporate operating expenses that directly benefit segments have been allocated to the operating segments. Allocable operating expenses are identified through a review process by management. These costs are allocated to the operating segments on a basis that approximates the use of services. This is typically measured on a weighted distribution of margin, asset, headcount or time spent.
Other/Eliminations represents the elimination of intersegment transactions as well as unallocated corporate costs consisting of costs specifically related to parent company operations that do not directly benefit segments, either individually or collectively. Prior to 2009, intercompany sales were not material to segment performance.
| (in US$ millions) |
USA | Canada | EMEA | Rest of World |
Other/ Eliminations |
Consolidated | |||||||||||||
| Period from Jan. 1, 2007 through Oct. 11, 2007 |
|||||||||||||||||||
| Net sales |
$ | 3,444.1 | $ | 937.3 | $ | 1,909.7 | $ | 35.8 | $ | — | $ | 6,326.9 | |||||||
| Cost of goods sold |
2,962.8 | 808.2 | 1,639.9 | 30.6 | — | 5,441.5 | |||||||||||||
| 481.3 | 129.1 | 269.8 | 5.2 | — | 885.4 | ||||||||||||||
| Adjusted EBITDA |
158.2 | 68.1 | 51.8 | 2.6 | (28.5 | ) | 252.2 | ||||||||||||
| Depreciation expense |
26.4 | 7.8 | 13.7 | 0.1 | 0.3 | 48.3 | |||||||||||||
| Amortization expense |
4.6 | 0.1 | 0.6 | 0.2 | 0.1 | 5.6 | |||||||||||||
| Extraordinary losses and unusual or nonrecurring charges |
26.0 | ||||||||||||||||||
| Interest expense, net |
58.0 | ||||||||||||||||||
| Income tax expense |
53.0 | ||||||||||||||||||
| Net income |
$ | 61.3 | |||||||||||||||||
| Total assets |
2,517.5 | 473.4 | 1,432.4 | 32.0 | (268.3 | ) | 4,187.0 | ||||||||||||
| Capital expenditure |
$ | 36.5 | $ | 8.4 | $ | 17.5 | $ | — | $ | 0.2 | $ | 62.6 | |||||||
F-45
Table of Contents
UNIVAR INC.
NOTES TO THE CONSOLIDATED FINANCIAL STATEMENTS—(Continued)
| (in US$ millions) |
USA | Canada | EMEA | Rest of World |
Other/ Eliminations |
Consolidated | ||||||||||||||
| Period from Oct. 12, 2007 through Dec. 31, 2007 |
||||||||||||||||||||
| Net sales |
$ | 998.7 | $ | 215.5 | $ | 527.8 | $ | 48.1 | $ | — | $ | 1,790.1 | ||||||||
| Cost of goods sold |
854.7 | 172.6 | 454.6 | 40.7 | — | 1,522.6 | ||||||||||||||
| 144.0 | 42.9 | 73.2 | 7.4 | — | 267.5 | |||||||||||||||
| Adjusted EBITDA |
39.6 | 25.5 | 11.1 | 3.1 | 1.3 | 80.6 | ||||||||||||||
| Depreciation expense |
10.6 | 2.1 | 4.0 | 0.1 | — | 16.8 | ||||||||||||||
| Amortization expense |
6.7 | 3.1 | 1.1 | — | — | 10.9 | ||||||||||||||
| Extraordinary losses and unusual or nonrecurring charges |
23.2 | |||||||||||||||||||
| Extraordinary gain and unusual or nonrecurring gain |
(31.3 | ) | ||||||||||||||||||
| Interest expense, net |
69.0 | |||||||||||||||||||
| Income tax expense |
6.6 | |||||||||||||||||||
| Net loss |
$ | (14.6 | ) | |||||||||||||||||
| Total assets |
3,033.3 | 1,565.5 | 1,779.1 | 36.1 | (214.0 | ) | 6,200.0 | |||||||||||||
| Capital expenditure |
$ | 14.7 | $ | 2.4 | $ | 11.9 | $ | 0.1 | $ | — | $ | 29.1 | ||||||||
| (in US$ millions) |
USA | Canada | EMEA | Rest of World |
Other/ Eliminations |
Consolidated | ||||||||||||||
| Year ended December 31, 2008 |
||||||||||||||||||||
| Net sales |
$ | 5,459.8 | $ | 1,436.4 | $ | 2,408.2 | $ | 123.8 | $ | — | $ | 9,428.2 | ||||||||
| Cost of goods sold |
4,673.2 | 1,225.7 | 2,037.6 | 102.7 | — | 8,039.2 | ||||||||||||||
| 786.6 | 210.7 | 370.6 | 21.1 | 1,389.0 | ||||||||||||||||
| Adjusted EBITDA |
292.5 | 114.7 | 82.5 | 9.5 | (1.2 | ) | 498.0 | |||||||||||||
| Depreciation expense |
48.5 | 12.4 | 20.2 | 0.3 | 0.2 | 81.6 | ||||||||||||||
| Amortization expense |
31.5 | 14.5 | 4.7 | 0.1 | — | 50.8 | ||||||||||||||
| Extraordinary losses and unusual or nonrecurring charges |
39.3 | |||||||||||||||||||
| Interest expense, net |
315.6 | |||||||||||||||||||
| Income tax expense |
18.7 | |||||||||||||||||||
| Net loss |
$ | (8.0 | ) | |||||||||||||||||
| Total assets |
3,129.1 | 1,308.7 | 1,224.2 | 43.4 | (47.8 | ) | 5,657.6 | |||||||||||||
| Capital expenditure |
$ | 47.5 | $ | 7.5 | $ | 22.4 | $ | — | $ | 0.1 | $ | 77.5 | ||||||||
F-46
Table of Contents
UNIVAR INC.
NOTES TO THE CONSOLIDATED FINANCIAL STATEMENTS—(Continued)
| (in US$ millions) |
USA | Canada | EMEA | Rest of World |
Other/ Eliminations |
Consolidated | ||||||||||||||
| Year ended December 31, 2009 |
||||||||||||||||||||
| Net sales: |
||||||||||||||||||||
| External customers |
$ | 4,218.3 | $ | 1,142.8 | $ | 1,718.0 | $ | 115.4 | $ | — | $ | 7,194.5 | ||||||||
| Inter-segment |
10.8 | 9.2 | 0.8 | — | (20.8 | ) | — | |||||||||||||
| Total net sales |
4,229.1 | 1,152.0 | 1,718.8 | 115.4 | (20.8 | ) | 7,194.5 | |||||||||||||
| Cost of goods sold |
3,525.2 | 974.1 | 1,409.6 | 97.8 | (20.8 | ) | 5,985.9 | |||||||||||||
| 703.9 | 177.9 | 309.2 | 17.6 | — | 1,208.6 | |||||||||||||||
| Adjusted EBITDA |
270.4 | 90.1 | 51.6 | 6.2 | 9.4 | 427.7 | ||||||||||||||
| Depreciation expense |
50.6 | 9.8 | 19.1 | 0.3 | 0.3 | 80.1 | ||||||||||||||
| Amortization expense |
28.7 | 13.2 | 4.4 | — | — | 46.3 | ||||||||||||||
| Extraordinary losses and unusual or nonrecurring charges |
29.6 | |||||||||||||||||||
| Expenses incurred for acquisition, investment, recapitalization, disposition |
1.2 | |||||||||||||||||||
| Other non-cash charges reducing net income |
36.0 | |||||||||||||||||||
| Interest expense, net |
307.3 | |||||||||||||||||||
| Income tax expense (benefit) |
(30.1 | ) | ||||||||||||||||||
| Net loss |
$ | (42.7 | ) | |||||||||||||||||
| Total assets |
2,587.3 | 1,443.7 | 1,202.9 | 49.7 | (91.9 | ) | 5,191.7 | |||||||||||||
| Capital expenditure |
$ | 35.3 | $ | 7.3 | $ | 22.3 | $ | 0.2 | $ | 0.8 | $ | 65.9 | ||||||||
| (in US$ millions) |
USA | Canada | EMEA | Rest of World |
Other/ Eliminations |
Consolidated | ||||||||||||||
| Three months ended March 31, 2009 (unaudited) |
||||||||||||||||||||
| Net Sales: |
||||||||||||||||||||
| External customers |
$ | 1,086.8 | $ | 266.5 | $ | 413.0 | $ | 25.2 | $ | — | $ | 1,791.5 | ||||||||
| Inter-segment |
5.1 | — | — | — | (5.1 | ) | — | |||||||||||||
| Total net sales |
1,091.9 | 266.5 | 413.0 | 25.2 | (5.1 | ) | 1,791.5 | |||||||||||||
| Cost of goods sold |
921.2 | 224.1 | 339.2 | 20.8 | (5.1 | ) | 1,500.2 | |||||||||||||
| 170.7 | 42.4 | 73.8 | 4.4 | — | 291.3 | |||||||||||||||
| Adjusted EBITDA |
57.9 | 21.1 | 12.7 | 1.9 | (1.2 | ) | 92.4 | |||||||||||||
| Depreciation expense |
12.4 | 2.5 | 4.1 | 0.1 | — | 19.1 | ||||||||||||||
| Amortization expense |
7.9 | 3.1 | 1.0 | — | — | 12.0 | ||||||||||||||
| Extraordinary losses and unusual or nonrecurring charges |
1.1 | |||||||||||||||||||
| Interest expense, net |
76.2 | |||||||||||||||||||
| Income tax expense (benefit) |
(6.0 | ) | ||||||||||||||||||
| Net loss |
$ | (10.0 | ) | |||||||||||||||||
| Total assets |
3,028.9 | 1,290.0 | 1,152.3 | 43.4 | (95.4 | ) | 5,419.2 | |||||||||||||
| Capital expenditure |
$ | 6.2 | $ | 0.8 | $ | 2.6 | $ | — | $ | — | $ | 9.6 | ||||||||
F-47
Table of Contents
UNIVAR INC.
NOTES TO THE CONSOLIDATED FINANCIAL STATEMENTS—(Continued)
| (in US$ millions) |
USA | Canada | EMEA | Rest of World |
Other/ Eliminations |
Consolidated | |||||||||||||
| Three months ended March 31, 2010 (unaudited) |
|||||||||||||||||||
| Net sales: |
|||||||||||||||||||
| External customers |
$ | 1,062.4 | $ | 257.5 | $ | 458.5 | $ | 31.8 | $ | — | $ | 1,810.2 | |||||||
| Inter-segment |
2.8 | 0.7 | 0.3 | — | (3.8 | ) | — | ||||||||||||
| Total net sales |
1,065.2 | 258.2 | 458.8 | 31.8 | (3.8 | ) | 1,810.2 | ||||||||||||
| Cost of goods sold |
883.6 | 212.6 | 376.7 | 26.5 | (3.8 | ) | 1,495.6 | ||||||||||||
| 181.6 | 45.6 | 82.1 | 5.3 | — | 314.6 | ||||||||||||||
| Adjusted EBITDA |
78.5 | 24.2 | 17.1 | 1.3 | (3.0 | ) | 118.1 | ||||||||||||
| Depreciation expense |
13.1 | 2.1 | 4.6 | 0.1 | 0.2 | 20.1 | |||||||||||||
| Amortization expense |
6.8 | 3.3 | 1.1 | — | — | 11.2 | |||||||||||||
| Expenses incurred for acquisition, investment, recapitalization, disposition |
1.4 | ||||||||||||||||||
| Other non-cash charges reducing net income |
3.6 | ||||||||||||||||||
| Interest expense, net |
73.8 | ||||||||||||||||||
| Income tax expense |
4.4 | ||||||||||||||||||
| Net income |
$ | 3.6 | |||||||||||||||||
| Total assets |
2,642.0 | 1,556.0 | 1,202.4 | 55.4 | (98.5 | ) | 5,357.3 | ||||||||||||
| Capital expenditure |
$ | 2.8 | $ | 2.0 | $ | 3.4 | $ | 0.1 | $ | — | $ | 8.3 | |||||||
Business line information
Univar’s operating segments derive their net sales primarily from distributing industrial chemicals and providing related specialty services.
Over 98% of Univar’s net sales from external customers relate to its industrial chemical business. Other sales to external customers relate to services for collecting and arranging for the transportation of hazardous and nonhazardous waste.
No single customer accounts for more than 2% of net sales.
| 17 | Commitments and contingencies |
Operating lease commitments
The Company leases certain property and equipment under various operating lease arrangements. Most of the property leases provide that the Company pay taxes, insurance and maintenance. As leases for existing locations expire, the Company expects to renew the leases or substitute another location to lease.
The majority of the Company’s fleet and some equipment are leased through operating leases. Lease terms vary but certain leases are non-cancelable for the first 12-month term and then become month-to-month leases, cancelable at the Company’s option or by the lessor. There are no net payments reflected in the future minimum lease obligation as the leases are cancelable and there are no expected net payments due under the guarantees.
F-48
Table of Contents
UNIVAR INC.
NOTES TO THE CONSOLIDATED FINANCIAL STATEMENTS—(Continued)
Rental and lease expense for the years ended December 31, 2007, 2008 and 2009 and the three months ended March 31, 2009 and 2010 were $57.5 million, $61.2 million, $55.8 million, $13.8 million (unaudited) and $14.4 million (unaudited), respectively. Rental and lease commitments at December 31, 2008 and 2009, relating mainly to land, buildings and fleet, amounted to $195.5 million and $229.3 million, respectively.
Breakdown of annual rental and lease commitments:
| December 31, | ||||||
| (In US$ millions) |
2008 | 2009 | ||||
| Within one year |
$ | 45.2 | $ | 50.4 | ||
| After one year, but not more than five years |
96.2 | 112.3 | ||||
| More than five years |
54.1 | 66.6 | ||||
| Total |
$ | 195.5 | $ | 229.3 | ||
At March 31, 2010, the Company had no significant capital lease commitments.
Guarantees and indemnifications
The Company provides bank guarantees and standby letters of credit to various institutions to support tax, pension, insurance and environmental obligations. At December 31, 2008 and 2009, and at March 31, 2010, the total amount of these guarantees and letters of credit was $99.7 million, $107.4 million and $107.7 million, respectively. In addition, the Company provided direct guarantees and security on behalf of third parties of $0.1 million and $1.0 million at December 31, 2008 and 2009, respectively, and $1.0 million at March 31, 2010 (unaudited).
In the ordinary course of its business, the Company is subject to claims from time to time. The liabilities for injuries to persons or property are typically covered by liability insurance, subject to various deductibles and self-insured retentions. The deductible and self-insured portions of these liabilities, where applicable, have been accrued in the consolidated financial statements. The Company is not aware of any litigation or arbitration proceedings that are likely to have a material adverse effect on its financial position, nor is the Company aware of any such proceedings that are pending or threatened.
In its 1986 purchase of McKesson Chemical Company from McKesson Corporation (“McKesson”), the Company’s wholly-owned subsidiary, Univar USA Inc. entered into an indemnification agreement with McKesson (“Agreement”). In 2007 McKesson, filed an arbitration against Univar USA Inc. to resolve a dispute concerning Univar USA Inc.’s defense and indemnity obligations under the Agreement. In 2009, the parties settled the arbitration and agreed upon the scope of Univar Inc.’s defense and indemnification obligations under the Agreement and other matters. Pursuant to the settlement, commencing December 1, 2009, Univar USA Inc. has an obligation to defend and indemnify McKesson for claims alleging injury from exposure to asbestos-containing products sold by McKesson Chemical Company (“asbestos claims”). Univar USA Inc.’s obligation to indemnify McKesson for settlements and judgments arising from asbestos claims is the amount which is in excess of applicable insurance coverage, if any, which may be available under McKesson’s historical insurance coverage.
As of December 31, 2009, Univar USA Inc. accepted the tender of and is defending McKesson in 516 pending separate-plaintiff claims in multi-plaintiff lawsuits filed in the State of Mississippi. In 2008, Univar USA Inc. was defending McKesson in 1,401 such pending separate-plaintiff claims. The lawsuits have multiple plaintiffs, a large number of defendants, and provide no specific information on the plaintiffs’ injuries or
F-49
Table of Contents
UNIVAR INC.
NOTES TO THE CONSOLIDATED FINANCIAL STATEMENTS—(Continued)
connecting the plaintiffs’ injuries to any specific source of asbestos. Univar USA Inc. also believes that many of the plaintiffs are not seriously injured from exposure to asbestos. No new claims in this category were received in 2008 or 2009. At the peak there were 18,000 such claims pending against McKesson. Univar USA Inc. expects most of the Mississippi cases to be dismissed or otherwise resolved with no or minimal payments. To date, the costs for defending these cases have not been material and Univar USA Inc. believes the future defense and liability costs for the Mississippi cases will not be material.
As of December 31, 2009, Univar USA Inc. accepted the tender of, and is defending McKesson in 452 single-plaintiff asbestos claims pending in the states of Alabama, California, Delaware, Illinois, Minnesota, Mississippi, Missouri and Texas. In 2008, there were 483 of such claims pending. These cases differ from the Mississippi multi-plaintiff cases in that they are single-plaintiff cases with the plaintiff alleging substantial specific injuries from exposure to asbestos-containing products. These cases are similar to the Mississippi cases in that numerous defendants are named and that they provide little specific information connecting the plaintiffs’ injuries to any specific source of asbestos. Univar USA Inc. believes the defense costs and liability for these cases will not be material. In 2008 and 2009, 330 and 324 single-plaintiff lawsuits were filed against McKesson, and 355 cases were resolved. All of the resolved cases were dismissed without any liability payments in both 2008 and 2009. In 2008 and 2009, Univar USA Inc. paid defense costs of $0.2 million each year. During the period ended March 31, 2010, the Company paid defense costs of $0.2 million.
Environmental obligations
One hundred and eleven Company sites are currently undergoing remediation efforts or are in the process of active review of the need for potential remediation efforts. Some of these efforts are being conducted pursuant to governmental proceedings or investigations, while the Company, with appropriate state or federal agency oversight and approval, is conducting others voluntarily.
The level of annual expenditures for remedial, monitoring and investigatory activities will change in the future as major components of planned remediation activities are completed and the scope, timing and costs of existing activities are changed. Environmental remediation expense is included within warehousing, selling and administrative expenses in the consolidated statements of operations. Project lives, and therefore cash flows, range from two to 30 years, depending on the specific site and type of remediation project. The Company’s undiscounted accrual for its environmental liabilities is an estimate that is affected by matters such as information obtained from investigatory studies; changes in the scope of remediation; the interpretation, application and enforcement of laws and regulations; changes in the costs of remediation programs; the development of alternative cleanup technologies and methods; the uncertainty concerning recovery of such costs from third parties which may be jointly liable; and the relative level of the Company’s involvement at various sites at which the Company is allegedly associated. The Company periodically reviews the status of all existing or potential environmental liabilities and adjusts its accruals based on all available, relevant information. The current portion of environmental liabilities is included in other accrued expenses on the consolidated balance sheets. This amount includes both disbursements that are expected to be made within one year, and those amounts for specific projects for which the timing is uncertain. The long-term portion of environmental liabilities resides in other long-term liabilities on the consolidated balance sheets.
The Company is subject to environmental liabilities for contamination of sites never occupied by the Company (“non-owned sites”). From time to time, Univar or related entities are contacted by various governmental agencies and private parties regarding potential liability for a share of the cost of clean-up of non-owned sites. These non-owned sites are typically locations of independent waste disposal or recycling operations with alleged or confirmed contaminated soil and/or groundwater to which Univar may have shipped
F-50
Table of Contents
UNIVAR INC.
NOTES TO THE CONSOLIDATED FINANCIAL STATEMENTS—(Continued)
waste products or drums for re-conditioning. The Company believes there are approximately 24 sites for which the Company may be liable for a share of the cost of clean-up. Univar’s estimate of the probable liability for the remediation of non-owned sites is $5.4 million, and is included in the environmental accrual.
Although the Company believes adequate accruals have been provided for environmental contingencies, it is possible, due to the uncertainties noted above, that additional accruals could be required in the future that could have a material effect on the results of operations in a particular period.
Changes in total environmental liabilities were as follows:
| December 31, | March 31, | |||||||||||
| (in US$ millions) |
2008 | 2009 | 2010 | |||||||||
| Environmental liabilities at January 1 |
$ | 221.7 | $ | 209.5 | $ | 200.4 | ||||||
| Revised obligation estimates |
4.4 | 8.4 | 3.2 | |||||||||
| Disbursements |
(13.8 | ) | (18.7 | ) | (4.4 | ) | ||||||
| Exchange differences |
(2.8 | ) | 1.2 | (1.6 | ) | |||||||
| Environmental liabilities at end of period |
$ | 209.5 | $ | 200.4 | $ | 197.6 | ||||||
The Company manages estimated cash flows by project. These estimates are subject to change if there are modifications to the scope of the remediation plan or if other factors, both external and internal, change the timing of the remediation activities. Based on current estimates, the expected payments for environmental remediation for the next five years and thereafter at December 31, 2009 are as follows:
| (in US$ millions) |
|||
| 2010 |
$ | 14.0 | |
| 2011 |
13.7 | ||
| 2012 |
10.8 | ||
| 2013 |
10.7 | ||
| 2014 |
8.3 | ||
| Thereafter |
142.9 | ||
| Total |
$ | 200.4 | |
Competition law violations
In 2006 an internal investigation was conducted into possible anti-competitive practices engaged in by employees of several of the Company’s European subsidiaries and it was determined that over a number of years certain employees in two countries engaged in illegal anti-competitive practices. The practices pertained to a limited number of products and were in certain limited geographical regions within the two countries. The Company informed the authorities of the results of its investigation and is cooperating in an ongoing investigation by those authorities. The illegal conduct subjects the Company to penalties. Univar has applied for leniency and received a ruling from one authority granting a partial remission of any penalties. An estimate of the penalty which may be imposed has been reserved.
F-51
Table of Contents
UNIVAR INC.
NOTES TO THE CONSOLIDATED FINANCIAL STATEMENTS—(Continued)
| 18 | Fair value |
As required by US GAAP, Univar uses applicable guidance for defining fair value, the initial recording and periodic remeasurement of certain assets and liabilities measured at fair value and related disclosures for instruments measured at fair value. Fair value accounting guidance establishes a fair value hierarchy, which prioritizes the inputs to valuation techniques used to measure fair value into three broad levels. The fair value hierarchy gives the highest priority to quoted prices in active markets for identical assets or liabilities (Level 1) and the lowest priority to unobservable inputs (Level 3). An instrument’s categorization within the fair value hierarchy is based upon the lowest level on input that is significant to the instrument’s fair value measurement.
For assets that are measured using quoted prices in active markets (Level 1), the total fair value is the published market price per unit multiplied by the number of units held without consideration of transaction costs. Assets and liabilities that are measured using significant other observable inputs (Level 2) are primarily valued by reference to quoted prices of similar assets or liabilities in active markets, adjusted for any terms specific to that asset or liability. For all other assets and liabilities for which unobservable inputs are used (Level 3), fair value is derived through the use of fair value models, such as a discounted cash flow model or other standard pricing models that Univar deems reasonable.
The following is a comparison by category of carrying amounts and fair values of all of Univar’s financial assets and liabilities that are carried in the financial statements.
Assets and liabilities measured at fair value on a recurring basis are as follows:
| Carrying Amount | Fair Value | |||||||||||||||||||
| December 31, | March
31, 2010 |
December 31, | March
31, 2010 | |||||||||||||||||
| (in US$ millions) |
Level | 2008 | 2009 | 2008 | 2009 | |||||||||||||||
| (unaudited) | (unaudited) | |||||||||||||||||||
| Financial assets: |
||||||||||||||||||||
| Cash and cash equivalents |
1 | $ | 223.1 | $ | 140.2 | $ | 114.7 | $ | 223.1 | $ | 140.2 | $ | 114.7 | |||||||
| Accounts receivable |
1 | 1,060.0 | 870.6 | 982.4 | 1,060.0 | 870.6 | 982.4 | |||||||||||||
| Forward currency contracts |
2 | 1.0 | 0.1 | 0.8 | 1.0 | 0.1 | 0.8 | |||||||||||||
| Interest rate swap contracts |
2 | — | 8.8 | 3.2 | — | 8.8 | 3.2 | |||||||||||||
| Receivables from related parties |
2 | 84.6 | 91.4 | 87.8 | 74.7 | 82.7 | 81.4 | |||||||||||||
| Financial liabilities: |
||||||||||||||||||||
| Trade accounts payable |
1 | 721.1 | 566.4 | 924.5 | 721.1 | 566.4 | 924.5 | |||||||||||||
| Forward currency contracts |
2 | 0.1 | 0.1 | 0.1 | 0.1 | 0.1 | 0.1 | |||||||||||||
| Current portion of long-term debt |
2 | 60.3 | 125.8 | 125.0 | 35.8 | 116.8 | 121.7 | |||||||||||||
| Long-term debt |
2,3 | 2,287.9 | 1,906.6 | 1,677.1 | 1,539.7 | 1,888.8 | 1,722.9 | |||||||||||||
| Payable to shareholders |
3 | 734.5 | 848.1 | 878.2 | 728.6 | 842.9 | 874.1 | |||||||||||||
| Interest rate swap contracts |
2 | 97.0 | 6.2 | 6.5 | 97.0 | 6.2 | 6.5 | |||||||||||||
Assets and liabilities measured at fair value on a nonrecurring basis at December 31, 2009 are as follows:
| (in US$ millions) |
Fair Value Measurement Using | Total Gains (Losses) |
|||||||||||
| Description |
Level 1 | Level 2 | Level 3 | ||||||||||
| Idle properties |
$ | 35.8 | $ | (18.7 | ) | ||||||||
| Rail cars (Canada) |
$ | 4.9 | (13.4 | ) | |||||||||
| Goodwill (Canada) |
466.8 | (1.5 | ) | ||||||||||
| Intangible assets (Canada) |
172.7 | (2.4 | ) | ||||||||||
| Total |
$ | — | $ | 4.9 | $ | 675.3 | $ | (36.0 | ) | ||||
F-52
Table of Contents
UNIVAR INC.
NOTES TO THE CONSOLIDATED FINANCIAL STATEMENTS—(Continued)
Assets and liabilities measured at fair value on a nonrecurring basis at March 31, 2010 are as follows:
| (in US$ millions) |
Fair Value Measurement Using | Total Gains (Losses) |
|||||||||
| Description |
Level 1 | Level 2 | Level 3 | ||||||||
| Idle properties |
$ | 32.2 | $ | (3.6) | |||||||
Currency and interest rate swap contracts are recorded in the balance sheets at fair value and debt is recorded at amortized cost. The methods employed for calculating the fair values of these instruments is discussed in detail in the following paragraphs. All other financial instruments are recorded at the instrument’s carrying value, which approximates fair value due to the short-term nature of these instruments. A gain or loss is recognized in the statements of operations for these instruments when the instrument is collected, determined to be uncollectible, sold or otherwise disposed of.
Forward currency contracts are not designated as hedges and are recorded at fair value and reported in either other current receivables and or payables on the balance sheets which reflects their short-term nature. The fair value of a forward currency contract is based on Level 2 inputs as described in Note 1 to the consolidated financial statements and is generally provided by a financial institution. Gains or losses resulting from the change in the fair value are recognized in the statements of operations in other operating expenses. Results on forward currency contracts recognized in the statements of operations was a $1.0 million gain in 2008 and a $0.8 million loss in 2009.
The market quotes for Term Loan B debt were obtained from a third party. We believe the quotes for 2009 are reflective of rational market conditions and pricing. The 2008 quotes are representative of a time when credit markets were experiencing significant turmoil and a preoccupation with liquidity which drove exaggerated negative debt valuations. However, the 2008 Term Loan B quote was based on a willing buyer and seller and there was trading activity in this time period. Due to the market focus on liquidity and the pervasive impact on debt valuations at the end of 2008, management believes this valuation method represents the best reflection of the market at that point in time. This market quote approach has therefore been used as the basis (with adjustments as appropriate to the instrument) for valuation of the Term Loan A and B and ABL loans (Level 2 fair value measurement).
While there is no readily available market quote for the Term Loan A and ABL loans, the nature of the instruments and the related collateral are very similar to the Term Loan B. Management believes the Term Loan B market quote, modified to reflect less liquidity and lower margin but accelerated amortization, is the best representation of market valuation. The fair value of these facility loans reflects an average discounted value, as a percentage of the carrying value, of 59%, 93% and 97% at December 31, 2008 and 2009 and March 31, 2010, respectively.
The Senior Subordinated Notes are not actively traded nor is there a readily available market for comparison. Management believes the most appropriate measure of fair value is to hold LIBOR constant over the term of the debt and to measure the cash flows of both principle and interest over that term. The cash flows are discounted back to present value using the adjusted margin, which includes the “LIBOR constant rate” plus an applicable margin, based on current debt credit spreads. Management evaluated and determined its credit spread based on information obtained as part of its credit risk analysis whereby the Company researched other recent debt issuance disclosures of companies with similar capital structure and similar credit ratings to determine an appropriate credit spread which represents the spread management would receive above LIBOR at December 31, 2009 if they were to obtain financing at current market rates (Level 3 fair value measurement). The fair value of the Senior Subordinated Notes reflects a discounted value, as a percentage of the carrying value, of 91% at December 31, 2008 and a premium of 113% and 112% at December 31, 2009 and March 31, 2010, respectively.
F-53
Table of Contents
UNIVAR INC.
NOTES TO THE CONSOLIDATED FINANCIAL STATEMENTS—(Continued)
Receivables from related parties primarily represent three loans between Univar Inc. and its immediate parent company, Univar N.V., and an indirect parent company, Ulixes B.V. Approximately 40% of the receivable balance is represented by one loan from Univar Inc. to Ulixes B.V. with a fixed rate of interest of 11%, an unspecified loan term and interest expense that is capitalized into the principal. Due to these terms, the Company is unable to determine the cash flow to maturity of the instrument. Since this instrument is a special purpose obligation that is not consistent with routine marketable debt instruments, there is no readily available market value comparison of similar instruments, nor would one expect the value of this obligation to be as sensitive to market conditions as routine marketable securities. Since Ulixes B.V. has no operations or cash flow, this loan is dependent on the potential for transactions that would support the payment of dividends from Univar N.V. to Ulixes B.V. The performance of the underlying business is, therefore, the primary driver of variability of value in the instrument. While operating income was quite strong in 2008, it was clear a recession had begun during the year. Operating income lagged in 2009 due to continuation of a global economic recession. Some recovery has been noted in the first quarter of 2010, however, these circumstances support little expected change in the market value of the obligation. As a result it is determined the carrying value of this obligation reasonably represents the fair value.
Other receivables from related parties include two loans granted by Univar Inc. to provide liquidity to the recipient borrower, Univar N.V. These loans carry interest rates based on LIBOR +1.3% (stated margin). These instruments pay cash interest but do not have a stated maturity. For market valuation purposes we have assumed these loans have a maturity date of December 31, 2014. This date coincides with the likely renewal of the Company’s credit facilities, when these loans would likely become subject to payoff. Management estimates similar loans from an independent external party would carry a margin of approximately 5% based on historic corporate bond rates. Management believes the most appropriate measure of fair value is to measure the difference in net present value of the cash flows discounted at the market rate of interest (5-7 year historical fixed swap rate plus the estimated market margin of 5%.)
Payable to shareholders represent loans made to Univar Inc. and various subsidiaries of Univar Inc. by Univar N.V. Approximately 96% of this balance is represented by one loan with a fixed rate of interest of 15%, unspecified loan term, and with interest expense capitalized into the principal. Due to these terms, the Company is unable to determine the cash flow to maturity of the instrument. Since this instrument is a special purpose obligation that is not consistent with routine marketable debt instruments, there is no readily available market value comparison of similar instruments, nor would one expect the value of this obligation to be as sensitive to market conditions as routine marketable securities. The performance of the underlying business is the primary driver of variability of value in the instrument. While operating income for Univar Inc. was quite strong in 2008, it was clear a recession had begun during the year. Operating income lagged in 2009 due to continuation of a global economic recession. Some recovery has been noted in the first quarter of 2010, however, these circumstances support little expected change in the market value of the obligation. As a result it is determined the carrying value of this obligation reasonably represents the fair value.
The remaining loans included in payable to shareholders provide liquidity to multiple European subsidiaries of Univar Inc. These loans carry interest rates based on LIBOR +1.3% (stated margin). These instruments pay cash interest but do not have a stated maturity. For market valuation purposes we have assumed these loans have a maturity date of December 31, 2014. This date coincides with the likely renewal of the Company’s credit facilities, when these loans would likely become subject to payoff. Management estimates similar loans from an independent external party would carry a margin of approximately 5% based on historic corporate bond rates. Management believes the most appropriate measure of fair value is to measure the difference in net present value of the cash flows discounted at the market rate of interest (5-7 year historical fixed swap rate plus the estimated market margin of 5%.)
F-54
Table of Contents
UNIVAR INC.
NOTES TO THE CONSOLIDATED FINANCIAL STATEMENTS—(Continued)
At December 31, 2009, the Company had one interest rate swap contract in place with a notional amount of $500.0 million, whereby a fixed rate of interest (1.781%) is paid and a variable rate of interest (equal to one-month USD LIBOR) is received on the notional amount. The interest rate swap expires on December 31, 2012. The swap contract is being used to hedge interest rate risk under the Company’s credit facilities. The interest rate swap asset is recorded at fair value ($2.6 million) and reported in other non-current assets ($8.8 million) and other current liabilities ($6.2 million) based on estimated cash flows. This swap replaced a $1,200.0 million swap that would have expired at December 31, 2010. The Company made a business decision to pay off the $61.2 million balance under the $1,200.0 million swap contract on December 21, 2009. This amount, net of $22.0 million charged directly to retained earnings at the time the contract was transferred by an indirect parent company on October 11, 2007, will be amortized to interest expense over the remaining original term of the swap. Due to debt balances that dropped below swap levels, the Company recognized ineffectiveness related to this swap of $1.7 million during 2009. The British pound swap with a notional amount of GBP 55 million expired on December 29, 2009.
Changes to the fair value of the interest rate swap are based on Level 2 measurement techniques as described in Note 1 to the consolidated financial statements and is generally provided by the financial institution which is the counterparty in the transaction. A net loss was recognized in the statement of other comprehensive income of $10.4 million, net of tax, in 2008 and a net gain was recognized in the amount of $29.2 million, net of tax, in 2009, resulting from changes in fair value on these contracts during the respective years.
Hedge accounting was applied for all interest rate swaps with changes in fair value primarily being recognized in other comprehensive income. In 2009, the Company recognized ineffectiveness as discussed above. In 2008, no such interest expense was incurred.
Following is a breakdown of the swap contracts by currency:
| Notional Amount (US$ millions) |
Fair
Value (US$ millions) |
Weighted-Average Fixed Swap Interest Rates |
Weighted-Average Term in Years | ||||||||||||||||
| December 31, | December 31, | December 31, | December 31, | ||||||||||||||||
| 2008 | 2009 | 2008 | 2009 | 2008 | 2009 | 2008 | 2009 | ||||||||||||
| US dollar ($) |
1,200.0 | 500.0 | (94.3 | ) | 2.6 | 5.38 | % | 1.78 | % | 2.0 | 3.0 | ||||||||
| British pound (GBP) |
80.7 | — | (2.7 | ) | — | 5.35 | % | — | 1.0 | — | |||||||||
| Notional Amount (US$ millions) |
Fair Value (US$ millions) |
Weighted-Average Fixed Swap Interest Rates |
Weighted-Average Term in Years | |||||||
| At March 31, 2010 | ||||||||||
| (unaudited) |
500.0 | (6.5 | ) | 1.78 | % | 2.75 | ||||
| 19 | Related party transactions |
As discussed in more detail in Note 12 to the consolidated financial statements, $600.0 million of debt, plus accrued interest, is due to a related party.
In connection with the CVC acquisition in October 2007, Ulixes effected a corporate reorganization of the group of companies it acquired. Univar N.V. contributed an investment in and intercompany loans from subsidiaries of $959.0 million to Univar Inc. The assets of the consolidated Univar Inc. group were stepped up to fair value in line with purchase accounting requirements resulting in an adjustment of $1,274.2 million. Two subsequent deemed dividends were charged against additional paid in capital as retained earnings were
F-55
Table of Contents
UNIVAR INC.
NOTES TO THE CONSOLIDATED FINANCIAL STATEMENTS—(Continued)
insufficient. The first deemed dividend stems from the redistribution of debt and assets from the corporate reorganization and amounted to $1,323.0 million. The second relates to the underwater fair value ($22.0 million) of the $1.2 billion interest rate swap which was pushed down from a CVC Advisory partner at the time of acquisition. In addition, a parent company of Univar Inc. cancelled a loan receivable from one of Univar Inc.’s subsidiaries, resulting in a gain of $31.3 million. A $265.0 million dividend was declared and used to settle a loan from a Univar Inc. subsidiary to Univar N.V. in 2008 as part of the finalization of the reorganization of the group companies.
The Company has a service level agreement with its parent, Univar N.V., whereby the costs incurred by the parent which benefit the subsidiaries are allocated to the subsidiaries via a cost allocation model using key profitability, headcount and asset measures as a basis for allocation. These costs include financial, legal and managerial advice and advice with respect to other matters and transactions. These fees are included in warehousing, selling and administrative expenses in the amount of $4.5 million, $4.7 million and $1.4 million for the years ended December 31, 2007, 2008 and 2009, respectively, and $0.6 million for each of the three month periods ended March 31, 2009 (unaudited) and 2010 (unaudited).
The Company has granted seventeen loans amounting to $2.2 million and $5.2 million at December 31, 2008 and 2009 and $5.1 million at March 31, 2010 to certain employees to acquire shares of an indirect parent company as a management equity program. The loan terms call for 0% to 5.5% interest to be accrued on unpaid principal per annum, in line with local tax guidance, and for repayment of the loan plus interest on the ninth anniversary of the loan. The terms of nine loans provide that a portion of the employee’s annual profit sharing bonus be used to repay the loan. During 2009, $0.2 million was repaid under this provision. The average remaining term of the loans at December 31, 2009 was 8.0 years. The shares acquired with the loans are pledged to repay the loans and the loans are with recourse against the individuals.
The Company has also granted three loans to its immediate parent company, Univar N.V., and an indirect parent company, Ulixes B.V. amounting to $82.4 million and $86.2 million at December 31, 2008 and 2009 and $82.7 million at March 31, 2010 (unaudited). These loans bear interest at rates ranging from 4.4% to 11.0%. One loan has a fixed rate of interest at 11.0% while the other two loans are reset at least yearly based on the then current LIBOR or other appropriate rate and spread. Included in interest income is $1.6 million, $6.1 million and $5.6 million for the successor period of 2007 and for the years ended December 31, 2008 and 2009, respectively, and $1.4 million and $1.7 million for the three month periods ended March 31, 2009 (unaudited) and 2010 (unaudited), related to these loans receivable. There was no intercompany interest earned in the predecessor period of 2007. Interest receivable on loans and other inter-company transactions are reported in prepaid expenses and other current asset and amount to $8.8 million and $10.1 million at December 31, 2008 and 2009, respectively, and $6.4 million at March 31, 2010 (unaudited).
Loans to shareholders consists of a number of loans payable from Univar Inc. and its subsidiaries to Univar N.V. These loans bear interest at rates ranging from 1.5% to 15.0%. A number of the loans were granted under inter-company credit facility agreements with Univar N.V. which were in place under the predecessor structure. These loans typically pay interest quarterly when the rates are reset based on then current LIBOR or other appropriate rate and spread. The majority of the loans, however, are at a fixed interest rate of 15.0%. Included in interest expense is $39.6 million, $107.7 million and $114.8 million for the successor period of 2007 and for the years ended December 31, 2008 and 2009, respectively, and $26.8 million and $31.0 million for the three month periods ended March 31,2009 (unaudited) and 2010 (unaudited), related to these loans payable. There was no intercompany interest expense in the predecessor period of 2007. Interest payable on loans and other inter-company transactions are reported in other accrued expenses and amount to $9.4 million and $12.6 million at December 31, 2008 and 2009, respectively and $7.4 million at March 31, 2010 (unaudited).
F-56
Table of Contents
UNIVAR INC.
NOTES TO THE CONSOLIDATED FINANCIAL STATEMENTS—(Continued)
As a result of the completion of discussions with the tax authorities in the Netherlands and Italy, Univar N.V. charged an additional $4.1 million of costs in 2009 associated with the asset write-off in 2001 of the failed Vision IT ERP system implementation. These costs are deductible for tax purposes in Italy. This cost is considered an unusual nonrecurring item in the EMEA operating segment.
| 20 | Subsequent events (unaudited) |
The Company has evaluated subsequent events through June 29, 2010, the date of issuance of the Company’s financial statements.
On February 10, 2010, the Company announced its agreement to acquire the Quaron Group, a leading chemical distributor in the Netherlands, Belgium and France and headquartered in Zwijndrecht, the Netherlands. The combined organizations will offer better product selection and enhanced value-added services to customers and provide supplier partners with greater opportunities for sales growth and technical service. The acquisition has not been completed and is subject to regulatory approval by the EU Commission.
On May 1, 2010, the company acquired a 100% interest in the voting equity of SMPC Holdings, Inc, (SMPC) an Ohio based distributor of pest control products for $5.3 million. The acquisition allows Univar to expand its customer and geographic reach. The acquisition was accounted for using the purchase method of accounting. If the acquisition had taken place on January 1, 2008, Univar’s net sales would have been $9,452.5 million, $7,218.9 million and $1,814.9 million for the years ended December 31, 2008 and 2009 and the three months ended March 31, 2010, respectively. Net income for these periods would not have materially changed. The assets acquired consisted of inventory of $4.6 million, property, plant and equipment of $0.4 million and goodwill of $2.1 million.
F-57
Table of Contents
Shares
Univar Inc.
Common Stock
P R O S P E C T U S
Through and including , 2010 (the 25th day after the date of this prospectus), all dealers that effect transactions in these securities, whether or not participating in this offering, may be required to deliver a prospectus. This is in addition to a dealer’s obligation to deliver a prospectus when acting as an underwriter and with respect to an unsold allotment or subscription.
No dealer, salesperson or other person is authorized to give any information or to represent anything not contained in this prospectus. You must not rely on any unauthorized information or representations. This prospectus is an offer to sell only the shares offered hereby, but only under circumstances and in jurisdictions where it is lawful to do so. The information in this prospectus is current only as of its date.
| Goldman, Sachs & Co. | BofA Merrill Lynch |
Barclays Capital
Deutsche Bank Securities
J.P. Morgan
Morgan Stanley
, 2010
Table of Contents
PART II
INFORMATION NOT REQUIRED IN PROSPECTUS
| Item 13. | Other Expenses of Issuance and Distribution. |
The following table sets forth all costs and expenses, other than the underwriting discounts and commissions, payable by the Registrant in connection with the sale and distribution of the common stock being registered. All amounts shown are estimates except for the Securities and Exchange Commission registration fee, the FINRA filing fee and the listing fee.
| Securities and Exchange Commission registration fee |
$ | 61,497 | |
| FINRA filing fee |
75,500 | ||
| Listing fee |
* | ||
| Printing and engraving expenses |
* | ||
| Directors’ and officers’ insurance |
* | ||
| Legal fees and expenses |
* | ||
| Blue sky fees and expenses |
* | ||
| Accounting fees and expenses |
* | ||
| Transfer agent and registrar fees |
* | ||
| Miscellaneous expenses |
* | ||
| Total expenses |
$ * | ||
| * | To be completed by amendment. |
| Item 14. | Indemnification of Directors and Officers. |
Section 102(b)(7) of the Delaware General Corporation Law, or DGCL, as amended, allows a corporation to provide in its certificate of incorporation that a director of the corporation will not be personally liable to the corporation or its stockholders for monetary damages for breach of fiduciary duty as a director, except where the director breached the duty of loyalty, failed to act in good faith, engaged in intentional misconduct or knowingly violated a law, authorized the payment of a dividend or approved a stock repurchase in violation of Delaware corporate law or obtained an improper personal benefit. Our certificate of incorporation provides for this limitation of liability.
Section 145 of the DGCL provides that a corporation may indemnify directors and officers as well as other employees and individuals against expenses (including attorneys’ fees), judgments, fines and amounts paid in settlement actually and reasonably incurred by such a person in connection with any threatened, pending or completed actions, suits or proceedings in which such a person is made a party by reason of being or having been a director, officer, employee or agent of the corporation, subject to certain limitations. The statute provides that it is not exclusive of other rights to which those seeking indemnification may be entitled under any bylaw, agreement, vote of stockholders or disinterested directors or otherwise. Article Eight of our certificate of incorporation provides for indemnification by us of our directors, officers and employees to the fullest extent permitted by the DGCL.
We expect to maintain standard policies of insurance that provide coverage (1) to our directors and officers against loss rising from claims made by reason of breach of duty or other wrongful act, and (2) to us with respect to indemnification payments that we may make to such directors and officers.
The proposed form of Underwriting Agreement filed as Exhibit 1.1 to this Registration Statement provides for indemnification to our directors and officers by the underwriters against certain liabilities.
II-1
Table of Contents
| Item 15. | Recent Sales of Unregistered Securities. |
During the past three years, the Registrant has issued and sold the following unregistered securities:
In connection with the acquisition of the registrant’s predecessor in October 2007, the registrant issued a total of 196 shares of its common stock, par value $0.01 per share, as follows:
| • | 100 shares of the registrant’s common stock were initially issued to Univar N.V., for an initial capital contribution of $1.00 on October 12, 2007; |
| • | 21 shares of common stock were issued to Univar N.V. in exchange for the cancellation of a promissory note in the principal amount of $209.6 million; |
| • | 40.6 shares of common stock were issued to Univar N.V. in connection with an exchange of such shares and a promissory note in the principal amount of $415 million for certain shares of an acquired subsidiary; and |
| • | 34.4 shares of common stock were issued to Univar N.V. in consideration of the contribution to the registrant of a promissory note in the principal amount of $344.6 million. |
These issuances were exempt from registration pursuant to Section 4(2) of the Securities Act of 1933.
| Item 16. | Exhibits and Financial Statement Schedules |
| (a) | Exhibits |
| Exhibit |
Description of Document | |
| 1.1* |
Form of Underwriting Agreement | |
| 3.1* |
Amended and Restated Certificate of Incorporation of the Registrant | |
| 3.2* |
Amended and Restated Bylaws of the Registrant | |
| 4.1* |
Specimen Common Stock Certificate | |
| 5.1* |
Opinion of Sullivan & Cromwell LLP | |
| 10.1* |
ABL Credit Agreement, dated as of October 11, 2007, among Ulixes Acquisition B.V., Univar Inc., the U.S. subsidiary borrowers from time to time party thereto, Univar Canada Ltd., the several lenders from time to time parties thereto, Bank of America, N.A., Deutsche Bank AG New York Branch, General Electric Capital Corporation, Wachovia Capital Finance Corporation (Western), Wells Fargo Foothill, LLC, Banc of America Securities LLC and Deutsche Bank Securities Inc. | |
| 10.2* |
Credit Agreement, dated as of October 11, 2007, among Ulixes Acquisition B.V., Univar Inc., Univar UK Ltd., the several Lenders from time to time parties thereto, Bank of America, N.A., Deutsche Bank AG New York Branch, Banc of America Securities LLC and Deutsche Bank Securities Inc. | |
| 10.3* |
Indenture, dated as of October 11, 2007, among Ulixes Acquisition B.V., the guarantors from time to time party thereto and Wells Fargo Bank, N.A., as Trustee, relating to $600,000,000 12% Senior Subordinated Notes due 2015 of Ulixes Acquisition B.V. and 12% Senior Subordinated Notes due 2015 of Univar Inc. | |
| 10.4* |
Registration Rights Agreement, dated as of October 11, 2007, by and among Ulixes Acquisition B.V., each of the guarantors listed on the signature pages thereto and Goldman Sachs Investments Ltd. | |
| 21.1* |
List of subsidiaries of the Registrant | |
| 23.1 |
Consent of Ernst & Young LLP, independent registered public accounting firm | |
| 23.2* |
Consent of Sullivan & Cromwell LLP (included in Exhibit 5.1) | |
| 24.1 |
Power of Attorney (included on signature page) | |
| * | To be filed by amendment. |
II-2
Table of Contents
| Item 17. | Undertakings |
The undersigned Registrant hereby undertakes to provide to the underwriters at the closing specified in the underwriting agreement certificates in such denominations and registered in such names as required by the underwriters to permit prompt delivery to each purchaser.
Insofar as indemnification for liabilities arising under the Securities Act of 1933 may be permitted to directors, officers and controlling persons of the Registrant pursuant to the provisions referenced in Item 14 of this registration statement or otherwise, the Registrant has been advised that in the opinion of the Securities and Exchange Commission such indemnification is against public policy as expressed in the Act, and is, therefore, unenforceable. In the event that a claim for indemnification against such liabilities (other than the payment by the Registrant of expenses incurred or paid by a director, officer, or controlling person of the Registrant in the successful defense of any action, suit or proceeding) is asserted by such director, officer or controlling person in connection with the securities being registered hereunder, the Registrant will, unless in the opinion of its counsel the matter has been settled by controlling precedent, submit to a court of appropriate jurisdiction the question whether such indemnification by it is against public policy as expressed in the Act and will be governed by the final adjudication of such issue.
The undersigned Registrant hereby undertakes that:
| (1) | For purposes of determining any liability under the Securities Act of 1933, the information omitted from the form of prospectus filed as part of this Registration Statement in reliance upon Rule 430A and contained in the form of prospectus filed by the Registrant pursuant to Rule 424(b)(1) or (4) or 497(h) under the Securities Act shall be deemed to be part of this Registration Statement as of the time it was declared effective; and |
| (2) | For the purpose of determining any liability under the Securities Act of 1933, each post-effective amendment that contains a form of prospectus shall be deemed to be a new registration statement relating to the securities offered therein, and the offering of such securities at the time shall be deemed to be the initial bona fide offering thereof. |
II-3
Table of Contents
SIGNATURES
Pursuant to the requirements of the Securities Act of 1933, the Registrant has duly caused this Registration Statement to be signed on its behalf by the undersigned, thereunto duly authorized, in the city of Redmond, Washington, on June 29, 2010.
| UNIVAR INC. | ||
| By: |
/s/ JOHN J. ZILLMER | |
| John J. Zillmer, Chief Executive Officer | ||
POWER OF ATTORNEY
KNOW ALL PERSONS BY THESE PRESENTS, that each person whose signature appears below hereby constitutes and appoints John J. Zillmer, Steve M. Nielsen, Peter D. Heinz and Jeffrey H. Siegel, and each of them acting individually, as his true and lawful attorneys-in-fact and agents, each with full power of substitution, for the undersigned in any and all capacities, to sign any and all amendments to this Registration Statement (including post-effective amendments or any abbreviated registration statement and any amendments thereto filed pursuant to Rule 462(b) increasing the number of securities for which registration is sought), and to file the same, with all exhibits thereto and other documents in connection therewith, with the Securities and Exchange Commission, granting unto said attorneys-in-fact and agents, with full power of each to act alone, full power and authority to do and perform each and every act and thing requisite and necessary to be done in connection therewith, as fully for all intents and purposes as the undersigned might or could do in person, hereby ratifying and confirming all that said attorneys-in-fact and agents, or his or their substitute or substitutes, may lawfully do or cause to be done by virtue hereof.
Pursuant to the requirements of the Securities Act of 1933, this Registration Statement has been signed by the following persons in the capacities and on the dates indicated:
| Signature |
Title |
Date | ||
|
/S/ JOHN J. ZILLMER John J. Zillmer |
Chief Executive Officer (principal executive officer) |
June 29, 2010 | ||
|
/S/ STEVEN M. NIELSEN Steven M. Nielsen |
Senior Vice President and Chief Financial Officer (principal financial officer) | June 29, 2010 | ||
|
/S/ JEFFREY H. SIEGEL Jeffrey H. Siegel |
Vice President and Controller (principal accounting officer) | June 29, 2010 | ||
|
/S/ GARY E. PRUITT Gary E. Pruitt |
Chairman and Director | June 29, 2010 | ||
|
/S/ RICHARD P. FOX Richard P. Fox |
Director | June 29, 2010 | ||
|
/S/ ROBERT TER HAAR Robert ter Haar |
Director | June 29, 2010 | ||
|
/S/ CLAUDE S. HORNSBY Claude S. Hornsby |
Director | June 29, 2010 | ||
| /S/ RICHARD JALKUT Richard Jalkut |
Director | June 29, 2010 | ||
II-4
Table of Contents
| Signature |
Title |
Date | ||
| /S/ PAUL JULIAN Paul Julian |
Director | June 28, 2010 | ||
| /S/ ROLLY VAN RAPPARD Rolly van Rappard |
Director | June 29, 2010 | ||
|
/S/ THOMAS SCHMITT Thomas Schmitt |
Director | June 28, 2010 | ||
|
/S/ CHRIS STADLER Chris Stadler |
Director | June 29, 2010 | ||
|
/S/ GIJS VUURSTEEN Gijs Vuursteen |
Director | June 29, 2010 | ||
II-5
Table of Contents
Exhibit Index
| Exhibit |
Description of Document | |
| 1.1* | Form of Underwriting Agreement | |
| 3.1* | Amended and Restated Certificate of Incorporation of the Registrant | |
| 3.2* | Amended and Restated Bylaws of the Registrant | |
| 4.1* | Specimen Common Stock Certificate | |
| 5.1* | Opinion of Sullivan & Cromwell LLP | |
| 10.1* | ABL Credit Agreement, dated as of October 11, 2007, among Ulixes Acquisition B.V., Univar Inc., the U.S. subsidiary borrowers from time to time party thereto, Univar Canada Ltd., the several lenders from time to time parties thereto, Bank of America, N.A., Deutsche Bank AG New York Branch, General Electric Capital Corporation, Wachovia Capital Finance Corporation (Western), Wells Fargo Foothill, LLC, Banc of America Securities LLC and Deutsche Bank Securities Inc. | |
| 10.2* | Credit Agreement, dated as of October 11, 2007, among Ulixes Acquisition B.V., Univar Inc., Univar UK Ltd., the several Lenders from time to time parties thereto, Bank of America, N.A., Deutsche Bank AG New York Branch, Banc of America Securities LLC and Deutsche Bank Securities Inc. | |
| 10.3* | Indenture, dated as of October 11, 2007, among Ulixes Acquisition B.V., the guarantors from time to time party thereto and Wells Fargo Bank, N.A., as Trustee, relating to $600,000,000 12% Senior Subordinated Notes due 2015 of Ulixes Acquisition B.V. and 12% Senior Subordinated Notes due 2015 of Univar Inc. | |
| 10.4* | Registration Rights Agreement, dated as of October 11, 2007, by and among Ulixes Acquisition B.V., each of the guarantors listed on the signature pages thereto and Goldman Sachs Investments Ltd. | |
| 21.1* | List of subsidiaries of the Registrant | |
| 23.1 | Consent of Ernst & Young LLP, independent registered public accounting firm | |
| 23.2* | Consent of Sullivan & Cromwell LLP (included in Exhibit 5.1) | |
| 24.1 | Power of Attorney (included on signature page) | |
| * | To be filed by amendment. |