Attached files
| file | filename |
|---|---|
| 8-K - 8-K - VIVUS INC | a10-13137_28k.htm |
Exhibit 99.1
|
|
Kishore M. Gadde, MD Duke University Medical Center Thomas Najarian, MD Wesley W. Day, PhD VIVUS A Low-Dose, Controlled-Release Formulation of Phentermine/Topiramate Demonstrates Significant Weight Loss, Clinical Improvement in Overweight/Obese Patients With Type 2 Diabetes Mellitus or Prediabetes: the CONQUER Trial |
|
|
Author Disclosure Past 2 years Kishore M. Gadde Research support: BMS, Forest Labs, NIDDK, Pfizer, VIVUS Stock/shareholder: Orexigen Thomas Najarian Employee of Vivus, Inc. Wesley W. Day Employee of Vivus, Inc. |
|
|
Background Phentermine (PHEN) is a sympathomimetic drug approved for short-term treatment of obesity1 Topiramate (TPM), indicated for treatment of epilepsy and prevention of migraine headache, has demonstrated weight loss, cardiometabolic benefits in clinical trials2-8 A novel low-dose, controlled-release (CR) combination of these two drugs – PHEN/TPM CR – has been developed with the aim of maximizing weight loss with a potential to reduce adverse events9 1. Adipex-P [package insert]. Sellersville, PA: Teva Pharmaceuticals USA; 2005. 2. Topamax [package insert]. Titusville, NJ: Ortho-McNeil-Janssen Pharmaceuticals, Inc.; 2009. 3. Bray GA, et al. Obes Res. 2003;11:722-733. 4. Wilding J, et al. Int J Obes. 2004;28:1399-1410. 5. Tonstad S, et al. Am J Cardiol. 2005;96:243-251. 6. Stenlöf K, et al. Diabetes Obes Metab. 2007;9:360-368. 7. Toplak H, et al. Int J Obes (Lond). 2007;31:138-146. 8. Rosenstock J, et al. Diabetes Care. 2007;30:1480-1486. 9. Data on file. Vivus, Inc. |
|
|
CONQUER Trial Objectives To examine weight loss and improvement in glycemic measures in the entire sample of overweight and obese subjects with related comorbidities (type 2 diabetes mellitus [T2DM] or prediabetes [impaired fasting glucose/impaired glucose tolerance, IFG/IGT], hypertension [HTN], hypertriglyceridemia) To examine improvement in glycemic measures in the subset of overweight and obese subjects with T2DM or prediabetes |
|
|
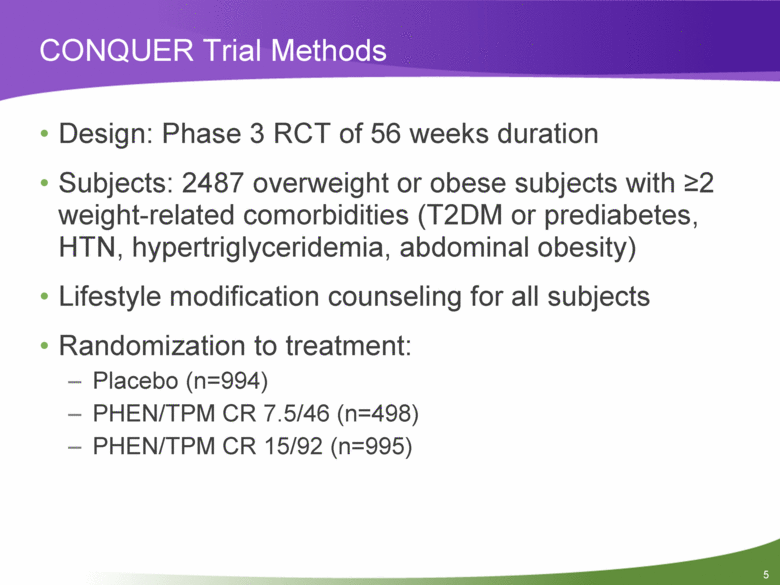
CONQUER Trial Methods Design: Phase 3 RCT of 56 weeks duration Subjects: 2487 overweight or obese subjects with >2 weight-related comorbidities (T2DM or prediabetes, HTN, hypertriglyceridemia, abdominal obesity) Lifestyle modification counseling for all subjects Randomization to treatment: Placebo (n=994) PHEN/TPM CR 7.5/46 (n=498) PHEN/TPM CR 15/92 (n=995) |
|
|
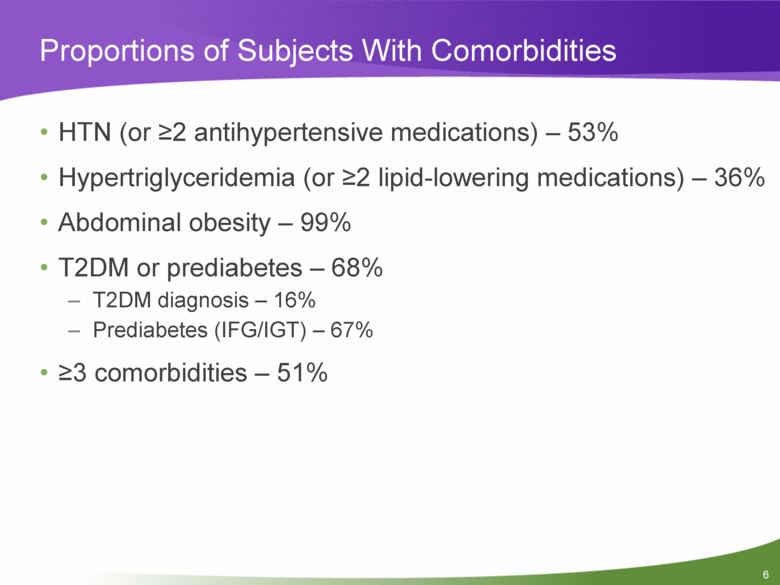
Proportions of Subjects With Comorbidities HTN (or >2 antihypertensive medications) – 53% Hypertriglyceridemia (or >2 lipid-lowering medications) – 36% Abdominal obesity – 99% T2DM or prediabetes – 68% T2DM diagnosis – 16% Prediabetes (IFG/IGT) – 67% >3 comorbidities – 51% |
|
|
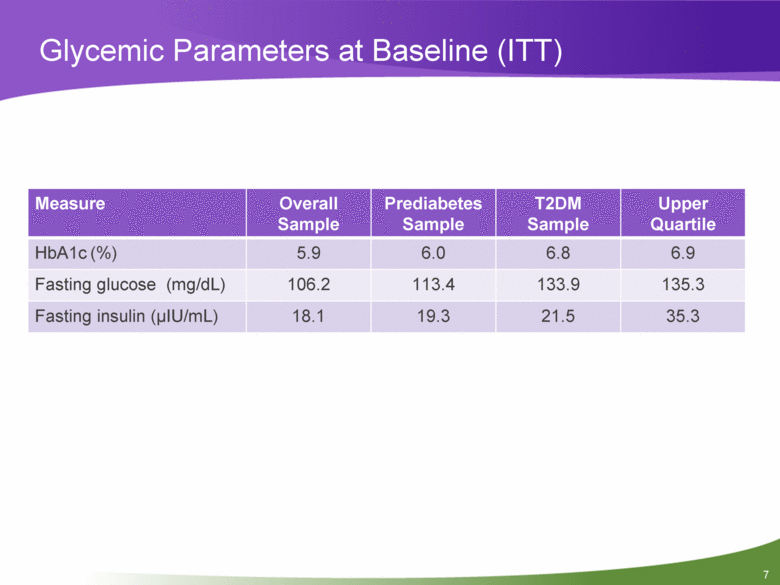
Glycemic Parameters at Baseline (ITT) Measure Overall Sample Prediabetes Sample T2DM Sample Upper Quartile HbA1c (%) 5.9 6.0 6.8 6.9 Fasting glucose (mg/dL) 106.2 113.4 133.9 135.3 Fasting insulin (µIU/mL) 18.1 19.3 21.5 35.3 |
|
|
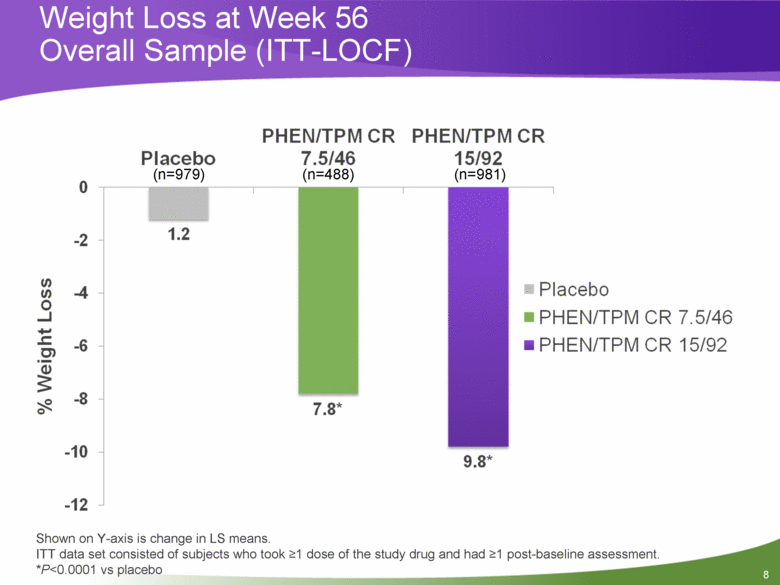
Weight Loss at Week 56 Overall Sample (ITT-LOCF) Shown on Y-axis is change in LS means. ITT data set consisted of subjects who took >1 dose of the study drug and had >1 post-baseline assessment. *P<0.0001 vs placebo (n=979) (n=488) (n=981) |
|
|
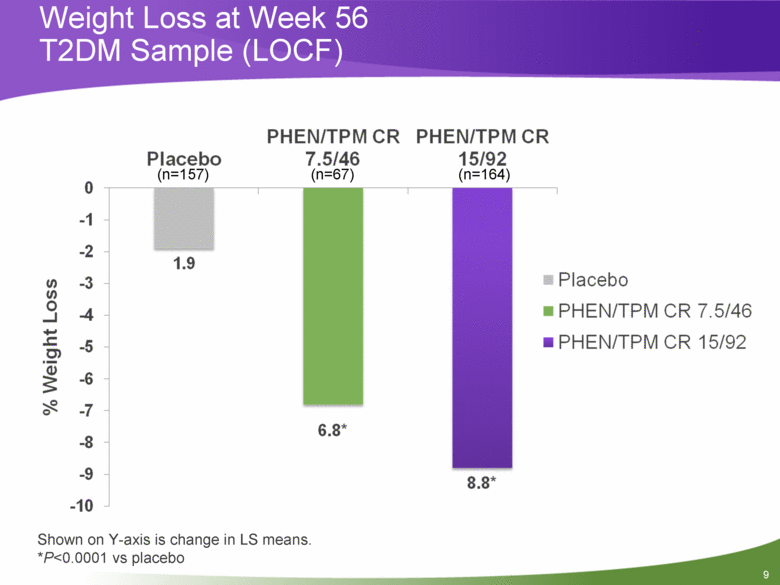
Weight Loss at Week 56 T2DM Sample (LOCF) Shown on Y-axis is change in LS means. *P<0.0001 vs placebo (n=157) (n=67) (n=164) |
|
|
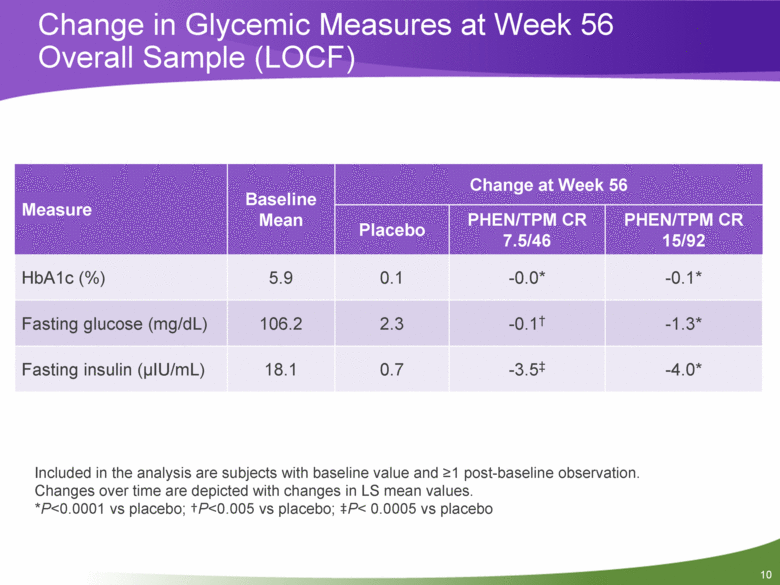
Change in Glycemic Measures at Week 56 Overall Sample (LOCF) Measure Baseline Mean Change at Week 56 Placebo PHEN/TPM CR 7.5/46 PHEN/TPM CR 15/92 HbA1c (%) 5.9 0.1 -0.0* -0.1* Fasting glucose (mg/dL) 106.2 2.3 -0.1† -1.3* Fasting insulin (µIU/mL) 18.1 0.7 -3.5‡ -4.0* Included in the analysis are subjects with baseline value and >1 post-baseline observation. Changes over time are depicted with changes in LS mean values. *P<0.0001 vs placebo; †P<0.005 vs placebo; ‡P< 0.0005 vs placebo |
|
|
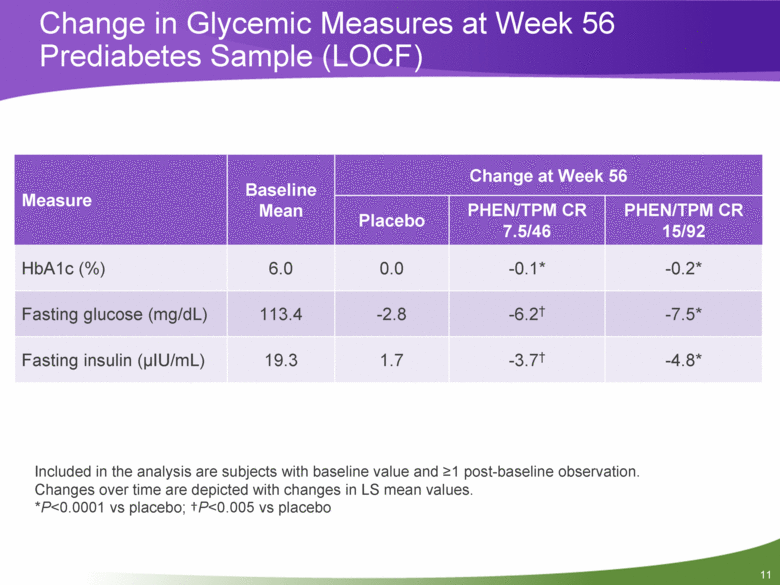
Change in Glycemic Measures at Week 56 Prediabetes Sample (LOCF) Included in the analysis are subjects with baseline value and >1 post-baseline observation. Changes over time are depicted with changes in LS mean values. *P<0.0001 vs placebo; †P<0.005 vs placebo Measure Baseline Mean Change at Week 56 Placebo PHEN/TPM CR 7.5/46 PHEN/TPM CR 15/92 HbA1c (%) 6.0 0.0 -0.1* -0.2* Fasting glucose (mg/dL) 113.4 -2.8 -6.2† -7.5* Fasting insulin (µIU/mL) 19.3 1.7 -3.7† -4.8* |
|
|
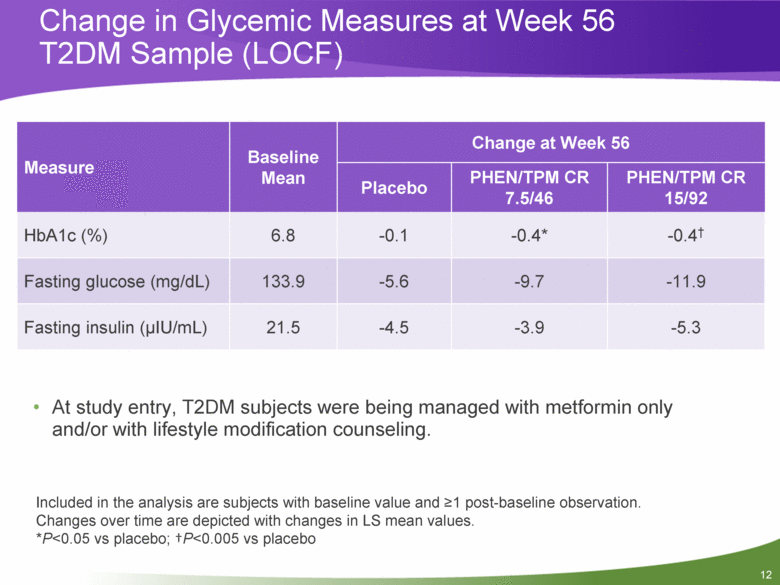
Change in Glycemic Measures at Week 56 T2DM Sample (LOCF) Included in the analysis are subjects with baseline value and >1 post-baseline observation. Changes over time are depicted with changes in LS mean values. *P<0.05 vs placebo; †P<0.005 vs placebo At study entry, T2DM subjects were being managed with metformin only and/or with lifestyle modification counseling. Measure Baseline Mean Change at Week 56 Placebo PHEN/TPM CR 7.5/46 PHEN/TPM CR 15/92 HbA1c (%) 6.8 -0.1 -0.4* -0.4† Fasting glucose (mg/dL) 133.9 -5.6 -9.7 -11.9 Fasting insulin (µIU/mL) 21.5 -4.5 -3.9 -5.3 |
|
|
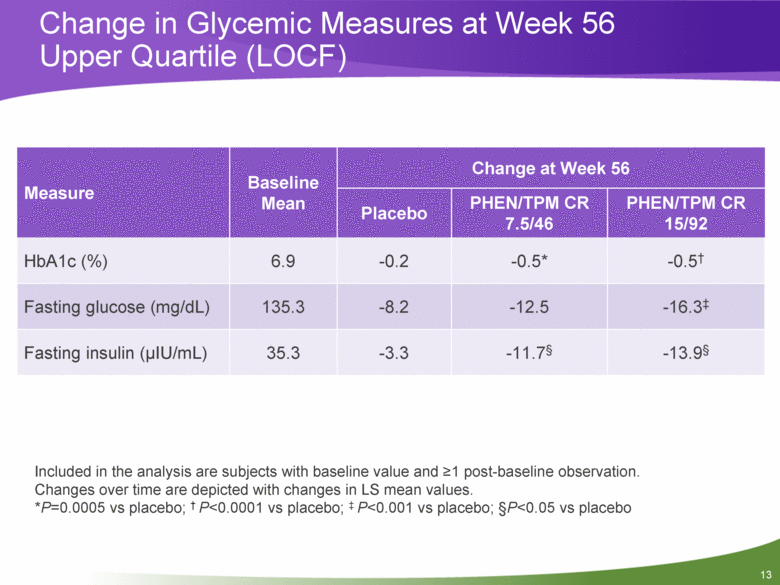
Change in Glycemic Measures at Week 56 Upper Quartile (LOCF) Included in the analysis are subjects with baseline value and >1 post-baseline observation. Changes over time are depicted with changes in LS mean values. *P=0.0005 vs placebo; † P<0.0001 vs placebo; ‡ P<0.001 vs placebo; §P<0.05 vs placebo Measure Baseline Mean Change at Week 56 Placebo PHEN/TPM CR 7.5/46 PHEN/TPM CR 15/92 HbA1c (%) 6.9 -0.2 -0.5* -0.5† Fasting glucose (mg/dL) 135.3 -8.2 -12.5 -16.3‡ Fasting insulin (µIU/mL) 35.3 -3.3 -11.7§ -13.9§ |
|
|
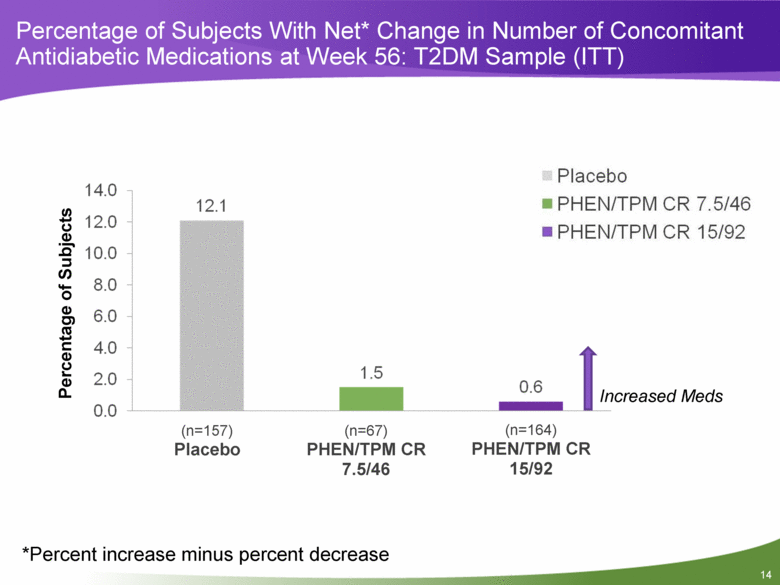
Percentage of Subjects With Net* Change in Number of Concomitant Antidiabetic Medications at Week 56: T2DM Sample (ITT) Increased Meds Percentage of Subjects (n=157) Placebo (n=67) PHEN/TPM CR 7.5/46 (n=164) PHEN/TPM CR 15/92 *Percent increase minus percent decrease |
|
|
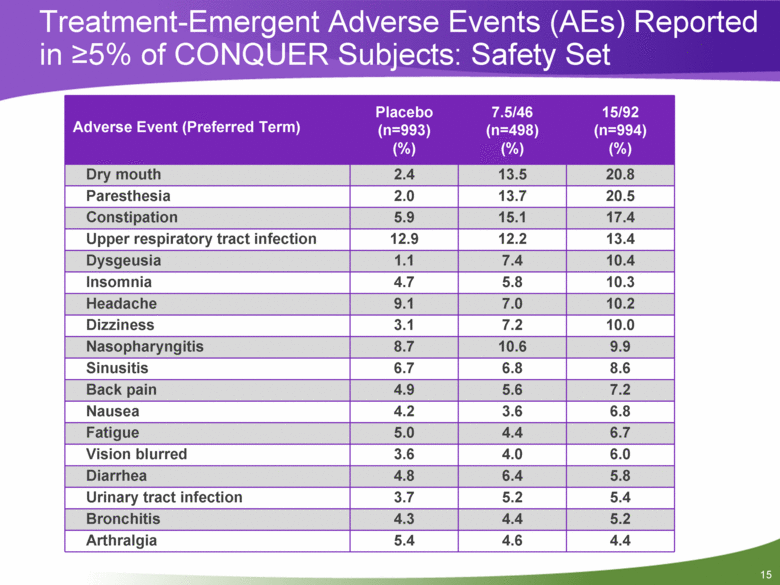
Treatment-Emergent Adverse Events (AEs) Reported in >5% of CONQUER Subjects: Safety Set Adverse Event (Preferred Term) Placebo (n=993) (%) 7.5/46 (n=498) (%) 15/92 (n=994) (%) Dry mouth 2.4 13.5 20.8 Paresthesia 2.0 13.7 20.5 Constipation 5.9 15.1 17.4 Upper respiratory tract infection 12.9 12.2 13.4 Dysgeusia 1.1 7.4 10.4 Insomnia 4.7 5.8 10.3 Headache 9.1 7.0 10.2 Dizziness 3.1 7.2 10.0 Nasopharyngitis 8.7 10.6 9.9 Sinusitis 6.7 6.8 8.6 Back pain 4.9 5.6 7.2 Nausea 4.2 3.6 6.8 Fatigue 5.0 4.4 6.7 Vision blurred 3.6 4.0 6.0 Diarrhea 4.8 6.4 5.8 Urinary tract infection 3.7 5.2 5.4 Bronchitis 4.3 4.4 5.2 Arthralgia 5.4 4.6 4.4 |
|
|
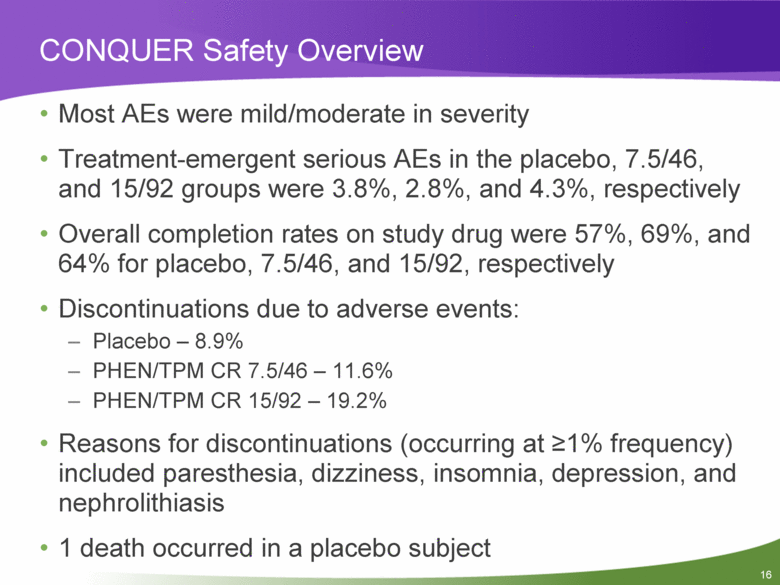
CONQUER Safety Overview Most AEs were mild/moderate in severity Treatment-emergent serious AEs in the placebo, 7.5/46, and 15/92 groups were 3.8%, 2.8%, and 4.3%, respectively Overall completion rates on study drug were 57%, 69%, and 64% for placebo, 7.5/46, and 15/92, respectively Discontinuations due to adverse events: Placebo – 8.9% PHEN/TPM CR 7.5/46 – 11.6% PHEN/TPM CR 15/92 – 19.2% Reasons for discontinuations (occurring at >1% frequency) included paresthesia, dizziness, insomnia, depression, and nephrolithiasis 1 death occurred in a placebo subject |
|
|
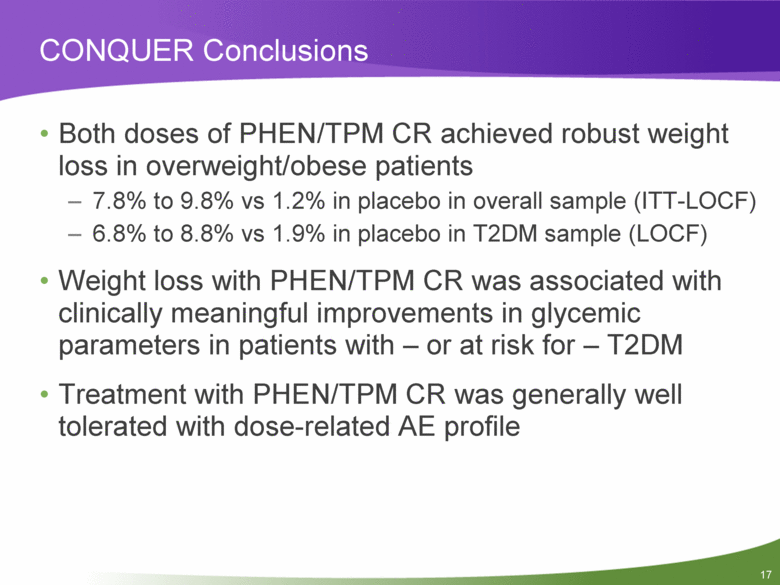
CONQUER Conclusions Both doses of PHEN/TPM CR achieved robust weight loss in overweight/obese patients 7.8% to 9.8% vs 1.2% in placebo in overall sample (ITT-LOCF) 6.8% to 8.8% vs 1.9% in placebo in T2DM sample (LOCF) Weight loss with PHEN/TPM CR was associated with clinically meaningful improvements in glycemic parameters in patients with – or at risk for – T2DM Treatment with PHEN/TPM CR was generally well tolerated with dose-related AE profile |
|
|
Questions |

