Attached files
| file | filename |
|---|---|
| EX-21 - EXHIBIT 21 - T BAY HOLDINGS INC | c02984exv21.htm |
| EX-31.2 - EXHIBIT 31.2 - T BAY HOLDINGS INC | c02984exv31w2.htm |
| EX-32.2 - EXHIBIT 32.2 - T BAY HOLDINGS INC | c02984exv32w2.htm |
| EX-31.1 - EXHIBIT 31.1 - T BAY HOLDINGS INC | c02984exv31w1.htm |
| EX-32.1 - EXHIBIT 32.1 - T BAY HOLDINGS INC | c02984exv32w1.htm |
Table of Contents
UNITED STATES
SECURITIES AND EXCHANGE COMMISSION
SECURITIES AND EXCHANGE COMMISSION
Washington, D.C. 20549
FORM 10-K
| þ | ANNUAL REPORT PURSUANT TO SECTION 13 OR 15(d) OF THE SECURITIES EXCHANGE ACT OF 1934 |
For the fiscal year ended March 31, 2010
| -OR- | ||
| o | TRANSITION REPORT PURSUANT TO SECTION 13 OR 15(d) OF THE SECURITIES AND EXCHANGE ACT OF 1934 |
For the transition period from to
Commission File Number 033-377099-S
T-BAY HOLDINGS, INC.
(Exact Name of registrant as specified in its charter)
| NEVADA (State or other jurisdiction of incorporation or organization) |
91-1465664 (I.R.S. Employer Identification No.) |
| Room 917, YongSheng Building ZhongShan Xi Road Xuhui District, Shanghai, China (Address of principal executive offices) |
(Zip code) |
Issuer’s telephone number, including area code: 86-021 51539900
(Former name, former address or former fiscal year, if changed since last report)
Indicate by check mark if the registrant is a well-known seasoned issuer, as defined in Rule 405 of
the Securities Act. Yes o No þ
Indicate by check mark if the registrant is not required to file reports pursuant to Section 13 or
Section 15(d) of the Act. Yes o No þ
Indicate by check mark whether the registrant: (1) filed all reports required to be filed by
Section 13 or 15(d) of the Securities Exchange Act of 1934 during the preceding 12 months (or for
such shorter period that the registrant was required to file such reports), and (2) has been
subject to such filing requirements for the past 90 days. Yes þ No o
Indicate by check mark whether the registrant has submitted electronically and posted on its
corporate Web site, if any, every Interactive Data File required to be submitted and posted
pursuant to Rule 405 of Regulation S-T during the preceding 12 months
(or for such shorter period that the registrant was required to submit and post such files).
Yes o No o
Indicate by check mark if disclosure of delinquent filers pursuant to Item 405 of Regulation S-K
(§229.405 of this chapter) is not contained herein, and will not be contained, to the best of
registrant’s knowledge, in definitive proxy
or information statements incorporated by reference in Part III of this Form 10-K or any amendment
to this Form 10-K. Yes o No þ
Indicate by check mark whether the registrant is a large accelerated filer, an accelerated filer,
or a non-accelerated filer or smaller reporting company. See definition of “large accelerated
filer,” “accelerated filer,” and “smaller reporting company” in Rule 12b-2 of the Exchange Act.
| Large accelerated filer o | Accelerated filer o | Non-accelerated filer o | Smaller reporting company þ |
Indicate
by check mark whether the registrant is a shell company (as defined in Rue 12b-2 of the
Exchange Act). Yes o No þ
As of March 31, 2010, the aggregate market value of the registrant’s common stock held by
non-affiliates of the registrant was US$2,185,189 based on the closing sale price as reported on the
Over-the-Counter Bulletin Board. As of June 28, 2010, there were 30,088,174 shares of common stock
outstanding.
DOCUMENTS INCORPORATED BY REFERENCE
None
T-Bay Holdings, Inc.
FORM 10-K
For the Year Ended March 31, 2010
TABLE OF CONTENTS
| 4 | ||||||||
| 8 | ||||||||
| 16 | ||||||||
| 16 | ||||||||
| 16 | ||||||||
| 16 | ||||||||
| 17 | ||||||||
| 18 | ||||||||
| 18 | ||||||||
ITEM 7A. Quantitative and Qualitative Disclosures About Market Risk |
||||||||
| 27 | ||||||||
| 28 | ||||||||
| 28 | ||||||||
| 29 | ||||||||
| 30 | ||||||||
| 31 | ||||||||
| 34 | ||||||||
| 35 | ||||||||
| 36 | ||||||||
PART IV |
||||||||
| 37 | ||||||||
| 38 | ||||||||
| Exhibit 21 | ||||||||
| Exhibit 31.1 | ||||||||
| Exhibit 31.2 | ||||||||
| Exhibit 32.1 | ||||||||
| Exhibit 32.2 | ||||||||
2
Table of Contents
INFORMATION REGARDING FORWARD-LOOKING STATEMENTS
This Annual Report on Form 10-K contains forward-looking statements. These statements relate to
future events or our future financial performance. These statements involve known and unknown
risks, uncertainties and other factors that may cause our actual results, levels of activity,
performance or achievements to be materially different from any future results, levels of activity,
performance, or achievements expressed or implied by forward-looking statements. In some cases, you
can identify forward-looking statements by terminology such as “may,” “will,” “should,” “expect,”
“plan,” “anticipate,” “believe,” “estimate,” “predict,” “potential” or “continue,” the negative of
such terms or other comparable terminology. These statements are only predictions. Actual events or
results may differ materially.
Although we believe that the expectations reflected in the forward-looking statements are
reasonable, we cannot guarantee future results, levels of activity, performance or achievements.
Moreover, neither we nor any other person assumes responsibility for the accuracy and completeness
of the forward-looking statements. We undertake no duty to update any of the forward-looking
statements after the date of this report to conform such statements to actual results or to changes
in our expectations.
Readers are also urged to carefully review and consider the various disclosures made by us which
attempt to advise interested parties of the factors which affect our business, including without
limitation the disclosures made in PART I. ITEM 1A: Risk Factors and PART II. ITEM 7 “Management’s
Discussion and Analysis or Plan of Operation” included herein.
3
Table of Contents
PART I.
| Item 1. | Business. |
Overview
The Company was incorporated under the laws of the State of Utah on August 8, 1984 with the name of
“Sharus Corporation” with authorized common stock of 50,000,000 shares with par value of US$0.001 per
share. On June 13, 1989 the domicile of the Company was changed to the state of Nevada in
connection with a name change to “Golden Quest, Inc.” On January 7, 2002, the name was changed to
“T-Bay Holdings, Inc.” as part of a reverse stock split of 400 shares of outstanding stock for one
share. On January 17, 2005 the Company carried out a reverse stock split of 20 shares of
outstanding stock for one share. After the reverse split, the Company has authorized common stock
of 100,000,000 shares common stock and 10,000,000 shares of preferred stock both with par value of
US$0.001.
On August 1, 2005, the Company entered into an Agreement and Plan of Reorganization (the
“Agreement”) between Wise Target International Limited, (“Wise Target”), Amber Link International
Limited (“Amber Link”), Ms. Meilian Li and Mr. Xiaofeng Li. Pursuant to the terms of the
Agreement, following due diligence, the Company acquired all of the outstanding stock of Wise
Target and Amber Link, making them wholly owned subsidiaries of the Company. Wise Target and Amber
Link together own and control 95% of Shanghai Sunplus Communication Technology Co., Ltd.,
(“Sunplus”), a Sino-foreign joint venture. The Agreement required the Company to issue 18,550,000
shares of restricted common stock in exchange for all of the issued and outstanding shares of Wise
Target and Amber Link. This transaction was subsequently completed on August 16, 2005.
We conduct our business mainly through our 100% owned subsidiary Amber Link, which sells mobile
phone components to mobile phone handset producers in China. We also conduct our business through
our 95% owned subsidiary, Shanghai Sunplus Communication Technology Co., Ltd., a Sino-foreign joint
venture established in China in 2002, which provides a wide span of mobile handset design and other
services to leading mobile handset brand owners in China.
We focus on the wireless telecommunication market in China. By working closely with top technology
partners, we provide tailored mobile handset design solution services according to our customers’
specifications. We believe we have strong capabilities to design mobile handsets to support a broad
range of wireless communications standards, baseband platforms and components. In addition, our
special project teams work closely with our customers to monitor and coordinate the progress of
each new design project. We believe the design solutions and services provided by us can help our
customers in enhancing competitive strength and gaining market share.
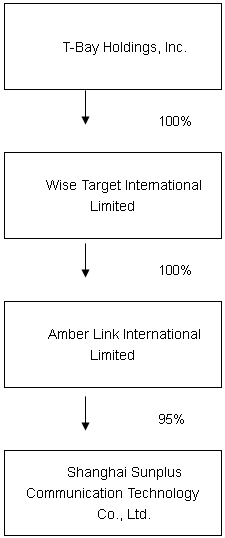
Corporate Structure
On August 16, 2005, T-Bay Holdings completed a reverse merger with Wise Target and Amber Link which
made them wholly owned subsidiaries of the Company. Wise Target owned a 75% interest and Amber
Link owned a 20% interest in Sunplus. The remaining 5% interest of Sunplus is owned by Shanghai
Fanna Industrial Product Design Co., Ltd. (“Shanghai Fanna”). Wise Target and Amber Link are
investment holding companies incorporated in the British Virgin Islands whereas Shanghai Fanna is a
privately-owned company established in China in 2001. In March 2009, Wise Target transferred all
its holdings (75%) in Sunplus to Amber Link for US$2,885,000 (HK$22,500,000). As a result of this
transaction, Amber Link directly owned 95% of Sunplus and this transaction had no impact on the
Company’s effective holdings of Sunplus. Shanghai Fanna Industrial Design Co., Ltd. continued to
own the remaining 5% interest in Sunplus. On November 25, 2009, the Company transferred all its
holdings (100%) in Amber Link to Wise Target for US$2,600. As a result of this transaction, the
Company indirectly holds Amber Link and this transaction had no impact on the Company’s effective
holdings of Amber Link and Sunplus.
In January 2007, Sunplus established Zhangzhou JiaXun Communication Facility Co.,Ltd. (“JiaXun”), a
100% owned subsidiary in Zhangzhou in Fujian province. In March 2007, JiaXun and Sunplus,
respectively acquired 20% and 80% interest in Fujian QiaoXing Industry Co.,Ltd.(“Fujian QiaoXing”)
for the construction of a technology park for long term development in the mobile telecommunication
industry. Fujian QiaoXing was established on February 13, 2004, with a registered capital of
RMB20,000,000 (US$2,590,000).
4
Table of Contents
In December, 2008, Sunplus, our 95%-owned Chinese subsidiary entered an agreement with
Huizhou Liyin Electronics Co., Ltd. (“Huizhou Liyin”) to sell 100% of Sunplus’ interest in its
wholly-owned subsidiary JiaXun for RMB5,000,000 and Eighty Percent (80%) of Sunplus’ interest in
its subsidiary Fujian QiaoXing Industry for RMB84,000,000.
In March 2009, Sunplus terminated the agreement with Huizhou Liyin relating to sale of its interest
in JiaXun and Fujian Qiao Xing and entered into another agreement to sell to
Qiaoxing Telecommunication Industry Company Limited (“QiaoXing Telecom”) 100% of Sunplus’ interest in its
wholly-owned subsidiary JiaXun for RMB5,000,000 and Eighty Percent (80%) of Sunplus’ interest in
its subsidiary Fujian QiaoXing for RMB84,000,000. The transfers of Jia Xun and Fujian QiaoXing were
completed on April 9 and March 20, 2009, respectively.
The current corporate structure of T-Bay Holdings is as follows:
Services and Products
We are a provider of high quality mobile handset design services. We tailor-make our services and
products based on the requirements of our customers. Our services mainly include:
Design Service
Mobile handset design: We have special project teams to work closely with our customers to monitor
and coordinate the progress of each new design project.
Industrial and mechanical design: We design the exterior outlook and mechanical structure of a
mobile handset. We adopt the user-orientation design concept and focus our product design on the
personality of target end-users.
5
Table of Contents
Hardware design: We design the core printed circuit board layout. We also have special
engineering teams on the design of baseband and radio frequency parts of mobile handsets based on
chip platforms.
Software design: We design the software system for the mobile handset and its functional modules.
We are capable of developing our own software in man-machine-interface and the driver software for
LCD display, camera, harmonic ring tones and MP3 functions.
Other Design Services: We can also design other electronic devices based on wireless technology.
Production Services
Based on the request of our customers, we also manufacture handset components. These mainly include
printed circuit boards (PCB) and printed circuit board assembly (PCBA). They are the backbones of
mobile handsets. We subcontract the production work to third party manufacturers. We have a
quality assurance team to monitor the production process to ensure the products can meet our
quality requirements.
Business Model
As a wireless telecommunication design house in China, we generate our revenue mainly by selling
mobile phone components and by charging design services fees.
Revenue from Sales of Handsets and Components
We provide production support to facilitate our customers’ manufacture of mobile handset
components. By closely working with our OEMs, we manufacture and sell PCBs and PCBAs to our
customers. We make to order. No inventory is held and purchases of goods are made only for firm
orders received from customers. We are fully responsible for cost control and quality control.
Revenue from Design Services
We charge design fees directly or indirectly for design solutions or services provided by us. The
design fee consists of NRE (non-recurring engineering) fees and royalty fees.
NRE fees are one-off fees for a certain design project. Typically, payment of the NRE fee is
required before we formally launch the project. We will start the development of a certain solution
only if we have received the pre-paid NRE fee. To minimize the operation risk, the NRE fee should
be no less than the projected R&D fee for a certain design solution.
We also charge royalty fees based upon the product sales volume of our customers. When the whole
handset is sold in the market, we charge royalty fees monthly on every handset manufactured by our
customers using our designs. We usually ask for a minimum volume term in our contracts to encourage
a larger volume order in a certain period of time.
Competitive Strengths
Strategic Relationships with Business Partners
We work closely with the world’s leading technology and platform providers in the mobile handset
industry which is characterized by rapid technological changes to keep abreast of and have access
to the latest technologies.
We have also established good relationships with subcontractors which provide production services
for mobile phone components.
6
Table of Contents
Quick Market Response
We pursue a market-oriented product development strategy, grasping end-users’ preferences and
tastes. Our experience and expertise enables us to complete a design solution in only two to three
months, which helps to reduce the time for the mobile handsets designed by us to reach the market.
Strong R&D capability
We have a professional and competent team to handle the wide spectrum of mobile phone design jobs,
including industrial design, structural design, electronics design, software design and machine-man
interface design. Some of our engineers were formerly employed by mobile communication leaders such
as Motorola, Siemens or BenQ.
We are able to develop new mobile phones based on chip-level modules, which can enhance the
flexibility of the product design in terms of handset size and functionalities.
Customized Products and Market Knowledge
We design many of our products based on our customers’ specifications. We work closely with mobile
device manufacturers and brand name owners to understand their needs and product roadmaps. We also
interface with our customers regularly to understand the mobile handset market, consumer
preferences and trends in the industry. This allows us to predict future trends and to assist our
customers in the development of new products and functions and the setting of a price range.
Current Business Development
During the year ended March 31, 2010, we kept working closely with strategic partners and have
developed Wideband Code Division Multiple Access (“W-CDMA”) and, Time Division Synchronous Code
Division Multiple Access (“TD-SCDMA”) solutions specially for the China market. As the
telecommunication industry in China was affected by the global financial crisis, with its
consequence in various manifestations, we postponed long-term projects.
Products Geographic Coverage
In terms of revenue, over 90% of our mobile handsets designed by us were within the China and Hong
Kong markets. The Company did not sell products to consumers directly, but instead through the
sales networks of our customers. According to sales information provided by our customers, products
designed or manufactured by us were sold in major cities, secondary cities and small towns
throughout China, covering all provinces of China.
Quality Assurance
We believe that a high standard quality management system is crucial for maintaining our
reputation. Our quality assurance team monitors hardware, software and mechanical design teams’
performance to ensure strict adherence to the quality standards required by our customers. The team
conducts product reliability tests, including accelerated life tests, climatic stress tests and
mechanical endurance tests. The team is also responsible for components qualification, prototype
quality assurance, and submission of prototypes for FTA (Full Type Approval) and CTA (China Testing
Alliance) certifications. In addition, the team collects and organizes all relevant written
documents produced and used throughout the design process.
FTA certifies that a mobile handset submitted for testing has passed tests for its reliability and
conformance with global standards.
CTA certifies that the use of telecommunication terminal equipment in the national
telecommunications network has been approved and complies with the requirements for network access
and the national standards established by the Ministry of Information Industry.
Through our quality assurance team, we adopt stringent quality procedures at the design stage,
incoming quality assurance of components and parts, assembly testing and final quality testing. Our
selection criteria for suppliers emphasize reputation, time to supply, availability of components
and parts, among other factors.
7
Table of Contents
Sales and marketing
Our sales force consists of approximately 13 salespeople and support personnel. Most of them have
many years of experience in the telecommunication industry. They are responsible for establishing
and maintaining client relationships, trying to fulfill customers’ special needs, and introducing
new technologies and applications in the telecommunications field.
Intellectual Property
We believe protection of our intellectual property rights is extremely important for our business.
As of March 31, 2010, we have registered 17 patents in China, of which 15 have been approved.
All of them are patents for product appearance. We have also registered six copyrights for
software. All of them are games and applications for mobile phone.
Our Competitors
There are more than a hundred mobile phone design houses in China, including market leaders such as
China TechFaith Wireless Communication Technology Limited, Shanghai Longcheer Telecommunication
Co.,Ltd and SIMCom Information Technology Ltd. Other major design houses include Shanghai WenTai
Communication Technology Co., Ltd., Shanghai Huaqi Telecom Technology Co., Ltd., Shenzhen Jinwave
Technology Co., Ltd. and Shenzhen Yulong Communication Technology Co., Ltd. We believe Shanghai
Longcheer and Shanghai Simcom are our most direct competitors.
Certain of our competitors are substantially larger and have significantly greater financial,
marketing, research and development, technological and operating resources and broader product
lines than we do.
We think that competition in our markets is based primarily on technology innovation, product
performance, reputation, delivery times, customer support and price. We believe we are among the
few design houses which are capable of software design and hardware design as well as performing
the whole spectrum of design activities and developing functions or applications at chipset-level
modules.
Employees
As of March 31, 2010, we had approximately 80 full-time employees employed in China. From time to
time we employ independent contractors to support our production, engineering, marketing, and sales
departments.
Web Site Access to Our Periodic SEC Reports
You may read and copy any public reports we file with the SEC at the SEC’s Public Reference Room at
100 F Street, N.E., Room 1580, Washington, D.C. 20549. You may obtain information on the operation
of the Public Reference Room by calling the SEC at 1-800-SEC-0330. The SEC also maintains an
Internet site http://www.sec.gov that contains reports and information statements, and
other information that we filed electronically.
| Item 1A. | Risk Factors. |
Set forth below is a description of factors that may affect our business, results of operations and
share price from time to time.
Aggregate demand for the types of mobile phone handsets to which our design services were suited
have been on a downward trend. We are looking at ways to deal with this adverse change in the
market. If we do not solve this problem within a reasonable period of time, our long-term financial
performance and condition would be adversely affected.
As a result of the global financial crisis and its consequence in its various manifestations, and
also the change in consumer preference, aggregate demand for the types of mobile phone handsets to
which our design services were suited, in the Mainland China market as well as the overseas market,
have been on a downward trend. We are looking at ways to deal with this adverse change in the
market. We may diversify into new businesses. However, it may take time to find new businesses to
which we are suited and which offer a reasonable prospect of success. In the meantime, we plan to
be prudent in the management of the Company, with a view to conserve cash. If this adverse
situation continued for a long time, our long-term financial performance and condition would be
adversely affected.
8
Table of Contents
Our sales and profitability depend on the continued growth of the mobile communications industry as
well as the growth of the new market segments within that industry in which we have recently
invested. If the mobile communications industry does not grow as we expect, or if the new market
segments on which we have chosen to focus and in which we have recently invested grow less than
expected, or if new faster-growing market segments emerge in which we have not invested, our sales
and profitability may be adversely affected.
Our business depends on continued growth in mobile communications in terms of the number of
existing mobile subscribers who upgrade or simply replace their existing mobile devices, the number
of new subscribers and increased usage. As well, our sales and profitability are affected by the
extent to which there is increasing demand for, and development of, value-added services, leading
to opportunities for us to successfully market mobile devices that feature these services. These
developments in our industry are to a certain extent outside of our control. For example, we are
dependent on operators in highly penetrated markets to successfully introduce services that cause a
substantial increase in usage of voice and data. Further, in order to support a continued increase
in mobile subscribers in certain low-penetration markets, we are dependent on operators to increase
their sales volumes of lower-cost mobile devices and to offer affordable rates. If operators are
not successful in their attempts to increase subscriber numbers, stimulate increased usage or drive
replacement sales, our business and results of operations could be materially adversely affected.
Our industry continues to undergo significant changes. First, the mobile communications,
information technology, media and consumer electronics industries are converging in some areas into
one broader industry leading to the creation of new types of mobile devices, services and ways to
use mobile devices. Second, while participants in the mobile communications industry once provided
complete products and solutions, industry players are increasingly providing specific hardware and
software layers for products and solutions. As a result of these changes, new market segments
within our industry have begun to emerge and we have made significant investments in new business
opportunities in certain of these market segments, such as smartphones, imaging, games, music and
enterprise mobility infrastructure. However, a number of the new market segments in the mobile
communications industry are still in the early stages of their development, and it may be difficult
for us to accurately predict which new market segments are the most advantageous for us to focus
on. As a result, if the segments on which we have chosen to focus grow less than expected, we may
not receive a return on our investment as soon as we expect, or at all. We may also forego growth
opportunities in new market segments of the mobile communications industry on which we do not
focus.
Our results of operations, particularly our profitability, may be adversely affected if we do not
successfully manage price erosion related to our products.
In the future, if, for competitive reasons, we need to lower the selling prices of certain of
our products and if we cannot lower our costs at the same rate or faster, this may have a material
adverse effect on our business and results of operations, particularly our profitability. To
mitigate the impact of product and service mix shifts on our profitability, we implement product
segmentation with the aim of designing appropriate features with an appropriate cost basis for each
customer segment. Likewise, we endeavor to mitigate the impact on our profitability of price
erosion of certain features and functionalities by seeking to correctly time the introduction of
new products, in order to align such introductions with declines in the prices of relevant
components. We cannot predict with any certainty whether or to what extent we may need to lower
prices for competitive reasons again and how successful we will be in aligning our cost basis to
the pricing at any given point in time. Price erosion is a normal characteristic of the mobile
devices industry, and the products and solutions offered by us are also subject to natural price
erosion over time. If we cannot reduce our costs at the same rate, our business may be materially
adversely affected.
9
Table of Contents
We must develop or otherwise acquire complex, evolving technologies to use in our business. If we
fail to develop these technologies or to successfully commercialize them as new advanced products
and solutions that meet customer demand, or fail to do so on a timely basis, it may have a material
adverse effect on our business, our ability to meet our targets and our results of operations.
In order to succeed in our markets, we believe that we must develop or otherwise acquire complex,
evolving technologies to use in our business. However, the development and use of new technologies,
applications and technology platforms for our mobile devices involves time, substantial costs and
risks both within and outside of our control. This is true whether we develop these technologies
internally, by acquiring or investing in other companies or through collaboration with third
parties.
The technologies, functionalities and features on which we choose to focus may not achieve as broad
or timely customer acceptance as we expect. This may result from numerous factors including the
availability of more attractive alternatives or a lack of sufficient compatibility with other
existing technologies, products and solutions. Additionally, even if we do select the technologies,
functionalities and features that customers ultimately want, we or the companies that work with us
may not be able to bring them to the market at the right time.
Furthermore, as a result of ongoing technological developments, our products and solutions are
increasingly used together with components or layers that have been developed by third parties,
whether or not we have authorized their use with our products and solutions. However, such
components, such as batteries, or layers, such as software applications, may not be compatible with
our products and solutions and may not meet our and our customers’ quality, safety or other
standards. As well, certain components or layers that may be used with our products may enable our
products and solutions to be used for objectionable purposes, such as to transfer content that
might be hateful or derogatory. The use of our products and solutions with incompatible or
otherwise substandard components or layers, or for purposes that are inappropriate, is largely
outside of our control and could harm our reputation in the industry.
We need to understand the different markets in which we operate and meet the needs of our
customers, which include mobile network operators, distributors, independent retailers and
enterprise customers. We need to have a competitive product portfolio, and to work together with
our operator customers to address their needs. Our failure to identify key market trends and to
respond timely and successfully to the needs of our customers may have a material adverse impact on
our market share, business and results of operations.
We serve a diverse range of customers, ranging from mobile network operators, distributors,
independent retailers to enterprise customers, across a variety of markets. In many of these
markets, the mobile communications industry is at different stages of development, and many of
these markets have different characteristics and dynamics, for example, in terms of mobile
penetration rates and technology, features and pricing preferences. Establishing and maintaining
good relationships with our customers and understanding trends and needs in their markets require
us to timely obtain and evaluate a complex array of feedback and other data. We must do this
efficiently in order to be able to identify key market trends and address our customers’ needs
proactively and in a timely manner. If we fail to analyze correctly and respond timely and
appropriately to customer feedback and other data, our business may be materially adversely
affected.
Certain mobile network operators require mobile devices to be customized to their specifications,
by requesting certain preferred features, functionalities or design, together with co-branding with
the network operator’s brand. We believe that customization is an important element in gaining
increased operator customer satisfaction and we are working together with operators on product
planning as well as accelerating product hardware and software customization programs. These
developments may result in new challenges as we provide customized products, such as the need for
us to produce mobile devices in smaller lot sizes, which can impede our economies of scale, or the
potential for the erosion of the Sunplus brand, which we consider to be one of our key competitive
advantages.
In order to meet our customers’ needs, we need to introduce new devices on a timely basis and
maintain a competitive product portfolio. For us, a competitive product portfolio means a broad and
balanced offering of commercially appealing mobile devices with attractive features, functionality
and design for all major user segments and price points. If we do not achieve a competitive
portfolio, we believe that we will be at a competitive disadvantage, which may lead to lower
revenue and lower profits.
10
Table of Contents
The competitiveness of our portfolio is also influenced by the value of the Sunplus brand. A number
of factors, including actual or even alleged defects in our products and solutions, may have a
negative effect on our reputation and erode the value of the Sunplus brand.
Competition in our industry is intense. Our failure to respond successfully to changes in the
competitive landscape may have a material adverse impact on our business and results of operations.
The markets for our products and solutions are intensely competitive. This competition has required
us to extend lenient payment terms to our customers, which adversely affects cash flows. Industry
participants normally compete with each other mainly on the basis of the breadth and depth of their
product portfolios, price, operational and manufacturing efficiency, technical performance, product
features, quality, customer support and brand recognition. We are facing increased competition from
both our traditional competitors in the mobile communications industry as well as a number of new
competitors, particularly from countries where production costs tend to be lower. Some of these
competitors have used, and we expect will continue to use, more aggressive pricing strategies,
different design approaches and alternative technologies than ours. In addition, some competitors
have chosen a strategy of focusing on productization based on commercially available technologies
and components, which may enable them to introduce products faster and with lower levels of
research and development spending than our company.
As a result of developments in our industry, we also expect to face new competition from companies
in related industries, such as consumer electronics manufacturers and business device and solution
providers, including but not limited to Dell, HP, Microsoft, Nintendo, Palm, Research in Motion and
Sony. Additionally, because mobile network operators are increasingly offering mobile devices under
their own brand, we face increasing competition from non-branded mobile device manufacturers. If we
cannot respond successfully to these competitive developments, our business and results of
operations may be materially adversely affected.
Reaching our sales, profitability, volume and market share targets depends on numerous factors.
These include our ability to offer products and solutions that meet the demands of the market and
to manage the prices and costs of our products and solutions, our operational efficiency, the pace
of development and acceptance of new technologies, our success in the business areas that we have
recently entered, and general economic conditions. Depending on those factors, some of which we may
influence and others of which are beyond our control, we may fail to reach our targets and we may
fail to provide accurate forecasts of our sales and results of operations.
A variety of factors discussed throughout these Risk Factors could affect our ability to reach our
targets and give accurate forecasts. Although we can influence some of these factors, some of them
depend on external factors that are beyond our control. In our mobile device businesses, we seek
to maintain healthy levels of sales and profitability through offering a competitive portfolio of
mobile devices, growing faster than the market, working to improve our operational efficiency,
controlling our costs, and targeting timely and successful product introductions and shipments. The
quarterly and annual sales and operating results in our mobile device businesses also depend on a
number of other factors that are not within our control. Such factors include the global growth in
mobile device volumes, which is influenced by, among other factors, regional economic factors,
competitive pressures, regulatory environment, the timing and success of product and service
introductions by various market participants, including network operators, the commercial
acceptance of new mobile devices, technologies and services, and operators’ and distributors’
financial situations. Our sales and operating results are also impacted by fluctuations in exchange
rates and at the quarterly level by seasonality. In developing markets, the availability and cost,
through affordable tariffs, of mobile phone service compared with the availability and cost of
fixed line networks may also impact volume growth.
In our mobile networks business, we also seek to maintain healthy levels of sales and profitability
and try to grow faster than the market. Our networks business’s quarterly and annual net sales and
operating results can be affected by a number of factors, some of which we can influence, such as
our operational efficiency, the level of our research and development investments and the
deployment progress and technical success we achieve under network contracts. Other relevant
factors include operator investment behavior, which can vary significantly from quarter to quarter,
competitive pressures and general economic conditions although these are not within our control.
11
Table of Contents
The new business areas that we have entered may be less profitable than we currently foresee, or
they may generate more variable operating results than we currently foresee. We expect to incur
short-term operating losses in certain of these new business areas given our early stage
investments in research and development and marketing in particular. Also our efforts in managing
prices and costs in the long-term, especially balancing prices and sales volumes with research and
development costs, may prove to be inadequate.
Although we may announce forecasts of our results of operations, uncertainties affecting any of
these factors, particularly during difficult economic conditions, render our forecasts difficult to
make, and may cause us not to reach the targets that we have forecasted, or to revise our
estimates.
Our sales and results of operations could be adversely affected if we fail to efficiently manage
our manufacturing and logistics without interruption, or fail to ensure that our products and
solutions meet our and our customers’ quality, safety and other requirements and are delivered in
time.
Our manufacturing and logistics requirements are complex, call for advanced and costly equipment
and include outsourcing to third parties. These operations are continuously modified in an effort
to improve manufacturing efficiency and flexibility. We may experience difficulties in adapting our
supply to the demand for our products, ramping up or down production at our facilities, adopting
new manufacturing processes, finding the timeliest way to develop the best technical solutions for
new products, or achieving manufacturing efficiency and flexibility, whether we manufacture our
products and solutions ourselves or outsource to third parties. Such difficulties may have a
material adverse effect on our sales and results of operations and may result from, among other
things: delays in adjusting or upgrading production at our facilities, delays in expanding
production capacity, failure in our manufacturing and logistics processes, failures in the
activities we have outsourced, and interruptions in the data communication systems that run our
operations. Also, a failure or an interruption could occur at any stage of our product creation,
manufacturing and delivery processes, resulting in our products and solutions not meeting our and
our customers’ quality, safety and other requirements, or being delivered late, which could have a
material adverse effect on our sales, our results of operations and reputation and the value of the
Sunplus brand.
We depend on our suppliers for the timely delivery of components and for their compliance with our
supplier requirements, such as, most notably, our and our customers’ product quality, safety and
other standards. Their failure to do so could adversely affect our ability to deliver our products
and solutions successfully and on time.
Our manufacturing operations depend to a certain extent on obtaining adequate supplies of fully
functional components on a timely basis. Our principal supply requirements are for electronic
components, mechanical components and software, which all have a wide range of applications in our
products. Electronic components include integrated circuits, microprocessors, standard components,
memory devices, cameras, displays, batteries and chargers while mechanical components include
covers, connectors, key mats and antennas. In addition, a particular component may be available
only from a limited number of suppliers. Suppliers may from time to time extend lead times, limit
supplies or increase prices due to capacity constraints or other factors, which could adversely
affect our ability to deliver our products and solutions on a timely basis. Moreover, even if we
attempt to select our suppliers and manage our supplier relationships with scrutiny, a component
supplier may fail to meet our supplier requirements, such as, most notably, our and our customers’
product quality, safety and other standards, and consequently some of our products are unacceptable
to us and our customers, or we may fail in our own quality controls. Moreover, a component supplier
may experience delays or disruption to its manufacturing, or financial difficulties. Any of these
events could delay our successful delivery of products and solutions that meet our and our
customers’ quality, safety and other requirements, or otherwise adversely affect our sales and our
results of operations. Also, our reputation and brand value may be affected due to real or merely
alleged failures in our products and solutions.
12
Table of Contents
We are developing a number of our new products and solutions together with other companies. If any
of these companies were to fail to perform, we may not be able to bring our products and solutions
to market successfully or in a timely way and this could have a material adverse impact on our
sales and profitability.
We continue to invite the providers of technology, components or software to work with us to
develop technologies or new products and solutions. These arrangements involve the commitment by
each company of various resources, including technology, research and development efforts, and
personnel. Although the target of these arrangements is a mutually beneficial outcome for each
party, our ability to introduce new products and solutions that meet our and our customers’
quality, safety and other standards successfully and on schedule could be hampered if, for example,
any of the following risks were to materialize: the arrangements with the companies that work with
us do not develop as expected, the technologies provided by the companies that work with us are not
sufficiently protected or infringe third parties’ intellectual property rights in a way that we
cannot foresee or prevent, the technologies, products or solutions supplied by the companies that
work with us do not meet the required quality, safety and other standards or customer needs, our
own quality controls fail, or the financial standing of the companies that work with us
deteriorates.
Our operations rely on complex and highly centralized information technology systems and networks.
If any system or network disruption occurs, this reliance could have a material adverse impact on
our operations, sales and operating results.
Our operations rely to a significant degree on the efficient and uninterrupted operation of complex
and highly centralized information technology systems and networks, which are integrated with those
of third parties. Any failure or disruption of our current or future systems or networks could have
a material adverse effect on our operations, sales and operating results. Furthermore, any data
leakages resulting from information technology security breaches could also adversely affect us.
All information technology systems are potentially vulnerable to damage or interruption from a
variety of sources. We pursue various measures in order to manage our risks related to system and
network disruptions, including the use of multiple suppliers and available information technology
security. However, despite precautions taken by us, an outage in a telecommunications network
utilized by any of our information technology systems, virus or other event that leads to an
unanticipated interruption of our information technology systems or networks could have a material
adverse effect on our operations, sales and operating results.
Our products and solutions include increasingly complex technology involving numerous new
proprietary technologies, as well as some developed or licensed to us by certain third parties. As
a consequence, evaluating the protection of the technologies we intend to use is more and more
challenging, and we expect increasingly to face claims that we have infringed third parties’
intellectual property rights. The use of increasingly complex technology may also result in
increased licensing costs for us, restrictions on our ability to use certain technologies in our
products and solution offerings, and/or costly and time-consuming litigation. Third parties may
also commence actions seeking to establish the invalidity of intellectual property rights on which
we depend.
Our products and solutions include increasingly complex technology involving numerous new
proprietary technologies, as well as some developed or licensed to us by certain third parties. As
the amount of such proprietary technologies needed for our products and solutions continues to
increase, the number of parties claiming rights continues to increase and becomes more fragmented
within individual products, and as the complexity of the technology and the overlap of product
functionalities increases, the possibility of more infringement and related intellectual property
claims against us also continues to increase. The holders of patents potentially relevant to our
product and solution offerings may be unknown to us, or may otherwise make it difficult for us to
acquire a license on commercially acceptable terms. There may also be technologies licensed to and
relied on by us that are subject to claims of infringement or other corresponding allegations by
others which could damage our ability to rely on such technologies.
In addition, although we endeavor to ensure that companies that work with us possess appropriate
intellectual property rights or licenses, we cannot fully avoid risks of intellectual property
rights infringement created by suppliers of components and various layers in our products and
solutions or by companies with which we work in cooperative research and development activities.
Similarly, we and our customers may face claims of infringement in connection with our customers’
use of our products and solutions. Finally, as all technology standards, including those used and
relied on by us, include some intellectual property rights, we cannot fully avoid risks of a claim
for infringement of such rights due to our reliance on such standards. We believe that the number
of third parties declaring their intellectual property to be relevant to these standards is
increasing, which may increase the likelihood that we will be subject to such claims in the future.
13
Table of Contents
Any restrictions on our ability to sell our products and solutions due to expected or alleged
infringements of third party intellectual property rights and any intellectual property rights
claims, regardless of merit, could result in material losses of profits, costly litigation, the
payment of damages and other compensation, the diversion of the attention of our personnel, product
shipment delays or the need for us to develop non-infringing technology or to enter into royalty or
licensing agreements. If we were unable to develop non-infringing technology, or if royalty or
licensing agreements were not available on commercially acceptable terms, we could be precluded
from making and selling the affected products and solutions. As new features are added to our
products and solutions, we may need to acquire further licenses, including from new and sometimes
unidentified owners of intellectual property. The cumulative costs of obtaining any necessary
licenses are difficult to predict and may over time have a negative effect on our operating
results.
In addition, other companies may commence actions seeking to establish the invalidity of our
intellectual property, such as, patent rights. In the event that one or more of our patents are
challenged, a court may invalidate the patent or determine that the patent is not enforceable,
which could harm our competitive position. If any of our key patents are invalidated, or if the
scope of the claims in any of these patents is limited by a court decision, we could be prevented
from licensing the invalidated or limited portion of our intellectual property rights. Even if such
a patent challenge is not successful, it could be expensive and time consuming, divert management
attention from our business and harm our reputation. Any diminution of the protection that our own
intellectual property rights enjoy could cause us to lose some of the benefits of our investments
in R&D, which may have a negative effect on our results of operations.
If we are unable to recruit, retain and develop appropriately skilled employees, we may not be able
to implement our strategies and, consequently, our results of operations may suffer.
We must continue to recruit, retain and through constant competence training develop appropriately
skilled employees with a comprehensive understanding of our businesses and technologies. As
competition for skilled personnel remains keen, we seek to create a corporate culture that
encourages creativity and continuous learning. We are also continuously developing our compensation
and benefit policies and taking other measures to attract and motivate skilled personnel, to deal
in particular with the recent demand for pay raises. Nevertheless, we have encountered in the past,
and may encounter in the future, shortages of appropriately skilled personnel, which may hamper our
ability to implement our strategies and harm our results of operations.
Our sales derived from, and assets located in the PRC, an emerging market country, may be adversely
affected by economic, regulatory and political developments there. As our sales are derived from
it, economic or political turmoil in the PRC could adversely affect our sales and results of
operations. Our investments in the PRC may also be subject to other risks and uncertainties.
We generate sales from and have invested in the PRC. As our sales are derived from the PRC,
economic or political turmoil there could adversely affect our sales and results of operations. Our
investments in the PRC may also be subject to risks and uncertainties, including unfavorable
taxation treatment, exchange controls, challenges in protecting our intellectual property rights,
nationalization, inflation, incidents of terrorist activity, currency fluctuations, or the absence
of, or unexpected changes in, regulation as well as other unforeseeable operational risks.
14
Table of Contents
Allegations of health risks from the electromagnetic fields generated by base stations and mobile
devices, and the lawsuits and publicity relating to them, regardless of merit, could affect our
operations negatively by leading consumers to reduce their use of mobile devices or by causing us
to allocate monetary and personnel resources to these issues.
There has been public speculation about possible health risks to individuals from exposure to
electromagnetic fields from base stations and from the use of mobile devices. While a substantial
amount of scientific research conducted to date by various independent research bodies has
indicated that these radio signals, at levels within the limits prescribed by public health
authority safety standards and recommendations, present no discernable adverse effect on human
health, we cannot be certain that future studies, irrespective of their scientific basis, will not
suggest a link between electromagnetic fields and adverse health effects that would adversely
affect our sales and share price. Research into these issues is ongoing by government agencies,
international health organizations and other scientific bodies in order to develop a better
scientific and public understanding of these issues.
Although Sunplus products and solutions are designed to meet all relevant safety standards and
recommendations globally, no more than a perceived risk of adverse health effects of mobile
communications devices could adversely affect us through a reduction in sales of mobile devices or
increased difficulty in obtaining sites for base stations, and could have a negative effect on our
reputation and brand value as well as harm our share price.
Changes in various types of regulation in countries around the world could affect our business
adversely.
Our business is subject to direct and indirect regulation in each of the countries in which we, and
the companies with which we work, or our customers, do business. As a result, changes in various
types of regulations applicable to current or new technologies, products or services could affect
our business adversely. For example, it is in our interest that the Federal Communications
Commission maintains a regulatory environment that ensures the continued growth of the wireless
sector in the United States. In addition, changes in regulation affecting the construction of base
stations and other network infrastructure could adversely affect the timing and costs of new
network construction or expansion and the commercial launch and ultimate commercial success of
these networks.
Moreover, the implementation of new technological or legal requirements, such as the requirement in
the United States that all handsets must be able to indicate their physical location, could impact
our products and solutions, manufacturing or distribution processes, and could affect the timing of
product and solution introductions, the cost of our production, products or solutions as well as
their commercial success. Finally, export control, tariff, environmental, safety and other
regulation that adversely affect the pricing or costs of our products and solutions as well as new
services related to our products could affect our net sales and results of operations. The impact
of these changes in regulation could affect our business adversely even though the specific
regulations do not always directly apply to us or our products and solutions.
Our stock price has been historically volatile and may continue to be volatile, which may make it
more difficult for you to resell shares when you want at prices you find attractive.
The trading price of our ordinary shares has been and may continue to be subject to considerable
daily fluctuations. During the twelve months ended March 31, 2010, the closing sale prices of our
ordinary shares on the Over-the-Counter Bulletin Board ranged from US$0.05 to US$1.01 per share and the
closing sale price on June 28, 2010 was US$0.10 per share. Our stock price may fluctuate in response
to a number of events and factors, such as quarterly variations in operating results, announcements
of technological innovations or new products and media properties by us or our competitors, changes
in financial estimates and recommendations by securities analysts, the operating and stock price
performance of other companies that investors may deem comparable, new governmental restrictions or
regulations and news reports relating to trends in our markets.
15
Table of Contents
| Item 1B. | Unresolved Staff Comments. |
None.
| Item 2. | Properties. |
As of March 31, 2010, we have an R&D headquarter in Shanghai, China and an office in Huizhou,
Guangdong, China.
Our principal executive offices occupy area of 140 square meters on the 9th floor YongSheng
Building, Zhongshan Xi Road, Xuhui District, Shanghai, China. The rental is US$2,000 per month. We
also rent 950 square meters of office space in the QiaoXing Industry and Technology Zone, Tangquan,
Huizhou, Guangdong, China. The rental is US$1,400 per month. These leased premises house the R&D and
design department, product testing facilities, maintenance and administrative departments.
| Item 3. | Legal Proceedings. |
We are not involved in any material pending legal proceedings at this time, and management is not
aware of any contemplated proceeding by any governmental authority.
| Item 4. | Submission of Matters to a Vote of Security Holders. |
None.
16
Table of Contents
PART II.
| Item 5. | Market for Registrant’s Common Equity, Related Stockholder Matters and Issuer Purchases of Equity Securities. |
Our common stock is listed on the Over-the-Counter Bulletin Board under the symbol “TBYH.OB”. As
of May 26, 2010, there were: (i) 319 shareholders of record, without giving effect to determining
the number of shareholders who hold shares in “street name” or other nominee status; (ii) no
outstanding options to purchase shares of our common stock; (iii) 30,088,174 outstanding shares of
our common stock, of which 9,640,186 shares are either freely tradable or eligible for sale under
Rule 144 or Rule 144K, and (iv) no shares subject to registration rights.
The following table sets forth, for the fiscal quarters indicated, the high and low closing prices
as reported by the Over-the-Counter Bulletin Board. These quotations reflect inter-dealer prices,
without retail mark-up, mark-down or commission, and may not represent actual transactions.
Sales Price
| High | Low | |||||||
Fiscal 2010 |
||||||||
First Quarter |
US$ | 1.01 | US$ | 0.21 | ||||
Second Quarter |
US$ | 0.50 | US$ | 0.11 | ||||
Third Quarter |
US$ | 0.45 | US$ | 0.20 | ||||
Fourth Quarter |
US$ | 0.30 | US$ | 0.05 | ||||
Fiscal 2009 |
||||||||
First Quarter |
US$ | 2.70 | US$ | 1.80 | ||||
Second Quarter |
US$ | 2.36 | US$ | 1.55 | ||||
Third Quarter |
US$ | 2.01 | US$ | 0.65 | ||||
Fourth Quarter |
US$ | 0.63 | US$ | 0.20 | ||||
Dividend Policy
We have never paid cash dividends and have no plans to do so in the foreseeable future. Our future
dividend policy will be determined by our Board of Directors and will depend upon a number of
factors, including our financial condition and performance, our cash needs and expansion plans,
income tax consequences, and the restrictions that applicable laws and our credit arrangements then
impose.
Recent Sales of Unregistered Securities
During the year ended March 31, 2010, we did not issue any securities that were not registered
under the Securities Act of 1933, as amended (the “Securities Act”).
17
Table of Contents
| Item 6. | Selected Financial Data. |
The following tables summarize the consolidated financial data of T-Bay Holdings, Inc. for the
periods presented. You should read the following financial information together with the
information under “Management’s Discussion and Analysis of Financial Condition and Results of
Operations” and our consolidated financial statements and the related notes to these consolidated
financial statements appearing elsewhere in this Form 10-K.
| Year Ended March 31 | ||||||||||||
| In thousands, except share amounts | ||||||||||||
| 2008 | 2009 | 2010 | ||||||||||
Revenue |
US$ | 45,681 | US$ | 34,838 | US$ | 35,867 | ||||||
Cost of sales |
US$ | 23,539 | US$ | 24,440 | US$ | 34,930 | ||||||
Gross profit |
US$ | 22,142 | US$ | 10,398 | US$ | 937 | ||||||
Depreciation and amortization |
US$ | 965 | US$ | 1,012 | US$ | 874 | ||||||
Selling and distribution expenses |
US$ | 280 | US$ | 245 | US$ | 129 | ||||||
General and administrative expenses |
US$ | 3,264 | US$ | 10,043 | US$ | 7,959 | ||||||
Other operating expenses |
US$ | — | US$ | 5,075 | US$ | — | ||||||
Other income |
US$ | 185 | US$ | 545 | US$ | 180 | ||||||
Interest expense |
US$ | 3 | US$ | — | US$ | — | ||||||
Gain on disposal of a subsidiary |
US$ | — | US$ | — | US$ | 43 | ||||||
Income (loss) before income taxes
and noncontrolling interest |
US$ | 18,780 | US$ | (4,420 | ) | US$ | (6,928 | ) | ||||
Income tax expense |
US$ | 3,188 | US$ | 1,900 | US$ | 7 | ||||||
Noncontrolling interests |
US$ | 659 | US$ | 429 | US$ | 427 | ||||||
Net income/(loss) attributable to
the Shareholders of the Company |
US$ | 14,554 | US$ | (8,713 | ) | US$ | (6,508 | ) | ||||
Income per Share — basic |
US$ | 0.48 | US$ | (0.29 | ) | US$ | (0.22 | ) | ||||
Income per Share — diluted |
US$ | 0.48 | US$ | (0.29 | ) | US$ | (0.22 | ) | ||||
| Year Ended March 31 | ||||||||||||
| In thousands, except share amounts | ||||||||||||
| 2008 | 2009 | 2010 | ||||||||||
Balance Sheet Data: |
||||||||||||
Cash and cash equivalents |
US$ | 23,330 | US$ | 20,493 | US$ | 703 | ||||||
Total current assets |
US$ | 43,227 | US$ | 48,585 | US$ | 13,230 | ||||||
Assets of discontinued
operations |
US$ | 18,954 | US$ | 724 | US$ | — | ||||||
Total assets |
US$ | 65,664 | US$ | 51,867 | US$ | 43,356 | ||||||
Accounts Payables |
US$ | 688 | US$ | 466 | US$ | 155 | ||||||
Total current liabilities |
US$ | 9,141 | US$ | 3,415 | US$ | 1,994 | ||||||
Liabilities of discontinued
operation |
US$ | 3,313 | US$ | — | US$ | — | ||||||
Long-term liabilities |
US$ | 4,177 | US$ | 4,255 | US$ | 4,255 | ||||||
Total stockholders’ equity |
US$ | 49,689 | US$ | 41,929 | US$ | 35,445 | ||||||
| Item 7. | Management’s Discussion and Analysis of Financial Condition and Results of Operation. |
The information in this discussion contains forward-looking statements within the meaning of
Section 27A of the Securities Act of 1933, as amended, and Section 21E of the Securities Exchange
Act of 1934, as amended. These forward-looking statements involve risks and uncertainties,
including statements regarding our capital needs, business strategy and expectations. Any
statements contained herein that are not statements of historical facts may be deemed to be
forward-looking statements. In some cases, you can identify forward-looking statements by
terminology such as “may”, “will”, “should”, “expect”, “plan”, “intend”, “anticipate”, “believe”,
“estimate”, “predict”, “potential” or “continue”, the negative of such terms or other comparable
terminology. Actual events or results may differ materially. We disclaim any obligation to publicly
update these statements, or disclose any difference between its actual results and those reflected
in these statements. The information constitutes forward-looking statements within the meaning of
the Private Securities Litigation Reform Act of 1995.
18
Table of Contents
The following review concerns the year ended March 31, 2010.
In the wake of the global financial crisis, our customers have become slow in their payments. The
Company does not expect settlement from customers within twelve months from the date of sale of
goods or services. Therefore, in the financial statements, accounts receivable relating to
revenue for the year ended March 31, 2010 have been discounted based on the future contractual cash
flows at the current market interest rate that is available to the Company for similar financial
instruments of 5%. US$1,425,000 was debited to revenue accordingly. Also, the customers changed their
orders from design services to mobile phone components, to provide some relief to the financial
strain that they have. This behavior has the effect of transferring part of the financing of the
production of mobile phone handsets from our customers to us. This, together with the reduction in
aggregate demand in the types of mobile phones to which our design services were suited, in the
Mainland China market as well as the overseas market, resulted in a drastic reduction of customer
orders for design services, for which the gross margin is relatively high. In addition to accounts
receivable from our customers, our assets in the balance sheet as of March 31, 2010 also included
other receivables which mainly represented remaining sales proceeds receivables of US$10,475,000 for
disposal of 80% interest in Fujian QiaoXing. We expect to recover this amount in full by March 31, 2011, and
no allowance for doubtful receivable had been made. The global financial crisis, and its
consequence in various manifestations, has also caused an increase in credit risk on our
receivables. We believe that we have made adequate provision for doubtful accounts in our financial
statements. However, if the provision turns out to be inadequate, then our financial performance
and our financial position will be adversely affected. The decline in purchases of design services
and the slowness in collecting our accounts receivable pose potential risks to our financial
performance. While there are limited steps that Management can take to mitigate these potential
risks, we cannot be assured that our customers’ financial position will improve. Our business model
has been adjusted with a view to conserve cash to allow us to get through this extended period of
temporary hardship. The orderly collection of our long-outstanding accounts receivable and other
receivables is necessary to the maintenance of sufficient liquidity and capital resources for our
operations during the next 12 months. While we believe that adequate provisions on our accounts
receivable and other receivables have been made, we cannot assure investors that their carrying
amount (net of provision) will be received in full within the anticipated time frame. A failure to
collect the anticipated amount within the anticipated time frame would adversely affect our
liquidity and capital resources.
Overview
Our net revenue increased 2.9% from US$34,838,000 for the year ended March 31, 2009 to US$35,867,000
for year ended 31 March 2010, which was the net result of a drop in revenue from design services,
and an increase in revenue from our sales of mobile phone components. Our net results for the year
changed from a loss of US$8,713,000 to a loss of US$6,508,000. This reduction of loss was the net
result of the decrease in gross profit on the one hand, and the decrease in general and
administrative expenses, the decrease in other operating expenses, the decrease in income tax and
the decrease in the loss from discontinued operations on the other hand. We recorded a loss per
share of US$0.22 for the year ended March 31, 2010, and a loss per share of US$0.29 for the year ended
March 31, 2009.
Net Revenue
| Fiscal Year Ended March 31 | ||||||||||||||||||||||||
| (in thousands of US dollars) | 2010 | % | 2009 | % | Variance | % | ||||||||||||||||||
Sales of mobile phone components |
US$ | 35,212 | 98.2 | 23,614 | 67.8 | US$ | 11,598 | 49.1 | % | |||||||||||||||
Revenue from design services |
US$ | 655 | 1.8 | 11,224 | 32.2 | US$ | (10,569 | ) | -94.2 | % | ||||||||||||||
NET REVENUE |
US$ | 35,867 | 100.0 | 34,838 | 100.0 | US$ | 1,029 | 2.9 | % | |||||||||||||||
19
Table of Contents
Our net revenue was US$35,867,000 for the year ended March 31, 2010, which represented an increase of
US$1,029,000, or 2.9%, from US$34,838,000 for the year ended March 31, 2009. Revenue from sales of
mobile phone components was US$35,212,000 compared to US$23,614,000 in the previous fiscal year,
representing a 49.1% increase. Revenue from design services decreased to US$655,000 from US$11,224,000
in previous fiscal year, representing a 94.2% decrease.
Our net revenue increase was the net result of the increase in the sales of mobile phone components
and the decrease in design services. In the fiscal year ended March 31, 2010, customers did not
place as many orders for design services, but placed more orders for mobile phone components. As a
result, the percentage of our revenue from sales of mobile phone components increased substantially
as compared with prior year.
For the year ended March 31, 2010, revenue from design services represented 1.8% of total revenue,
while revenue from sales of mobile phone components was 98.2%, compared to 32.2% from design
services and 67.8% from sales of mobile phone components for the year ended March 31, 2009.
Detailed information on sale of mobile phone components
Sales of mobile phone components (PCB and PCBA, the key components in the manufacture of mobile
handsets) increased from US$23,614,000 to US$35,212,000, representing a 49.1% increase. The increase
was largely the result of the transfer of orders from design services to mobile phone components.
For customers who would like to relieve the strain on their finances, they preferred buying mobile
phone components rather than design services, which requires more capital investments.
We design and manufacture PCB and provide PCBA according to our customers’ specifications. We
manufactured more PCB and PCBA for our customers for the year ended March 31, 2010 when compared
with the year ended March 31, 2009.
Detailed information on revenue from design services
Revenue from design services decreased from US$11,224,000 for the year ended March 31, 2009 to
US$655,000 for the year ended March 31, 2010, representing a 94.2% decrease. In the year ended March
31, 2010, there was a drastic reduction of customer orders for design services compared with the
previous fiscal year. We believe that as a result of the global financial crisis and its
consequence in its various manifestations, and also the change in consumer preference, aggregate
demand for the types of mobile phone handsets to which our design services were suited, in the
Mainland China market as well as the overseas market, had been on a downward trend. The decrease in
design services was to a certain extent also the result of order transfer, as customers shifted
from purchasing design services to purchasing components. By purchasing components rather than
design services, customers have been able to conserve cash.
Cost of Revenue
For the fiscal year ended March 31, 2010, cost of revenue increased to US$34,930,000 from US$24,440,000
in the fiscal year ended March 31, 2009, representing a 42.9% increase. Cost of revenue primarily
consisted of the purchase cost of raw and processed materials.
Detailed information on Cost of Revenue
| Fiscal Year Ended March 31 | ||||||||||||||||
| (in thousands of US dollars) | 2010 | 2009 | Variance | % | ||||||||||||
Cost of revenue |
US$ | 34,930 | US$ | 24,440 | US$ | 10,490 | 42.9 | % | ||||||||
Raw materials |
US$ | 34,104 | US$ | 22,952 | US$ | 11,152 | 48.6 | % | ||||||||
R&D |
US$ | — | US$ | 17 | US$ | -17 | -100.0 | % | ||||||||
Salaries |
US$ | 791 | US$ | 938 | US$ | -147 | - 15.7 | % | ||||||||
Business tax |
US$ | 35 | US$ | 533 | US$ | -498 | - 93.4 | % | ||||||||
20
Table of Contents
The increase in cost of revenue was mainly attributable to an increase in the purchase of raw
materials. As we manufactured more PCB and PCBA boards for our customers, we purchased more raw
materials in the current fiscal year than in the fiscal year ended March 31, 2009. Key materials
for manufacture such as chipsets and PCB blank boards accounted for a large proportion of cost of
raw materials. The cost of raw material increased by US$11,152,000, or 48.6 %, from US$22,952,000 for
the fiscal year ended March 31, 2009.
Gross profit
Our gross profit was US$937,000 for the fiscal year ended March 31, 2010 as compared to US$10,398,000
for the fiscal year ended March 31, 2009, representing a 91.0% decrease. The decrease in gross
profit was mainly attributable to the significant decrease in revenue from design services with
high profit margin.
Operating Expenses
Operating expenses consist of selling expenses and general and administrative (G&A) expenses and
other operating expenses. For the fiscal year ended March 31, 2010, operating expenses were
US$8,088,000, as compared to US$15,363,000 for the fiscal year ended March 31, 2009, representing a
47.4% decrease.
Detailed information of operating expenses for the years ended March 31, 2010 and 2009 is as
follows:
| Fiscal Year Ended March 31, | ||||||||||||||||
| 2010 | 2009 | |||||||||||||||
| (in thousands of US dollars) | Amount | % of net revenue | Amount | % of net revenue | ||||||||||||
Operating Expenses |
US$ | 8,088 | 22.5 | % | US$ | 15,363 | 44.1 | % | ||||||||
Selling Expenses |
US$ | 129 | 0.4 | % | US$ | 245 | 0.7 | % | ||||||||
G&A Expenses |
US$ | 7,959 | 22.2 | % | US$ | 10,043 | 28.8 | % | ||||||||
Other Operating
Expenses |
US$ | — | 0 | % | US$ | 5,075 | 14.6 | % | ||||||||
Operating expenses during the fiscal year ended March 31, 2010 were US$8,088,000, 22.5% of revenue,
compared to US$15,363,000, or 44.1% of revenue, for the fiscal year ended March 31, 2009. The
decrease was mainly attributed to the decrease in G&A expenses and the decrease in other operating
expenses.
Selling expenses decreased from US$245,000 to US$129,000. The decrease was mainly attributable to the
closure of our sales office in Shenzhen.
G&A expenses were US$7,959,000, 22.2% of revenue, compared to US$10,043,000, or 28.8% of revenue in the
last fiscal year. The decrease in G&A expenses was mainly due to the decrease of allowance for
doubtful receivables from US$8,077,000 to US$6,227,000 and a decrease of salaries. Included in the G&A
expenses was the charge for allowance for doubtful receivables. We increased allowance for doubtful
receivables by US$6,227,000 for the year ended 31 March 2010. The allowance for doubtful receivables
was US$15,429,000 as of March 31, 2010 compared to US$9,202,000 as of March 31, 2009. Allowance for
doubtful receivables is maintained for all customers based on a variety of factors, including the
overall economy and industry condition, length of time the receivables are past due, significant
one-time events and historical experience. For the year ended March 31, 2010, particular
consideration was given to the increased credit risk due to the sluggish economic climate, which
was evident from the increase in the length of time the receivables were past due. With a view to
halting further increases in allowance for doubtful receivables, in its decision to grant credit to
its customers, the Company has been using more stringent criteria in the evaluation of their
creditworthiness.
21
Table of Contents
Other operating expenses for the fiscal year ended March 31,2009 represented compensation of
US$5,075,000 (2010: US$nil) to two customers to compensate them for subcontracting fees and raw
materials consumed for two defectively designed mobile phone PCBAs.
Loss from Operations
Loss from
operations was US$7,151,000 in fiscal year ended March 31, 2010, compared to loss of
US$4,965,000 in year ended March 31, 2009. This increase in loss was the net result of the decrease
of revenue in design service with relatively high gross profit margin, which was not adequately
made up for by the increase in the sales of mobile phone components with relatively low profit
margin on the one hand, and the decrease in compensation to customers on the other hand.
Income Tax
Sunplus is subject to PRC Enterprise Income Tax. Pursuant to the PRC Income Tax Laws, the
prevailing statutory rate of enterprise income tax in Shanghai was 25%.
For the year ended March 31, 2010, Sunplus recorded an income tax expense US$7,000, compared to
US$1,900,000 in the year ended March 31, 2009. The income tax expenses of US$7,000 related to an
under-provision in the prior year. No income tax expense relating to the current fiscal year was
recorded for the year ended March 31, 2010 as Sunplus incurred a loss for this fiscal year.
Non-controlling Interest
Non-controlling interest represents the portion of loss of Sunplus that we do not own. In the
fiscal year ended March 31, 2010, non-controlling interest was attributable to the 5% of the equity
interest of Sunplus owned by Shanghai Fanna.
Loss from Discontinued Operations
For the year ended March 31, 2009, the Company reported a loss of US$2,822,000 (2010: US$nil) from
discontinued operations. Loss from discontinued operations for the year ended March 31, 2009
consisted of other revenue of US$2,000, operating losses of US$90,000, loss on disposal of a
subsidiary of US$2,730,000 and impairment loss on assets of discontinued operations of US$4,000.
We recorded losses on discontinued operations as Sunplus disposed of its 80% interest in its
subsidiary Fujian QiaoXing for US$12,230,000 (RMB84,000,000), which was US$2,730,000 less than the
carrying values of Fujian QiaoXing’s net assets.
22
Table of Contents
Net loss
As a result of the above items, net loss attributable to common stockholders was US$6,508,000 for the
year ended March 31, 2010, as compared to net loss attributable to common stockholders of
US$8,713,000 for the year ended March 31, 2009. This reduction of loss was the net result of the
decrease of revenue in design service with relatively high gross profit margin, which was not
adequately made up for by the increase in the sales of mobile phone components with relatively low
profit margin on the one hand, and the decrease in G&A expenses, the decrease in compensation paid
to customers, the decrease in income tax and the decrease in loss from discontinued operations on
the other hand.
Loss per share attributable to common stockholders
We reported loss per share attributable to common stockholders of US$0.22, based on a weighted
average number of shares outstanding of 30,088,174 for the year ended March 31, 2010, compared with
a loss per share of US$0.29, based on the same weighted average number of shares for the year ended
March 31, 2009. Our outstanding common stock was 30,088,174 shares as of March 31, 2010 and March
31, 2009. We do not have any preferred stock issued or outstanding warrants or options as of March
31, 2010 and March 31, 2009.
Assets
Cash and cash equivalents
| As of March 31 | ||||||||
| (in thousands of US dollars) | ||||||||
| 2010 | 2009 | |||||||
Cash and cash equivalents |
703 | 20,493 | ||||||
Cash and cash equivalents were US$703,000 as of March 31, 2010. Decrease in cash and cash equivalents
was mainly attributed to the negative operating cash flows arising from the paltry gross profit and
the significant increase in accounts receivable.
Accounts receivable, net
As of March 31, 2010, accounts receivable amounted to US$28,493,000, an increase of US$14,132,000
compared to US$14,361,000 as of March 31, 2009. The increase was mainly the net result of an increase
in the gross amount of accounts receivable and an increase in the allowance for doubtful accounts
receivable. The gross amount of the accounts receivable increased by US$21,726,000 mainly because
trade debtors took longer to pay in an economic environment which was deteriorating. The allowance
for doubtful accounts receivable increased by an amount of US$7,594,000 for the year ended March 31,
2010. The Company evaluated credit risk on trade debtors and maintained its allowance policy of
100% provision for accounts receivable overdue more than one year. It is to reflect significant
credit risk in the wake of the financial crisis, with its consequence in various manifestations. If
circumstances related to customers change, estimates of the recoverability of receivables would be
further adjusted.
Due to the financial crisis, the Company does not expect settlement from customers in the next
twelve months, therefore, accounts receivables relating to revenue for the year ended March 31,
2010 have been discounted based on the future contractual cash flows at the current market interest
rate that is available to the Company for similar financial instruments of 5%. US$1,425,000 was
debited to revenue accordingly.
23
Table of Contents
Detailed information on accounts receivables, net
| As of March 31 | ||||||||
| (in thousands of US dollars) | ||||||||
| 2010 | 2009 | |||||||
Accounts receivable, gross |
42,769 | 21,043 | ||||||
Allowance of doubtful debts |
(14,276 | ) | (6,682 | ) | ||||
Accounts receivable, net |
28,493 | 14,361 | ||||||
Classified as current assets |
— | 14,361 | ||||||
Classified as non-current assets |
28,493 | — | ||||||
Prepayments, deposits and other receivables, net
Prepayments, deposits and other receivable mainly represented remaining sales proceeds receivables
of US$10,475,000 (2009: US$11,928,000) for disposal of 80% interest in
Fujian QiaoXing. An allowance of
US$1,153,000 (2009: US$2,520,000) was made against long-outstanding other receivables.
Pursuant to the agreement signed between Sunplus and Qiaoxing Telecom in respect of the disposal of
Fujian QiaoXing to Qiaoxing Telecom in March 2009, Qiaoxing Telecom was to settle this outstanding
balance by June 2009. However, Qiaoxing Telecom was unable to obtain approval from the local
governmental bureau in Zhangzhou to develop the land held by Fujian QiaoXing. This was due to the
delay in development by Fujian QiaoXing. When the Zhangzhou local government granted the land use
right to Fujian QiaoXing in 2006, Fujian QiaoXing was required to develop the land within three
years. However, the land had not been developed prior to the disposal to Qiaoxing Telecom and the
local authorities have refused to approve the development plans submitted by Qiaoxing Telecom.
Recently, the Company has actively liaised with the Zhangzhou local governmental bureau to apply
for an extension of the land development. Based on this contact, the Company, in conjunction with
its legal counsel, has made its initial assessment of the situation and concluded that it is more
likely than not that the Zhangzhou local government bureau will provide an extension for developing
the land and Qiaoxing Telecom can honor the agreement and settle the balance due to Sunplus.
Accordingly, no allowance has been made in respect of the sales proceeds receivable from QiaoXing
Telecom of US$10,475,000.
Property, Plant and Equipment
| As of March 31 | ||||||||
| (in thousands of US dollars) | ||||||||
| 2010 | 2009 | |||||||
Property, Plant and Equipment |
1,591 | 2,493 | ||||||
As of March 31, 2010, our property, plant and equipment amounted to US$1,591,000.
The detailed information on property, plant and equipment is as follows:
| As of March 31 | ||||||||
| (in thousands of US dollars) | ||||||||
| 2010 | 2009 | |||||||
Cost |
||||||||
Machinery |
4,766 | 4,859 | ||||||
Office equipment |
104 | 138 | ||||||
Motor vehicles |
— | 56 | ||||||
Total |
4,870 | 5,053 | ||||||
Accumulated depreciation |
||||||||
Machinery |
3,200 | 2,426 | ||||||
Office equipment |
79 | 95 | ||||||
Motor vehicles |
— | 39 | ||||||
Total |
3,279 | 2,560 | ||||||
Carrying value |
||||||||
Machinery |
1,566 | 2,433 | ||||||
Office equipment |
25 | 43 | ||||||
Motor vehicles |
— | 17 | ||||||
Total |
1,591 | 2,493 | ||||||
24
Table of Contents
Liabilities
| As of March 31 | ||||||||
| (in thousands of US dollars) | 2010 | 2009 | ||||||
Liabilities |
6,249 | 7,670 | ||||||
Current liabilities |
1,994 | 3,415 | ||||||
Long-term liabilities |
4,255 | 4,255 | ||||||
Our total liabilities as of March 31, 2010 were US$6,249,000, which consisted of US$1,994,000 in
current liabilities and US$4,255,000 in long-term liabilities.
Long-term liabilities amounted to US$4,255,000 as of March 31, 2010, all of which were liabilities
due to shareholders.
Liquidity and Capital Resources
For the fiscal year ended March 31, 2010, we principally engaged in provision of design solutions
of wireless communication devices and sales of mobile phone components. We did not declare or pay
dividends in the fiscal year ended March 31, 2010.
Cash and cash equivalents decreased from US$20,493,000 to US$703,000 as of March 31, 2010.
For the year ended March 31 2010, US$19,949,000 was used in operating activities and US$14,000 was
provided by investing activities and US$142,000 was provided by financing activities. Cash and cash
equivalents decreased by US$19,790,000 to US$703,000 as of March 31, 2010 from US$20,493,000 as of March
31, 2009.
We used US$19, 949,000 in operating activities for the year ended March 31, 2010, as compared to
US$3,987,000 for the last fiscal year. Net cash used in operating activities for the year ended March
31, 2010 related to net loss adjusted for items not involving movement of cash for the period,
augmented mainly by the increase in accounts receivable of US$21,691,000.
In arriving at the net loss, we made an allowance of US$6,227,000 for doubtful receivables for the
year ended March 31, 2010, which did not involve any outflow of cash.
Net cash provided by investing activities amounted to US$14,000 for the year ended March 31, 2010,
compared to net cash used of US$1,000 for the last fiscal year. Cash provided by investing activities
for the year ended March 31, 2010 was mainly proceeds from the sale of property, plant and
equipment.
For the year ended March 31, 2010, net cash provided by financing activities was approximately
US$142,000, compared to net cash provided of US$78,000 for the last fiscal year. For the year ended
March 31, 2010, net cash flow provided by financing activities related primarily to the increase in
advances from a shareholder.
25
Table of Contents
As of March 31, 2010, we had capital commitments of US$38,000 in relation to acquisition of
intangible assets.
We believe that proceeds from the collection of our long-outstanding accounts and other
receivables are necessary to support our operations and capital commitments, as well as to meet
our working capital needs for the next twelve months. While we believe that adequate provisions on
our accounts receivable and other receivables have been made, we cannot assure investors that their
carrying amount (net of provision) will be received in full within the anticipated time frame. A
failure to collect the anticipated amount within the anticipated time frame would adversely affect
our liquidity and capital resources.
Critical Accounting Policies
The financial statements are prepared in accordance with accounting principles generally accepted
in the U.S., which requires us to make estimates and assumptions in certain circumstances that
affect amounts reported in the accompanying financial statements and related footnotes. In
preparing these financial statements, management has made its best estimates and judgments of
certain amounts included in the financial statements, giving consideration to materiality. We do
not believe there is a great likelihood that materially different amounts would be reported related
to the accounting policies described below. However, application of these accounting policies
involves the exercise of judgment and use of assumptions as to future uncertainties and, as a
result, actual results could differ from these estimates.
Revenue Recognition
Our revenues are mainly derived from design fees of mobile handset design services and sales of
mobile phone components. We earn our revenue mainly through NRE fees, royalties, and sales of
products.
NRE fee. NRE fees stands for Non Refundable Engineering fees, a fixed one-off fee after an
agreement has been signed by both the customer and the Company. The NRE fees are no less than the
total expenses of project design which normally includes the cost of market study, product concept
identification, hardware designs, software designs, engineer expenses, mechanical engineering
designs, testing and quality assurance, pilot production and production support. The NRE fees are
recognized when payments are received.
Royalty. In addition to NRE fees, we also charge royalties to our customers. Royalty is calculated
at an agreed rate for each unit manufactured or sold by our customers. The rate is variable based
on volume of mobile handsets manufactured or sold. Royalty income is recognized when confirmation
of manufacturing or selling volume is obtained from customers.
Component sales. Revenue from sales of components including but not limited to PCBAs, PCBs and
wireless modules is recognized when title passes to the customers, which is generally when products
are delivered to them.
Allowance for doubtful receivables
The Group recognizes an allowance for doubtful receivables to ensure accounts and other receivable
are not overstated due to uncollectibility. Allowance for doubtful receivables is maintained for
all customers based on a variety of factors, including the length of time the receivables are past
due, significant one-time events and historical experience. An additional allowance for individual
accounts is recorded when the Group becomes aware of a customer’s or other debtor’s inability to
meet its financial obligation, such as in the case of bankruptcy filings or deterioration in the
customer’s or other debtor’s operating results or financial position. If circumstances related to
customers or debtors change, estimates of the recoverability of receivables would be further
adjusted.
26
Table of Contents
| Item 8. | Financial Statements and Supplementary Data. |
T-BAY HOLDINGS, INC. AND SUBSIDIARIES
INDEX TO CONSOLIDATED FINANCIAL STATEMENTS
INDEX TO CONSOLIDATED FINANCIAL STATEMENTS
| F-1 | ||||
| F-2 | ||||
| F-3 | ||||
| F-4 | ||||
| F-5 – F-6 | ||||
| F-7 – F-19 |
27
Table of Contents
REPORT OF INDEPENDENT REGISTERED PUBLIC ACCOUNTING FIRM
The Board of Directors and Stockholders of
T-Bay Holdings, Inc.
T-Bay Holdings, Inc.
We have audited the accompanying consolidated balance sheets of T-Bay Holdings, Inc. and
subsidiaries (the “Company”) as of March 31, 2010 and 2009, and the related consolidated statements
of operations and comprehensive income, changes in equity, and cash flows for each of the two years
in the period ended March 31, 2010. These consolidated financial statements are the responsibility
of the Company’s management. Our responsibility is to express an opinion on these consolidated
financial statements based on our audits.
We conducted our audits in accordance with the standards of the Public Company Accounting Oversight
Board (United States). Those standards require that we plan and perform the audit to obtain
reasonable assurance about whether the consolidated financial statements are free of material
misstatement. The Company is not required to have, nor were we engaged to perform, an audit of its
internal control over financial reporting. Our audit included consideration of internal control
over financial reporting as a basis for designing audit procedures that are appropriate in the
circumstances, but not for the purposes of expressing an opinion on the effectiveness of the
Company’s internal control over financial reporting. Accordingly, we express no such opinion. An
audit includes examining, on a test basis, evidence supporting the amounts and disclosures in the
consolidated financial statements. An audit also includes assessing the accounting principles used
and significant estimates made by management, as well as evaluating the overall financial statement
presentation. We believe that our audits provide a reasonable basis for our opinion.
In our opinion, the consolidated financial statements referred to above present fairly, in all
material respects, the consolidated financial position of the Company as of March 31, 2010 and 2009
and the results of its operations and cash flows for each of the two years in the period then ended
in conformity with accounting principles generally accepted in the United States of America.
/s/ Moore Stephens
Certified Public Accountants
Hong Kong
Hong Kong
June 29, 2010
F-1
Table of Contents
T-BAY HOLDINGS, INC. AND SUBSIDIARIES
CONSOLIDATED BALANCE SHEETS
March 31, 2010 and 2009
(In thousands of United States dollars)
(In thousands of United States dollars)
| Note(s) | MARCH 31, | |||||||||
| 2010 | 2009 | |||||||||
ASSETS |
||||||||||
CURRENT ASSETS |
||||||||||
Cash and cash equivalents |
US$ | 703 | US$ | 20,493 | ||||||
Notes receivable |
10 | 37 | ||||||||
Accounts receivable, net |
3, 7 | — | 14,361 | |||||||
Prepayments, deposits and other receivables, net |
3, 7 | 12,517 | 13,694 | |||||||
Total current assets |
13,230 | 48,585 | ||||||||
PROPERTY, PLANT AND EQUIPMENT, NET |
4 | 1,591 | 2,493 | |||||||
ACCOUNTS RECEIVABLE, NET |
2(m), 7 | 28,493 | — | |||||||
INTANGIBLE ASSETS, NET |
5 | 42 | 65 | |||||||
ASSETS OF DISCONTINUED OPERATIONS |
12 | — | 724 | |||||||
TOTAL ASSETS |
US$ | 43,356 | US$ | 51,867 | ||||||
LIABILITIES AND STOCKHOLDERS’ EQUITY |
||||||||||
CURRENT LIABILITIES |
||||||||||
Accounts payable |
US$ | 155 | US$ | 466 | ||||||
Accruals and other payables |
||||||||||
Related parties |
9 | 437 | 285 | |||||||
Third parties |
1,259 | 1,412 | ||||||||
Receipts in advance |
143 | 990 | ||||||||
Income taxes payable |
— | 262 | ||||||||
Total current liabilities |
1,994 | 3,415 | ||||||||
LONG-TERM LIABILITIES |
||||||||||
Due to shareholders |
9 | 4,255 | 4,255 | |||||||
Total liabilities |
6,249 | 7,670 | ||||||||
COMMITMENTS AND CONTINGENCIES |
11 | |||||||||
STOCKHOLDERS’ EQUITY |
||||||||||
Preferred stock, authorized 10,000,000 shares, par value
US$0.001, issued and outstanding Nil |
2(p) | — | — | |||||||
Common stock, authorized 100,000,000 shares, par value US$0.001, issued and outstanding 30,088,174 |
30 | 30 | ||||||||
Additional paid-in capital |
1,462 | 1,462 | ||||||||
Public welfare fund |
2,109 | 2,109 | ||||||||
Statutory surplus fund |
4,219 | 4,219 | ||||||||
Retained earnings |
21,795 | 28,303 | ||||||||
Accumulated other comprehensive income |
5,830 | 5,806 | ||||||||
Total stockholders’ equity |
35,445 | 41,929 | ||||||||
NON-CONTROLLING INTEREST |
1,662 | 2,268 | ||||||||
TOTAL EQUITY |
37,107 | 44,197 | ||||||||
TOTAL LIABILITIES AND STOCKHOLDERS’ EQUITY |
US$ | 43,356 | US$ | 51,867 | ||||||
The accompanying notes are an integral part of these consolidated financial statements.
F-2
Table of Contents
T-BAY HOLDINGS, INC. AND SUBSIDIARIES
CONSOLIDATED STATEMENTS OF OPERATIONS AND COMPREHENSIVE INCOME
For the years ended March 31, 2010 and 2009
(In thousands of United States dollars, except per share data)
(In thousands of United States dollars, except per share data)
| Note(s) | YEAR ENDED MARCH 31, | |||||||||
| 2010 | 2009 | |||||||||
NET REVENUE |
2(m), 7 | US$ | 35,867 | US$ | 34,838 | |||||
COST OF REVENUE |
34,930 | 24,440 | ||||||||
GROSS PROFIT |
937 | 10,398 | ||||||||
OPERATING EXPENSES |
||||||||||
Selling expenses |
129 | 245 | ||||||||
General and administrative expenses |
7,959 | 10,043 | ||||||||
Other operating expenses |
10 | — | 5,075 | |||||||
TOTAL OPERATING EXPENSES |
8,088 | 15,363 | ||||||||
LOSS FROM OPERATIONS |
(7,151 | ) | (4,965 | ) | ||||||
OTHER INCOME |
180 | 545 | ||||||||
GAIN ON DISPOSAL OF A SUBSIDIARY |
12 | 43 | — | |||||||
LOSS BEFORE INCOME TAX |
(6,928 | ) | (4,420 | ) | ||||||
INCOME TAX: CURRENT |
6 | (7 | ) | (1,900 | ) | |||||
NET LOSS FROM CONTINUING OPERATIONS |
(6,935 | ) | (6,320 | ) | ||||||
LESS: NET LOSS ATTRIBUTABLE TO NON-CONTROLLING INTEREST |
427 | 429 | ||||||||
NET LOSS ATTRIBUTABLE TO COMMON STOCKHOLDERS FROM CONTINUING OPERATIONS |
(6,508 | ) | (5,891 | ) | ||||||
LOSS FROM DISCONTINUED OPERATIONS |
12 | — | (2,822 | ) | ||||||
NET LOSS |
(6,508 | ) | (8,713 | ) | ||||||
OTHER COMPREHENSIVE INCOME |
||||||||||
Foreign currency translation adjustment |
24 | 953 | ||||||||
COMPREHENSIVE LOSS |
US$ | (6,484 | ) | US$ | (7,760 | ) | ||||
WEIGHTED AVERAGE NUMBER OF SHARES (in thousands) |
30,088 | 30,088 | ||||||||
LOSS PER SHARE ATTRIBUTABLE TO COMMON STOCKHOLDERS (in dollars) |
2(n) | |||||||||
- CONTINUING OPERATIONS |
(0.22 | ) | (0.20 | ) | ||||||
- DISCONTINUED OPERATIONS |
— | (0.09 | ) | |||||||
| (0.22 | ) | (0.29 | ) | |||||||
The accompanying notes are an integral part of these consolidated financial statements.
F-3
Table of Contents
T-BAY HOLDINGS, INC. AND SUBSIDIARIES
CONSOLIDATED STATEMENTS OF CHANGES IN EQUITY
For the years ended March 31, 2010 and 2009
(In thousands of United States dollars)
(In thousands of United States dollars)
| Accumulated other | Total | Non- | ||||||||||||||||||||||||||||||||||||||
| Common stock | Additional | Public | Statutory | Retained | comprehensive | stockholders’ | controlling | |||||||||||||||||||||||||||||||||
| No. of shares | paid-in capital | welfare fund | surplus fund | earnings | income | equity | interest | Total | ||||||||||||||||||||||||||||||||
Balance, March 31,
2008 |
30,088,174 | 30 | 1,462 | 2,109 | 4,219 | 37,016 | 4,853 | 49,689 | 2,657 | 52,346 | ||||||||||||||||||||||||||||||
Net loss |
— | — | — | — | — | (8,713 | ) | — | (8,713 | ) | (429 | ) | (9,142 | ) | ||||||||||||||||||||||||||
Repayment to
minority
shareholder |
— | — | — | — | — | — | — | — | 69 | 69 | ||||||||||||||||||||||||||||||
Foreign currency
translation
adjustment |
— | — | — | — | — | — | 953 | 953 | (29 | ) | 924 | |||||||||||||||||||||||||||||
Balance, March 31,
2009 |
30,088,174 | US$ | 30 | US$ | 1,462 | US$ | 2,109 | US$ | 4,219 | US$ | 28,303 | US$ | 5,806 | US$ | 41,929 | US$ | 2,268 | US$ | 44,197 | |||||||||||||||||||||
Net loss |
— | — | — | — | — | (6,508 | ) | — | (6,508 | ) | (427 | ) | (6,935 | ) | ||||||||||||||||||||||||||
Disposal of a
subsidiary |
— | — | — | — | — | — | — | — | (36 | ) | (36 | ) | ||||||||||||||||||||||||||||
Repayment to
minority
shareholder |
— | — | — | — | — | — | — | — | (10 | ) | (10 | ) | ||||||||||||||||||||||||||||
Foreign currency
translation
adjustment |
— | — | — | — | — | — | 24 | 24 | (133 | ) | (109 | ) | ||||||||||||||||||||||||||||
Balance, March 31,
2010 |
30,088,174 | US$ | 30 | US$ | 1,462 | US$ | 2,109 | US$ | 4,219 | US$ | 21,795 | US$ | 5,830 | US$ | 35,445 | US$ | 1,662 | US$ | 37,107 | |||||||||||||||||||||
The accompanying notes are an integral part of these consolidated financial statements.
F-4
Table of Contents
T-BAY HOLDINGS, INC. AND SUBSIDIARIES
CONSOLIDATED STATEMENTS OF CASH FLOWS
For the years ended March 31, 2010 and 2009
(In thousands of United States dollars)
(In thousands of United States dollars)
| Note(s) | FOR THE YEAR ENDED MARCH 31, | |||||||||
| 2010 | 2009 | |||||||||
CASH FLOWS FROM OPERATING ACTIVITIES |
||||||||||
Net loss from continuing operations |
US$ | (6,935 | ) | US$ | (6,320 | ) | ||||
Adjustments to reconcile net income to net cash
generated from operating activities: |
||||||||||
Depreciation |
874 | 933 | ||||||||
Amortization |
23 | 37 | ||||||||
Gain on disposal of subsidiary |
12 | (43 | ) | — | ||||||
Loss on disposal of property, plant and equipment |
17 | 44 | ||||||||
Allowance for doubtful receivables |
6,227 | 8,077 | ||||||||
Reversal of allowance for obsolete inventories |
— | (370 | ) | |||||||
Changes in operating assets and liabilities: |
||||||||||
Decrease/(increase) in notes receivable |
27 | (37 | ) | |||||||
Increase in accounts receivable |
(21,691 | ) | (2,201 | ) | ||||||
Decrease/(increase) in prepayments, deposits and other receivables |
3,134 | (2,387 | ) | |||||||
Decrease in inventories |
— | 612 | ||||||||
Decrease in accounts payable |
(312 | ) | (222 | ) | ||||||
(Decrease) / increase in accruals and other payables |
(154 | ) | 255 | |||||||
Decrease in receipts in advance |
(847 | ) | (1,108 | ) | ||||||
Decrease in income tax payable |
(269 | ) | (1,254 | ) | ||||||
Operating cash flows used in operating activities |
(19,949 | ) | (3,941 | ) | ||||||
Operating cash flows provided by discontinued operations |
— | (46 | ) | |||||||
Net cash used in operating activities |
(19,949 | ) | (3,987 | ) | ||||||
CASH FLOWS FROM INVESTING ACTIVITIES |
||||||||||
Acquisition of property, plant and equipment |
— | (1 | ) | |||||||
Proceeds from disposal of property, plant and equipment |
14 | — | ||||||||
Net cash flows provided by/(used in) investing
activities |
14 | (1 | ) | |||||||
Net cash flows provided by investing activities of discontinued operations, (including proceeds from sale of a subsidiary, net of cash at date of sale) |
— | 364 | ||||||||
Net cash provided by investing activities |
14 | 363 | ||||||||
CASH FLOWS FROM FINANCING ACTIVITIES |
||||||||||
Repayment of cash advance to the minority
shareholder |
(10 | ) | — | |||||||
Cash advance from shareholders |
152 | 78 | ||||||||
Net cash flows provided by financing activities |
142 | 78 | ||||||||
Effect of exchange rate changes on cash |
3 | 685 | ||||||||
F-5
Table of Contents
T-BAY HOLDINGS, INC. AND SUBSIDIARIES
CONSOLIDATED STATEMENTS OF CASH FLOWS (continued)
For the years ended March 31, 2010 and 2009
(In thousands of United States dollars)
(In thousands of United States dollars)
| Note(s) | FOR THE YEAR ENDED MARCH 31, | |||||||||||
| 2010 | 2009 | |||||||||||
Net decrease in cash and cash equivalents |
(19,790 | ) | (2,861 | ) | ||||||||
Cash and cash equivalents at beginning of year |
20,493 | 23,355 | ||||||||||
Cash and cash equivalents at end of year (including cash of discontinued operations of US$nil and US$1,000, respectively) |
US$ | 703 | US$ | 20,494 | ||||||||
SUPPLEMENTAL INFORMATION |
||||||||||||
Income taxes paid |
US$ | 269 | US$ | 3,188 | ||||||||
The accompanying notes are an integral part of these consolidated financial statements.
F-6
Table of Contents
T-BAY HOLDINGS, INC. AND SUBSIDIARIES
NOTES TO CONSOLIDATED FINANCIAL STATEMENTS
MARCH 31, 2010 and 2009
1. The Company and Subsidiaries
T-Bay Holdings, Inc. (the “Company” or T-Bay) was incorporated under the laws of the State of Utah
on August 8, 1984 as “Sharus Corporation” with authorized common stock of 50,000,000 shares with a
par value of US$0.001. On June 13, 1989, the domicile of the Company was changed to the state of
Nevada in connection with a name change to “Golden Quest, Inc.”. On January 7, 2002, the name was
changed to “T-Bay Holdings, Inc.” as part of a reverse stock split of 400 shares of outstanding
stock for one share and on November 23, 2004, the Company increased the authorized common stock to
100,000,000 shares with a par value of US$0.001 as part of a reverse stock split of 20 outstanding
shares for one share.
On August 16, 2005, pursuant to an Agreement and Plan of Reorganization, T-Bay issued 18,550,000
shares of its common stock for all of Amber Link International Limited’s (“Amber Link”) and Wise
Target International Limited’s (“Wise Target”) outstanding shares of common stock (the “Merger”).
Amber Link and Wise Target were two of the owners of Shanghai Sunplus Communication Technology Co.,
Ltd. (“Sunplus”). Wise Target owned a 75% interest and Amber Link owned a 20% interest in Sunplus.
After the Merger, T-Bay indirectly owned a 95% interest in Sunplus. In March 2009, Wise Target
transferred all its holdings (75%) in Sunplus to Amber Link for US$2,885,000 (HK$22,500,000). As a
result of this transaction, Amber Link directly owned 95% of Sunplus and this transaction had no
impact on the Company’s effective holdings of Sunplus. Shanghai Fanna Industrial Design Co., Ltd.
owned the remaining 5% interest in Sunplus. On November 25, 2009, the Company transferred all its
holdings (100%) in Amber Link to Wise Target for US$2,600. As a result of the transaction, the
Company indirectly holds Amber Link and this transaction had no impact on the Company’s effective
holdings of Amber Link and Sunplus.
Wise Target was incorporated on April 24, 2002 under the International Business Companies Act in
the British Virgin Islands.
Amber Link was incorporated on May 10, 2002 under the International Business Companies Act in the
British Virgin Islands. During the year ended March 31, 2007, Amber Link commenced the sales of
mobile phones and components.
Sunplus was established on October 17, 2002 under the laws of the People’s Republic of China
(“PRC”) as a Sino-foreign joint venture specialized in the development, production and sales of
electronic telecommunication devices. Sunplus commenced operations on May 1, 2003. At March 31,
2010, Sunplus has approximately 80 staff, mostly engineers and software programmers.
On February 12, 2007, Sunplus established a wholly-owned subsidiary, Zhangzhou JiaXun Communication
Facility Co., Ltd. (“Zhangzhou JiaXun”) under the laws of the PRC. Zhangzhou JiaXun is an
investment holding company.
On March 19, 2007, Sunplus and Zhangzhou JiaXun acquired 80% and 20%, respectively, of Fujian
Qiaoxing Industry Co., Ltd. (“Fujian Qiaoxing”).
On March 20, 2009, Sunplus disposed of its 80% interest in Fujian Qiaoxing to Qiaoxing
Telecommunication Industry Company Limited (“QiaoXing Telecom”), a third party, at a consideration
of US$12,230,000 (RMB84,000,000) (See Note 12).
On April 9, 2009, Sunplus disposed of Zhangzhou JiaXun to QiaoXing Telecom at a consideration of
US$731,000 (RMB5,000,000) (See Note 12).
F-7
Table of Contents
T-BAY HOLDINGS, INC. AND SUBSIDIARIES
NOTES TO CONSOLIDATED FINANCIAL STATEMENTS (continued)
MARCH 31, 2010 and 2009
NOTES TO CONSOLIDATED FINANCIAL STATEMENTS (continued)
MARCH 31, 2010 and 2009
1. The Company and Subsidiaries (continued)
As of March 31, 2010, the Group structure is as follows:-
2. Summary of Significant Accounting Policies
(a) Basis of Preparation
The consolidated financial statements for the two years ended March 31, 2010 and 2009 included the
financial statements of T-Bay and its subsidiaries (hereinafter, referred to collectively as the
“Group”) and are prepared in conformity with accounting principles generally accepted in the United
States of America (US GAAP). All significant inter-company balances and transactions have been
eliminated on consolidation.
F-8
Table of Contents
T-BAY HOLDINGS, INC. AND SUBSIDIARIES
NOTES TO CONSOLIDATED FINANCIAL STATEMENTS (continued)
MARCH 31, 2010 and 2009
NOTES TO CONSOLIDATED FINANCIAL STATEMENTS (continued)
MARCH 31, 2010 and 2009
2. Summary of Significant Accounting Policies (continued)
(b) Basis of Consolidation
The consolidated balance sheet as of March 31, 2010 included T-Bay, Wise Target, Amber Link and
Sunplus. The consolidated balance sheet as of March 31, 2009 also included Zhangzhou JiaXun. As
mentioned in Note 1, Zhangzhou JiaXun was disposed of on April 9, 2009; therefore, the financial
position of Zhangzhou JiaXun has been presented as assets of discontinued operations as of March
31, 2009.
The consolidated statement of operations for the year ended March 31, 2010 included T-Bay, Wise
Target, Amber Link and Sunplus. The consolidated statement of operations for the year ended March
31, 2009 also included Fujian Qiaoxing and Zhangzhou JiaXun.
(c) Use of Estimates
In preparing financial statements in conformity with US GAAP, management is required to make
estimates and assumptions that affect the reported amounts of assets and liabilities and the
disclosure of contingent assets and liabilities at the date of the financial statements and
revenues and expenses during the reported periods. Significant estimates include useful lives of
depreciable and amortizable assets and allowance for doubtful receivables. Actual results could
differ from those estimates.
(d) Cash and Cash Equivalents
The Group considers all highly liquid investments with original maturities of three months or less
at the time of purchase to be cash equivalents. As of March 31, 2010 and 2009, the Group did not
have any cash equivalents.
(e) Allowance for Doubtful Receivables
The Group recognizes an allowance for doubtful receivables to ensure accounts and other receivable
are not overstated due to uncollectibility. Allowance for doubtful receivables is maintained for
all customers based on a variety of factors, including the length of time the receivables are past
due, significant one-time events and historical experience. An additional allowance for individual
accounts is recorded when the Group becomes aware of a customer’s or other debtor’s inability to
meet its financial obligation, such as in the case of bankruptcy filings or deterioration in the
customer’s or other debtor’s operating results or financial position. If circumstances related to
customers or debtors change, estimates of the recoverability of receivables would be further
adjusted (See Note 3).
(f) Property, Plant and Equipment
Property, plant and equipment is stated at cost. Depreciation is provided principally by use of the
straight-line method over the estimated useful lives of the related assets. Expenditure for
maintenance and repairs, which does not improve or extend the expected useful life of the assets,
is expensed to operations while major repairs are capitalized.
Management estimates that property, plant and equipment have a 10% residual value. The estimated
useful lives are as follows:
Machinery |
5 years | |||
Office equipment |
5 years | |||
Motor vehicles |
5 years | |||
The gain or loss on disposal of property, plant and equipment is the difference between the net
sales proceeds and the carrying amount of the relevant assets, and, if any, is recognized in the
statement of operations and comprehensive income.
F-9
Table of Contents
T-BAY HOLDINGS, INC. AND SUBSIDIARIES
NOTES TO CONSOLIDATED FINANCIAL STATEMENTS (continued)
MARCH 31, 2010 and 2009
NOTES TO CONSOLIDATED FINANCIAL STATEMENTS (continued)
MARCH 31, 2010 and 2009
2. Summary of Significant Accounting Policies (continued)
(g) Intangible Assets
Intangible assets consist of software and patents and are amortized using the straight-line method
over their estimated useful life of 5 years.
(h) Impairment of Long-Lived Assets
In accordance with Statement of Auditing Standards (“SFAS”) No. 144, “Accounting for Impairment or
Disposal of Long-Lived Assets”, which is now codified as Financial Accounting Standards Board
Accounting Standards Codification (“FASB ASC”) No. 360-10-35, the Group evaluates its long-lived
assets to determine whether later events and circumstances warrant revised estimates of useful
lives or a reduction in carrying value due to impairment. If indicators of impairment exist and if
the value of the assets is impaired, an impairment loss would be recognized. For the year ended
March 31, 2009, an impairment loss of US$4,000 has been recognized. No Impairment loss was
recognized in 2010.
(i) Income Taxes
The Group accounts for income taxes under SFAS No. 109, “Accounting for Income Taxes”, which is now
codified as FASB ASC No. 740. Under FASB ASC No. 740, deferred tax assets and liabilities are
recognized for the future tax consequences attributable to differences between the financial
statement carrying amounts of existing assets and liabilities and their respective tax bases.
Deferred tax assets and liabilities are measured using enacted tax rates expected to apply to
taxable income in the years in which those temporary differences are expected to be recovered or
settled. Under FASB ASC No. 740, the effect on deferred tax assets and liabilities of a change in
tax rates is recognized in income in the period that includes the enactment date.
The Group reviews the differences between the tax bases under PRC tax laws and financial reporting
under US GAAP. As of March 31, 2010 and 2009, no material differences were found; therefore, there
were no material deferred tax assets or liabilities arising from the operations of the subsidiaries
in the PRC.
FASB ASC No 740 clarifies the accounting for uncertainty in income taxes recognized in an
enterprise’s financial statements and it prescribes a recognition threshold and measurement
attributable for the financial statements recognition and measurement of a tax position taken or
expected to be taken in a tax return. FASB ASC No. 740 also provides guidance on derecognizing,
classification, interest and penalties, accounting in interim periods, disclosures and
transitions. Interest and penalties from tax assessments, if any, are included in general and
administrative expenses in the consolidated statements of operations and comprehensive income.
The Group recognizes that virtually all tax positions in the PRC are not free of some degree of
uncertainty due to tax law and policy changes by the PRC government. However, the Group cannot
reasonably quantify political risk factors and thus must depend on guidance issued by current PRC
government officials.
Based on all known facts and circumstances and current tax law, the Group believes that the total
amount of unrecognized tax benefits as of March 31, 2010 and 2009 is not material to its results of
operations, financial condition or cash flows. The Group also believes that the total amount of
unrecognized tax benefits as of March 31, 2010 and 2009, if recognized, would not have a material
effect on its effective tax rate. The Group further believes that there are no tax positions for
which it is reasonably possible, based on current Chinese tax law and policy, that the unrecognized
tax benefits will significantly increase or decrease over the next twelve months producing,
individually or in the aggregate, a material effect on the Group’s results of operations, financial
condition or cash flows.
Under current PRC tax laws, no tax is imposed in respect to distributions paid to owners except
individual income tax.
F-10
Table of Contents
T-BAY HOLDINGS, INC. AND SUBSIDIARIES
NOTES TO CONSOLIDATED FINANCIAL STATEMENTS (continued)
MARCH 31, 2010 and 2009
NOTES TO CONSOLIDATED FINANCIAL STATEMENTS (continued)
MARCH 31, 2010 and 2009
2. Summary of Significant Accounting Policies (continued)
(j) Revenue Recognition
Revenue from goods sold is recognized when title has passed to the purchaser, which generally is at
the time of delivery. Revenue from design services is recognized when earned on the basis of the
terms specified in the underlying contractual agreements.
(k) Research and Development Costs
Research and development costs consist of expenditure incurred during the course of planned
research and investigation aimed at discovery of new knowledge which will be useful for developing
new products or significantly enhancing existing products, and the implementation of such through
design and testing of product alternatives. All expenses incurred in connection with the Group’s
research and development activities are charged to current income. During the two years ended
March 31, 2010 and 2009, research and development costs amounting to nil and US$17,000,
respectively, were charged to the statement of operation and are included in cost of revenue.
(l) Foreign Currency Translation and Transactions
The functional currencies of the Group are U.S. dollars, Hong Kong dollars and Renminbi, and its
reporting currency is U.S. dollars. The Group’s balance sheet accounts are translated into U.S.
dollars at the year-end exchange rates and all revenue and expenses are translated into U.S.
dollars at the average exchange rates prevailing during the periods in which these items arise.
Translation gains and losses are deferred and accumulated as a component of other comprehensive
income in stockholders’ equity. Transaction gains and losses that arise from exchange rate
fluctuations from transactions denominated in a currency other than the functional currency are
included in the consolidated statement of operations as incurred.
The PRC government imposes significant exchange restrictions on fund transfers out of the PRC that
are not related to business operations. These restrictions have not had a material impact on the
Group because it has not engaged in any significant transactions that are subject to the
restrictions.
(m) Fair Value of Financial Instruments
SFAS No. 107, “Disclosures about Fair Values of Financial Instruments”, which is now codified as
FASB ASC No. 825, requires disclosing fair value to the extent practicable for financial
instruments that are recognized or unrecognized in the balance sheet. The fair value of the
financial instruments disclosed herein is not necessarily representative of the amount that could
be realized or settled, nor does the fair value amount consider the tax consequences of realization
or settlement.
For certain financial instruments, including cash, accounts, notes and other receivables, accounts
payable, accruals and other payables, it was assumed that the carrying amounts approximate fair
value because of the near term maturities of such obligations.
The long-term accounts receivable are discounted based on the future contractual cash flows at the
current market interest rate that is available to the Group for similar financial instruments of
5%. US$1,425,000 was debited to revenue accordingly.
F-11
Table of Contents
T-BAY HOLDINGS, INC. AND SUBSIDIARIES
NOTES TO CONSOLIDATED FINANCIAL STATEMENTS (continued)
MARCH 31, 2010 and 2009
NOTES TO CONSOLIDATED FINANCIAL STATEMENTS (continued)
MARCH 31, 2010 and 2009
2. Summary of Significant Accounting Policies (continued)
(m) Fair Value of Financial Instruments (continued)
The Group complies with FASB ASC No. 820 “Fair Value Measurements and Disclosures”. FASB ASC No.
820 clarifies the definition of fair value, prescribes methods for measuring fair value and
establishes a fair value hierarchy to classify the inputs used in measuring fair value as follows:
Level 1-Inputs are unadjusted quoted prices in active markets for identical assets or liabilities
available at the measurement date.
Level 2-Inputs are unadjusted quoted prices for similar assets and liabilities in active markets,
quoted prices for identical or similar assets and liabilities in markets that are not active,
inputs other then quoted prices that are observable, and inputs derived from or corroborated by
observable market data.
Level 3-Inputs are unobservable inputs which reflect the reporting entity’s own assumptions on what
assumptions the market participants would use in pricing the asset or liability based on the best
available information.
The Group currently does not have any balance sheet components deemed financial assets, and we do
not have any nonfinancial assets or liabilities of our continuing operations that have been marked
to fair value, however, our financial statements in the future may be impacted by this standard.
(n) Loss Per Share
Basic loss per share is computed by dividing the loss for the year by the weighted average number
of common shares outstanding for the year.
(o) Profit Appropriation
In accordance with PRC regulations, the PRC subsidiaries are required to make appropriations to the
statutory surplus reserve, based on after-tax net income determined in accordance with PRC GAAP.
Appropriation to the statutory surplus reserve should be at least 10% of the after-tax net income
determined in accordance with PRC GAAP until the reserve is equal to 50% of the entity’s registered
capital. Appropriations to the statutory public welfare fund and discretionary surplus reserve fund
are made on the same basis as statutory surplus fund, normally at 5%-10% or higher rates and are
generally optional at the discretion of the Board of Directors. Statutory surplus reserve is
non-distributable other than in liquidation.
(p) Preferred Stock
No shares of preferred stock have been issued or are outstanding. Dividends, voting rights and
other terms, rights and preferences of the preferred shares have not been designated but may be
designated by our board of directors from time to time.
3. Allowance for Doubtful Receivables
| MARCH 31, | ||||||||
| 2010 | 2009 | |||||||
| US$’000 | US$’000 | |||||||
Balance, beginning of year |
US$ | 9,202 | US$ | 1,125 | ||||
Additions |
6,227 | 8,077 | ||||||
Balance, end of year |
US$ | 15,429 | US$ | 9,202 | ||||
F-12
Table of Contents
T-BAY HOLDINGS, INC. AND SUBSIDIARIES
NOTES TO CONSOLIDATED FINANCIAL STATEMENTS (continued)
MARCH 31, 2010 and 2009
NOTES TO CONSOLIDATED FINANCIAL STATEMENTS (continued)
MARCH 31, 2010 and 2009
4. Property, Plant and Equipment, Net
| MARCH 31, | ||||||||
| 2010 | 2009 | |||||||
| US$’000 | US$’000 | |||||||
Cost |
||||||||
Machinery |
US$ | 4,766 | US$ | 4,859 | ||||
Office equipment |
104 | 138 | ||||||
Motor vehicles |
— | 56 | ||||||
| 4,870 | 5,053 | |||||||
Accumulated depreciation |
||||||||
Machinery |
3,200 | 2,426 | ||||||
Office equipment |
79 | 95 | ||||||
Motor vehicles |
— | 39 | ||||||
| 3,279 | 2,560 | |||||||
Carrying value |
||||||||
Machinery |
1,566 | 2,433 | ||||||
Office equipment |
25 | 43 | ||||||
Motor vehicles |
— | 17 | ||||||
| US$ | 1,591 | US$ | 2,493 | |||||
Depreciation expense for each of years ended March 31, 2010 and 2009 was approximately US$874,000
and US$975,000, respectively.
5. Intangible Assets, Net
Changes in the carrying amount of intangible assets for the years ended March 31, 2010 and 2009
were as follows:
| Software | Patent | Total | ||||||||||
| US$’000 | US$’000 | US$’000 | ||||||||||
Cost: |
||||||||||||
Balance, March 31, 2009 and 2010 |
US$ | 183 | US$ | 4 | US$ | 187 | ||||||
Less: Accumulated amortization
Balance, March 31, 2009 |
(119 | ) | (3 | ) | (122 | ) | ||||||
Amortization expenses |
(22 | ) | (1 | ) | (23 | ) | ||||||
Balance, March 31, 2010 |
(141 | ) | (4 | ) | (145 | ) | ||||||
Net balance, March 31, 2010 |
US$ | 42 | US$ | — | US$ | 42 | ||||||
The estimated amortization expense for the five years ending March 31, 2011, 2012, 2013, 2014 and
2015 amounts to approximately US$22,000, US$18,000, US$2,000, US$ nil and US$ nil, respectively.
F-13
Table of Contents
T-BAY HOLDINGS, INC. AND SUBSIDIARIES
NOTES TO CONSOLIDATED FINANCIAL STATEMENTS (continued)
MARCH 31, 2010 and 2009
NOTES TO CONSOLIDATED FINANCIAL STATEMENTS (continued)
MARCH 31, 2010 and 2009
6. Income Taxes
Amber Link and Wise Target are not subject to income taxes in any tax jurisdiction.
No provision for current income tax for T-Bay has been made as it incurred a loss for each of the
years ended March 31, 2010 and 2009, respectively.
Sunplus is subject to PRC Income Tax. Pursuant to the PRC Income Tax Laws, the prevailing statutory
rate of enterprise income tax is 25%.
Zhangzhou JiaXun and Fujian Qiaoxing were inactive during the year ended March 31, 2009 up to date
of disposal.
A reconciliation between taxes computed at the PRC statutory rate of 25% and the Group’s effective
tax rate is as follows:-
| YEAR ENDED MARCH 31, | ||||||||
| 2010 | 2009 | |||||||
| US$’000 | US$’000 | |||||||
Loss before income tax |
US$ | (6,928 | ) | US$ | (4,420 | ) | ||
Income benefit on pretax income at statutory rate |
(1,732 | ) | (1,105 | ) | ||||
Effect of different tax rates of Group company operating
in other jurisdictions |
382 | 142 | ||||||
Tax effect of non-deductible expenses |
862 | 334 | ||||||
Tax effect of non-taxable income |
— | (2 | ) | |||||
Change in valuation allowance |
488 | 2,531 | ||||||
Under-provision in prior year |
7 | — | ||||||
Income tax expense |
US$ | 7 | US$ | 1,900 | ||||
As of March 31, 2010, T-Bay had accumulated net operating loss carryforwards for United States
federal tax purposes of approximately US$649,000, that are available to offset future taxable
income. As of March 31, 2010, Sunplus had net operating loss carryforwards of approximately
US$2,949,000 that are available to offset future taxable income up to 2015. Realization of the net
operating loss carryforwards is dependent upon future profitable operations. In addition, the
carryforwards may be limited upon a change of control in accordance with Internal Revenue Code
Section 382, as amended. Accordingly, management has recorded a valuation allowance to reduce
deferred tax assets associated with the net operating loss carryforwards to zero at March 31, 2010.
T-Bay’s net operating loss carryforwards expire in years 2012 through 2030.
As of March 31, 2010, deferred tax assets consist of:-
| MARCH 31, | ||||||||
| 2010 | 2009 | |||||||
| US$’000 | US$’000 | |||||||
Net operating loss carryforwards |
US$ | 3,598 | US$ | 3,110 | ||||
Less: valuation allowance |
(3,598 | ) | (3,110 | ) | ||||
| US$ | — | US$ | — | |||||
F-14
Table of Contents
T-BAY HOLDINGS, INC. AND SUBSIDIARIES
NOTES TO CONSOLIDATED FINANCIAL STATEMENTS (continued)
MARCH 31, 2010 and 2009
NOTES TO CONSOLIDATED FINANCIAL STATEMENTS (continued)
MARCH 31, 2010 and 2009
7. Concentrations and Credit Risk
The Group operates principally in the PRC (including Hong Kong) and grants credit to its customers
in this geographic region. Although the PRC is economically stable, it is always possible that
unanticipated events in foreign countries could disrupt the Group’s operations.
Financial instruments that potentially subject the Group to a concentration of credit risk consist
of cash, accounts and other receivables.
As of March 31, 2010 and 2009, the Group had credit risk exposure of uninsured cash in banks of
approximately US$703,000 and US$20,494,000, respectively.
As of March 31, 2010 and 2009, the Group had credit risk exposure of sales proceeds receivable from
Qiaoxing Telecom of approximately US$10,475,000 and US$11,928,000, respectively. (See Note 1)
Pursuant to the agreement signed between Sunplus and Qiaoxing Telecom in respect of the disposal of
Fujian Qiaoxing to Qiaoxing Telecom in March 2009, Qiaoxing Telecom was to settle this outstanding
balance by June 2009. However, Qiaoxing Telecom was unable to obtain approval from the local
governmental bureau in Zhangzhou to develop the land held by Fujian Qiaoxing. This was due to the
delay in development by Fujian Qiaoxing. When the Zhangzhou local government granted the land use
right to Fujian Qiaoxing in 2006, Fujian Qiaoxing was required to develop the land within three
years. However, the land had not been developed prior to the disposal to Qiaoxing Telecom and the
local authorities have refused to approve the development plans submitted by Qiaoxing Telecom.
Recently, the Company has actively liaised with the Zhangzhou local governmental bureau to apply
for an extension of the land development. Based on this contact, the Company, in conjunction with
its legal counsel, has made its initial assessment of the situation and concluded that it is more
likely than not that the Zhangzhou local government bureau will provide an extension for developing
the land and Qiaoxing Telecom can honor the agreement and settle the balance due to Sunplus.
Accordingly, no allowance has been made in respect of the sales proceeds receivable from QiaoXing
Telecom of US$10,475,000.
A substantial portion of revenue was generated from one group of customers for the years ended
March 31, 2010 and 2009.
The net sales to customers representing at least 10% of net total sales are as follows:-
| YEAR ENDED MARCH 31, | ||||||||||||||||
| 2010 | 2009 | |||||||||||||||
| US$’000 | % | US$’000 | % | |||||||||||||
Customer A |
7,453 | 21 | 2,708 | 8 | ||||||||||||
Customer B |
5,710 | 16 | 1,734 | 5 | ||||||||||||
Customer C |
4,501 | 13 | 1,258 | 4 | ||||||||||||
Customer D* |
4,066 | 11 | 848 | 3 | ||||||||||||
Customer E* |
3,816 | 11 | 2,603 | 7 | ||||||||||||
Customer F |
3,898 | 11 | 479 | 1 | ||||||||||||
Customer G |
3,721 | 10 | 6,951 | 20 | ||||||||||||
Customer H |
— | — | 6,945 | 20 | ||||||||||||
Customer I |
— | — | 6,251 | 18 | ||||||||||||
Customer Group A* |
7,882 | 22 | 3,451 | 10 | ||||||||||||
F-15
Table of Contents
T-BAY HOLDINGS, INC. AND SUBSIDIARIES
NOTES TO CONSOLIDATED FINANCIAL STATEMENTS (continued)
MARCH 31, 2010 and 2009
NOTES TO CONSOLIDATED FINANCIAL STATEMENTS (continued)
MARCH 31, 2010 and 2009
7. Concentrations and Credit Risk (continued)
The following customers had balances greater than 10% of the total accounts receivable as of March
31, 2010 and March 31, 2009:
| MARCH 31, 2010 | MARCH 31, 2009 | |||||||||||||||
| US$’000 | % | US$’000 | % | |||||||||||||
Customer A |
8,248 | 19 | 3,505 | 16 | ||||||||||||
Customer B |
6,846 | 16 | 3,219 | 14 | ||||||||||||
Customer E* |
4,731 | 11 | 2,551 | 11 | ||||||||||||
Customer G |
4,497 | 11 | 2,241 | 10 | ||||||||||||
Customer H |
2,025 | 5 | 2,808 | 13 | ||||||||||||
Customer J |
3,917 | 9 | 2,762 | 12 | ||||||||||||
Customer group A* |
8,499 | 20 | 3,261 | 15 | ||||||||||||
| * | Customer Group A includes customers D and E. | |
At March 31, 2010 and March 31, 2009, this group of customers accounted for 20% and 15%,
respectively, of accounts receivable.
The accounts receivable that have repayment terms of more than
twelve months have been discounted (See Note 2(m)).
The Group does not require collateral to support financial instruments that are
subject to credit risk.
8. Retirement and Welfare Benefits
The full-time employees of the PRC subsidiaries are entitled to staff welfare benefits including
medical care, casualty, housing benefits, education benefits, unemployment insurance and pension
benefits through a PRC government-mandated multi-employer defined contribution plan. The PRC
subsidiaries are required to accrue the employer-portion for these benefits based on certain
percentages of the employees’ salaries. The total provision for such employee benefits was
US$164,000 and US$189,000 for the years ended March 31, 2010 and 2009, respectively. The PRC
subsidiaries are required to make contributions to the plans out of the amounts accrued for all
staff welfare benefits except for education benefits. The PRC government is responsible for the
staff welfare benefits including medical care, casualty, housing benefits, unemployment insurance
and pension benefits to be paid to these employees.
9. Related Party Transactions
The Group engages in business transactions with the following related parties:
a. Li Xiaofeng, a director and stockholder of T-Bay.
b. Li Meilian, a stockholder of T-Bay.
a. Li Xiaofeng, a director and stockholder of T-Bay.
b. Li Meilian, a stockholder of T-Bay.
The Group has the following transactions and balances with related parties:-
| MARCH 31,2010 | MARCH 31, 2009 | |||||||
| US$’000 | US$’000 | |||||||
Other payable — Li Meilian |
US$ | 437 | US$ | 285 | ||||
Long-term liabilities |
||||||||
Other payable — Li Meilian |
US$ | 3,482 | US$ | 3,482 | ||||
Other payable — Li Xiaofeng |
773 | 773 | ||||||
| US$ | 4,255 | US$ | 4,255 | |||||
The balances have no stated terms for repayment, are not interest bearing, and are the result of
cash advances from related parties and the repayment thereof. Those payables to Li Meilian and Li
Xiaofeng which are classified as long-term liabilities are not repayable within the next twelve
months.
F-16
Table of Contents
T-BAY HOLDINGS, INC. AND SUBSIDIARIES
NOTES TO CONSOLIDATED FINANCIAL STATEMENTS (continued)
MARCH 31, 2010 and 2009
NOTES TO CONSOLIDATED FINANCIAL STATEMENTS (continued)
MARCH 31, 2010 and 2009
10. Other Operating Expenses
Other operating expenses for the year ended March 31, 2009 represented compensation of US$5,075,000
(2010: US$nil) to two customers to compensate them for subcontracting fees and raw materials consumed
for two defectively designed mobile phone printed circuit board accessories.
11. Commitments and Contingencies
| a. | As of March 31, 2010, Sunplus leased office premises and staff quarters under several agreements expiring from 2010 to 2012. |
Rental expenses for the years ended March 31, 2010 and 2009 amounted to US$ 91,000 and US$ 246,000
respectively, and are included in general and administrative expenses in the consolidated
statements of operations and comprehensive income.
The future minimum lease payments under the above-mentioned leases as of March 31, 2010 are as
follows:-
| Year Ending March 31, | US$’000 | |||
2011 |
US$ | 58 | ||
2012 |
38 | |||
Total |
US$ | 96 | ||
| b. | As of March 31, 2010, the Group had capital commitments in relation to acquisition of intangible assets of US$38,000. |
12. Discontinued Operations
On December 31, 2008, Sunplus entered into an agreement with Huizhou Liyin Electronics Co., Ltd.
(“Huizhou Liyin”) to dispose of, among other things, its 100% interest in Zhangzhou JiaXun for
RMB5,000,000 (US$733,000). However, on March 10, 2009, pursuant to a supplemental agreement
between Sunplus and Huizhou Liyin, Huizhou Liyin and Sunplus rescinded the original agreement. On
the same date, Sunplus entered into another agreement with Qiaoxing Telecom to dispose of, among
other things, its interest in Zhangzhou JiaXun at a consideration of RMB5,000,000 (US$724,000). As
of March 31, 2009, the net assets of discontinued operations amounted to US$728,000. An impairment
loss of US$4,000 was recognized.
On March 20, 2009, Sunplus disposed of its 80% interest in its subsidiary Fujian QiaoXing to
Qiaoxing Telecom for a consideration of RMB84,000,000 (US$12,230,000). (See Note 1)
The following table summarises the result of these discontinued operations, net of income taxes for
the year ended March 31, 2009.
a) Discontinued Operations (Fujian Qiaoxing and Zhangzhou Jiaxun)
| 2009 | ||||
| US$’000 | ||||
Other revenue |
US$ | 2 | ||
Operating loss |
90 | |||
Loss on disposal of Fujian Qiaoxing |
2,730 | |||
Impairment loss on assets of discontinued operations |
4 | |||
Net loss |
US$ | 2,822 | ||
F-17
Table of Contents
T-BAY HOLDINGS, INC. AND SUBSIDIARIES
NOTES TO CONSOLIDATED FINANCIAL STATEMENTS (continued)
MARCH 31, 2010 and 2009
NOTES TO CONSOLIDATED FINANCIAL STATEMENTS (continued)
MARCH 31, 2010 and 2009
12. Discontinued Operations (continued)
a) Discontinued Operations (Fujian Qiaoxing and Zhangzhou JiaXun)
The carrying values of the assets of Zhangzhou JiaXun classified as held for sale as at March 31,
2009 were as follows:
| MARCH 31, 2009 | ||||
| US$’000 | ||||
Investment at cost |
US$ | 585 | ||
Deposits and other receivables |
83 | |||
Due from minority shareholder |
59 | |||
Cash and bank balances |
1 | |||
| 728 | ||||
Impairment |
(4 | ) | ||
Assets of discontinued operations |
US$ | 724 | ||
b) Disposal of a subsidiary
On April 9, 2009, Sunplus disposed of its 100% interest in Zhangzhou JiaXun to Qiaoxing Telecom at
a consideration of US$731,000 (RMB5,000,000) (See Note 1).
| APRIL 9, 2009 | ||||
| US$’000 | ||||
Net assets disposed:- |
||||
Investment at cost |
US$ | 585 | ||
Other receivables |
83 | |||
Due from minority shareholder |
59 | |||
Cash and bank balances |
1 | |||
Net assets disposed |
728 | |||
Impairment |
(4 | ) | ||
Assets of discontinued operations |
724 | |||
Less: Non-controlling interest — 5% |
(36 | ) | ||
Assets held by the Group |
688 | |||
Consideration to be satisfied by cash |
731 | |||
Gain on disposal of a subsidiary |
US$ | 43 | ||
An analysis of the net inflow of cash and cash equivalents in respect of the disposal of Zhangzhou
JiaXun is as follows:-
| US$’000 | ||||
Cash and bank balances disposed |
US$ | (1 | ) | |
Cash consideration received |
731 | |||
Net cash inflow |
US$ | 730 | ||
F-18
Table of Contents
T-BAY HOLDINGS, INC. AND SUBSIDIARIES
NOTES TO CONSOLIDATED FINANCIAL STATEMENTS (continued)
MARCH 31, 2010 and 2009
NOTES TO CONSOLIDATED FINANCIAL STATEMENTS (continued)
MARCH 31, 2010 and 2009
13. New Accounting Pronouncements
In June 2009, the FASB issued ASC No. 105 (Prior authoritative guidance: SFAS No. 168 “The FASB
Accounting Standards Codification TM and the Hierarchy of Generally Accepted Accounting Principles,
a replacement of FASB Statement No. 162”), which establishes the FASB Accounting Standards
Codification as the source of authoritative accounting principles recognized by the FASB to be
applied in the preparation of financial statements in conformity with generally accepted accounting
principles. FASB ASC No. 105 explicitly recognizes rules and interpretive releases of the
Securities and Exchange Commission (“SEC”) under federal securities laws as authoritative GAAP for
SEC registrants. ASC No. 105 is effective for the current year. Adoption of FASB ASC No. 105 did
not have a material impact on the Company’s consolidated financial statements.
In December 2007, the Financial Accounting Standards Board (“FASB”) issued SFAS No. 160,
“Noncontrolling Interests in Consolidated Financial Statements — an amendment of ARB No. 51” (“SFAS
No. 160”), which is now codified as FASB ASC No. 815. FASB ASC No. 815 requires that a
noncontrolling interest in a subsidiary be reported as equity and the amount of consolidated net
income specifically attributable to the noncontrolling interest be identified in the consolidated
financial statements. It also calls for consistency in the manner of reporting changes in the
parent’s ownership interest and requires fair value measurement of any noncontrolling equity
investment retained in a deconsolidation. FASB ASC No. 815 is effective for fiscal years, and
interim periods within those fiscal years, beginning on or after December 15, 2008. Accordingly,
minority interest has been renamed noncontrolling interest, net loss is reported at amounts that
include the amounts attributable to both noncontrolling interests and common stockholders for all
period presented. In addition, noncontrolling interest has been reported as a component of equity
in the consolidated balance sheets and consolidated statements of changes in equity for all periods
presented. The Company has retrospectively applied the presentation to its prior year balances in
the consolidated financial statements.
In December 2007, the FASB issued ASC No. 815 (Prior authoritative guidance: FASB issued SFAS 141
(revised 2007), Business Combinations (ASC 815). ASC No. 815 amends and clarifies the accounting
guidance for the acquirer’s recognition and measurement of assets acquired, liabilities assumed and
noncontrolling interests of an acquiree in a business combination. The adoption of ASC No. 815 had
no material effect on the Company’s consolidated financial statements.
In April 2008, the FASB issued ASC No. 350-30-35-1 (Prior authoritative guidance: FSP FAS No.
142-3, “Determination of the Useful Life of Intangible Assets”). ASC No. 350-30-35-1 amends the
factors that should be considered in developing renewal or extension assumptions used to determine
the useful life of a recognized intangible asset under ASC No. 350-30-35-1, Goodwill and Other
Intangible Assets. ASC No. 350-30-35-1 is intended to improve the consistency between the useful
life of an intangible asset and the period of expected cash flows used to measure the fair value of
the asset under other applicable accounting literature. ASC No. 350-30-35-1 is effective for fiscal
years beginning after December 15, 2008. Early adoption is prohibited. The adoption of ASC No.
350-30-35-1 had no material effect on the Company’s consolidated financial statements.
In May 2009, the FASB issued FASB ASC No. 855-10 (Prior authoritative guidance: SFAS No. 165,
“Subsequent Events”), which sets forth general standards of accounting for and disclosure of events
that occur after the balance sheet date but before financial statements are issued or are available
to be issued. ASC No. 855-10 is effective after June 15, 2009. The adoption of ASC No. 855-10 had
no material effect on the Company’s financial statements. Effective February 24, 2010, the Company
adopted FASB ASU No. 2010-09, “Subsequent Events (Topic 855) — Amendments to Certain Recognition
and Disclosure Requirements.” ASU 2010-09 requires an entity that is an SEC filer to evaluate
subsequent events through the date that the financial statements are issued and removes the
requirement that an SEC filer disclose the date through which subsequent events have been
evaluated.
The adoption of this ASU had no effect on the Company’s consolidated financial position or results
of operations.
F-19
Table of Contents
| Item 9. | Changes in and Disagreements With Accountants on Accounting and Financial Disclosure. |
None.
| Item 9A(T). | Controls and Procedures. |
(a) Evaluation of Disclosure Controls and Procedures
As of the end of the period covered by this report, we carried out an evaluation, under the
supervision and with the participation of our management, including our Chief Executive Officer
(“CEO”) and our Chief Financial Officer (“CFO”), of the effectiveness of the design and operation
of our disclosure controls and procedures, or “disclosure controls,” pursuant to Exchange Act Rule
13a-15(b). Disclosure controls are controls and procedures designed to reasonably ensure that
information required to be disclosed in our reports filed under the Exchange Act, such as this
annual report, is recorded, processed, summarized and reported within the time periods specified in
the U.S. Securities and Exchange Commission’s rules and forms. Disclosure controls include, without
limitation, controls and procedures designed to ensure that information required to be disclosed in
our reports filed under the Exchange Act is accumulated and communicated to our management,
including our CEO and CFO, or persons performing similar functions, as appropriate, to allow timely
decisions regarding required disclosure. Our disclosure controls include some, but not all,
components of our internal control over financial reporting. In making this evaluation, our
management considered the material weaknesses in our internal control over financial reporting and
the status of remediation as discussed below. Based upon that evaluation, our CEO and CFO concluded
that our disclosure controls and procedures were not effective as of March 31, 2010. However,
giving full consideration to the material weaknesses described below, we performed adequate
analyses and procedures, including among other things, transaction reviews and account
reconciliations, in order to provide assurance that our consolidated financial statements included
in this annual report were prepared in accordance with generally accepted accounting principles
(“GAAP”) and present fairly, in all material respects, our financial position, results of
operations and cash flows for the periods presented in conformity with GAAP.
(b) Management’s Report on Internal Control Over Financial Reporting
Our management is responsible for establishing and maintaining effective internal control over
financial reporting. This system is designed to provide reasonable assurance regarding the
reliability of financial reporting and the preparation of consolidated financial statements for
external purposes in accordance with GAAP.
Our internal control over financial reporting includes those policies and procedures that: (1)
pertain to the maintenance of records that, in reasonable detail, accurately and fairly reflect our
transactions and dispositions of our assets; (2) provide reasonable assurance that transactions are
recorded as necessary to permit preparation of consolidated financial statements in accordance with
generally accepted accounting principles, and that our receipts and expenditures are being made
only in accordance with authorizations of our management and directors; and (3) provide reasonable
assurance regarding prevention or timely detection of unauthorized acquisition, use, or disposition
of our assets that could have a material effect on the consolidated financial statements.
Our management performed an assessment of the effectiveness of our internal control over financial
reporting as of March 31, 2010, utilizing the criteria described in the “Internal Control —
Integrated Framework” issued by the Committee of Sponsoring Organizations of the Treadway
Commission (COSO). The objective of this assessment was to determine whether our internal control
over financial reporting was effective as of March 31, 2010. Management’s assessment included
evaluation of such elements as the design and operating effectiveness of key financial reporting
controls, process documentation, accounting policies, and our overall control environment.
28
Table of Contents
A material weakness is a deficiency, or a combination of deficiencies, in internal control over
financial
reporting such that there is a reasonable possibility that a material misstatement of the Company’s
annual or interim financial statements will not be prevented or detected on a timely basis. In our
assessment of the effectiveness of internal control over financial reporting as of March 31, 2010,
we identified the following material weaknesses, which have not been fully remedied and continue to
exist:
| • | There was a lack of 1) effective communication of the importance of internal controls over financial reporting throughout the structure of the Company and 2) an adequate tone set by management around control consciousness. |
| • | We do not have sufficient in-house capacity to review and supervise the accounting operations. Our policies and procedures with respect to the review, supervision and monitoring of accounting operations were not operating in a fully effective manner. Timely review of vouchers, general ledger and sub-ledger was not sufficient. |
| • | Our accounting staff were not familiar with U.S. GAAP and SEC reporting requirements. In addition, we did not maintain effective controls over the preparation and review of the period-end closing procedures to ensure the completeness and accuracy of the consolidated financial statements and that balances and disclosures reported in the consolidated financial statements reconciled to the underlying supporting schedules and accounting records. |
| • | There was a lack of an effective anti-fraud program designed to detect and prevent fraud relating to an effective whistle-blower program, consistent background checks of personnel in positions of responsibility and an ongoing program to manage identified fraud risks. |
| • | We did not maintain an effective risk assessment and management mechanism. Specifically, we do not have sufficient internal mechanisms to prevent management override in a fully effective manner. |
| • | Our internal audit function was not sufficient. Specifically, there were no personnel with an appropriate level of experience, training and there were no lines of reporting to allow an internal audit group to function effectively in determining the adequacy of our internal control over financial reporting and monitoring the ongoing effectiveness thereof. | ||
| On September 2, 2009, the two independent directors who composed the audit committee resigned from their positions as independent directors of the Company effective September 2, 2009. There is no audit committee since that date. |
In light of these material weaknesses management concluded that our internal control over financial
reporting was not effective as of March 31, 2010.
However, giving full consideration to the material weaknesses described above, we performed
adequate analyses and procedures, including among other things, transaction reviews and account
reconciliations, in order to provide assurance that our consolidated financial statements included
in this annual report were prepared in accordance with generally accepted accounting principles
(“GAAP”) and present fairly, in all material respects, our financial position, results of
operations and cash flows for the periods presented in conformity with GAAP.
This annual report does not include an attestation report of our independent registered public
accounting firm regarding internal control over financial reporting. Management’s report was not
subject to attestation by our independent registered public accounting firm pursuant to temporary
rules of the Securities and Exchange Commission that permit us to provide only management’s report
in this annual report.
| Item 9B. | Other Information. |
None.
29
Table of Contents
PART III.
| Item 10. | Directors, Executive Officers and Corporate Governance. |
DIRECTORS AND EXECUTIVE OFFICERS
Our directors and officers, as of March 31, 2010, are set forth below. The directors hold office
for their respective term and until their successors are duly elected and qualified. Vacancies in
the existing Board are filled by a majority vote of the remaining directors. The officers serve at
the will of the Board of Directors.
| Name | Age | Position | Director Since | |||||
Xiaofeng Li
|
35 | Chief Executive Officer and Director | April 2009 | |||||
Xiangning Qin
|
32 | Chief Financial Officer | April 2009 | |||||
Zhaohui Xu
|
38 | Independent Director | September 2009 | |||||
The following is a brief summary of the business experience of our management.
Mr. Xiaofeng Li, Director and Chief Executive Officer.
Mr. Li holds a Bachelor Degree from Shanghai University, Industrial Design Department. From August
1998 to February 2001, Mr. Li was employed by Inventec Appliances Corp. where he was an Industrial
Designer. From 2001 to March 2002, Mr. Li was employed by Shanghai Fanna Industrial Product Design
Co., Ltd. as executive director and general manager. Since April 2002, Mr. Li has been Chairman of
the Board of Shanghai Sunplus Communication Technology Co., Ltd.
Mr. Xiaofeng Li was first appointed Chief Executive Officer of the Company in August 2005, resigned
from the office of Chief Executive Officer in June 2008 and was re-appointed Chief Executive
Officer in April 2009.
Mr. Xiangning Qin, Director and Chief Executive Officer
Mr. Qin currently serves as the Chief Financial Officer of the Company. From 2000 to 2006,
Mr. Qin was employed by Guangxi Liugong Machinery Co., Ltd. (SZSE: 000528), a Top 500 enterprise in
China, serving as the Accounting Manager, Accounting Director and Internal Auditor during the six
years with Guangxi. Before his appointment as the Chief Financial Officer of the Company on
April 1, 2009, Mr. Qin was Director of Shanghai Sunplus Communication Technology Co., Ltd., which
is a subsidiary of the Company. Mr. Qin holds a Bachelors Degree of Accounting from Zhongnana
University of Economics and Law. Mr. Qin also holds a Certificate of Assistant Auditor and
Certificate of Medium Level Accountant.
Mr Zhaohui Xu, Independent Director
Mr. Xu holds a Master’s degree of accounting. From 1994 to 2005, Mr. Xu served as accountant and
manager of financial department with Jiangxi Coal Mining Machinery Co., Ltd successively. From 2005
to the present, Mr. Xu serves as CFO of Shenzhen Xianxun Technology Co., Ltd.
(a) Significant Employees
Other than our officers, there are no employees who are expected to make a significant contribution
to our corporation.
(b) Family Relationships
There are no family relationships among any of our directors and executive officers. There are no
family relationships among our officers, directors, or persons nominated for such positions.
30
Table of Contents
LEGAL PROCEEDINGS
No officer, director, or persons nominated for these positions, and no promoter or significant
employee of our corporation has been involved in legal proceedings that would be material to an
evaluation of our management.
AUDIT COMMITTEE
The Board of Directors adopted an Audit Committee Charter authorizing the establishment of an Audit
Committee as noted on the Form 8-K filed with the Commission on August 15, 2008. On September 2,
2009, the two independent directors who composed the audit committee resigned from their positions
as independent directors of the Company effective September 2, 2009. There is no audit committee
since that date.
CODE OF ETHICS
As noted on the Form 8-K filed with the Commission on August 15, 2008, on August 15, 2008, the
Board of Directors approved a Business Code of Conduct and a Financial Code of Conduct
(collectively the “Codes”). Our Codes define the standard of conduct expected by our officers,
directors and employees. The Codes were filed as Exhibits 14.1 and 14.2 to our Form 8-K filed with
the Commission on August 15, 2008 and are incorporated herein by reference.
COMPLIANCE WITH SECTION 16 OF THE SECURITIES EXCHANGE ACT OF 1934
Section 16(a) of the Securities Exchange Act of 1934, as amended, requires our directors and
executive officers and beneficial holders of more than 10% of our common stock to file with the
Commission initial reports of ownership and reports of changes in ownership of our equity
securities on Forms 3, 4 and 5. Based on the copies of filings received by the Company during the
most recent fiscal year the directors, officers, and beneficial owners of more than ten percent of
the equity securities of the Company registered pursuant to Section 12 of the Exchange Act have
filed on a timely basis all required Forms 3, 4, and 5 and any amendments thereto.
| Item 11. | Executive Compensation. |
Background and Compensation Philosophy
There are altogether three (3) persons acting individually either as a director or an executive
officer or both in our Company: (1) Mr. Xiaofeng Li, our Chief Executive Officer and director, and
beneficial owner of 6.64 % of our common stock; (2) Mr. Xiangning Qin, our Chief Financial Officer
and director, and (3) Mr. Zhaohui Xu, an independent director. Our board of directors have
historically determined the compensation to be paid to our executive officers based on our
financial and operating performance and prospects, the level of compensation paid to similarly
situated executives in comparably sized companies and contributions made by the officers’ to our
success. Each of the named officers will be measured by a series of performance criteria by the
board of directors, or the compensation committee when it is established, on a yearly basis. Such
criteria will be set forth based on certain objective parameters such as job characteristics,
required professionalism, management skills, interpersonal skills, related experience, personal
performance and overall corporate performance.
31
Table of Contents
Our board of directors have not adopted or established a formal policy or procedure for determining
the amount of compensation paid to our executive officers. Mr. Li and Mr. Qin have been and may
continue to be involved when our board of directors deliberate compensation issues related to their
own compensation.
As our executive leadership and board of directors grow, our board of directors may decide to form
a compensation committee charged with the oversight of executive compensation plans, policies and
programs.
Elements of Compensation
We provide our executive officers solely with a base salary to compensate them for services
rendered during the year. Our policy of compensating our executives with a cash salary has served
us well. Because of our history of attracting and retaining executive talent, we do not believe it
is necessary at this time to provide our executives discretionary bonuses, equity incentives, or
other benefits in order for us to continue to be successful.
Base Salary
The yearly base salary of Mr. Xiaofeng Li for the fiscal years ended March 31, 2010 and 2009 was
US$66,000 and US$61,000 respectively. Mr. Xiangning Qin received US$15,000 and US$11,000 for the fiscal
years ended March 31, 2010 and 2009 respectively; he was
appointed as CFO on April 1, 2009. Mr. Zhaohui Xu received US$Nil during the fiscal year ended March 31, 2010; he was appointed as an
Independent Director in September 2009. Mr. Jie Shi received US$Nil during the fiscal year ended March
31, 2009; he was appointed as the CEO in June 2008 and resigned in March 2009. Mr. Wai Chiu Albert
Leung received US$26,000 for the fiscal years ended March 31, 2009; he served as CFO from October,
2008 to March 2009. Mr. Murry Zuhe Xiao received US$23,000 for the fiscal years ended March 31, 2009,
he served as CFO from August, 2005 to September 2009.
Discretionary Bonus
We have not provided our executive officers with any discretionary bonuses at the moment but our
board of directors may consider the necessity of bonuses in the future based on our financial and
operating performance and prospects, the level of compensation paid to similarly situated
executives in comparably sized companies and contributions made by the officers’ to our success.
Equity Incentives
We have not established equity based incentive program and have not granted stock based awards as a
component of compensation. In the future, we may adopt and establish an equity incentive plan
pursuant to which awards may be granted if our board of directors determines that it is in the best
interests of our stockholders and the Company to do so.
Retirement Benefits
Two of our executive officers in Shanghai participated in the government -mandated multi-employer
defined contribution retirement plan.
Perquisites
We have not provided our executive with any material perquisites and other personal benefits
and, therefore, we do not view perquisites as a significant or necessary element of our
executive’s compensation.
Deferred Compensation
We do not provide our executives the opportunity to defer receipt of annual compensation.
32
Table of Contents
The following table sets forth information for the period indicated with respect to the persons who
served as our CEO, CFO and other most highly compensated executive officers who served on our board
of directors.
SUMMARY COMPENSATION TABLE
| Nonqualified | ||||||||||||||||||||||||||||||||||||
| Non-Equity | Deferred | |||||||||||||||||||||||||||||||||||
| Bonus | Stock | Option | Incentive Plan | Compensation | All Other | |||||||||||||||||||||||||||||||
| Salary | Shares | Awards | Awards | Compensation | Earnings | Compensation | Total | |||||||||||||||||||||||||||||
| Name and Position | Year | (US$) | (US$) | (US$) | (US$) | (US$) | (US$) | (US$) | (US$) | |||||||||||||||||||||||||||
Xiaofeng Li |
2010 | 66,000 | — | — | — | — | — | 6,700 | 72,700 | |||||||||||||||||||||||||||
Chief Executive Officer |
2009 | 61,000 | — | — | — | — | — | 6,400 | 67,400 | |||||||||||||||||||||||||||
Xiangning Qin |
2010 | 15,000 | — | — | — | — | — | 15,000 | ||||||||||||||||||||||||||||
Chief Financial Officer |
2009 | 11,000 | — | — | — | — | — | 11,000 | ||||||||||||||||||||||||||||
Murry Zuhe Xiao Ex-Chief Financial Officer |
2009 | 23,000 | 23,000 | |||||||||||||||||||||||||||||||||
Wai Chiu Albert Leung Ex-Chief Financial Officer |
2009 | 26,000 | 26,000 | |||||||||||||||||||||||||||||||||
Jie Shi Ex-Chief Executive Officer |
2009 | — | — | |||||||||||||||||||||||||||||||||
SERVICE AGREEMENTS WITH DIRECTORS AND EXECUTIVE OFFICERS
We will bear all travelling and travel-related expenses, entertainment expenses and other
out-of-pocket expenses reasonably incurred by Mr. Li or Mr. Qin in the process of discharging their
respective duties on our behalf.
Except as disclosed herein, we have no other existing or proposed agreements with any of our
officers and directors.
BONUSES AND DEFERRED COMPENSATION
We do not have an incentive bonus plan at this time.
We do not have any deferred compensation or retirement plans. We do not have a compensation
committee; all decisions regarding compensation are determined by our entire board of directors.
OPTION GRANTS IN THE LAST FISCAL YEAR
We did not grant any options or stock appreciation rights to our named executive officers or
directors in the fiscal year ended March 31, 2010. As of March 31, 2010, Mr. Xiaofeng Li, Chief
Executive Officer and Director, owned 1,998,237 shares of common stock in our Company, which
represented 6.64% of the total number of shares issued and outstanding.
33
Table of Contents
INDEMNIFICATION OF DIRECTORS AND EXECUTIVE OFFICERS
Our bylaws provide for the indemnification of our present and prior directors and officers or any
person who may have served at our request as a director or officer of another corporation in which
we own shares of capital stock or of which we are a creditor, against expenses actually and
necessarily incurred by them in connection with the defense of any actions, suits or proceedings in
which they, or any of them, are made parties, or a party, by reason of being or having been
director(s) or officer(s) of us or of such other corporation, in the absence of negligence or
misconduct in the performance of their duties. This indemnification policy could result in
substantial expenditure by us, which we may be unable to recoup.
Insofar as indemnification by us for liabilities arising under the Securities Exchange Act of 1934
may be permitted to our directors, officers and controlling persons pursuant to provisions of the
Amended Articles of Incorporation and Bylaws, or otherwise, we have been advised that in the
opinion of the SEC, such indemnification is against public policy and is, therefore, unenforceable.
In the event that a claim for indemnification by such director, officer or controlling person of us
is in the successful defense of any action, suit or proceeding is asserted by such director,
officer or controlling person in connection with the securities being offered, we will, unless in
the opinion of our counsel the matter has been settled by controlling precedent, submit to a court
of appropriate jurisdiction the question whether such indemnification by us is against public
policy as expressed in the Act and will be governed by the final adjudication of such issue.
At the present time, there is no pending litigation or proceeding involving a director, officer,
employee or other agent of ours in which indemnification would be required or permitted. We are not
aware of any threatened litigation or proceeding which may result in a claim for such
indemnification.
Compensation of Directors
Our Board of Directors receive no compensation.
| Item 12. | Security Ownership of Certain Beneficial Owners and Management and Related Stockholder Matters. |
Security Ownership — Certain Beneficial Owners
Beneficial
ownership is shown as of June 28, 2010, for shares held by (i) each person or entity known
to us to be the beneficial owner of more than 5% of our issued and outstanding shares of common
stock based solely upon a review of filings made with the Commission and our knowledge of the
issuances by us, (ii) each of our directors, (iii) our Chief Executive Officer and our three other
most highly compensated officers whose compensation exceeded US$100,000 during the fiscal year ended
March 31, 2010, or the Named Executive Officers, and (iv) all of our current directors and
executive officers as a group. Unless otherwise indicated, the persons listed below have sole
voting and investment power with respect to the shares and may be reached at 9th Floor,
YongSheng Building, ZhongShan Xi Road, Xuhui District, Shanghai, China.
Security Ownership — Certain Beneficial Owners
| Amount | ||||||||||||||||
| And | Percentage | |||||||||||||||
| Nature of | of Class | |||||||||||||||
| Beneficial | Beneficially | |||||||||||||||
| Beneficial Owner (including address) | Title of class | Ownership (1) | Total | Owned | ||||||||||||
Meilian Li |
Common | 15,950,000D | 15,950,000 | 53.01 | % | |||||||||||
Room 917, YongSheng Building Xhong Shang Xi Road Xuhui District, Shanghai, China |
||||||||||||||||
34
Table of Contents
Security Ownership — Management
| Amount | ||||||||||||||||
| And | Percentage | |||||||||||||||
| Nature of | of Class | |||||||||||||||
| Beneficial | Beneficially | |||||||||||||||
| Beneficial Owner (including address) | Title of class | Ownership (1) | Total | Owned | ||||||||||||
Xiaofeng Li (2)(3) |
Common | 1,998,237 | D | 1,998,237 | 6.64 | % | ||||||||||
Room 917, YongSheng Building Xhong Shang Xi Road Xuhui District, Shanghai, China |
||||||||||||||||
Xiangning Qin (2)(3) |
— | — | — | — | ||||||||||||
Room 917, YongSheng Building Xhong Shang Xi Road Xuhui District, Shanghai, China |
||||||||||||||||
Zhaohui Xu (3) |
— | — | — | — | ||||||||||||
Room 917, YongSheng Building Xhong Shang Xi Road Xuhui District, Shanghai, China |
||||||||||||||||
Officers and Directors as a group
Three (3) People |
Common | 1,998,237 | 1,998,237 | 6.64 | % | |||||||||||
Notes:
| (1) | (D) stands for direct ownership; (I) stands for indirect ownership | |
| (2) | Officer | |
| (3) | Director |
Changes in Control
There are no arrangements, known to the Registrant, including any pledge by any person of
securities of the Registrant which may at a subsequent date result in a change in control of the
Registrant.
| Item 13. | Certain Relationships and Related Transactions, and Director Independence. |
Certain Relationships and Related Transactions
None.
Director Independence
As of March 31, 2010, the Board of Directors consisted of three (3) members: Mr. Xiaofeng Li, Mr.
Xiangning Qin and Mr. Zhaohui Xu. Mr.Zhaohui Xu meets the requirement to be considered
“independent” as defined by the governance rules of the NASDAQ Global Market.
35
Table of Contents
| Item 14. | Principal Accounting Fees and Services. |
The following is a summary of the fees billed to us by Moore Stephens for professional services
rendered for the years ended March 31, 2010 and 2009:
| Service | 2010 | 2009 | ||||||
Audit Fees |
US$ | 127,000 | US$ | 154,000 | ||||
Audit Related
Fees |
||||||||
Tax Fees |
||||||||
All Other Fees |
||||||||
TOTAL |
US$ | 127,000 | US$ | 154,000 | ||||
Audit fees consist of the aggregate fees billed for services rendered for the audit of our annual
financial statements, the reviews of the financial statements included in our Forms 10-Q and for
any other services that are normally provided by our independent auditors in connection with our
statutory and regulatory filings or engagements.
Audit related fees consist of the aggregate fees billed for professional services rendered for
assurance and related services that reasonably related to the performance of the audit or review of
our financial statements that were not otherwise included in Audit Fees.
Tax fees consist of the aggregate fees billed for professional services rendered for tax
compliance, tax advice and tax planning. These services include assistance regarding federal, state
and local tax compliance and consultation in connection with various transactions and acquisitions.
All other fees consist of the aggregate fees billed for products and services provided by our
independent auditors and not otherwise included in Audit Fees, Audit Related fees or Tax Fees.
36
Table of Contents
| Item 15. | Exhibits, Financial Statement Schedules. |
(a)(1) Financial Statements
The financial statements and notes are listed in the Index to Financial Statements on page F-1 of
this Report.
(a)(2) Exhibits
| 14 | Business
Code of Conduct and Financial Code of Conduct (Incorporated by
reference to Exhibit 14.1
and 14.2 to Form 8-K filed with the Commission on August 15, 2008) |
|||
| 21 | *Subsidiaries List |
|||
| 31.1 | *Certification of Chief Executive Officer pursuant to 13a-14 and 15d-14 of the Exchange Act |
|||
| 31.2 | *Certification of Chief Financial Officer pursuant to 13a-14 and 15d-14 of the Exchange Act |
|||
| 32.1 | *Certificate pursuant to 18 U.S.C. ss. 1350 for Michael Mak, Chief Executive Officer |
|||
| 32.2 | *Certificate pursuant to 18 U.S.C. ss. 1350 for Michael Mak, Chief Financial Officer |
| * | - Filed herein |
(a)(3) Financial Statement Schedules
Financial statement schedules not filed herein have been omitted as they are not applicable or the
required information or equivalent information has been included in the financial statements or the
notes thereto.
37
Table of Contents
SIGNATURES
Pursuant to the requirements of Section 13 or 15(d) of the Securities Exchange Act of 1934, the
registrant has duly caused this report to be signed on its behalf by the undersigned, thereunto
duly authorized.
| T-BAY HOLDINGS, INC. | ||||
/s/
Xiaofeng
Li
Xiaofeng Li, Chief Executive Officer
|
||||
Dated:
June 29, 2010
|
(Principal executive officer) | |||
/s/
Xiangning Qin
Xiangning Qin, Chief Financial Officer
|
||||
Dated:
June 29, 2010
|
(Principal financial officer) |
Pursuant to the requirements of the Securities Exchange Act of 1934, this report has been signed
below by the following persons on behalf of the registrant and in the
capacities indicated on June 29, 2010.
Each person whose signature appears below constitutes and appoints Xiaofeng Li and Xiangning Qin as
his true and lawful attorneys-in-fact and agents, each acting alone, with full power of
substitution and re-substitution, for him and in his name, place and stead, in any and all
capacities, to sign any and all amendments to this Annual Report on Form 10-K and to file the same,
with all exhibits thereto, and other documents in connection therewith, with the U.S. Securities
and Exchange Commission, granting unto said attorneys-in-fact and agents, each acting alone, full
power and authority to do and perform each and every act and thing requisite and necessary to be
done in and about the premises, as fully to all intents and purposes as he might or could do in
person, hereby ratifying and confirming all said attorneys-in-fact and agents, each acting alone,
or his substitute or substitutes, may lawfully do or cause to be done by virtue thereof.
| Signature | Title | Date | ||
/s/ Xiaofeng Li
Xiaofeng Li
|
Chief Executive Officer (Chief principal officer) and Director |
June 29, 2010 | ||
/s/ Xiangning Qin
Xiangning Qin
|
Chief Financial Officer and Director | June 29, 2010 | ||
/s/ Zhaohui Xu
Zhaohui Xu
|
Independent Director | June 29, 2010 |
38