Attached files
| file | filename |
|---|---|
| 8-K - FORM 8-K - MOSAIC CO | d8k.htm |
Exhibit 99.1

Near Term P&K Outlook:
New or No Normal?

Market Mosaic is a quarterly newsletter published for our customers, suppliers and stakeholders by the Market and Strategic Analysis group of The Mosaic Company. The spring and fall issues recap our assessment of the near term outlook for agricultural and crop nutrient markets. The summer and winter issues provide an in-depth look at a topic of special interest to our readers.
Michael R. Rahm
Vice President
mike.rahm@mosaicco.com
Joseph Fung
Market Analyst
joseph.fung@mosaicco.com
Mathew Philippi
Market Analysis Assistant
matt.philippi@mosaicco.com
“New Normal” is the latest buzz-phrase used by some analysts to describe the expected performance of the U.S. economy post the Great Recession of 2008/09. The “New Normal” hypothesis states that the U.S. economy will grow at a slower pace of about 2% per year compared to the historical rate of more than 3% due to several factors such as household de-leveraging and the eventual need to address burgeoning federal and state budget deficits. Analysts are closely monitoring economic statistics to assess whether there is empirical support for this hypothesis. Stay tuned.
The “New Normal” hypothesis raises questions about how agricultural and crop nutrient markets will emerge from the 2008/09 downturn. In fact, a growing number of analysts are using this term to describe a less optimistic outlook for agricultural and crop nutrient markets due to recent fundamental developments such as back-to-back record harvests, the expected start-up of new phosphate (P) and potash (K) capacity and lingering fears about the stability of the world economy and global financial markets.
“New Normal” is a catchy shtick, but we do not find the concept all that useful for analyzing cyclical commodity markets. In fact, “No Normal” may be a better description for these markets because of the dynamic and unpredictable drivers that can quickly change the level, length or amplitude of a commodity cycle.
This issue of Market Mosaic reviews developments since 2008/09 and assesses the near term outlook for agricultural and P&K markets based on expected changes in several of these key drivers. We draw three main conclusions from the analysis. First, P&K demand is back on track. Global demand is recovering and North American shipments have snapped back from unprecedented declines in 2008/09. The first read of 2009/10 statistics indicates that North American phosphate shipments have nearly recovered in one big step while potash shipments are expected to recover in two steps. Further increases are forecast for 2010/11. Second, P&K fundamentals look stronger than recent market sentiment. Our analysis indicates that continued demand growth, the need to restock a nearly empty global distribution pipeline and limited output from new capacity is expected to keep P&K markets balanced to tight throughout the 2010/11 crop nutrient year. Finally, the food story has not changed even though grain and oilseed stocks have increased to more secure levels. Prospects for agricultural commodity prices, farm profitability and crop nutrient demand continue to look positive to us due to the need for farmers to plant record area and reap higher yields year after year in order to meet accelerating grain and oilseed demand.
P&K Demand is Back on Track
Recent statistics indicate that a strong recovery in P&K demand is underway. The latest statistics released by the International Fertilizer Industry Association (IFA) show that global phosphate use increased 5% in 2009 and demand is expected to
— continued inside
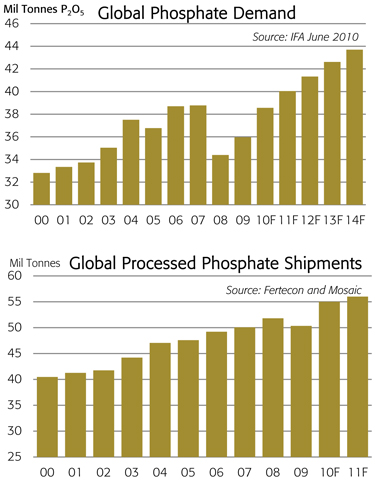
increase another 7% to 38.6 million tonnes P2O5 in 2010. The estimate for 2010 is in line with the previous peak of 38.8 million tonnes in 2007 and is up from the low of 34.4 million tonnes in 2008. IFA forecasts show global phosphate use climbing to 40.0 million tonnes in 2011 and to 43.7 million tonnes in 2014.
In the case of potash, global demand declined 9% to just 22.1 million tonnes K2O in 2009 but use is expected to rebound 21% to 26.6 million tonnes in 2010. The estimate for 2010 still lags the previous peak of 28.8 million tonnes in 2007 but demand is forecast to climb another 7% to 28.5 million tonnes in 2011 or nearly equal to the 2007 peak. The latest IFA forecasts show global potash use climbing to 31.9 million tonnes in 2014.
Shipment statistics for the main P&K products also indicate a strong recovery. For example, we estimate that global shipments of the leading phosphate products (DAP/MAP/TSP) will climb to 54 to 56 million tonnes in 2010, up almost 10% from a year earlier and greater than the previous peak of 51.8 million tonnes in 2008. Phosphate shipments are forecast to increase to 55 to 57 million tonnes in 2011.
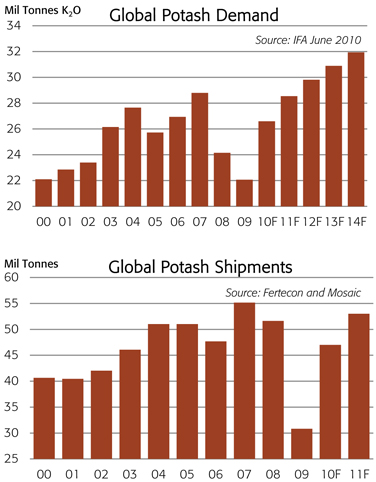
We estimate that global muriate of potash (MOP) shipments also will rebound to 46 to 48 million tonnes KCL in 2010, up from just 30.8 million tonnes in 2009 but still below the previous record of 55.2 million tonnes in 2007. MOP shipments are forecast to recover to 52 to 54 million tonnes in 2011.
Recent North American statistics also show a strong recovery in P&K shipments this year. For example, U.S. DAP/MAP shipments for the crop nutrient year ending June 30, 2010 are estimated to rebound 37% or 1.8 million tons to 6.7 million tons from the low level of last year. Shipments last year plunged 37% or 2.9 million tons from the record of 2007/08. The estimate for this year is equal to 95% of the 10-year Olympic average so U.S. DAP/MAP shipments have nearly recovered in one big step this year (an Olympic average discards the lowest and highest scores). Monthly production, trade and inventory statistics show that the expected gain for this year already is in the bag as shipments were up 44% or 1.9 million tons during the first 11 months of the crop nutrient year (Jul-May). June shipments are expected to be slightly less than a year ago due to strong exports especially to India as well as continued cautious positioning and just in time purchasing by domestic distributors. U.S. DAP/MAP shipments are forecast to increase another 2% to 6.9 million tons in 2010/11.
North American MOP shipments for the 2009/10 crop nutrient year are projected to surge 50% or 2.7 million tons KCL to almost 8.0 million tons from the anemic level of last year. Shipments


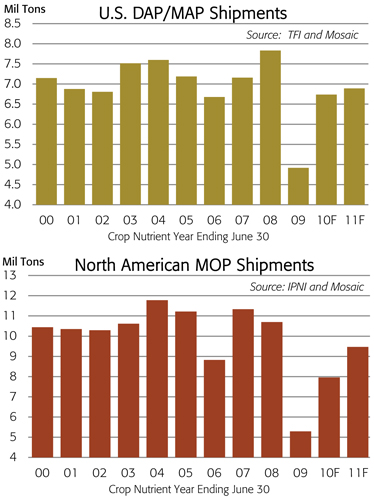
last year plunged 51% or 5.4 million tons from the high level of 2007/08. The estimate for this year is equal to 76% of the 10-year Olympic average. North American shipments are expected to recover in two steps with a little more than one-half of the gain achieved this year. Monthly statistics show that shipments were up 48% or 2.4 million tons during the first 11 months of the crop nutrient year with much of the recovery taking place following the settlement of key international contracts and a recalibration of prices in late December. In fact, North American MOP shipments from January through May increased 275% or 3.7 million tons from the dormant period a year earlier. North American MOP shipments are forecast to increase another 19% to 9.5 million tons or more than 90% of the 10-year Olympic average in 2010/11.
Fundamentals are Stronger than Market Sentiment
Our read of global P&K markets indicates that near term fundamentals are stronger than recent market sentiment. The demand recovery this year has depleted inventories and revved-up production facilities that had operated at low rates during much of 2008/09. Further demand growth combined with a need to restock a nearly empty pipeline is expected to keep P&K markets balanced to tight throughout the 2010/11 crop nutrient year.
Recent market sentiment remains cautious for several reasons. First, the global market is between the main application seasons in the Northern and Southern Hemispheres. Buyers have a window to watch market developments before positioning product for pre-plant or post-harvest applications and that has resulted in a season lull in demand. Second, uncertainty about the global economy and softer agricultural commodity prices have worried distributors about on-farm demand even though farm profitability in the large Asian markets is at record highs and futures prices for 2011 crops continue to trade at levels that generate profitable returns elsewhere. Finally, many distributors simply perceive more downside than upside risk at current P&K prices.
Despite this cautious sentiment, fundamentals continue to exhibit strength. India is one of the powerful engines pulling the demand recovery. Public policies are focused on programs to boost food security and quell food inflation following a poor monsoon and kharif season last year. The government and industry are working closely to insure that no missteps take place in the implementation of the new nutrient based subsidy that was introduced on April 1. Major Indian importers contracted for annual volumes of P&K at fixed prices for the entire 2010/11 crop nutrient year. Fixed import prices combined with fixed subsidy payments enabled Indian distributors to establish retail prices that were up only slightly from the very low fixed levels of the past.
Indian farm economics are as good as anywhere in the world due to high local prices for grain and oilseed products as well as low crop nutrient costs. These factors have combined to fuel large P&K imports. For example, we project that India will import a record 7.5 to 7.7 million tonnes of DAP/ MAP and 5.7 to 5.9 million tonnes of MOP in 2010. Domestic DAP sales totaled almost 10.2 million tonnes during the fiscal year that ended March 31, 2010 and we forecast that DAP use will increase to at least 10.7 million tonnes in 2010/11 assuming normal monsoon rainfall. DAP fabrication from imported rock and acid is expected to remain flat or even slip again this year as domestic producers run more NPK compounds rather than DAP at granulation facilities.
Brazil is another important engine pulling along the demand recovery. We project that shipments of all crop nutrient products will increase to 23.0 to 23.5 million tonnes in 2010, the second highest level on record. Phosphate (DAP/MAP/TSP) imports are forecast to rebound to 2.4 to 2.6 million tonnes this year with peak shipments of approximately 1.2 million tonnes during June, July and August. Projected imports still are far below the peak of 3.7 million tonnes in 2007 but they are up from the trough of 2.0 million tonnes last year. Despite cautious buyers, imports for the first five months of this year (Jan-May) were up 25% from the low level a year earlier. Brazilian MOP imports are forecast to increase to 5.9 to 6.1 million tonnes this year, up from just 3.4 million tonnes last year but still less than the record of 6.7 million tonnes in 2007. Year-to-date (Jan-May) MOP imports were up more than 300% from the scant levels a year ago.
The demand recovery is driven by the improved financial conditions of Brazilian farmers as well as favorable farm economics. Farmers have just completed a record harvest and big volumes coupled with relatively high agricultural commodity prices have improved farm balance sheets. Projected profitability for the 2010/11 growing season is down for some crops such as soybeans but is up for other crops such as sugar cane and coffee. In addition, the government recently announced a record farm credit package for the upcoming planting season.
The rebound in global demand has been met by both increases in production as well as a destocking of inventories all along the supply chain from producer warehouses to retail sheds. We estimate that the global phosphoric acid operating rate has rebounded to the 80% to 85% range, up from a trough of 50% to 55% early last year. Rates in the United States have increased to the 85% to 90% range, up from a trough of 30% to 35% last year. In the case of potash, we estimate that the global MOP operating rate has rebounded to 75% to 80%, up from a trough of 40% to 45% while North American rates have increased to 85% to 90%, up from a trough of 20% to 25% early last year.
In addition to a rebound in production, further destocking of inventories especially at producer warehouses also met part of the increase in demand


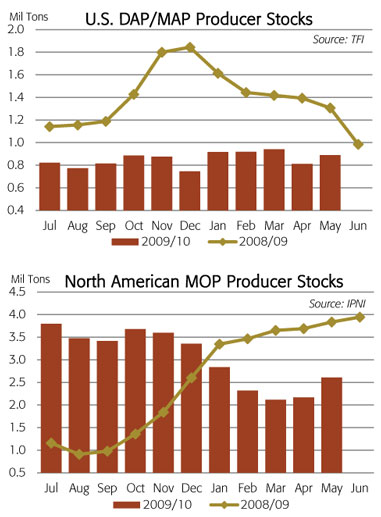
this year. The decline in North American producer stocks provides a good example. After peaking at 1.9 million tons on December 31, 2008, U.S. DAP/MAP inventories held by producers at both on-and off-site facilities have dropped and stabilized in the 800,000 to 1.0 million ton range during the last 12 months. Producer stocks totaled just 889,000 tons on May 31, 2010 and, based on current supply and demand forecasts, we expect that producer stocks will remain within this low range throughout the 2010/11 crop nutrient year.
North American MOP stocks held by producers also dropped from a peak of 3.9 million tons KCL on June 30, 2009 to 2.1 million tons on March 31, 2010, the lowest level since November 30, 2008. Since then, producer inventories have stabilized in the 2.2 to 2.6 million ton range during the last two months. Based on current supply and demand forecasts, we expect that producer stocks will track average levels throughout the 2010/11 crop nutrient year.
Several swing factors could impact the near term outlook. The direction of agricultural commodity prices is at the top of everyone’s list, but fears about the global economy and a collapse of grain and oilseed prices look overblown to us (see next section). China always is a wildcard due to the volatility of its potash imports and phosphate exports during the past several years. We expect that initiatives to enhance food security and stimulate agricultural productivity eventually will put potash imports back on the growth trajectory of the last decade and stabilize phosphate exports at current levels or less. The appreciation of the Chinese yuan also will support these trends. We project that China will import 5.0 to 5.5 million tonnes of MOP and export 2.8 to 3.0 million tonnes of DAP/MAP in 2010. Finally, many analysts are concerned about the impact of new P&K capacity that is scheduled to start up during the next several years. We expect a limited impact in the near term. In the case of potash, there is little new capacity set to start-up in 2010/11. In the case of phosphate, the Bayovar rock mine is expected to begin commercial operation during the last half of 2010, but the mine will ramp up gradually and some of the initial output from Mosaic’s 35% off-take agreement will largely replace tonnage from our Hopewell operation that is slated to mine-out in the near future. The Ma’aden facility in Saudi Arabia is expected to commence commercial production in the second quarter of 2011 but will not reach full capacity until approximately one year later. Many analysts have expressed concerns about the impact of new P&K capacity expected online during the next several years and we will assess the long term P&K outlook in the next issue of Market Mosaic.
The Food Story Has Not Changed
Back-to-back record harvests have built global grain and oilseed stocks to more secure levels and a good start to the 2010 growing season in the Northern Hemisphere has raised expectations for yet another bumper crop this year. These developments have weighed on nearby crop prices and caused some analysts to question whether the food story is still valid. Our analysis, however, indicates that the food story has not changed. Agricultural commodity markets will need to incent farmers to plant record area and reap ever increasing yields in order to meet projected increases in grain and oilseed demand.
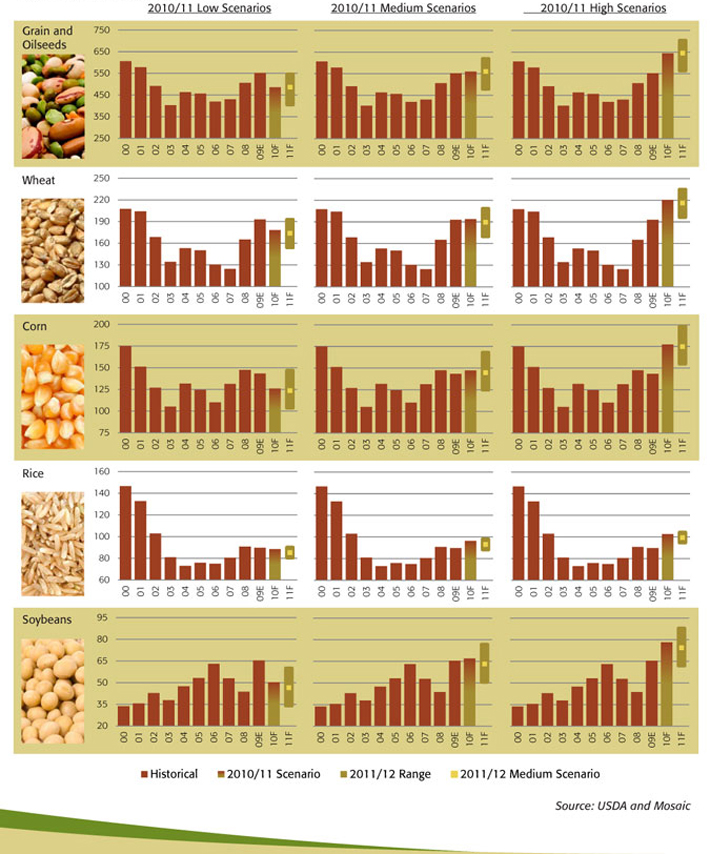
The charts (on outside flap) provide a picture of how global grain and oilseed inventories could change during the next two crop years. They show actual stocks during the last decade as well as projections for the 2010/11 and 2011/12 crop years for low, medium and high production and use scenarios. Charts are included for all grain and oilseed crops combined as well as for corn, wheat, rice and soybeans – the four largest crops that account for more than 80% of total grain and oilseed production and about 90% of projected stocks.
A separate chart is included for each of the 2010/11 scenarios. The medium scenario utilizes U.S. Department of Agriculture (USDA) estimates released on June 10. The low (high) scenario assumes an average yield equal to the 10-year trend minus (plus) the largest negative (positive) deviation from trend during the past 10 years. For the 2011/12 crop year, we illustrate the potential range for ending stocks defined by the low and high scenarios as well as the point estimate for the medium scenario.
The analysis reveals a wide range of possible outcomes during the next two years as well as significant differences between the four major crops. One could draw several conclusions from the analysis but we will highlight just three important take-aways. The first is that the horse race between supply and demand looks like a dead heat under medium scenarios or normal conditions during the next two crop years. In other words, supply just keeps pace with demand and stocks stay stable as long as demand continues to grow at 2.0% to 2.5% per year, harvested area remains at record levels and yields equal the 10-year trend.
Global Grain and Oilseed Stocks
Units: million tonnes for crop year beginning in
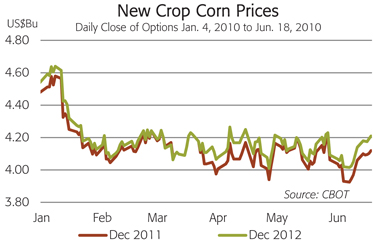
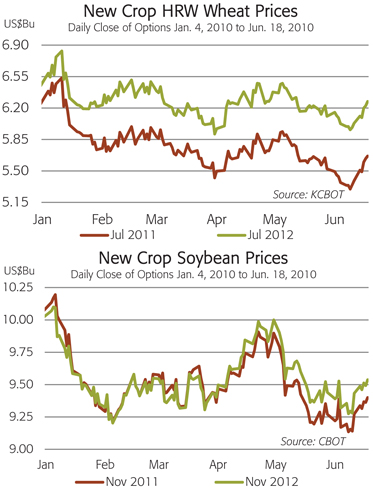
A second important take-away is that relatively high grain and oilseed prices are required for supply to keep pace with demand in the medium scenarios. Demand growth has accelerated. For example, global grain and oilseed use increased at a compound annual growth rate of 1.4% during the 1990s, but the pace picked up to 1.8% during the past decade with global demand growing at the rapid rate of 2.2% per year during the last five years. As a consequence, farmers will have to continue to plant record area and reap record yields in order to meet projected grain and oilseed demand during the next two crop years. That, in our view, is precisely what futures markets are signaling to farmers today. The 2011 and 2012 new crop prices for corn, wheat, and soybeans were trading north of $4.00, $5.50 and $9.25 per bushel, respectively, in mid-June. Those relatively high prices are required to keep farmers running at full throttle for the next couple of years.
The last take-away is that the situation differs significantly by crop and near term prospects look better for more P&K intensive crops such as corn than for less intensive crops such as wheat. In fact, wheat accounts for 55% of the large increase in global grain and oilseed stocks between 2007/08 and 2009/10. Corn accounts for just 12% of the build during this period and global inventories are projected to decline about 4.0 million tonnes during the 2009/10 crop year.
Our assessment is that global wheat stocks have increased to a secure level – a level sufficient to absorb a severe crop shortfall without causing a disruptive spike in prices. This analysis shows that even under the low scenario in 2010/11 wheat inventories drop to a level that still could make up for a second production shortfall in 2011/12 without causing a disruptive price spike. Global corn stocks still are not secure in the sense that a severe yield shortfall in 2010/11 would draw down inventories to a level that could not absorb a second shock in 2011/12 without likely causing a price spike.