Attached files
| file | filename |
|---|---|
| 10-K - FORM 10-K - J M SMUCKER Co | l39979e10vk.htm |
| EX-24 - EX-24 - J M SMUCKER Co | l39979exv24.htm |
| EX-21 - EX-21 - J M SMUCKER Co | l39979exv21.htm |
| EX-23 - EX-23 - J M SMUCKER Co | l39979exv23.htm |
| EX-32 - EX-32 - J M SMUCKER Co | l39979exv32.htm |
| EX-31.3 - EX-31.3 - J M SMUCKER Co | l39979exv31w3.htm |
| EX-31.1 - EX-31.1 - J M SMUCKER Co | l39979exv31w1.htm |
| EX-31.2 - EX-31.2 - J M SMUCKER Co | l39979exv31w2.htm |
Table of Contents

| The J. M. Smucker Company 2010 Annual Report |
Financial Highlights
The J.M. Smucker Company
The J.M. Smucker Company
| Year Ended April 30, | ||||||||
| (Dollars in thousands, except per share data) | 2010 | 2009 | ||||||
Net sales |
$ | 4,605,289 | $ | 3,757,933 | ||||
Net income and net income per common share: |
||||||||
Net income |
$ | 494,138 | $ | 265,953 | ||||
Net income per common share — assuming dilution |
$ | 4.15 | $ | 3.11 | ||||
Income and income per common share before restructuring
and merger and integration costs: (1) |
||||||||
Income |
$ | 520,782 | $ | 321,617 | ||||
Income per common share — assuming dilution |
$ | 4.37 | $ | 3.76 | ||||
Common shares outstanding at year end |
119,119,152 | 118,422,123 | ||||||
Number of employees |
4,850 | 4,700 | ||||||
(1) Reconciliation to net income: |
||||||||
Income before income taxes |
$ | 730,753 | $ | 396,065 | ||||
Merger and integration costs |
33,692 | 72,666 | ||||||
Cost of products sold — restructuring |
3,870 | — | ||||||
Other restructuring costs |
1,841 | 10,229 | ||||||
Income before income taxes, restructuring, and merger and integration costs |
$ | 770,156 | $ | 478,960 | ||||
Income taxes |
249,374 | 157,343 | ||||||
Income before restructuring and merger and integration costs |
$ | 520,782 | $ | 321,617 | ||||
On Our Cover
“A Memorable Meal” © 2010 Willa Aylaian
A native Californian and mother of five, Willa Aylaian’s
artwork typically features cottages, coastal ocean scenes,
and children on the beach. Her paintings are known
for being bright and filled with whimsy and delight.
This year our Annual Report cover captures
the joy of the family meal.
Contents
Our Culture |
1 | |||
Letter to Shareholders |
2 | |||
| 4 | ||||
| 12 | ||||
Recipes |
13 | |||
| 15 | ||||
| 16 | ||||
| 16 | ||||
| 17 | ||||
| 18 | ||||
| 30 | ||||
| 30 | ||||
| 31 | ||||
| 32 | ||||
Consolidated Financial Statements |
33 | |||
| 38 | ||||
| 64 | ||||
| 64 | ||||
| 65 |
Table of Contents

| Why We Are, Who We Are ...Our Culture A culture of dotting the i’s and crossing the Of doing the right things and doing things right culture of growth — individual and as a company. It’s who we are. It’s because of who we are. It’s a result of living our Basic Beliefs... Our Commitment to Each Other. To our consumers and to our customers. As we look to the future of unlimited possibilities, we recognize the principles that are instrumental to our success... A culture deeply rooted in our Basic Beliefs... Guideposts for decisions at every level... Why we are who we are. A culture that encourages commitment to each other... Clear communication and collaboration... Vision... A culture of appreciation. A family-sense of sharing in a job well done... Where every person makes a difference. |
Table of Contents
Dear Shareholders and Friends:
We are pleased to share with you that fiscal 2010 was another record year for The J.M.
Smucker Company as we continued to focus on Our Purpose of bringing families together to share
memorable meals and moments. Our results demonstrate that when our employees focus on a shared
purpose and implementing a clear strategy, strong financial performance follows:
| • | Sales were $4.6 billion, up 23 percent over last year. | |
| • | Net income per share was $4.15, up from $3.11 last year, a 33 percent increase. | |
| • | Cash flow from operations exceeded $713 million, up 60 percent over last year. |
Strong cash flows provide us with a number of opportunities to create additional shareholder
value in the future. These opportunities include future growth through acquisitions, dividend
payments, share repurchase programs, and capital investments. In fact, we recently announced a 14
percent increase in our quarterly dividend.
Several key strategic accomplishments over the past year have contributed to our strong
momentum and outstanding Company results:
| • | Achieved market share growth across a number of our core categories. | |
| • | Successfully completed the remaining activities associated with integrating the Folgers coffee business with our broader portfolio of brands and Company infrastructure. | |
| • | Realized the first full year of synergies associated with managing the Folgers coffee business as part of The J.M. Smucker Company. | |
| • | Grew Dunkin’ Donuts coffee in retail volume, which represented the fastest growing brand in our Company portfolio. | |
| • | Delivered significant sales, profits, and cash flow from the coffee business. | |
| • | Strengthened core brand equities across our entire portfolio of brands through an unprecedented level of investment in print, digital, and television advertising. | |
| • | Leveraged the power of our diverse categories and products through multi-brand promotional events that invited consumers to include even more of our products as part of their family meals. | |
| • | Introduced new, better-for-you product alternatives, including but not limited to Pillsbury sugar-free cake mixes, brownies, and frostings — the first sugar-free alternatives in the dessert baking mix category — offering consumers even more ways to enjoy our brands. | |
| • | Continued our strong commitment to sustainability so that we can create a better tomorrow through economic, environmental, and social programs. | |
| • | Enjoyed and preserved the unique Company culture that makes Smucker a great place to work. | |
| We were proud that our Company was once again recognized by FORTUNE magazine’s “100 Best Companies to Work For.” This recognition is a testament to our employees. We thank them for their continued passion and dedication to our business. |
Long-Term Perspective
Achieving solid financial results and growing our business were important objectives that we
were proud to deliver this past fiscal year. However, we believe that an even more important
measure of success is providing strong results and value to our constituents — consumers,
customers, employees, suppliers, communities, and shareholders — over the long term.
A commitment to continuous improvement is essential to ensuring our ongoing success. Our
employees are committed to continuously improving our brands, products, business processes,
operational practices, and cost structure.
Most significantly, we announced this past year the strategic decision to invest in the
long-term strength and profitability of our coffee and fruit spreads businesses with the largest
capital investment in our Company’s history. This multi-project initiative will help achieve our
long-term financial objectives, better allocate capacity and assets across the supply chain, and
strengthen our category leadership positions. This decision, while right for the ongoing strength
of the businesses, was a difficult one because of the impact on many of our employees as a result
of the planned closing of four manufacturing facilities.
Looking to the future, we will continue to strengthen our work environment and unique culture.
Over the next few years, we will make significant investments at our
2
Table of Contents
corporate headquarters location in Orrville, Ohio, to support recent and future growth. We will
open a new office building, expand an existing building that will add to our research and
development capabilities, and build a state-of-the-art manufacturing facility.
Our culture, emphasis on growth, and focus on continuous improvement have long contributed to
our success. These investments are only the most recent examples of our commitment to these areas.
Our Purpose
During fiscal 2010, we extended Our Purpose of bringing families together to share memorable
meals and moments to more consumers than ever before. We continue to believe in the far-reaching
benefits of family mealtime. Families that eat together are stronger, smarter, healthier, and
happier.
To best fulfill Our Purpose and deliver sustained results we are guided by our strategic
vision to own and market North American food brands that hold the #1 market position in their
respective category. We remain confident in this North American focused strategy and will also
continue to embrace a global perspective.
Having the right strategic focus is essential, but how we work to fulfill our strategy is what
makes The J.M. Smucker Company unique. Our Basic Beliefs — Quality, People, Ethics, Growth, and
Independence — are the guideposts for everything we do. They are the fabric of our culture and have
enabled us to build trust with our constituents for generations. That trust is the confidence that
constituents place in our Company, our brands, and our products. We do not take this trust for
granted and work to maintain it every day — one product at a time.
We thank you for your investment in The J.M. Smucker Company and look forward to our continued
partnership.
| Sincerely, | ||||

|
 |
|||
| Tim Smucker | Richard Smucker |
Our Purpose is to bring families together to share memorable meals and moments. At
Smucker, we have always measured success by more than financial performance and are honored that
our brands play a role in helping family and friends enjoy these cherished mealtime moments.

3
Table of Contents
| Business Overview U.S. Retail Coffee Market Folgers • Dunkin’ Donuts • Millstone |
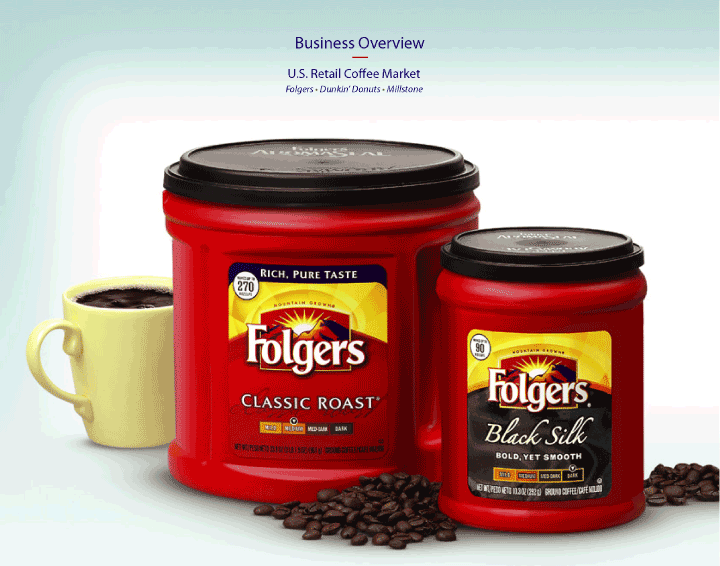

Sales and profits within our U.S. Retail Coffee Market segment grew by 99
percent and 129 percent, respectively, in fiscal 2010.
We are the clear market leader in the coffee category and the momentum of
the business is strong. Since the close of the Folgers transaction in November
2008, we have realized the first full year of synergies, completed all of the integration
milestones, and fully integrated the business into the Company. Our results from Folgers and
Dunkin’ Donuts coffee exceeded the expectations we had for the business at the time of the
acquisition.
In fiscal 2010, we produced 11 new television commercials to support the coffee business and
made a significant marketing investment in its brands. Consistent with our strategic rationale for
the acquisition, Folgers coffee has created scale and fueled growth across our entire portfolio of
brands as we have capitalized on multi-brand marketing and merchandising opportunities.
Folgers core products continue to be a popular choice across the U.S. as families brew and
enjoy more coffee at home. Consumers believe The Best Part of Wakin’ Up starts with a freshly
brewed, hot cup of Folgers coffee. That’s why we continue to focus our investments and efforts on
growing Folgers core products and ensuring the right marketing mix, distribution, and packaging. We
also continue to strengthen our Folgers brand equity through our new television advertising,
promotions, digital, and in-store marketing initiatives.
Dunkin’ Donuts coffee is the fastest growing brand in the Company’s portfolio. More and
more consumers are turning toward Dunkin’ Donuts coffee — including our bold tasting Dunkin’
Turbo variety — which was successfully launched this past year and will continue to build our
presence and support our success in the growing gourmet category.
We also entered into a manufacturing and distribution agreement with Green Mountain Coffee
Roasters, Inc. The agreement will enable consumers to enjoy our Folgers Gourmet Selections and
Frozen Caramel Coffee (recipe on page 13)
4
Table of Contents

Millstone brands in single-serve K-Cup® portion packs for use in the fastest growing
single-serve brewing system — the Keurig® Single Cup Brewer.
As the leader in the at-home coffee category, our goal is to participate in all segments of
the business. Although the single-serve segment represents less than five percent of the total
at-home coffee category in the United States, it is the fastest growing segment in the category.
Our agreement with Green Mountain allows us to sell the Folgers Gourmet Selections and Millstone
K-Cup® portion packs to consumers in the U.S. and Canada through the grocery, mass retailer, drug
store, and club channels.
Reflecting the importance of coffee within our portfolio, in 2010 we made the
strategic decision to invest $70 million and consolidate coffee production in New Orleans
by the summer of 2012. This consolidation will significantly streamline the coffee supply
chain, increase our asset utilization, and better position our operations for future
expansion.

5
Table of Contents

| U.S. Retail Consumer Market Smucker’s • Jif • Hungry Jack |

Sales and profits within our U.S. Retail Consumer Market segment grew by
two percent and 10 percent, respectively, in fiscal 2010.
Fruit Spreads and Peanut Butter
It’s the simple things in life that often provide us with the greatest value,
comfort, and pleasure. For generations,
families have had to look no further than a peanut butter and jelly sandwich. Whether part of a
nutritious lunch, as a snack between meals, or as a healthy alternative at any other time of the
day — consumers have included our trusted jams, jellies, preserves, and peanut butter as a part of
their sandwiches for years.
We continued our growth in the fruit spreads category and strengthened our #1 position.
Consumers continue to have a wide array of choices — including organic and sugar-free alternatives
— under our Smucker’s, Dickinson’s, and Knott’s Berry Farm brands. We also expanded our Orchard’s
Finest premium preserve offerings this past year with the introduction of Fall Harvest Cinnamon
Apple and Coastal Valley Peach Apricot.
During fiscal 2010, we committed to making a $150 million investment over the next three
years to support the fruit spreads business and maintain our leadership position. This initiative
will include investing in new equipment and technology in Ripon, Wisconsin, and building a
state-of-the-art manufacturing plant in Orrville, Ohio. This investment will ensure our superior
product quality, support future growth, and provide operational flexibility to meet the needs of
our consumer and foodservice businesses in the U.S. and Canada.
Jif remains the #1 brand in the peanut butter category as we increased our share of market. We
further strengthened this position this past year through advertising, public relations, and
digital communications. Whether through our 8th Annual Jif Most Creative Peanut Butter Sandwich
Contest or our Jif To Go online contest, we are reaching more consumers than ever before and
strengthening the Jif brand equity.
Consumers are responding well to Jif Natural and our re-packaged Jif To Go individual servings
of peanut butter. And while many consumers enjoy traditional Jif Creamy peanut butter, they now
have more options to choose from, including Jif Omega-3 and Reduced Fat Jif To Go.
Turkey Salad with Orange Peanut Dressing (recipe on page 13)
6
Table of Contents

Toppings What better way to “top off” a celebration or to end a meal than with Smucker’s ice cream
toppings. Consumers have over 35 different flavor offerings to choose from to satisfy everyone’s
cravings. New products in fiscal 2010 included Magic Shell Orange Crème, Special Recipe Milk
Chocolate, and Black Cherry toppings.
Potatoes, Pancakes, and Syrup To leverage our strengths in breakfast and to simplify our portfolio,
we made the strategic decision this past year to divest the Hungry Jack potato business. We remain
committed to Hungry Jack pancake mixes and syrups — key products in our breakfast portfolio.
Through a variety of new products, including Hungry Jack Easy Pack Wheat Blends and Blueberry
Wheat pancakes, consumers have even more alternatives when they prepare a healthy breakfast for
their family. Consumers can also enjoy the convenience of a new, no drip cap when pouring Hungry
Jack syrup on their pancakes.

7
Table of Contents
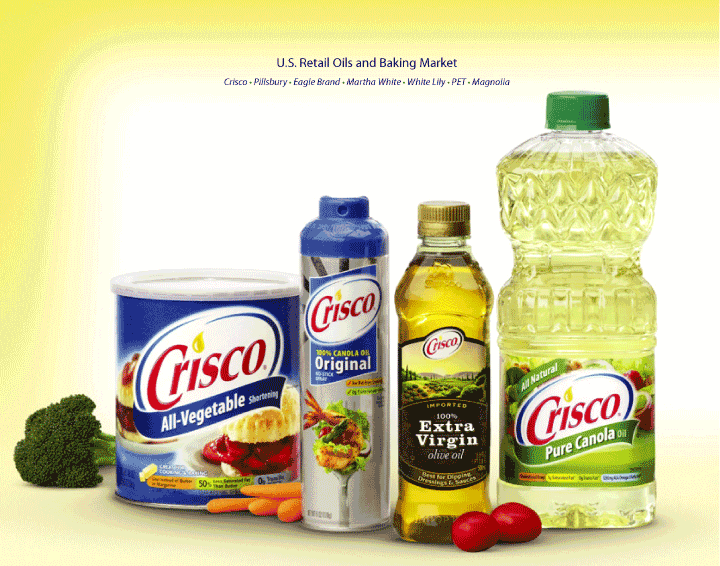
| U.S. Retail Oils and Baking Market Crisco • Pillsbury • Eagle Brand • Martha White • White Lily • PET • Magnolia |

Sales within our U.S. Retail Oils and Baking Market segment declined by
nine percent primarily related to price declines. Profits grew 15 percent in
fiscal 2010.
Crisco continues to be an iconic brand enjoyed by consumers across the U.S.
Crisco products often bring back memories of cooking and baking with family for
generations. The products also remain relevant to today’s consumer. The April 2010 edition of
Cook’s Illustrated magazine recommended Crisco Natural Blend Oil as the top-ranking cooking oil and
also recommended our vegetable, canola, and corn oils.
Over the last several years we began contemporizing the brand, including introducing olive
oils, to expand the Crisco consumer base. This past year we refreshed the Crisco packaging to
reflect a more contemporary look and feel while leveraging the equity of the blue, red, and white
colors.
It’s in the baking aisle where consumers often look for fun and exciting products that they
can include as part of their everyday meals and special occasions. In fiscal 2010, we aired our
first national television advertising for Pillsbury, which generated positive responses from
consumers. As we look toward the upcoming fiscal year, consumers will find even more Pillsbury
cookies, brownies, cakes, and frostings to choose from —
Double Chocolate Peanut Butter Supreme (recipe on page 13)
8
Table of Contents

including sugar-free alternatives. We are continuing our progress toward solidifying the #2
market position in the baking category as we work toward our long-term vision of being #1.
Martha White has been making family traditions easy since 1899 and continues its
long-standing brand history and loyalty across the South. These convenient baking mixes are “made
in minutes and gone in seconds” and are now expanding into the western region of the United
States.

9
Table of Contents


Our Special Markets business segment grew sales and profits by nine percent and 33 percent,
respectively, versus fiscal 2009. The businesses that contributed to this success include Canada,
foodservice, natural foods, and international.
Canada Our broad portfolio of brands in Canada drove an increase in sales in fiscal 2010. A
significant portion of this growth came from Folgers coffee — as this business was successfully
integrated into our Canadian portfolio. As part of this integration, we expanded our
distribution, launched new advertising, and introduced Folgers Black Silk coffee into the Canadian
marketplace.
We also realized strong results from our other brands in Canada including Smucker’s fruit
spreads and toppings, Double Fruit fruit spreads, and Robin Hood flour and baking mixes. We look
to build on this success in fiscal 2011 by expanding our retail distribution and introducing new
advertising for both Smucker’s and Double Fruit to build on the emotional bond between our brands
and consumers.
Canadian consumers continue to enjoy Bick’s pickles and condiments with their meals. They
can now add Bick’s 50% Less Salt Baby Dills Garlic — the first low-sodium branded pickle in the
category — to their pantries and kitchen tables.
We also introduced new advertising and promotions to support Europe’s Best premium
frozen fruits and vegetables. Consumers can now include Europe’s Best Sun Ripe Harvest Peaches in
their freezers, a premium blend of select orchard peaches that are picked and frozen at their
peak of ripeness to preserve nutrients and delicious taste. Europe’s Best Imperial Blend is a new
product that includes a unique mix of edamame kernels, snow peas, bamboo shoots, shitake
mushrooms, water chestnuts, carrots, and red peppers, which can be enjoyed on its own or added to
a stir fry.
Foodservice The foodservice industry continues to be challenged as families are
choosing to eat more meals at home. While the overall industry is down, our foodservice business
grew by double digits — primarily fueled by the addition of Folgers coffee and
Smucker’s Snack’n Waffles brand waffles.
Two new products included Folgers 100% Colombian and Gourmet Supreme coffee. We expect to
build on the momentum that coffee has generated within our foodservice business in the upcoming
fiscal year.
Consumers continue to be enthusiastic about Smucker’s Uncrustables sandwiches and Snack’n
Waffles brand waffles — ready-to-eat, individually packaged sandwiches and waffles. To support the
growth of these products, we consolidated production to our Scottsville, Kentucky, facility. The
Scottsville facility will meet current and future demand.
Natural Foods Natural foods
continues to meet consumer demand for products that are “good and good for you” by offering
natural
Savory Sweet Potato and Sausage Dressing (recipe on page 13)
10
Table of Contents

foods products across the beverage, peanut
butter, dessert toppings, and fruit sauces
categories.
Consumers have even more healthy, flavorful
alternatives to choose from among our Santa Cruz Organic
and R.W. Knudsen Family products. New products on shelf
this past year included Santa Cruz Organic Mango
Lemonade and Sparkling Pomegranate Limeade. R.W. Knudsen
Family unveiled a Sparkling Pomegranate beverage in the
celebratory category, as well as new packaging and
formulations for their fruit juice Spritzers. Sparkling
Essence, a zero calorie organic sparkling beverage, was
also introduced in a variety of flavors including Mint,
Blueberry, Cucumber, and Lemon.
The business continues to be an industry
sustainability leader. It was awarded the California
Waste Reduction Awards Program (WRAP) Award for the
tenth consecutive year — achieving over a 98 percent
reuse/recycle rate. It also recently achieved Leadership
in Energy and Environmental Design (LEED) Gold
certification for the Smucker Natural Foods warehouse in
Chico, California.
International Consumers in
more than 65 countries beyond the United States and
Canada continue to enjoy our brands and products. Puerto
Rico is our largest export market, with our brands
continuing to hold #1 market positions across almost
every category in which we compete.
Our international business provides
important insights into emerging trends and helps
us to maintain a global perspective on our
consumers, customers, and suppliers.

11
Table of Contents
Our Commitment to Sustainability
Economic • Environmental • Social
Since 1897, our Company has considered
environmental, economic, and social sustainability to
be among our many responsibilities as a good corporate
citizen. Today sustainability is recognized as a
strategic objective of the Company.
A Company-wide cross
functional task force was
established in 2006 to guide
and oversee our continuing
efforts relating to
sustainability.
We are pleased to announce
that as part of our ongoing
efforts to measure our progress
toward our stated
sustainability goals, this
year, for the first time, we
submitted our current results
to the Carbon Disclosure
Project. Organizations from
around the world measure and
disclose their greenhouse gas
emissions and sustainability
efforts through the Carbon
Disclosure Project.
Further, the Company
plans to publish its first
Corporate Social
Responsibility Report in the
summer of 2011.
Our Sustainable Operations
Smucker Quality
Management Systems (SQMS) is a
proven set of business
processes used to drive
results in our business. It is
the foundation of how we run
our operations. SQMS has
provided improved results in
the areas of quality,
reliability, cost, and
effectiveness.
In 2010, the Company made a substantial addition to
our SQMS initiative by adding a Sustainability Pillar.
Each manufacturing facility has a pillar leader, and our
Corporate SQMS Leadership Team and Sustainability Task
Force provide oversight and support. This pillar’s primary
focus is achieving the Company’s established environmental
goals.

Our Sustainability Strategy
With our Basic Beliefs as our
foundation, we will create a better tomorrow
by focusing on preserving our culture,
ensuring our long-term economic viability,
limiting our environmental impact, and being
socially responsible.
Our efforts are focused on the following
goals that we will strive to achieve by
2014:
| • | Reduce greenhouse gas emissions by 15% | ||
| • | Reduce water usage by 25% | ||
| • | Reduce waste sent to landfill by 75% | ||
| • | Ensure we offer a sustainable line of products | ||
| • | Maintain a leadership role in social sustainability |
Our Facilities
We continue to be recognized with regard to our
sustainability efforts at our facilities. Specific
examples include:
| • | Awarded Silver and Gold LEED Certification, respectively, for the new building and renovations on our Corporate Campus and Company Store as well as a solar powered ware- house and cold storage at our Chico, California, facility. |
| • | Received the Waste Reduction Awards Program (WRAP) Award administered by the State of California Waste Management Board at our Chico, California, facility for the 10th consecutive year. |
Our Social Responsibilities
Smucker has a long history
of promoting initiatives and
programs that support and
enhance the quality of life in
the communities in which we
operate. The primary focus of
these efforts has been within
the area of education. Examples
of our social sustainability
programs include:
| • | Played a key role in the establishment of the Heartland Education initiative based in Orrville, Ohio, which is focused on improving education through a partnership between community organizations, parents, the local school district, and local businesses. Learn more about Heartland Education Community, Inc. efforts at heartlandorrville.com. |
| • | Continued support of Feeding America’s network of food-banks, Boys and Girls Clubs of America, American Red Cross, and United Way with both financial resources and the volunteer efforts of our employees. |

12
Table of Contents

13
Table of Contents
Frozen Caramel Coffee
Directions
Directions
PLACE coffee, caramel syrup, vanilla syrup
and milk in blender container. Cover. Blend on
medium speed until combined.
ADD ice cubes.
Process until well blended (consistency should be
thick and “slushy”).
POUR into tall glasses. Top with whipped
cream. Drizzle with caramel syrup.
©/ TM/® The J. M. Smucker Company
® The Folgers Coffee Company
® The Folgers Coffee Company
folgers.com
smuckers.com
smuckers.com
Turkey Salad with Orange Peanut Dressing
Directions
Directions
COMBINE marmalade, peanut butter, salad
dressing, sour cream and curry powder in large bowl
until well blended.
ADD carrots, cranberries, turkey and apples; stir
well to combine.
To Serve: FORM a lettuce cup using
one or two lettuce leaves; place on salad plate. Fill
with 1/2 cup turkey salad. Repeat to make 5 servings.
TIP: Salad can be made ahead and held overnight in refrigerator.
©/ TM/® The J. M. Smucker Company
smuckers.com
Peachy Barbecued Ham Kabobs
Directions
Directions
SPRAY cold grill grates with no-stick cooking
spray. Heat grill to medium heat. Thread ham, red
peppers and pineapple chunks onto skewers.
COMBINE
preserves and barbecue sauce in a microwave safe bowl.
Microwave on HIGH 20 to 30 seconds. Reserve half of
sauce.
GRILL kabobs, turning occasionally, 6 to 8 minutes.
Baste with apricot mixture the last 2 minutes. Serve
with remaining sauce.
TIP: This recipe can also be prepared using a grill pan on the stove top.
©/® The J. M. Smucker Company
crisco.com
smuckers.com
smuckers.com
Coffee Caramel Flan
Directions
Directions
COOK sugar in heavy saucepan over medium heat,
stirring constantly, until completely melted and caramel
colored. Carefully pour into 8-inch round baking pan,
tilting to completely coat bottom. Sprinkle evenly with
1/4 teaspoon cinnamon.
HEAT oven to 350°F. Whisk eggs in large bowl. Beat in
sweetened condensed milk, 1/4 cup cream, vanilla and
salt. Whisk in coffee until well blended. Set prepared
baking pan in larger shallow pan (such as a 13 x 9-inch
baking pan). Pour flan mixture into prepared pan. Fill
larger pan with 1 inch hot water. Bake 55 to 60 minutes
or until knife inserted in center comes out clean.
Carefully remove baking pan from hot water; cool on wire
rack 1 hour. Cover and chill several hours or overnight.
COMBINE remaining cream, powdered sugar and remaining 1/4
teaspoon cinnamon in medium mixing bowl. Beat with an
electric mixer on low until cream begins to thicken. Beat
on high until stiff peaks form.
RUN knife around edge of pan to loosen flan. Invert
onto serving plate with rim. Cut into wedges. Dollop
each serving with whipped cream. Sprinkle with
cinnamon.
©/® The J. M. Smucker Company
® The Folgers Coffee Company
® The Folgers Coffee Company
folgers.com
eaglebrand.com
eaglebrand.com
Easy Glazed Cinnamon Rolls
Directions
Directions
COMBINE flour and yeast packets from roll mix with 2
tablespoons sugar in large bowl. Stir in hot water, 2
tablespoons butter and egg until dough pulls away from
sides of bowl. Knead dough on lightly floured surface 5
minutes until smooth, adding more flour as needed. Cover
with large bowl; let rest 5 minutes. Heat oven to 375°F.
COAT 13 x 9-inch pan with no-stick cooking spray. Roll
dough to 15 x 10-inch rectangle on lightly floured
surface. Spread 4 tablespoons butter evenly over dough.
Combine cinnamon and 5 tablespoons sugar. Sprinkle over
butter. Starting with 10-inch side, roll up tightly,
pressing edges to seal. Cut into 12 slices. Place cut side
down in prepared pan. Cover with plastic wrap and towel.
Let rise in warm place (80° to 85°F) 30 minutes or until
doubled in size.
UNCOVER dough. Bake 20 to 25 minutes or
until golden brown. Cool 1 minute. Remove from pan. For
glaze, blend powdered sugar, milk and vanilla until
smooth. Drizzle over warm rolls.
©/® The J. M. Smucker Company
Pillsbury and Pillsbury BEST are trademarks of
The Pillsbury Company, LLC, used under license.
Pillsbury and Pillsbury BEST are trademarks of
The Pillsbury Company, LLC, used under license.
crisco.com
pillsburybaking.com
pillsburybaking.com
Savory Sweet Potato and Sausage Dressing
Directions
Directions
PLACE sweet potatoes in 2-quart saucepan. Add 1/2
teaspoon salt and enough water to cover. Bring to a
boil. Cover and simmer 20 to 25 minutes, or until fork
tender. Drain. Cool.
HEAT oven to 350°F. Coat a 2-quart casserole with
no-stick cooking spray.
MELT 2 tablespoons shortening in
large skillet. Add celery and onion. Cook and stir over
medium heat until tender. Stir in remaining 1/2 teaspoon
salt, poultry seasoning and pepper. Place in large bowl.
BROWN sausage in large skillet. Stir to break apart. Drain
if necessary. Add to celery and onion mixture. Stir in
croutons, apple and raisins. Mix in egg. Melt 1/4 cup
shortening. Add to sausage mixture with prepared bouillon.
Stir in sweet potatoes. Mix well. Place in prepared
casserole.
BAKE, uncovered, 30 to 35 minutes or until golden
brown. Garnish with parsley, if desired.
©/® The J. M. Smucker Company
crisco.com
Mustard and Herb Potato Salad
Directions
Directions
COOK potatoes in salted water until tender. Drain.
When cool enough to handle, peel and dice.
COMBINE chives, parsley and capers in large bowl.
Whisk in vinegar and mustard. Whisk in oil.
ADD potatoes. Toss gently. Season with salt and
pepper, as desired. Serve immediately or
refrigerate for later use.
TIP: Best when made several hours ahead. Bring to
room temperature before serving.
©/® The J. M. Smucker Company
crisco.com
crosseandblackwell.com
crosseandblackwell.com
Double Chocolate Peanut Butter Supreme
Directions
Directions
HEAT oven to 350°F. Coat 8-inch springform pan with
no-stick cooking spray.
PREPARE brownie mix according to
package directions using packet of chocolate-flavored
syrup, oil, water and egg. Spread into prepared pan. Bake
34 to 37 minutes or until toothpick inserted in center
comes out clean. Cool completely on wire rack.
BEAT peanut butter and vanilla in medium bowl with an
electric mixer until smooth. Gradually add powdered sugar.
Beat 1 minute. Remove outer edge of springform pan. Spread
peanut butter mixture over top of cooled brownie. Chill
until firm.
PLACE hot fudge topping in small resealable plastic bag.
Knead until smooth. Cut small corner off bag. Drizzle
topping over peanut butter layer.
Cut into wedges.
©/® The J. M. Smucker Company
Pillsbury is a trademark of The Pillsbury Company, LLC,
used under license.
Pillsbury is a trademark of The Pillsbury Company, LLC,
used under license.
jif.com
crisco.com
smuckers.com
pillsburybaking.com
crisco.com
smuckers.com
pillsburybaking.com
14
Table of Contents
Five-Year Summary of Selected Financial Data
The following table presents selected financial data for each of the five years in the period
ended April 30, 2010. The selected financial data was derived from the consolidated financial
statements and should be read in conjunction with “Management’s Discussion and Analysis of Results
of Operations and Financial Condition” and the consolidated financial statements and notes thereto.
| Year Ended April 30, | ||||||||||||||||||||
| (Dollars in thousands, except per share data) | 2010 | 2009 | 2008 | 2007 | 2006 | |||||||||||||||
Statements of Income: |
||||||||||||||||||||
Net sales |
$ | 4,605,289 | $ | 3,757,933 | $ | 2,524,774 | $ | 2,148,017 | $ | 2,154,726 | ||||||||||
Net income |
494,138 | 265,953 | 170,379 | 157,219 | 143,354 | |||||||||||||||
Financial Position: |
||||||||||||||||||||
Total assets |
$ | 7,974,853 | $ | 8,192,161 | $ | 3,129,881 | $ | 2,693,823 | $ | 2,649,744 | ||||||||||
Cash and cash equivalents |
283,570 | 456,693 | 171,541 | 199,541 | 71,832 | |||||||||||||||
Long-term debt |
900,000 | 910,000 | 789,684 | 392,643 | 428,602 | |||||||||||||||
Shareholders’ equity |
5,326,320 | 4,939,931 | 1,799,853 | 1,795,657 | 1,728,059 | |||||||||||||||
Other Data: |
||||||||||||||||||||
Capital expenditures |
$ | 136,983 | $ | 108,907 | $ | 76,430 | $ | 57,002 | $ | 63,580 | ||||||||||
Weighted-average shares |
118,951,434 | 85,448,592 | 56,641,810 | 56,844,151 | 58,154,704 | |||||||||||||||
Weighted-average shares – assuming dilution |
119,081,445 | 85,547,530 | 56,873,492 | 57,233,399 | 58,590,065 | |||||||||||||||
Earnings per common share: |
||||||||||||||||||||
Net income |
$ | 4.15 | $ | 3.11 | $ | 3.01 | $ | 2.77 | $ | 2.47 | ||||||||||
Net income – assuming dilution |
$ | 4.15 | $ | 3.11 | $ | 3.00 | $ | 2.75 | $ | 2.45 | ||||||||||
Dividends declared per common share |
$ | 1.45 | $ | 6.31 | $ | 1.22 | $ | 1.14 | $ | 1.09 | ||||||||||
15
Table of Contents
Summary of Quarterly Results of Operations
The following is a summary of unaudited quarterly results of operations for the years ended
April 30, 2010 and 2009.
| (Dollars in thousands, except per share data) | ||||||||||||||||||||||||
| Net Income per | ||||||||||||||||||||||||
| Net | Net Income per | Common Share – | ||||||||||||||||||||||
| Quarter Ended | Net Sales | Gross Profit | Income | Common Share | Assuming Dilution | |||||||||||||||||||
2010 |
July 31, 2009 | $ | 1,051,526 | $ | 406,029 | $ | 98,063 | $ | 0.83 | $ | 0.83 | |||||||||||||
| October 31, 2009 | 1,278,745 | 492,250 | 139,990 | 1.18 | 1.18 | |||||||||||||||||||
| January 31, 2010 | 1,205,939 | 458,304 | 135,479 | 1.14 | 1.14 | |||||||||||||||||||
| April 30, 2010 | 1,069,079 | 430,107 | 120,606 | 1.01 | 1.01 | |||||||||||||||||||
2009 |
July 31, 2008 | $ | 663,657 | $ | 207,779 | $ | 42,291 | $ | 0.77 | $ | 0.77 | |||||||||||||
| October 31, 2008 | 843,142 | 243,419 | 51,453 | 0.94 | 0.94 | |||||||||||||||||||
| January 31, 2009 | 1,182,594 | 401,041 | 77,941 | 0.68 | 0.68 | |||||||||||||||||||
| April 30, 2009 | 1,068,540 | 399,190 | 94,268 | 0.80 | 0.80 | |||||||||||||||||||
Annual net income per share may not equal the sum of the individual quarters due to differences in
the average number of shares outstanding during the respective periods.
Stock Price Data
The Company’s common shares are listed on the New York Stock Exchange – ticker symbol SJM. The
table below presents the high and low market prices for the shares and the quarterly and special
dividends declared. There were approximately 304,575 shareholders as of June 9, 2010, of which
74,513 were registered holders of common shares.
| Quarter Ended | High | Low | Dividends | |||||||||||||
2010 |
July 31, 2009 | $ | 51.06 | $ | 39.19 | $ | 0.35 | |||||||||
| October 31, 2009 | 55.36 | 49.08 | 0.35 | |||||||||||||
| January 31, 2010 | 63.00 | 51.19 | 0.35 | |||||||||||||
| April 30, 2010 | 63.50 | 57.72 | 0.40 | |||||||||||||
2009 |
July 31, 2008 | $ | 55.58 | $ | 40.18 | $ | 0.32 | |||||||||
| October 31, 2008 | 56.69 | 40.08 | 5.32 | |||||||||||||
| January 31, 2009 | 46.00 | 37.22 | 0.32 | |||||||||||||
| April 30, 2009 | 46.49 | 34.09 | 0.35 | |||||||||||||
16
Table of Contents
Comparison of Five-Year Cumulative Total Shareholder Return
Among The J. M. Smucker Company, the S&P 500 Index, and the S&P Packaged Foods & Meats Index
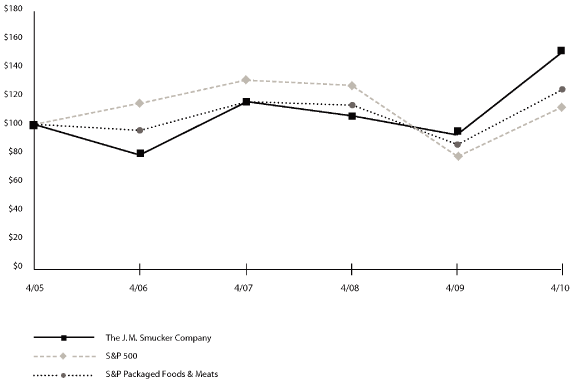
| April 30, | ||||||||||||||||||||||||
| 2005 | 2006 | 2007 | 2008 | 2009 | 2010 | |||||||||||||||||||
The J. M. Smucker Company |
$ | 100.00 | $ | 80.99 | $ | 118.04 | $ | 107.88 | $ | 96.14 | $ | 153.20 | ||||||||||||
S&P 500 |
100.00 | 115.42 | 133.00 | 126.78 | 82.01 | 113.87 | ||||||||||||||||||
S&P Packaged Foods & Meats |
100.00 | 96.76 | 115.60 | 113.50 | 89.84 | 125.77 | ||||||||||||||||||
The above graph compares the cumulative total shareholder return for the five years ended April 30,
2010, for the Company’s common shares, the S&P 500 Index, and the S&P Packaged Foods and Meats
Index. These figures assume all dividends are reinvested when received and are based on $100
invested in the Company’s common shares and the referenced index funds on April 30, 2005.
Copyright© 2010 Standard & Poor’s, a division of The McGraw-Hill Companies Inc. All rights reserved.
www.researchdatagroup.com/S&P.htm
www.researchdatagroup.com/S&P.htm
17
Table of Contents
Management’s Discussion and Analysis
EXECUTIVE SUMMARY
For more than 100 years, The J. M. Smucker Company (“Company”), headquartered in Orrville, Ohio,
has been committed to offering consumers trusted, quality products that help families create
memorable mealtime moments. Today, the Company is a leading marketer and manufacturer of fruit
spreads, retail packaged coffee, peanut butter, shortening and oils, sweetened condensed milk,
ice cream toppings, and health and natural foods beverages in North America.
Its family of brands includes Smucker’s, Folgers, Jif, Crisco, Pillsbury, Eagle Brand, R.W.
Knudsen Family, Hungry Jack, and Martha White in the United States, along with Robin Hood, Five
Roses, Carnation, Europe’s Best, and Bick’s in Canada. In addition to these brands, the Company
markets products under numerous other brands, including Dunkin’ Donuts, Millstone, Dickinson’s,
Laura Scudder’s, Adams, Double Fruit (Canada), and Santa Cruz Organic.
The Company has four reportable segments: U.S. Retail Coffee Market, U.S. Retail Consumer Market,
U.S. Retail Oils and Baking Market, and Special Markets. The Company’s three U.S. retail market
segments in total comprised over 80 percent of the Company’s net sales in fiscal 2010 and
represent a major portion of the strategic focus area for the Company — the sale of branded food
products with leadership positions to consumers through retail outlets in North America. The
Special Markets segment represents sales outside of the U.S. retail market segments and includes
the Company’s Canada, foodservice, natural foods, and international business areas.
In each of the U.S. retail market segments, the Company’s products are sold primarily to food
retailers, food wholesalers, drug stores, club stores, mass merchandisers, discount and dollar
stores, and military commissaries. In the Special Markets segment, the Company’s products are
distributed domestically and in foreign countries through retail channels, foodservice
distributors and operators (e.g., restaurants, schools and universities, health care
operations), and health and natural foods stores and distributors.
STRATEGIC ELEMENTS
The Company remains rooted in its Basic Beliefs of Quality, People, Ethics, Growth, and
Independence, established by its founder and namesake more than a century ago. Today, these basic
beliefs still serve as a foundation for the Company’s decision making and actions.
The Company’s strategic vision is to own and market food brands which hold the number one market
position in their category, with an emphasis on North America while embracing a global
perspective. In support of this vision, the Company in recent years has expanded its portfolio of
number one and leading, iconic brands through acquisitions, most recently Folgers coffee in
November 2008.
The Company’s strategic long-term growth objectives are to increase net sales by six percent and
earnings per share by greater than eight percent annually. While year-to-year the net sales
contribution from acquisitions will vary, the Company expects organic growth, including new
products, to add three to four percent per year and acquisitions to contribute the remainder.
RESULTS OF OPERATIONS
On November 6, 2008, the Company completed a merger transaction with The Folgers Coffee Company
(“Folgers”), previously a subsidiary of The Procter & Gamble Company. The transaction was
accounted for as a purchase business combination and Folgers is included in the Company’s
consolidated financial statements from the date of the merger. Because the transaction closed
during the first week of the fiscal 2009 third quarter, incremental Folgers business,
approximating six months of operations, is included in fiscal 2010 (“incremental Folgers
business”).
18
Table of Contents
| Year Ended April 30, | ||||||||||||||||||||
| % Increase | % Increase | |||||||||||||||||||
| (Dollars in millions, except per share data) | 2010 | (Decrease) | 2009 | (Decrease) | 2008 | |||||||||||||||
Net sales |
$ | 4,605.3 | 23 | % | $ | 3,757.9 | 49 | % | $ | 2,524.8 | ||||||||||
Operating income |
$ | 789.9 | 75 | % | $ | 451.0 | 59 | % | $ | 284.2 | ||||||||||
% of net sales |
17.2 | % | 12.0 | % | 11.3 | % | ||||||||||||||
Net income: |
||||||||||||||||||||
Income |
$ | 494.1 | 86 | % | $ | 266.0 | 56 | % | $ | 170.4 | ||||||||||
Income per common share — assuming dilution |
$ | 4.15 | 33 | % | $ | 3.11 | 4 | % | $ | 3.00 | ||||||||||
Operating income before restructuring and
merger and integration costs (1) |
$ | 829.3 | 55 | % | $ | 533.9 | 80 | % | $ | 296.9 | ||||||||||
% of net sales |
18.0 | % | 14.2 | % | 11.8 | % | ||||||||||||||
Income before restructuring and merger and
integration costs: (2) |
||||||||||||||||||||
Income |
$ | 520.8 | 62 | % | $ | 321.6 | 80 | % | $ | 178.9 | ||||||||||
Income per common share — assuming dilution |
$ | 4.37 | 16 | % | $ | 3.76 | 19 | % | $ | 3.15 | ||||||||||
(1) Reconciliation to operating income: |
||||||||||||||||||||
Operating income |
$ | 789.9 | $ | 451.0 | $ | 284.2 | ||||||||||||||
Merger and integration costs |
33.7 | 72.7 | 8.0 | |||||||||||||||||
Cost of products sold — restructuring |
3.9 | — | 1.5 | |||||||||||||||||
Other restructuring costs |
1.8 | 10.2 | 3.2 | |||||||||||||||||
Operating income before restructuring and
merger and integration costs |
$ | 829.3 | $ | 533.9 | $ | 296.9 | ||||||||||||||
(2) Reconciliation to net income: |
||||||||||||||||||||
Income before income taxes |
$ | 730.8 | $ | 396.1 | $ | 254.8 | ||||||||||||||
Merger and integration costs |
33.7 | 72.7 | 8.0 | |||||||||||||||||
Cost of products sold — restructuring |
3.9 | — | 1.5 | |||||||||||||||||
Other restructuring costs |
1.8 | 10.2 | 3.2 | |||||||||||||||||
Income before income taxes, restructuring,
and merger and integration costs |
$ | 770.2 | $ | 479.0 | $ | 267.5 | ||||||||||||||
Income taxes |
249.4 | 157.4 | 88.6 | |||||||||||||||||
Income before restructuring and
merger and integration costs |
$ | 520.8 | $ | 321.6 | $ | 178.9 | ||||||||||||||
— Summary of 2010 —
Net sales, margins, and earnings per share growth was
realized in 2010 as the incremental Folgers business and
improved profitability across all of the Company’s
reportable segments contributed to the improvements.
Company net sales increased 23 percent as incremental
Folgers business more than offset the impact of price
reductions in certain categories resulting from
generally lower commodity costs in 2010 compared to
2009. Operating income increased 75 percent, and
excluding restructuring and merger and integration
costs, increased 55 percent as the Company realized the
first full year of synergies associated with the Folgers
merger and the benefit of favorable green coffee costs.
Net income per common share – assuming dilution
increased approximately 33 percent. Excluding
restructuring and merger and integration costs, income
per common share – assuming dilution increased
approximately 16 percent in 2010 compared to 2009.
— Summary of 2009 —
The Company realized strong sales and margin growth in
2009. Despite the impact of a global recession and credit
crisis, the impact of the Folgers transaction and
improved profitability in the Company’s U.S. Retail Oils
and Baking Market segment contributed to the strong 2009
performance. Company net sales increased 49 percent, led
by the contributions from Folgers. Operating and net
income increased 59 percent and 56 percent, respectively,
and each increased 80 percent excluding restructuring and
merger and integration costs. Net income per common share
– assuming dilution increased approximately four percent,
reflecting the impact of additional common shares issued,
increased interest expense, and increased merger and
integration costs, all related to the Folgers
transaction. Excluding restructuring and merger and
integration costs, income per common share – assuming
dilution increased 19 percent.
19
Table of Contents
— Net Sales —
2010 Compared to 2009
| Year Ended April 30, | ||||||||||||||||
| Increase | ||||||||||||||||
| (Dollars in millions) | 2010 | 2009 | (Decrease) | % | ||||||||||||
Net sales |
$ | 4,605.3 | $ | 3,757.9 | $ | 847.4 | 23 | % | ||||||||
Adjust for
noncomparable items: |
||||||||||||||||
Acquisitions |
(920.9 | ) | — | (920.9 | ) | (25 | ) | |||||||||
Divestiture |
— | (6.3 | ) | 6.3 | 1 | |||||||||||
Foreign currency
exchange |
(23.4 | ) | — | (23.4 | ) | (1 | ) | |||||||||
Net sales without
acquisitions, divestiture,
and foreign currency
exchange |
$ | 3,661.0 | $ | 3,751.6 | $ | (90.6 | ) | (2 | )% | |||||||
Net sales increased $847.4 million, or 23 percent,
to $4,605.3 million in 2010 compared to $3,757.9 million
in 2009. Acquisitions, primarily incremental Folgers
business, contributed $920.9 million to 2010 net sales.
Excluding acquisitions, the potato business divested in
March 2010, and the impact of foreign currency exchange,
net sales were down two percent in 2010 compared to 2009
primarily due to pricing.
Excluding the incremental Folgers business and
divestiture, volume increased one percent in 2010
compared to 2009, with gains across most of the
Company’s leading brands including Pillsbury flour,
baking mixes, and frostings, Jif peanut butter, Crisco
shortening and oils, Robin Hood baking products in
Canada, Hungry Jack pancakes and syrups, and Smucker’s
fruit spreads. Volume declines were primarily in private
label canned milk, regional baking brands, and Europe’s
Best frozen fruit in Canada. The overall favorable
impact of volume growth on net sales was more than
offset by a three percent price and mix decline,
attributable primarily to price reductions in the U.S.
Retail Oils and Baking Market segment, and an increase
in promotional spending across several categories.
2009 Compared to 2008
| Year Ended April 30, | ||||||||||||||||
| Increase | ||||||||||||||||
| (Dollars in millions) | 2009 | 2008 | (Decrease) | % | ||||||||||||
Net sales |
$ | 3,757.9 | $ | 2,524.8 | $ | 1,233.1 | 49 | % | ||||||||
Adjust for
noncomparable items: |
||||||||||||||||
Acquisitions |
(1,032.4 | ) | — | (1,032.4 | ) | (41 | ) | |||||||||
Foreign currency
exchange |
35.2 | — | 35.2 | 1 | ||||||||||||
Net sales without
acquisitions and
foreign currency
exchange |
$ | 2,760.7 | $ | 2,524.8 | $ | 235.9 | 9 | % | ||||||||
Net sales were $3,757.9 million in 2009, an increase
of $1,233.1 million, or 49 percent, compared to 2008.
Acquisitions contributed approximately $1,032.4 million
of the increase, including $924.8 million from Folgers,
while the foreign currency exchange impact, primarily
due to the weakening Canadian dollar, reduced net sales
by approximately $35.2 million. Excluding acquisitions
and foreign currency exchange, net sales increased nine
percent. The increase reflects a net pricing and mix
gain, which offset a two percent volume decline.
Despite the overall volume decline, a number of
categories experienced gains, including Smucker’s fruit
spreads, toppings, and syrups, Pillsbury baking mixes
and frostings, Hungry Jack pancakes, syrups, and potato
side dishes, and Eagle Brand canned milk. Volume
declines were concentrated in oils and flour, as
anticipated, due to significant price increases taken
over the prior year in these categories, and peanut
butter products due to the U.S. Food and Drug
Administration’s (“FDA”) recall of another
manufacturer’s foodservice peanut butter and ingredient
peanut products during the first quarter of the 2009
calendar year.
— Operating Income —
The following table presents components of operating
income as a percentage of net sales.
| Year Ended April 30, | ||||||||||||
| 2010 | 2009 | 2008 | ||||||||||
Gross profit |
38.8 | % | 33.3 | % | 31.0 | % | ||||||
Selling, distribution,
and administrative expenses: |
||||||||||||
Marketing |
3.8 | % | 3.7 | % | 3.5 | % | ||||||
Advertising |
2.8 | 2.1 | 2.2 | |||||||||
Selling |
3.3 | 3.5 | 4.0 | |||||||||
Distribution |
3.3 | 3.5 | 3.4 | |||||||||
General and administrative |
5.9 | 5.1 | 6.2 | |||||||||
Total selling, distribution,
and administrative expenses |
19.1 | % | 17.9 | % | 19.3 | % | ||||||
Amortization |
1.6 | 1.0 | 0.1 | |||||||||
Impairment charges |
0.3 | 0.1 | 0.0 | |||||||||
Restructuring and merger
and integration costs |
0.8 | 2.2 | 0.4 | |||||||||
Other operating (income)
expense – net |
(0.2 | ) | 0.1 | (0.1 | ) | |||||||
Operating income |
17.2 | % | 12.0 | % | 11.3 | % | ||||||
2010 Compared to 2009
Gross profit increased $535.3 million, or 43 percent, in
2010 compared to 2009, and improved to 38.8 percent of
net sales from 33.3 percent over the same period. Much
of the gross profit improvement is attributable to
incremental Folgers business and other coffee-related
impacts in 2010 compared to 2009, primarily favorable
green coffee costs and volume-related plant
efficiencies.
20
Table of Contents
Lower other raw material costs, notably oils, flour, and
milk, and freight costs across the businesses also
favorably impacted gross margin in 2010 compared to 2009.
Selling, distribution, and administrative (“SD&A”)
expenses increased 30 percent in 2010 compared to 2009,
primarily due to incremental Folgers business and the
larger company. Marketing expense, including advertising
expense, increased approximately 39 percent in 2010
compared to 2009, as the Company made a record investment
in print, online, and television advertisement in support
of its largest brands. Advertising expense was $130.6
million in 2010 compared to $77.4 million in 2009.
Selling and distribution expenses both increased 17
percent in 2010 compared to 2009, as the impact of
synergies related to the Folgers merger partially offset
the expense impact of the incremental Folgers business.
General and administrative expenses increased 38 percent
in 2010 compared to 2009, as 2009 did not include
expenses to fully support the Folgers business. Increased
pension and other employee benefit costs, and costs
related to the closure of the Company’s West Fargo, North
Dakota, manufacturing facility are also included in 2010.
Amortization expense, a noncash item, was $73.7 million
in 2010, an increase of $34.8 million from 2009,
reflecting the full-year impact of intangible assets
associated with the Folgers transaction. Noncash
impairment charges of $11.7 million were recognized in
2010 resulting from the write-down to estimated fair
value of certain of the Company’s intangible assets,
primarily the Europe’s Best trademark in Canada.
Other operating income – net of $2.3 million was
recognized in 2010 resulting from a $12.9 million gain
recognized on the divestiture of the potato business
which offset losses on the disposition of assets no
longer used in manufacturing operations. Other operating
expense – net of $3.6 million was recognized in 2009
consisting of losses on the disposition of assets.
Driven by gross profit improvements, operating income
increased 75 percent in 2010 compared to 2009, and
improved from 12.0 percent to 17.2 percent of net sales.
Restructuring and merger and integration costs were $43.5
million lower in 2010 compared to 2009, as integration
activities related to Folgers were near completion and
restructuring costs had minimal impact.
2009 Compared to 2008
Overall, gross profit increased $469.3 million and
improved from 31.0 percent in 2008 to 33.3 percent of net
sales in 2009. The primary driver of the gross profit
improvement was the addition of Folgers. The Company
improved gross profit on its noncoffee business by
approximately 12 percent despite higher costs, estimated
at $135 million, on many key ingredients compared to
2008. During 2009, pricing came more in line with these
higher costs, contributing to the gross profit increase.
In addition, costs on certain raw materials stabilized
during the year, and in some cases decreased, allowing
the Company to continue to recover margin lost over the
past few years while also returning some pricing to
customers.
SD&A expenses increased $187.0 million, or 38 percent, in
2009 compared to 2008. An increase in marketing and
distribution expenses, much of which was related to the
addition of Folgers, accounted for approximately 63
percent of the SD&A increase. Most SD&A expenses,
particularly selling and corporate overhead, increased at
a lesser rate than net sales resulting in an overall
decrease in SD&A expense as a percent of net sales from
19.3 percent to 17.9 percent, further contributing to the
improvement in operating margin. General and
administrative expense in 2009 did not include
administrative expenses to fully support the Folgers
business.
Amortization expense increased $34.8 million to 1.0
percent of net sales compared to 0.1 percent of net sales
in the same period in 2008 reflecting the addition of
finite-lived intangible assets associated with the
Folgers transaction.
Other operating expense – net of $3.6 million was
recognized in 2009 consisting of losses on the
disposition of assets. Other operating income – net of
$3.9 million was recognized in 2008 resulting from a net
insurance settlement related to storm damage at a
third-party distribution and warehouse facility in
Memphis, Tennessee.
Operating income increased 59 percent in 2009 compared to
2008, and improved from 11.3 percent to 12.0 percent of
net sales. Restructuring and merger and integration costs
were $70.2 million higher in 2009 compared to 2008, as
integration activities related to Folgers commenced. In
addition, a defined benefit pension settlement charge
related to the Company’s divested Canadian businesses was
finalized, reducing operating margin by 2.2 percentage
points.
— Interest Income and Expense —
Interest income decreased $4.2 million during 2010
compared to 2009, primarily due to a decrease in the
average investment balance throughout the year. Interest
expense increased $2.7 million in 2010 compared to 2009,
reflecting an increase in the Company’s debt obligations
during the first half of 2010 compared to the first half
of 2009 resulting from the October 2008 issuance of $400.0
million in Senior Notes with a weighted-average interest
rate of 6.60 percent, and the addition of Folgers’ $350.0
million LIBOR-based variable rate bank note payable at the
merger date. The interest incurred on these additional
borrowings was mostly offset by a reduction in interest
expense resulting from the scheduled repayments of Senior
Notes of $75.0 million and $200.0 million in June and
November 2009, respectively, and the Folgers’ $350.0
million bank note in November 2009.
Interest income decreased $6.3 million during 2009
compared to 2008, primarily due to a decrease in the
average investment balance and lower interest rates
throughout 2009. Interest expense increased $20.3 million
in 2009 compared to 2008, resulting from the issuance of
the $400.0 million in Senior Notes and the addition of
Folgers’ $350.0 million bank note payable at the merger
date.
21
Table of Contents
— Income Taxes —
Income taxes increased $106.5 million, or 82 percent,
during 2010 compared to 2009, slightly less than the
percentage increase in income before taxes as the
effective tax rate was 32.4 percent in 2010 compared to
32.9 percent in 2009. The effective tax rate decrease was
primarily a result of lower deferred tax rates and
increased benefits realized from the domestic
manufacturing deduction offset somewhat by increases in
state and local income taxes.
Income taxes increased $45.7 million, or 54 percent,
during 2009 compared to 2008, slightly less than the
percentage increase in income before taxes as the
effective tax rate was 32.9 percent in 2009 compared to
33.1 percent in 2008. The effective tax rate decrease was
primarily a result of an increase in the domestic
manufacturing deduction.
— Restructuring —
On March 24, 2010, the Company announced its plan to
restructure certain coffee and fruit spreads operations as
part of its ongoing efforts to enhance the long-term
strength and profitability of its leading brands. The
initiative is a long-term investment to optimize
production capacity and lower the overall cost structure
and includes capital investments for a new
state-of-the-art food manufacturing facility in Orrville,
Ohio, and consolidation of all coffee production in New
Orleans, Louisiana. The program calls for the future
closing of four of the Company’s plants – Memphis,
Tennessee; Ste. Marie, Quebec; Sherman, Texas; and Kansas City,
Missouri, over the next three years. Upon completion, the
restructuring will result in the reduction of
approximately 700 full-time positions.
The Company expects to incur restructuring costs of
approximately $190.0 million, of which $5.7 million was
recognized in 2010. The balance of the costs is
anticipated to be incurred over the next four fiscal
years, with approximately $85.0 million to $90.0 million
expected to be recognized in fiscal 2011.
— Segment Results —
The Company has four reportable segments: U.S. Retail
Coffee Market, U.S. Retail Consumer Market, U.S. Retail
Oils and Baking Market, and Special Markets. The U.S.
Retail Coffee Market segment represents the sales of
Folgers, Millstone, and Dunkin’ Donuts branded coffee;
the U.S. Retail Consumer Market segment primarily
includes sales of Smucker’s, Jif, and Hungry Jack branded
products; the U.S. Retail Oils and Baking Market segment
includes sales of Crisco, Pillsbury, Eagle Brand, Martha
White, and White Lily branded products all to domestic
retail customers; and the Special Markets segment is
comprised of the Canada, foodservice, natural foods, and
international strategic business areas. Special Markets
segment products are distributed domestically and in
foreign countries through retail channels, foodservice
distributors and operators (e.g., restaurants, schools
and universities, health care operations), and health and
natural foods stores and distributors.
| Year Ended April 30, | ||||||||||||||||||||
| % Increase | % Increase | |||||||||||||||||||
| (Dollars in millions) | 2010 | (Decrease) | 2009 | (Decrease) | 2008 | |||||||||||||||
Net sales: |
||||||||||||||||||||
U.S. Retail Coffee Market |
$ | 1,700.5 | 99 | % | $ | 855.6 | n/a | $ | — | |||||||||||
U.S. Retail Consumer Market |
1,125.3 | 2 | 1,103.3 | 10 | % | 998.6 | ||||||||||||||
U.S. Retail Oils and Baking Market |
905.7 | (9 | ) | 995.5 | 14 | 876.0 | ||||||||||||||
Special Markets |
873.8 | 9 | 803.6 | 24 | 650.2 | |||||||||||||||
Segment profit: |
||||||||||||||||||||
U.S. Retail Coffee Market |
$ | 550.8 | 129 | % | $ | 241.0 | n/a | $ | — | |||||||||||
U.S. Retail Consumer Market |
275.0 | 10 | 249.3 | 7 | % | 233.2 | ||||||||||||||
U.S. Retail Oils and Baking Market |
142.2 | 15 | 124.2 | 25 | 99.6 | |||||||||||||||
Special Markets |
148.8 | 33 | 111.7 | 21 | 92.0 | |||||||||||||||
Segment profit margin: |
||||||||||||||||||||
U.S. Retail Coffee Market |
32.4 | % | 28.2 | % | n/a | |||||||||||||||
U.S. Retail Consumer Market |
24.4 | 22.6 | 23.4 | % | ||||||||||||||||
U.S. Retail Oils and Baking Market |
15.7 | 12.5 | 11.4 | |||||||||||||||||
Special Markets |
17.0 | 13.9 | 14.2 | |||||||||||||||||
22
Table of Contents
U.S. Retail Coffee Market
U.S. Retail Coffee Market segment net sales nearly
doubled in 2010 compared to 2009, including incremental
Folgers business totaling approximately $840.6 million.
Volume increased approximately four percent compared to
the same full 12-month period last year, which included
the period prior to the merger, approximating six months
of operations. The Folgers brand contributed the
majority of the volume increase compared to last year.
Continued growth of Dunkin’ Donuts coffee also
contributed double-digit volume growth and nearly $250.0
million in net sales for 2010. The U.S. Retail Coffee
Market segment profit more than doubled to $550.8
million in 2010 compared to $241.0 million in 2009, and
improved to 32.4 percent of net sales from 28.2 percent
in 2009. The 2010 segment profit margin was favorably
impacted by green coffee cost, product mix, and
volume-related plant efficiencies which offset
significantly increased marketing investments.
The U.S. Retail Coffee Market segment contributed $855.6
million to net sales in 2009, from the date acquired, as
the business benefited from growth in the coffee
category, primarily driven by the Folgers brand. The
expansion of the Dunkin’ Donuts brand contributed
approximately $106.8 million of the net sales in 2009.
The U.S. Retail Coffee Market segment contributed $241.0
million in segment profit representing a profit margin
of 28.2 percent.
U.S. Retail Consumer Market
U.S. Retail Consumer Market segment net sales increased
two percent in 2010 compared to 2009. Total volume in
the U.S. Retail Consumer Market increased four percent
compared to 2009, with gains in Hungry Jack pancake
mixes and syrups, Jif peanut butter, and Smucker’s fruit
spreads. Volume gains were somewhat offset by increases
in promotional spending and price declines on selected
items. During March 2010, the Company divested the
potato business in a $19.0 million cash transaction
realizing a gain of approximately $12.9 million on the
divestiture, which is not included in segment profit.
U.S. Retail Consumer Market segment profit increased 10
percent for 2010 compared to 2009, mainly due to lower
raw material and freight costs offset by an eight
percent increase in marketing expense. Segment profit
margin improved from 22.6 percent in 2009 to 24.4
percent in 2010.
Net sales in the U.S. Retail Consumer Market segment
increased 10 percent in 2009 to $1,103.3 million
compared to $998.6 million in 2008. Acquisitions,
primarily Knott’s Berry Farm brand, contributed
approximately $25.7 million of the net sales. Volume
gains in Smucker’s fruit spreads, toppings, and syrups,
and Hungry Jack pancakes, syrups, and potato side
dishes, combined with price increases, offset volume
declines in peanut butter and Smucker’s Uncrustables
sandwiches of approximately two and three percent,
respectively. During January 2009, the FDA initiated a
recall of another manufacturer’s foodservice peanut
butter and ingredient peanut products. As a result,
volume in the retail peanut butter
category declined approximately seven percent in the
food, drug, and mass retail stores channel as estimated
by Information Resources, Inc. for the 12-week period
ended April 19, 2009. The Company’s peanut butter
products experienced a lesser decline.
U.S. Retail Consumer Market segment profit increased
seven percent in 2009 compared to 2008, while decreasing
as a percentage of net sales from 23.4 percent to 22.6
percent. Profit margins were unfavorably impacted by
cost increases on certain raw materials, declines in
peanut butter sales during the year, and other sales mix
changes.
U.S. Retail Oils and Baking Market
Total volume in the U.S. Retail Oils and Baking Market
segment was up one percent in 2010 compared to 2009,
with strong gains in the Pillsbury and Crisco brands
mostly offset by declines in canned milk and regional
baking brands. Net sales in the U.S. Retail Oils and
Baking Market segment were down nine percent in 2010
compared to 2009, reflecting the full year impact of
price declines taken during 2009 and increased
promotional spending across the segment. The U.S. Retail
Oils and Baking Market segment profit increased 15
percent in 2010 compared to 2009, resulting in segment
profit margin increasing to 15.7 percent compared to
12.5 percent in 2009, primarily due to lower raw
material costs.
Net sales in the U.S. Retail Oils and Baking Market
segment increased 14 percent in 2009 to $995.5 million
from $876.0 million in 2008. Increases in Pillsbury,
Crisco, and Eagle Brand canned milk, primarily due to
the effect of price increases taken in the later part of
2008, and volume gains in baking mixes, frostings, and
canned milk accounted for the increase. While total
volume in the segment was down almost four percent, much
of the decline was expected and reflects the impact of
price increases in oils and flour over the past year.
Segment profit increased 25 percent in 2009 compared to
2008, and improved from 11.4 percent of net sales to
12.5 percent despite higher costs on many key
ingredients. Pricing at the end of 2009 was more in line
with these higher costs resulting in margin recoveries
in oils, canned milk, and regional baking brands.
Special Markets
Net sales in the Special Markets segment increased nine
percent in 2010 compared to 2009, due to a favorable
exchange rate impact of $23.4 million and incremental
Folgers business totaling approximately $78.3 million.
Net sales, excluding acquisitions and foreign exchange,
decreased four percent over the same period. Volume
decreased two percent, excluding incremental Folgers
business, in 2010 compared to 2009. Gains in Canada’s
baking and spreads categories and coffee in the
foodservice and export businesses were offset by
declines in Europe’s Best frozen fruit in Canada,
natural foods beverages, and foodservice portion
control. The impact of the overall volume decline,
combined with lower prices and increases in promotional
spending, resulted in the net sales
23
Table of Contents
decline, excluding acquisitions and foreign exchange.
Special Markets segment profit increased 33 percent in
2010 compared to 2009, primarily due to the impact of
increased coffee sales and lower raw material costs.
Profit margin improved from 13.9 percent in 2009 to 17.0
percent in 2010.
Net sales in the Special Markets segment were $803.6
million in 2009, an increase of 24 percent from 2008, as
acquisitions and pricing gains offset unfavorable
foreign currency exchange. The merger with Folgers added
$69.2 million of the increase and the Knott’s Berry
Farm, Europe’s Best, and the Canadian Carnation canned
milk business acquisitions contributed $81.9 million.
The gains from merger and acquisitions and pricing more
than offset volume declines in the foodservice portion
control business resulting from a general decline in
away-from-home dining, and Smucker Uncrustables
sandwiches and other peanut butter products correlated
to the FDA recall of another manufacturer’s food-service
peanut butter and ingredient peanut products. Consumer
demand for natural foods products was also soft due to
the general economic environment. Special Markets
segment profit increased 21 percent from 2008 to 2009,
while decreasing as a percentage of net sales from 14.2
percent in 2008 to 13.9 percent in 2009 as profit
margins were impacted by the acquisitions.
FINANCIAL CONDITION
— Liquidity —
| Year Ended April 30, | ||||||||||||
| (Dollars in millions) | 2010 | 2009 | 2008 | |||||||||
Net cash provided by
operating activities |
$ | 713.5 | $ | 447.0 | $ | 182.9 | ||||||
Net cash used for
investing activities |
(104.4 | ) | (177.0 | ) | (265.9 | ) | ||||||
Net cash (used for)
provided by
financing activities |
(788.5 | ) | 12.6 | 49.8 | ||||||||
Net cash provided by
operating activities |
$ | 713.5 | $ | 447.0 | $ | 182.9 | ||||||
Additions to property,
plant, and equipment |
(137.0 | ) | (108.9 | ) | (76.4 | ) | ||||||
Free cash flow |
$ | 576.5 | $ | 338.1 | $ | 106.5 | ||||||
The Company’s principal source of funds is cash
generated from operations, supplemented by borrowings
against the Company’s revolving credit facilities. Total
cash and cash equivalents declined to $283.6 million at
April 30, 2010, compared to $456.7 million at
April 30, 2009, as strong cash flow generated by
operations was offset by debt repayments in 2010.
The Company expects a significant use of cash during the
first half of each fiscal year, primarily due to
seasonal fruit and vegetable procurement, the buildup of
inventories to support the Fall Bake and Holiday period,
and the additional increase of coffee inventory in
advance of the Atlantic hurricane season. The Company
expects cash provided by operations in the second half
of the year to
significantly exceed the amount in the first half of the
year, upon completion of the Company’s key promotional
periods.
Cash provided by operations in 2010 was $713.5 million,
an increase of $266.5 million compared to $447.0 million
in 2009, resulting from increased earnings primarily
associated with the incremental Folgers business.
Increased cash provided by operations resulted in an
increase in free cash flow to $576.5 million in 2010
from $338.1 million in 2009. Working capital also
favorably impacted cash provided by operations in 2010
compared to 2009. Working capital, excluding cash and
cash equivalents and current debt, improved to 10.2
percent of net sales in 2010.
Cash used for investing activities was approximately
$104.4 million in 2010, consisting primarily of capital
expenditures of approximately $137.0 million offset by
approximately $19.6 million in proceeds from the sale of
businesses, primarily the potato divestiture, and $13.5
million in proceeds from the sale of available-for-sale
investment securities. Cash used for investing was
approximately $177.0 million in 2009, including capital
expenditures of approximately $108.9 million and the use
of approximately $77.3 million for acquisitions,
primarily the Knott’s Berry Farm business and the cash
portion of the Folgers transaction. The increase in
capital expenditures in 2010 compared to 2009 was
primarily due to the addition of Folgers.
Cash used for financing activities during 2010 was
approximately $788.5 million, consisting primarily of
the repayments of $275.0 million of Senior Notes and
$350.0 million of Folgers’ bank note payable, and
quarterly dividend payments of $166.2 million. Cash
provided by financing activities during 2009 consisted
primarily of the proceeds from the Company’s $400.0
million Senior Notes placement. A portion of the
proceeds was used to fund the payment of a $5.00 per
share one-time special dividend, totaling approximately
$274.2 million, on October 31, 2008. In addition,
quarterly dividend payments of approximately $110.7
million were made in 2009.
24
Table of Contents
— Capital Resources —
The following table presents the Company’s capital structure.
| April 30, | ||||||||
| (Dollars in millions) | 2010 | 2009 | ||||||
Note payable |
$ | — | $ | 350.0 | ||||
Current portion of long-term debt |
10.0 | 276.7 | ||||||
Long-term debt |
900.0 | 910.0 | ||||||
Total debt |
$ | 910.0 | $ | 1,536.7 | ||||
Shareholders’ equity |
5,326.3 | 4,939.9 | ||||||
Total capital |
$ | 6,236.3 | $ | 6,476.6 | ||||
The Company has available a $180.0 million revolving
credit facility with a group of three banks that expires
in January 2011 and a $400.0 million revolving credit
facility with a group of five banks that expires in
October 2012. The Company’s debt repayments in 2010
utilized a combination of cash on hand and borrowings
against the $180.0 million credit facility. The Company
subsequently paid off the borrowings against the credit
facility and no amounts were outstanding against either
revolving credit facility at April 30, 2010.
On June 15, 2010, the Company issued $400.0 million in
4.5 percent Senior Notes with a final maturity on June
1, 2025. The Senior Notes have a 12-year average
maturity with required prepayments starting on June 1,
2020. Proceeds from the Senior Notes issuance will be
used for general corporate purposes.
Cash requirements for 2011 will include capital
expenditures of approximately $235.0 million, including
amounts related to the announced restructuring programs,
quarterly dividends of approximately $190.0 million, and
interest and principal payments on debt obligations of
approximately $62 million and $10 million, respectively,
for the year. Absent any material acquisitions or other
significant investments, the Company believes that cash
on hand, combined with cash provided by operations, new
financing, and borrowings available under existing credit
facilities will be sufficient to meet cash requirements
for the next 12 months, including capital expenditures,
the payment of quarterly dividends, and principal and
interest on debt outstanding.
NON-GAAP MEASURES
The Company uses non-GAAP measures including net sales
excluding acquisitions, divestitures, and foreign
exchange rate impact; income, operating income, and
income per diluted share, excluding restructuring and
merger and integration costs; and free cash flow as key
measures for purposes of evaluating performance
internally. These non-GAAP measures are not intended to
replace the presentation of financial results in
accordance with U.S. generally accepted
accounting principles. Rather, the presentation of these
non-GAAP measures supplement other metrics used by
management to
internally evaluate its businesses, and facilitate the
comparison of past and present operations. These
non-GAAP measures may not be comparable to similar
measures used by other companies and may exclude certain
nondiscretionary expenses and cash payments.
OFF-BALANCE SHEET ARRANGEMENTS
AND CONTRACTUAL OBLIGATIONS
AND CONTRACTUAL OBLIGATIONS
The Company does not have off-balance sheet
arrangements, financings, or other relationships with
unconsolidated entities or other persons, also known as
variable interest entities. Transactions with related
parties are in the ordinary course of business,
conducted at an arm’s length basis, and not material to
the Company’s results of operations, financial
condition, or cash flows.
The following table summarizes the Company’s contractual
obligations at April 30, 2010.
| More | ||||||||||||||||||||
| Less | One | Three | Than | |||||||||||||||||
| Than | to Three | to Five | Five | |||||||||||||||||
| (Dollars in millions) | Total | One Year | Years | Years | Years | |||||||||||||||
Debt obligations |
$ | 910.0 | $ | 10.0 | $ | — | $ | 200.0 | $ | 700.0 | ||||||||||
Operating lease
obligations |
122.9 | 27.5 | 51.5 | 28.5 | 15.4 | |||||||||||||||
Purchase
obligations |
1,142.8 | 980.8 | 162.0 | — | — | |||||||||||||||
Other noncurrent
liabilities |
150.5 | — | — | — | 150.5 | |||||||||||||||
Total |
$ | 2,326.2 | $ | 1,018.3 | $ | 213.5 | $ | 228.5 | $ | 865.9 | ||||||||||
Purchase obligations in the above table include
agreements to purchase goods or services that are
enforceable and legally binding on the Company. Included
in this category are certain obligations related to
normal, ongoing purchase obligations in which the Company
has guaranteed payment to ensure availability of raw
materials and packaging supplies. The Company expects to
receive consideration for these purchase obligations in
the form of materials. The purchase obligations in the
above table do not represent the entire anticipated
purchases in the future, but represent only those items
for which the Company is contractually obligated. The
table excludes the liability for unrecognized tax
benefits under Financial Accounting Standards Board
(“FASB”) Accounting Standards Codification 740, Income
Taxes (“ASC 740”), since the Company is unable to
reasonably estimate the timing of cash settlements with
the respective taxing authorities. As of April 30, 2010,
the Company’s liability for unrecognized tax benefits and
tax-related net interest and penalties was $15.3 million
and $2.3 million, respectively.
25
Table of Contents
CRITICAL ACCOUNTING ESTIMATES AND POLICIES
The preparation of financial statements in conformity
with U.S. generally accepted accounting principles
requires management to make estimates and assumptions
that in certain circumstances affect amounts reported in
the accompanying consolidated financial statements. In
preparing these financial statements, management has
made its best estimates and judgments of certain amounts
included in the financial statements, giving due
consideration to materiality. The Company does not
believe there is a great likelihood that materially
different amounts would be reported under different
conditions or using different assumptions related to the
accounting policies described below. However,
application of these accounting policies involves the
exercise of judgment and use of assumptions as to future
uncertainties and, as a result, actual results could
differ from these estimates.
Revenue Recognition. The Company recognizes revenue when
all of the following criteria have been met: a valid
customer order with a determinable price has been
received; the product has been shipped and title has
transferred to the customer; there is no further
significant obligation to assist in the resale of the
product; and collectibility is reasonably assured. A
provision for estimated returns and allowances is
recognized as a reduction of sales at the time revenue
is recognized.
Trade Marketing and Merchandising Programs. In order to
support the Company’s products, various promotional
activities are conducted through the retail trade,
distributors, or directly with consumers, including
in-store display and product placement programs, feature
price discounts, coupons, and other similar activities.
The Company regularly reviews and revises, when it deems
necessary, estimates of costs to the Company for these
promotional programs based on estimates of what will be
redeemed by the retail trade, distributors, or
consumers. These estimates are made using various
techniques including historical data on performance of
similar promotional programs. Differences between
estimated expense and actual performance are recognized
as a change in management’s estimate in a subsequent
period. As the Company’s total promotional expenditures,
including amounts classified as a reduction of net
sales, represented approximately 26 percent of net sales
in 2010, the likelihood exists of materially different
reported results if factors such as the level and
success of the promotional programs or other conditions
differ from expectations.
Income Taxes. The future tax benefit arising from the
net deductible temporary differences and tax
carryforwards is approximately $107.3 million and $94.7
million, at April 30, 2010 and 2009, respectively.
Management believes that the Company’s earnings during
the periods when the temporary differences become
deductible will be sufficient to realize the related
future income tax benefits. For those jurisdictions
where the expiration date of tax carryforwards or the
projected operating results of the Company indicate that
realization is not likely, a valuation allowance has
been provided.
In assessing the need for a valuation allowance, the
Company estimates future taxable income, considering the
viability of ongoing tax planning strategies and the
probable recognition of future tax deductions and loss
carryforwards. Valuation allowances related to deferred
tax assets can be affected by changes in tax laws,
statutory tax rates, and projected future taxable income
levels. Changes in estimated realization of deferred tax
assets would result in an adjustment to income in the
period in which that determination is made.
In the ordinary course of business, the Company is
exposed to uncertainties related to tax filing positions
and periodically assesses these tax positions for all
tax years that remain subject to examination, based upon
the latest information available. For uncertain tax
positions, the Company has recognized tax reserves,
including any applicable interest and penalty charges,
in accordance with ASC 740.
Long-Lived Assets. Long-lived assets are reviewed for
impairment whenever events or changes in circumstances
indicate that the carrying amount of the asset may not
be recoverable. Recoverability of assets to be held and
used is measured by a comparison of the carrying amount
of the assets to future net cash flows estimated to be
generated by such assets. If such assets are considered
to be impaired, the impairment to be recognized is the
amount by which the carrying amount of the assets
exceeds the fair value of the assets. However,
determining fair value is subject to estimates of both
cash flows and discount rates and different estimates
could yield different results. There are no events or
changes in circumstances of which management is aware
indicating that the carrying value of the Company’s
long-lived assets may not be recoverable.
Goodwill and Other Indefinite-Lived Intangible Assets.
The Company is required to test goodwill for impairment
annually and more often if indicators of impairment
exist. To test for goodwill impairment, the Company
estimates the fair value of each of its reporting units
using both a discounted cash flow valuation technique
and a market-based approach. The impairment test
incorporates the Company’s estimates of future cash
flows, allocations of certain assets, liabilities, and
cash flows among reporting units, future growth rates,
terminal value amounts, and the applicable
weighted-average cost of capital used to discount those
estimated cash flows. The estimates and projections used
in the calculation of fair value are consistent with the
Company’s current and long-range plans, including
anticipated changes in market conditions, industry
trends, growth rates, and planned capital expenditures.
Changes in forecasted operations and other estimates and
assumptions could impact the assessment of impairment in
the future.
26
Table of Contents
At April 30, 2010, goodwill totaled $2.8 billion.
Goodwill is substantially concentrated within the U.S.
Retail Coffee Market, U.S. Retail Consumer Market, and
U.S. Retail Oils and Baking Market segments. No goodwill
impairment was recognized as a result of the annual
evaluation performed as of February 1, 2010. The fair
value of each reporting unit was substantially in excess
of its carrying value as of the annual test date, with
the exception of the U.S. Retail Oils and Baking Market
segment. A sensitivity analysis was performed for this
reporting unit, which increased the discount rate by 50
basis points and decreased the expected long-term growth
rate by 50 basis points, and still yielded a fair value
which exceeded carrying value.
The Company’s other indefinite-lived intangible assets,
mainly trademarks, are also tested for impairment
annually and whenever events or changes in circumstances
indicate their carrying value may not be recoverable. To
test these assets for impairment, the Company estimates
the fair value of each asset based on a discounted cash
flow model using various inputs, including projected
revenues, an assumed royalty rate, and a discount rate.
Changes in these estimates and assumptions could impact
the assessment of impairment in the future.
At April 30, 2010, other indefinite-lived intangible
assets totaled $1.8 billion. The Company has eight
trademarks which represent several of its leading, iconic
brands and comprise more than 95 percent of the total
carrying value of its other indefinite-lived intangible
assets. Each of these trademarks had a fair value
substantially in excess of its carrying value as of the
annual test date, with the exception of the recently
acquired Folgers trademark. Management has concluded that
the risk of impairment related to this trademark was
remote at April 30, 2010.
Pension and Other Postretirement Benefit Plans. To
determine the Company’s ultimate obligation under its
defined benefit pension plans and other postretirement
benefit plans, management must estimate the future cost
of benefits and attribute that cost to the time period
during which each covered employee works. Various
actuarial assumptions must be made in order to predict
and measure costs and obligations many years prior to the
settlement date, the most significant being the interest
rates used to discount the obligations of the plans, the
long-term rates of return on the plans’ assets, assumed
pay increases, and the health care cost trend rates.
Management, along with third-party actuaries and
investment managers, reviews all of these assumptions on
an ongoing basis to ensure that the most reasonable
information available is being considered. For 2011
expense recognition, the Company will use a discount rate
of 5.8 percent and 5.3 percent for the U.S. and Canadian
plans, respectively, and a rate of compensation increase
of 4.0 percent for both plans. The Company anticipates
using an expected rate of return on plan assets of 7.5
percent for U.S. plans. For the Canadian plans, the
Company
will use an expected rate of return on plan assets of
6.75 percent for the hourly plan and 7.25 percent for
all other plans.
Recovery of Trade Receivables. In the normal course of
business, the Company extends credit to customers that
satisfy predefined
criteria. The Company evaluates the collectibility of
trade receivables based on a combination of factors.
When aware that a specific customer may be unable to
meet its financial obligations, such as in the case of
bankruptcy filings or deterioration in the customer’s
operating results or financial position, the Company
records a specific reserve for bad debt to reduce the
related receivable to the amount the Company reasonably
believes is collectible. The Company also records
reserves for bad debt for all other customers based on a
variety of factors, including the length of time the
receivables are past due, historical collection
experience, and an evaluation of current and projected
economic conditions at the balance sheet date. Actual
collections of trade receivables could differ from
management’s estimates due to changes in future economic
or industry conditions or specific customers’ financial
conditions.
DERIVATIVE FINANCIAL INSTRUMENTS
AND MARKET RISK
AND MARKET RISK
The following discussions about the Company’s market
risk disclosures involve forward-looking statements.
Actual results could differ from those projected in the
forward-looking statements. The Company is exposed to
market risk related to changes in interest rates,
foreign currency exchange rates, and commodity prices.
Interest Rate Risk. The fair value of the Company’s cash
and short-term investment portfolio at April 30, 2010,
approximates carrying value. Exposure to interest rate
risk on the Company’s long-term debt is mitigated since
it is at a fixed rate until maturity. Based on the
Company’s overall interest rate exposure as of and
during the year ended April 30, 2010, including
derivative and other instruments sensitive to interest
rates, a hypothetical 10 percent movement in interest
rates would not materially affect the Company’s results
of operations. Interest rate risk can also be measured
by estimating the net amount by which the fair value of
the Company’s financial liabilities would change as a
result of movements in interest rates. Based on a
hypothetical one-percentage point decrease in interest
rates at April 30, 2010, the fair value of the Company’s
long-term debt would increase by approximately $35.8
million.
Foreign Currency Exchange Risk. The Company has
operations outside the U.S. with foreign currency
denominated assets and liabilities, primarily in Canada.
Because the Company has foreign currency denominated
assets and liabilities, financial exposure may result,
primarily from the timing of transactions and the
movement of exchange rates. The foreign currency balance
sheet
27
Table of Contents
exposures as of April 30, 2010, are not expected to
result in a significant impact on future earnings or
cash flows.
The Company utilizes foreign currency exchange forwards
and options contracts to manage the price volatility of
foreign currency exchange fluctuations on future cash
transactions. The contracts generally have maturities of
less than one year. The mark-to-market gains and losses
on qualifying hedges are included as a component of
other comprehensive income, and reclassified to earnings
in the period the contract is executed. The ineffective
portion of these contracts is immediately recognized in
earnings. Instruments currently used to manage foreign
currency exchange exposures do not meet the requirements
for hedge accounting treatment and the change in value
of these instruments is immediately recognized in cost
of products sold. Based on the Company’s hedged foreign
currency positions as of April 30, 2010, a hypothetical
10 percent change in exchange rates would result in a
loss of fair value of approximately $4.3 million.
Revenues from customers outside the U.S. represented 10
percent of net sales during 2010. Thus, certain revenues
and expenses have been, and are expected to be, subject
to the effect of foreign currency fluctuations, and
these fluctuations may have an impact on operating
results.
Commodity Price Risk. Raw materials and other
commodities used by the Company are subject to price
volatility caused by supply and demand conditions,
political and economic variables, and other
unpredictable factors. To manage the volatility related
to anticipated commodity purchases, the Company uses
futures and options with maturities generally less than
one year. Certain of these instruments are designated as
cash flow hedges.
The mark-to-market gains or losses on qualifying
hedges are included in other comprehensive income to
the extent effective, and reclassified into cost of
products sold in the period during which the hedged
transaction affects earnings. The mark-to-market gains
or losses on nonqualifying, excluded, and ineffective
portions of hedges are recognized in cost of products
sold immediately.
The following sensitivity analysis presents the
Company’s potential loss of fair value resulting from
a hypothetical 10 percent change in market prices.
| Year Ended April 30, | ||||||||
| (Dollars in thousands) | 2010 | 2009 | ||||||
Raw material commodities: |
||||||||
High |
$ | 21,207 | $ | 16,374 | ||||
Low |
2,330 | 3,949 | ||||||
Average |
11,643 | 9,785 | ||||||
Fair value was determined using quoted market
prices and was based on the Company’s net derivative
position by commodity at each quarter end during the
fiscal year. The calculations are not intended to
represent actual losses in fair value that the Company
expects to incur. In practice, as markets move, the
Company actively manages its risk and adjusts hedging
strategies as appropriate. The commodities hedged have
a high inverse correlation to price changes of the
derivative commodity instrument; thus, the Company
would expect that any gain or loss in the fair value
of its derivatives would generally be offset by an
increase or decrease in the fair value of the
underlying exposures.
28
Table of Contents
FORWARD-LOOKING STATEMENTS
Certain statements included in this Annual Report contain forward-looking statements within
the meaning of federal securities laws. The forward-looking statements may include statements
concerning the Company’s current expectations, estimates, assumptions, and beliefs concerning
future events, conditions, plans, and strategies that are not historical fact. Any statement that
is not historical in nature is a forward-looking statement and may be identified by the use of
words and phrases such as “expects,” “anticipates,” “believes,” “will,” “plans,” and similar
phrases.
Federal securities laws provide a safe harbor for forward-looking statements to encourage companies
to provide prospective information. The Company is providing this cautionary statement in
connection with the safe harbor provisions. Readers are cautioned not to place undue reliance on
any forward-looking statements as such statements are by nature subject to risks, uncertainties,
and other factors, many of which are outside of the Company’s control and could cause actual
results to differ materially from such statements and from the Company’s historical results and
experience. These risks and uncertainties include, but are not limited to, those set forth under
the caption “Risk Factors” in the Company’s Annual Report on Form 10-K, as well as the following:
| • | volatility of commodity markets from which raw materials, particularly green coffee beans, wheat, soybean oil, milk, and peanuts, are procured and the related impact on costs; | |
| • | risks associated with hedging, derivative, and purchasing strategies employed by the Company to manage commodity pricing risks, including the risk that such strategies could result in significant losses and adversely impact the Company’s liquidity; | |
| • | crude oil price trends and their impact on transportation, energy, and packaging costs; | |
| • | the ability to successfully implement price changes; | |
| • | the success and cost of introducing new products and the competitive response; | |
| • | the success and cost of marketing and sales programs and strategies intended to promote growth in the Company’s businesses; | |
| • | general competitive activity in the market, including competitors’ pricing practices and promotional spending levels; | |
| • | the successful completion of the Company’s restructuring programs, and the ability to realize anticipated savings and other potential benefits within the time frames currently contemplated; | |
| • | the impact of food safety concerns involving either the Company or its competitors’ products; | |
| • | the impact of accidents, including the Gulf of Mexico oil spill, and natural disasters, including crop failures and storm damage; | |
| • | the concentration of certain of the Company’s businesses with key customers and suppliers and the ability to manage and maintain key relationships; | |
| • | the loss of significant customers or a substantial reduction in orders from these customers or the bankruptcy of any such customer; | |
| • | changes in consumer coffee preferences, and other factors affecting the coffee business, which represents a substantial portion of the Company’s business; | |
| • | the ability of the Company to obtain any required financing; | |
| • | the timing and amount of the Company’s capital expenditures, restructuring costs, and merger and integration costs; | |
| • | impairments in the carrying value of goodwill, other intangible assets, or other long-lived assets or changes in useful lives of other intangible assets; | |
| • | the impact of future legal, regulatory, or market measures regarding climate change; | |
| • | the outcome of current and future tax examinations, changes in tax laws and other tax matters, and their related impact on the Company’s tax positions; | |
| • | foreign currency and interest rate fluctuations; | |
| • | political or economic disruption; | |
| • | other factors affecting share prices and capital markets generally; and | |
| • | the other factors described under “Risk Factors” in registration statements filed by the Company with the Securities and Exchange Commission and in the other reports and statements filed by the Company with the Securities and Exchange Commission, including its most recent Annual Report on Form 10-K and proxy materials. |
Readers are cautioned not to unduly rely on such forward-looking statements, which speak only as
of the date made, when evaluating the information presented in this Annual Report. The Company
does not assume any obligation to update or revise these forward-looking statements to reflect new
events or circumstances.
29
Table of Contents
Report of Management on Internal Control Over Financial Reporting
Shareholders
The J. M. Smucker Company
The J. M. Smucker Company
Management of The J.M. Smucker Company is responsible for establishing and maintaining adequate
accounting and internal control systems over financial reporting for the Company. The Company’s
internal control system is designed to provide reasonable assurance that the Company has the
ability to record, process, summarize, and report reliable financial information on a timely
basis.
The Company’s management assessed the effectiveness of the Company’s internal control over
financial reporting as of April 30, 2010. In making this assessment, management used the criteria
established in Internal Control — Integrated Framework issued by the Committee of Sponsoring
Organizations of the Treadway Commission (“the COSO criteria”).
Based on the Company’s assessment of internal control over financial reporting under the COSO
criteria, management concluded the Company’s internal control over financial reporting was
effective as of April 30, 2010.
Ernst & Young LLP, independent registered public accounting firm, audited the effectiveness of the
Company’s internal control ever financial reporting as of April 30, 2010, and their report thereon
is included on page 31 of this report.
Timothy P. Smucker
|
Richard K. Smucker
|
Mark R. Belgya |
||
Chairman of the Board
|
Executive Chairman | Senior Vice President and | ||
and Co-Chief Executive Officer
|
and Co-Chief Executive Officer | Chief Financial Officer |
Report of Management on Responsibility for Financial Reporting
Shareholders
The J.M. Smucker Company
The J.M. Smucker Company
Management of The J.M. Smucker Company is responsible for the preparation, integrity, accuracy, and
consistency of the consolidated financial statements and the related financial information in this
report. Such information has been prepared in accordance with U.S. generally accepted accounting
principles and is based on our best estimates and judgments.
The Company maintains systems of internal accounting controls supported by formal policies and
procedures that are communicated throughout the Company. There is a program of audits performed by
the Company’s internal audit staff designed to evaluate the adequacy of and adherence to these
controls, policies, and procedures.
Ernst & Young LLP, independent registered public accounting firm, has audited the Company’s
financial statements in accordance with the standards of the Public Company Accounting Oversight
Board (United States). Management has made all financial records and related data available to
Ernst & Young LLP during its audit.
The Company’s audit committee, comprised of three nonemployee members of the Board of Directors,
meets regularly with the independent registered public accounting firm and management to review the
work of the internal audit staff and the work, audit scope, timing arrangements, and fees of the
independent registered public accounting firm. The audit committee also regularly satisfies itself
as to the adequacy of controls, systems, and financial records. The manager of the internal audit
department is required to report directly to the chair of the audit committee as to internal audit
matters.
It is the Company’s best judgment that its policies and procedures its program of internal and
independent audits, and the oversight activity of the audit committee work together to provide
reasonable assurance that the operations of the Company are conducted according to law and in
compliance with the high standards of business ethics and conduct to which the Company subscribes.
Timothy P. Smucker
|
Richard K. Smucker
|
Mark R. Belgya |
||
Chairman of the Board
|
Executive Chairman | Senior Vice President and | ||
and Co-Chief Executive Officer
|
and Co-Chief Executive Officer | Chief Financial Officer |
30
Table of Contents
Report of Independent Registered Public Accounting Firm on
Internal Control Over Financial Reporting
Internal Control Over Financial Reporting
Board of Directors and Shareholders
The J. M. Smucker Company
The J. M. Smucker Company
We have audited The J.M. Smucker Company’s internal control over financial reporting as of April
30, 2010, based on criteria established in Internal Control — Integrated Framework issued by the
Committee of Sponsoring Organizations of the Treadway Commission (“the COSO criteria”). The J.M.
Smucker Company’s management is responsible for maintaining effective internal control over
financial reporting, and for its assessment of the effectiveness of internal control over
financial reporting included in the accompanying Report of Management on Internal Control Over
Financial Reporting. Our responsibility is to express an opinion on the Company’s internal
control over financial reporting based on our audit.
We conducted our audit in accordance with the standards of the Public Company Accounting Oversight
Board (United States). Those standards require that we plan and perform the audit to obtain
reasonable assurance about whether effective internal control over financial reporting was
maintained in all material respects. Our audit included obtaining an understanding of internal
control over financial reporting, assessing the risk that a material weakness exists, testing and
evaluating the design and operating effectiveness of internal control based on the assessed risk,
and performing such other procedures as we considered necessary in the circumstances. We believe
that our audit provides a reasonable basis for our opinion.
A company’s internal control over financial reporting is a process designed to provide reasonable
assurance regarding the reliability of financial reporting and the preparation of financial
statements for external purposes in accordance with U.S. generally accepted accounting principles.
A company’s internal control over financial reporting includes those policies and procedures that
(1) pertain to the maintenance of records that, in reasonable detail, accurately and fairly
reflect the transactions and dispositions of the assets of the company; (2) provide reasonable
assurance that transactions are recorded as necessary to permit preparation of financial
statements in accordance with U.S. generally accepted accounting principles, and that receipts and
expenditures of the company are being made only in accordance with authorizations of management
and directors of the company; and (3) provide reasonable assurance regarding prevention or timely
detection of unauthorized acquisition, use, or disposition of the company’s assets that could have
a material effect on the financial statements.
Because of its inherent limitations, internal control over financial reporting may not prevent or
detect misstatements. Also, projections of any evaluation of effectiveness to future periods are
subject to the risk that controls may become inadequate because of changes in conditions, or that
the degree of compliance with the policies or procedures may deteriorate.
In our opinion, The J.M. Smucker Company maintained, in all material respects, effective internal
control over financial reporting as of April 30, 2010, based on the COSO criteria.
We also have audited, in accordance with the standards of the Public Company Accounting Oversight
Board (United States), the consolidated balance sheets of The J.M. Smucker Company as of April 30,
2010 and 2009, and the related statements of consolidated income, shareholders’ equity, and cash
flows for each of the three years in the period ended April 30, 2010, and our report dated June 21, 2010, expressed an unqualified opinion thereon.
Akron, Ohio
June 21, 2010
June 21, 2010
31
Table of Contents
Report of Independent Registered Public Accounting Firm on the
Consolidated Financial Statements
Consolidated Financial Statements
Board of Directors and Shareholders
The J. M. Smucker Company
The J. M. Smucker Company
We have audited the accompanying consolidated balance sheets of The J.M. Smucker Company as of
April 30, 2010 and 2009, and the related statements of consolidated income, shareholders’ equity,
and cash flows for each of the three years in the period ended April 30, 2010. These financial
statements are the responsibility of the Company’ s management. Our responsibility is to express
an opinion on these financial statements based on our audits.
We conducted our audits in accordance with the standards of the Public Company Accounting Oversight
Board (United States). Those standards require that we plan and perform the audit to obtain
reasonable assurance about whether the financial statements are free of material misstatement. An
audit includes examining, on a test basis, evidence supporting the amounts and disclosures in the
financial statements. An audit also includes assessing the accounting principles used and
significant estimates made by management, as well as evaluating the overall financial statement
presentation. We believe that our audits provide a reasonable basis for our opinion.
In our opinion, the consolidated financial statements referred to above present fairly, in all
material respects, the consolidated financial position of The J.M. Smucker Company at April 30,
2010 and 2009, and the consolidated results of its operations and its cash flows for each of the
three years in the period ended April 30, 2010, in conformity with U.S. generally accepted
accounting principles.
As discussed in Note N, effective May 1, 2007, the Company adopted FASB Interpretation No. 48,
Accounting for Uncertainty in Income Taxes, as codified in Accounting Standards Codification Topic
740.
We also have audited in accordance with the standards of the Public Company Accounting Oversight
Board (United States), the effectiveness of The J.M. Smucker Company’ s internal control over
financial reporting as of April 30, 2010, based on criteria established in Internal
Control-Integrated Framework issued by the Committee of Sponsoring Organizations of the Treadway
Commission and our report dated June 21, 2010, expressed an unqualified opinion thereon.
Akron, Ohio
June 21, 2010
June 21, 2010
32
Table of Contents
Statements of Consolidated Income
The J. M. Smucker Company
The J. M. Smucker Company
| Year Ended April 30, | ||||||||||||
| (Dollars in thousands, except per share data) | 2010 | 2009 | 2008 | |||||||||
Net sales |
$ | 4,605,289 | $ | 3,757,933 | $ | 2,524,774 | ||||||
Cost of products sold |
2,814,729 | 2,506,504 | 1,741,100 | |||||||||
Cost of products sold — restructuring |
3,870 | — | 1,510 | |||||||||
Gross Profit |
1,786,690 | 1,251,429 | 782,164 | |||||||||
Selling, distribution, and administrative expenses |
878,221 | 673,565 | 486,592 | |||||||||
Amortization |
73,657 | 38,823 | 4,073 | |||||||||
Impairment charges |
11,658 | 1,491 | — | |||||||||
Merger and integration costs |
33,692 | 72,666 | 7,967 | |||||||||
Other restructuring costs |
1,841 | 10,229 | 3,237 | |||||||||
Other operating (income) expense — net |
(2,309 | ) | 3,624 | (3,879 | ) | |||||||
Operating Income |
789,930 | 451,031 | 284,174 | |||||||||
Interest income |
2,793 | 6,993 | 13,259 | |||||||||
Interest expense |
(65,187 | ) | (62,478 | ) | (42,145 | ) | ||||||
Other income (expense) — net |
3,217 | 519 | (500 | ) | ||||||||
Income Before Income Taxes |
730,753 | 396,065 | 254,788 | |||||||||
Income taxes |
236,615 | 130,112 | 84,409 | |||||||||
Net Income |
$ | 494,138 | $ | 265,953 | $ | 170,379 | ||||||
Earnings per common share: |
||||||||||||
Net Income |
$ | 4.15 | $ | 3.11 | $ | 3.01 | ||||||
Net Income — Assuming Dilution |
$ | 4.15 | $ | 3.11 | $ | 3.00 | ||||||
33
Table of Contents
Consolidated Balance Sheets
The J. M. Smucker Company
The J. M. Smucker Company
— ASSETS —
| April 30, | ||||||||
| (Dollars in thousands) | 2010 | 2009 | ||||||
Current Assets |
||||||||
Cash and cash equivalents |
$ | 283,570 | $ | 456,693 | ||||
Trade receivables, less allowance for doubtful accounts |
238,867 | 266,037 | ||||||
Inventories: |
||||||||
Finished products |
413,269 | 441,033 | ||||||
Raw materials |
241,670 | 162,893 | ||||||
| 654,939 | 603,926 | |||||||
Other current assets |
46,254 | 72,235 | ||||||
Total Current Assets |
1,223,630 | 1,398,891 | ||||||
Property, Plant, and Equipment |
||||||||
Land and land improvements |
62,982 | 51,131 | ||||||
Buildings and fixtures |
308,358 | 273,343 | ||||||
Machinery and equipment |
997,374 | 901,614 | ||||||
Construction in progress |
31,426 | 48,593 | ||||||
| 1,400,140 | 1,274,681 | |||||||
Accumulated depreciation |
(541,827 | ) | (436,248 | ) | ||||
Total Property, Plant, and Equipment |
858,313 | 838,433 | ||||||
Other Noncurrent Assets |
||||||||
Goodwill |
2,807,730 | 2,791,391 | ||||||
Other intangible assets, net |
3,026,515 | 3,098,976 | ||||||
Other noncurrent assets |
58,665 | 64,470 | ||||||
Total Other Noncurrent Assets |
5,892,910 | 5,954,837 | ||||||
| $ | 7,974,853 | $ | 8,192,161 | |||||
34
Table of Contents
— LIABILITIES AND SHAREHOLDERS’ EQUITY —
| April 30, | ||||||||
| (Dollars in thousands) | 2010 | 2009 | ||||||
Current Liabilities |
||||||||
Accounts payable |
$ | 179,509 | $ | 198,954 | ||||
Accrued compensation |
60,080 | 61,251 | ||||||
Accrued trade marketing and merchandising |
52,536 | 54,281 | ||||||
Income taxes |
75,977 | 17,690 | ||||||
Dividends payable |
47,648 | 41,448 | ||||||
Current portion of long-term debt |
10,000 | 276,726 | ||||||
Notes payable |
— | 350,000 | ||||||
Other current liabilities |
53,147 | 60,886 | ||||||
Total Current Liabilities |
478,897 | 1,061,236 | ||||||
Noncurrent Liabilities |
||||||||
Long-term debt |
900,000 | 910,000 | ||||||
Defined benefit pensions |
86,968 | 66,401 | ||||||
Postretirement benefits other than pensions |
45,592 | 38,182 | ||||||
Deferred income taxes |
1,101,506 | 1,145,808 | ||||||
Other noncurrent liabilities |
35,570 | 30,603 | ||||||
Total Noncurrent Liabilities |
2,169,636 | 2,190,994 | ||||||
Shareholders’ Equity |
||||||||
Serial preferred shares — no par value: Authorized — 3,000,000 shares; outstanding — none |
— | — | ||||||
Common shares — no par value: Authorized — 150,000,000 shares; outstanding — 119,119,152 in 2010 and 118,422,123 in 2009 (net of 9,485,013 and 10,179,989 treasury shares, respectively), at stated value |
29,780 | 29,606 | ||||||
Additional capital |
4,575,127 | 4,547,921 | ||||||
Retained income |
746,063 | 424,504 | ||||||
Amount due from ESOP Trust |
(4,069 | ) | (4,830 | ) | ||||
Accumulated other comprehensive loss |
(20,581 | ) | (57,270 | ) | ||||
Total Shareholders’ Equity |
5,326,320 | 4,939,931 | ||||||
| $ | 7,974,853 | $ | 8,192,161 | |||||
See notes to consolidated financial statements.
35
Table of Contents
Statements of Consolidated Cash Flows
The J. M. Smucker Company
The J. M. Smucker Company
| Year Ended April 30, | ||||||||||||
| (Dollars in thousands) | 2010 | 2009 | 2008 | |||||||||
Operating Activities |
||||||||||||
Net income |
$ | 494,138 | $ | 265,953 | $ | 170,379 | ||||||
Adjustments to reconcile net income to net cash
provided by operations: |
||||||||||||
Depreciation |
108,225 | 79,450 | 58,497 | |||||||||
Amortization |
73,657 | 38,823 | 4,073 | |||||||||
Impairment charges |
11,658 | 1,491 | — | |||||||||
Share-based compensation expense |
25,949 | 22,105 | 11,531 | |||||||||
Restructuring charges |
3,870 | 9,093 | 1,510 | |||||||||
(Gain) loss on sale of assets — net |
(7,831 | ) | 2,165 | 1,494 | ||||||||
Deferred income tax (benefit) expense |
(39,320 | ) | 25,525 | 18,215 | ||||||||
Changes in assets and liabilities, net of effect from
businesses acquired: |
||||||||||||
Trade receivables |
31,521 | (78,631 | ) | (17,599 | ) | |||||||
Inventories |
(46,160 | ) | 34,669 | (35,022 | ) | |||||||
Other current assets |
3,461 | 38,792 | (16,208 | ) | ||||||||
Accounts payable and accrued items |
(34,620 | ) | 67,883 | 6,988 | ||||||||
Defined benefit pension contributions |
(4,436 | ) | (34,665 | ) | (3,538 | ) | ||||||
Income taxes |
55,449 | 22,941 | (22,302 | ) | ||||||||
Other — net |
37,917 | (48,601 | ) | 4,900 | ||||||||
Net Cash Provided by Operating Activities |
713,478 | 446,993 | 182,918 | |||||||||
Investing Activities |
||||||||||||
Businesses acquired, net of cash acquired |
— | (77,335 | ) | (220,949 | ) | |||||||
Additions to property, plant, and equipment |
(136,983 | ) | (108,907 | ) | (76,430 | ) | ||||||
Proceeds from sale of businesses |
19,554 | — | 3,407 | |||||||||
Purchase of marketable securities |
— | — | (229,405 | ) | ||||||||
Sale and maturities of marketable securities |
13,519 | 3,013 | 257,536 | |||||||||
Proceeds from disposal of property, plant, and equipment |
205 | 800 | 135 | |||||||||
Other — net |
(738 | ) | 5,448 | (177 | ) | |||||||
Net Cash Used for Investing Activities |
(104,443 | ) | (176,981 | ) | (265,883 | ) | ||||||
Financing Activities |
||||||||||||
Repayment of bank note payable |
(350,000 | ) | — | — | ||||||||
Repayments of long-term debt |
(275,000 | ) | — | (148,000 | ) | |||||||
Proceeds from long-term debt |
— | 400,000 | 400,000 | |||||||||
Quarterly dividends paid |
(166,224 | ) | (110,668 | ) | (68,074 | ) | ||||||
Special dividends paid |
— | (274,208 | ) | — | ||||||||
Purchase of treasury shares |
(5,569 | ) | (4,025 | ) | (152,521 | ) | ||||||
Proceeds from stock option exercises |
6,413 | 1,976 | 17,247 | |||||||||
Other — net |
1,832 | (474 | ) | 1,187 | ||||||||
Net Cash (Used for) Provided by Financing Activities |
(788,548 | ) | 12,601 | 49,839 | ||||||||
Effect of exchange rate changes on cash |
6,390 | 2,539 | 5,126 | |||||||||
Net (decrease) increase in cash and cash equivalents |
(173,123 | ) | 285,152 | (28,000 | ) | |||||||
Cash and cash equivalents at beginning of year |
456,693 | 171,541 | 199,541 | |||||||||
Cash and Cash Equivalents at End of Year |
$ | 283,570 | $ | 456,693 | $ | 171,541 | ||||||
( ) Denotes use of cash
See notes to consolidated financial statements.
36
Table of Contents
Statements of Consolidated Shareholders’ Equity
The J. M. Smucker Company
| Accumulated | ||||||||||||||||||||||||||||
| Common | Amount | Other | Total | |||||||||||||||||||||||||
| (Dollars in thousands, | Shares | Common | Additional | Retained | Due from | Comprehensive | Shareholders' | |||||||||||||||||||||
| except per share data) | Outstanding | Shares | Capital | Income | ESOP Trust | (Loss) Income | Equity | |||||||||||||||||||||
Balance at May 1, 2007 |
56,779,850 | $ | 14,195 | $ | 1,216,091 | $ | 553,631 | $ | (6,017 | ) | $ | 17,757 | $ | 1,795,657 | ||||||||||||||
Net income |
170,379 | 170,379 | ||||||||||||||||||||||||||
Foreign currency translation
adjustment |
20,861 | 20,861 | ||||||||||||||||||||||||||
Pensions and other postretirement
liabilities |
(2,920 | ) | (2,920 | ) | ||||||||||||||||||||||||
Unrealized loss on
available-for-sale securities |
(379 | ) | (379 | ) | ||||||||||||||||||||||||
Unrealized gain on cash flow
hedging derivatives |
7,293 | 7,293 | ||||||||||||||||||||||||||
Comprehensive Income |
195,234 | |||||||||||||||||||||||||||
Purchase of treasury shares |
(2,991,920 | ) | (748 | ) | (66,075 | ) | (85,698 | ) | (152,521 | ) | ||||||||||||||||||
Stock plans |
834,682 | 209 | 20,398 | 20,607 | ||||||||||||||||||||||||
Cash dividends declared –$1.22
per share |
(68,519 | ) | (68,519 | ) | ||||||||||||||||||||||||
Adjustments to initially apply
Financial Accounting Standards Board
Interpretation No. 48 |
(2,374 | ) | (2,374 | ) | ||||||||||||||||||||||||
Tax benefit of stock plans |
11,231 | 11,231 | ||||||||||||||||||||||||||
Other |
538 | 538 | ||||||||||||||||||||||||||
Balance at April 30, 2008 |
54,622,612 | 13,656 | 1,181,645 | 567,419 | (5,479 | ) | 42,612 | 1,799,853 | ||||||||||||||||||||
Net income |
265,953 | 265,953 | ||||||||||||||||||||||||||
Foreign currency translation
adjustment |
(47,024 | ) | (47,024 | ) | ||||||||||||||||||||||||
Pensions and other postretirement
liabilities |
(43,479 | ) | (43,479 | ) | ||||||||||||||||||||||||
Unrealized loss on
available-for-sale securities |
(2,798 | ) | (2,798 | ) | ||||||||||||||||||||||||
Unrealized loss on cash flow
hedging derivatives |
(6,581 | ) | (6,581 | ) | ||||||||||||||||||||||||
Comprehensive Income |
166,071 | |||||||||||||||||||||||||||
Purchase of treasury shares |
(81,685 | ) | (20 | ) | (3,982 | ) | (23 | ) | (4,025 | ) | ||||||||||||||||||
Purchase business combination |
63,166,532 | 15,792 | 3,350,561 | 3,366,353 | ||||||||||||||||||||||||
Stock plans |
714,664 | 178 | 17,344 | 17,522 | ||||||||||||||||||||||||
Cash dividends declared –$6.31
per share |
(408,845 | ) | (408,845 | ) | ||||||||||||||||||||||||
Tax benefit of stock plans |
2,353 | 2,353 | ||||||||||||||||||||||||||
Other |
649 | 649 | ||||||||||||||||||||||||||
Balance at April 30, 2009 |
118,422,123 | 29,606 | 4,547,921 | 424,504 | (4,830 | ) | (57,270 | ) | 4,939,931 | |||||||||||||||||||
Net income |
494,138 | 494,138 | ||||||||||||||||||||||||||
Foreign currency translation
adjustment |
45,926 | 45,926 | ||||||||||||||||||||||||||
Pensions and other postretirement
liabilities |
(12,313 | ) | (12,313 | ) | ||||||||||||||||||||||||
Unrealized gain on
available-for-sale securities |
2,652 | 2,652 | ||||||||||||||||||||||||||
Unrealized gain on cash flow
hedging derivatives |
424 | 424 | ||||||||||||||||||||||||||
Comprehensive Income |
530,827 | |||||||||||||||||||||||||||
Purchase of treasury shares |
(122,483 | ) | (31 | ) | (5,383 | ) | (155 | ) | (5,569 | ) | ||||||||||||||||||
Stock plans |
819,512 | 205 | 29,584 | 29,789 | ||||||||||||||||||||||||
Cash dividends declared –$1.45
per share |
(172,424 | ) | (172,424 | ) | ||||||||||||||||||||||||
Tax benefit of stock plans |
3,005 | 3,005 | ||||||||||||||||||||||||||
Other |
761 | 761 | ||||||||||||||||||||||||||
Balance at April 30, 2010 |
119,119,152 | $ | 29,780 | $ | 4,575,127 | $ | 746,063 | $ | (4,069 | ) | $ | (20,581 | ) | $ | 5,326,320 | |||||||||||||
See notes to consolidated financial statements.
37
Table of Contents
Notes to Consolidated Financial Statements
The J. M. Smucker Company
(Dollars in thousands, except per share data)
NOTE A: ACCOUNTING POLICIES
Principles of Consolidation: The consolidated financial statements include the accounts of
the Company, its wholly-owned subsidiaries, and its majority-owned investments, if any.
Intercompany transactions and accounts are eliminated in consolidation.
Use of Estimates: The preparation of consolidated financial statements in conformity with U.S.
generally accepted accounting principles requires management to make certain estimates and
assumptions that affect the amounts reported in the consolidated financial statements and
accompanying notes. Significant estimates in these consolidated financial statements include:
allowances for doubtful trade receivables, estimates of future cash flows associated with assets,
asset impairments, useful lives for depreciation and amortization, loss contingencies, net
realizable value of inventories, accruals for trade marketing and merchandising programs, income
taxes, and the determination of discount and other rate assumptions for defined benefit pension
and other postretirement benefit expenses. Actual results could differ from these estimates.
Revenue Recognition: The Company recognizes revenue, net of estimated returns and allowances, when
all of the following criteria have been met: a valid customer order with a determinable price has
been received; the product has been shipped and title has transferred to the customer; there is no
further significant obligation to assist in the resale of the product; and collectibility is
reasonably assured.
Major Customer: Sales to Wal-Mart Stores, Inc. and subsidiaries amounted to approximately 27
percent, 24 percent, and 20 percent of net sales in 2010, 2009, and 2008, respectively. These sales
are primarily included in the three U.S. retail market segments. No other customer exceeded 10
percent of net sales for any year. Trade receivables at April 30, 2010 and 2009, included amounts
due from Wal-Mart Stores, Inc. and subsidiaries of $61,176 and $73,196, respectively.
Shipping and Handling Costs: Shipping and handling costs are included in cost of products sold.
Trade Marketing and Merchandising Programs: In order to support the Company’s products, various
promotional activities are conducted through the retail trade, distributors, or directly with
consumers, including in-store display and product placement programs, feature price discounts,
coupons, and other similar activities. The Company regularly reviews and revises, when it deems
necessary, estimates of costs to the Company for these promotional programs based on estimates of
what will be redeemed by the retail trade, distributors, or consumers. These estimates are made
using various techniques including historical data on performance of similar promotional programs.
Differences between estimated expense and actual performance are recognized as a change in
management’s estimate in a subsequent period. As the Company’s total promotional expenditures,
including amounts classified as a reduction of net sales, represented approximately 26 percent of
net sales in 2010, a likelihood exists of materially different reported results if factors such as
the level and success of the promotional programs or other conditions differ from expectations.
Advertising Expense: Advertising costs are expensed as incurred. Advertising expense was $130,583,
$77,363, and $55,522 in 2010, 2009, and 2008, respectively.
Research and Development Costs: Total research and development costs, including product
formulation costs, were $20,963, $14,498, and $9,547 in 2010, 2009, and 2008, respectively.
Share-Based Payments: Compensation expense is recognized over the requisite service period, which
includes a one-year performance period plus the defined forfeiture period, which is typically four
years of service or the attainment of a defined age and years of service. Compensation expense
recognized related to share-based awards was $25,949, $22,105, and $11,531 in 2010, 2009, and 2008,
respectively. Of the total compensation expense for share-based awards recognized, $5,262 and
$8,062 are included in merger and integration costs in the Statements of Consolidated Income in
2010 and 2009, respectively. There was no compensation expense related to share-based awards
recognized in merger and integration costs in 2008. The related tax benefit recognized in the
Statements of Consolidated Income was $8,402, $7,261, and $3,820 in 2010, 2009, and 2008,
respectively.
As of April 30, 2010, total compensation cost related to nonvested share-based awards not yet
recognized was approximately $36,286. The weighted-average period over which this amount is
expected to be recognized is approximately three years.
Corporate income tax benefits realized upon exercise or vesting of an award in excess of that
previously recognized in earnings, referred to as excess tax benefit, are presented in the
Statements of Consolidated Cash Flows as a financing activity. Realized excess tax benefits are
credited to additional capital in the Consolidated Balance Sheets. Realized shortfall tax
benefits, amounts which are less than that previously recognized in earnings, are first offset
against the cumulative balance of excess tax benefits, if any, and then charged directly
38
Table of Contents
to income tax expense. For 2010, 2009, and 2008, the actual tax deductible benefit realized from
share-based compensation was $3,005, $2,353, and $11,231, including $2,908, $2,372, and $11,107,
respectively, of excess tax benefits realized upon exercise or vesting of share-based compensation,
and classified as other-net under financing activities in the Statements of Consolidated Cash
Flows.
Income Taxes: The Company accounts for income taxes using the liability method. Accordingly,
deferred tax assets and liabilities are recognized for the future tax consequences attributable to
differences between financial statement carrying amounts of existing assets and liabilities and
their respective tax bases. Deferred tax assets and liabilities are measured using enacted tax
rates expected to apply to taxable income in the years in which those temporary differences are
expected to be recovered or settled. The effect on deferred tax assets and liabilities of a change
in the tax rate is recognized in income or expense in the period that the change is effective. A
valuation allowance is established when it is more likely than not that all or a portion of a
deferred tax asset will not be realized. A tax benefit is recognized when it is more likely than
not to be sustained.
Cash and Cash Equivalents: The Company considers all short-term investments with a maturity of
three months or less when purchased to be cash equivalents.
Trade Receivables: In the normal course of business, the Company extends credit to customers. Trade
receivables, less allowance for doubtful accounts, reflect the net realizable value of receivables
and approximate fair value. In the domestic markets, the Company’s products are sold primarily to
food retailers, food wholesalers, drug stores, club stores, mass merchandisers, discount and dollar
stores, and military commissaries. The Company’s operations outside the U.S. are principally in
Canada where the Company’s products are primarily sold to a concentration of food retailers and
other retail and foodservice channels similar to those in domestic markets. The Company believes
there is no concentration of risk with any single customer whose failure or nonperformance would
materially affect the Company’s results other than as discussed in Major Customer. On a regular
basis, the Company evaluates its trade receivables and establishes an allowance for doubtful
accounts based on a combination of specific customer circumstances, credit conditions, and
historical write-offs and collections. A receivable is considered past due if payments have not
been received within the agreed upon invoice terms. The allowance for doubtful accounts at April
30, 2010 and 2009, was $1,521 and $2,001, respectively. Trade receivables are charged off against
the allowance after management determines the potential for recovery is remote.
Inventories: Inventories are stated at the lower of cost or market. Cost for all inventories is
determined using the first-in, first-out method.
The cost of finished products and work-in-process inventory includes materials, direct labor, and
overhead. Work-in-process is included in finished products in the Consolidated Balance Sheets and
was $49,214 and $47,209 at April 30, 2010 and 2009. Coffee work-in-process at April 30, 2009, was
reclassified to conform to the current year classification within finished products.
Derivative Financial Instruments: The Company utilizes derivative instruments such as basis
contracts, commodity futures and options contracts, and foreign currency forwards and options
contracts to manage exposure to changes in commodity prices and foreign currency exchange rates.
The Company accounts for these derivative instruments in accordance with Financial Accounting
Standards Board (“FASB”) Accounting Standards Codification 815, Derivatives and Hedging (“ASC
815”). ASC 815 requires that all derivative instruments be recognized in the financial statements
and measured at fair value regardless of the purpose or intent for holding them. For derivatives
designated as a cash flow hedge that are used to hedge an anticipated transaction, changes in fair
value are deferred and recognized in shareholders’ equity as a component of accumulated other
comprehensive (loss) income to the extent the hedge is effective and then recognized in the
Statements of Consolidated Income in the period during which the hedged transaction affects
earnings. Hedge effectiveness is measured at inception and on a monthly basis. Any ineffectiveness
associated with the hedge or changes in fair value of derivatives that are nonqualifying are
recognized immediately in the Statements of Consolidated Income. By policy, the Company
historically has not entered into derivative financial instruments for trading purposes or for
speculation. For additional information, see Note L: Derivative Financial Instruments.
Property, Plant, and Equipment: Property, plant, and equipment are recognized at cost and are
depreciated on a straight-line basis over the estimated useful lives of the assets (3 to 20 years
for machinery and equipment, 3 to 7 years for capitalized software costs, and 10 to 40 years for
buildings, fixtures, and improvements).
The Company leases certain land, buildings, and equipment for varying periods of time, with
renewal options. Rent expense in 2010, 2009, and 2008 totaled $55,010, $36,547, and $23,902,
respectively.
Impairment of Long-Lived Assets: In accordance with FASB Accounting Standards Codification 360,
Property, Plant, and Equipment, long-lived assets, except goodwill and indefinite-lived intangible
assets, are reviewed for impairment when circumstances indicate the carrying value of an asset may
not be recoverable. Recoverability of assets to be held and used is measured by a comparison of the
carrying
39
Table of Contents
amount of the assets to future net cash flows estimated by the Company to be generated by such
assets. If such assets are considered to be impaired, the impairment to be recognized is the
amount by which the carrying amount of the assets exceeds the fair value of the assets. Assets to
be disposed of by sale are recognized as held for sale at the lower of carrying value or estimated
net realizable value.
Goodwill and Other Intangible Assets: Goodwill is the excess of the purchase price paid over the
fair value of the net assets of the business acquired. In accordance with FASB Accounting
Standards Codification 350, Intangibles — Goodwill and Other, goodwill and other indefinite-lived
intangible assets are not amortized but are reviewed at least annually for impairment. The Company
conducts its annual test for impairment of goodwill and other indefinite-lived intangible assets
as of February 1 of each year. A discounted cash flow valuation technique and a market-based
approach are utilized to estimate the fair value of the Company’s reporting units. For annual
impairment testing purposes, the Company’s reporting units are its operating segments. The
discount rates utilized in the analysis are developed using a weighted-average cost of capital
methodology. In addition to the annual test, the Company will test for impairment if events or
circumstances occur that would more likely than not reduce the fair value of a reporting unit
below its carrying amount. Finite-lived intangible assets are amortized on a straight-line basis
over their estimated useful lives. For additional information, see Note F: Goodwill and Other
Intangible Assets.
Marketable Securities and Other Investments: Under the Company’s investment policy, it may invest
in debt securities deemed to be investment grade at the time of purchase for general corporate
purposes. The Company determines the appropriate categorization of debt securities at the time of
purchase and reevaluates such designation at each balance sheet date. At April 30, 2009, the
Company categorized all debt securities as available for sale because it had the intent to convert
these investments into cash if and when needed. Classification of these available-for-sale
marketable securities as current or noncurrent was based on whether the conversion to cash was
expected to be necessary for operations in the upcoming year, which was consistent with the
security’s maturity date.
Securities categorized as available for sale are stated at fair value, with unrealized gains and
losses reported as a component of accumulated other comprehensive (loss) income. The fair value of
available-for-sale marketable securities included in other noncurrent assets was $12,813 at April
30, 2009. Included in accumulated other comprehensive (loss) income at April 30, 2009, was an
unrealized loss of $706. In 2010, these available-for-sale marketable securities were sold.
Approximately $13,519, $3,013, and $257,536 of proceeds have been realized upon maturity or sale of
available-for-sale marketable securities in 2010, 2009, and 2008, respectively. The Company uses
specific identification to determine the basis on which securities are sold.
The Company also maintains funds for the payment of benefits associated with nonqualified
retirement plans. These funds include investments considered to be available-for-sale marketable
securities. At April 30, 2010 and 2009, the fair value of these investments included in other
noncurrent assets was $34,895 and $29,273, respectively. Included in accumulated other
comprehensive (loss) income at April 30, 2010 and 2009, was an unrealized gain of $693 and an
unrealized loss of $2,763, respectively.
Foreign Currency Translation: Assets and liabilities of the Company’s foreign subsidiaries are
translated using the exchange rates in effect at the balance sheet date, while income and expenses
are translated using average rates. Translation adjustments are reported as a component of
shareholders’ equity in accumulated other comprehensive (loss) income.
Recently Issued Accounting Standards: In January 2010, the FASB issued Accounting Standards Update
2010-06, Improving Disclosures about Fair Value Measurements (“ASU 2010-06”), which requires
additional disclosures about fair value measurements including transfers in and out of different
levels of the fair value hierarchy and a higher level of disaggregation for different types of
financial instruments. These disclosure requirements are effective April 30, 2010, for the
Company. In addition, for the reconciliation of Level 3 fair value measurements, ASU 2010-06
requires information about purchases, sales, issuances, and settlements to be presented
separately. These disclosure requirements are effective April 30, 2011, for the Company.
Risks and Uncertainties: The Company insures its business and assets in each country against
insurable risks, to the extent that it deems appropriate, based upon an analysis of the relative
risks and costs.
40
Table of Contents
The raw materials used by the Company in each of its segments are primarily commodities and
agricultural-based products. Glass, plastic, steel cans, caps, carton board, and corrugate are the
principle packaging materials used by the Company. The fruit and vegetable raw materials used by
the Company in the production of its food products are purchased from independent growers and
suppliers. Green coffee, peanuts, edible oils, sweeteners, milk, flour, corn, and other ingredients
are obtained from various suppliers. The cost of many of these commodities have fluctuated, and may
continue to fluctuate, over time. Green coffee is sourced solely from foreign countries and its
supply and price are subject to high volatility due to factors such as weather, pest damage, and
political and economic conditions in the source countries. Raw materials are generally available
from numerous sources although the Company has elected to source certain plastic packaging
materials from single sources of supply pursuant to long-term contracts. While availability may
vary year-to-year, the Company believes that it will continue to be able to obtain adequate
supplies and that alternatives to single-sourced materials are available. The Company has not
historically encountered shortages of key raw materials. The Company considers its relationships
with key material suppliers to be good.
Approximately 32 percent of the Company’s employees, located at 10 facilities, are covered by
union contracts. The contracts vary in term depending on the location with two contracts expiring
in 2011.
Reclassifications: Certain prior year amounts have been reclassified to conform to current year
classifications.
NOTE B: MERGERS AND ACQUISITIONS
On November 6, 2008, the Company merged The Folgers Coffee Company (“Folgers”), previously a
subsidiary of The Procter & Gamble Company (“P&G”), with a wholly-owned subsidiary of the Company.
Under the terms of the agreement, P&G distributed the Folgers common shares to electing P&G
shareholders in a tax-free transaction, which was immediately followed by the conversion of
Folgers common stock into Company common shares. As a result of the merger, Folgers became a
wholly-owned subsidiary of the Company. In the merger, P&G shareholders received approximately
63.2 million common shares of the Company valued at approximately $3,366.4 million based on the
average closing price of the Company’s common shares for the period beginning two trading days
before and concluding two trading days after the announcement of the transaction on June 4, 2008.
After the closing of the transaction on November 6, 2008, the Company had approximately 118.0
million common shares outstanding. As part of the transaction, the Company’s debt obligations
increased by $350.0 million as a result of Folgers’ variable rate bank debt. In addition, on
October 23, 2008, the Company issued $400.0 million in Senior Notes with a weighted-average
interest rate of 6.6 percent. A portion of the proceeds was used to fund the payment of a $5.00
per share one-time special dividend on the Company’s common shares, totaling approximately $274.2
million, on October 31, 2008.
The transaction with Folgers, a leading producer of retail packaged coffee products in the U.S., is
consistent with the Company’s strategy to own and market number one brands in North America. For
accounting purposes, the Company was the acquiring enterprise. The merger was accounted for as a
purchase business combination. Accordingly, the results of the Folgers business are included in the
Company’s consolidated financial statements from the date of the merger. The aggregate purchase
price was approximately $3,735.8 million, including $19.4 million of capitalized
transaction-related expenses and $350.0 million of Folgers’ debt. In addition, the Company incurred
costs of $96.7 million to date that were directly related to the merger and integration of Folgers.
Due to the nature of these costs, they were expensed as incurred. Total transaction costs of $116.1
million incurred to date include approximately $13.3 million of noncash compensation expense.
The Folgers purchase price was allocated to the underlying assets acquired and liabilities assumed
based upon their estimated fair values at the date of merger. The Company determined the estimated
fair values based on independent appraisals, discounted cash flow analyses, quoted market prices,
and estimates made by management. To the extent the purchase price exceeded the estimated fair
value of the net identifiable tangible and intangible assets acquired, such excess was allocated to
goodwill.
41
Table of Contents
The following table summarizes the estimated fair values of the assets acquired and liabilities
assumed at the transaction date.
Assets acquired: |
||||
Current assets |
$ | 300,781 | ||
Property, plant, and equipment |
316,851 | |||
Intangible assets |
2,515,000 | |||
Goodwill |
1,643,636 | |||
Other noncurrent assets |
4,278 | |||
Total assets acquired |
$ | 4,780,546 | ||
Liabilities assumed: |
||||
Current liabilities |
$ | 85,795 | ||
Deferred tax liabilities |
955,235 | |||
Other noncurrent liabilities |
3,750 | |||
Total liabilities assumed |
$ | 1,044,780 | ||
Net assets acquired |
$ | 3,735,766 | ||
Folgers goodwill of $1,643.6 million was assigned to the U.S. Retail Coffee Market and
Special Markets segments. Of the total goodwill, $1,633.8 million is not deductible for tax
purposes.
The purchase price allocated to the identifiable intangible assets acquired is as follows:
Intangible assets with finite lives: |
||||
Customer and contractual relationships (20-year weighted-average useful life) |
$ | 1,089,000 | ||
Technology (14-year weighted-average useful life) |
133,000 | |||
Intangible assets with indefinite lives |
1,293,000 | |||
Total intangible assets |
$ | 2,515,000 | ||
The results of the operations of the Folgers business are included in the Company’s
consolidated financial statements from the date of the transaction. Had the transaction occurred
on May 1, 2008, unaudited, pro forma consolidated results for the year ended April 30, 2009, would
have been as follows:
| Year Ended April 30, 2009 | ||||
Net sales |
$ | 4,684,746 | ||
Net income |
359,979 | |||
Net income per common share — assuming dilution |
3.04 | |||
The unaudited, pro forma consolidated results are based on the Company’s historical
financial statements and those of the Folgers business and do not necessarily indicate the results
of operations that would have resulted had the merger been completed at the beginning of the
applicable period presented. The unaudited, pro forma consolidated results do not give effect to
the synergies of the merger and are not indicative of the results of operations in future periods.
In addition to the Folgers merger, the Company completed a series of other acquisitions during 2009
and 2008, including Knott’s Berry Farm food brand, Europe’s Best, Inc., the Canadian Carnation
brand canned milk business, and Eagle Family Foods Holdings, Inc., for aggregate cash consideration
of approximately $278.6 million and the assumption of $115.0 million in debt. The results of
operations of each of the merged or acquired businesses are included in the Company’s consolidated
financial statements from the date of the transaction.
NOTE C: RESTRUCTURING
On March 24, 2010, the Company announced its plan to restructure certain coffee and fruit
spreads operations as part of its ongoing efforts to enhance the long-term strength and
profitability of its leading brands. The initiative is a long-term investment to optimize
production capacity and lower the overall cost structure and includes capital investments for a
new state-of-the-art food manufacturing facility in Orrville, Ohio, and consolidation of all
coffee production in New Orleans, Louisiana. The program calls for the closing of four
42
Table of Contents
of the Company’s plants — Memphis, Tennessee; Ste. Marie, Quebec; Sherman, Texas; and Kansas City,
Missouri. Upon completion, the restructuring will result in the reduction of approximately 700
full-time positions.
The Company expects to incur restructuring costs of approximately $190.0 million, of which $5.7
million was recognized in 2010. The balance of the costs will be incurred over the next four
fiscal years, with approximately $85.0 million to $90.0 million expected to be recognized in
fiscal 2011.
The following table summarizes the restructuring activity, including the reserves established and
the total amount expected to be incurred.
| Site Preparation | ||||||||||||||||||||||||
| Long-Lived | Employee | and Equipment | Production | |||||||||||||||||||||
| Asset Charges | Separation | Relocation | Start-up | Other Costs | Total | |||||||||||||||||||
Total expected restructuring charge |
$ | 90,000 | $ | 47,000 | $ | 22,000 | $ | 21,000 | $ | 10,000 | $ | 190,000 | ||||||||||||
Balance at May 1, 2009 |
$ | — | $ | — | $ | — | $ | — | $ | — | $ | — | ||||||||||||
Charge to expense |
3,870 | 1,139 | 407 | 16 | 279 | 5,711 | ||||||||||||||||||
Cash payments |
— | (50 | ) | (407 | ) | (16 | ) | (279 | ) | (752 | ) | |||||||||||||
Noncash utilization |
(3,870 | ) | — | — | — | — | (3,870 | ) | ||||||||||||||||
Balance at April 30, 2010 |
$ | — | $ | 1,089 | $ | — | $ | — | $ | — | $ | 1,089 | ||||||||||||
Remaining expected restructuring
charge |
$ | 86,130 | $ | 45,861 | $ | 21,593 | $ | 20,984 | $ | 9,721 | $ | 184,289 | ||||||||||||
Approximately $3.9 million of the total restructuring charges of $5.7 million in 2010 was
reported in cost of products sold in the accompanying Statements of Consolidated Income, while the
remaining charges were reported in other restructuring costs. The restructuring costs classified
as cost of products sold consist of long-lived asset charges and were classified as noncash
restructuring charges in the Statements of Consolidated Cash Flows. Long-lived asset charges
include accelerated depreciation related to property, plant, and equipment that will be used at
the affected production facilities until they close or are sold.
Total expected employee separation costs of approximately $47.0 million include severance costs,
retention bonuses, and pension costs. Severance costs and retention bonuses are being recognized
over the estimated required future service period of the affected employees. The obligation
related to employee separation costs is included in accrued compensation in the Consolidated
Balance Sheets. For information on the impact of the restructuring plan on the deferred benefit
pension and other postretirement plans, see Note G: Pensions and Other Postretirement Benefits.
Other costs include miscellaneous expenditures associated with the Company’s restructuring
initiative and are expensed as incurred. These costs include professional fees and other closed
facility costs.
The Company incurred total restructuring costs of approximately $10.2 million and $4.7 million in
2009 and 2008, respectively, related to the Company’s divested Canadian businesses. Of the total
restructuring charges, approximately $1.5 million was reported in cost of products sold in 2008,
and no restructuring charges were reported in cost of products sold in 2009. The restructuring
costs classified as noncash restructuring charges in the Statements of Consolidated Cash Flows
were approximately $9.1 million and $1.5 million in 2009 and 2008, respectively, and consisted of
a noncash defined benefit pension settlement charge and long-lived asset charges. This
restructuring program was complete in 2009.
NOTE D: REPORTABLE SEGMENTS
The Company operates in one industry: the manufacturing and marketing of food products. The
Company has four reportable segments: U.S. Retail Coffee Market, U.S. Retail Consumer Market, U.S.
Retail Oils and Baking Market, and Special Markets. The U.S. Retail Coffee Market segment
represents the domestic sales of Folgers, Millstone, and Dunkin’ Donuts branded coffee; the U.S.
Retail Consumer Market segment primarily includes domestic sales of Smucker’s, Jif, and Hungry
Jack branded products; the U.S. Retail Oils and Baking Market segment includes domestic sales of
Crisco, Pillsbury, Eagle Brand, Martha White, and White Lily branded products all to domestic
retail customers; and the Special Markets segment is comprised of the Canada, foodservice, natural
foods, and international strategic business areas. Special Markets segment products are
distributed domestically and in foreign countries through retail channels, foodservice
distributors and operators (e.g., restaurants, schools and universities, health care operations),
and health and natural foods stores and distributors.
While the Company’s four reportable segments will remain the same in fiscal 2011, the calculation
of segment profit will change to include intangible asset amortization and impairment charges
related to segment assets, along with certain other charges in each of the segments. These items
were previously considered corporate expenses and were not allocated to the segments.
43
Table of Contents
The following table sets forth reportable segment and geographical information.
| Year Ended April 30, | ||||||||||||
| 2010 | 2009 | 2008 | ||||||||||
Net sales: |
||||||||||||
U.S. Retail Coffee Market |
$ | 1,700,458 | $ | 855,571 | $ | — | ||||||
U.S. Retail Consumer Market |
1,125,280 | 1,103,264 | 998,556 | |||||||||
U.S. Retail Oils and Baking Market |
905,719 | 995,474 | 875,991 | |||||||||
Special Markets |
873,832 | 803,624 | 650,227 | |||||||||
Total net sales |
$ | 4,605,289 | $ | 3,757,933 | $ | 2,524,774 | ||||||
Segment profit: |
||||||||||||
U.S. Retail Coffee Market |
$ | 550,786 | $ | 240,971 | $ | — | ||||||
U.S. Retail Consumer Market |
274,969 | 249,313 | 233,201 | |||||||||
U.S. Retail Oils and Baking Market |
142,161 | 124,150 | 99,626 | |||||||||
Special Markets |
148,768 | 111,741 | 92,019 | |||||||||
Total segment profit |
$ | 1,116,684 | $ | 726,175 | $ | 424,846 | ||||||
Interest income |
2,793 | 6,993 | 13,259 | |||||||||
Interest expense |
(65,187 | ) | (62,478 | ) | (42,145 | ) | ||||||
Amortization |
(73,657 | ) | (38,823 | ) | (4,073 | ) | ||||||
Impairment charges |
(11,658 | ) | (1,491 | ) | — | |||||||
Share-based compensation expense |
(20,687 | ) | (14,043 | ) | (11,531 | ) | ||||||
Restructuring costs |
(5,711 | ) | (10,229 | ) | (4,747 | ) | ||||||
Merger and integration costs |
(33,692 | ) | (72,666 | ) | (7,967 | ) | ||||||
Corporate administrative expenses |
(181,132 | ) | (133,313 | ) | (115,618 | ) | ||||||
Other unallocated income (expense) |
3,000 | (4,060 | ) | 2,764 | ||||||||
Income before income taxes |
$ | 730,753 | $ | 396,065 | $ | 254,788 | ||||||
Net sales: |
||||||||||||
Domestic |
$ | 4,167,042 | $ | 3,353,362 | $ | 2,199,433 | ||||||
International: |
||||||||||||
Canada |
$ | 385,870 | $ | 356,300 | $ | 278,447 | ||||||
All other international |
52,377 | 48,271 | 46,894 | |||||||||
Total international |
$ | 438,247 | $ | 404,571 | $ | 325,341 | ||||||
Total net sales |
$ | 4,605,289 | $ | 3,757,933 | $ | 2,524,774 | ||||||
Assets: |
||||||||||||
Domestic |
$ | 7,591,931 | $ | 7,670,192 | $ | 2,547,609 | ||||||
International: |
||||||||||||
Canada |
$ | 376,788 | $ | 514,993 | $ | 573,829 | ||||||
All other international |
6,134 | 6,976 | 8,443 | |||||||||
Total international |
$ | 382,922 | $ | 521,969 | $ | 582,272 | ||||||
Total assets |
$ | 7,974,853 | $ | 8,192,161 | $ | 3,129,881 | ||||||
Long-lived assets: |
||||||||||||
Domestic |
$ | 6,543,440 | $ | 6,406,085 | $ | 1,895,494 | ||||||
International: |
||||||||||||
Canada |
$ | 207,517 | $ | 386,948 | $ | 457,345 | ||||||
All other international |
266 | 237 | 835 | |||||||||
Total international |
$ | 207,783 | $ | 387,185 | $ | 458,180 | ||||||
Total long-lived assets |
$ | 6,751,223 | $ | 6,793,270 | $ | 2,353,674 | ||||||
Segment profit represents revenue less direct and allocable operating expenses.
44
Table of Contents
The following table presents product sales information.
| Year Ended April 30, | ||||||||||||
| 2010 | 2009 | 2008 | ||||||||||
Coffee |
40 | % | 25 | % | — | % | ||||||
Peanut butter |
12 | 14 | 19 | |||||||||
Shortening and oils |
8 | 11 | 14 | |||||||||
Fruit spreads |
8 | 9 | 13 | |||||||||
Baking mixes and frostings |
6 | 8 | 10 | |||||||||
Canned milk |
5 | 7 | 10 | |||||||||
Flour and baking ingredients |
5 | 7 | 8 | |||||||||
Portion control |
3 | 4 | 5 | |||||||||
Juices and beverages |
3 | 3 | 5 | |||||||||
Uncrustables frozen sandwiches |
3 | 3 | 5 | |||||||||
Toppings and syrups |
2 | 3 | 4 | |||||||||
Other |
5 | 6 | 7 | |||||||||
Total |
100 | % | 100 | % | 100 | % | ||||||
NOTE E: EARNINGS PER SHARE
On May 1, 2009, the Company adopted the two-class method of computing earnings per share as
required by Financial Accounting Standards Board Accounting Standards Codification 260, Earnings
Per Share (“ASC 260”). ASC 260 provides that unvested share-based payment awards that contain
nonforfeitable rights to dividends or dividend equivalents, whether paid or unpaid, are
participating securities and are to be included in the computation of earnings per share under
the two-class method described in ASC 260. The Company’s unvested restricted shares contain
rights to receive nonforfeitable dividends and are participating securities. All presented prior
period earnings per share data has been adjusted to retrospectively reflect the application of
the two-class method. The conversion to the two-class method resulted in a reduction of net
income per common share for the years ended April 30, 2009 and 2008, of $0.03 and $0.02 per
share, respectively. Net income per common share — assuming dilution for the year ended April 30,
2009, decreased $0.01 per share, while net income per common share — assuming dilution for the
year ended April 30, 2008, was unchanged.
45
Table of Contents
The following table sets forth the computation of net income per common share and net income per
common share — assuming dilution.
| Year Ended April 30, | ||||||||||||
| 2010 | 2009 | 2008 | ||||||||||
Computation of net income per share: |
||||||||||||
Net income |
$ | 494,138 | $ | 265,953 | $ | 170,379 | ||||||
Net income allocated to participating securities |
4,321 | 1,944 | 1,250 | |||||||||
Net income allocated to common stockholders |
$ | 489,817 | $ | 264,009 | $ | 169,129 | ||||||
Weighted-average common shares outstanding |
117,911,160 | 84,823,849 | 56,226,206 | |||||||||
Net income per common share |
$ | 4.15 | $ | 3.11 | $ | 3.01 | ||||||
Computation of net income per share — assuming dilution: |
||||||||||||
Net income |
$ | 494,138 | $ | 265,953 | $ | 170,379 | ||||||
Net income allocated to participating securities |
4,318 | 1,947 | 1,247 | |||||||||
Net income allocated to common stockholders |
$ | 489,820 | $ | 264,006 | $ | 169,132 | ||||||
Weighted-average common shares outstanding |
117,911,160 | 84,823,849 | 56,226,206 | |||||||||
Dilutive effect of stock options |
130,011 | 98,938 | 231,682 | |||||||||
Weighted-average common shares outstanding — assuming dilution |
118,041,171 | 84,922,787 | 56,457,888 | |||||||||
Net income per common share — assuming dilution |
$ | 4.15 | $ | 3.11 | $ | 3.00 | ||||||
The following table reconciles the weighted-average common shares used in the basic and
diluted earnings per share disclosures to the total weighted-average shares outstanding.
| Year Ended April 30, | ||||||||||||
| 2010 | 2009 | 2008 | ||||||||||
Weighted-average common shares outstanding |
117,911,160 | 84,823,849 | 56,226,206 | |||||||||
Weighted-average participating shares outstanding |
1,040,274 | 624,743 | 415,604 | |||||||||
Weighted-average shares outstanding |
118,951,434 | 85,448,592 | 56,641,810 | |||||||||
Dilutive effect of stock options |
130,011 | 98,938 | 231,682 | |||||||||
Weighted-average shares outstanding — assuming dilution |
119,081,445 | 85,547,530 | 56,873,492 | |||||||||
46
Table of Contents
NOTE F: GOODWILL AND OTHER INTANGIBLE ASSETS
A summary of changes in the Company’s goodwill during the years ended April 30, 2010 and
2009, by reportable segment is as follows:
| U.S. Retail | U.S. Retail | U.S. Retail | ||||||||||||||||||
| Coffee | Consumer | Oils and Baking | Special | |||||||||||||||||
| Market | Market | Market | Markets | Total | ||||||||||||||||
Balance at April 30, 2008 |
$ | — | $ | 550,825 | $ | 461,223 | $ | 120,428 | $ | 1,132,476 | ||||||||||
Acquisitions |
1,629,873 | 19,489 | — | 24,136 | 1,673,498 | |||||||||||||||
Other |
— | (631 | ) | (383 | ) | (13,569 | ) | (14,583 | ) | |||||||||||
Balance at April 30, 2009 |
$ | 1,629,873 | $ | 569,683 | $ | 460,840 | $ | 130,995 | $ | 2,791,391 | ||||||||||
Acquisitions |
5,540 | 289 | — | 265 | 6,094 | |||||||||||||||
Other |
— | 2,301 | 1,282 | 6,662 | 10,245 | |||||||||||||||
Balance at April 30, 2010 |
$ | 1,635,413 | $ | 572,273 | $ | 462,122 | $ | 137,922 | $ | 2,807,730 | ||||||||||
Included in the other category at April 30, 2010 and 2009, were foreign currency exchange
adjustments. In addition, tax-related adjustments were included in the other category at April 30,
2009. As a result of the change in segment reporting in 2009, the above historical information has
been reclassified to conform to the new presentation.
The Company’s other intangible assets and related accumulated amortization and impairment charges
are as follows:
| April 30, 2010 | April 30, 2009 | |||||||||||||||||||||||
| Accumulated | Accumulated | |||||||||||||||||||||||
| Amortization/ | Amortization/ | |||||||||||||||||||||||
| Acquisition | Impairment | Acquisition | Impairment | |||||||||||||||||||||
| Cost | Charges | Net | Cost | Charges | Net | |||||||||||||||||||
Finite-lived intangible assets subject to
amortization: |
||||||||||||||||||||||||
Customer and contractual relationships |
$ | 1,180,000 | $ | 95,722 | $ | 1,084,278 | $ | 1,176,006 | $ | 35,433 | $ | 1,140,573 | ||||||||||||
Patents and technology |
134,970 | 15,874 | 119,096 | 134,970 | 6,331 | 128,639 | ||||||||||||||||||
Trademarks |
29,222 | 3,491 | 25,731 | 6,460 | 968 | 5,492 | ||||||||||||||||||
Total intangible assets
subject to amortization |
$ | 1,344,192 | $ | 115,087 | $ | 1,229,105 | $ | 1,317,436 | $ | 42,732 | $ | 1,274,704 | ||||||||||||
Indefinite-lived intangible assets not
subject to amortization: |
||||||||||||||||||||||||
Trademarks |
$ | 1,805,793 | $ | 8,383 | $ | 1,797,410 | $ | 1,824,615 | $ | 343 | $ | 1,824,272 | ||||||||||||
Total other intangible assets |
$ | 3,149,985 | $ | 123,470 | $ | 3,026,515 | $ | 3,142,051 | $ | 43,075 | $ | 3,098,976 | ||||||||||||
Amortization expense for finite-lived intangible assets was $72,417, $38,094, and $3,895 in
2010, 2009, and 2008, respectively. The weighted-average useful life of the finite-lived
intangible assets is 19 years. Based on the current amount of intangible assets subject to
amortization, the estimated amortization expense for each of the succeeding five years is $73,200.
Pursuant to Financial Accounting Standards Board (“FASB”) Accounting Standards Codification 350,
Intangibles — Goodwill and Other (“ASC 350”), the Company is required to review goodwill and other
indefinite-lived intangible assets at least annually for impairment. The annual impairment review
was performed as of February 1, 2010. Goodwill impairment is tested at the reporting unit level
which is the Company’s operating segments. Impairment of $11,658 and $1,491 was recognized related
to certain intangible assets in 2010 and 2009, respectively, and no impairment was recognized in
2008.
The majority of the impairment recognized in 2010 was recognized in the third quarter when the
Company was notified of a significant future reduction in the Europe’s Best frozen fruit business
with a customer in Canada. The Company determined that this event constituted a potential
indicator of impairment of the Europe’s Best indefinite-lived and finite-lived intangible assets
recognized in its Special Markets segment under ASC 350 and FASB Accounting Standards Codification
360, Property, Plant, and Equipment, respectively.
47
Table of Contents
The Company estimated the fair value of the Europe’s Best indefinite-lived trademark based on an
analysis of the projected cash flows for the brand, discounted at a rate developed using a
risk-adjusted, weighted-average cost of capital methodology. As a result, impairment of $7,282 was
recognized to reduce the trademark to fair value.
The Company concluded that the carrying amount of the finite-lived customer relationship
intangible asset associated with the Europe’s Best business was recoverable based on the
undiscounted projected net cash flows estimated by the Company to be generated from the asset
group. Accordingly, no impairment charge was recognized on the finite-lived customer relationship.
No additional impairment was recognized related to Europe’s Best as a result of the February 1,
2010, impairment test, and no further indicators of potential impairment have been identified
subsequent to that date.
NOTE G: PENSIONS AND OTHER POSTRETIREMENT BENEFITS
The Company has defined benefit pension plans covering certain domestic and Canadian
employees. Benefits are based on the employee’s years of service and compensation. The Company’s
plans are funded in conformity with the funding requirements of applicable government regulations.
In addition to providing pension benefits, the Company sponsors several unfunded, defined
postretirement plans that provide health care and life insurance benefits to certain retired
domestic and Canadian employees. These plans are contributory, with retiree contributions adjusted
periodically, and contain other cost-sharing features, such as deductibles and coinsurance.
Covered employees generally are eligible for these benefits when they reach age 55 and have
attained 10 years of credited service.
Upon completion of the restructuring activity discussed in Note C: Restructuring, approximately 700
full-time positions will be reduced. The Company has included the estimated impact of the planned
reductions in measuring the U.S. and Canadian benefit obligation of the pension plans and other
postretirement plans at April 30, 2010. As a result, the benefit obligation of the pension plans
and other postretirement plans was reduced by $2,200 and $500, respectively. These decreases
related to the plants in Memphis, Tennessee; Ste. Marie, Quebec; Sherman, Texas; and Kansas City,
Missouri. The restructuring activity had no impact on net periodic benefit cost in 2010. In 2011,
the Company expects to recognize a charge for termination benefits in the range of $10 million to
$15 million related to planned reductions at the Orrville, Ohio, plant.
In March 2010, comprehensive health care reform legislation under the Patient Protection and
Affordable Care Act and the Health Care Education and Affordability Reconciliation Act
(collectively, the “Acts”) was passed and signed into law. The initial impact of the Acts’
provisions on the other postretirement benefits obligation was not material in 2010, but could
impact benefit obligations and net periodic benefit costs in future periods. The ultimate extent
of the impact on the Company cannot be determined until final regulations are promulgated under
the Acts and additional interpretations of the Acts become available. The Company will monitor
these developments.
One provision of the Acts did impact the other postretirement benefits obligation at April 30,
2010. An excise tax was introduced which will be levied on employers beginning in 2018 when total
plan-provided health benefits exceed a legislated high-cost standard. The impact of the excise tax
on the obligation at April 30, 2010, was not material, as it related to only one of the Company’s
plans.
Another provision of the Acts, effective in 2013, eliminates the federal income tax deduction for
prescription drug expenses of Medicare beneficiaries for which the plan sponsor also receives the
retiree drug subsidy under Part D. This provision did not have a material impact on the Company
due to the design of its plans.
48
Table of Contents
The following table summarizes the components of net periodic benefit cost (credit) and the
change in accumulated other comprehensive (loss) income related to the defined benefit pension and
other postretirement plans.
| Defined Benefit Pension Plans | Other Postretirement Benefits | |||||||||||||||||||||||
| Year Ended April 30, | 2010 | 2009 | 2008 | 2010 | 2009 | 2008 | ||||||||||||||||||
Service cost |
$ | 5,755 | $ | 5,871 | $ | 6,925 | $ | 1,525 | $ | 1,892 | $ | 1,291 | ||||||||||||
Interest cost |
24,788 | 26,263 | 25,900 | 2,607 | 2,540 | 2,516 | ||||||||||||||||||
Expected return on plan assets |
(22,894 | ) | (29,905 | ) | (35,391 | ) | — | — | — | |||||||||||||||
Amortization of prior service cost (credit) |
1,362 | 1,295 | 1,364 | (489 | ) | (489 | ) | (454 | ) | |||||||||||||||
Amortization of initial net asset |
— | — | (1 | ) | — | — | — | |||||||||||||||||
Amortization of net actuarial loss (gain) |
6,291 | 1,360 | 1,014 | (1,043 | ) | (730 | ) | (523 | ) | |||||||||||||||
Settlement loss |
— | 9,908 | — | — | — | — | ||||||||||||||||||
Curtailment loss |
— | — | 68 | — | — | — | ||||||||||||||||||
Net periodic benefit cost (credit) |
$ | 15,302 | $ | 14,792 | $ | (121 | ) | $ | 2,600 | $ | 3,213 | $ | 2,830 | |||||||||||
Other changes in plan assets and benefit
liabilities recognized in accumulated other comprehensive (loss) income
before income taxes: |
||||||||||||||||||||||||
Prior service (cost) credit arising during the year |
$ | (1,334 | ) | $ | — | $ | — | $ | — | $ | — | $ | 3,175 | |||||||||||
Net actuarial (loss) gain arising during the year |
(13,713 | ) | (74,195 | ) | (14,670 | ) | (3,248 | ) | 4,645 | 4,826 | ||||||||||||||
Amortization of prior service cost (credit) |
1,362 | 1,295 | 1,364 | (489 | ) | (489 | ) | (454 | ) | |||||||||||||||
Amortization of net actuarial loss (gain) |
6,291 | 1,360 | 1,014 | (1,043 | ) | (730 | ) | (523 | ) | |||||||||||||||
Curtailment |
— | — | 2,821 | — | — | — | ||||||||||||||||||
Foreign currency translation |
(5,932 | ) | 2,517 | (1,212 | ) | 173 | (231 | ) | 18 | |||||||||||||||
Other adjustments |
(71 | ) | — | (1 | ) | — | — | — | ||||||||||||||||
Net change for year |
$ | (13,397 | ) | $ | (69,023 | ) | $ | (10,684 | ) | $ | (4,607 | ) | $ | 3,195 | $ | 7,042 | ||||||||
Weighted-average assumptions used in
determining net periodic benefit costs: |
||||||||||||||||||||||||
U.S. plans: |
||||||||||||||||||||||||
Discount rate |
7.40 | % | 6.60 | % | 6.00 | % | 7.40 | % | 6.60 | % | 6.00 | % | ||||||||||||
Expected return on plan assets |
7.75 | 7.75 | 8.25 | — | — | — | ||||||||||||||||||
Rate of compensation increase |
3.79 | 3.84 | 4.10 | — | — | — | ||||||||||||||||||
Canadian plans: |
||||||||||||||||||||||||
Discount rate |
5.40 | % | 6.10 | % | 5.25 | % | 5.40 | % | 6.10 | % | 5.25 | % | ||||||||||||
Expected return on plan assets |
7.33 | 7.25 | 8.00 | — | — | — | ||||||||||||||||||
Rate of compensation increase |
4.00 | 4.00 | 4.00 | — | — | — | ||||||||||||||||||
The Company uses a measurement date of April 30 to determine defined benefit pension plans and
other postretirement benefits’ assets and benefit obligations.
49
Table of Contents
The following table sets forth the combined status of the plans as recognized in the Consolidated
Balance Sheets.
| Defined Benefit | Other | |||||||||||||||
| Pension Plans | Postretirement Benefits | |||||||||||||||
| April 30, | 2010 | 2009 | 2010 | 2009 | ||||||||||||
Change in benefit obligation: |
||||||||||||||||
Benefit obligation at beginning of the year |
$ | 362,720 | $ | 430,989 | $ | 38,182 | $ | 41,583 | ||||||||
Service cost |
5,755 | 5,871 | 1,525 | 1,892 | ||||||||||||
Interest cost |
24,788 | 26,263 | 2,607 | 2,540 | ||||||||||||
Amendments |
1,334 | — | — | — | ||||||||||||
Divestiture |
— | (25,934 | ) | — | — | |||||||||||
Actuarial loss (gain) |
64,423 | (27,359 | ) | 3,248 | (4,645 | ) | ||||||||||
Participant contributions |
410 | 328 | 988 | 1,089 | ||||||||||||
Benefits paid |
(25,296 | ) | (26,089 | ) | (2,577 | ) | (2,393 | ) | ||||||||
Foreign currency translation adjustments |
16,594 | (21,349 | ) | 1,602 | (1,884 | ) | ||||||||||
Other adjustments |
— | — | 17 | — | ||||||||||||
Benefit obligation at end of the year |
$ | 450,728 | $ | 362,720 | $ | 45,592 | $ | 38,182 | ||||||||
Change in plan assets: |
||||||||||||||||
Fair value of plan assets at beginning of the year |
$ | 300,482 | $ | 422,019 | $ | — | $ | — | ||||||||
Actual return on plan assets |
73,604 | (82,034 | ) | — | — | |||||||||||
Company contributions |
4,436 | 34,665 | 1,572 | 1,304 | ||||||||||||
Participant contributions |
410 | 328 | 988 | 1,089 | ||||||||||||
Benefits paid |
(25,296 | ) | (26,089 | ) | (2,577 | ) | (2,393 | ) | ||||||||
Divestiture |
— | (25,934 | ) | — | — | |||||||||||
Foreign currency translation adjustments |
13,756 | (22,473 | ) | — | — | |||||||||||
Other adjustments |
(70 | ) | — | 17 | — | |||||||||||
Fair value of plan assets at end of the year |
$ | 367,322 | $ | 300,482 | $ | — | $ | — | ||||||||
Funded status of the plans |
$ | (83,406 | ) | $ | (62,238 | ) | $ | (45,592 | ) | $ | (38,182 | ) | ||||
Other noncurrent assets |
$ | 3,562 | $ | 5,032 | $ | — | $ | — | ||||||||
Accrued compensation |
— | (869 | ) | — | — | |||||||||||
Defined benefit pensions |
(86,968 | ) | (66,401 | ) | — | — | ||||||||||
Postretirement benefits other than pensions |
— | — | (45,592 | ) | (38,182 | ) | ||||||||||
Net benefit liability |
$ | (83,406 | ) | $ | (62,238 | ) | $ | (45,592 | ) | $ | (38,182 | ) | ||||
The following table summarizes amounts recognized in accumulated other comprehensive (loss) income
in the Consolidated Balance Sheets, before income taxes.
| Defined Benefit | Other | |||||||||||||||
| Pension Plans | Postretirement Benefits | |||||||||||||||
| April 30, | 2010 | 2009 | 2010 | 2009 | ||||||||||||
Net actuarial (loss) gain |
$ | (131,489 | ) | $ | (118,094 | ) | $ | 14,885 | $ | 19,003 | ||||||
Prior service (cost) credit |
(7,237 | ) | (7,235 | ) | 3,542 | 4,031 | ||||||||||
Total |
$ | (138,726 | ) | $ | (125,329 | ) | $ | 18,427 | $ | 23,034 | ||||||
During 2011, the Company expects to recognize amortization of net actuarial losses and prior
service cost of $6,760 and $1,355, respectively, in net periodic benefit cost.
50
Table of Contents
The following table sets forth the assumptions used in determining the benefit obligations.
| Defined Benefit | Other | |||||||||||||||
| Pension Plans | Postretirement Benefits | |||||||||||||||
| April 30, | 2010 | 2009 | 2010 | 2009 | ||||||||||||
Weighted-average assumptions used in
determining benefit obligation: |
||||||||||||||||
U.S. plans: |
||||||||||||||||
Discount rate |
5.80 | % | 7.40 | % | 5.80 | % | 7.40 | % | ||||||||
Rate of compensation increase |
4.13 | 3.79 | — | — | ||||||||||||
Canadian plans: |
||||||||||||||||
Discount rate |
5.30 | 5.40 | 5.30 | 5.40 | ||||||||||||
Rate of compensation increase |
4.00 | 4.00 | — | — | ||||||||||||
For 2011, the assumed health care trend rates are nine percent and seven percent for U.S. and
Canadian plans, respectively. The rate for participants under age 65 is assumed to decrease to five
percent in 2019 and four and one-half percent in 2014 for U.S. and Canadian plans, respectively.
The health care cost trend rate assumption has a significant effect on the amount of the other
postretirement benefits obligation and periodic other postretirement benefits cost reported.
A one-percentage point annual change in the assumed health care cost trend rate would have the
following effect as of April 30, 2010:
| One-Percentage Point | ||||||||
| Increase | Decrease | |||||||
Effect on total service and interest cost components |
$ | 193 | $ | (171 | ) | |||
Effect on benefit obligation |
2,205 | (1,944 | ) | |||||
The following table sets forth selective information pertaining to the Company’s Canadian pension
and other postretirement benefit plans.
| Defined Benefit | Other | |||||||||||||||
| Pension Plans | Postretirement Benefits | |||||||||||||||
| Year Ended April 30, | 2010 | 2009 | 2010 | 2009 | ||||||||||||
Benefit obligation at end of the year |
$ | 112,672 | $ | 94,633 | $ | 11,586 | $ | 10,866 | ||||||||
Fair value of plan assets at end of the year |
99,103 | 75,899 | — | — | ||||||||||||
Funded status of the plans |
$ | (13,569 | ) | $ | (18,734 | ) | $ | (11,586 | ) | $ | (10,866 | ) | ||||
Service cost |
$ | 1,112 | $ | 816 | $ | 62 | $ | 46 | ||||||||
Interest cost |
5,491 | 7,963 | 632 | 631 | ||||||||||||
Expected return on plan assets |
(5,988 | ) | (9,745 | ) | — | — | ||||||||||
Settlement loss |
— | 9,908 | — | — | ||||||||||||
Company contributions |
1,698 | 2,497 | 665 | 607 | ||||||||||||
Participant contributions |
410 | 328 | — | — | ||||||||||||
Benefits paid |
(8,238 | ) | (9,407 | ) | (665 | ) | (607 | ) | ||||||||
Actual return on plan assets |
15,649 | (23,643 | ) | — | — | |||||||||||
Net periodic benefit cost |
2,746 | 9,596 | 694 | 665 | ||||||||||||
51
Table of Contents
The following table sets forth additional information related to the Company’s defined benefit
pension plans.
| April 30, | ||||||||
| 2010 | 2009 | |||||||
Accumulated benefit obligation for all pension plans |
$ | 422,166 | $ | 344,901 | ||||
Plans with an accumulated benefit obligation in excess of plan assets: |
||||||||
Accumulated benefit obligation |
290,762 | 244,070 | ||||||
Fair value of plan assets |
225,244 | 183,585 | ||||||
Plans with a projected benefit obligation in excess of plan assets: |
||||||||
Projected benefit obligation |
423,270 | 252,573 | ||||||
Fair value of plan assets |
336,454 | 185,516 | ||||||
The Company employs a total return on investment approach for defined benefit pension plan assets.
A mix of equities, fixed income, and alternative investments are used to maximize the long-term
rate of return on assets for the level of risk. In determining the expected long-term rate of
return on defined benefit pension plan assets, management considers the historical rates of return,
the nature of investments, the asset allocation, and expectations of future investment strategies.
The fair value of the major asset classes for the U.S. and Canadian defined benefit pension plans
are as follows:
| April 30, | ||||||||
| 2010 | 2009 | |||||||
Cash and cash equivalents |
$ | 5,048 | $ | 36,949 | ||||
Equity securities: |
||||||||
U.S. |
96,405 | 68,108 | ||||||
International |
72,786 | 47,059 | ||||||
Fixed income securities: |
||||||||
Bonds |
86,852 | 50,869 | ||||||
Fixed income |
63,843 | 70,781 | ||||||
Other types of investments: |
||||||||
Hedge funds |
33,163 | 18,797 | ||||||
Private equity funds |
9,225 | 7,919 | ||||||
Total |
$ | 367,322 | $ | 300,482 | ||||
52
Table of Contents
The following table summarizes the fair values and levels within the fair value hierarchy in which
the fair value measurements fall for defined benefit pension plan assets at April 30, 2010.
| Quoted Prices in | Significant | Significant | ||||||||||||||
| Active Markets for | Observable | Unobservable | ||||||||||||||
| Identical Assets | Inputs | Inputs | Fair Value at | |||||||||||||
| (Level 1) | (Level 2) | (Level 3) | April 30, 2010 | |||||||||||||
Cash and cash equivalents (A) |
$ | 5,048 | $ | — | $ | — | $ | 5,048 | ||||||||
Equity securities: |
||||||||||||||||
U.S. (B) |
77,921 | 16,093 | 2,391 | 96,405 | ||||||||||||
International (C) |
36,479 | 36,307 | — | 72,786 | ||||||||||||
Fixed income securities: |
||||||||||||||||
Bonds (D) |
62,133 | 24,719 | — | 86,852 | ||||||||||||
Fixed income (E) |
42,545 | 21,298 | — | 63,843 | ||||||||||||
Other types of investments: |
||||||||||||||||
Hedge funds (F) |
— | — | 33,163 | 33,163 | ||||||||||||
Private equity funds (G) |
— | — | 9,225 | 9,225 | ||||||||||||
Total |
$ | 224,126 | $ | 98,417 | $ | 44,779 | $ | 367,322 | ||||||||
| (A) | This category includes money market holdings classified as Level 1 and valued at amortized cost. | |
| (B) | This category is invested primarily in a portfolio of common stocks included in the Russell 1000 Index and traded on active exchanges. The Level 1 assets are valued using quoted market prices. The Level 2 assets are funds that consist of equity securities traded on active exchanges. The Level 3 assets are valued at original cost. | |
| (C) | This category is invested primarily in common stocks and other equity securities traded on active exchanges whose issuers are located outside of the U.S. The fund invests primarily in developed countries, but may also invest in emerging markets. The Level 1 assets are valued using quoted market prices. The Level 2 assets are funds that consist of equity securities traded on active exchanges. | |
| (D) | This category seeks to duplicate the return characteristics of high quality corporate bonds with a duration range of 10 to 13 years. The Level 1 assets are valued using quoted market prices. The Level 2 assets are funds that consist of bonds traded on active exchanges. | |
| (E) | This category is comprised of a core fixed income fund that invests at least 80 percent of its assets in investment grade U.S. corporate and government fixed income securities, including mortgage-backed securities. The Level 1 assets are valued using quoted market prices. The Level 2 assets are funds that consist of fixed income securities traded on active exchanges. | |
| (F) | This category is comprised of two hedge funds. It is classified as Level 3 and valued using unobservable inputs including the plan’s own assumptions. | |
| (G) | This category is comprised of private equity funds whose investments consist of primary limited partnership interests in corporate finance and venture capital funds. It is classified as Level 3 and valued using unobservable inputs including the plan’s own assumptions. |
The following table presents a rollforward of activity for Level 3 assets between May 1, 2009 and
April 30, 2010.
| U.S. Equity | Hedge | Private | ||||||||||||||
| Securities | Funds | Equity Funds | Total | |||||||||||||
Balance at May 1, 2009 |
$ | 2,996 | $ | 18,797 | $ | 7,919 | $ | 29,712 | ||||||||
Actual return on plan assets still held at reporting date |
(600 | ) | 1,366 | (2,153 | ) | (1,387 | ) | |||||||||
(Sales), purchases, and settlements |
(5 | ) | 13,000 | 3,459 | 16,454 | |||||||||||
Balance at April 30, 2010 |
$ | 2,391 | $ | 33,163 | $ | 9,225 | $ | 44,779 | ||||||||
The Company’s current investment policy is to have approximately 42 percent of assets invested in
equity securities, 39 percent in fixed income securities, and 19 percent in cash and other
investments. Included in equity securities were 317,552 of the Company’s common shares at April 30,
2010 and 2009. The market value of these shares was $19,393 at April 30, 2010. The Company paid
dividends of $445 on these shares during 2010.
The Company expects to contribute approximately $15 million to the defined benefit pension plans in
2011. The Company expects to make the following benefit payments for the defined benefit pension
and other postretirement benefit plans: $28 million in 2011, $29 million in 2012, $29 million in
2013, $39 million in 2014, $32 million in 2015, and $170 million in 2016 through 2020.
53
Table of Contents
NOTE H: SAVINGS PLANS
ESOP: The Company sponsors an Employee Stock Ownership Plan and Trust (“ESOP”) for certain
domestic, nonrepresented employees. The Company has entered into loan agreements with the Trustee
of the ESOP for purchases by the ESOP of the Company’s common shares in amounts not to exceed a
total of 1,134,120 unallocated common shares of the Company at any one time. These shares are to be
allocated to participants over a period of not less than 20 years.
ESOP loans bear interest at one-half percentage point over prime, are secured by the unallocated
shares of the plan, and are payable as a condition of allocating shares to participants. Interest
expense incurred on ESOP debt was $115, $261, and $376 in 2010, 2009, and 2008, respectively.
Contributions to the plan, representing compensation expense, are made annually in amounts
sufficient to fund ESOP debt repayment and were $614 and $690 in 2009 and 2008, respectively. Due
to the payment by the Company of a $5.00 per share one-time special dividend in 2009, no
contribution was necessary in 2010 to fund ESOP debt repayment. Dividends on unallocated shares are
used to reduce expense and were $281, $1,461, and $334 in 2010, 2009, and 2008, respectively. The
principal payments received from the ESOP in 2010, 2009, and 2008 were $761, $649, and $538,
respectively.
Dividends on allocated shares are credited to participant accounts and are used to purchase
additional common shares for participant accounts. Dividends on allocated and unallocated shares
are charged to retained income by the Company.
As permitted by Financial Accounting Standards Board Accounting Standards Codification 718,
Compensation – Retirement Benefits, the Company will continue to recognize future compensation
using the cost basis as all shares currently held by the ESOP were acquired prior to 1993. At April
30, 2010, the ESOP held 193,790 unallocated and 816,171 allocated shares. All shares held by the
ESOP were considered outstanding in earnings per share calculations for all periods presented.
Defined Contribution Plans: The Company offers employee savings plans for domestic and Canadian
employees. The Company’s contributions under these plans are based on a specified percentage of
employee contributions. Charges to operations for these plans in 2010, 2009, and 2008 were $15,625,
$10,900, and $4,943, respectively.
NOTE I: SHARE-BASED PAYMENTS
The Company provides for equity-based incentives to be awarded to key employees and nonemployee
directors. Currently, these incentives consist of restricted shares, restricted stock units,
deferred shares, deferred stock units, performance units, and stock options. These awards are
administered primarily through the 2006 Equity Compensation Plan approved by the Company’s
shareholders in August 2006. Awards under this plan may be in the form of stock options, stock
appreciation rights, restricted shares, deferred stock units, performance units, incentive awards,
and other share-based awards. Awards under this plan may be granted to the Company’s nonemployee
directors, consultants, officers, and other employees. Deferred stock units granted to nonemployee
directors vest immediately. At April 30, 2010, there were 1,097,710 shares available for future
issuance under this plan. As a result of this plan becoming effective in August 2006, no further
awards will be made under previously existing equity compensation plans, except for certain defined
circumstances included in the new plan.
Under the 2006 Equity Compensation Plan, the Company has the option to settle share-based awards by
issuing common shares from treasury or issuing new Company common shares. For awards granted from
the Company’s other equity compensation plans, the Company issues common shares from treasury,
except for plans that were acquired as part of the International Multifoods Corporation
acquisition, which are settled by issuing new Company common shares.
54
Table of Contents
Stock Options: The following table is a summary of the Company’s stock option activity and related
information.
| Weighted- | ||||||||
| Average | ||||||||
| Exercise | ||||||||
| Options | Price | |||||||
Outstanding at May 1, 2009 |
992,160 | $ | 39.32 | |||||
Exercised |
(261,881 | ) | 34.18 | |||||
Forfeited |
(18,292 | ) | 45.36 | |||||
Outstanding and exercisable at April 30, 2010 |
711,987 | $ | 41.06 | |||||
At April 30, 2010, the weighted-average remaining contractual term for stock options outstanding
and exercisable was 3.6 years and the aggregate intrinsic value of these stock options was
approximately $14,248.
The total intrinsic value of options exercised during 2010, 2009, and 2008 was approximately
$5,876, $2,871, and $28,973, respectively.
Other Equity Awards: The following table is a summary of the Company’s restricted shares, deferred
shares, deferred stock units, and performance units.
| Restricted/ | ||||||||||||||||
| Deferred | Weighted- | |||||||||||||||
| Shares and | Average | Weighted- | ||||||||||||||
| Deferred | Grant Date | Performance | Average | |||||||||||||
| Stock Units | Fair Value | Units | Fair Value | |||||||||||||
Outstanding at May 1, 2009 |
838,666 | $ | 44.70 | 114,440 | $ | 43.44 | ||||||||||
Granted |
504,580 | 44.63 | 190,010 | 57.37 | ||||||||||||
Converted |
114,440 | 43.44 | (114,440 | ) | 43.44 | |||||||||||
Vested |
(365,982 | ) | 44.46 | — | — | |||||||||||
Forfeited |
(12,982 | ) | 43.58 | — | — | |||||||||||
Outstanding at April 30, 2010 |
1,078,722 | $ | 44.74 | 190,010 | $ | 57.37 | ||||||||||
The total fair value of equity awards other than stock options vesting in 2010, 2009, and 2008 was
approximately $16,273, $11,117, and $8,547, respectively. The weighted-average grant date fair
value of restricted shares, deferred shares, deferred stock units, and performance units is the
average of the high and the low share price on the date of grant. The following table summarizes
the weighted-average grant date fair values of the equity awards granted in 2010, 2009, and 2008.
| Restricted/ | ||||||||||||||||
| Deferred | Weighted- | Weighted- | ||||||||||||||
| Shares and | Average | Average | ||||||||||||||
| Deferred | Grant Date | Performance | Grant Date | |||||||||||||
| Year Ended April 30, | Stock Units | Fair Value | Units | Fair Value | ||||||||||||
2010 |
504,580 | $ | 44.63 | 190,010 | $ | 57.37 | ||||||||||
2009 |
570,359 | 42.29 | 114,440 | 43.44 | ||||||||||||
2008 |
140,290 | 57.50 | 65,830 | 51.37 | ||||||||||||
The performance units column represents the number of restricted shares received by certain
executive officers, subsequent to year end, upon conversion of the performance units earned during
the year. Restricted stock generally vests four years from the date of grant or upon the attainment
of a defined age and years of service.
55
Table of Contents
NOTE J: DEBT AND FINANCING ARRANGEMENTS
Long-term debt consists of the following:
| April 30, | ||||||||
| 2010 | 2009 | |||||||
6.77% Senior Notes due June 1, 2009 |
$ | — | $ | 75,000 | ||||
6.60% Senior Notes due November 13, 2009 |
— | 201,726 | ||||||
7.94% Series C Senior Notes due September 1, 2010 |
10,000 | 10,000 | ||||||
4.78% Senior Notes due June 1, 2014 |
100,000 | 100,000 | ||||||
6.12% Senior Notes due November 1, 2015 |
24,000 | 24,000 | ||||||
6.63% Senior Notes due November 1, 2018 |
376,000 | 376,000 | ||||||
5.55% Senior Notes due April 1, 2022 |
400,000 | 400,000 | ||||||
Total long-term debt |
$ | 910,000 | $ | 1,186,726 | ||||
Current portion of long-term debt |
10,000 | 276,726 | ||||||
Total long-term debt less current portion |
$ | 900,000 | $ | 910,000 | ||||
All of the Company’s Senior Notes are unsecured and interest is paid semiannually. Prepayments are
required on the 5.55 percent Senior Notes, the first of which is $50.0 million on April 1, 2013.
During 2010, the Company entered into an unsecured three-year $400.0 million revolving credit
facility with a group of five banks maturing on October 29, 2012. The Company also has available a
$180.0 million revolving credit facility with a group of three banks maturing on January 31, 2011.
Interest on the revolving credit facilities is based on prevailing U.S. Prime, Canadian Base Rate,
London Interbank Offered Rate, or Canadian Dealer Offered Rate, as determined by the Company, and
is payable either on a quarterly basis or at the end of the borrowing term.
During the year ended April 30, 2010, the Company repaid $75.0 million of 6.77 percent Senior
Notes, $200.0 million of 6.60 percent Senior Notes, and $350.0 million of Folgers’ bank debt, as
scheduled, utilizing a combination of cash on hand and borrowings of approximately $100.0 million
against the $180.0 million credit facility. At April 30, 2010, the Company did not have a balance
outstanding under either revolving credit facility. At April 30, 2010, the Company had standby
letters of credit of approximately $6.6 million outstanding.
The Company’s debt instruments contain certain financial covenant restrictions including
consolidated net worth, leverage ratios, and an interest coverage ratio. The Company is in
compliance with all covenants.
Interest paid totaled $76,461, $52,918, and $44,584 in 2010, 2009, and 2008, respectively. This
differs from interest expense due to the timing of payments, amortization of the fair value
adjustment on the 6.60 percent Senior Notes prior to maturity, amortization of debt issuance costs,
and interest capitalized.
On June 15, 2010, the Company issued $400.0 million in 4.50 percent Senior Notes with a final
maturity on June 1, 2025. The Senior Notes have a 12-year average maturity with required
prepayments starting on June 1, 2020. Proceeds from the Senior Notes issuance will be used for
general corporate purposes. In conjunction with this issuance, the Company also obtained an
amendment with respect to its intercreditor agreement.
NOTE K: CONTINGENCIES
The Company, like other food manufacturers, is from time to time subject to various administrative,
regulatory, and other legal proceedings arising in the ordinary course of business. The Company is
a defendant in a variety of legal proceedings, some of which involve claims for damages in
unspecified amounts. The Company cannot predict with certainty the results of these proceedings or
reasonably determine a range of potential loss. The Company’s policy is to accrue costs for
contingent liabilities when such liabilities are probable and amounts can be reasonably estimated.
Based on the information known to date, the Company does not believe the final outcome of these
proceedings will have a material adverse effect on the Company’s financial position, results of
operations, or cash flows.
56
Table of Contents
NOTE L: DERIVATIVE FINANCIAL INSTRUMENTS
The Company is exposed to market risks, such as changes in foreign currency exchange rates and
commodity pricing. To manage the volatility relating to these exposures, the Company enters into
various derivative transactions. By policy, the Company historically has not entered into
derivative financial instruments for trading purposes or for speculation.
Commodity Price Management: The Company enters into commodity futures and options contracts to
manage the price volatility and reduce the variability of future cash flows related to anticipated
inventory purchases of green coffee, edible oils, flour, milk, and corn. The Company also enters
into commodity futures and options to manage price risk for energy input costs, including natural
gas and diesel fuel. The derivative instruments generally have maturities of less than one year.
Certain of the derivative instruments associated with the Company’s U.S. Retail Oils and Baking
Market and U.S. Retail Coffee Market segments meet the hedge criteria according to Financial
Accounting Standards Board Accounting Standards Codification 815, Derivatives and Hedging (“ASC
815”), and are accounted for as cash flow hedges. The mark-to-market gains or losses on qualifying
hedges are deferred and included as a component of other comprehensive income to the extent
effective, and reclassified to cost of products sold in the period during which the hedged
transaction affects earnings. In order to qualify as a hedge of commodity price risk, it must be
demonstrated that the changes in the fair value of the commodity’s futures contracts are highly
effective in hedging price risks associated with the commodity purchased. Hedge effectiveness is
measured at inception and on a monthly basis. The mark-to-market gains or losses on nonqualifying,
excluded, and ineffective portions of hedges are recognized in cost of products sold immediately.
Foreign Currency Exchange Rate Hedging: The Company utilizes foreign currency forwards and options
contracts to manage the effect of foreign currency exchange fluctuations on future cash payments
related to purchases of certain raw materials, finished goods, and fixed assets. The contracts
generally have maturities of less than one year. At the inception of the contract, the derivative
is evaluated and documented for ASC 815 accounting treatment. If the contract qualifies for hedge
accounting treatment, to the extent the hedge is deemed effective, the associated mark-to-market
gains and losses are deferred and included as a component of other comprehensive income. These
gains or losses are reclassified to earnings in the period the contract is executed. The
ineffective portion of these contracts is immediately recognized in earnings. Instruments currently
used to manage foreign currency exchange exposures do not meet the requirements for hedge
accounting treatment and the change in value of these instruments is immediately recognized in cost
of products sold.
The following table sets forth the fair value of derivative instruments as recognized in the
Consolidated Balance Sheets at April 30, 2010 and 2009.
| April 30, 2010 | April 30, 2009 | |||||||||||||||
| Other | Other | Other | Other | |||||||||||||
| Current Assets | Current Liabilities | Current Assets | Current Liabilities | |||||||||||||
Derivatives designated as hedging instruments: |
||||||||||||||||
Commodity contracts |
$ | 1,874 | $ | 9 | $ | 3,782 | $ | 1,562 | ||||||||
Derivatives not designated as hedging instruments: |
||||||||||||||||
Commodity contracts |
$ | 2,414 | $ | 599 | $ | 414 | $ | 2,278 | ||||||||
Foreign currency exchange contracts |
— | 830 | — | 332 | ||||||||||||
Total derivatives not designated as hedging instruments |
$ | 2,414 | $ | 1,429 | $ | 414 | $ | 2,610 | ||||||||
Total derivative instruments |
$ | 4,288 | $ | 1,438 | $ | 4,196 | $ | 4,172 | ||||||||
The Company has elected to not offset fair value amounts recognized for derivative instruments and
its cash margin accounts executed with the same counterparty. The Company maintained cash margin
accounts of $5,714 and $16,619 at April 30, 2010 and 2009, respectively, that are included in other
current assets in the Consolidated Balance Sheets.
57
Table of Contents
The following table presents information on gains recognized on derivatives designated as cash flow
hedging relationships, all of which hedge commodity price risk.
| Year Ended | ||||
| April 30, 2010 | ||||
Gain recognized in other comprehensive income (effective portion) |
$ | 6,029 | ||
Gain reclassified from accumulated other comprehensive (loss) income
to cost of products sold (effective portion) |
5,395 | |||
Change in accumulated other comprehensive (loss) income |
$ | 634 | ||
Gain recognized in cost of products sold (ineffective portion) |
$ | 200 | ||
Included as a component in accumulated other comprehensive (loss) income at April 30, 2010 and
2009, were deferred gains of $1,994 and $1,570, respectively. The related tax impact recognized in
accumulated other comprehensive (loss) income was $1,134 and $924 at April 30, 2010 and 2009,
respectively. The entire amount of the deferred gain included in accumulated other comprehensive
(loss) income at April 30, 2010, is expected to be recognized in earnings within one year as the
related commodity is utilized.
The following table presents the losses recognized in cost of products sold on derivatives not
designated as qualified hedging instruments.
| Year Ended | ||||
| April 30, 2010 | ||||
Loss on commodity contracts |
$ | 2,384 | ||
Loss on foreign currency exchange contracts |
7,234 | |||
Total |
$ | 9,618 | ||
The following table presents the gross contract notional amount of outstanding derivative contracts
at April 30, 2010 and 2009.
| April 30, | ||||||||
| 2010 | 2009 | |||||||
Commodity contracts |
$ | 323,351 | $ | 276,644 | ||||
Foreign currency exchange contracts |
45,295 | 41,999 | ||||||
NOTE M: OTHER FINANCIAL INSTRUMENTS AND FAIR VALUE MEASUREMENTS
Financial instruments, other than derivatives, that potentially subject the Company to significant
concentrations of credit risk consist principally of cash investments and trade receivables. With
respect to trade receivables, the Company believes there is no concentration of risk with any
single customer whose failure or nonperformance would materially affect the Company’s results other
than as discussed in Major Customer of Note A: Accounting Policies. The Company does not require
collateral from its customers. The fair value of the Company’s financial instruments, other than
certain of its fixed-rate long-term debt, approximates their carrying amounts.
The following table provides information on the carrying amount and fair value of the Company’s
financial instruments.
| April 30, 2010 | April 30, 2009 | |||||||||||||||
| Carrying | Carrying | |||||||||||||||
| Amount | Fair Value | Amount | Fair Value | |||||||||||||
Marketable securities |
$ | — | $ | — | $ | 12,813 | $ | 12,813 | ||||||||
Other investments |
34,895 | 34,895 | 29,273 | 29,273 | ||||||||||||
Derivative financial instruments |
2,850 | 2,850 | 24 | 24 | ||||||||||||
Fixed rate long-term debt |
910,000 | 1,172,467 | 1,186,726 | 1,234,728 | ||||||||||||
58
Table of Contents
Fair value is defined as the price that would be received to sell an asset or paid to transfer a
liability in an orderly transaction between market participants at the measurement date. Valuation
techniques are based on observable and unobservable inputs. Observable inputs reflect readily
obtainable data from independent sources, while unobservable inputs reflect the Company’s market
assumptions.
The following table summarizes the fair values and the levels within the fair value hierarchy in
which the fair value measurements fall for the Company’s financial assets (liabilities).
| Quoted Prices in | Significant | Significant | ||||||||||||||||||
| Active Markets for | Observable | Unobservable | ||||||||||||||||||
| Identical Assets | Inputs | Inputs | Fair Value at | Fair Value at | ||||||||||||||||
| (Level 1) | (Level 2) | (Level 3) | April 30, 2010 | April 30, 2009 | ||||||||||||||||
Marketable securities: (A) |
||||||||||||||||||||
Mortgage-backed securities |
$ | — | $ | — | $ | — | $ | — | $ | 12,813 | ||||||||||
Other investments: (B) |
||||||||||||||||||||
Equity mutual funds |
11,626 | — | — | 11,626 | 8,035 | |||||||||||||||
Municipal obligations |
— | 16,753 | — | 16,753 | 15,283 | |||||||||||||||
Other investments |
336 | 6,180 | — | 6,516 | 5,955 | |||||||||||||||
Derivatives: (C) |
||||||||||||||||||||
Commodity contracts |
3,680 | — | — | 3,680 | 356 | |||||||||||||||
Foreign currency exchange contracts |
(830 | ) | — | — | (830 | ) | (332 | ) | ||||||||||||
Total |
$ | 14,812 | $ | 22,933 | $ | — | $ | 37,745 | $ | 42,110 | ||||||||||
| (A) | The Company’s marketable securities, consisting entirely of mortgage-backed securities, are broker-priced and valued by a third party using an evaluated pricing methodology. An evaluated pricing methodology is a valuation technique which uses inputs that are derived principally from or corroborated by observable market data. For additional information, see Marketable Securities and Other Investments of Note A: Accounting Policies. | |
| (B) | The Company’s other investments consist of funds maintained for the payment of benefits associated with nonqualified retirement plans. The funds include equity securities listed in active markets and municipal bonds. The municipal bonds are valued by a third party using an evaluated pricing methodology. For additional information, see Marketable Securities and Other Investments of Note A: Accounting Policies. | |
| (C) | The Company’s derivatives are valued using quoted market prices. For additional information, see Note L: Derivative Financial Instruments. |
The following table presents the Company’s nonfinancial assets adjusted to fair value during the
year ended April 30, 2010.
| Carrying Amount at | Fair Value | Other | Carrying Amount at | |||||||||||||
| April 30, 2009 | Adjustment | Adjustments | April 30, 2010 | |||||||||||||
Indefinite-lived trademarks (D) |
$ | 21,370 | $ | (9,133 | ) | $ | 2,315 | $ | 14,552 | |||||||
Finite-lived trademarks (D) |
3,012 | (2,525 | ) | (487 | ) | — | ||||||||||
Total |
$ | 24,382 | $ | (11,658 | ) | $ | 1,828 | $ | 14,552 | |||||||
| (D) | The Company utilized Level 3 inputs to estimate the fair value of the nonfinancial assets. For additional information, see Note F: Goodwill and Other Intangible Assets. |
During 2010, the Company recognized fair value adjustments of $11,658 related to the impairment of
indefinite-lived and finite-lived trademarks. Other adjustments of $1,828 related to foreign
currency exchange and amortization were recognized during the year ended April 30, 2010.
59
Table of Contents
NOTE N: INCOME TAXES
Deferred income taxes reflect the tax effects of temporary differences between the carrying amounts
of assets and liabilities for financial reporting purposes and the amounts used for income tax
reporting. Significant components of the Company’s deferred tax assets and liabilities are as
follows:
| April 30, | ||||||||
| 2010 | 2009 | |||||||
Deferred tax liabilities: |
||||||||
Intangible assets |
$ | 1,042,375 | $ | 1,062,680 | ||||
Property, plant, and equipment |
121,950 | 117,736 | ||||||
Pension and other employee benefits |
10,566 | 11,362 | ||||||
Other |
22,042 | 29,357 | ||||||
Total deferred tax liability |
$ | 1,196,933 | $ | 1,221,135 | ||||
Deferred tax assets: |
||||||||
Post-employment and other employee benefits |
$ | 80,453 | $ | 69,051 | ||||
Tax credit and loss carryforwards |
5,049 | 11,915 | ||||||
Intangible assets |
3,984 | 5,896 | ||||||
Other |
21,247 | 16,867 | ||||||
Total deferred tax assets |
$ | 110,733 | $ | 103,729 | ||||
Valuation allowance for deferred tax assets |
(3,470 | ) | (9,026 | ) | ||||
Total deferred tax assets less allowance |
$ | 107,263 | $ | 94,703 | ||||
Net deferred tax liability |
$ | 1,089,670 | $ | 1,126,432 | ||||
The following table summarizes domestic and foreign loss and credit carryforwards at April 30,
2010.
| Related Tax | Deferred | Valuation | ||||||||||||||
| Deduction | Tax Asset | Allowance | Expiration Date | |||||||||||||
Tax carryforwards: |
||||||||||||||||
State loss carryforwards |
$ | 75,331 | $ | 3,622 | $ | 3,321 | 2011 to 2029 | |||||||||
State tax credit carryforwards |
— | 1,357 | — | 2018 | ||||||||||||
Foreign jurisdictional loss carryforwards |
192 | 50 | — | 2017 | ||||||||||||
Foreign jurisdictional tax credit carryforwards |
— | 20 | — | 2013 | ||||||||||||
Total tax carryforwards |
$ | 75,523 | $ | 5,049 | $ | 3,321 | ||||||||||
The Company evaluates the realizability of deferred tax assets for each of the jurisdictions in
which it operates. Included in the overall valuation allowance is $149 for other deferred tax
assets where it is more likely than not those assets will not be realized. The valuation allowance
decreased by $5,556, primarily due to the expiration of federal capital loss and foreign tax credit
carryforwards and state net operating losses that had full valuation allowances.
Domestic income and foreign withholding taxes have not been recorded on undistributed earnings of
foreign subsidiaries since these amounts are considered to be permanently reinvested. Any
additional taxes payable on the earnings of foreign subsidiaries, if remitted, would be partially
offset by domestic tax deductions for foreign taxes paid. It is not practical to estimate the
amount of additional taxes that might be payable on such undistributed earnings.
60
Table of Contents
Income before income taxes is as follows:
| Year Ended April 30, | ||||||||||||
| 2010 | 2009 | 2008 | ||||||||||
Domestic |
$ | 712,226 | $ | 378,293 | $ | 236,307 | ||||||
Foreign |
18,527 | 17,772 | 18,481 | |||||||||
Income before income taxes |
$ | 730,753 | $ | 396,065 | $ | 254,788 | ||||||
The components of the provision for income taxes are as follows:
| Year Ended April 30, | ||||||||||||
| 2010 | 2009 | 2008 | ||||||||||
Current: |
||||||||||||
Federal |
$ | 256,444 | $ | 97,182 | $ | 59,239 | ||||||
Foreign |
6,584 | 1,688 | 3,580 | |||||||||
State and local |
12,907 | 5,717 | 3,375 | |||||||||
Deferred |
(39,320 | ) | 25,525 | 18,215 | ||||||||
Total income tax expense |
$ | 236,615 | $ | 130,112 | $ | 84,409 | ||||||
A reconciliation of the statutory federal income tax rate and the effective income tax rate
follows:
| Year Ended April 30, | ||||||||||||
| Percent of Pretax Income | 2010 | 2009 | 2008 | |||||||||
Statutory federal income tax rate |
35.0 | % | 35.0 | % | 35.0 | % | ||||||
State and local income taxes, net of federal income tax benefit |
1.1 | 0.6 | 0.4 | |||||||||
Domestic manufacturing deduction |
(1.9 | ) | (1.5 | ) | (1.2 | ) | ||||||
Other items — net |
(1.8 | ) | (1.2 | ) | (1.1 | ) | ||||||
Effective income tax rate |
32.4 | % | 32.9 | % | 33.1 | % | ||||||
Income taxes paid |
$ | 212,981 | $ | 69,107 | $ | 73,786 | ||||||
The Company accounts for the financial statement recognition and measurement criteria of a
tax position taken or expected to be taken in a tax return under Financial Accounting Standards
Board (“FASB”) Accounting Standards Codification 740, Income Taxes (“ASC 740”). ASC 740 also
provides guidance on derecognition, classification, interest and penalties, accounting in interim
periods, disclosure, and transition. Effective May 1, 2007, the Company adopted FASB
Interpretation No. 48, Accounting for Uncertainty in Income Taxes, as codified by ASC 740. The
cumulative effect of applying this interpretation has been recorded as a decrease of $2,374 to
retained income as of May 1, 2007.
In accordance with the requirements of ASC 740, uncertain tax positions have been classified in
the Consolidated Balance Sheets as long term, except to the extent payment is expected within one
year. The Company recognizes net interest and penalties related to unrecognized tax benefits in
income tax expense.
The Company files income tax returns in the U.S. and various state, local, and foreign
jurisdictions. The Company is no longer subject to examination of U.S. federal income taxes for
years prior to 2007 and, with limited exceptions, the Company is no longer subject to examination
of state, local, or foreign income taxes for years prior to 2006. In May 2009, the Company
reached an agreement with the Internal Revenue Service on proposed adjustments resulting from an
examination of its federal income tax returns for years ended in 2007 and 2006. The agreement did
not have a material effect on the Company’s effective tax rate.
Within the next 12 months, it is reasonably possible that the Company could decrease its
unrecognized tax benefits by an estimated $4.0 million, primarily as a result of the expiration
of federal, state, local, and foreign statute of limitation periods.
61
Table of Contents
The Company’s unrecognized tax benefits as of April 30, 2010 and 2009, were $15,322 and $13,794,
respectively. Of the unrecognized tax benefits, $11,321 and $5,694 would affect the effective tax
rate, if recognized, as of April 30, 2010 and 2009, respectively. The Company’s accrual for
tax-related net interest and penalties totaled $2,289 and $2,883 as of April 30, 2010 and 2009,
respectively. The amount of tax-related net interest and penalties credited to earnings totaled
$594 and $1,982 during 2010 and 2009, respectively.
A reconciliation of the Company’s unrecognized tax benefits is as follows:
| 2010 | 2009 | |||||||
Balance at May 1, |
$ | 13,794 | $ | 21,902 | ||||
Increases: |
||||||||
Current year tax positions |
3,977 | 118 | ||||||
Prior year tax positions |
2,353 | 274 | ||||||
Acquisitions |
— | 3,103 | ||||||
Foreign currency translation |
686 | — | ||||||
Decreases: |
||||||||
Prior year tax positions |
— | 8,338 | ||||||
Settlement with tax authorities |
— | 1,370 | ||||||
Expiration of statute of limitations periods |
5,488 | 1,711 | ||||||
Foreign currency translation |
— | 184 | ||||||
Balance at April 30, |
$ | 15,322 | $ | 13,794 | ||||
NOTE O: ACCUMULATED OTHER COMPREHENSIVE (LOSS) INCOME
Comprehensive income is included in the Statements of Consolidated Shareholders’ Equity. The
components of accumulated other comprehensive (loss) income as shown in the Consolidated Balance
Sheets are as follows:
| Foreign | Pension | Unrealized and | Unrealized Gain | Accumulated | ||||||||||||||||
| Currency | Other | Gain (Loss) on | on Cash Flow | Other | ||||||||||||||||
| Translation | Postretirement | Available-for-Sale | Hedging | Comprehensive | ||||||||||||||||
| Adjustment | Liabilities | Securities | Derivatives | (Loss) Income | ||||||||||||||||
Balance at May 1, 2007 |
$ | 37,225 | $ | (21,294 | ) | $ | 968 | $ | 858 | $ | 17,757 | |||||||||
Reclassification adjustments |
— | — | — | (1,354 | ) | (1,354 | ) | |||||||||||||
Current period credit (charge) |
20,861 | (3,642 | ) | (611 | ) | 12,885 | 29,493 | |||||||||||||
Income tax benefit (expense) |
— | 722 | 232 | (4,238 | ) | (3,284 | ) | |||||||||||||
Balance at April 30, 2008 |
$ | 58,086 | $ | (24,214 | ) | $ | 589 | $ | 8,151 | $ | 42,612 | |||||||||
Reclassification adjustments |
— | — | — | (12,885 | ) | (12,885 | ) | |||||||||||||
Current period (charge) credit |
(47,024 | ) | (65,828 | ) | (4,384 | ) | 2,494 | (114,742 | ) | |||||||||||
Income tax benefit |
— | 22,349 | 1,586 | 3,810 | 27,745 | |||||||||||||||
Balance at April 30, 2009 |
$ | 11,062 | $ | (67,693 | ) | $ | (2,209 | ) | $ | 1,570 | $ | (57,270 | ) | |||||||
Reclassification adjustments |
— | — | — | (2,494 | ) | (2,494 | ) | |||||||||||||
Current period credit (charge) |
45,926 | (18,004 | ) | 4,162 | 3,128 | 35,212 | ||||||||||||||
Income tax benefit (expense) |
— | 5,691 | (1,510 | ) | (210 | ) | 3,971 | |||||||||||||
Balance at April 30, 2010 |
$ | 56,988 | $ | (80,006 | ) | $ | 443 | $ | 1,994 | $ | (20,581 | ) | ||||||||
Income tax benefit (expense) is determined using the applicable deferred tax rate for each
component of accumulated other comprehensive (loss) income.
62
Table of Contents
NOTE P: COMMON SHARES
Voting: The Company’s Amended Articles of Incorporation (“Articles”) provide that each holder
of an outstanding common share is entitled to one vote on each matter submitted to a vote of the
shareholders except for the following specific matters:
| • | any matter that relates to or would result in the dissolution or liquidation of the Company; | |
| • | the adoption of any amendment of the Articles or the Regulations of the Company, or the adoption of amended Articles, other than the adoption of any amendment or amended Articles that increases the number of votes to which holders of common shares are entitled or expands the matters to which time phase voting applies; | |
| • | any proposal or other action to be taken by the shareholders of the Company, relating to the Company’s Rights Agreement or any successor plan; | |
| • | any matter relating to any stock option plan, stock purchase plan, executive compensation plan, or other similar plan, arrangement, or agreement; | |
| • | adoption of any agreement or plan of or for the merger, consolidation, or majority share acquisition of the Company or any of its subsidiaries with or into any other person, whether domestic or foreign, corporate or noncorporate, or the authorization of the lease, sale, exchange, transfer, or other disposition of all, or substantially all, of the Company’s assets; | |
| • | any matter submitted to the Company’s shareholders pursuant to Article Fifth (which relates to procedures applicable to certain business combinations) or Article Seventh (which relates to procedures applicable to certain proposed acquisitions of specified percentages of the Company’s outstanding common shares) of the Articles, as they may be further amended, or any issuance of common shares of the Company for which shareholder approval is required by applicable stock exchange rules; and | |
| • | any matter relating to the issuance of common shares, or the repurchase of common shares that the Board determines is required or appropriate to be submitted to the Company’s shareholders under the Ohio Revised Code or applicable stock exchange rules. |
On the matters listed above, common shares are entitled to 10 votes per share, if they meet the
requirements set forth in the Articles. Common shares which would be entitled to 10 votes per
share include:
| • | common shares beneficially owned as of November 6, 2008, and for which there has not been a change in beneficial ownership after November 6, 2008; or | |
| • | common shares received through the Company’s various equity plans which have not been sold or otherwise transferred since November 6, 2008. |
In the event of a change in beneficial ownership, the new owner of that share will be entitled to
only one vote with respect to that share on all matters until four years pass without a further
change in beneficial ownership of the share.
Shareholders’ Rights Plan:Pursuant to a shareholders’ rights plan adopted by the Company’s Board
of Directors on May 20, 2009, one share purchase right is associated with each of the Company’s
outstanding common shares.
Under the plan, the rights will initially trade together with the Company’s common shares and will
not be exercisable. In the absence of further action by the directors, the rights generally will
become exercisable and allow the holder to acquire the Company’s common shares at a discounted
price if a person or group acquires 10 percent or more of the outstanding common shares. Rights
held by persons who exceed the applicable threshold will be void. Shares held by members of the
Smucker family are not subject to the threshold. If exercisable, each right entitles the
shareholder to buy one common share at a discounted price. Under certain circumstances, the rights
will entitle the holder to buy shares in an acquiring entity at a discounted price.
The plan also includes an exchange option. In general, if the rights become exercisable, the
directors may, at their option, effect an exchange of part or all of the rights, other than rights
that have become void, for common shares. Under this option, the Company would issue one common
share for each right, in each case subject to adjustment in certain circumstances.
The Company’s directors may, at their option, redeem all rights for $0.001 per right, generally at
any time prior to the rights becoming exercisable. The rights will expire June 3, 2019, unless
earlier redeemed, exchanged, or amended by the directors.
63
Table of Contents
Directors and Officers
The J. M. Smucker Company
— DIRECTORS —
Vincent C. Byrd
President, U.S. Retail — Coffee
The J. M. Smucker Company
President, U.S. Retail — Coffee
The J. M. Smucker Company
R. Douglas Cowan A
Director and Retired Chairman and
Chief Executive Officer
The Davey Tree Expert Company
Kent, Ohio
Director and Retired Chairman and
Chief Executive Officer
The Davey Tree Expert Company
Kent, Ohio
Kathryn W. Dindo A, E
Retired Vice President
FirstEnergy Corp.
Akron, Ohio
Retired Vice President
FirstEnergy Corp.
Akron, Ohio
Paul J. Dolan E
President
Cleveland Indians
Cleveland, Ohio
President
Cleveland Indians
Cleveland, Ohio
Elizabeth Valk Long A, E
Former Executive Vice President
Time Inc.
New York, New York
Former Executive Vice President
Time Inc.
New York, New York
Nancy Lopez Knight G
Founder
Nancy Lopez Golf Company
Albany, Georgia
Founder
Nancy Lopez Golf Company
Albany, Georgia
Gary A. Oatey G
Chairman and Chief Executive Officer
Oatey Co.
Cleveland, Ohio
Chairman and Chief Executive Officer
Oatey Co.
Cleveland, Ohio
Alex Shumate G
Managing Partner
Squire, Sanders & Dempsey L.L.P.
Columbus, Ohio
Managing Partner
Squire, Sanders & Dempsey L.L.P.
Columbus, Ohio
Mark T. Smucker
President, Special Markets
The J.M. Smucker Company
President, Special Markets
The J.M. Smucker Company
Richard K. Smucker
Executive Chairman and
Co-Chief Executive Officer
The J. M. Smucker Company
Executive Chairman and
Co-Chief Executive Officer
The J. M. Smucker Company
Timothy P. Smucker
Chairman of the Board and
Co-Chief Executive Officer
The J. M. Smucker Company
Chairman of the Board and
Co-Chief Executive Officer
The J. M. Smucker Company
William H. Steinbrink G
Principal
Unstuk, LLC
Shaker Heights, Ohio
Principal
Unstuk, LLC
Shaker Heights, Ohio
Paul Smucker Wagstaff
President, U.S. Retail — Oils and Baking
The J. M. Smucker Company
President, U.S. Retail — Oils and Baking
The J. M. Smucker Company
| A | Audit Committee Member | |
| E | Executive Compensation Committee Member | |
| G | Nominating and Corporate Governance Committee Member |
— OFFICERS —
Timothy P. Smucker
Chairman of the Board and
Co-Chief Executive Officer
Chairman of the Board and
Co-Chief Executive Officer
Richard K. Smucker
Executive Chairman and
Co-Chief Executive Officer
Executive Chairman and
Co-Chief Executive Officer
Dennis J. Armstrong
Senior Vice President, Logistics and
Operations Support
Senior Vice President, Logistics and
Operations Support
Mark R. Belgya
Senior Vice President and
Chief Financial Officer
Senior Vice President and
Chief Financial Officer
James A. Brown
Vice President, U.S. Grocery Sales
Vice President, U.S. Grocery Sales
Vincent C. Byrd
President, U.S. Retail — Coffee
President, U.S. Retail — Coffee
John W. Denman
Vice President and Controller
Vice President and Controller
Barry C. Dunaway
Senior Vice President, Corporate and
Organization Development
Senior Vice President, Corporate and
Organization Development
M. Ann Harlan
Vice President and General Counsel
Vice President and General Counsel
Jeannette L. Knudsen
Vice President, Deputy General Counsel
and Corporate Secretary
Vice President, Deputy General Counsel
and Corporate Secretary
John F. Mayer
Vice President, Sales, Grocery Market
Vice President, Sales, Grocery Market
Kenneth A. Miller
Vice President, Alternate Channels
Vice President, Alternate Channels
Steven Oakland
President, U.S. Retail — Smucker’s,
Jif, and Hungry Jack
President, U.S. Retail — Smucker’s,
Jif, and Hungry Jack
Andrew G. Platt
Vice President, Information
Services and Chief Information Officer
Vice President, Information
Services and Chief Information Officer
Christopher P. Resweber
Vice President, Marketing Communications
Vice President, Marketing Communications
Julia L. Sabin
Vice President and General Manager,
Smucker Natural Foods, Inc.
Vice President and General Manager,
Smucker Natural Foods, Inc.
Mark T. Smucker
President, Special Markets
President, Special Markets
Paul Smucker Wagstaff
President, U.S. Retail — Oils and Baking
President, U.S. Retail — Oils and Baking
Albert W. Yeagley
Vice President, Industry and Government Affairs
Vice President, Industry and Government Affairs
Debra A. Marthey
Treasurer
Treasurer
— PROPERTIES —
Corporate Offices:
Orrville, Ohio
Orrville, Ohio
Domestic Manufacturing Locations:
Chico, California
Cincinnati, Ohio
El Paso, Texas
Grandview, Washington
Havre de Grace, Maryland
Kansas City, Missouri
Lexington, Kentucky
Memphis, Tennessee
New Bethlehem, Pennsylvania
New Orleans, Louisiana (2)
Orrville, Ohio
Oxnard, California
Ripon, Wisconsin
Scottsville, Kentucky
Seneca, Missouri
Sherman, Texas
Toledo, Ohio
International Manufacturing Locations:
Delhi Township, Ontario, Canada
Dunnville, Ontario, Canada
Sherbrooke, Quebec, Canada
Ste. Marie, Quebec, Canada
Dunnville, Ontario, Canada
Sherbrooke, Quebec, Canada
Ste. Marie, Quebec, Canada
Sales and Administrative Offices:*
Akron, Ohio
Bentonville, Arkansas
Edina, Minnesota
Markham, Ontario, Canada
Mexico City, Mexico
Bentonville, Arkansas
Edina, Minnesota
Markham, Ontario, Canada
Mexico City, Mexico
| * | Leased properties |
64
Table of Contents
Corporate and Shareholder Information
The J. M. Smucker Company
Corporate Offices
The J.M. Smucker Company
Strawberry Lane
Orrville, Ohio 44667
Telephone: (330) 682-3000
The J.M. Smucker Company
Strawberry Lane
Orrville, Ohio 44667
Telephone: (330) 682-3000
Stock Listing
The J.M. Smucker Company’s common shares are listed on the New York Stock Exchange — ticker symbol
SJM.
Corporate Web Site
To learn more about The J.M. Smucker Company, visit www.smuckers.com.
Annual Meeting
The annual meeting will be held at 11:00 a.m. Eastern Daylight Time, Wednesday, August 18, 2010, in
Fisher Auditorium at the Ohio Agricultural Research and Development Center, 1680 Madison Avenue,
Wooster, Ohio 44691.
Corporate News and Reports
Corporate news releases, annual reports, and Securities and Exchange Commission filings, including
Forms 10-K, 10-Q, and 8-K, are available free of charge on the Company’s Web site. They are also
available without cost to shareholders who submit a written request to:
The J. M. Smucker Company
Attention: Corporate Secretary
Strawberry Lane
Orrville, Ohio 44667
Attention: Corporate Secretary
Strawberry Lane
Orrville, Ohio 44667
Certifications
The Company’s Co-Chief Executive Officers and Chief Financial Officer have certified to the New
York Stock Exchange that they are not aware of any violation by the Company of New York Stock
Exchange corporate governance standards. The Company has also filed with the Securities and
Exchange Commission certain certifications relating to the quality of the Company’s public
disclosures. These certifications are filed as exhibits to the Company’s Annual Report on Form
10-K.
Independent Registered Public Accounting Firm
Ernst & Young LLP
Akron, Ohio
Akron, Ohio
Dividends
The Company’s Board of Directors typically declares a cash dividend each quarter. Dividends are
generally payable on the first business day of March, June, September, and December. The record
date is approximately two weeks before the payment date. The Company’s dividend disbursement agent
is Computershare Investor Services, LLC.
Shareholder Services
The transfer agent and registrar for the Company, Computershare Investor Services, LLC, is
responsible for assisting registered shareholders with a variety of matters including:
| • | Shareholder investment program (CIPSM) |
| — | direct purchase of Company common shares | ||
| — | dividend reinvestment | ||
| — | automatic monthly cash investments |
| • | Book-entry share ownership | |
| • | Share transfer matters (including name changes, gifting, and inheritances) | |
| • | Direct deposit of dividend payments | |
| • | Nonreceipt of dividend checks | |
| • | Lost share certificates | |
| • | Changes of address | |
| • | Online shareholder account access | |
| • | Form 1099 income inquiries (including requests for duplicate copies) |
Shareholders may contact Shareholder Services at the corporate offices regarding other
shareholder inquiries.
Transfer Agent and Registrar
Computershare Investor Services, LLC
250 Royall Street
Canton, MA 02021
Telephone: (800) 456-1169
Telephone outside the U.S., Canada, and Puerto Rico:
(312) 360-5254
Web site: www.computershare.com/contactus
250 Royall Street
Canton, MA 02021
Telephone: (800) 456-1169
Telephone outside the U.S., Canada, and Puerto Rico:
(312) 360-5254
Web site: www.computershare.com/contactus
This Annual Report includes certain forward-looking statements that are based on
current expectations and are subject to a number of risks and uncertainties. Please reference
“Forward-Looking Statements” located on page 29 in the Management’s Discussion and Analysis
section.
©/ TM/® The J.M. Smucker Company or its subsidiaries. Pillsbury, the Barrelhead logo, and the
Doughboy character are trademarks of The Pillsbury Company, LLC, used under license. Borden and
Elsie trademarks used under license. Dunkin’ Donuts is a trademark of DD IP Holder LLC used under
license. Carnation is a trademark of Société des Produits Nestlé S.A. Keurig and K-Cup are
trademarks of Keurig, Incorporated.

 |
The financial section of this report was printed on paper with a 50% post-consumer recycled content. The balance of the report was printed on elemental chlorine-free paper with a 30% post-consumer recycled content |
Table of Contents
| All the Qoodness of SmuckersL. In a Store For over 110 years, The J.M. Smucker Company has been committed to bringing you quality products from its family of brands and helping families create memorable mealtime moments. Today, we are pleased to continue this proud tradition by presenting our brands, our history, and our culture through a unique sensory experience at our Company Store. Browse products and merchandise, learn about our Company’s heritage, and enjoy delicious recipes. We can also help you with gift baskets for friends, family, and business associates through our custom gift basket corner. Open Mon-Sat 9am-6pm • Route 57, 1/4 mi. N. of Route 30 • 333 Wadsworth Rd., Orrville, Ohio 44667 Phone: 330-684-1500 • www.smuckers.com with a name like smucker’s, it has to be good.® ©/® The J.M.Smucker Company. Pillsbury, the Barrelhead logo, and the Doughboy character are trademarks of The Pillsbury Company, LLC, used under license. *Offer valid through 12/31/10. Limit one coupon per customer per day. No reproductions accepted. |