Attached files
| file | filename |
|---|---|
| EX-10.9 - EXHIBIT 10.9 - JOHN WILEY & SONS, INC. | exh10.htm |
| EX-32.2 - EXHIBIT 32.2 - JOHN WILEY & SONS, INC. | exh32.htm |
| EX-31.2 - EXHIBIT 31.2 - JOHN WILEY & SONS, INC. | exh31.htm |
| EX-10.11 - EXHIBIT 10.11 - JOHN WILEY & SONS, INC. | exhi10.htm |
| EX-10.13 - EXHIBIT 10.13 - JOHN WILEY & SONS, INC. | exhib10.htm |
| EX-10.14 - EXHIBIT 10.14 - JOHN WILEY & SONS, INC. | exhibi10.htm |
| EX-23 - EXHIBIT 23 - JOHN WILEY & SONS, INC. | exhibit23.htm |
| EX-31.1 - EXHIBIT 31.1 - JOHN WILEY & SONS, INC. | exhibit31.htm |
| EX-32.1 - EXHIBIT 32.1 - JOHN WILEY & SONS, INC. | exhibit32.htm |
| EX-21 - EXHIBIT 21 - JOHN WILEY & SONS, INC. | exhibit21.htm |
| EX-10.10 - EXHIBIT 10.10 - JOHN WILEY & SONS, INC. | exhibit10.htm |
| EX-10.15 - EXHIBIT 10.15 - JOHN WILEY & SONS, INC. | milestonesplanexh10.htm |
FORM 10-K/A
SECURITIES AND EXCHANGE COMMISSION
Washington, DC 20549
[x] ANNUAL REPORT PURSUANT TO SECTION 13 OR 15(d) OF
THE SECURITIES EXCHANGE ACT OF 1934
For the fiscal year ended: April 30, 2010
OR
[ ] TRANSITION REPORT PURSUANT TO SECTION 13 OR 15(d) OF THE
SECURITIES EXCHANGE ACT OF 1934 (FEE REQUIRED)
For the transition period from to
Commission file number 1-11507
JOHN WILEY & SONS, INC.
(Exact name of Registrant as specified in its charter)
|
NEW YORK
|
13-5593032
|
|
|
State or other jurisdiction of incorporation or organization
|
I.R.S. Employer Identification No.
|
|
|
111 River Street, Hoboken, NJ
|
07030
|
|
|
Address of principal executive offices
|
Zip Code
|
|
|
(201) 748-6000
|
||
|
Registrant’s telephone number including area code
|
||
|
Securities registered pursuant to Section 12(b) of the Act: Title of each class
|
Name of each exchange on which registered
|
|
|
Class A Common Stock, par value $1.00 per share
|
New York Stock Exchange
|
|
|
Class B Common Stock, par value $1.00 per share
|
New York Stock Exchange
|
|
|
Securities registered pursuant to Section 12(g) of the Act:
|
||
|
None
|
1
Indicate by check mark if the registrant is a well-known seasoned issuer, as defined in Rule 405 of the Securities Act.
Yes |X| No | |
Indicate by check mark if the registrant is not required to file reports pursuant to Section 13 or Section 15(d) of the Exchange Act.
Yes | | No |X |
Indicate by check mark whether the registrant (1) has filed all reports required to be filed by Section 13 or 15(d) of the Securities Exchange Act of 1934 during the preceding 12 months (or for such shorter period that the registrant was required to file such reports), and (2) has been subject to such filing requirements for the past 90 days.
Yes |X| No | |
Indicate by check mark if disclosure of delinquent filers pursuant to Item 405 of Regulation S-K is not contained herein, and will not be contained, to the best of registrant’s knowledge, in definitive proxy or information statements incorporated by reference in Part III of this Form 10-K or any amendment to this Form 10-K. | |
Indicate by check mark whether the registrant is a large accelerated filer, an accelerated filer, or a non-accelerated filer. See definition of “accelerated filer and large accelerated filer” in Rule 12b-2 of the Exchange Act.
Large accelerated filer |X| Accelerated filer | | Non-accelerated filer | |
Indicate by check mark whether the registrant is a shell company (as defined in Rule 12b-2 of the Exchange Act).
Yes | | No |X|
The aggregate market value of the voting stock held by non-affiliates of the registrant, computed by reference to the closing price as of the last business day of the registrant’s most recently completed second fiscal quarter, October 31, 2009, was approximately $1,565.6 million. The registrant has no non-voting common stock.
The number of shares outstanding of the registrant’s Class A and Class B Common Stock as of May 31, 2010 was 50,533,570 and 9,582,095 respectively.
DOCUMENTS INCORPORATED BY REFERENCE
Portions of the registrant’s definitive proxy statement for use in connection with its annual meeting of stockholders scheduled to be held on September 16, 2010, are incorporated by reference into Part III of this form 10-K.
EXPLANATORY STATEMENT
Conformed signatures for William J. Pesce, Ellis E. Cousens and Edward J. Melando were added to pages 46, 83 and Exhibits 31.1, 31.2, 32.1 and 32.2.
2
JOHN WILEY AND SONS, INC. AND SUBSIDIARIES
FORM 10-K
FOR THE FISCAL YEAR ENDED APRIL 30, 2010
INDEX
|
PART I
|
PAGE
|
|
|
ITEM 1.
|
Business
|
4
|
|
ITEM 1A.
|
Risk Factors
|
4-8
|
|
ITEM 1B.
|
Unresolved Staff Comments
|
8
|
|
ITEM 2.
|
Properties
|
9
|
|
ITEM 3.
|
Legal Proceedings
|
9
|
|
ITEM 4
|
[Removed and Reserved]
|
10
|
|
PART II
|
|
|
|
ITEM 5.
|
Market for the Company’s Common Equity and Related Stockholder Matters and Issuer Purchases of Equity Securities
|
10
|
|
ITEM 6.
|
Selected Financial Data
|
10
|
|
ITEM 7.
|
Management’s Discussion and Analysis of Financial Condition and Results of Operations
|
10
|
|
ITEM 7A.
|
Quantitative and Qualitative Disclosures About Market Risk
|
10
|
|
ITEM 8.
|
Financial Statements and Supplemental Data
|
10
|
|
ITEM 9.
|
Changes in and Disagreements with Accountants on Accounting and Financial Disclosure
|
79
|
|
ITEM 9A.
|
Controls and Procedures
|
79
|
|
ITEM 9B.
|
Other Information
|
79
|
|
PART III
|
||
|
ITEM 10.
|
Directors and Executive Officers of the Registrant
|
80-81
|
|
ITEM 11.
|
Executive Compensation
|
81
|
|
ITEM 12.
|
Security Ownership of Certain Beneficial Owners and Management and Related Stockholder Matters
|
81
|
|
ITEM 13.
|
Certain Relationships and Related Transactions
|
81
|
|
ITEM 14.
|
Principal Accounting Fees and Services
|
81
|
|
81
|
||
|
PART IV
|
||
|
ITEM 15.
|
Exhibits, Financial Statement Schedules and Reports on Form 8-K
|
82-84
|
|
SIGNATURES
|
|
3
PART I
|
Item 1.
|
Business
|
The Company, founded in 1807, was incorporated in the state of New York on January 15, 1904. (As used herein the term “Company” means John Wiley & Sons, Inc., and its subsidiaries and affiliated companies, unless the context indicates otherwise.)
The Company is a global publisher of print and electronic products, providing content and digital solutions to customers worldwide. Core businesses produce scientific, technical, medical and scholarly journals, encyclopedias, books, online products and services; professional and consumer books, subscription products, certification and training materials, online applications and websites; and educational materials in all media, including integrated online teaching and learning resources, for undergraduate, graduate and advanced placement students, educators, and lifelong learners worldwide as well as secondary school students in Australia. The Company takes full advantage of its content from all three core businesses in developing and cross-marketing products to its diverse customer base of professionals, consumers, researchers, students, and educators. The use of technology enables the Company to make its content more accessible to its customers around the world. The Company maintains publishing, marketing, and distribution centers in the United States, Canada, Europe, Asia, and Australia.
Further description of the Company’s business is incorporated herein by reference in the Management’s Discussion and Analysis section of this 10-K.
Employees
As of April 30, 2010, the Company employed approximately 5,100 people on a full-time equivalent basis worldwide.
Financial Information About Industry Segments
The note entitled “Segment Information” of the Notes to Consolidated Financial Statements and the Management’s Discussion and Analysis section of this 10-K, both listed in the attached index, are incorporated herein by reference.
Financial Information About Foreign and Domestic Operations and Export Sales
The note entitled “Segment Information” of the Notes to Consolidated Financial Statements and the Management’s Discussion and Analysis section of this 10-K, both listed in the attached index, are incorporated herein by reference.
|
Item 1A.
|
Risk Factors
|
You should carefully consider all of the information set forth in this Form 10-K, including the following risk factors, before deciding to invest in any of the Company’s securities. The risks below are not the only ones the Company faces. Additional risks not currently known to the Company or that the Company presently deems immaterial may also impair its business operations. The Company’s business, financial condition, results of operations or prospects could be materially adversely affected by any of these risks.
Cautionary Statement Under the Private Securities Litigation Reform Act of 1995:
4
This 10-K and our Annual Report to Shareholders for the year ending April 30, 2010 contain certain forward-looking statements concerning the Company’s operations, performance and financial condition. In addition, the Company provides forward-looking statements in other materials released to the public as well as oral forward-looking information. Statements which contain the words anticipate, expect, believes, estimate, project, forecast, plan, outlook, intend and similar expressions constitute forward-looking statements that involve risk and uncertainties. Reliance should not be placed on forward-looking statements, as actual results may differ materially from those in any forward-looking statements.
Any such forward-looking statements are based upon a number of assumptions and estimates that are inherently subject to uncertainties and contingencies, many of which are beyond the control of the Company, and are subject to change based on many important factors. Such factors include, but are not limited to (i) the level of investment in new technologies and products; (ii) subscriber renewal rates for the Company’s journals; (iii) the financial stability and liquidity of journal subscription agents; (iv) the consolidation of book wholesalers and retail accounts; (v) the market position and financial stability of key retailers; (vi) the impact of the used-book market; (vii) worldwide economic and political conditions; and (viii) the Company’s ability to protect its copyrights and other intellectual property worldwide (ix) other factors detailed from time to time in the Company’s filings with the Securities and Exchange Commission. The Company undertakes no obligation to update or revise any such forward-looking statements to reflect subsequent events or circumstances.
Operating Costs and Expenses
The Company has a significant investment, and cost, in its employee base around the world. The Company offers competitive salaries and benefits in order to attract and retain the highly skilled workforce needed to sustain and develop new products and services required for growth. Employment and benefit costs are affected by competitive market conditions for qualified individuals, and factors such as healthcare, pension and retirement benefits costs. The Company is a large paper purchaser, and paper prices may fluctuate significantly from time-to-time. The Company attempts to moderate the exposure to fluctuations in price by entering into multi-year supply contracts and having alternative suppliers available. In general, however, any significant increase in the costs of goods and services provided to the Company may adversely affect the Company’s costs of operation.
Protection of Intellectual Property Rights
Substantially all of the Company’s publications are protected by copyright, held either in the Company’s name, in the name of the author of the work, or in the name of the sponsoring professional society. Such copyrights protect the Company’s exclusive right to publish the work in many countries abroad for specified periods, in most cases the author’s life plus 70 years, but in any event a minimum of 50 years for works published after 1978. The ability of the Company to continue to achieve its expected results depends, in part, upon the Company’s ability to protect its intellectual property rights. The Company’s results may be adversely affected by lack of legal and/or technological protections for its intellectual property in some jurisdictions and markets.
The Scientific, Technical, Medical and Scholarly (“STMS”) publishing industry generates much of its revenue from paid customer subscriptions to print and online journal content. There is debate within the academic and government communities whether such journal content should be made available for free, immediately or following a period of embargo after publication. For instance, certain governments are considering mandating that all publications containing information derived from government-funded research be made available to the public at no cost. These mandates have the potential to put pressure on subscription-based publications and favor business models funded by author fees or government and private subsidies. If such regulations are widely implemented, the Company’s operating results could be adversely affected.
5
Maintaining the Company’s Reputation
Professionals worldwide rely upon many of the Company’s publications to perform their jobs. It is imperative that the Company consistently demonstrates its ability to maintain the integrity of the information included in its publications. Adverse publicity, whether or not valid, may reduce demand for the Company’s publications.
Trade Concentration and Credit Risk
In the journal publishing business, subscriptions are primarily sourced through independent journal subscription agents who, acting as agents for library customers, facilitate ordering by consolidating the subscription orders/billings of each subscriber with various publishers. Cash is generally collected in advance from subscribers by the subscription agent and is remitted to the journal publisher, including the Company, generally prior to the commencement of the subscription. Although at fiscal year-end the Company had minimal credit risk exposure to these agents, future calendar-year subscription receipts from these agents are highly dependent on their financial condition and liquidity. Subscription agents account for approximately 24% of consolidated book and journal revenue and no one agent accounts for more than 10% of total consolidated revenue.
The Company’s business is not dependent upon a single customer; however, the book industry is concentrated in national, regional, and online bookstore chains. Although no one book customer accounts for more than 8% of consolidated revenue, the top 10 book customers account for approximately 20% of total consolidated revenue and approximately 45% of accounts receivable, before reserves at April 30, 2010. Payments for the sale of subscription journals are predominantly collected in advance.
Changes in Regulation and Accounting Standards
The Company maintains publishing, marketing and distribution centers in Asia, Australia, Canada, Europe and the United States. The conduct of our business, including the sourcing of content, distribution, sales, marketing and advertising is subject to various laws and regulations administered by governments around the world. Changes in laws, regulations or government policies, including tax regulations and accounting standards, may adversely affect the Company’s future financial results.
Introduction of New Technologies or Products
The Company must continue to invest in technological and other innovations and adapt in order to continue to add value to its products and services and remain competitive. There are uncertainties whenever developing new products and services, and it is often possible that such new products and services may not be launched or if launched, may not be profitable or as profitable as existing products and services.
In July 2010, the Company plans to launch a new online publishing platform Wiley Online Library. Wiley Online Library will host the vast majority of the Company’s online content, replacing the current platform Wiley Interscience. All existing Wiley Interscience content and licensees will be transferred to Wiley Online Library. The new online service will include enhanced discoverability, expanded functionality and a range of new personalization options. The Company has formal plans and procedures to effect the transformation. Any disruption to the online service during implementation or unforeseen issue could adversely impact results and the Company’s reputation.
6
Competition for Market Share and Author and Society Relationships
The Company operates in highly competitive markets. Success and continued growth depends greatly on developing new products and the means to deliver them in an environment of rapid technological change. Attracting new authors and professional societies, while retaining our existing business relationships, are also critical to our success.
Introduction of Higher Education Textbook Rental Programs
The Company’s Higher Education business publishes educational materials for two and four-year colleges and universities, for-profit career colleges, advanced placement classes and secondary schools in Australia. Due to a growing demand by students for less expensive textbooks, a growing number of college bookstores are offering textbook rental programs to students. In addition, there are a variety of online national textbook rental companies already offering textbooks on a rental basis. In many ways, the textbook rental business model is an adaptation of the used book model that has been in place in the higher education market for many years. Due to its recent introduction it is uncertain whether such textbook rental programs will have any impact on Wiley results.
Interest Rate and Foreign Exchange Risk
International-based revenues, as well as our substantial international net assets, expose the Company’s results to foreign currency exchange rate volatility. Fiscal year 2010 revenue was recognized in the following currencies: approximately 55% U.S dollar; 28% British pound sterling; 8% Euro and 9% other currencies. In addition, our interest-bearing loans and borrowings are subject to risk from changes in interest rates. These risks and the measures we have taken to help contain them are discussed in the Market Risk section of this 10-K. For additional details, see Note 11 to our consolidated financial statements, Debt and Available Credit Facilities, in this 10-K. Those sections of our 2010 10-K are incorporated by reference. Notwithstanding our efforts to foresee and mitigate the effects of changes in fiscal circumstances, we cannot predict with certainty changes in currency and interest rates, inflation or other related factors affecting our business.
Risk of Doing Business in Developing and Emerging Markets
The Company sells its products to customers in the Middle East (including Iran and Syria), Africa (including Sudan), Cuba, and other developing markets where it does not have operating subsidiaries. The Company does not own any assets or liabilities in these markets except for trade receivables. Challenges and uncertainties associated with operating in developing markets may entail a relatively higher risk due to political instability, economic volatility, crime, terrorism, corruption, social and ethnic unrest, and other factors. While sales in these markets do not have a material effect on the Company’s business results, adverse developments related to the risks associated with these markets may cause actual results to differ from historical and forecasted future operating results. Disruption in these markets could also trigger a decrease in consumer purchasing power, resulting in a reduced demand for our products.
7
Liquidity and Global Economic Conditions
The recent changes in global financial markets have not had, nor do we anticipate they will have, a significant impact on our liquidity. Due to our significant operating cash flow, financial assets, access to capital markets and available lines of credit and revolving credit agreements, we continue to believe that we have the ability to meet our financing needs for the foreseeable future. As market conditions change, we will continue to monitor our liquidity position. However, there can be no assurance that our liquidity or our results of operations will not be affected by recent and possible future changes in global financial markets and global economic conditions. Similar to other global businesses, we face the potential effects of the global economic recession. Unprecedented market conditions including illiquid credit markets, volatile equity markets, dramatic fluctuations in foreign currency rates and economic recession could affect future results.
Effects of Inflation and Cost Increases
The Company, from time to time, experiences cost increases reflecting, in part, general inflationary factors. There is no guarantee that the Company can increase selling prices or reduce costs to fully mitigate the effect of inflation on company costs.
Ability to Successfully Integrate Key Acquisitions
The Company’s growth strategy includes title, imprint and business acquisitions which complement the Company’s existing businesses; the development of new products and services; designing and implementing new methods of delivering products to our customers, and organic growth of existing brands and titles. Acquisitions may have a substantial impact on the Company’s costs, revenues, cash flows, and financial position. Acquisitions involve risks and uncertainties, including difficulties in integrating acquired operations and in realizing expected opportunities; diversions of management resources and loss of key employees; challenges with respect to operating new businesses; debt incurred in financing such acquisitions; and other unanticipated problems and liabilities.
Attracting and Retaining Key Employees
The Company’s success is highly dependent upon the retention of key employees globally. In addition, we are dependent upon our ability to continue to attract new employees with key skills to support the continued organic growth of the business.
|
Item 1B.
|
Unresolved Staff Comments
|
None
8
|
Item 2.
|
Properties
|
The Company occupies office, warehouse, and distribution facilities in various parts of the world, as listed below (excluding those locations with less than 10,000 square feet of floor area, none of which is considered material property). All of the buildings and the equipment owned or leased are believed to be in good condition and are generally fully utilized.
|
Location
|
Purpose
|
Owned or Leased
|
Approx. Sq. Ft.
|
|
United States:
|
|||
|
New Jersey
|
Corporate Headquarters
|
Leased
|
386,000
|
|
New Jersey
|
Warehouse
|
Leased
|
380,000
|
|
New Jersey
|
Office & Warehouse
|
Leased
|
185,000
|
|
Indiana
|
Office
|
Leased
|
123,000
|
|
Massachusetts
|
Office
|
Leased
|
43,000
|
|
California
|
Office
|
Leased
|
38,000
|
|
Iowa
|
Office & Warehouse
|
Owned
|
27,000
|
|
International:
|
|||
|
Australia
|
Office & Warehouse
|
Leased
|
93,000
|
|
Office
|
Leased
|
33,000
|
|
|
Office
|
Leased
|
26,000
|
|
|
Canada
|
Office & Warehouse
|
Leased
|
87,000
|
|
Office
|
Leased
|
20,000
|
|
|
England
|
Warehouse
|
Leased
|
143,000
|
|
Warehouse
|
Leased
|
85,000
|
|
|
Office
|
Leased
|
63,000
|
|
|
Office
|
Leased
|
17,000
|
|
|
Office
|
Owned
|
49,000
|
|
|
Office
|
Owned
|
21,000
|
|
|
Germany
|
Office
|
Leased
|
29,000
|
|
Office
|
Leased
|
19,000
|
|
|
Office
|
Owned
|
58,000
|
|
|
India
|
Office & Warehouse
|
Leased
|
16,000
|
|
Singapore
|
Office & Warehouse
|
Leased
|
67,000
|
|
Office
|
Leased
|
15,000
|
|
|
Item 3.
|
Legal Proceedings
|
The Company is involved in routine litigation in the ordinary course of its business. In the opinion of management, the ultimate resolution of all pending litigation will not have a material effect upon the financial condition or results of operations of the Company.
9
|
Item 4.
|
[Removed and Reserved]
|
PART II
|
Item 5.
|
Market for the Company’s Common Equity and Related Stockholder Matters and Issuer Purchases of Equity Securities
|
The Quarterly Share Prices, Dividends, and Related Stockholder Matters and Issuer Purchases of Equity Securities listed in the index on page 11 are incorporated herein by reference.
On September 17, 2009, 14,130 shares of restricted stock were granted to the Company's non-employee directors under the Company's 2009 Director Stock Plan. These shares were equal in value to 100 percent of the directors' annual total cash compensation, excluding the additional fees paid to committee chairmen and any expense reimbursements. These awards do not vest until the director retires from the Board of Directors and were made as partial compensation for the recipients’ services as directors. On December 16, 2009, 30,000 shares of restricted stock were granted to William J. Pesce, the Company's President and Chief Executive Officer in recognition of his role in reorganizing the company into three global lines of business and on selecting and developing successors for the three global lines of business. These issuances of shares were not registered under the Securities Act of 1933, as amended (the Securities Act), pursuant to the exemption under Section 4(2) of the Securities Act for transactions not involving any public offering. No underwriters participated in these transactions, and the Company did not receive any proceeds in connection with these transactions.
|
Item 6.
|
Selected Financial Data
|
The Selected Financial Data listed in the index on page 11 is incorporated herein by reference.
|
Item 7.
|
Management’s Discussion and Analysis of Financial Condition and Results of Operations
|
Management’s Discussion and Analysis of Business, Financial Condition and Results of Operations listed in the index on page 11 are incorporated herein by reference.
|
Item 7A.
|
Quantitative and Qualitative Disclosures about Market Risk
|
The information appearing under the caption “Market Risk” in Management’s Discussion and Analysis of Financial Condition and Results of Operations listed in the index on page 11 is incorporated herein by reference.
|
Item 8.
|
Financial Statements and Supplemental Data
|
The Financial Statements and Supplemental Data listed in the index on page 11 is incorporated herein by reference.
10
JOHN WILEY & SONS, INC., AND SUBSIDIARIES
INDEX TO CONSOLIDATED FINANCIAL STATEMENTS AND SCHEDULES
The following financial statements and information appearing on the pages indicated are filed as part of this report:
|
Page(s)
|
|
|
Management’s Discussion and Analysis of Business, Financial Condition and Results of Operations
|
12-42
|
|
Results by Quarter
|
43
|
|
Quarterly Share Prices, Dividends, and Related Stockholder Matters and Issuer Purchases of Equity Securities
|
44
|
|
Selected Financial Data
|
45
|
|
Management’s Report on Internal Control over Financial Reporting
|
46
|
|
Reports of Independent Registered Public Accounting Firm
|
47-48
|
|
Consolidated Statements of Financial Position as of April 30, 2010 and 2009
|
49
|
|
Consolidated Statements of Income for the years ended April 30, 2010, 2009, and 2008
|
50
|
|
Consolidated Statements of Cash Flows for the years ended April 30, 2010, 2009, and 2008
|
51
|
|
Consolidated Statements of Shareholders’ Equity and Comprehensive Income for the years ended April 30, 2010, 2009, and 2008
|
52
|
|
Notes to Consolidated Financial Statements
|
53-77
|
|
Schedule II — Valuation and Qualifying Accounts for the years ended April 30, 2010, 2009, and 2008
|
78
|
Other schedules are omitted because of the absence of conditions under which they apply or because the information required is included in the Notes to Consolidated Financial Statements.
11
Management’s Discussion and Analysis of Business,
Financial Condition and Results of Operations
The Company is a global publisher of print and electronic products, providing content and digital solutions to customers worldwide. Core businesses produce scientific, technical, medical and scholarly journals, encyclopedias, books, online products and services; professional and consumer books, subscription products, certification and training materials, online applications and websites; and educational materials in all media, notably through WileyPLUS, the Company’s integrated online learning environment, for undergraduate and graduate students, educators, and lifelong learners worldwide as well as secondary school students in Australia. The Company takes full advantage of its content from all three core businesses in developing and cross-marketing products to its diverse customer base of professionals, consumers, researchers, students, and educators. The use of technology enables the Company to make its content more accessible to its customers around the world. The Company maintains publishing, marketing, and distribution centers in the United States, Canada, Europe, Asia, and Australia.
Business growth comes from a combination of title, imprint and business acquisitions which complement the Company’s existing businesses; from the development of new products and services; from designing and implementing new methods of delivering products to our customers; and from organic growth of existing brands and titles. The Company’s revenue grew at a compound annual rate of 12% over the past five years, including the acquisition of Blackwell in February 2007.
Core Businesses
Scientific, Technical, Medical and Scholarly (STMS):
The Company is one of the leading publishers for the scientific, technical, medical and scholarly communities worldwide, including academic, corporate, government, and public libraries; researchers; scientists; clinicians; engineers and technologists; scholarly and professional societies; and students and professors. STMS products include journals, books, major reference works, databases and laboratory manuals. STMS publishing areas include the physical sciences, health sciences, social science and humanities and life sciences. The Company’s STMS products are sold and distributed globally, online and in print through multiple channels, including research libraries and library consortia, independent subscription agents, direct sales to professional society members, bookstores, online booksellers and other customers. Publishing centers include Australia, Germany, Singapore, the United Kingdom and the United States. STMS accounted for approximately 58% of total Company revenue in fiscal year 2010 and generated revenue growth at a compound annual rate of 20% over the past five years, including the acquisition of Blackwell in February 2007. The graph below presents STMS revenue by product type for fiscal year 2010:

12
Approximately 53% of journal subscription revenue is derived from publishing rights owned by the Company. Publishing alliances also play a major role in STMS’s success. The Company publishes the journals of prestigious societies, including the American Cancer Society, the British Journal of Surgery Society, the Federation of European Biochemical Societies, The European Molecular Biology Organization, the American Anthropological Association and the German Chemical Society. Approximately 47% of journal subscription revenue is derived from publication rights which are owned by professional societies and published by the Company pursuant to a long-term contract or owned jointly with a professional society. These society alliances bring mutual benefit, with the societies gaining Wiley’s publishing, marketing, sales and distribution expertise, while Wiley benefits from being affiliated with prestigious societies and their members.
STMS is a leading provider of evidence-based medicine (EBM). The Cochrane Collaboration database, a premier source of high-quality independent evidence to inform healthcare decision-making, provides the foundation for the Company’s growing suite of EBM products designed to improve patient healthcare. EBM facilitates the effective management of patients through clinical expertise informed by best practice evidence that is derived from medical literature.
In late July 2010, the Company plans to launch Wiley Online Library, which will host the world’s broadest and deepest multidisciplinary collection of online resources covering life, health and physical sciences, medicine, humanities and social science. Built on the latest technology and designed with extensive input from scholars around the world, Wiley Online Library will deliver seamless integrated access to over 4 million articles from 1,500 journals, 8,000 books, and hundreds of reference works, laboratory protocols and databases from John Wiley & Sons and key imprints including Wiley-Blackwell, Wiley-VCH and Jossey-Bass. Featuring a clean and simple interface, this new online service will combine intuitive navigation, enhanced discoverability, expanded functionalities and a range of personalization options. Wiley Online Library will completely replace Wiley InterScience, the Company’s current online publishing platform for its scientific, technical, medical and scholarly content, previously introduced in 1999. All existing Wiley InterScience content and licensees will be transferred to the new site to enable seamless access for users and subscribers.
Access to Wiley Online Library and Wiley InterScience is sold through licenses with institutional and corporate libraries, consortia and other academic, government and corporate customers. The Company offers a range of licensing options including customized suites of journal publications for individual customer needs as well as subscriptions for individual journal and online book publications. Licenses are typically sold in durations of one to three years. The Company also provides fee-based access to its content through its Article Select and PayPerView programs which offer non-subscribed journal content, book chapters and major reference work articles.
Wiley Online Library and Wiley InterScience take advantage of technology to update content frequently and to add new features and resources on an ongoing basis to increase the productivity of scientists, professionals and students. Two examples are EarlyView, through which customers can access individual articles well in advance of print publication, and MobileEditions, which enables users to view tables of content and abstracts on wireless handheld devices and Web-enabled phones.
In 2008, the Company introduced its open access business model, OnlineOpen. Under this open access business model, the author, the author's funding agency, or the author's institution pays a fee to ensure that an article is made available globally via Wiley InterScience to all non-subscribers including the general public upon publication. The article is also deposited in the funding agency's preferred repository. In return for the service fee, the Company provides its customary publishing, editing and peer review and technology services.
13
In 2005, the Company began a program to digitize its entire historical journal content, dating back to the 1800s. The Company’s digitization of legacy content is designed to improve the research pathway and ensure content discovery is as seamless and efficient as possible. The backfile collection, which is available online through Wiley InterScience, spans three centuries of scientific research and comprise over 13.6 million pages – one of the largest archives of its kind issued by a single publisher. As of April 30, 2010 all of Wiley’s and Blackwell’s existing journal content is digitized and made available to customers.
The Company has been focused on reducing costs associated with the STMS business to finance investments in enabling technology and new businesses. The cost savings are principally the result of increased off-shoring and out-sourcing of certain functions and activities from high cost locations to Singapore and other countries in Asia. Significant portions of the STMS journals and books content management functions, in addition to certain customer support activities, have been off-shored as of the end of fiscal year 2010, with central marketing roles expected to be transferred during fiscal year 2011. In addition to cost savings, the off-shoring and out-sourcing of these functions has enabled the Company to focus its resources on value-added activities, such as process and service enhancements.
Significant Acquisitions: In February 2007, the Company acquired Blackwell Publishing (Holdings) Ltd. (“Blackwell”), a leading publisher of journals and books for the academic, research and professional markets focused on science, technology, medicine and social sciences and humanities. Headquartered in Oxford, England, Blackwell also maintained publishing locations in the United States, Asia, Australia, Denmark and Germany. Approximately 50% of Blackwell’s annual revenue was derived from the United States. Blackwell employed approximately 1,000 individuals worldwide with just over half located in the United Kingdom. The acquisition of Blackwell enhanced Wiley’s global position as a provider of content and services, expanded and added diversity to the journal portfolio, increased both print and online advertising revenue and added more professional society relationships.
Professional/Trade:
The Company’s Professional/Trade business acquires, develops and publishes books, subscription products and information services in all media, in the subject areas of business, technology, architecture, cooking, psychology, education, travel, health, religion, consumer reference, pets and general interest. Products are developed for worldwide distribution through multiple channels, including major chains and online booksellers, independent bookstores, libraries, colleges and universities, warehouse clubs, corporations, direct marketing, and websites. The Company’s Professional/Trade customers are professionals, consumers, and students worldwide. Publishing centers include Australia, Canada, Germany, Singapore, the United Kingdom and the United States. Professional/Trade publishing accounted for approximately 25% of total Company revenue in fiscal year 2010 and generated revenue growth at a compound annual rate of 3% over the past five years. The graph below presents P/T revenue by product type for fiscal year 2010:

14
Key revenue growth strategies of the Professional/Trade business include adding value to its content, developing its leading brands and franchises, and executing strategic acquisitions. The Company’s leading Professional/Trade brands include the For Dummies series, the Frommer’s and Unofficial Guide travel series, the Bible and Visual technology series, the CliffsNotes study guides, Webster’s New World dictionaries, and Betty Crocker and Weight Watchers cookbooks.
Publishing alliances and franchise products are also central to the Company’s strategy. The ability to bring together Wiley’s product development, sales, marketing, distribution and technological capabilities with a partner’s content and brand name recognition has been a driving factor in its success. Professional/Trade alliance partners include General Mills, the Culinary Institute of America, Bloomberg Press, the American Institute of Architects, the Graduate Management Admission Council, the Leader to Leader Institute, Fisher Investments, Meredith Corporation and Weight Watchers, among many others.
The Company promotes an active and growing Professional/Trade custom publishing program. Custom publications are typically used by organizations for internal promotional or incentive programs. Books that are specifically written for a customer or an existing Professional/Trade publication can be customized, such as having the cover art include custom imprint, messages or slogans. Of special note are customized For Dummies publications, which leverage the power of this well-known brand to meet the specific information needs of a wide range of organizations around the world.
Higher Education:
The Company publishes educational materials in all media, for two and four-year colleges and universities, for-profit career colleges, advanced placement classes and secondary schools in Australia. Higher Education products focus on courses in business and accounting, sciences, engineering, computer science, mathematics, statistics, geography, hospitality and the culinary arts, education, psychology and modern languages.
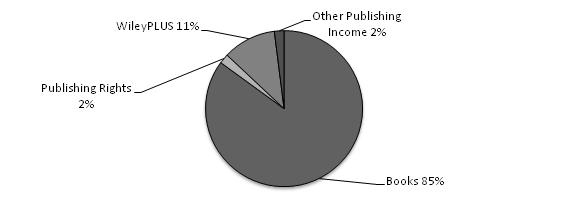
Higher Education customers include undergraduate, graduate, and advanced placement students, educators, and lifelong learners worldwide as well as secondary school students in Australia. Product is delivered online and in print, principally through college bookstores, online booksellers, and websites. Higher Education accounted for approximately 17% of total Company revenue in fiscal year 2010 and generated revenue growth at a compound annual rate of 6% over the past five years.
Higher Education’s mission is to help teachers teach and students learn. Our strategy is to provide value-added quality materials and services through textbooks, supplemental study aids, course and homework management tools and more, in print and electronic formats. The Higher Education website offers online learning materials with links to thousands of companion sub-sites to support and supplement textbooks.
15
Higher Education delivers high-quality online learning materials that offer more opportunities for customization and accommodate diverse learning styles. A prime example is WileyPLUS, the Company’s integrated online learning environment focused on both teaching and learning. By offering an electronic version of a text along with additional integrated materials, custom content provided by the instructor, and administrative tools, WileyPLUS supports a full range of course-oriented activities, including online planning, presentations, study, homework, and testing. The graph below presents global Higher Education revenue by product type for fiscal year 2010:
The Company also provides the services of the Wiley Faculty Network, a peer-to-peer network of faculty/professors supporting the use of online course material tools and discipline-specific software in the classroom. The Company believes this unique, reliable, and accessible service gives the Company a competitive advantage.
Higher Education is also leveraging the internet in its sales and marketing efforts. The internet enhances the Company’s ability to have direct contact with students and faculty at universities worldwide through the use of interactive electronic brochures and e-mail campaigns.
Publishing relationships are key to Higher Education’s strategy. The ability to bring Wiley’s product development, sales, marketing, distribution and technology with a partner’s content and/or brand name has contributed to the Company’s success. Alliance partners include Microsoft and National Geographic.
Publishing Operations
Journal Products:
The Company now publishes over 1,600 Scientific, Technical, Medical and Scholarly and Professional/Trade journals. Journal subscription revenue and other related publishing income, such as advertising, backfile sales, the sale of publishing rights, journal reprints and individual article sales accounted for approximately 49% of the Company’s consolidated fiscal year 2010 revenue. The journal portfolio includes titles owned by the Company, in which case they may or may not be sponsored by a professional society; titles owned jointly with a professional society; and titles owned by professional societies and published by the Company pursuant to long-term contract.
Societies that sponsor or own such journals generally receive a royalty and/or other consideration. The Company may procur editorial services from such societies on a pre negotiated fee basis. The Company also enters into agreements with outside independent editors of journals that state the duties of the editors, and the fees and expenses for their services. Contributors of journal articles transfer publication rights to the Company or a professional society, as applicable. Journal articles may be based on funded research through government or charitable grants. In certain cases the terms of the grant may require the grantholder to make articles (either the published version or an earlier unedited version) available free of charge to the public, typically after an embargo period. The Company provides various services for a fee to enable the grantholder to comply.
16
The Company sells journal subscriptions directly through sales representatives; indirectly through independent subscription agents; through promotional campaigns; and through memberships in professional societies for those journals that are sponsored by societies. Journal subscriptions are primarily licensed through contracts for online content delivered through the Company’s web-based platform, WileyInterScience. The Company plans to launch Wiley Online Library in late July 2010 which will replace WileyInterscience. Contracts are negotiated by the Company directly with customers or their subscription agents. Licenses range from one to three years in duration and typically cover calendar years.
Printed journals are generally mailed to subscribers directly from independent printers. The Company does not own or manage printing facilities. The print journal content is also available online. Subscription revenue is generally collected in advance, and deferred until the related issue is shipped or made available online at which time the revenue is earned.
Book Products:
Book products and book related publishing revenue, such as advertising revenue and the sale of publishing rights, accounted for approximately 51% of the Company’s consolidated fiscal year 2010 revenue. Materials for book publications are obtained from authors throughout most of the world through the efforts of an editorial staff, outside editorial advisors, and advisory boards. Most materials originate with authors, or as a result of suggestion or solicitations by editors and advisors. The Company enters into agreements with authors that state the terms and conditions under which the materials will be published, the name in which the copyright will be registered, the basis for any royalties, and other matters. Most of the authors are compensated by royalties, which vary with the nature of the product and its anticipated potential profitability. The Company may make advance payments against future royalties to authors of certain publications. Royalty advances are reviewed for recoverability and a reserve for loss is maintained, if appropriate.
The Company continues to add new titles, revise existing titles, and discontinue the sale of others in the normal course of its business, also creating adaptations of original content for specific markets fulfilling customer demand. The Company’s general practice is to revise its textbooks every three to five years, if warranted, and to revise other titles as appropriate. Subscription-based products are updated more frequently on a regular schedule. Approximately 30% of the Company’s fiscal year 2010 U.S. book-publishing revenue was from titles published or revised in the current fiscal year.
Professional and consumer books are sold to bookstores and online booksellers serving the general public; wholesalers who supply such bookstores; warehouse clubs; college bookstores for their non-textbook requirements; individual practitioners; and research institutions, libraries (including public, professional, academic, and other special libraries), industrial organizations, and government agencies. The Company employs sales representatives who call upon independent bookstores, national and regional chain bookstores and wholesalers. Sales of professional and consumer books also result from direct mail campaigns, telemarketing, online access, advertising and reviews in periodicals. Trade sales to bookstores and wholesalers are generally made on a returnable basis with certain restrictions. The Company provides for estimated future returns on sales made during the year principally based on historical return experience and current market trends.
17
Adopted textbooks, related supplementary material, and online products such as WileyPLUS, are sold primarily to bookstores, including online bookstores, serving educational institutions. The Company employs sales representatives who call on faculty responsible for selecting books to be used in courses, and on the bookstores that serve such institutions and their students. Textbook sales are generally made on a returnable basis with certain restrictions. The textbook business is seasonal, with the majority of textbook sales occurring during the June through August and November through January periods. There is an active used textbook market, which adversely affects the sale of new textbooks.
Like most other publishers, the Company generally contracts with independent printers and binderies for their services. The Company purchases its paper from independent suppliers and printers. The fiscal year 2010 weighted average U.S. paper prices decreased approximately 8% from fiscal year 2009. Approximately 64% of the Company’s paper inventory is held in the United States. Management believes that adequate printing and binding facilities, sources of paper and other required materials are available to it, and that it is not dependent upon any single supplier. Printed book products are distributed from both Company-operated warehouses and independent distributors.
The Company develops content in a digital format that can be used for online and print products, resulting in productivity and efficiency savings, as well as enabling the Company to offer customized publishing and print-on-demand products. Book content is increasingly being made available online through Wiley InterScience, WileyPLUS and other platforms, and in eBook formats through licenses with alliance partners. The Company also sponsors online communities of interest, both on its own and in partnership with others, to expand the market for its products.
The Company believes that the demand for new electronic technology products will continue to increase. Accordingly, to properly service its customers and to remain competitive, the Company has increased its expenditures related to such new technologies and anticipates it will continue to do so over the next several years.
The Company’s online presence not only enables it to deliver content online, but also to sell more books. The growth of online booksellers benefits the Company because they provide unlimited virtual “shelf space” for the Company’s entire backlist.
Marketing and distribution services are made available to other publishers under agency arrangements. The Company also engages in co-publishing of titles with international publishers and in publication of adaptations of works from other publishers for particular markets. The Company also receives licensing revenue from photocopies, reproductions, translations, and electronic uses of its content.
Advertising Revenue:
The Company generates advertising revenue from print and online journal subscription products; controlled circulation magazines which are issued free to a specific target audience; its online publishing platforms, Wiley Online Library and Wiley Interscience; and the websites of its consumer brands, including Frommers.com, Dummies.com and Cliffsnotes.com. These revenues accounted for approximately 3% of the Company’s consolidated fiscal year 2010 revenue.
Advertisements are sold by the Company’s sales representatives to advertising agencies representing the Company’s target customers. Typical customers include worldwide pharmaceutical companies; equipment manufacturers and distributors servicing the pharmaceutical industry; and a variety of businesses targeting the Company’s consumer brand customers. The Company’s advertising growth strategy focuses on increasing the volume of advertising on its online publishing platforms; leveraging the brand recognition of its consumer titles in all media; the development of new advertising products such as online video promotions or event sponsorship arrangements; and advertising in new and emerging technologies such as the mobile devices market (i.e. smart phone and iPad applications).
18
Global Operations
The Company’s publications are sold throughout most of the world through operations located in Europe, Canada, Australia, Asia, and the United States. All operations market their indigenous publications, as well as publications produced by other parts of the Company. The Company also markets publications through independent agents as well as independent sales representatives in countries not served by the Company. John Wiley & Sons International Rights, Inc., a wholly owned subsidiary of the Company, sells reprint and translations rights worldwide. The Company publishes or licenses others to publish its products, which are distributed throughout the world in many languages. Approximately 45% of the Company’s consolidated fiscal year 2010 revenue was derived from non-U.S. markets.
The global nature of the Company’s business creates an exposure to foreign currency fluctuations relative to the U.S dollar. Each of the Company’s geographic locations sell products worldwide in multiple currencies. Revenue and deferred revenue, although billed in multiple currencies are accounted for in the local currency of the selling location. Fiscal year 2010 revenue was recognized in the following currencies: approximately 55% U.S dollar; 28% British pound sterling; 8% Euro and 9% other currencies.
Competition and Economic Drivers within the Publishing Industry
The sectors of the publishing industry in which the Company is engaged are highly competitive. The principal competitive criteria for the publishing industry are considered to be the following: product quality, customer service, suitability of format and subject matter, author reputation, price, timely availability of both new titles and revisions of existing books, online availability of published information, and timely delivery of products to customers.
The Company is in the top rank of publishers of scientific, technical, medical and scholarly journals worldwide, a leading commercial research chemistry publisher; the leading society journal publisher; one of the leading publishers of university and college textbooks and related materials for the “hardside” disciplines, (i.e. sciences, engineering, and mathematics), and a leading publisher in its targeted professional/trade markets. The Company knows of no reliable industry statistics that would enable it to determine its share of the various international markets in which it operates.
Performance Measurements
The Company measures its performance based upon revenue, operating income, earnings per share and cash flow, excluding unusual or one-time events, and considering worldwide and regional economic and market conditions. The Company evaluates market share statistics for publishing programs in each of its businesses. STMS uses various reports to monitor competitor performance and industry financial metrics. Specifically for STMS journal titles, the ISI Impact Factor, published by the Institute for Scientific Information, is used as a key metric of a journal title’s influence in scientific publishing. For Professional/Trade, the Company evaluates market share statistics published by BOOKSCAN, a statistical clearinghouse for book industry point of sale data in the United States. The statistics include survey data from all major retail outlets, online booksellers, mass merchandisers, small chain and independent retail outlets. For Higher Education, the Company subscribes to Management Practices Inc., which publishes customized comparative sales reports.
19
Results of Operations
Fiscal Year 2010 Summary Results
Revenue for fiscal year 2010 increased 5% to $1,699.1 million, or 4% excluding the favorable impact of foreign exchange. Excluding foreign exchange, Higher Education (“HE”) and Professional/Trade (“P/T”) experienced strong growth, while Scientific, Technical, Medical and Scholarly (“STMS”) was flat with the prior year.
Gross profit margin for fiscal year 2010 of 68.6% was 0.6% higher than prior year, or 0.4% excluding the favorable impact of foreign exchange mainly due to increased sales of higher margin digital products.
Operating and administrative expenses for fiscal year 2010 of $872.2 million were 4% higher than the prior year. The increase was mainly due to higher accrued performance-based incentive compensation costs; higher planned HE editorial and production costs to support business growth; increased technology spending; and a $2.0 million bankruptcy recovery in the prior year activity. The increases in cost were partially offset by lower distribution costs; less Blackwell integration activity; and cost savings initiatives.
The Company performed a strategic review of certain non-core businesses within the STMS reporting segment. The review led the Company to consider alternatives for GIT Verlag, a business-to-business German-language controlled circulation magazine business, which was acquired by the Company in 2002. Based on the outlook for the print advertising business in German language publishing, the Company performed an impairment test on the intangible assets related to GIT Verlag. This test resulted in an $11.5 million pre-tax impairment charge in fiscal year 2010. The Company also identified a similar decline in the financial outlook for three smaller business-to-business controlled circulation advertising magazines. An impairment test on the intangible assets associated with those magazines resulted an additional $0.9 million pre-tax impairment charge in fiscal year 2010. After considering a variety of strategic alternatives for GIT Verlag, the Company implemented a restructuring plan in fiscal year 2010 to reduce certain staffing levels and the number of journals published by GIT Verlag. As a result, the Company recorded a pre-tax restructuring charge of approximately $1.6 million within the STMS reporting segment during fiscal year 2010 for GIT Verlag severance-related costs.
The Company recorded severance costs of $1.1 million related to offshoring and outsourcing certain central marketing and content management activities to Singapore and other countries in Asia. These charges are expected to be fully recovered within 18 months from implementation as a result of lower operating expenses. The impairment and restructuring charges described above, totaling $15.1 million, or $0.17 per share, are reflected in the Impairment and Restructuring Charges line item in the Consolidated Statements of Income.
Operating income for fiscal year 2010 increased 11% to $242.6 million, or 7% excluding the favorable impact of foreign exchange and the impairment and restructuring charges. The 7% increase was mainly driven by HE and P/T revenue growth, margin improvement, cost savings initiatives, partially offset by higher performance-based compensation, editorial, production and technology costs to support growth.
Interest expense decreased $16.1 million to $32.3 million. Lower interest rates contributed approximately $12.1 million towards the improvement, while lower average debt outstanding contributed approximately $4.0 million. Losses on foreign currency transactions for fiscal years 2010 and 2009 were $10.9 million and $11.8 million, respectively. The foreign currency transaction losses for fiscal year 2010 were primarily due to the revaluation of U.S. dollar cash balances held by the Company’s non-U.S. locations. The losses incurred in fiscal year 2009 were primarily due to the strengthening of the U.S. dollar in the prior year against U.S. dollar third party loans and intercompany payables maintained in non-U.S. locations during that period. Since these amounts were held in U.S. dollars, the transaction loss did not represent an economic loss to the Company. Fiscal year 2009 included a favorable $4.6 million ($0.08 per share) insurance settlement reported as Interest Income and Other.
20
The effective tax rate for fiscal year 2010 was 28.3% compared to 22.0% in the prior year. The effective tax rate for fiscal year 2009 includes the reversal of a previously accrued income tax reserve of approximately $3.2 million ($0.05 per share) due to an income tax settlement with tax authorities in non-U.S. jurisdictions. The Company’s effective tax rate for fiscal year 2009 excluding the reversal was approximately 24.0%. The increase in the effective tax rate excluding the reversal was principally due to lower foreign tax benefits and a non-taxable insurance receipt in the prior year.
Earnings per diluted share for fiscal years 2010 and 2009 was $2.41 and $2.15, respectively, while net income for the same periods was $143.5 million and $128.3 million, respectively. On a currency neutral basis and excluding the impairment and restructuring charges of approximately $0.17 per share from the current year, earnings per diluted share increased 6%. Higher operating income and lower interest expense was partially offset by a prior year insurance receipt ($0.08 per share), a prior year tax reserve reversal ($0.05 per share) and lower foreign tax benefits.
Throughout this report, references to amounts “excluding foreign exchange”, “currency neutral” and “performance basis” exclude both foreign currency translation effects and transactional gains and losses. Foreign currency translation effects are based on the change in average exchange rates for each reporting period multiplied by the current period’s volume of activity in local currency for each non-U.S. location.
Fiscal Year 2010 Segment Results
As of May 1, 2009, the Company transferred management responsibilities and reporting for certain textbooks from the Professional/Trade segment to the Higher Education segment. All prior periods have been restated for comparability. These changes had no impact on the Company’s consolidated revenue, net income or earnings per share.
|
Scientific, Technical, Medical and Scholarly (STMS):
|
||||
|
% change
|
||||
|
Dollars in thousands
|
2010
|
2009
|
% change
|
w/o FX (a)
|
|
Revenue
|
$986,683
|
$969,184
|
2%
|
0%
|
|
Direct Contribution
|
$405,244
|
$399,156
|
2%
|
0%
|
|
Contribution Margin
|
41.1%
|
41.2%
|
||
|
(a)
|
Adjusted to exclude fiscal year 2010 impairment and restructuring charges of $15.1 million from direct contribution.
|
Global STMS revenue for fiscal year 2010 increased 2% to $986.7 million, but was flat excluding the favorable impact of foreign exchange. Increased revenue from rights, individual articles and the Cochrane Library, were offset by lower revenue from business-to-business advertising, journal subscriptions (mainly due to production scheduling) and individual member subscriptions. The improvement in rights income principally relates to a legal settlement of approximately $2.0 million.
Direct contribution to profit for fiscal year 2010 increased 2% to $405.2 million, but was flat excluding the $15.1 million asset impairment and restructuring charges recorded in fiscal year 2010 and the favorable impact of foreign exchange. Lower journal production costs, the completion of Blackwell-related integration activities and other cost savings initiatives were offset by increased costs associated with new business and a $2.0 million bad debt recovery in fiscal year 2009. Direct contribution margin declined 10 basis points to 41.1% and was flat with the prior year excluding the favorable impact of foreign exchange and the asset impairment and restructuring charges.
21
Calendar Year 2010 Journals Update
Due to the fact that the majority of the Company’s journal subscriptions are licensed on a calendar year basis, the Company also monitors and analyzes its journal subscription revenue on that basis. As of April 30, 2010, calendar year 2010 journal subscription billings increased 3% to 4% over prior year on a currency neutral basis, with approximately 95% of expected business closed. There was solid growth in Europe, Middle East, and Africa (“EMEA”), Asia-Pacific and Latin America and modest growth in the U.S. and Canada. Licensed journal business now accounts for 71% of the subscription business as compared to 60% at the same time last year. New licenses included journal subscriptions, backfiles, online books and ArticleSelect sales.
Journals
Journals revenue for fiscal year 2010 increased 2% to $803.0 million, but was flat excluding the favorable impact of foreign exchange. Increased revenue from rights, individual articles and the Cochrane Library, were offset by lower revenue from business-to-business advertising, journal subscriptions (mainly due to production scheduling) and individual member subscriptions. The improvement in rights income principally relates to a legal settlement of approximately $2.0 million.
Society Journal Activity
|
·
|
31 new signings
|
|
·
|
90 renewed/extended contracts
|
|
·
|
2 contracts not renewed
|
Key New Contracts
|
·
|
Journal of Midwifery and Women's Health on behalf of the American College of Nurse Midwives
|
|
·
|
Australian Journal of Psychology, Australian Psychologist and Clinical Psychologist, the three flagship journals of Australian Psychological Society
|
|
·
|
Legislative Studies Quarterly on behalf of the Comparative Legislative Research Center at the University of Iowa
|
|
·
|
Allergy & Rhinology on behalf of the American Academy of Otolaryngic Allergy and the American Rhinologic Society
|
|
·
|
Thoracic Cancer on behalf of the Tianjin Lung Cancer Institute
|
|
·
|
The Bulletin of the Institute of Classical Studies (BICS), one of the world’s most prestigious classics journals
|
|
·
|
Four academic journals of the Royal Pharmaceutical Society of Great Britain, which were previously self-published (Journal of Pharmacy and Pharmacology, International Journal of Pharmacy Practice, Focus on Alternative and Complementary Therapies, and Journal of Pharmaceutical Health Services Research)
|
|
·
|
Equine Veterinary Journal and Equine Veterinary Education, previously self- published by the British Equine Veterinary Association
|
|
·
|
Contemporary Accounting Research and Accounting Perspectives, previously self-published by the Canadian Academic Accounting Association
|
|
·
|
Steel Research International on behalf of the German Steel Makers Association
|
22
Books and Reference
Books and reference revenue for fiscal year 2010 declined 1% to $172.6 million. The decrease is principally due to the transfer of certain books to HE in the current fiscal year which generated revenue of approximately $3.6 million in fiscal year 2009. On a currency neutral basis and excluding the effect of the transfer, books and reference revenue increased 2% over prior year mainly due to increased revenue from licensing rights.
Wiley Online Library
In late July 2010, the Company plans to launch Wiley Online Library, which will host one of the world’s broadest and deepest multidisciplinary collection of online resources covering life, health and physical sciences, medicine, humanities and social science. Built on the latest technology and designed with extensive input from scholars around the world, Wiley Online Library will deliver seamless integrated access to over 4 million articles from 1,500 journals, 8,000 books, and hundreds of reference works, laboratory protocols and databases from John Wiley & Sons and key imprints including Wiley-Blackwell, Wiley-VCH and Jossey-Bass. Featuring a clean and simple interface, this new online service will combine intuitive navigation, enhanced discoverability, expanded functionalities and a range of personalization options. Users will be able to discover, read, download and cite current journal and book content, EarlyView articles, backfiles, related materials and supporting data. Wiley Online Library will completely replace Wiley InterScience, the Company’s current online publishing platform for its scientific, technical, medical and scholarly content, previously introduced in 1999. All existing Wiley InterScience content and licensees will be transferred to the new site to enable seamless access for users and subscribers.
Digital Update
|
·
|
Online book revenue grew 44% in fiscal year 2010 to approximately $6 million. There is a growing trend for institutional library customers to purchase digital books. Online books are sold individually or through subscriptions, similar to journal licenses.
|
|
·
|
Wiley’s Chinese language website launched in April. Designed to enhance customers’ experience with tailored sections for librarians, authors, societies and industry partners, wileychina.com will feature general information about Wiley’s presence in China, as well as specific details about core content of particular interest to the Chinese community. In addition, this site will include hyper-links and cross references to wiley.com, Wiley InterScience (and ultimately Wiley Online Library) and the Press Room, where all local news and events will be highlighted.
|
|
·
|
The Cochrane Library is now available to more than 650,000 students and faculty at 47 universities in Germany as part of a new agreement with Universitätsbibliothek Johann Christian Senckenberg in Frankfurt. The agreement allows access for a period of ten years to the Cochrane Library, a collection of regularly updated evidence-based healthcare databases, including the highly regarded Cochrane Systematic Reviews. In addition, a national license agreement in India will provide about 60 million Internet users with access to The Cochrane Library.
|
|
·
|
In April, Wiley announced that it will extend licensed electronic content to emergency workers, students, faculty and academic institutions affected by a local, national or global natural disaster. Under the Natural Disaster Access Clause, Wiley will allow a licensee to provide affected groups with electronic access to its licensed products via the licensee’s secure network. Such an arrangement was put in place after Hurricane Katrina.
|
|
·
|
Essential Evidence, a new product added to the online, evidence-based Essential Evidence Plus, was launched. This resource tool will help clinicians make diagnoses, chart treatment plans and determine prognoses. The product currently features approximately 700 structured medical topics with approximately 100 more in development.
|
23
New Alliances
|
·
|
A co-publication agreement with Higher Education Press (HEP) in Beijing was signed in the fourth quarter. HEP is the second largest science and technology publisher in China.
|
|
·
|
A books co-publishing agreement was signed with The Minerals, Metals & Materials Society. The society is closely affiliated with the American Ceramic Society (ACerS) and ASM International.
|
|
·
|
An agreement was signed with the Royal Geographical Society for a book series. Wiley also publishes The Royal Geographical Society’s Geographical Journal, Area and Transactions of the Institute of British Geographers.
|
|
·
|
An agreement was signed with The American Geographical Society to co-publish both the Geographical Review and FOCUS on Geography. Geographical Review is a leading scholarly periodical.
|
|
·
|
Through a partnership with the Australian Psychological Society, Wiley will publish three flagship journals – Australian Journal of Psychology, Australian Psychologist and Clinical Psychologist.
|
|
·
|
An agreement was signed with Chemical Industry Press (Beijing, China) to publish a co-branded Wiley-CIP series imprint. The collaboration will focus on a series of English-language advanced textbooks and reference books for a global readership of post-graduates, researchers and practitioners in engineering, materials science and chemistry, with the potential to expand into other areas.
|
|
·
|
An agreement was signed with Scrivener Publishing, an engineering book publisher, to co-publish and distribute their books globally. The program will publish 15-20 books per year. The target market includes researchers in the technical and applied sciences.
|
Acquisitions/Divestments
|
·
|
Acquired Microcirculation, the journal of The Microcirculatory Society. The haematology/vascular medicine publication is in its sixteenth year.
|
|
·
|
Acquired the Israel Journal of Chemistry from Laser Pages Publishing Ltd. Launched in 1951 as the Bulletin of the Research Council of Israel, Section A, it was re-launched in 1963 under its current name.
|
|
·
|
Sold two journals to Maney Publishing: Cochlear Implants International and Deafness & Education International.
|
|
·
|
Wiley acquired the publishing rights to Topley & Wilson’s Microbiology and Microbial Infections from Hodder Education. Now in its 10th edition (having been first published in 1929), the 8-volume reference work is prominent in the fields of microbiology and infectious disease. Wiley will offer it to customers for the first time online in fiscal year 2010.
|
Journal Impact Factors
In July 2009, Wiley announced that 338 of its journals received top 10 rankings in their respective categories in the Thomson ISI® 2008 Journal Citation Report (JCR), a leading evaluator of journal influence and impact. Journals are ranked using a metric known as an “Impact Factor,” which reflects the frequency that peer-reviewed journals are cited by researchers. Other highlights include:
|
·
|
Wiley is at or near the top of its peers as measured by journal influence and impact. A total of 949 out of 1,450 Wiley journals were ranked in the JCR, which is up from 926 in the previous report. Wiley publications achieved thirty #1 rankings within the 227 categories. The Company’s journals received the highest total Impact Factors of any publisher in 37 categories.
|
|
·
|
Eight out of the thirty newly-listed Wiley journals are Asia-Pacific publications. Sixty-three Asia-Pacific journals are currently represented in the JCR, evidence of Wiley’s expanding publishing program in this region.
|
|
·
|
In chemistry and physical sciences, Angewandte Chemie, a journal of the German Chemical Society, increased its Impact Factor, strengthening its position as the leading chemistry journal that features primary research and review articles. Medicinal Research Reviews is ranked #1 in its category. Other #1 ranked journals in the physical sciences include Mass Spectrometry Reviews for the 10th consecutive year; Advanced Synthesis and Catalysis for its 6th year; and Communications on Pure and Applied Mathematics.
|
24
|
·
|
In technology and engineering, International Journal of Circuit Theory and Applications is the top circuit theory journal. International Journal for Numerical Methods in Engineering is #1 in numerical engineering.
|
|
·
|
In medical sciences, the journal CA–A Cancer Journal for Clinicians, published on behalf of The American Cancer Society, was awarded the highest Impact Factor among all medical journals. In dentistry, Periodontology 2000 is ranked #1 for the second year and Journal of Clinical Periodontology has risen to be ranked #2 (from #5 in 2007). Addiction's Impact Factor increased again and remains #1 in substance abuse in the social science index. Addiction Biology has taken the #1 spot in substance abuse in the science index. In nursing, Birth continues to rank first.
|
|
·
|
In life sciences, Aging Cell increased its Impact Factor and is ranked #1 in geriatrics and gerontology. For the 5th consecutive year, Ecology Letters increased its Impact Factor and remains the highest ranking primary research journal in ecology. Developmental Dynamics remains the #1 journal in anatomy and morphology.
|
|
·
|
In social sciences and humanities, Wiley published #1 ranked journals in nine categories, including Addiction, Birth: Issues in Perinatal Care, Child Development, Criminology, Journal of Finance, Journal of Communication, Transactions of the Institute of British Geographers and Perspectives on Sexual & Reproductive Health.
|
|
Professional/Trade (P/T):
|
||||
|
% change
|
||||
|
Dollars in thousands
|
2010
|
2009
|
% change
|
w/o FX
|
|
Revenue
|
$429,988
|
$403,113
|
7%
|
6%
|
|
Direct Contribution
|
$100,196
|
$89,678
|
12%
|
11%
|
|
Contribution Margin
|
23.3%
|
22.2%
|
||
Global P/T revenue for fiscal year 2010 increased 7% to $430.0 million, or 6% excluding the favorable impact of foreign exchange. The revenue growth was driven by higher consumer, business and technology sales and new titles acquired through the Meredith and GMAC agreements. The new agreements contributed approximately $14.4 million to current period results. North America exhibited the most growth, followed by EMEA.
Direct contribution to profit for fiscal year 2010 increased 12% to $100.2 million, or 11% excluding the favorable impact of foreign exchange. The improvement reflected higher sales volumes and advertising and marketing cost savings, partially offset by higher performance-based incentive compensation. Direct contribution margin improved 110 basis points to 23.3%, or 90 basis points excluding the favorable impact of foreign exchange.
Revenue by Category
|
·
|
Business advanced 5%, led by social media and quick-to-market books.
|
|
·
|
Consumer grew 16%, led by cooking (Meredith, Food Network TV, Weight Watchers) and the GMAC agreement.
|
|
·
|
Technology was up 4%. Growth was attributed to Sybex certification and virtualization books, and the release of Windows 7.
|
|
·
|
Psychology grew 15% for the year.
|
|
·
|
Architecture was down 6% for the year.
|
|
·
|
Education grew 6% for the year.
|
25
Online Initiatives/eBooks
|
·
|
Fiscal year 2010 ebook revenue increased 93% to approximately $7 million.
|
|
·
|
Approximately 11,000 eBooks are now available on Kindle.
|
|
·
|
Frommer’s Unlimited launched Frommer’s destination guides on Canada.com; unveiled destination guides on the UK meta search engine Travelsupermarket; created custom leisure and business events for a high-profile British Airways ad campaign microsite; launched an innovative trip planning tool with Eurostar; and integrated multilingual events content and weather charts into an Air France desktop widget.
|
|
·
|
eBook agreements were signed with Barnes and Noble (Nook), EBooks.com, Ingram Digital and Scrollmotion (Apple’s preferred eBook vendor). Existing agreements include Amazon (Kindle), Sony (eReader) and Mobipocket.
|
|
·
|
P/T launched a CliffsNotes literature note application for the iPhone and iPod Touch, branded CliffsNotes-to-Go, which was produced on a fast-track schedule to coincide with a major Apple promotion. Five popular classics (The Adventures of Huckleberry Finn, Macbeth, The Scarlet Letter, To Kill a Mockingbird, and Romeo and Juliet) are available in the iTunes App Store. The apps contain the full content of the books plus audio summaries, interactive character maps, and a user defined “CramPlan” that allows students to access the most important components of the text based on the amount of time they have to study.
|
|
·
|
Through an alliance with LibreDigital, Wiley now has the capability to sell ebooks in bulk, enabling volume sales in e-only or print plus electronic combinations based on a variety of access models.
|
Digital Advertising/Websites
|
·
|
Cliffsnotes.com advertising revenue in fiscal year 2010 grew by 28% over prior year.
|
|
·
|
Dummies.com reported an all-time record monthly traffic count of 4 million users in March.
|
New Alliances
|
·
|
Wiley was named the exclusive global publisher of BLOOMBERG® and BLOOMBERG BUSINESSWEEK® branded books to be marketed as “BLOOMBERG PRESS®, a Wiley imprint.” Wiley intends to publish the content in print, e-book and digital formats.
|
|
·
|
Wiley has been named an official licensee by The London Organizing Committee of the Olympic Games and Paralympics Games. We will publish 12 books in non-fiction categories including illustrated reference, photographic and architecture and design books, including the official commemorative book.
|
|
·
|
Publishing agreement signed with Facebook.com to produce “Official” branded Facebook instruction guides, The Definitive Facebook Guides. The series will be launched in fiscal year 2011.
|
|
·
|
Wiley-Pfeiffer (HR development and management) signed an agreement with Korean Management Association to deliver products in Korea.
|
|
·
|
Agreement signed with the Construction Specifications Institute (CSI) to become the publisher of the CSI Professional Practice Guides. These guides align with CSI’s certification program for Architecture, Engineering and Construction industry professionals.
|
|
·
|
The Great Place to Work® Institute and Wiley will collaborate on a training package and two books. The Institute has been developing the annual “FORTUNE 100 Best Companies to Work For” list for twenty years and is known around the world for its research-based models and accessible best practices.
|
|
·
|
The Meredith (Better Homes and Gardens, Food Network TV, etc.) backlist boosted cookbook sales. There were 25 new Meredith books in the lifestyles, pets and education categories published in fiscal year 2010.
|
|
·
|
Chatelaine, Canada’s #1 women’s magazine, will publish a major cookbook and personal finance guide in partnership with Wiley.
|
26
Notable New Books
Business
|
·
|
Patrick Lencioni, Getting Naked: A Business Fable about Shedding the Three Fears that Sabotage Client Loyalty
|
|
·
|
Chris Brogan, Trust Agents
|
|
·
|
Erik Qualman, Social Economics
|
|
·
|
Jon Gordon, Training Camp
|
|
·
|
Bill George, Seven lessons for Leading In A Crisis
|
|
·
|
Brian Halligan, Inbound Marketing
|
Finance
|
·
|
Harry Markopolis, No One Would Listen
|
|
·
|
Peter Schiff, LoyaltyCrash Proof 2.0
|
|
·
|
John Bogle, Common Sense of Mutual Funds, 10th Anniversary Edition
|
|
·
|
Ben Stein, Little Book of Bulletproof Investing
|
|
·
|
Christine Richard, Confidence Game
|
|
·
|
David Faber, And Then The Roof Crashed In
|
Psychology
|
·
|
Irving Weiner, Handbook of Social Psychology, Fifth Edition
|
|
·
|
The Corsini Encyclopedia of Psychology, Fourth Edition
|
|
·
|
Bret A. Moore, The Veterans and Active Duty Military Psychotherapy Treatment Planner
|
|
·
|
Sue, Counseling the Culturally Diverse, Theory and Practice, Fifth Edition
|
|
·
|
Dattilo, Therascribe Family Treatment Planner, Second Edition
|
Consumer
|
·
|
Doug Lemov, Teach Like A Champion
|
|
·
|
Bob Sehlinger, The Unofficial Guide to Walt Disney World: The Color Companion
|
|
·
|
John Brady, Hero of the Pacific
|
|
·
|
Fred Kaplan, 1959, The Year Everything Changed
|
|
·
|
Brian Leaf, Defining Twilight
|
|
·
|
Ellie Kreiger, So Easy
|
|
·
|
Sandra Lee, Weeknight Wonders
|
|
·
|
Rose Levy Beranbaum, Rose’s Heavenly Cakes
|
Architecture
|
·
|
Architectural Graphic Standards for Residential Construction
|
|
·
|
Stein and Reynolds, Mechanical and Electrical Equipment for Buildings , Tenth Edition
|
|
·
|
Edward Allen, Forms and Forces
|
|
·
|
Frank Ching, Building Codes Illustrated, Third Edition
|
Technology
|
·
|
Andy Rathbone, Windows 7 For Dummies
|
|
·
|
Paul Thurott, Windows 7 Secrets For Dummies
|
|
·
|
Dan Gookin, Laptops For Dummies
|
|
·
|
Peter Weverka, Office 2010 All-In-One For Dummies
|
|
·
|
Scott Lowe, Mastering VMware VSphere4
|
|
·
|
Daniel Hedengren, Smashing WordPress: Beyond The Blog
|
|
Higher Education (HE):
|
||||
|
|
% change
|
|||
|
Dollars in thousands
|
2010
|
2009
|
% change
|
w/o FX
|
|
Revenue
|
$282,391
|
$239,093
|
18%
|
15%
|
|
Direct Contribution
|
$86,212
|
$66,619
|
29%
|
25%
|
|
Contribution Margin
|
30.5%
|
27.9%
|
||
Global HE revenue for fiscal year 2010 increased 18% to $282.4 million, or 15% excluding the favorable impact of foreign exchange. Double-digit growth was experienced in all regions and in nearly every subject category. The revenue growth includes approximately $3.4 million from books previously reported in STMS and $1.2 million from books previously reported in P/T. Excluding the effect of these transfers and favorable foreign exchange, HE revenue increased 13%.
27
Direct contribution to profit for fiscal year 2010 increased 29% to $86.2 million, or 25% excluding the favorable impact of foreign exchange. The improvement was driven by the top-line growth and improved margin due to increased sales of digital products, partially offset by higher costs to support business growth and higher performance-based compensation. Direct contribution margin improved 270 basis points to 30.5%, or 230 basis points excluding the favorable impact of foreign exchange.
Revenue by Region
|
·
|
Americas grew 16% to $239.0 million.
|
|
·
|
EMEA revenue increased 13% to $23.5 million.
|
|
·
|
Asia-Pacific revenue advanced 27% to $60.7 million, or 13% on a currency neutral basis.
|
Revenue by Subject
|
·
|
Business and Accounting exceeded prior year by 21%, driven mainly by a strong accounting frontlist.
|
|
·
|
Engineering and Computer Science exceeded prior year by 8%. Top textbooks driving the growth include Munson: Fluid Mechanics 6e, Turban: Information Management 7e and Callister: Materials Science 8e.
|
|
·
|
Mathematics and Statistics surpassed prior year by 27%. Driving the growth over prior year were Hughes Hallett: Calculus 5e, Anton: Calculus 9e, Boyce: Elementary Differential Equations 9e and Young: College Algebra 2e.
|
|
·
|
Sciences surpassed prior year by 9%. Growth is attributed to Cutnell: Physics 8e, Jenkins: Anatomy and Physiology 2e and Tortora: Introduction to the Human Body 8e.
|
|
·
|
Social Sciences exceeded prior year by 20%. The textbooks driving the growth include Huffman: Psychology 9e, deBlij: Concepts Geography 14e, Kring: Abnormal Psychology 11e and deBlij: Human Geography 9e.
|
|
·
|
MOAC revenue exceeded prior year by 29%. The operating systems and server books continue to drive results.
|
WileyPLUS
|
·
|
Global revenue for the full year grew 42% to 11% of global HE sales.
|
|
·
|
Digital-only sales grew 55% to $10 million, accounting for 36% of WileyPLUS sales. Digital-only is defined as WileyPLUS standalone (not packaged with a print textbook).
|
New Alliances
|
·
|
Wiley is partnering with Reaction Explorer to bring new capabilities to the online organic chemistry market. Reaction Explorer uses expert system technology to predict the results of arbitrary organic chemistry reactions. By accessing Reaction Explorer through WileyPLUS, students will be able to achieve a higher level of understanding of the intricacies of organic chemistry reactions, syntheses and mechanisms.
|
|
·
|
National Geographic Society (NGS): Pilot program signed for custom initiative that will allow customers to choose from over 100 additional pieces of NGS magazine articles and some maps. Customers can combine them with Wiley’s Geosciences books to create a more customized and engaging learning solution for instructors and students.
|
|
·
|
In May 2009, Wiley announced that it was expanding its alliance with Amazon to offer select Wiley textbooks for sale through the Kindle DX. A pilot program began in the first quarter.
|
28
RFID Project
|
·
|
Many of Wiley’s textbooks will now contain embedded Radio Frequency Identification (RFID) tags that will:
|
|
·
|
Increase bookstore sell-through by reducing the supply of reimported, pirated, hurt and comp copies;
|
|
·
|
Enhance business intelligence to enforce returns policy such as no-return agreements and returns attempted after our stated returns period;
|
|
·
|
Improve customer experience by reducing shipping errors. The presence of RFID hardware and systems in Wiley’s distribution centers will enable us to validate the contents of shipments as they are fulfilled, thereby reducing shipping errors and the costs associated with correcting them.
|
Other Developments
|
·
|
Institutional sales, particularly for-profit schools, continued to gain traction.
|
|
·
|
In India, eight new contracts were signed and ten new books were published as part of the indigenous publishing and adaptation program.
|
Shared Services and Administrative Costs
Shared services and administrative costs for fiscal year 2010 increased 4% to $349.1 million including and excluding the effect of foreign exchange. The increase was driven by higher accrued performance-based incentive compensation and higher contractor, software licensing and maintenance costs and depreciation due to increased technology investments including Wiley Online Library. The cost increases were partially offset by lower distribution costs and reduced spending following the completion of Blackwell integration. Technology investments are focused on next generation publishing platforms in HE and STMS and the related content technology, hosting and support.
Fiscal Year 2009 Summary Results
Revenue for fiscal year 2009 decreased 4% to $1,611.4 million. Excluding the unfavorable impact of foreign exchange revenue increased 3%. Growth in STMS journals, including an acquisition accounting adjustment that reduced fiscal year 2008 STMS revenue by approximately $16.7 million, and growth in Higher Education were partially offset by a decline in P/T revenue due to weak market conditions.
Gross profit margin in fiscal year 2009 of 68.0% was 0.2% lower than the prior year as lower P/T sales volume and higher inventory obsolescence and royalty advance provisions were partially offset by favorable product mix and lower production costs in Higher Education. Operating and administrative expenses for fiscal year 2009 of $839.6 million were 4% lower than the prior year, or increased 1% excluding the favorable impact of foreign exchange. Lower accrued incentive compensation expense and marketing and advertising cost containment programs were more than offset by annual merit increases; higher editorial and distribution costs to support new Higher Education and STMS titles; and higher occupancy, facilities and depreciation costs related to business expansion.
Operating income for fiscal year 2009 decreased 3% to $218.5 million, or improved 11% excluding the unfavorable impact of foreign exchange. The improvement excluding foreign exchange was mainly due to revenue growth, including the acquisition accounting adjustment in fiscal year 2008. Interest expense decreased $18.3 million to $48.4 million. Lower interest rates contributed approximately $10.8 million towards the improvement, while lower average outstanding debt contributed approximately $7.5 million. Interest income and other increased $0.3 million to $6.2 million principally due to a $4.6 million ($0.08 per diluted share) non-recurring insurance receipt received in fiscal year 2009, partially offset by higher interest income in the prior year. Losses on foreign currency transactions for fiscal year 2009 and 2008 were $11.8 million and $2.9 million, respectively. The increase in foreign currency transaction losses was mainly due to the strengthening of the U.S. dollar against the British pound sterling on intercompany payables and U.S. dollar third party debt outstanding in the U.K.
29
The effective tax rates for fiscal years 2009 and 2008 were 22.0% and 8.7%, respectively. During fiscal year 2008, the Company recorded an $18.7 million tax benefit associated with new tax legislation enacted in the United Kingdom (UK) and Germany that reduced the corporate income tax rates from approximately 30% to 28% and 39% to 29%, respectively. The benefits recognized by the Company reflect the adjustments required to restate all applicable deferred tax balances at the new income tax rates. The new tax rates were effective in Germany as of May 1, 2007 and in the UK as of April 1, 2008. The effective tax rate for fiscal year 2009 was 22.0% compared to 20.2% for fiscal year 2008, excluding the deferred tax benefits described above. The increase was mainly due to lower foreign tax benefits.
Earnings per diluted share and net income for fiscal year 2009 were $2.15 and $128.3 million, respectively. Reported earnings per diluted share and net income for fiscal year 2008 were $2.49 and $147.5 million, respectively. Adjusted to exclude the non-cash deferred tax benefits described above, earnings per diluted share and net income for fiscal year 2008 were $2.17 and $128.9 million, respectively. See Non-GAAP Financial Measures described below. Excluding the deferred tax benefits and the effect of foreign exchange transaction and translation losses of approximately $0.50 per share, earnings per share increased 22% to $2.15 per share.
Non-GAAP Financial Measures: The Company’s management internally evaluates its operating performance excluding unusual and/or nonrecurring events. The Company believes excluding such events provides a more effective and comparable measure of current and future performance. We also believe that excluding the effects of the following tax benefits provides a more balances view of the underlying dynamics of our business.
Deferred Tax Benefit on Changes in Statutory Tax Rates
The Company recorded an $18.7 million tax benefit ($15.6 million for Blackwell) associated with new tax legislation enacted in the United Kingdom (U.K.) and Germany that reduced the corporate income tax rates from approximately 30% to 28% and 39% to 29%, respectively. The benefits recognized by the Company reflect the adjustments required to restate all applicable deferred tax balances at the new income tax rates. These benefits have been adjusted below due to their infrequent non-recurring nature.
Since adjusted net income and adjusted earnings per share are not measures calculated in accordance with US GAAP, they should not be considered as a substitute for other US GAAP measures, including net income and earnings per share as indicators of operating performance. Accordingly, adjusted net income and adjusted earnings per diluted share are reconciled below to net income and earnings per share on a US GAAP basis, for fiscal years 2009 and 2008.
30
|
Reconciliation of Non-GAAP Financial Disclosure
|
||
|
For the Years
Ended April 30,
|
||
|
Net Income (in thousands)
|
2009
|
2008
|
|
As Reported
|
$128,258
|
$147,536
|
|
Deferred Tax Benefit on Changes in Statutory Rates
|
-
|
(18,663)
|
|
Adjusted
|
$128,258
|
$128,873
|
|
For the Years
Ended April 30,
|
||
|
Earnings per Diluted Share
|
2009
|
2008
|
|
As Reported
|
$2.15
|
$2.49
|
|
Deferred Tax Benefit on Changes in Statutory Rates
|
-
|
(0.31)
|
|
Adjusted
|
$2.15
|
$2.17
|
Fiscal Year 2009 Segment Results
|
Scientific, Technical, Medical and Scholarly (STMS):
|
||||
|
% change
|
||||
|
Dollars in thousands
|
2009
|
2008
|
% change
|
w/o FX
|
|
Revenue
|
$969,184
|
$975,797
|
(1%)
|
9%
|
|
Direct Contribution
|
$399,156
|
$384,170
|
4%
|
14%
|
|
Contribution Margin
|
41.2%
|
39.4%
|
||
Global STMS revenue for fiscal year 2009 of $969.2 million declined 1% from prior year mainly due to unfavorable foreign exchange. Excluding the unfavorable impact of foreign exchange revenue increased 9%. Increased revenue from journal subscription renewals, new business, price increases, global rights and STMS books was partially offset by lower sales of backfiles, reprints and custom publishing. Also contributing to the increase in journal subscriptions was a $16.7 million acquisition accounting adjustment related to Blackwell that reduced revenue in fiscal year 2008. This adjustment contributed 2% to revenue growth excluding foreign exchange.
Direct contribution to profit for fiscal year 2009 grew 4% from prior year to $399.2 million, or 14% excluding the unfavorable effect of foreign exchange. Direct contribution margin improved 180 basis points to 41.2%, or 41.1% excluding the unfavorable impact of foreign exchange, mainly due to the prior year acquisition accounting adjustment, a $2.0 million bad debt recovery and cost containment efforts, partially offset by higher performance compensation and other employment costs and editorial costs due to the addition of more society journals. Margins on professional society journals are lower than margins earned on Company owned journals.
STMS Journals
Journal revenue grew 8% excluding unfavorable foreign exchange and the fiscal year 2008 acquisition accounting adjustment related to Blackwell. All regions exhibited journal sales growth, excluding unfavorable foreign exchange. The performance is mainly attributed to renewals, new business, price increases and the acquisition accounting adjustment in fiscal year 2008. Subscription and pay-per-view revenue was up year-over-year, while backfile revenue fell due to the economic climate, particularly in the US.
31
Society Journal Activity
|
·
|
32 New signings
|
|
·
|
87 Renewed/extended contracts
|
|
·
|
9 Contracts not renewed
|
Key New Agreements
|
·
|
A new journal launch for 2010 – the Journal of Research Synthesis Methods in association with the Society for Research Synthesis Methodology
|
|
·
|
Family and Consumer Science Research on behalf of the American Association of Family and Consumer Sciences
|
|
·
|
Design Management Review and Design Management Journal with the Design Management Institute
|
|
·
|
The Institute of Development Studies at the University of Sussex, one of Europe’s leading research institutions. The journal, IDS Bulletin, was previously self-published.
|
|
·
|
The Economic Society of Australia for Economic Papers.
|
|
·
|
Asian Journal of Endoscopic Surgery.
|
Key Journal Renewals
|
·
|
Economic Journal and Econometrics Journal (Royal Economic Society)
|
|
·
|
Journal of Accounting Research (Institute of Professional Accounting at the University of Chicago Booth School of Business)
|
|
·
|
Cancer Science (Japanese Cancer Association)
|
|
·
|
ANZ Journal of Surgery (Royal Australasian College of Surgeons)
|
|
·
|
International Journal of Urology (Japanese Urological Association)
|
|
·
|
Journal of Neuroendocrinology (European Neuroendocrine Association, the British Society for Neuroendocrinology and the International Neuroendocrine Federation)
|
|
·
|
Therapeutic Aphaeresis and Dialysis (International Society for Aphaeresis, The Japanese Society for Aphaeresis and The Japanese Society for Dialysis Therapy)
|
|
·
|
Journal of Philosophy of Education (Philosophy of Education Society of Great Britain)
|
Journal Licenses
Journal licenses, which represent approximately 60% of fiscal year 2009 journal subscription revenue, provide academic, government and corporate customers with online access to multiple journals. During fiscal year 2009, agreements were signed or renewed with universities, library consortia and government agencies in the US, Norway, Japan, China, Brazil, Canada, Greece, Chile, Denmark and India.
STMS Books and References
Book sales and other related income, which account for approximately 17% of fiscal year 2009 STMS revenue, were up 5% excluding unfavorable foreign exchange. The total number of books published increased slightly. Online book sales rose approximately 20% to $10 million. During the fiscal year, Wiley acquired the Arnold statistics book program from Hodder Education. The acquisition, which includes over 50 titles, complements areas of strength in Wiley’s statistics program, while providing growth opportunities.
Wiley InterScience
Wiley achieved an important milestone in the early part of fiscal year 2009 by migrating online journal content, customers and access licenses from Blackwell’s Synergy platform to Wiley InterScience. The migration included approximately 29,000 customers, over two million licenses and nearly two million journal articles.
32
|
Professional/Trade (P/T):
|
||||
|
% change
|
||||
|
Dollars in thousands
|
2009
|
2008
|
% change
|
w/o FX
|
|
Revenue
|
$403,113
|
$457,286
|
(12%)
|
(9%)
|
|
Direct Contribution
|
$89,678
|
$130,502
|
(31%)
|
(27%)
|
|
Contribution Margin
|
22.2%
|
28.5%
|
||
Global P/T revenue for fiscal year 2009 decreased 12% to $403.1 million, or 9% excluding the unfavorable impact of foreign exchange. The decline in revenue was due to a weak retail environment particularly in the U.S., partially offset by modest growth in the European and Canadian markets. Also affecting the comparison to last year was the termination of a publishing agreement in the culinary/hospitality publishing program.
Direct contribution to profit decreased 31% to $89.7 million, or 27% excluding the unfavorable impact of foreign exchange. Direct contribution margin declined 630 basis points to 22.2%, or 560 basis points excluding the unfavorable impact of foreign exchange. The decline reflects lower sales volume, higher inventory obsolescence and royalty advance provisions and a $2.0 million bad debt recovery in the prior year, partially offset by cost containment efforts in advertising, sales and marketing and lower accrued incentive compensation.
Notable Alliances
|
·
|
GMAC/Official Guide to the GMAT: Wiley became the official publisher of the Graduate Management Admission Test® (GMAT®) study guides in October 2008. In March, the 12th edition of the top-selling Official Guide for GMAT Review was released worldwide. It will be followed by The Official Guide for GMAT Verbal Review and The Official Guide for GMAT Quantitative.
|
|
·
|
Meredith: In March 2009, as part of its multi-year agreement, Wiley began publishing Better Homes and Garden book titles and other brands such as Family Circle, as well as Food Network TV, Sandra Lee, Rocco DiSpirito and Tyler Florence.
|
|
·
|
Kindle (Amazon): Currently, Wiley has over 9,000 P/T books available on the Kindle 2.
|
|
·
|
General Mills: Wiley and General Mills signed an agreement to renew their publishing partnership. Under the agreement, Wiley will continue to publish the flagship Betty Crocker “Big Red” cookbook and other cookbooks under the Betty Crocker, Pillsbury and other General Mills brands.
|
|
·
|
Vancouver Olympic Organizing Committee: Wiley Canada entered into an agreement with VANOC, becoming the official publication partner of the 2010 Winter Olympic and Paralympics Games in Vancouver/Whistler. In close cooperation with VANOC, Wiley will produce commemorative books, games reports, and custom publications.
|
Online Initiatives
|
·
|
For the fiscal year, Frommers.com maintained its top position in website traffic by posting 137 million page views and nearly 29 million visits. The results were lower than last year due to the economy.
|
|
·
|
Launched in November 2008, the new Dummies.com generated a total of 29 million page views by fiscal year-end, a 23% increase over prior year. Eleven million unique visitors represented a 21% increase. Users are spending 17% more time on content pages. The site now includes 25 topic areas with 250+ pieces of content in each, 950 fully illustrated step-by-step articles, 6,610 articles, and 265 videos.
|
|
·
|
CliffsNotes.com recorded year-on-year increases of 5% in page views and 21% in unique visitors.
|
33
Notable New Titles
Business:
|
·
|
Lee Bolman: Reframing Organizations, Fourth Edition
|
|
·
|
Jim Kouzes and Barry Posner: Leadership Challenge, Fourth Edition
|
|
·
|
GAAP 2009
|
|
·
|
CPA Exam Set, Thirty-fifth edition, Volumes 1 and 2
|
|
·
|
Mary Kay Ash: Mary Kay Way
|
|
·
|
Patrick Lencioni: Three Big Questions for A Frantic Family
|
Finance:
|
·
|
JK Lasser, Year In Taxes 2009
|
|
·
|
Fischer: Ten Road to Riches
|
|
·
|
John Bogle: Enough
|
|
·
|
Peter Schiff: Little Book of Bull Moves in Bear Markets
|
|
·
|
Martin Weiss: Depression Survival Guide
|
|
·
|
Addison Wiggin: I.O.U.S.A.: One Nation. Under Stress. In Debt
|
Psychology:
|
·
|
Lenore Skenazy: Free Range Kids: Giving Our Children the Freedom We had without Going Nuts with Worry
|
|
·
|
Michael Gurian: The Purpose of Boys: Helping Our Sons Find Meaning, Significance and Direction in Their Lives
|
|
·
|
Gary Groth-Marnat: Handbook of Psychological Assessment, Fifth Edition
|
|
·
|
Richard Lerner: Handbook of Adolescent Psychology, Third Edition
|
Consumer:
|
·
|
Weight Watchers in 20 Minutes
|
|
·
|
Mark Bittman: How to Cook Everything, Second Edition
|
|
·
|
Bob Sehlinger: Unofficial Guide to Walt Disney World 2009
|
|
·
|
GMAC: The Official Guide to the GMAT, Twelfth Edition
|
|
·
|
Jack Cafferty: Now Or Never: Getting Down To Business of Saving Our American Dream
|
|
·
|
Alan Rubin: Diabetes for Dummies
|
|
·
|
Paul McFedries: iPhone 3G Portable Genius
|
Architecture:
|
·
|
Edward Allen: Fundamentals of Building Construction, Fifth Edition
|
|
·
|
Wiley CPE (Continuing Professional Education, a web-based online continuing education system).
|
|
Higher Education (HE):
|
||||
|
|
% change
|
|||
|
Dollars in thousands
|
2009
|
2008
|
% change
|
w/o FX
|
|
Revenue
|
$239,093
|
$240,651
|
(1%)
|
3%
|
|
Direct Contribution
|
$66,619
|
$74,387
|
(10%)
|
(5%)
|
|
Contribution Margin
|
27.9%
|
30.9%
|
||
Global HE revenue for fiscal year 2009 decreased 1% from the prior year period, but increased 3% excluding the unfavorable impact of foreign exchange. Excluding foreign exchange, revenue growth occurred in every region and in nearly every subject category. Contributing to these results were a strong frontlist; approximately $6.6 million of revenue from recently acquired titles; solid growth from the Microsoft publishing agreement; and the continued success of WileyPLUS.
Direct contribution to profit decreased 10% to $66.6 million, or 5% excluding the unfavorable impact of foreign exchange. Direct contribution margin declined 300 basis points to 27.9%, or 240 basis points excluding the unfavorable impact of foreign exchange. The decline reflects prior year cost containment efforts which significantly curtailed expenditures in fiscal year 2008, higher accrued incentive compensation expense and increased marketing, advertising and content development costs to support the large frontlist.
34
WileyPLUS
|
·
|
Now accounts for 9% of global HE revenue
|
|
·
|
Global full year billings increased 38%
|
|
·
|
Digital-only sales grew 70%
|
|
·
|
Validation/usage rates increased
|
|
·
|
WileyPLUS sales outside the US represent 15% of the total
|
Notable Alliances
|
·
|
Microsoft Official Academic Course (MOAC) revenue was up 16% over prior year.
|
|
·
|
Wiley is partnering with American Hospitality Training Institute, an online provider of hospitality training for students outside the US interested in working for US hotels and resorts. Twenty-one classes utilizing content from Barrows/Introduction to Management in the Hospitality Industry 9e will begin in June, 2009.
|
|
·
|
Wiley and Learning House agreed to create highly integrative online courses based on Wiley textbooks. The courses will be bundled with the book. We received approval for a licensing agreement for two pilot courses in world regional geography and Spanish 1. Learning House is an online education solutions partner helping small colleges and universities offer and manage their online degree programs.
|
|
·
|
Wiley expanded its alliance with Amazon to offer select Wiley textbooks for sale through the Kindle DX. Books are set to go live on the Kindle Store in the summer of 2009.
|
Acquisitions
|
·
|
In August 2008, Wiley acquired business and modern language textbooks from Cengage Learning and mathematics and statistics textbooks from Key College Publishing.
|
|
·
|
These acquisitions contributed approximately $6.6 million of revenue in fiscal year 2009, exceeding expectations.
|
Custom Publishing
|
·
|
Wiley Custom Select was successfully launched in the fourth quarter. Wiley Custom Select is a custom textbook system that allows instructors to "build" customized higher education course materials that fit their pedagogical needs, enabling users to easily find the content, personalize the material and format, and submit the order. In fiscal year 2009, custom sales increased approximately 25%.
|
Shared Service and Administrative Costs
Shared services and administrative costs for fiscal year 2009 decreased 7% to $337.0 million, or 2% excluding the favorable impact of foreign exchange. The improvement reflects lower accrued incentive compensation expense and lower integration costs, partially offset by planned salary merit increases, higher distribution costs due to increased journal shipping and handling and higher occupancy, facilities and depreciation costs related to business expansion.
Liquidity and Capital Resources
The Company’s cash and cash equivalents balance was $153.5 million at the end of fiscal year 2010, compared with $102.8 million a year earlier. Cash provided by operating activities in fiscal year 2010 increased $77.5 million to $418.8 million due primarily to higher earnings and non-cash charges and provisions, and lower working capital, partially offset by higher pension contributions. Pension contributions in fiscal year 2010 were $48.1 million, of which $31.0 million were discretionary, compared to $21.0 million in the prior year.
35
The improvement in working capital was principally due to higher accrued incentive compensation, lower inventories due to improved sales and inventory management, and higher unearned deferred revenue, partially offset by higher accounts receivable due to increased book sales, and lower accounts payable due to timing of payments. The improvement in Deferred Revenue reflects journal subscription and WileyPLUS growth and the timing of cash collections on journal subscriptions resulting from the resolution of prior year billing delays of approximately $37 million, which shifted cash collection from fiscal year 2009 to fiscal year 2010.
Cash used for investing activities for fiscal year 2010 was approximately $209.9 million compared to $201.6 million in fiscal year 2009. The Company invested $6.4 million in the acquisition of publishing businesses, assets and rights compared to $24.0 million in the prior year. Cash used for property, equipment and technology and product development increased $25.8 million in fiscal year 2010 versus the prior year with product development spending increasing approximately $23.7 million primarily due to the timing of author advance payments.
Cash used in financing activities was $156.4 million in fiscal year 2010, as compared to $89.1 million in fiscal year 2009. In fiscal 2010, cash was used primarily to pay dividends to shareholders, and repay debt. The Company did not repurchase any shares in fiscal 2010 while during fiscal year 2009, the Company repurchased one million shares at an average price of $34.89. The Company increased its quarterly dividend to shareholders by 7.7% to $0.14 per share in fiscal year 2010 from $0.13 per share in the prior year. Proceeds from stock option exercises increased $21.0 million to $32.6 million in fiscal 2010.
The aggregate notional amount of interest rate swap agreements associated with the Term Loan and Revolving Credit Facility were $300 million as of April 30, 2010. It is management's intention that the notional amount of the interest rate swap be less than the Term Loan and Revolving Credit Facility outstanding during the life of the derivative.
The Company’s operating cash flow is affected by the seasonality and timing of receipts from its STMS journal subscriptions and its Higher Education business. Cash receipts for calendar year STMS subscription journals occur primarily from November through February. Reference is made to the Credit Risk section, which follows, for a description of the impact on the Company as it relates to independent journal agents’ financial position and liquidity. Sales primarily in the U.S. higher education market tend to be concentrated in June through August, and again in November through January. Due to this seasonality, the Company normally requires increased funds for working capital from May through September.
Global capital and credit markets have recently experienced increased volatility. As of April 30, 2010, we had approximately $649.0 million of debt outstanding and approximately $572.0 million of unused borrowing capacity under the Revolving Credit Facility which is described in Note 12. We believe that our operating cash flow, together with our revolving credit facilities and other available debt financing, will be adequate to meet our operating, investing and financing needs in the foreseeable future, although there can be no assurance that continued or increased volatility in the global capital and credit markets will not impair our ability to access these markets on terms commercially acceptable to us or at all.
The Company has adequate cash and cash equivalents available, as well as short-term lines of credit to finance its short-term seasonal working capital requirements. The Company does not have any off-balance-sheet debt.
Working capital at April 30, 2010 was negative $188.7 million. Working capital is negative as a result of including, in current liabilities, unearned deferred revenue related to subscriptions for which cash has been collected in advance. This deferred revenue will be recognized into income as the products are shipped or made available online to the customers over the term of the subscription. Current liabilities as of April 30, 2010 include $275.7 million of such deferred subscription revenue for which cash was collected in advance.
36
Projected product development and property, equipment and technology capital spending for fiscal year 2011 is forecast to be approximately $145 million and $60 million, respectively, primarily to enhance system functionality and drive future business growth.
Contractual Obligations and Commercial Commitments
A summary of contractual obligations and commercial commitments, excluding interest charges on debt, and unrecognized tax benefits further described in Note 10, as of April 30, 2010 is as follows:
|
Payments Due by Period
|
|||||
|
Within
|
2-3
|
4-5
|
After 5
|
||
|
Total
|
Year 1
|
Years
|
Years
|
Years
|
|
|
Total Debt
|
$649.0
|
$90.0
|
$559.0
|
$-
|
$-
|
|
Non-Cancelable Leases
|
238.6
|
34.0
|
59.1
|
54.8
|
90.7
|
|
Minimum Royalty Obligations
|
204.4
|
42.2
|
70.1
|
52.7
|
39.4
|
|
Other Commitments
|
6.8
|
4.6
|
2.1
|
0.1
|
-
|
|
Total
|
$1,098.8
|
$170.8
|
$690.3
|
$107.6
|
$130.1
|
Market Risk
The Company is exposed to market risk primarily related to interest rates, foreign exchange, and credit risk. It is the Company’s policy to monitor these exposures and to use derivative financial investments and/or insurance contracts from time to time to reduce fluctuations in earnings and cash flows when it is deemed appropriate to do so. The Company does not use derivative financial instruments for trading or speculative purposes.
Interest Rates:
The Company had $649.0 million of variable rate loans outstanding at April 30, 2010, which approximated fair value. On February 16, 2007, the Company entered into an interest rate swap agreement, designated as a cash flow hedge as defined under the Financial Accounting Standards Board (“FASB”) Accounting Standards Codification (“ASC”) 815, “Derivatives and Hedging” (“ASC 815”). The hedge locked-in a portion of the variable interest due on a portion of the Term Loan. Under the terms of the interest rate swap, the Company pays a fixed rate of 5.076% and receives a variable rate of interest based on three month LIBOR (as defined) from the counter party which is reset every three months for a four-year period ending February 8, 2011. The notional amount of the rate swap was initially $660 million which will decline through February 8, 2011, based on the expected amortization of the Term Loan. As of April 30, 2010, the notional amount of the rate swap was $200.0 million.
On October 19, 2007, the Company entered into an additional interest rate swap agreement designed by the Company as a cash flow hedge that locked-in a portion of the variable interest due on the Revolving Credit Facility. Under the terms of this interest rate swap, the Company pays a fixed rate of 4.60% and receives a variable rate of interest based on three month LIBOR (as defined) from the counterparty which is reset every three months for a three-year period ending August 8, 2010. The notional amount of the rate swap is $100.0 million.
37
It is management’s intention that the notional amount of interest rate swaps be less than the Term Loan and the Revolving Credit Facility outstanding during the life of the derivatives. During fiscal year 2010, the Company recognized a loss on its hedge contracts of approximately $20.4 million which is reflected in interest expense. At April 30, 2010, the aggregate fair value of the interest rate swaps was a net loss of $11.5 million which is included in Other Accrued Liabilities in the Consolidated Statements of Financial Position. On an annual basis, a hypothetical one percent change in interest rates for the $349.0 million of unhedged variable rate debt as of April 30, 2010 would affect net income and cash flow by approximately $2.2 million.
Foreign Exchange Rates:
Fluctuations in the currencies of countries where the Company operates outside the U.S. may have a significant impact on financial results. The Company is primarily exposed to movements in British pound sterling, euros, Canadian and Australian dollars, and certain Asian currencies. The Statements of Financial Position of non-U.S. business units are translated into U.S. dollars using period-end exchange rates for assets and liabilities and weighted-average exchange rates for revenues and expenses. Fiscal year 2010 revenue was recognized in the following currencies: approximately 55% U.S dollar; 28% British pound sterling; 8% Euro and 9% other currencies.
Adjustments resulting from translating assets and liabilities are reported as a separate component of Accumulated Other Comprehensive Income (Loss) within Shareholders’ Equity under the caption Foreign Currency Translation Adjustment. The Company also has significant investments in non-U.S. businesses that are exposed to foreign currency risk. During fiscal year 2010, the Company recorded approximately $60.3 million of currency translation gains in other comprehensive income primarily as a result of the weakening of the U.S. dollar relative to the British pound sterling.
Effective November 1, 2008, the Company changed its functional currency reporting basis for the non-Blackwell portion of the Company’s European STMS journal business from U.S. Dollar to local currency. As part of the integration of Blackwell and Wiley fulfillment systems and licensing practices, in the third quarter of fiscal year 2009 the Company began pricing journal revenue based on local currency in Europe. Prior to the integration, journal revenue was principally priced and reported in U.S. Dollars. This change primarily impacted business denominated in Euros and Sterling.
Exchange rate gains or losses related to foreign currency transactions are recognized as transaction gains or losses in the Consolidated Statements of Income as incurred. Under certain circumstances, the Company may enter into derivative financial instruments in the form of foreign currency forward contracts to hedge against specific transactions, including intercompany purchases and loans. The Company does not use derivative financial instruments for trading or speculative purposes.
During fiscal year 2010, the Company entered into forward exchange contracts to manage the Company’s exposure on certain foreign currency denominated assets and liabilities. Foreign currency denominated assets and liabilities are remeasured at spot rates in effect on the balance sheet date, with the effects of changes in spot rates reported in Foreign Exchange Gains (Losses) on the Consolidated Statements of Income. The Company did not designate these forward exchange contracts as hedges under current accounting standards as the benefits of doing so were not material due to the short-term nature of the contracts. Therefore, the forward exchange contracts are marked to market through Foreign Exchange Gains (Losses) on the Consolidated Statements of Income, and carried at their fair value on the Consolidated Statements of Financial Position. Accordingly, fair value changes in the forward exchange contracts substantially mitigated the changes in the value of the remeasured foreign currency denominated assets and liabilities attributable to changes in foreign currency exchange rates. The fair value of open forward exchange contracts were measured on a recurring basis using Level 2 inputs. In fiscal year 2010, the losses recognized on the forward contracts were $2.0 million, and were substantially offset by the foreign exchange gains recognized on the economically hedged foreign currency denominated assets and liabilities. As of April 30, 2010, there were no open contracts outstanding. The Company did not enter into any forward exchange contracts during fiscal year 2009.
38
Customer Credit Risk:
In the journal publishing business, subscriptions are primarily sourced through journal subscription agents who, acting as agents for library customers, facilitate ordering by consolidating the subscription orders/billings of each subscriber with various publishers. Cash is generally collected in advance from subscribers by the subscription agents and is remitted to the journal publisher, including the Company, generally prior to the commencement of the subscriptions. Although at fiscal year-end the Company had minimal credit risk exposure to these agents, future calendar-year subscription receipts from these agents are highly dependent on their financial condition and liquidity. Subscription agents account for approximately 24% of total consolidated revenue and no one agent accounts for more than 10% of total consolidated revenue.
The Company’s book business is not dependent upon a single customer; however, the industry is concentrated in national, regional, and online bookstore chains. Although no one book customer accounts for more than 8% of total consolidated revenue, the top 10 book customers account for approximately 20% of total consolidated revenue and approximately 45% of accounts receivable at April 30, 2010.
Critical Accounting Policies and Estimates
The preparation of the Company’s financial statements in conformity with accounting principles generally accepted in the U.S. requires management to make estimates and assumptions that affect the reported amount of assets and liabilities, disclosure of contingent assets and liabilities as of the date of the financial statements, and reported amounts of revenue and expenses during the reporting period. Management continually evaluates the basis for its estimates. Actual results could differ from those estimates, which could affect the reported results.
Financial Reporting Release No. 60, released by the Securities and Exchange Commission, requires all companies to discuss critical accounting policies or methods used in the preparation of financial statements. Note 2 of the “Notes to Consolidated Financial Statements” includes a summary of the significant accounting policies and methods used in preparation of our Consolidated Financial Statements. Set forth below is a discussion of the Company’s more critical accounting policies and methods.
Revenue Recognition: The Company recognizes revenue when the following criteria are met: persuasive evidence that an arrangement exists; delivery has occurred or services have been rendered; the price to the customer is fixed or determinable; and collectability is reasonably assured. If all of the above criteria have been met, revenue is principally recognized upon shipment of products or when services have been rendered. Subscription revenue is generally collected in advance. The prepayment is deferred and recognized as earned when the related issue is shipped or made available online over the term of the subscription. When a product is sold with multiple deliverables, the Company accounts for each deliverable within the arrangement as a separate unit of accounting due to the fact that each deliverable is also sold on a stand-alone basis. The total consideration of a multiple-element arrangement is allocated to each unit of accounting using the relative fair value method based on the estimated selling prices of each deliverable within the arrangement. Collectability is evaluated based on the amount involved, the credit history of the customer, and the status of the customer’s account with the Company. Revenue is reported net of any amounts billed to customers for taxes which are remitted to government authorities.
39
Allowance for Doubtful Accounts: The estimated allowance for doubtful accounts is based on a review of the aging of the accounts receivable balances, historical write-off experience, credit evaluations of customers and current market conditions. A change in the evaluation of a customer’s credit could affect the estimated allowance. The allowance for doubtful accounts is shown as a reduction of accounts receivable in the Consolidated Statements of Financial Position and amounted to $6.9 million and $5.7 million as of April 30, 2010 and 2009, respectively.
Sales Return Reserve: The estimated allowance for sales returns is based on a review of the historical return patterns, as well as current market trends in the businesses in which we operate. Sales return reserves, net of estimated inventory and royalty costs, are reported as a reduction of accounts receivable in the Consolidated Statements of Financial Position and amounted to $55.3 million and $55.2 million as of April 30, 2010 and 2009, respectively. A one percent change in the estimated sales return rate could affect net income by approximately $4.0 million. A change in the pattern or trends in returns could affect the estimated allowance.
Reserve for Inventory Obsolescence: Inventories are carried at the lower of cost or market. A reserve for inventory obsolescence is estimated based on a review of damaged, obsolete, or otherwise unsalable inventory. The review encompasses historical unit sales trends by title; current market conditions, including estimates of customer demand compared to the number of units currently on hand; and publication revision cycles. A change in sales trends could affect the estimated reserve. The inventory obsolescence reserve is reported as a reduction of the inventory balance in the Consolidated Statements of Financial Position and amounted to $39.7 million and $36.3 million as of April 30, 2010 and 2009, respectively.
Allocation of Acquisition Purchase Price to Assets Acquired and Liabilities Assumed: In connection with acquisitions, the Company allocates the cost of the acquisition to the assets acquired and the liabilities assumed based on estimates of the fair value of such items including goodwill and other intangible assets. Such estimates include expected cash flows to be generated by those assets and the expected useful lives based on historical experience, current market trends, and synergies to be achieved from the acquisition and expected tax basis of assets acquired. For significant acquisitions, the Company uses independent appraisers to assist in the determination of such estimates.
Goodwill and Intangible Assets: Goodwill is the excess of the purchase price paid over the fair value of the net assets of the business acquired. Other intangible assets principally consist of branded trademarks, acquired publication rights, customer relationships and non-compete agreements. Goodwill and indefinite-lived intangible assets are not amortized but are reviewed annually for impairment or more frequently if events or circumstances indicate that the asset might be impaired. The fair values of the Company’s reporting units are substantially in excess of their carrying values. Other finite-lived intangible assets continue to be amortized over their useful lives. Acquired publication rights with definitive lives are amortized on a straight-line basis over periods ranging from 5 to 40 years. Non-compete agreements are amortized over the terms of the individual agreement.
Impairment of Long-Lived Assets: Depreciable and amortizable assets are only evaluated for impairment upon a significant change in the operating or macroeconomic environment. In these circumstances, if an evaluation of the current forecasts of undiscounted cash flows indicates impairment, the asset is written down to its estimated fair value based on the discounted future cash flows.
Share-Based Compensation: The Company recognizes share-based compensation expense based on the fair value of the share-based awards on the grant date, reduced by an estimate of future forfeited awards. As such, share-based compensation expense is only recognized for those awards that are expected to ultimately vest. The fair value of share-based awards is recognized in net income on a straight-line basis over the requisite service period. The grant date fair value for stock options is estimated using the Black-Scholes option-pricing model. The determination of the assumptions used in the Black-Scholes model requires the Company to make significant judgments and estimates, which include the expected life of an option, the expected volatility of the Company’s Common Stock over the estimated life of the option, a risk-free interest rate and the expected dividend yield. Judgment is also required in estimating the amount of share-based awards that may be forfeited. Share-based compensation expense associated with performance-based stock awards is determined based upon actual results compared to targets established three years in advance. The cumulative effect on current and prior periods of a change in the estimated number of performance share awards, or estimated forfeiture rate is recognized as an adjustment to earnings in the period of the revision. If actual results differ significantly from estimates, the Company’s share-based compensation expense and results of operations could be impacted.
40
Retirement Plans: The Company provides defined benefit pension plans for the majority of its employees worldwide. The accounting for benefit plans is highly dependent on assumptions concerning the outcome of future events and circumstances, including compensation increases, long-term return rates on pension plan assets, healthcare cost trends, discount rates and other factors. In determining such assumptions, the Company consults with outside actuaries and other advisors. The discount rates for the U.S. and Canadian pension plans are based on the derivation of a single-equivalent discount rate using a standard spot rate curve and the timing of expected payments as of the balance sheet date. The spot rate curve is based upon a portfolio of Moody’s-rated Aa3 (or higher) corporate bonds. The discount rates for other non-U.S. plans are based on similar published indices with durations comparable to that of each plan’s liabilities. The expected long-term rates of return on pension plan assets are estimated using market benchmarks for equities, real estate and bonds applied to each plan’s target asset allocation and are estimated by asset class including an anticipated inflation rate. The expected long-term rates are then compared to the historic investment performance of the plan assets as well as future expectations and estimated through consultation with investment advisors and actuaries. Salary growth and healthcare cost trend assumptions are based on the Company’s historical experience and future outlook. While the Company believes that the assumptions used in these calculations are reasonable, differences in actual experience or changes in assumptions could materially affect the expense and liabilities related to the defined benefit pension plans of the Company.
Recently Issued Accounting Standards: In September 2006, the Financial Accounting Standards Board (“FASB”) issued guidance which is included Accounting Standards Codification (“ASC”) 820, “Fair Value Measurements and Disclosures” (“ASC 820”). ASC 820 provides a single authoritative definition of fair value and provides enhanced guidance for measuring the fair value of assets and liabilities and requires additional disclosures related to the extent to which companies measure assets and liabilities at fair value, the information used to measure fair value, and the effect of fair value measurements on earnings. In February 2008, the FASB agreed to a one-year delay of the fair value measurement requirement for certain nonfinancial assets and liabilities. The Company adopted ASC 820 as of May 1, 2008 for assets and liabilities not subject to the deferral and as of May 1, 2009 for those nonfinancial assets and liabilities subject to the deferral. The adoption did not have a significant impact on the Company’s consolidated financial statements or disclosures.
In December 2007, the FASB issued guidance which is included in ASC 805 “Business Combinations” (“ASC 805”) and is effective for acquisitions made on or after May 1, 2009. ASC 805 expands the scope of acquisition accounting to all transactions under which control of a business is obtained. Principally, ASC 805 requires that contingent consideration be recorded at fair value on the acquisition date and that certain transaction and restructuring costs be expensed. The Company adopted ASC 805 as of May 1, 2009 and is now accounting for all acquisitions made after the effective date under the standard.
In April 2008, the FASB issued guidance which is included in ASC 350 “Intangibles – Goodwill and Other” (“ASC 350”). The guidance in ASC 350 amends the factors that must be considered in developing renewal or extension assumptions used to determine the useful life over which to amortize the cost of a recognized intangible asset under ASC 350. The guidance requires an entity to consider its own experience with the renewal or extension of the terms of a contractual arrangement, consistent with its expected use of the asset. The guidance also requires several incremental disclosures for renewable intangible assets. Application of this standard will not significantly impact the process previously used by the Company to determine the useful life of intangible assets. The Company adopted the guidance as of May 1, 2009 and is applying the guidance to intangible assets acquired after the effective date.
41
In August 2009, the FASB issued Accounting Standards Update (“ASU”) ASU 2009-05, “Fair Value Measurements and Disclosures (Topic 820): Measuring Liabilities at Fair Value” ("ASU 2009-05"). ASU 2009-05 provides clarification to entities that measure liabilities at fair value under circumstances where a quoted price in an active market is not available. The Company adopted ASU 2009-05 as of November 1, 2009. The adoption did not have a significant impact on the Company’s consolidated financial statements.
In October 2009, the FASB issued ASU 2009-13 “Revenue Recognition (Topic 605): Multiple-Deliverable Revenue Arrangements” (“ASU 2009-13”). ASU 2009-13 addresses the accounting for multiple-deliverable arrangements to enable vendors to account for products and services separately rather than as a combined unit. Specifically, this guidance amends the existing criteria for separating consideration received in multiple-deliverable arrangements, eliminates the residual method of allocation and requires that arrangement consideration be allocated at the inception of the arrangement to all deliverables using the relative selling price method. The guidance also establishes a hierarchy for determining the selling price of a deliverable, which is based on vendor-specific objective evidence; third-party evidence; or management estimates. Expanded disclosures related to the Company’s multiple-deliverable revenue arrangements will also be required. The new guidance is effective for revenue arrangements entered into or materially modified on and after May 1, 2011. The Company does not expect the application of this new standard to have a significant impact on its consolidated financial statements.
There have been no other new accounting standards issued that have had, or are expected to have a material impact on the Company’s consolidated financial statements.
“Safe Harbor” Statement Under the
Private Securities Litigation Reform Act of 1995
This report contains certain forward-looking statements concerning the Company’s operations, performance, and financial condition. Reliance should not be placed on forward-looking statements, as actual results may differ materially from those in any forward-looking statements. Any such forward-looking statements are based upon a number of assumptions and estimates that are inherently subject to uncertainties and contingencies, many of which are beyond the control of the Company, and are subject to change based on many important factors. Such factors include, but are not limited to (i) the level of investment in new technologies and products; (ii) subscriber renewal rates for the Company’s journals; (iii) the financial stability and liquidity of journal subscription agents; (iv) the consolidation of book wholesalers and retail accounts; (v) the market position and financial stability of key online retailers; (vi) the seasonal nature of the Company’s educational business and the impact of the used-book market; (vii) worldwide economic and political conditions; and (viii) the Company’s ability to protect its copyrights and other intellectual property worldwide (ix) other factors detailed from time to time in the Company’s filings with the Securities and Exchange Commission. The Company undertakes no obligation to update or revise any such forward-looking statements to reflect subsequent events or circumstances.
42
Results By Quarter (Unaudited)
|
Dollars in millions, except per share data
|
||||||||
|
2010
|
2009
|
|||||||
|
Revenue
|
||||||||
|
First Quarter
|
$
|
388.4
|
$
|
401.7
|
||||
|
Second Quarter
|
448.0
|
431.9
|
||||||
|
Third Quarter
|
427.1
|
374.4
|
||||||
|
Fourth Quarter
|
435.6
|
403.4
|
||||||
|
Fiscal Year
|
$
|
1,699.1
|
$
|
1,611.4
|
||||
|
Operating Income
|
||||||||
|
First Quarter
|
$
|
55.7
|
$
|
44.3
|
||||
|
Second Quarter (a)
|
75.3
|
70.2
|
||||||
|
Third Quarter (a)
|
68.3
|
63.3
|
||||||
|
Fourth Quarter (b)
|
43.3
|
40.7
|
||||||
|
Fiscal Year
|
$
|
242.6
|
$
|
218.5
|
||||
|
Net Income
|
||||||||
|
First Quarter
|
$
|
26.9
|
$
|
30.2
|
||||
|
Second Quarter (a)
|
46.3
|
40.1
|
||||||
|
Third Quarter (a)
|
42.4
|
33.4
|
||||||
|
Fourth Quarter (b)
|
27.9
|
24.6
|
||||||
|
Fiscal Year
|
$
|
143.5
|
$
|
128.3
|
||||
|
2010
|
2009
|
|||||||
|
Income Per Share
|
Diluted
|
Basic
|
Diluted
|
Basic
|
||||
|
First Quarter
|
$
|
0.45
|
$
|
0.46
|
$
|
0.50
|
$
|
0.52
|
|
Second Quarter (a)
|
0.78
|
0.79
|
0.67
|
0.68
|
||||
|
Third Quarter (a)
|
0.71
|
0.72
|
0.57
|
0.58
|
||||
|
Fourth Quarter (b)
|
0.46
|
0.47
|
0.42
|
0.42
|
||||
|
Fiscal Year
|
$
|
2.41
|
$
|
2.45
|
$
|
2.15
|
$
|
2.20
|
|
(a)
|
In the second and third quarters of fiscal year 2010, the Company recognized intangible asset impairment and restructuring charges principally related to GIT Verlag, a Business-to-Business German-language controlled circulation magazine business acquired in 2002. The second quarter charge was $11.5 million ($8.2 million after taxes) or $0.14 per diluted share. The third quarter charge was $2.8 million ($2.0 million after taxes) or $0.03 per diluted share.
|
|
(b)
|
In the fourth quarter of fiscal year 2010, the Company recognized restructuring charges principally related to offshoring and outsourcing certain marketing and content management activities to Singapore. The fourth quarter charge was $0.8 million ($0.5 million after taxes) or $0.01 per diluted share.
|
43
Quarterly Share Prices, Dividends, and Related Stockholder Matters and Issuer Purchases of Equity Securities
The Company’s Class A and Class B shares are listed on the New York Stock Exchange under the symbols JWa and JWb, respectively. Dividends per share and the market price range by fiscal quarter for the past two fiscal years were as follows:
|
Class A Common Stock
|
Class B Common Stock
|
|||||
|
Market Price
|
Market Price
|
|||||
|
Dividends
|
High
|
Low
|
Dividends
|
High
|
Low
|
|
|
2010
|
||||||
|
First Quarter
|
$0.14
|
$35.04
|
$30.84
|
$0.14
|
$35.00
|
$31.00
|
|
Second Quarter
|
0.14
|
35.90
|
29.77
|
0.14
|
35.76
|
29.50
|
|
Third Quarter
|
0.14
|
43.17
|
35.35
|
0.14
|
43.30
|
35.17
|
|
Fourth Quarter
|
0.14
|
43.95
|
39.73
|
0.14
|
43.74
|
39.97
|
|
2009
|
||||||
|
First Quarter
|
$0.13
|
$49.76
|
$43.39
|
$0.13
|
$49.52
|
$43.53
|
|
Second Quarter
|
0.13
|
48.88
|
27.75
|
0.13
|
49.11
|
28.02
|
|
Third Quarter
|
0.13
|
37.60
|
26.21
|
0.13
|
37.58
|
26.05
|
|
Fourth Quarter
|
0.13
|
36.72
|
27.55
|
0.13
|
36.63
|
27.50
|
As of April 30, 2010, the approximate number of holders of the Company’s Class A and Class B Common Stock were 1,181 and 102 respectively, based on the holders of record.
The Company did not repurchase any common stock during the fourth quarter of fiscal year 2010.
The Company’s credit agreement contains certain restrictive covenants related to the payment of dividends and share repurchases. Under the most restrictive covenant, approximately $106.0 million was available for such restricted payments as of April 30, 2010. Subject to the foregoing, the Board of Directors considers quarterly the payment of cash dividends based upon its review of earnings, the financial position of the Company, and other relevant factors.
44
Selected Financial Data
|
For the Years Ended April 30,
|
|||||
|
Dollars in millions (except per share data)
|
2010
|
2009
|
2008
|
2007
|
2006
|
|
Revenue
|
$1,699.1
|
$1,611.4
|
$1,673.7
|
$1,234.6
|
$1,043.9
|
|
Operating Income (a)
|
242.6
|
218.5
|
225.2
|
161.5
|
152.9
|
|
Net Income (a,b,c)
|
143.5
|
128.3
|
147.5
|
99.6
|
110.3
|
|
Working Capital (d)
|
(188.7)
|
(157.4)
|
(243.6)
|
(199.7)
|
(35.8)
|
|
Total Assets
|
2,316.2
|
2,223.7
|
2,576.2
|
2,553.1
|
1,026.0
|
|
Long-Term Debt
|
559.0
|
754.9
|
797.3
|
977.7
|
160.5
|
|
Shareholders’ Equity
|
722.4
|
513.5
|
689.1
|
529.5
|
401.8
|
|
Per Share Data
|
|||||
|
Income Per Share (a,b,c)
|
|||||
|
Diluted
|
$2.41
|
$2.15
|
$2.49
|
$1.71
|
$1.85
|
|
Basic
|
$2.45
|
$2.20
|
$2.55
|
$1.75
|
$1.90
|
|
Cash Dividends
|
|||||
|
Class A Common
|
$0.56
|
$0.52
|
$0.44
|
$0.40
|
$0.36
|
|
Class B Common
|
$0.56
|
$0.52
|
$0.44
|
$0.40
|
$0.36
|
|
|
NOTE: The Company acquired Blackwell Publishing (Holdings) Ltd. (“Blackwell”) on February 2, 2007.
|
|
(a)
|
In fiscal year 2010, the Company recognized intangible asset impairment and restructuring charges principally related to GIT Verlag, a Business-to-Business German-language controlled circulation magazine business acquired in 2002. The fiscal year 2010 charges were $15.1 million ($10.6 million after taxes) and impacted diluted earnings per share by $0.17.
|
|
(b)
|
Tax benefits included in fiscal year results are as follows:
|
|
·
|
Fiscal year 2008 includes a $18.7 million tax benefit, or $0.32 per diluted share, associated with new tax legislation enacted in the United Kingdom and Germany that reduced the corporate income tax rates from 30% to 28% and from 39% to 29%, respectively. The benefits recognized by the Company reflect the adjustments required to record all U.K. and Germany-related deferred tax balances at the new corporate income tax rates.
|
|
·
|
Fiscal year 2007 includes a $5.5 million tax benefit, or $0.09 per diluted share. This benefit coincides with the resolution and settlements of certain tax matters with authorities in the U.S. and abroad.
|
|
·
|
Fiscal year 2006 includes a tax benefit of $6.8 million, or $0.11 per diluted share, related to the favorable resolution of certain matters with tax authorities.
|
|
·
|
In the fourth quarter of fiscal year 2005, the Company elected to repatriate approximately $94 million of dividends from its European subsidiaries under the American Jobs Creation Act of 2004. The law provided for a favorable one-time tax rate on dividends from foreign subsidiaries. The tax accrued on the dividend in the fourth quarter of fiscal year 2005 was approximately $7.5 million, or $0.12 per diluted share. Pursuant to guidance issued by the Internal Revenue Service in May 2005, the Company recorded a tax benefit in the first quarter of fiscal year 2006 reversing the accrued tax recorded in the previous year. Neither the first quarter fiscal year 2006 tax benefit nor the corresponding fourth quarter fiscal year 2005 tax accrual had a cash impact on the Company.
|
|
(c)
|
Effective May 1, 2006, the Company adopted the guidance included in ASC 718, “Compensation – Stock Compensation (“ASC 718”) which required that companies recognize share-based compensation to employees in the Statement of Income based on the fair value of the share-based awards. The adoption of ASC 718 resulted in the recognition of an incremental share-based compensation expense of $11.3 million ($7.0 million after taxes) or $0.12 per diluted share for the full year ended April 30, 2007.
|
|
(d)
|
Working capital is reduced or negative as a result of including in current liabilities the deferred revenue related to prepaid journal subscriptions for which the cash has been received. The deferred revenue will be recognized into income as the journals are shipped or made available online to the customers over the term of the subscription.
|
45
Financial Statements and Supplementary Data
MANAGEMENT’S REPORT ON INTERNAL CONTROL OVER FINANCIAL REPORTING
To our Shareholders
John Wiley and Sons, Inc.:
The management of John Wiley and Sons, Inc. and subsidiaries is responsible for establishing and maintaining adequate internal control over financial reporting, as such term is defined in Exchange Act Rules 13a-15(f) and 15d-15(f).
Under the supervision and with the participation of our management, we conducted an evaluation of the effectiveness of our internal control over financial reporting based on the framework in Internal Control – Integrated Framework issued by the Committee of Sponsoring Organizations of the Treadway Commission (COSO). Based on our evaluation under the framework in Internal Control – Integrated Framework issued by COSO, our management concluded that our internal control over financial reporting was effective as of April 30, 2010.
Changes in Internal Control over Financial Reporting: There were no changes in our internal control over financial reporting that have materially affected, or are reasonably likely to materially affect, our internal control over financial reporting during fiscal year 2010.
The effectiveness of our internal control over financial reporting as of April 30, 2010 has been audited by KPMG LLP, an independent registered public accounting firm, as stated in their report which is included herein.
The Company’s Corporate Governance Principles, Committee Charters, Business Conduct and Ethics Policy and the Code of Ethics for Senior Financial Officers are published on our web site at www.wiley.com under the “About Wiley—Investor Relations—Corporate Governance” captions. Copies are also available free of charge to shareholders on request to the Corporate Secretary, John Wiley & Sons, Inc., 111 River Street, Hoboken, NJ 07030-5774.
| /s/ William J. Pesce | |
|
William J. Pesce
|
|
|
President and Chief Executive Officer
|
|
| /s/ Ellis E. Cousens | |
|
Ellis E. Cousens
|
|
|
Executive Vice President and
|
|
|
Chief Financial and Operations Officer
|
|
| /s/ Edward J. Melando | |
|
Edward J. Melando
|
|
|
Vice President, Controller and
|
|
|
Chief Accounting Officer
|
|
|
June 23, 2010
|
46
Report of Independent Registered Public Accounting Firm
The Board of Directors and Stockholders
John Wiley & Sons, Inc.:
We have audited the accompanying consolidated statements of financial position of John Wiley & Sons, Inc. (the “Company”) and subsidiaries as of April 30, 2010 and 2009, and the related consolidated statements of income, shareholders’ equity and comprehensive income, and cash flows for each of the years in the three-year period ended April 30, 2010. In connection with our audits of the consolidated financial statements, we also have audited the financial statement schedule (as listed in the index to Item 8). These consolidated financial statements and financial statement schedule are the responsibility of the Company’s management. Our responsibility is to express an opinion on these consolidated financial statements and financial statement schedule based on our audits.
We conducted our audits in accordance with the standards of the Public Company Accounting Oversight Board (United States). Those standards require that we plan and perform the audit to obtain reasonable assurance about whether the financial statements are free of material misstatement. An audit includes examining, on a test basis, evidence supporting the amounts and disclosures in the financial statements. An audit also includes assessing the accounting principles used and significant estimates made by management, as well as evaluating the overall financial statement presentation. We believe that our audits provide a reasonable basis for our opinion.
In our opinion, the consolidated financial statements referred to above present fairly, in all material respects, the financial position of John Wiley & Sons, Inc. and subsidiaries as of April 30, 2010 and 2009, and the results of their operations and their cash flows for each of the years in the three-year period ended April 30, 2010, in conformity with U.S. generally accepted accounting principles. Also in our opinion, the related financial statement schedule, when considered in relation to the basic consolidated financial statements taken as a whole, presents fairly, in all material respects, the information set forth therein.
We also have audited, in accordance with the standards of the Public Company Accounting Oversight Board (United States), John Wiley & Sons, Inc.’s internal control over financial reporting as of April 30, 2010, based on criteria established in Internal Control – Integrated Framework issued by the Committee of Sponsoring Organizations of the Treadway Commission (COSO)”), and our report dated June 23, 2010 expressed an unqualified opinion on the effectiveness of the Company’s internal control over financial reporting.
(signed) KPMG LLP
New York, New York
June 23, 2010
47
Report of Independent Registered Public Accounting Firm
The Board of Directors and Stockholders
John Wiley & Sons, Inc.:
We have audited John Wiley & Sons, Inc.’s internal control over financial reporting as of April 30, 2010, based on criteria established in Internal Control – Integrated Framework issued by the Committee of Sponsoring Organizations of the Treadway Commission (COSO). John Wiley & Sons, Inc.’s management is responsible for maintaining effective internal control over financial reporting and for its assessment of the effectiveness of internal control over financial reporting, included in the accompanying Management’s Report on Internal Control Over Financial Reporting. Our responsibility is to express an opinion on the Company’s internal control over financial reporting based on our audit.
We conducted our audit in accordance with the standards of the Public Company Accounting Oversight Board (United States). Those standards require that we plan and perform the audit to obtain reasonable assurance about whether effective internal control over financial reporting was maintained in all material respects. Our audit included obtaining an understanding of internal control over financial reporting, assessing the risk that a material weakness exists, and testing and evaluating the design and operating effectiveness of internal control based on the assessed risk. Our audit also included performing such other procedures as we considered necessary in the circumstances. We believe that our audit provides a reasonable basis for our opinion.
A company’s internal control over financial reporting is a process designed to provide reasonable assurance regarding the reliability of financial reporting and the preparation of financial statements for external purposes in accordance with generally accepted accounting principles. A company’s internal control over financial reporting includes those policies and procedures that (1) pertain to the maintenance of records that, in reasonable detail, accurately and fairly reflect the transactions and dispositions of the assets of the company; (2) provide reasonable assurance that transactions are recorded as necessary to permit preparation of financial statements in accordance with generally accepted accounting principles, and that receipts and expenditures of the company are being made only in accordance with authorizations of management and directors of the company; and (3) provide reasonable assurance regarding prevention or timely detection of unauthorized acquisition, use, or disposition of the company’s assets that could have a material effect on the financial statements.
Because of its inherent limitations, internal control over financial reporting may not prevent or detect misstatements. Also, projections of any evaluation of effectiveness to future periods are subject to the risk that controls may become inadequate because of changes in conditions, or that the degree of compliance with the policies or procedures may deteriorate.
In our opinion, John Wiley & Sons, Inc. maintained, in all material respects, effective internal control over financial reporting as of April 30, 2010, based on criteria established in Internal Control – Integrated Framework issued by the Committee of Sponsoring Organizations of the Treadway Commission.
We also have audited, in accordance with the standards of the Public Company Accounting Oversight Board (United States), the consolidated statements of financial position of John Wiley & Sons, Inc. and subsidiaries as of April 30, 2010 and 2009, and the related consolidated statements of operations, shareholders’ equity and comprehensive income, and cash flows for each of the years in the three-year period ended April 30, 2010, and our report dated June 23, 2010 expressed an unqualified opinion on those consolidated financial statements.
(signed) KPMG LLP
New York, New York
June 23, 2010
48
|
CONSOLIDATED STATEMENTS OF FINANCIAL POSITION
|
||||||||
|
John Wiley & Sons, Inc., and Subsidiaries
|
April 30
|
|||||||
|
Dollars in thousands
|
2010
|
2009
|
||||||
|
Assets:
|
||||||||
|
Current Assets
|
||||||||
|
Cash and cash equivalents
|
$ | 153,513 | $ | 102,828 | ||||
|
Accounts receivable
|
186,535 | 178,550 | ||||||
|
Inventories
|
97,857 | 111,267 | ||||||
|
Prepaid and other
|
47,809 | 46,924 | ||||||
|
Total Current Assets
|
485,714 | 439,569 | ||||||
|
Product Development Assets
|
107,755 | 89,662 | ||||||
|
Property, Equipment and Technology
|
152,684 | 141,196 | ||||||
|
Intangible Assets
|
911,550 | 919,375 | ||||||
|
Goodwill
|
615,479 | 589,993 | ||||||
|
Deferred Income Tax Benefits
|
6,736 | 14,065 | ||||||
|
Other Assets
|
36,284 | 29,848 | ||||||
|
Total Assets
|
$ | 2,316,202 | $ | 2,223,708 | ||||
|
Liabilities and Shareholders’ Equity:
|
||||||||
|
Current Liabilities
|
||||||||
|
Accounts and royalties payable
|
$ | 158,870 | $ | 160,275 | ||||
|
Deferred revenue
|
275,653 | 246,584 | ||||||
|
Accrued employment compensation and benefits
|
81,507 | 56,976 | ||||||
|
Accrued income taxes
|
2,516 | 4,281 | ||||||
|
Accrued pension liability
|
2,245 | 2,483 | ||||||
|
Other accrued liabilities
|
63,581 | 58,868 | ||||||
|
Current portion of long-term debt
|
90,000 | 67,500 | ||||||
|
Total Current Liabilities
|
674,372 | 596,967 | ||||||
|
Long-Term Debt
|
559,000 | 754,900 | ||||||
|
Accrued Pension Liability
|
119,280 | 90,621 | ||||||
|
Other Long-Term Liabilities
|
73,445 | 91,292 | ||||||
|
Deferred Income Tax Liabilities
|
167,669 | 176,412 | ||||||
|
Shareholders’ Equity
|
||||||||
|
Preferred Stock, $1 par value: Authorized - 2 million, Issued - zero
|
- | - | ||||||
|
Class A Common Stock, $1 par value: Authorized - 180 million,
|
||||||||
|
Issued – 69,705,591 and 69,643,571
|
69,706 | 69,644 | ||||||
|
Class B Common Stock, $1 par value: Authorized - 72 million,
|
||||||||
|
Issued – 13,484,671 and 13,546,691
|
13,485 | 13,547 | ||||||
|
Additional paid-in capital
|
210,848 | 164,592 | ||||||
|
Retained earnings
|
1,003,099 | 892,542 | ||||||
|
Accumulated other comprehensive income (loss):
|
||||||||
|
Foreign currency translation adjustment
|
(142,731 | ) | (203,023 | ) | ||||
|
Unamortized pension and retiree medical
|
(80,953 | ) | (41,978 | ) | ||||
|
Unrealized gain (loss) on interest rate swap
|
(3,962 | ) | (13,397 | ) | ||||
| 1,069,492 | 881,927 | |||||||
|
Less Treasury Shares At Cost (Class A – 19,270,308 and 20,907,317;
|
||||||||
|
Class B – 3,902,576 and 3,902,576)
|
(347,056 | ) | (368,411 | ) | ||||
|
Total Shareholders’ Equity
|
722,436 | 513,516 | ||||||
|
Total Liabilities and Shareholders’ Equity
|
$ | 2,316,202 | $ | 2,223,708 | ||||
|
The accompanying notes are an integral part of the consolidated financial statements.
|
||||||||
49
|
CONSOLIDATED STATEMENTS OF INCOME
|
||||||||||||
|
John Wiley & Sons, Inc., and Subsidiaries
|
For the years ended April 30
|
|||||||||||
|
Dollars in thousands, except per share data
|
2010
|
2009
|
2008
|
|||||||||
|
Revenue
|
$ | 1,699,062 | $ | 1,611,390 | $ | 1,673,734 | ||||||
|
Costs and Expenses
|
||||||||||||
|
Cost of sales
|
534,001 | 516,420 | 532,908 | |||||||||
|
Operating and administrative expenses
|
872,193 | 839,648 | 876,635 | |||||||||
|
Impairment and restructuring charges
|
15,118 | - | - | |||||||||
|
Amortization of intangibles
|
35,158 | 36,844 | 38,980 | |||||||||
|
Total Costs and Expenses
|
1,456,470 | 1,392,912 | 1,448,523 | |||||||||
|
Operating Income
|
242,592 | 218,478 | 225,211 | |||||||||
|
Interest expense
|
(32,334 | ) | (48,424 | ) | (66,738 | ) | ||||||
|
Foreign exchange losses
|
(10,883 | ) | (11,759 | ) | (2,863 | ) | ||||||
|
Interest income and other, net
|
834 | 6,180 | 5,918 | |||||||||
|
Income Before Taxes
|
200,209 | 164,475 | 161,528 | |||||||||
|
Provision for Income Taxes
|
56,666 | 36,217 | 13,992 | |||||||||
|
Net Income
|
$ | 143,543 | $ | 128,258 | $ | 147,536 | ||||||
|
Income Per Share
|
||||||||||||
|
Diluted
|
$ | 2.41 | $ | 2.15 | $ | 2.49 | ||||||
|
Basic
|
2.45 | 2.20 | 2.55 | |||||||||
|
Cash Dividends Per Share
|
||||||||||||
|
Class A Common
|
$ | 0.56 | $ | 0.52 | $ | 0.44 | ||||||
|
Class B Common
|
0.56 | 0.52 | 0.44 | |||||||||
|
Average Shares
|
||||||||||||
|
Diluted
|
59,679 | 59,610 | 59,323 | |||||||||
|
Basic
|
58,498 | 58,419 | 57,921 | |||||||||
|
The accompanying notes are an integral part of the consolidated financial statements.
|
||||||||||||
50
|
CONSOLIDATED STATEMENTS OF CASH FLOWS
|
||||||||||||
|
John Wiley & Sons, Inc., and Subsidiaries
|
For the years ended April 30
|
|||||||||||
|
Dollars in thousands
|
2010
|
2009
|
2008
|
|||||||||
|
Operating Activities
|
||||||||||||
|
Net Income
|
$ | 143,543 | $ | 128,258 | $ | 147,536 | ||||||
|
Noncash Items
|
||||||||||||
|
Amortization of intangibles
|
35,158 | 36,844 | 38,980 | |||||||||
|
Amortization of composition costs
|
47,440 | 43,767 | 43,613 | |||||||||
|
Depreciation of property, equipment and technology
|
40,281 | 35,134 | 33,330 | |||||||||
|
Impairment and restructuring charges (net of tax)
|
10,631 | - | - | |||||||||
|
Stock-based compensation
|
24,842 | 17,042 | 28,041 | |||||||||
|
Excess tax benefits from stock-based compensation
|
(7,636 | ) | (5,350 | ) | (11,223 | ) | ||||||
|
Non-cash tax benefits
|
- | - | (18,663 | ) | ||||||||
|
Reserves for returns, doubtful accounts, and obsolescence
|
18,916 | 13,355 | 6,419 | |||||||||
|
Deferred income taxes
|
9,481 | 17,141 | 10,784 | |||||||||
|
Foreign exchange transaction losses
|
10,883 | 11,759 | 2,863 | |||||||||
|
Pension expense
|
20,319 | 18,324 | 22,894 | |||||||||
|
Earned royalty advances and other
|
81,828 | 76,175 | 58,100 | |||||||||
|
Changes in Operating Assets and Liabilities
|
||||||||||||
|
Source/(Use), excluding acquisitions
|
||||||||||||
|
Accounts receivable
|
(9,004 | ) | 17,625 | (20,007 | ) | |||||||
|
Inventories
|
13,960 | (6,696 | ) | (10,038 | ) | |||||||
|
Accounts and royalties payable
|
(15,585 | ) | 8,070 | 4,421 | ||||||||
|
Deferred revenue
|
21,626 | (41,132 | ) | 10,277 | ||||||||
|
Net taxes payable/receivable
|
10,887 | 4,994 | 9,745 | |||||||||
|
Other accrued liabilities
|
15,908 | (14,416 | ) | (13,701 | ) | |||||||
|
Pension contributions
|
(48,124 | ) | (21,020 | ) | (59,360 | ) | ||||||
|
Other
|
(6,565 | ) | 1,381 | (3,876 | ) | |||||||
|
Cash Provided by Operating Activities
|
418,789 | 341,255 | 280,135 | |||||||||
|
Investing Activities
|
||||||||||||
|
Additions to product development assets
|
(155,367 | ) | (131,666 | ) | (113,069 | ) | ||||||
|
Additions to property, equipment and technology
|
(48,110 | ) | (46,009 | ) | (50,315 | ) | ||||||
|
Acquisition of other publishing businesses, assets and rights
|
(6,430 | ) | (23,960 | ) | (6,802 | ) | ||||||
|
Cash Used for Investing Activities
|
(209,907 | ) | (201,635 | ) | (170,186 | ) | ||||||
|
Financing Activities
|
||||||||||||
|
Repayment of long-term debt
|
(951,010 | ) | (618,512 | ) | (1,049,360 | ) | ||||||
|
Borrowings of long-term debt
|
777,610 | 598,594 | 891,476 | |||||||||
|
Purchase of treasury stock
|
- | (35,110 | ) | (3,679 | ) | |||||||
|
Change in book overdrafts
|
9,707 | (20,522 | ) | 36,253 | ||||||||
|
Cash dividends
|
(32,986 | ) | (30,478 | ) | (25,613 | ) | ||||||
|
Excess tax benefits from stock-based compensation
|
7,636 | 5,350 | 11,223 | |||||||||
|
Proceeds from exercise of stock options and other
|
32,625 | 11,623 | 15,190 | |||||||||
|
Cash Used for Financing Activities
|
(156,418 | ) | (89,055 | ) | (124,510 | ) | ||||||
|
Effects of Exchange Rate Changes on Cash
|
(1,779 | ) | (7,048 | ) | 2,379 | |||||||
|
Cash and Cash Equivalents
|
||||||||||||
|
Increase/(Decrease) for year
|
50,685 | 43,517 | (12,182 | ) | ||||||||
|
Balance at beginning of year
|
102,828 | 59,311 | 71,493 | |||||||||
|
Balance at end of year
|
$ | 153,513 | $ | 102,828 | $ | 59,311 | ||||||
|
Cash Paid During the Year for
|
||||||||||||
|
Interest
|
$ | 33,186 | $ | 50,108 | $ | 69,071 | ||||||
|
Income taxes, net
|
$ | 33,358 | $ | 15,942 | $ | 24,679 | ||||||
| The accompanying notes are an integral part of the consolidated financial statements. | ||||||||||||
51
|
CONSOLIDATED STATEMENTS OF SHAREHOLDERS’ EQUITY
|
|||||||
|
AND COMPREHENSIVE INCOME
|
|||||||
|
Common
Stock
Class A
|
Common
Stock
Class B
|
Additional
Paid-in
Capital
|
Retained
Earnings
|
Treasury
Stock
|
Accumulated
Other Comp-
rehensive
Income
(Loss)
|
||
|
Total
Share-
holder’s
Equity
|
|||||||
|
John Wiley & Sons, Inc., and Subsidiaries
|
|||||||
|
Dollars in thousands
|
|||||||
|
Balance at April 30, 2007
|
$69,388
|
$13,803
|
$100,013
|
$673,254
|
$(351,907)
|
$24,957
|
$529,508
|
|
Shares Issued Under Employee Benefit Plans
|
(2,665)
|
3,590
|
925
|
||||
|
Purchase of Treasury Shares
|
(3,679)
|
(3,679)
|
|||||
|
Exercise of Stock Options, including taxes
|
15,334
|
9,790
|
25,124
|
||||
|
Stock-based compensation expense
|
28,041
|
28,041
|
|||||
|
Class A Common Stock Dividends
|
(21,263)
|
(21,263)
|
|||||
|
Class B Common Stock Dividends
|
(4,350)
|
(4,350)
|
|||||
|
Other
|
254
|
(254)
|
|||||
|
Adoption of accounting standards for uncertain tax positions
|
(415)
|
(415)
|
|||||
|
Comprehensive Income:
|
|||||||
|
Net income
|
147,536
|
147,536
|
|||||
|
Foreign currency translation loss
|
(3,932)
|
(3,932)
|
|||||
|
Unamortized pension and retiree medical, net of a $1,848 tax provision
|
3,652
|
3,652
|
|||||
|
Change in unrecognized loss of interest rate swap, net of a $7,248 tax benefit
|
(12,029)
|
(12,029)
|
|||||
|
Total Comprehensive Income
|
135,227
|
||||||
|
Balance at April 30, 2008
|
$69,642
|
$13,549
|
$140,723
|
$794,762
|
$(342,206)
|
$12,648
|
$689,118
|
|
Shares Issued Under Employee Benefit Plans
|
(3,325)
|
3,209
|
(116)
|
||||
|
Purchase of Treasury Shares
|
(35,110)
|
(35,110)
|
|||||
|
Exercise of Stock Options, including taxes
|
10,152
|
5,696
|
15,848
|
||||
|
Stock-based compensation expense
|
17,042
|
17,042
|
|||||
|
Class A Common Stock Dividends
|
(25,463)
|
(25,463)
|
|||||
|
Class B Common Stock Dividends
|
(5,015)
|
(5,015)
|
|||||
|
Other
|
2
|
(2)
|
|||||
|
Comprehensive (Loss):
|
|||||||
|
Net income
|
128,258
|
128,258
|
|||||
|
Foreign currency translation loss
|
(256,314)
|
(256,314)
|
|||||
|
Unamortized pension and retiree medical, net of a $5,553 tax benefit
|
(15,165)
|
(15,165)
|
|||||
|
Change in unrecognized loss of interest rate swap, net of a $261 tax provision
|
433
|
433
|
|||||
|
Total Comprehensive (Loss):
|
(142,788)
|
||||||
|
Balance at April 30, 2009
|
$69,644
|
$13,547
|
$164,592
|
$892,542
|
$(368,411)
|
$(258,398)
|
$513,516
|
|
Shares Issued Under Employee Benefit Plans
|
(4,008)
|
5,166
|
1,158
|
||||
|
Exercise of Stock Options, including taxes
|
22,892
|
16,189
|
39,081
|
||||
|
Stock-based compensation expense
|
24,842
|
24,842
|
|||||
|
Class A Common Stock Dividends
|
(27,607)
|
(27,607)
|
|||||
|
Class B Common Stock Dividends
|
(5,379)
|
(5,379)
|
|||||
|
Other
|
62
|
(62)
|
2,530
|
2,530
|
|||
|
Comprehensive (Loss):
|
|||||||
|
Net income
|
143,543
|
143,543
|
|||||
|
Foreign currency translation gain
|
60,292
|
60,292
|
|||||
|
Unamortized pension and retiree medical, net of a $18,657 tax benefit
|
(38,975)
|
(38,975)
|
|||||
|
Change in unrecognized loss of interest rate swap, net of a $5,685 tax provision
|
9,435
|
9,435
|
|||||
|
Total Comprehensive Income:
|
174,295
|
||||||
|
Balance at April 30, 2010
|
$69,706
|
$13,485
|
$210,848
|
$1,003,099
|
$(347,056)
|
$(227,646)
|
$722,436
|
|
The accompanying notes are an integral part of the consolidated financial statements.
|
|||||||
52
Notes to Consolidated Financial Statements
Note 1 – Description of Business
The Company, founded in 1807, was incorporated in the state of New York on January 15, 1904. As used herein the term “Company” means John Wiley & Sons, Inc., and its subsidiaries and affiliated companies, unless the context indicates otherwise.
The Company is a global publisher of print and electronic products, providing content and digital solutions to customers worldwide. Core businesses include scientific, technical, medical and scholarly journals, encyclopedias, books, online products and services; professional and consumer books, subscription products, certification and training materials, online applications and websites; and educational materials in all media, including integrated online teaching and learning resources, for undergraduate, graduate and advanced placement students, educators and lifelong learners worldwide as well as secondary school students in Australia. The Company takes full advantage of its content from all three core businesses in developing and cross-marketing products to its diverse customer base of professionals, consumers, researchers, students, and educators. The use of technology enables the Company to make its content more accessible to its customers around the world. The Company maintains publishing, marketing, and distribution centers in the United States, Canada, Europe, Asia, and Australia.
Note 2 - Summary of Significant Accounting Policies
Principles of Consolidation: The consolidated financial statements include the accounts of the Company. Investments in entities in which the Company has at least a 20%, but less than a majority interest, are accounted for using the equity method of accounting. Investments in entities in which the Company has less than a 20% ownership and in which it does not exercise significant influence are accounted for using the cost method of accounting. All intercompany accounts and transactions have been eliminated in consolidation.
Use of Estimates: The preparation of the Company’s financial statements in conformity with accounting principles generally accepted in the United States requires management to make estimates and assumptions that affect the reported amounts of assets and liabilities and disclosure of contingent assets and liabilities as of the date of the financial statements and reported amounts of revenue and expenses during the reporting period. Actual results could differ from those estimates.
Book Overdrafts: Under the Company’s cash management system, a book overdraft balance exists for the Company’s primary disbursement accounts. This overdraft represents uncleared checks in excess of cash balances in individual bank accounts. The Company’s funds are transferred from other existing bank account balances or from lines of credit as needed to fund checks presented for payment. As of April 30, 2010 and April 30, 2009, book overdrafts of $41.2 million and $31.5 million, respectively, were included in Accounts and Royalties payable.
Revenue Recognition: The Company recognizes revenue when the following criteria are met: persuasive evidence that an arrangement exists; delivery has occurred or services have been rendered; the price to the customer is fixed or determinable; and collectability is reasonably assured. If all of the above criteria have been met, revenue is principally recognized upon shipment of products or when services have been rendered. Subscription revenue is generally collected in advance. The prepayment is deferred and recognized as earned when the related issue is shipped or made available online over the term of the subscription. When a product is sold with multiple deliverables, the Company accounts for each deliverable within the arrangement as a separate unit of accounting due to the fact that each deliverable is also sold on a stand-alone basis. The total consideration of a multiple-element arrangement is allocated to each unit of accounting using the relative fair value method based on the estimated selling prices of each deliverable within the arrangement. Collectability is evaluated based on the amount involved, the credit history of the customer, and the status of the customer’s account with the Company. Revenue is reported net of any amounts billed to customers for taxes which are remitted to government authorities.
53
Cash Equivalents: Cash equivalents consist of highly liquid investments with an original maturity of three months or less and are stated at cost plus accrued interest, which approximates market value.
Allowance for Doubtful Accounts: The estimated allowance for doubtful accounts is based on a review of the aging of the accounts receivable balances, historical write-off experience, credit evaluations of customers and current market conditions. A change in the evaluation of a customer’s credit could affect the estimated allowance. The allowance for doubtful accounts is shown as a reduction of accounts receivable in the Consolidated Statements of Financial Position and amounted to $6.9 million and $5.7 million as of April 30, 2010 and 2009, respectively.
Sales Return Reserves: The process which the Company uses to determine its sales returns and the related reserve provision charged against revenue is based on applying an estimated return rate to current year sales. This rate is based upon an analysis of actual historical return experience in the various markets and geographic regions in which the Company does business. The Company collects, maintains and analyzes significant amounts of sales returns data for large volumes of homogeneous transactions. This allows the Company to make reasonable estimates of the amount of future returns. All available data is utilized to identify the returns by market and as to which fiscal year the sales returns apply. This enables management to track the returns in detail and identify and react to trends occurring in the marketplace, with the objective of being able to make the most informed judgments possible in setting reserve rates. Sales return reserves, net of estimated inventory and royalty costs, are reported as a reduction of accounts receivable in the Consolidated Statements of Financial Position and amounted to $55.3 million and $55.2 million as of April 30, 2010 and 2009, respectively.
Reserve for Inventory Obsolescence: A reserve for inventory obsolescence is estimated based on a review of damaged, obsolete, or otherwise unsalable inventory. The review encompasses historical unit sales trends by title; current market conditions, including estimates of customer demand compared to the number of units currently on hand; and publication revision cycles. The inventory obsolescence reserve is reported as a reduction of the inventory balance in the Consolidated Statements of Financial Position and amounted to $39.7 million and $36.3 million as of April 30, 2010 and 2009, respectively.
Allocation of Acquisition Purchase Price to Assets Acquired and Liabilities Assumed: In connection with acquisitions, the Company allocates the cost of the acquisition to the assets acquired and the liabilities assumed based on estimates of the fair value of such items, including goodwill and other intangible assets. Such estimates include discounted estimated cash flows to be generated by those assets and the expected useful lives based on historical experience, current market trends, and synergies to be achieved from the acquisition and expected tax basis of assets acquired. For major acquisitions, the Company may use an independent appraiser to assist in the determination of such estimates.
Inventories: Inventories are carried at the lower of cost or market. U.S. book inventories aggregating $63.1 million and $73.6 million at April 30, 2010 and 2009, respectively, are valued using the last-in, first-out (LIFO) method. All other inventories are valued using the first-in, first-out (FIFO) method.
Product Development Assets: Product development assets consist of composition costs and royalty advances to authors. Costs associated with developing any publication are expensed until the product is determined to be commercially viable. Composition costs represent the costs incurred to bring an edited commercial manuscript to publication, which include typesetting, proofreading, design and illustration costs. Composition costs are capitalized and are generally amortized on a double-declining basis over their estimated useful lives, ranging from 1 to 3 years. Royalty advances to authors are capitalized and, upon publication, are recovered as royalties earned by the authors based on sales of the published works. Royalty advances are reviewed for recoverability and a reserve for loss is maintained, if appropriate.
54
Advertising Expense: Advertising costs are expensed as incurred. The Company incurred $26.0 million, $28.6 million and $34.1 million in advertising costs in fiscal years 2010, 2009 and 2008, respectively.
Property, Equipment and Technology: Property, equipment and technology is recorded at cost. Major renewals and improvements are capitalized, while maintenance and repairs are expensed as incurred.
Costs incurred for computer software developed or obtained for internal use are capitalized during the application development stage and expensed as incurred during the preliminary project and post-implementation stages. Costs incurred during the application development stage include costs of materials and services, and payroll and payroll-related costs for employees who are directly associated with the software project. Such costs are amortized over the expected useful life of the related software generally 3 to 6 years. Maintenance, training, and upgrade costs that do not result in additional functionality are expensed as incurred.
Property, equipment and technology is depreciated using the straight-line method based upon the following estimated useful lives: Buildings Leases and Leasehold Improvements – the lessor of the estimated useful life of the asset up to 40 years or the duration of the lease; Furniture and Fixtures - 3 to 10 years; Computer Hardware and Software - 3 to 6 years.
Goodwill and Intangible Assets: Goodwill is the excess of the purchase price paid over the fair value of the net assets of the business acquired. Intangible assets principally consist of brands, trademarks, acquired publication rights, customer relationships and non-compete agreements. Goodwill and indefinite-lived intangible assets are not amortized but are reviewed annually for impairment, or more frequently if events or changes in circumstances indicate the asset might be impaired. The Company evaluates the recoverability of indefinite-lived intangible assets by comparing the fair value of the intangible asset to its carrying value.
To evaluate the recoverability of goodwill, the Company uses a two-step impairment test approach at the reporting unit level. In the first step, the estimated fair value of the entire reporting unit is compared to its carrying value including goodwill. If the fair value of the reporting unit is less than the carrying value, a second step is performed to determine the charge for goodwill impairment. In the second step, the Company determines an implied fair value of the reporting unit’s goodwill by determining the fair value of the individual assets and liabilities (including any previous unrecognized intangible assets) of the reporting unit other than goodwill. The resulting implied fair value of the goodwill is compared to the carrying amount and an impairment charge is recognized for the difference.
Finite-lived intangible assets are amortized over their estimated useful lives. The most significant factors in determining the estimated life of these intangibles is the history and longevity of the brands, trademarks or titles acquired, combined with the strength of cash flows. Acquired publishing rights that have an indefinite life are typically characterized by intellectual property with a long and well-established revenue stream resulting from strong and well-established imprint/brand recognition in the market.
Acquired publication rights, trademarks, customer relationships and brands with finite lives are amortized on a straight-line basis over periods ranging from 5 to 40 years. Non-compete agreements are amortized over the terms of the individual agreement, generally up to 3 years.
55
Impairment of Long-Lived Assets including finite intangible assets: Depreciable and amortizable assets are only evaluated for impairment upon a significant change in the operating or macroeconomic environment. In these circumstances, if an evaluation of the current forecasts of undiscounted cash flows indicates impairment, the asset is written down to its estimated fair value based on the discounted future cash flows.
Derivative Financial Instruments: The Company, from time to time, enters into forward exchange and interest rate swap contracts as a hedge against foreign currency asset and liability commitments, changes in interest rates and anticipated transaction exposures, including intercompany purchases. The Company accounts for its derivative instruments in accordance with ASC 815, “Derivatives and Hedging” (“ASC 815”). Accordingly, all derivatives are recognized as assets or liabilities and measured at fair value. Derivatives that are not determined to be effective hedges are adjusted to fair value with a corresponding effect on earnings. The Company does not use financial instruments for trading or speculative purposes.
Foreign Currency Gains/Losses: The Company maintains operations in many non-U.S. locations. Assets and liabilities are translated into U.S. dollars using end of period exchange rates and revenues and expense are translated into U.S. dollars using weighted average rates. Foreign currency translation adjustments are accumulated and reported as a separate component of Accumulated Other Comprehensive Loss within Shareholders’ Equity. The Company’s significant investments in non-U.S. businesses are exposed to foreign currency risk. During fiscal year 2010, the Company recorded $60.3 million of foreign currency translation gains primarily due to the weakening of the U.S. dollar relative to the British pound sterling. Foreign currency transaction gains or losses are recognized in the Consolidated Statements of Income as incurred.
Share-Based Compensation: The Company recognizes share-based compensation expenses based on the fair value of the share-based awards on the grant date, reduced by an estimate for future forfeited awards. As such, share-based compensation expense is only recognized for those awards that are expected to ultimately vest. The fair value of share-based awards is recognized in net income on a straight-line basis over the requisite service period. Share-based compensation expense associated with performance-based stock awards is determined based upon actual results compared to targets established three years in advance. The cumulative effect on current and prior periods of a change in the estimated number of performance share awards, or estimated forfeiture rate is recognized as an adjustment to earnings in the period of the revision.
Recently Issued Accounting Standards: In June 2009, the FASB issued the ASC which has become the single source of accounting principles generally accepted in the United States (“GAAP”) recognized by the FASB in the preparation of financial statements. The ASC does not supersede the rules or regulations of the Securities and Exchange Commission (“SEC”), therefore, the rules and interpretive releases of the SEC continue to be additional sources of GAAP for the Company. The Company adopted the ASC as of August 1, 2009 and has replaced all FASB references with ASC references. The ASC does not change GAAP and did not have an effect on the Company’s consolidated financial statements.
In September 2006, the FASB issued guidance which is included in ASC 820, “Fair Value Measurements and Disclosures” (“ASC 820”). ASC 820 provides a single authoritative definition of fair value and provides enhanced guidance for measuring the fair value of assets and liabilities and requires additional disclosures related to the extent to which companies measure assets and liabilities at fair value, the information used to measure fair value, and the effect of fair value measurements on earnings. In February 2008, the FASB agreed to a one-year delay of the fair value measurement requirement for certain nonfinancial assets and liabilities. The Company adopted ASC 820 as of May 1, 2008 for assets and liabilities not subject to the deferral and as of May 1, 2009 for those nonfinancial assets and liabilities subject to the deferral. The adoption did not have a significant impact on the Company’s consolidated financial statements or disclosures.
56
In December 2007, the FASB issued guidance which is included in ASC 805 “Business Combinations” (“ASC 805”) and is effective for acquisitions made on or after May 1, 2009. ASC 805 expands the scope of acquisition accounting to all transactions under which control of a business is obtained. Principally, ASC 805 requires that contingent consideration be recorded at fair value on the acquisition date and that certain transaction and restructuring costs be expensed. The Company adopted ASC 805 as of May 1, 2009 and is now accounting for all acquisitions made after the effective date under the standard.
In March 2008, the FASB issued guidance which is included in ASC 815 “Derivatives and Hedging” (“ASC 815”). The guidance amends and expands the disclosure requirements of ASC 815, to provide an enhanced understanding of the use of derivative instruments, how they are accounted for under ASC 815, and their effect on financial position, financial performance and cash flows. The Company adopted the disclosure guidance in the first quarter of fiscal year 2010.
In April 2008, the FASB issued guidance which is included in ASC 350 “Intangibles – Goodwill and Other” (“ASC 350”). The guidance in ASC 350 amends the factors that must be considered in developing renewal or extension assumptions used to determine the useful life over which to amortize the cost of a recognized intangible asset under ASC 350. The guidance requires an entity to consider its own experience with the renewal or extension of the terms of a contractual arrangement, consistent with its expected use of the asset. The guidance also requires several incremental disclosures for renewable intangible assets. Application of this standard will not significantly impact the process previously used by the Company to determine the useful life of intangible assets. The Company adopted the guidance as of May 1, 2009 and is applying the guidance to intangible assets acquired after the effective date.
In December 2008, the FASB issued guidance which is included in ASC 715 “Compensation – Retirement Benefits” to require additional disclosures about assets held in an employer’s defined benefit pension and other postretirement plans. The new disclosures are to provide an understanding of how investment allocations decisions are made, the major categories of plan assets, the inputs and valuation techniques used to measure the fair value of plan assets, the effect of fair value measurements using significant unobservable inputs on changes in plan assets for the period, and significant concentrations of risk within plan assets. The Company adopted the disclosure guidance as of April 30, 2010.
In May 2009, the FASB issued guidance which is included in ASC 855 “Subsequent Events” (“ASC 855”). ASC 855 establishes general standards of accounting for and disclosure of events that occur after the balance sheet date but before the financial statements are issued or are available to be issued. Although the standard is based on the same principles as those that previously existed for subsequent events, it included a new required disclosure of the date through which an entity has evaluated subsequent events. The Company adopted the guidance in the first quarter of fiscal year 2010 and the adoption did not have a significant impact on the Company’s consolidated financial statements. We have evaluated subsequent events through the date that the financial statements are issued.
In August 2009, the FASB issued Accounting Standards Update (“ASU”) 2009-05, “Fair Value Measurements and Disclosures (Topic 820): Measuring Liabilities at Fair Value” ("ASU 2009-05"). ASU 2009-05 provides clarification to entities that measure liabilities at fair value under circumstances where a quoted price in an active market is not available. The Company adopted ASU 2009-05 as of November 1, 2009. The adoption did not have a significant impact on the Company’s consolidated financial statements.
57
In October 2009, the FASB issued ASU 2009-13 “Revenue Recognition (Topic 605): Multiple-Deliverable Revenue Arrangements” (“ASU 2009-13”). ASU 2009-13 addresses the accounting for multiple-deliverable arrangements to enable vendors to account for products and services separately rather than as a combined unit. Specifically, this guidance amends the existing criteria for separating consideration received in multiple-deliverable arrangements, eliminates the residual method of allocation and requires that arrangement consideration be allocated at the inception of the arrangement to all deliverables using the relative selling price method. The guidance also establishes a hierarchy for determining the selling price of a deliverable, which is based on vendor-specific objective evidence; third-party evidence; or management estimates. Expanded disclosures related to the Company’s multiple-deliverable revenue arrangements will also be required. The new guidance is effective for revenue arrangements entered into or materially modified on and after May 1, 2011. The Company does not expect the application of this new standard to have a significant impact on its consolidated financial statements.
In January 2010, the FASB issued ASU 2010-06, “Fair Value Measurements and Disclosures (Topic 820): Improving Disclosures about Fair Value Measurements” (“ASU 2010-06”). ASU 2010-06 provides amendments to ASC 820 by requiring new disclosures for transfers in and out of Levels 1 and 2 of the fair value measurement hierarchy, and expands disclosures related to activity in Level 3 fair value measurements. ASU 2010-06 also clarifies existing disclosures on the level of detail required for assets and liabilities measured at fair value from their respective line items on the statement of financial position, and the valuation techniques and inputs used in fair value measurements that fall within Level 2 or Level 3 of the fair value hierarchy. ASU 2010-06 is effective for the Company as of May 1, 2010. Since the revised guidance only requires additional disclosures about the Company’s fair value measurements, its adoption will not affect the Company’s financial position or results of operations.
There have been no other new accounting standards issued that have had, or are expected to have a material impact on the Company’s consolidated financial statements.
Note 3 – Reconciliation of Weighted Average Shares Outstanding
A reconciliation of the shares used in the computation of net income per share for the years ended April 30 follows (in thousands):
|
2010
|
2009
|
2008
|
|
|
Weighted Average Shares Outstanding
|
58,897
|
58,665
|
58,193
|
|
Less: Unearned Restricted Shares
|
(399)
|
(246)
|
(272)
|
|
Shares Used for Basic Income Per Share
|
58,498
|
58,419
|
57,921
|
|
Dilutive Effect of Stock Options and Other Stock Awards
|
1,181
|
1,191
|
1,402
|
|
Shares Used for Diluted Income Per Share
|
59,679
|
59,610
|
59,323
|
For the years ended April 30, 2010, 2009, and 2008, options to purchase Class A Common Stock of 1,714,089, 2,210,837 and 1,591,593 respectively, have been excluded from the shares used for diluted income per share as their inclusion would have been antidilutive. In addition, for the years ended April 30, 2010, 2009 and 2008, unearned restricted shares of 14,128, 24,250 and 19,000 have been excluded as their inclusion would have been antidilutive.
Note 4 – Significant Acquisitions
Fiscal Year 2009:
On June 12, 2008, the Company acquired the publishing rights to a list of business and modern language textbooks and learning materials. The cost of acquisition was principally allocated to acquired publication rights of the Higher Education business and is being amortized over a 20-year period.
58
Fiscal Year 2008:
The Company entered into a contract with Microsoft to develop, publish, and deliver Microsoft Official Academic Curriculum (MOAC) textbooks and e-learning tools to the higher education markets. The Company recorded amounts due under the Microsoft agreement which were primarily allocated to acquired publication rights and are being amortized over the life of the contract.
Note 5 – Inventories
Inventories at April 30 were as follows (in thousands):
|
2010
|
2009
|
|
|
Finished Goods
|
$86,355
|
$97,013
|
|
Work-in-Process
|
7,566
|
9,507
|
|
Paper, Cloth, and Other
|
7,434
|
9,002
|
|
101,355
|
115,522
|
|
|
LIFO Reserve
|
(3,498)
|
(4,255)
|
|
Total Inventories
|
$97,857
|
$111,267
|
Note 6 – Product Development Assets
Product development assets consisted of the following at April 30 (in thousands):
|
2010
|
2009
|
|
|
Composition Costs
|
$52,274
|
$46,686
|
|
Royalty Advances
|
55,481
|
42,976
|
|
Total
|
$107,755
|
$89,662
|
Composition costs are net of accumulated amortization of $130.0 million and $107.6 million as of April 30, 2010 and 2009, respectively.
Note 7 - Property, Equipment and Technology
Property, equipment and technology consisted of the following at April 30 (in thousands):
|
2010
|
2009
|
|
|
Land and Land Improvements
|
$4,038
|
$3,860
|
|
Buildings and Leasehold Improvements
|
88,440
|
83,618
|
|
Furniture, Fixtures and Warehouse Equipment
|
70,434
|
67,095
|
|
Computer Hardware and Capitalized Software
|
296,750
|
259,999
|
|
459,662
|
414,572
|
|
|
Accumulated Depreciation
|
(306,978)
|
(273,376)
|
|
Total
|
$152,684
|
$141,196
|
The net book value of capitalized software costs was $61.9 million and $45.7 million as of April 30, 2010 and 2009, respectively. Depreciation expense recognized in 2010, 2009, and 2008 for capitalized software costs was approximately $18.4 million, $14.5 million, and $11.9 million, respectively.
59
Note 8 - Goodwill and Intangible Assets
The following table summarizes the activity in goodwill by segment (in thousands):
|
As of April
30, 2009
|
Foreign Translation
|
As of April
30, 2010
|
|
|
STMS
|
$432,418
|
24,573
|
$456,991
|
|
P/T
|
157,575
|
913
|
158,488
|
|
Total
|
$589,993
|
25,486
|
$615,479
|
Intangible assets as of April 30, 2010 and 2009 were as follows (in thousands):
|
2010
|
2009
|
|||||
|
Cost
|
Accumulated
Amortization
|
Cost
|
Accumulated Amortization
|
|||
|
Intangible Assets with Determinable Lives
|
||||||
|
Acquired Publishing Rights
|
$762,727
|
$(184,587)
|
$723,702
|
$(153,917)
|
||
|
Brands & Trademarks
|
16,094
|
(5,776)
|
16,034
|
(4,613)
|
||
|
Covenants not to Compete
|
2,290
|
(2,036)
|
2,240
|
(1,571)
|
||
|
Customer Relationships
|
61,923
|
(10,597)
|
60,481
|
(7,585)
|
||
|
843,034
|
(202,996)
|
802,457
|
(167,686)
|
|||
|
Intangible Assets with Indefinite Lives
|
||||||
|
Acquired Publishing Rights
|
101,891
|
-
|
120,771
|
-
|
||
|
Brands & Trademarks
|
169,621
|
-
|
163,833
|
-
|
||
|
$1,114,546
|
$(202,996)
|
$1,087,061
|
$(167,686)
|
|||
The change in intangible assets at April 30, 2010 compared to April 30, 2009 is primarily due to foreign exchange translation, amortization expense and the impairment of GIT Verlag as discussed in Note 9.
Based on the current amount of intangible assets subject to amortization and assuming current exchange rates, the estimated amortization expense for each of the succeeding 5 fiscal years are as follows: 2011 - $35.7 million; 2012 - $34.7 million; 2013 - $32.5 million; 2014 - $31.4 million; and 2015 - $31.2 million.
Note 9 - Impairment and Restructuring Charges
In fiscal year 2010, the Company recognized intangible asset impairment and restructuring charges of $15.1 million, which impacted diluted earnings per share by $0.17. These changes are reflected in the Impairment and Restructuring Charges line item in the Consolidated Statements of Income and are described in more detail below.
Impairment Charges
GIT Verlag, a business-to-business German-language controlled circulation magazine business, was acquired by the Company in 2002. As part of a strategic review of certain non-core businesses within the STMS reporting segment, the Company considered alternatives for GIT Verlag during fiscal year 2010 due to the economic outlook for the print advertising business in German language publishing. As a result of the review, the Company performed an impairment test on the intangible assets related to GIT Verlag which resulted in an $11.5 million pre-tax impairment charge in fiscal year 2010. This impairment charge reduced the carrying value of the acquired publication rights of GIT Verlag, which was classified as an indefinite-lived intangible asset, to its fair value of $7.7 million. Concurrent with the strategic review and impairment, the Company has classified the remaining acquired publication rights as a finite-lived intangible asset which is being amortized over a 10 year period. The Company also identified a similar decline in the economic outlook for three smaller business-to-business controlled circulation advertising magazines. An impairment test on the intangible assets associated with those magazines resulted in an additional $0.9 million pre-tax impairment charge in fiscal year 2010 that reduced the intangible assets carrying values of these magazines to their fair value of $0.5 million.
60
The fair values of the intangible assets mentioned in the preceding paragraphs were determined using the income approach with a discounted cash flow technique. This technique relies upon Level 3 inputs (unobservable), which reflect use of the best available internal information, and also represents assumptions the Company believes other market participants would utilize in performing this valuation. These inputs primarily include the discount rate, estimated future financial performance, and an assumed residual value for the business. Determining these inputs requires the Company’s management to make a number of judgments about assumptions and estimates that are highly subjective. The Company determined the discount rate based on an estimate of a reasonable risk-adjusted return an investor would expect to realize on an investment in this business. Estimates of future financial performance include future sales growth rates based on the Company’s knowledge of the business and operating cost inflation rates.
Restructuring Charges
After considering a number of strategic alternatives for the GIT Verlag business, the Company implemented a restructuring plan in fiscal year 2010 which will reduce certain staff levels and the number of magazines published. As a result, the Company recorded a pre-tax restructuring charge of approximately $1.6 million within the STMS reporting segment in fiscal year 2010 for GIT Verlag severance costs.
The Company recorded severance costs of $1.1 million related to offshoring and outsourcing certain central marketing and content management activities to Singapore and other countries in Asia. The charges related to offshoring are expected to be fully recovered within 18 months from implementation as a result of lower operating expenses.
As of April 30, 2010, accrued severance of approximately $2.5 million is reflected in the Other Accrued Liabilities line item in the Consolidated Statements of Financial Position. The balance reflects $2.7 million in pre-tax restructuring charges described above, partially offset by severance payments of $0.1 million and foreign currency translation adjustments of $0.1 million. Payments to be made under the restructuring plans are expected to be completed by January 31, 2011.
61
Note 10 - Income Taxes
The provision for income taxes for the years ending April 30 were as follows (in thousands):
|
2010
|
2009
|
2008
|
|
|
Current Provision
|
|||
|
US – Federal
|
$19,976
|
$7,795
|
$9,397
|
|
International
|
25,460
|
10,006
|
10,088
|
|
State and Local
|
1,749
|
1,275
|
2,386
|
|
Total Current Provision
|
$47,185
|
$19,076
|
$21,871
|
|
Deferred Provision (Benefit)
|
|||
|
US – Federal
|
$5,536
|
$7,520
|
$5,183
|
|
International
|
3,286
|
8,619
|
(13,414)
|
|
State and Local
|
659
|
1,002
|
352
|
|
Total Deferred Provision
|
$9,481
|
$17,141
|
$(7,879)
|
|
Total Provision
|
$56,666
|
$36,217
|
$13,992
|
International and United States pretax income for the year ended April 30 was as follows (in thousands):
|
2010
|
2009
|
2008
|
|
|
International
|
$133,088
|
$107,013
|
$122,369
|
|
United States
|
67,121
|
57,462
|
39,159
|
|
Total
|
$200,209
|
$164,475
|
$161,528
|
The Company’s effective income tax rate as a percentage of pretax income differed from the U.S. federal statutory rate as shown below:
|
2010
|
2009
|
2008
|
|
|
U.S. Federal Statutory Rate
|
35.0%
|
35.0%
|
35.0%
|
|
State Income Taxes, Net of U.S. Federal Tax Benefit
|
0.8
|
0.9
|
1.2
|
|
Benefit from Lower Taxes Non-US Jurisdictions
|
(8.9)
|
(11.2)
|
(14.2)
|
|
Deferred Tax Benefit From Statutory Tax Rate Change
|
-
|
-
|
(11.6)
|
|
Other, including Interest on Tax Reserves
|
1.4
|
(2.7)
|
(1.7)
|
|
Effective Income Tax Rate
|
28.3%
|
22.0%
|
8.7%
|
Deferred Tax Benefit from Statutory Tax Rate Change: In fiscal year 2008 the Company recognized tax benefits in the amount of $18.7 million associated with new tax laws enacted in the United Kingdom and Germany that reduced the corporate income tax rate from 30% to 28% and from 39% to 29%, respectively. The benefit recognized by the Company reflected the adjustment to record the U.K. and Germany related deferred tax balances at the new tax rates.
Other, including Interest on Tax Reserves: In fiscal years 2009 and 2008 the Company reported tax benefits of $3.3 million and $3.9 million, respectively, related to the favorable resolution of certain federal, state and foreign tax matters.
62
Accounting for Uncertainty in Income Taxes:
On May 1, 2007, the Company adopted the provisions that are included in ASC 740, “Income Taxes” (“ASC 740”), which prescribe a recognition threshold and measurement attributes for financial statement recognition of income taxes.
Upon adoption, the Company recognized a $0.4 million increase to reserves for income taxes, with a corresponding decrease of $0.4 million in retained earnings. As of April 30, 2010 and April 30, 2009, the total amount of unrecognized tax benefits were $37.6 million and $30.4 million, respectively, of which $6.8 million and $5.4 million represented reserves for interest and penalties that were recorded as additional tax expense in accordance with the Company’s accounting policy. The net interest and penalties charged to tax expense in fiscal year 2010 and 2009 were $1.4 million and $0.7 million, respectively. As of April 30, 2010 and April 30, 2009, the total amount of unrecognized tax benefits that, if recognized, would reduce the Company’s income taxes was approximately $34.5 million and $27.8 million, respectively. The Company does not expect any significant change to the unrecognized tax benefits within the next year.
The Company files income tax returns in the U.S. and various states and non-U.S. tax jurisdictions. The Company’s major taxing jurisdictions include the United States, the United Kingdom and Germany. Other than the Company’s German subsidiaries, the Company is no longer subject to income tax examinations by tax jurisdictions for years prior to its 2005 fiscal year. With respect to Germany, all years including fiscal year 2003 forward remain subject to an income tax examination. All U.S. federal tax years prior to fiscal year 2004 have been audited by the Internal Revenue Service and closed. The statute of limitations in the U.S. for fiscal year 2004 and fiscal 2005 expired during January 2008 and January 2009 respectively. The Company is currently under an audit examination in Germany for years 2003 through 2007 and in the United States for the years 2006 through 2009.
A reconciliation of the beginning and ending amount of unrecognized tax benefits for the years ended April 30 were as follows (in thousands):
|
2010
|
2009
|
|
|
Balance at the Beginning of Year
|
$30,368
|
$32,432
|
|
Additions for Current Year Tax Positions
|
1,476
|
944
|
|
Additions for Prior Year Tax Positions
|
5,961
|
1,550
|
|
Reductions of Prior Year Tax Positions
|
(310)
|
(3,319)
|
|
Cumulative Translation Adjustment
|
403
|
(678)
|
|
Reductions for Lapse of Statute of Limitations
|
(286)
|
(561)
|
|
Balance at the End of Year
|
$37,612
|
$30,368
|
63
Deferred taxes result from temporary differences in the recognition of revenue and expense for tax and financial reporting purposes. It is more likely than not that the results of future operations will generate sufficient taxable income to realize the deferred tax assets. The significant components of deferred tax assets and liabilities at April 30 were as follows (in thousands):
|
2010
|
2009
|
|
|
Net Operating Loss
|
$6,355
|
$2,750
|
|
Reserve for Sales Returns and Doubtful Accounts
|
9,054
|
9,551
|
|
Inventory
|
(5,151)
|
(6,140)
|
|
Accrued Expenses
|
8,066
|
7,572
|
|
Accrued Employee Compensation
|
29,982
|
27,288
|
|
Retirement and Post-Employment Benefits
|
37,512
|
24,412
|
|
Intangible and Fixed Assets
|
(248,993)
|
(230,928)
|
|
Net Deferred Tax (Liabilities) Assets
|
$(163,175)
|
$(165,495)
|
The Company intends to continue to reinvest earnings outside the U.S. for the foreseeable future and, therefore, has not recognized U.S. tax expense on non-U.S. earnings. At April 30, 2010, the undistributed earnings of international subsidiaries approximated $282 million. The related tax cost, if the earnings were remitted, cannot be reasonably determined.
Note 11 - Debt and Available Credit Facilities
Debt and available credit facilities consisted of the following as of April 30, 2010 and 2009 (in thousands):
|
2010
|
2009
|
|
|
Revolving Credit Facility – Due 2012
|
$114,000
|
$219,400
|
|
Term Loan – Due 2011 - 2013
|
535,000
|
603,000
|
|
Total Debt
|
649,000
|
822,400
|
|
Less: Current Portion
|
(90,000)
|
(67,500)
|
|
Total Long-Term Debt
|
$559,000
|
$754,900
|
In connection with the Blackwell acquisition, the Company entered into a new Credit Agreement with Bank of America and Royal Bank of Scotland as Co-Lead Arrangers in the aggregate amount of $1.35 billion. The financing was comprised of a six-year Term Loan (Term Loan) in the amount of $675 million and a $675 million five-year revolving credit facility (Revolver) which can be drawn in multiple currencies. The agreement provides financing to complete the acquisition, refinance the existing revolving debt of the Company, as well as meet future seasonal operating cash requirements. The Company has the option of borrowing at the following floating interest rates: (i) at the rate as announced from time to time by Bank of America as its prime rate or (ii) at a rate based on the London Bank Interbank Offered Rate (LIBOR) plus an applicable margin ranging from .37% to 1.05% for the Revolver and .45% to 1.25% for the Term Loan depending on the Company’s consolidated leverage ratio, as defined. In addition, the Company will pay a facility fee ranging from .08% to .20% on the Revolver depending on the Company’s consolidated leverage ratio, as defined. The total of the applicable margin and facility fee at both April 30, 2010 and 2009 were .50% and .63%, respectively. The Term loan has quarterly mandatory principle payments ranging from zero to $33.8 million. For the fiscal years ending April 30, 2010 and 2009, these payments were $68.0 million and $45.0 million, respectively. The final amount due at maturity in 2013 is $231.3 million. The Company has the option to request an increase of up to $250 million in the size of the Revolver in minimum amounts of $50 million. The Term Loan matures on February 2, 2013 and the Revolver will terminate on February 2, 2012.
64
The credit agreements contain certain restrictive covenants related to Leverage Ratio, Fixed Charge coverage ratio, property, equipment and technology expenditures, and restricted payments, including a limitation for dividends paid and share repurchases. Under the most restrictive covenant, approximately $106 million was available for such restricted payments as of April 30, 2010.
The Company and its subsidiaries have other short-term lines of credit aggregating $11 million at various interest rates. No borrowings under the credit lines were outstanding at April 30, 2010 or 2009.
The Company’s total available lines of credit as of April 30, 2010 were approximately $1.2 billion, of which approximately $572 million was unused. The weighted average interest rates on long term debt outstanding during fiscal years 2010 and 2009 were 3.70% and 5.02%, respectively. As of April 30, 2010 and 2009, the weighted average interest rates for the long-term debt were 3.13% and 4.11% respectively. Based on estimates of interest rates currently available to the Company for loans with similar terms and maturities, the fair value of amounts outstanding under the Credit Agreement approximate the carrying value.
Total debt maturing in each of the next three years are: 2011 – $90.0 million; 2012 – $226.5 million; 2013 – $332.5 million.
Note 12 – Derivative Instruments and Hedging Activities
The Company, from time to time, enters into forward exchange and interest rate swap contracts as a hedge against foreign currency asset and liability commitments, changes in interest rates and anticipated transaction exposures, including intercompany purchases. All derivatives are recognized as assets or liabilities and measured at fair value. Derivatives that are not determined to be effective hedges are adjusted to fair value with a corresponding effect on earnings. The Company does not use financial instruments for trading or speculative purposes.
The Company had approximately $649.0 million of variable rate loans outstanding at April 30, 2010, which approximated fair value. The Company maintains two interest rate swap agreements that are designated as cash flow hedges as defined under ASC 815 “Derivatives and Hedging” (“ASC 815”). As of April 30, 2010, these swap agreements have been evaluated as being fully effective. As a result, there is no impact on the Company’s Consolidated Statements of Income for changes in the fair value of the interest rate swap. Under ASC 815, fully effective derivative instruments that are designated as cash flow hedges have changes in their fair value recorded initially within Accumulated Other Comprehensive Income on the Consolidated Statements of Financial Position. As interest expense is recognized based on the variable rate loan agreements, the corresponding deferred gain or loss on the interest rate swaps is reclassified from Accumulated Other Comprehensive Income to Interest Expense in the Consolidated Statements of Income.
On February 16, 2007 the Company entered into an interest rate swap agreement which fixed variable interest due on a portion of its term loan (“Term Loan”). Under the terms of the agreement, the Company pays a fixed rate of 5.076% and receives a variable rate of interest based on three month LIBOR (as defined) from the counter party which is reset every three months for a four-year period ending February 8, 2011. The notional amount of the rate swap was initially $660 million, which will decline through February 8, 2011, based on the expected amortization of the Term Loan. As of April 30, 2010 and 2009, the notional amount was $200 million and $400 million, respectively. On October 19, 2007 the Company entered into an additional interest rate swap agreement which fixed a portion of the variable interest due on its revolving credit facility (“Revolving Credit Facility”). Under the terms of this interest rate swap, the Company pays a fixed rate of 4.60% and receives a variable rate of interest based on three month LIBOR (as defined) from the counterparty which is reset every three months for a three-year period ending August 8, 2010. As of April 30, 2010 and 2009, the notional amount of the rate swap was $100 million. It is management’s intention that the notional amount of interest rate swaps be less than the Term Loan and the Revolving Credit Facility outstanding during the life of the derivatives.
65
The Company records the fair value of its interest rate swaps on a recurring basis using Level 2 inputs of quoted prices for similar assets or liabilities in active markets. The fair value of the interest rate swaps as of April 30, 2010 and 2009 was a net deferred loss of $11.5 million and $28.2 million, respectively. As of April 30, 2010, the deferred loss was recorded in Other Accrued Liabilities on the Consolidated Statements of Financial Position. As of April 30, 2009, the deferred loss was fully recorded within Other Long-Term Liabilities based on the maturity dates of the contracts. Losses that have been reclassified from Accumulated Other Comprehensive Income into Interest Expense for fiscal years 2010, 2009 and 2008 were $20.4 million, $17.4 and $2.2 million, respectively. Based on the amount in Accumulated Other Comprehensive Income at April 30, 2010, approximately $4.0 million, net of tax, of unrecognized loss would be reclassified into net income in the next twelve months.
During fiscal year 2010, the Company entered into certain forward exchange contracts to manage the Company’s exposure on certain foreign currency denominated intercompany loans. Foreign currency denominated assets and liabilities are remeasured at spot rates in effect on the balance sheet date, with the effects of changes in spot rates reported in Foreign Exchange Gains (Losses) on the Consolidated Statements of Income. The Company did not designate its forward exchange contracts as hedges under current accounting standards as the benefits of doing so were not material due to the short-term nature of the contracts. Therefore, the forward exchange contracts were marked to market through Foreign Exchange Gains (Losses) on the Consolidated Statements of Income, and were carried at their fair value on the Consolidated Statements of Financial Position. Accordingly, fair value changes in the forward exchange contracts substantially mitigated the changes in the value of the remeasured foreign currency denominated intercompany loans attributable to changes in foreign currency exchange rates. The Company measured the forward exchange contracts on a recurring basis using Level 2 inputs. The losses recognized on the forward contracts in fiscal year 2010 were $2.0 million, and were substantially offset by the foreign exchange gains recognized on the economically hedged foreign currency denominated assets and liabilities. As of April 30, 2010, the Company had settled its forward exchange contracts and had no remaining open forward contracts. The Company did not enter into any forward exchange contracts during fiscal year 2009.
Note 13 - Commitments and Contingencies
The following schedule shows the composition of rent expense for operating leases (in thousands):
|
2010
|
2009
|
2008
|
|
|
Minimum Rental
|
$37,261
|
$37,561
|
$36,002
|
|
Less: Sublease Rentals
|
(1,709)
|
(1,828)
|
(1,624)
|
|
Total
|
$35,552
|
$35,733
|
$34,378
|
Future minimum payments under operating leases were $238.6 million at April 30, 2010. Annual minimum payments under these leases for fiscal years 2011 through 2015 are approximately $34.0 million, $31.2 million, $27.9 million, $27.5 million, and $27.3 million, respectively. Rent expense associated with operating leases that include scheduled rent increases and tenant incentives, such as rent holidays, are recorded on a straight-line basis over the term of the lease.
66
The Company is involved in routine litigation in the ordinary course of its business. In the opinion of management, the ultimate resolution of all pending litigation will not have a material effect upon the financial condition or results of operations of the Company.
Note 14 - Retirement Plans
The Company and its principal subsidiaries have contributory and noncontributory retirement plans that cover substantially all employees. The plans generally provide for employee retirement between the ages of 60 and 65, and benefits based on length of service and compensation, as defined.
The Company recognizes the overfunded or underfunded status of defined benefit postretirement plans, measured as the difference between the fair value of plan assets and the projected benefit obligation, in the Consolidated Statements of Financial Position. The change in the funded status of the plan is recognized within Accumulated Other Comprehensive Income. Plan assets and obligations are measured as of the Company’s balance sheet date.
The amounts in Accumulated Other Comprehensive Income that are expected to be recognized as components of net periodic benefit cost during the next fiscal year are as follows (in thousands):
|
Funded
|
Unfunded
|
Total
|
|
|
Actuarial Loss
|
$5,863
|
$1,065
|
$6,928
|
|
Prior Service Cost
|
348
|
353
|
701
|
|
Total
|
$6,211
|
$1,418
|
$7,629
|
The Company has agreements with certain officers and senior management that provide for the payment of supplemental retirement benefits during each of the 10 years after the termination of employment. Under certain circumstances, including a change of control as defined, the payment of such amounts could be accelerated on a present value basis.
Net pension expense detailed below includes approximately $8.2 million, $7.4 million and $13.2 million for plans outside of the United States for fiscal years 2010, 2009 and 2008, respectively. The components of net pension expense for the defined benefit plans were as follows (in thousands):
|
2010
|
2009
|
2008
|
|
|
Service Cost
|
$11,095
|
$13,835
|
$19,639
|
|
Interest Cost
|
24,055
|
22,715
|
22,030
|
|
Expected Return on Plan Assets
|
(19,468)
|
(21,470)
|
(22,443)
|
|
Net Amortization of Prior Service Cost and Transition Asset
|
861
|
589
|
608
|
|
Recognized Net Actuarial Loss
|
3,776
|
2,654
|
3,060
|
|
Net Pension Expense
|
$20,319
|
$18,323
|
$22,894
|
67
The weighted-average assumptions used to determine net pension expense for the years ended April 30 were as follows:
|
2010
|
2009
|
2008
|
|
|
Discount Rate
|
7.1%
|
6.3%
|
5.7%
|
|
Rate of Compensation Increase
|
4.2%
|
4.3%
|
4.6%
|
|
Expected Return on Plan Assets
|
7.4%
|
7.4%
|
7.6%
|
The projected benefit obligation, accumulated benefit obligation, and fair value of plan assets for the retirement plans with accumulated benefit obligations in excess of plan assets were $205.6 million, $190.9 million, and $119.3 million, respectively, as of April 30, 2010, and $153.8 million, $144.5 million and $70.5 million, respectively, as of April 30, 2009.
68
The following table sets forth the changes in and the status of the plans’ assets and benefit obligations. The unfunded plans relate primarily to a non-U.S. subsidiary, which is governed by local statutory requirements, and the domestic supplemental retirement plans for certain officers and senior management personnel.
|
Dollars in thousands
|
2010
|
2009
|
||
|
CHANGE IN PLAN ASSETS
|
Funded
|
Unfunded
|
Funded
|
Unfunded
|
|
Fair Value of Plan Assets, Beginning of Year
|
$229,931
|
$ -
|
$321,713
|
$ -
|
|
Actual Return on Plan Assets
|
65,233
|
-
|
(45,032)
|
-
|
|
Employer Contributions
|
45,852
|
2,304
|
18,788
|
2,229
|
|
Employees’ Contributions
|
2,118
|
-
|
2,157
|
-
|
|
Benefits Paid
|
(8,042)
|
(2,304)
|
(8,899)
|
(2,229)
|
|
Foreign Currency Rate Changes
|
7,605
|
-
|
(58,796)
|
-
|
|
Fair Value, End of Year
|
$342,697
|
$ -
|
$229,931
|
$ -
|
|
CHANGE IN PROJECTED BENEFIT OBLIGATION
|
||||
|
Benefit Obligation, Beginning of Year
|
$(270,727)
|
$(51,920)
|
$(339,526)
|
$(57,521)
|
|
Service Cost
|
(9,635)
|
(1,460)
|
(11,942)
|
(1,893)
|
|
Interest Cost
|
(20,350)
|
(3,705)
|
(19,358)
|
(3,357)
|
|
Employee Contributions
|
(2,118)
|
-
|
(2,157)
|
-
|
|
Actuarial Gain (Loss)
|
(95,982)
|
(10,166)
|
32,439
|
4,590
|
|
Benefits Paid
|
8,042
|
2,304
|
8,899
|
2,229
|
|
Foreign Currency Rate Changes
|
(7,298)
|
(263)
|
60,972
|
4,032
|
|
Amendments and Other
|
-
|
(905)
|
(54)
|
-
|
|
Benefit Obligation, End of Year
|
$(398,068)
|
$(66,115)
|
$(270,727)
|
$(51,920)
|
|
Funded Status
|
$(55,371)
|
$(66,115)
|
$(40,796)
|
$(51,920)
|
|
Amounts Recognized in the Statement of Financial Position:
|
||||
|
Deferred Pension Asset
|
$39
|
$ -
|
$388
|
$ -
|
|
Current Pension Liability
|
-
|
(2,245)
|
-
|
(2,483)
|
|
Noncurrent Pension Liability
|
(55,410)
|
(63,870)
|
(41,184)
|
(49,437)
|
|
Net Amount Recognized in Statement of Financial Position
|
$(55,371)
|
$(66,115)
|
$(40,796)
|
$(51,920)
|
|
AMOUNTS RECOGNIZED IN ACCUMULATED OTHER COMPREHENSIVE INCOME CONSIST OF (before tax)
|
||||
|
Net Actuarial Loss
|
$(106,094)
|
$(10,601)
|
$(59,178)
|
$(785)
|
|
Prior Service Cost
|
(1,409)
|
(1,720)
|
(1,849)
|
(1,164)
|
|
Total Accumulated Other Comprehensive Loss
|
$(107,503)
|
$(12,321)
|
$(61,027)
|
$(1,949)
|
|
(Decrease)/Increase in Accumulated other Comprehensive Income
|
$(46,476)
|
$(10,372)
|
$(26,314)
|
$5,596
|
|
WEIGHTED AVERAGE ASSUMPTIONS USED IN DETERMINING ASSETS AND LIABILITIES
|
||||
|
Discount Rate
|
5.8%
|
5.4%
|
7.2%
|
6.9%
|
|
Rate of Compensation Increase
|
4.6%
|
4.0%
|
4.2%
|
4.0%
|
|
Accumulated Benefit Obligations
|
$(348,028)
|
$(56,611)
|
$(244,929)
|
$(45,495)
|
69
Basis for determining discount rate:
The discount rates for the United States and Canadian pension plans were based on the derivation of a single-equivalent discount rate using a standard spot rate curve and the timing of expected benefit payments as of April 30, 2010. The spot rate curve used is based upon a portfolio of Moody’s-rated Aa3 (or higher) corporate bonds. The discount rates for the other international plans were based on similar published indices with durations comparable to that of each plan’s liabilities.
Basis for determining the expected asset return:
The expected long-term rates of return were estimated using market benchmarks for equities, real estate, and bonds applied to each plan’s target asset allocation and are estimated by asset class including an anticipated inflation rate. The expected long-term rates are then compared to the historic investment performance of the plan assets as well as future expectations and estimated through consultation with investment advisors and actuaries.
Pension plan assets/investments:
The investment guidelines for the defined benefit pension plans are established based upon an evaluation of market conditions, plan liabilities, cash requirements for benefit payments, and tolerance for risk. Investment guidelines include the use of actively and passively managed securities. The investment objective is to ensure that funds are available to meet the plan’s benefit obligations when they are due. The investment strategy is to invest in high quality and diversified equity and debt securities to achieve our long-term expectation. The plans’ risk management practices provide guidance to the investment managers, including guidelines for asset concentration, credit rating and liquidity. Asset allocation favors a balanced portfolio, with a target allocation of approximately 51% equity securities, 43% fixed income securities and cash, and 6% real estate. Due to volatility in the market, the target allocation is not always desirable and asset allocations will fluctuate between acceptable ranges of plus or minus 5%. The Company regularly reviews the investment allocations and periodically rebalances investments to the target allocations. As of April 30, 2010, the Company adopted the new accounting guidance on employer’s disclosures about postretirement benefit plan assets which requires that we categorize pension assets into three levels based upon the assumptions (inputs) used to price the assets. Level 1 provides the most reliable measure of fair value, whereas Level 3 generally requires significant management judgment. The three levels are defined as follows:
|
·
|
Level 1: Unadjusted quoted prices in active markets for identical assets.
|
|
·
|
Level 2: Observable inputs other than those included in Level 1. For example, quoted prices for similar assets in active markets or quoted prices for identical assets in inactive markets.
|
|
·
|
Level 3: Unobservable inputs reflecting assumptions about the inputs used in pricing the asset.
|
70
The Company held no level 3 assets during the year. The following table sets forth by level within the fair value hierarchy, pension plan assets at their fair value as of April 30, 2010 (in thousands):
|
(Level 1)
Quoted Prices in Active Markets for Identical Assets
|
(Level 2)
Significant Observable Inputs
|
Total
|
|
|
U.S. Plan Assets
|
|||
|
Equity Securities:
|
|||
|
U.S. Commingled Funds
|
$ -
|
$47,938
|
$47,938
|
|
Non-U.S. Commingled Funds
|
-
|
20,095
|
20,095
|
|
Fixed Income Securities:
|
|||
|
Fixed Income Commingled Funds
|
-
|
46,846
|
46,846
|
|
Other:
|
|||
|
Real Estate
|
-
|
4,422
|
4,422
|
|
Total U.S. Plan Assets
|
$ -
|
$119,301
|
$119,301
|
|
Non-U.S. Plan Assets
|
|||
|
Equity Securities:
|
|||
|
U.S. Equities
|
$13,278
|
$10,863
|
$24,141
|
|
Non-U.S. Equities
|
15,022
|
60,336
|
75,358
|
|
International Equities
|
2,351
|
-
|
2,351
|
|
Fixed Income Securities:
|
|||
|
Government /Sovereign Securities
|
13,292
|
1,439
|
14,731
|
|
Fixed Income Funds
|
17,736
|
67,693
|
85,429
|
|
Other:
|
|||
|
Real Estate/Other
|
2,719
|
10,368
|
13,087
|
|
Cash and Cash Equivalents
|
8,151
|
148
|
8,299
|
|
Total Non-U.S. Plan Assets
|
$72,549
|
$150,847
|
$223,396
|
|
Total Plan Assets
|
$72,549
|
$270,148
|
$342,697
|
Expected employer contributions to the defined benefit pension plans in fiscal year 2011 will be approximately $14.6 million, including $8.6 million of minimum amounts required for the Company’s non-U.S. plans. From time to time, the Company may elect to make voluntary contributions to its defined benefit plans to improve their funded status.
Benefit payments from all plans are expected to approximate $11.7 million in fiscal year 2011, $12.7 million in fiscal year 2012, $13.9 million in fiscal year 2013, $15.4 million in fiscal year 2014, $17.7 million in fiscal year 2015, and $117.6 million for fiscal years 2016 through 2020.
The Company provides contributory life insurance and health care benefits, subject to certain dollar limitations for substantially all of its eligible retired U.S. employees. The cost of such benefits is expensed over the years the employee renders service and is not funded in advance. The accumulated post-retirement benefit obligation recognized in the Consolidated Statements of Financial Position as of April 30, 2010 and 2009 was $4.0 million and $2.8 million, respectively. Annual expenses for these plans for fiscal years 2010, 2009 and 2008 were $0.5 million, $0.4 million and $0.3 million, respectively.
71
The Company has defined contribution savings plans. The Company contribution is based on employee contributions and the level of Company match. The expense for these plans amounted to approximately $8.4 million, $7.3 million, and $6.3 million in fiscal years 2010, 2009, and 2008, respectively.
Note 15 – Share-Based Compensation
All equity compensation plans have been approved by security holders. At the meeting of shareholders held in September 2009, shareholders approved the 2009 Key Employee Stock Plan (“the Plan”). Under the Plan, qualified employees are eligible to receive awards that may include stock options, performance-based stock awards, and restricted stock awards. Under the Plan, a maximum number of 8,000,000 shares of Company Class A stock may be issued. As of April 30, 2010, there were approximately 7,915,000 securities remaining available for future issuance under the Plan. The Company issues treasury shares to fund stock options and performance-based and restricted stock awards.
Stock Option Activity:
Under the terms of the Company’s stock option plan, the exercise price of stock options granted may not be less than 100% of the fair market value of the stock at the date of grant. Options are exercisable over a maximum period of 10 years from the date of grant and generally vest 50% on the fourth and fifth anniversary date after the award is granted. Under certain circumstances relating to a change of control, as defined, the right to exercise options outstanding could be accelerated.
The following table provides the estimated weighted average fair value, under the Black-Scholes option-pricing model, for each option granted during the periods and the significant weighted average assumptions used in their determination. The expected life represents an estimate of the period of time stock options are outstanding based on the historical exercise behavior of the employees. The risk-free interest rate is based on the corresponding U.S. Treasury yield curve in effect at the time of the grant. The expected volatility is based on the historical volatility of the Company’s Common Stock Price over the estimated life of the option while, the dividend yield is based on the expected dividend payments to be made by the Company.
|
For the Twelve Months
Ending April 30,
|
|||||
|
2010
|
2009
|
2008
|
|||
|
Per Share Fair Value of Options Granted
|
$11.32
|
$15.30
|
$18.42
|
||
|
Weighted Average assumptions:
|
|||||
|
Expected Life of Options (years)
|
7.8
|
7.7
|
7.7
|
||
|
Risk-Free Interest Rate
|
3.3%
|
3.8%
|
5.1%
|
||
|
Expected Volatility
|
29.9%
|
25.2%
|
27.3%
|
||
|
Expected Dividend Yield
|
1.6%
|
1.1%
|
0.9%
|
||
|
Fair Value of Common Stock on Grant Date
|
$35.04
|
$47.55
|
$48.46
|
||
72
A summary of the activity and status of the Company’s stock option plans follows:
|
2010
|
2009
|
2008
|
||||||||
|
Stock Options
|
Options
(in 000’s)
|
Weighted Average Exercise Price
|
Weighted Average Remaining Term
(in years)
|
Average Intrinsic Value
(in millions)
|
Options
(in 000’s)
|
Weighted Average Exercise Price
|
Options
(in 000’s)
|
Weighted Average Exercise Price
|
||
|
Outstanding at Beginning of Year
|
5,722
|
$34.05
|
5,730
|
$31.27
|
6,216
|
$27.37
|
||||
|
Granted
|
695
|
$35.04
|
631
|
$47.55
|
627
|
$48.46
|
||||
|
Exercised
|
(1,407)
|
$25.74
|
(622)
|
$22.02
|
(1,001)
|
$17.89
|
||||
|
Expired or Forfeited
|
(23)
|
$40.37
|
(17)
|
$34.66
|
(112)
|
$30.45
|
||||
|
Outstanding at End of Year
|
4,987
|
$36.51
|
5.9
|
$35.9
|
5,722
|
$34.05
|
5,730
|
$31.27
|
||
|
Exercisable at End of Year
|
2,513
|
$31.47
|
4.1
|
$27.1
|
2,937
|
$27.38
|
2,657
|
$24.40
|
||
|
Vested and Expected to Vest in the Future at April 30, 2010
|
4,802
|
$36.61
|
5.9
|
$34.2
|
|
|||||
The intrinsic value is the difference between the Company’s common stock price and the option exercise price. The total intrinsic value of options exercised during fiscal years 2010, 2009 and 2008 was $22.9 million, $11.8 million and $25.3 million, respectively. The total fair value of stock options vested during fiscal year 2010 was $11.6 million.
As of April 30, 2010, there was $8.0 million of unrecognized share-based compensation expense related to stock options, which is expected to be recognized over a period up to 5 years, or 1.9 years on a weighted average basis.
The following table summarizes information about stock options outstanding and exercisable at April 30, 2010:
|
Options Outstanding
|
Options Exercisable
|
|||||
|
Range of
Exercise Prices
|
Number of Options
(in 000’s)
|
Weighted Average Remaining Term (in years)
|
Weighted Average Exercise Price
|
Number of Options
(in 000’s)
|
Weighted Average Exercise Price
|
|
|
$18.30 to $20.54
|
20
|
1.4
|
$19.58
|
20
|
$19.58
|
|
|
$21.44 to $23.40
|
96
|
1.3
|
$23.17
|
96
|
$23.17
|
|
|
$23.56 to $25.32
|
717
|
2.8
|
$25.16
|
717
|
$25.16
|
|
|
$31.89 to $38.78
|
2,908
|
6.1
|
$34.93
|
1,680
|
$34.77
|
|
|
$47.55 to $48.46
|
1,246
|
7.7
|
$48.00
|
-
|
-
|
|
|
Total/Average
|
4,987
|
5.9
|
$36.51
|
2,513
|
$31.47
|
|
Performance-Based and Other Restricted Stock Activity:
Under the terms of the Company’s long-term incentive plans, upon the achievement of certain three-year financial performance-based targets, awards are payable in restricted shares of the Company’s Class A Common Stock. During each three-year period, the Company adjusts compensation expense based upon its best estimate of expected performance. The restricted performance shares vest 50% on the first and second anniversary date after the award is earned.
73
The Company may also grant individual restricted shares awards of the Company’s Class A Common Stock to key employees in connection with their employment. The restricted shares generally vest 50% at the end of the fourth and fifth years following the date of the grant.
Under certain circumstances relating to a change of control or termination, as defined, the restrictions would lapse and shares would vest earlier. Activity for performance-based and other restricted stock awards during fiscal years 2010, 2009 and 2008 was as follows (shares in thousands):
|
2010
|
2009
|
2008
|
|||
|
Restricted Shares
|
Weighted Average Grant Date Value
|
Restricted Shares
|
Restricted Shares
|
||
|
Nonvested Shares at Beginning of Year
|
682
|
$37.81
|
1,096
|
814
|
|
|
Granted
|
363
|
$35.04
|
308
|
307
|
|
|
Change in shares due to performance
|
191
|
$48.31
|
(459)
|
211
|
|
|
Vested and Issued
|
(292)
|
$35.00
|
(228)
|
(224)
|
|
|
Forfeited
|
(18)
|
$41.08
|
(35)
|
(12)
|
|
|
Nonvested Shares at End of Year
|
926
|
$39.71
|
682
|
1,096
|
|
As of April 30, 2010, there was $14.9 million of unrecognized share-based compensation cost related to restricted stock awards, which is expected to be recognized over a period up to 5 years, or 3.1 years on a weighted average basis. Compensation expense for restricted stock awards is measured using the closing market price of the Company’s Class A Common Stock at the date of grant. The total grant date value of shares vested during fiscal years 2010, 2009 and 2008 was $10.2 million, $7.8 million and $6.4 million, respectively.
Director Stock Awards:
Under the terms of the Company’s Director Stock Plan (the “Director Plan”), each non-employee director receives an annual award of Class A Common Stock equal in value to 100% of the annual director fee, based on the stock price on the date of grant. The granted shares may not be sold or transferred during the time the non-employee director remains a director. There were 14,130, 8,616 and 7,680 shares awarded under the Director Plan for fiscal years 2010, 2009 and 2008, respectively.
Note 16 - Capital Stock and Changes in Capital Accounts
Each share of the Company’s Class B Common Stock is convertible into one share of Class A Common Stock. The holders of Class A stock are entitled to elect 30% of the entire Board of Directors and the holders of Class B stock are entitled to elect the remainder. On all other matters, each share of Class A stock is entitled to one tenth of one vote and each share of Class B stock is entitled to one vote.
Under the Company’s current stock repurchase program, up to four million shares of its Class A Common Stock may be purchased from time to time in the open market and through privately negotiated transactions. The Company did not repurchase any shares during fiscal year 2010. As of April 30, 2010, the Company has authorization from its Board of Directors to purchase up to approximately 798,630 additional shares.
74
Note 17 - Segment Information
The Company is a global publisher of print and electronic products, providing content and digital solutions to customers worldwide. The Company maintains publishing, marketing and distribution centers principally in Asia, Australia, Canada, Germany, the United Kingdom and the United States. Below is a description of the Company’s three operating segments.
Scientific, Technical, Medical and Scholarly includes the publishing of titles for the scientific, technical, medical and scholarly communities worldwide including academic, corporate, government and public libraries; researchers; scientists; clinicians; engineers and technologists; scholarly and professional societies; and students and professors. Products include journals, books, major reference works, databases and laboratory manuals. Publishing areas include the physical sciences, health sciences, social science and humanities and life sciences. Products are sold and distributed globally, online and in print through multiple channels, including research libraries, library consortia, independent subscription agents, direct sales to professional society members, bookstores, online booksellers and other customers. Publishing centers include Australia, Germany, Singapore, the United Kingdom and the United States.
Professional/Trade includes the publishing of books, subscription products and information services in all media. Subject areas include business, technology, architecture, cooking, psychology, education, travel, health, religion, consumer reference, pets and general interest. Products are developed for worldwide distribution through multiple channels, including major chains and online booksellers, independent bookstores, libraries, colleges and universities, warehouse clubs, corporations, direct marketing and websites. Professional/Trade customers are professionals, consumers and students worldwide. Publishing centers include Asia, Australia, Canada, Germany, the United Kingdom and the United States.
Higher Education includes the publishing of educational materials in all media, for two and four-year colleges and universities, for-profit career colleges, advanced placement classes and secondary schools in Australia. Higher Education products focus on courses in business and accounting, sciences, engineering, computer science, mathematics, statistics, geography, hospitality and the culinary arts, education, psychology and modern languages. Customers include undergraduate, graduate and advanced placement students, educators and lifelong learners worldwide and secondary school students in Australia. Products are sold and delivered online and in print, principally through college bookstores, online booksellers and websites. The Company maintains centers in Asia, Australia, Canada, India, the United Kingdom and the United States.
Shared Services - The Company reports separate financial data for shared service functions, which are centrally managed for the benefit of the three global businesses, including Distribution, Technology Services, Finance and Other Administration support.
75
Segment information is as follows (in thousands) :
|
For the years ended April 30,
|
|||
|
2010
|
2009
|
2008
|
|
|
Revenue
|
|||
|
Scientific, Technical, Medical and Scholarly
|
$986,683
|
$969,184
|
$975,797
|
|
Professional/Trade
|
429,988
|
403,113
|
457,286
|
|
Higher Education
|
282,391
|
239,093
|
240,651
|
|
Total
|
$1,699,062
|
$1,611,390
|
$1,673,734
|
|
Direct Contribution to Profit
|
|||
|
Scientific, Technical, Medical and Scholarly
|
$405,241
|
$399,156
|
$384,170
|
|
Professional/Trade
|
100,196
|
89,678
|
130,502
|
|
Higher Education
|
86,212
|
66,619
|
74,387
|
|
Total
|
$591,649
|
$555,453
|
$589,059
|
|
Shared Services and Administration Costs
|
|||
|
Distribution
|
$(110,858)
|
$(112,961)
|
$(116,147)
|
|
Technology Services
|
(103,154)
|
(93,413)
|
(95,412)
|
|
Finance
|
(47,294)
|
(45,937)
|
(49,684)
|
|
Other Administration
|
(87,751)
|
(84,664)
|
(102,605)
|
|
Total
|
$(349,057)
|
$(336,975)
|
$(363,848)
|
|
Operating Income
|
$242,592
|
$218,478
|
$225,211
|
|
Foreign Exchange Losses
|
(10,883)
|
(11,759)
|
(2,863)
|
|
Interest Expense & Other, net
|
(31,500)
|
(42,244)
|
(60,820)
|
|
Income Before Taxes
|
$200,209
|
$164,475
|
$161,528
|
|
Total Assets
|
|||
|
Scientific, Technical, Medical and Scholarly
|
$1,417,276
|
$1,380,991
|
$1,715,292
|
|
Professional/Trade
|
474,428
|
462,482
|
506,838
|
|
Higher Education
|
157,816
|
165,839
|
160,292
|
|
Corporate/Shared Services
|
266,682
|
214,396
|
193,793
|
|
Total
|
$2,316,202
|
$2,223,708
|
$2,576,215
|
|
Expenditures for Other Long Lived Assets
|
|||
|
Scientific, Technical, Medical and Scholarly
|
$97,329
|
$95,417
|
$83,464
|
|
Professional/Trade
|
50,733
|
55,433
|
50,638
|
|
Higher Education
|
19,455
|
36,287
|
20,117
|
|
Corporate/Shared Services
|
42,390
|
14,498
|
15,967
|
|
Total
|
$209,907
|
$201,635
|
$170,186
|
|
Depreciation and Amortization
|
|||
|
Scientific, Technical, Medical and Scholarly
|
$52,215
|
$51,045
|
$52,101
|
|
Professional/Trade
|
32,191
|
31,703
|
32,322
|
|
Higher Education
|
25,125
|
21,926
|
20,924
|
|
Corporate/Shared Services
|
13,348
|
11,071
|
10,576
|
|
Total
|
$122,879
|
$115,745
|
$115,923
|
76
Export sales from the United States to unaffiliated customers amounted to approximately $140.5 million, $142.3 million, and $95.2 million in fiscal years 2010, 2009, and 2008, respectively. The pretax income for consolidated operations outside the United States was approximately $133.1 million, $107.0 million, and $122.4 million in 2010, 2009, and 2008, respectively.
Revenue from external customers based on the location of the customer and long-lived assets by geographic area were as follows (in thousands):
|
Revenue
|
Long-Lived Assets
|
||||||||||
|
2010
|
2009
|
2008
|
2010
|
2009
|
2008
|
||||||
|
United States
|
$865,519
|
$812,416
|
$856,438
|
$734,512
|
$731,535
|
$702,722
|
|||||
|
United Kingdom
|
120,953
|
126,190
|
131,642
|
889,921
|
845,681
|
1,203,700
|
|||||
|
Germany
|
91,954
|
88,336
|
91,130
|
132,783
|
140,507
|
149,403
|
|||||
|
Asia
|
234,585
|
220,107
|
209,436
|
3,454
|
3,309
|
2,789
|
|||||
|
Australia
|
79,194
|
65,084
|
76,530
|
57,447
|
44,618
|
48,411
|
|||||
|
Canada
|
70,566
|
67,189
|
68,609
|
5,635
|
4,424
|
5,073
|
|||||
|
Other Countries
|
236,291
|
232,068
|
239,949
|
-
|
-
|
-
|
|||||
|
Total
|
$1,699,062
|
$1,611,390
|
$1,673,734
|
$1,823,752
|
$1,770,074
|
$2,112,098
|
|||||
Note 18 – Interest Income and Other, Net
Included in Interest Income and Other for fiscal year 2009 is a $4.6 million ($0.08 per diluted share) non-recurring insurance receipt.
Note 19 – Functional Currency Change
Effective November 1, 2008, the Company changed its functional currency reporting basis for the non-Blackwell portion of the Company’s European STMS journal business from U.S. Dollar to local functional currency. As part of the integration of Blackwell and Wiley fulfillment systems and licensing practices, in the third quarter the Company began pricing journal revenue based on local currency in Europe. Prior to the integration, journal revenue was principally priced and reported in U.S. Dollars. This change primarily impacted business denominated in Euros and Sterling.
77
Schedule II
JOHN WILEY & SONS, INC., AND SUBSIDIARIES
VALUATION AND QUALIFYING ACCOUNTS
FOR THE YEARS ENDED APRIL 30, 2010, 2009, AND 2008
(Dollars in thousands)
|
Additions/ (Deductions)
|
|||||||
|
Description
|
Balance at Beginning of Period
|
Charged to
Cost &
Expenses
|
Deductions From Reserves(2)
|
Balance at End of Period
|
|||
|
Year Ended April 30, 2010
|
|||||||
|
Allowance for Sales Returns (1)
|
$55,207
|
$102,395
|
$102,291
|
$55,311
|
|||
|
Allowance for Doubtful Accounts
|
$5,655
|
$3,177
|
$1,973
|
$6,859
|
|||
|
Allowance for Inventory Obsolescence
|
$36,329
|
$28,699
|
$25,354
|
$39,674
|
|||
|
Year Ended April 30, 2009
|
|||||||
|
Allowance for Sales Returns (1)
|
$55,483
|
$93,738
|
$94,014
|
$55,207
|
|||
|
Allowance for Doubtful Accounts
|
$8,025
|
$2,019
|
$4,389
|
$5,655
|
|||
|
Allowance for Inventory Obsolescence
|
$35,420
|
$28,405
|
$27,496
|
$36,329
|
|||
|
Year Ended April 30, 2008
|
|||||||
|
Allowance for Sales Returns (1)
|
$56,148
|
$93,909
|
$94,574
|
$55,483
|
|||
|
Allowance for Doubtful Accounts
|
$11,206
|
$(638)
|
$2,543
|
$8,025
|
|||
|
Allowance for Inventory Obsolescence
|
$32,244
|
$22,156
|
$18,980
|
$35,420
|
|
|
(1)
|
Allowance for sales returns represents anticipated returns net of inventory and royalty costs. The provision is reported as a reduction of gross sales to arrive at revenue and the reserve balance is reported as a reduction of accounts receivable.
|
|
|
(2)
|
Deductions from reserves include foreign exchange translation adjustments and accounts written off, less recoveries.
|
78
Item 9. Changes in and Disagreements with Accountants on Accounting and Financial Disclosure
None
Item 9A. Controls and Procedures
Disclosure Controls and Procedures: As of the end of the period covered by this report, an evaluation was performed under the supervision and with the participation of the Company’s management, including the Chief Executive Officer and Chief Financial Officer, of the effectiveness of the design and operation of the Company’s disclosure controls and procedures as such term is defined in Rule 13a-15(e) of the Exchange Act. Based on that evaluation, the Chief Executive Officer and Chief Financial Officer concluded that the Company’s disclosure controls and procedures were effective in alerting them on a timely basis to information required to be included in our submissions and filings with the SEC.
Management’s Report on Internal Control over Financial Reporting: Our Management is responsible for establishing and maintaining adequate internal control over financial reporting, as such term is defined in Rule 13a-15(f) of the Exchange Act. Under the supervision and with the participation of our management, including our Chief Executive Officer and Chief Financial Officer, we conducted an evaluation of the effectiveness of our internal control over financial reporting based upon the framework in Internal Control – Integrated Framework issued by the Committee of Sponsoring Organizations of the Treadway Commission. Based on that evaluation, our management concluded that our internal control over financial reporting is effective as of April 30, 2010.
KPMG LLP, an independent registered public accounting firm, has audited the consolidated financial statements included in this Annual Report on Form 10-K and, as part of their audit, has issued their report, included herein, on the effectiveness of our internal control over financial reporting.
Changes in Internal Control over Financial Reporting: There were no changes in our internal control over financial reporting that have materially affected, or are reasonably likely to materially affect, our internal control over financial reporting during fiscal year 2010.
Item 9B. Other Information
Information on the Audit Committee Charter is contained in the Company’s Proxy Statement for the 2010 Annual Meeting of Shareholders under the caption “Certain Information Concerning the Board” and is incorporated herein by reference.
Information with respect to the Company’s corporate governance principles is contained in the Proxy Statement for the 2010 Annual Meeting of Shareholders under the caption “Corporate Governance Principles” and is incorporated herein by reference.
Following the acquisition of Sun Microsystems, Inc. by Oracle, One of the Company’s Board of Directors, Kim Jones, exercised her change of control provision and is no longer employed by Oracle. Pursuant the Company’s Corporate Governance Principles, Ms. Jones tendered her resignation as a director. On June 17, 2010, the Board of Directors accepted Ms. Jones’ resignation.
79
PART III
Item 10. Directors and Executive Officers of the Registrant
The name, age and background of each of the directors nominated for election are contained under the caption “Election of Directors” in the Proxy Statement for our 2010 Annual Meeting of Shareholders and are incorporated herein by reference.
Information on the beneficial ownership reporting for the directors and executive officers is contained under the caption “Section 16(a) Beneficial Ownership Reporting Compliance” in the Proxy Statement for the 2010 Annual Meeting of Shareholders and is incorporated herein by reference.
Information on the audit committee financial experts is contained in the Proxy Statement for the 2010 Annual Meeting of Shareholders under the caption “Report of the Audit Committee” and is incorporated herein by reference.
Executive Officers
Set forth below as of April 30, 2010 are the names and ages of all executive officers of the Company, the period during which they have been officers, and the offices presently held by each of them.
|
Name and Age
|
Officer Since
|
Present Office
|
||
|
Peter Booth Wiley
67
|
2002
|
Chairman of the Board since September 2002 and a Director since 1984.
|
||
|
William J. Pesce
59
|
1989
|
President and Chief Executive Officer and a Director since 1998.
|
||
|
Ellis E. Cousens
58
|
2001
|
Executive Vice President and Chief Financial and Operations Officer since 2001.
|
||
|
Stephen A. Kippur
63
|
1986
|
Executive Vice President; and President, Professional and Trade Publishing since 1998.
|
||
|
William Arlington
61
|
1990
|
Senior Vice President, Human Resources since 1996.
|
||
|
Bonnie E. Lieberman
62
|
1990
|
Senior Vice President, Higher Education since 1996.
|
||
|
Gary M. Rinck
58
|
2004
|
Senior Vice President, General Counsel since 2004.
|
||
|
Stephen M. Smith
55
|
1995
|
Executive Vice President and Chief Operating Officer since 2009.
|
||
|
Eric A. Swanson
62
|
1989
|
Senior Vice President, Wiley-Blackwell since 2007 (previously Senior Vice President, Scientific Technical and Medical since 1996).
|
||
|
Deborah E. Wiley
64
|
1982
|
Senior Vice President, Corporate Communications since 1996.
|
||
|
Vincent Marzano
47
|
2006
|
Vice President, Treasurer since 2006.
|
||
|
Edward J. Melando
54
|
2002
|
Vice President, Corporate Controller and Chief Accounting Officer since 2002.
|
||
|
Michael Preston
42
|
2009
|
Corporate Secretary since 2009.
|
|
|
Each of the other officers listed above will serve until the next organizational meetings of the Board of Directors of the Company and until each of the respective successors are duly elected and qualified. Deborah E. Wiley is the sister of Peter Booth Wiley. There is no other family relationship among any of the aforementioned individuals.
|
80
Item 11. Executive Compensation
Information on compensation of the directors and executive officers is contained in the Proxy Statement for the 2010 Annual Meeting of Shareholders under the captions “Directors’ Compensation” and “Executive Compensation,” respectively, and is incorporated herein by reference.
Item 12. Security Ownership of Certain Beneficial Owners and Management and Related Stockholder Matters
Information required by this item is contained in the Company’s Proxy Statement for the 2010 Annual Meeting of Shareholders under the caption “Beneficial Ownership of Directors and Management” and is incorporated herein by reference.
Item 13. Certain Relationships and Related Transactions
None.
Item 14. Principal Accountant Fees and Services
Information required by this item is contained in the Company’s Proxy Statement for the 2010 Annual Meeting of Shareholders under the caption “Report of the Audit Committee” and is incorporated herein by reference.
81
PART IV
Item 15. Exhibits, Financial Statement Schedules and Reports on Form 8-K
|
(a)
|
Financial Statements and Schedules
|
|
Financial Statements and Schedules are listed in the attached index on page 10 and are filed as part of this Report.
|
|
|
(b)
|
Reports on Form 8-K
|
|
Earnings release on the third quarter fiscal 2010 results issued on Form 8-K dated March 11, 2010, which included certain condensed financial statements of the Company.
|
|
|
Earnings release on the fiscal year 2010 results issued on Form 8-K dated June 17, 2010, which included certain condensed financial statements of the Company.
|
|
|
(c)
|
Exhibits
|
|
2.1
|
Agreement and Plan of Merger dated as of August 12, 2001, among the Company, HMI Acquisition Corp. and Hungry Minds, Inc. (incorporated by reference to the Company’s Report on Form 8-K dated as of August 12, 2001).
|
|
2.2
|
Scheme of Arrangement dated as of November 21, 2006, among the Company, Wiley Europe Investment Holdings Limited and Blackwell Publishing (Holdings) Limited (incorporated by reference to the Company’s Report on Form 8-K dated as of November 21, 2006).
|
|
3.1
|
Restated Certificate of Incorporation (incorporated by reference to the Company’s Report on Form 10-K for the year ended April 30, 1992).
|
|
3.2
|
Certificate of Amendment of the Certificate of Incorporation dated October 13, 1995 (incorporated by reference to the Company’s Report on Form 10-K for the year ended April 30, 1997).
|
|
3.3
|
Certificate of Amendment of the Certificate of Incorporation dated as of September 1998 (incorporated by reference to the Company’s Report on Form 10-Q for the quarterly period ended October 31, 1998).
|
|
3.4
|
Certificate of Amendment of the Certificate of Incorporation dated as of September 1999 (incorporated by reference to the Company’s Report on Form 10-Q for the quarterly period ended October 31, 1999).
|
|
3.5
|
By-Laws as Amended and Restated dated as of September 2007 (incorporated by reference to the Company’s Report on Form 10-K for the year ended April 30, 2008).
|
|
10.2
|
Credit Agreement dated as of February 2, 2007, among the Company and Bank of America, N.A., as Administrative Agent and Swing Line Lender and the Other Lenders Party Hereto (incorporated by reference to the Company’s Report on Form 8-K dated as of February 8, 2007).
|
|
10.3
|
Agreement of the Lease dated as of June 7, 2006 between One Wiley Drive, LLC, an independent third party, as landlord and John Wiley and Sons, Inc., as Tenant (incorporated by reference to the Company’s Report on Form 10-K for the year ended April 30, 2006).
|
|
10.4
|
Agreement of Lease dated as of August 4, 2000, between, Block A South Waterfront Development L.L.C., as Landlord, and the Company, as Tenant (incorporated by reference to the Company’s Report on Form 10-Q for the quarterly period ended July 31, 2000).
|
|
10.5
|
Summary of Lease Agreement dated as of March 4, 2005, between, Investa Properties Limited L.L.C. as Landlord, and the Company, as Tenant (incorporated by reference to the Company’s Report on Form 10-K for the year ended April 30, 2005).
|
|
10.6
|
2009 Director Stock Plan (incorporated by reference to the Company’s second quarter fiscal year 2010 report on Form 10-Q as exhibit 10.3).
|
|
10.7
|
2009 Executive Annual Incentive Plan (incorporated by reference to the Company’s second quarter fiscal year 2010 report on Form 10-Q as exhibit 10.2).
|
|
10.8
|
2009 Key Employee Stock Plan (incorporated by reference to the Company’s second quarter fiscal year 2010 report on Form 10-Q as exhibit 10.1).
|
|
10.9
|
Supplemental Executive Retirement Plan as Amended and Restated effective as of January 1, 2009
|
|
10.10
|
Supplemental Benefit Plan Amended and Restated as of January 1, 2009
|
|
10.11
|
Deferred Compensation Plan as Amended and Restated effective as of January 1, 2008
|
|
10.12
|
Deferred Compensation Plan for Directors’ 2005 & After Compensation (incorporated by reference to the report on Form 8-K, filed December 21, 2005).
|
|
10.13
|
Form of the Fiscal Year 2011 Qualified Executive Long Term Incentive Plan
|
|
10.14
|
Form of the Fiscal Year 2011 Qualified Executive Annual Incentive Plan
|
|
10.15
|
Form of the Fiscal Year 2011 Executive Annual Strategic Milestones Incentive Plan
|
|
10.16
|
Form of the Fiscal Year 2010 Qualified Executive Long Term Incentive Plan (incorporated by reference to the Company’s Report on Form 10-K for the year ended April 30, 2009).
|
|
10.17
|
Form of the Fiscal Year 2010 Qualified Executive Annual Incentive Plan (incorporated by reference to the Company’s Report on Form 10-K for the year ended April 30, 2009).
|
|
10.18
|
Form of the Fiscal Year 2010 Executive Annual Strategic Milestones Incentive Plan (incorporated by reference to the Company’s Report on Form 10-K for the year ended April 30, 2009).
|
|
10.19
|
Form of the Fiscal Year 2009 Qualified Executive Long Term Incentive Plan (incorporated by reference to the Company’s Report on Form 10-K for the fiscal year ended April 30, 2008).
|
|
10.20
|
Form of the Fiscal Year 2009 Qualified Executive Annual Incentive Plan (incorporated by reference to the Company’s Report on Form 10-K for the fiscal year ended April 30, 2008).
|
|
10.21
|
Form of the Fiscal Year 2009 Executive Annual Strategic Milestones Incentive Plan (incorporated by reference to the Company’s Report on Form 10-K for the fiscal year ended April 30, 2008).
|
|
10.22
|
Senior Executive Employment Agreement to Arbitrate dated as of April 29, 2003 (incorporated by reference to the Company’s Report on Form 10-K for the year ended April 30, 2003).
|
|
10.23
|
Schedule of individual officers party to Senior Executive Employment Agreement to Arbitrate dated as of April 29, 2003 (incorporated by reference to the Company’s second quarter fiscal year 2010 report on Form 10-Q).
|
|
10.24
|
Senior Executive Non-competition and Non-Disclosure Agreement dated as of April 29, 2003 (incorporated by reference to the Company’s Report on Form 10-K for the year ended April 30, 2003).
|
|
10.25
|
Schedule of individual officers party to Senior Executive Non-Competition and Non-Disclosure Agreement dated as of April 29, 2003 (incorporated by reference to the Company’s second quarter fiscal year 2010 report on Form 10-Q).
|
|
10.26
|
Senior executive Employment Agreement dated as of December 1, 2008, between William J. Pesce and the Company (incorporated by reference to the Company’s third quarter fiscal year 2009 report on Form 10-Q).
|
|
10.27
|
Senior executive Employment Agreement dated as of March 1, 2003, between Stephen A. Kippur and the Company (incorporated by reference to the Company’s Report on Form 10-K for the year ended April 30, 2003).
|
|
10.28
|
Senior executive Employment Agreement dated as of December 1, 2008, between Ellis E. Cousens and the Company (incorporated by reference to the Company’s third quarter fiscal year 2009 report on Form 10-Q).
|
|
10.29
|
Senior executive Employment Agreement letter dated as of November 18, 2009, between Stephen M. Smith and the Company (incorporated by reference to the Company’s second quarter fiscal year 2010 report on Form 10-Q).
|
|
10.30
|
Senior executive Employment Agreement letter dated as of March 1, 2003, between Bonnie E. Lieberman and the Company (incorporated by reference to the Company’s Report on Form 10-K for the year ended April 30, 2008).
|
|
21*
|
List of Subsidiaries of the Company
|
|
23*
|
Consent of KPMG LLP
|
|
31.1*
|
Certification of Chief Executive Officer pursuant to Section 302 of the Sarbanes-Oxley Act of 2002.
|
|
32.1*
|
Certification of the Chief Executive Officer pursuant to 18 U.S.C. Section 1350, as adopted pursuant to Section 906 of the Sarbanes-Oxley Act of 2002.
|
|
31.2*
|
Certification of the Chief Financial Officer pursuant to Section 302 of the Sarbanes-Oxley Act of 2002.
|
|
32.2*
|
Certification of Chief Financial Officer pursuant to 18 U.S.C. Section 1350, as adopted pursuant to Section 906 of the Sarbanes-Oxley Act of 2002.
|
* Filed herewith
82
SIGNATURES
Pursuant to the requirements of Section 13 or 15(d) of the Securities Exchange Act of 1934, the Company has duly caused this report to be signed on its behalf by the undersigned, thereunto duly authorized.
|
JOHN WILEY & SONS, INC.
|
|||
|
(Company)
|
|||
|
By:
|
/s/ William J. Pesce | ||
|
William J. Pesce
|
|||
|
President and Chief Executive Officer
|
|||
|
By:
|
/s/ Ellis E. Cousens | ||
|
Ellis E. Cousens
|
|||
|
Executive Vice President and
|
|||
|
Chief Financial and Operations Officer
|
|||
|
By:
|
/s/ Edward J. Melando | ||
|
Edward J. Melando
|
|||
|
Vice President, Controller and
|
|||
|
Chief Accounting Officer
|
|||
|
Dated: June 23, 2010
|
|||
83
Pursuant to the requirements of the Securities Exchange Act of 1934, this report has been signed below by the following persons constituting directors of the Company on June 23, 2010.
|
/s/ Warren J. Baker
|
/s/ William J. Pesce
|
||
|
Warren J. Baker
|
William J. Pesce
|
||
|
/s/ Richard M. Hochhauser
|
/s/ William B. Plummer
|
||
|
Richard M. Hochhauser
|
William B. Plummer
|
||
|
/s/ Mathew S. Kissner
|
/s/ Kalpana Raina
|
||
|
Mathew S. Kissner
|
Kalpana Raina
|
||
|
/s/ Raymond McDaniel, Jr.
|
/s/ Bradford Wiley II
|
||
|
Raymond McDaniel, Jr.
|
Bradford Wiley II
|
||
|
/s/ Eduardo R. Menascé
|
/s/ Peter Booth Wiley
|
||
|
Eduardo R. Menascé
|
Peter Booth Wiley
|
||
84