Attached files
| file | filename |
|---|---|
| 8-K - FORM 8-K - Cornerstone Building Brands, Inc. | h73946e8vk.htm |
Exhibit 99.1

| Investor Presentation June |

| 2 Safe Harbor Some comments made in this presentation are "forward-looking" statements, as defined in the Private Securities Litigation Reform Act of 1995. These forward-looking statements are subject to a number of risks and uncertainties that may cause the Company's actual performance to differ materially from that projected in such statements. Among the factors that could cause actual results to differ materially are industry cyclicality and seasonality; fluctuations in customer demand; raw material pricing and supply; the financial condition of the Company's raw material suppliers; competitive activity and pricing pressure; ability to make strategic acquisitions accretive to earnings; general economic conditions affecting the construction industry; current financial crisis and U.S. recession; changes in laws or regulations; the outcome of any legal proceedings that may be instituted against the Company; and ability to service or refinance our debt. Investors should refer to statements regularly filed by the Company with the Securities and Exchange Commission for a discussion of additional factors which could affect the Company's operations and forward-looking statements made in this presentation. The Company expressly disclaims any obligation to release publicly any updates or revisions to these forward-looking statements to reflect any changes in expectations. |

| 3 It is our mission to produce sustainable products and systems, for the metal construction industry, of enduring quality that enhance the beauty, form and function of structures in which people work, live, play, learn, worship and use for storage and protection. Mission Statement |

| 4 It is the vision of NCI to be the undisputed leader in the U.S. building construction industry by providing superior products and services through our metal coil coating, metal components and custom metal building systems divisions. Vision Statement |

| The Market |

| 6 Nonresidential Market Segments |

| 7 NCI's Strategic Positioning Leading market positions in all operating segments High quality, well respected stable of brands marketed through a broad network of builders and distributors Large variety of products and services Participates in highly fragmented markets and has attractive spread of risk in terms of geography, end market applications and customer concentration 32 manufacturing plants located throughout North America operated in an efficient "hub-and-spoke" network Places manufacturing and distribution operations closer to our customers Affiliated builder network and architectural relationships provide substantial and extended channels to market Each segment uses same type of steel Ability to receive contract pricing without long-term contracts Significant ability to flex manufacturing infrastructure and ESG&A levels to changes in volume Vertically integrated producer enabling faster turnaround times - majority of orders are completed in 1 - 3 months Positioned to capitalize on material conversion trends and green initiative Actively pursuing market leading initiatives Significant operating expertise Management averages 17 years of experience in the Metal Building Manufacturing industry Proven ability to operate and grow the business and in the current downturn to execute cost reduction initiatives Leading Market Positions and Strong Brands Motivated and Experienced Management Team Integrated Business Model Well Positioned for Growth Efficient Distribution Model High Volume Producer with Flexible Cost Structure |

| SEGMENT METAL COIL COATING METAL COMPONENTS ENGINEERED BUILDING SYSTEMS Focus Cleaning, treating & painting flat rolled metal coil substrates Metal roof & wall systems, metal partitions, metal doors, etc. Engineered building systems for low rise non-residential markets Key Products Product Utilization Used by manufacturers of metal components and engineered building systems (NCI's other segments used approximately 55% of production). Also sold to other manufacturers of painted metal goods, such as the appliance industry. Roof and wall systems with specialized product lines such as insulated metal panels and standing seam roof panels for architectural and commercial/industrial applications, as well as traditional single-skin, thru-fastener panels primarily used for agricultural and residential facilities; secondary structural (purlins and girts), as well as ancillary accessories such as doors and trim. Custom designed, engineered, ready for assembly primary structural framing, secondary structural members (purlins, girts) and metal roofs/walls. NCI Companies FY2009 % of Total Revenue 5% 40% 55% FY2009 % of Total EBITDA1 15% 53% 32% Segment EBITDA excludes Corporate Costs of $42.3 MM 1 Three Integrated Segments 8 |

| Metal Coil Coating Cleans, treats, coats and paints flat-rolled metal coil substrates Slits and/or embosses coated coils Manufacturers of painted steel products: Metal Buildings Light Fixtures HVAC Water Heater Jackets Walk-in Coolers PRODUCTS CUSTOMERS Light Gauge Coil Coating Light Gauge Coil Coating Light Gauge Coil Coating Est. Rank % Market Share Precoat Metals Division 1 18% Roll Coater, Inc. 2 14% NCI 3 12% Steelscape 4 9% MSC Prefinish Metals 5 7% Others N/A 40% Total 100% Heavy Gauge Hot Rolled Steel Coating Heavy Gauge Hot Rolled Steel Coating Heavy Gauge Hot Rolled Steel Coating Est. Rank % Market Share NCI 1 42% Hanna Steel 2 30% Midwest Metal Coaters 3 12% SDI 4 10% Others N/A 6% Total 100% Source: 2009 NCI Estimates STATS Internal: External: Construction All Other END USE MARKET SHARE PERFORMANCE No. of Customers: No. of Employees: No. of Plants: 154 352 5 55% 29% 16% 9 |

| PRODUCTS Metal Components CUSTOMERS Small, medium and large contractors Specialty roofers Engineered building fabricators Distributors/lumberyards End users Pre-formed metal roof and wall systems Insulated metal panels Secondary structural members Flashings and accessories Roll-up doors and interior partition systems Metal Components Metal Components Metal Components Est. Rank % Market Share NCI 1 12% Fabral 2 7% Metal Sales 3 6% McElroy 4 5% Copper Sales/UNA Clad 5 5% Englert 6 4% Others N/A 61% Total 100% Source: 2008 NCI/Strategic Decisions Group No. of Customers: No. of Employees: No. of Plants: STATS Internal: External: Commercial & Industrial Ag & Res Retail END USE (FY 2009) MARKET SHARE PERFORMANCE 26,511 903 18 21.2% 52.7% 23.1% 3.1% 10 |

| Engineered Building Systems Custom engineered buildings Self-storage mini-warehouses Long Bay(r) System Engineered Building Systems Engineered Building Systems Engineered Building Systems Est. Rank % Market Share NCI 1 19% Butler/Varco 1 19% Nucor Building Systems 3 13% Others N/A 49% Total 100% Source: 2008 MBMA Data & NCI Est. PRODUCTS CUSTOMERS Builder network General contractors Developers Custom fabrication customers End users No. of Builders: No. of Employees: No. of Plants: STATS Commercial & Industrial Institutional Agricultural END USE (FY 2009) MARKET SHARE PERFORMANCE SALES CHANNEL 3,447 2,031 9 60% 31% 9% Authorized Builders/Erectors Direct Sales Resellers/Private Label Non-Affiliated Builders 11 |

| 12 Architectural Billings Index Architectural Billings Index |

| 13 Producer Price Index Producer Price Index Charts thru March 2010 |

| 14 McGraw-Hill Construction Activity Non-Residential Historical and Forecast Volume Millions of Square Feet McGraw-Hill McGraw-Hill Linear Trend |

| 15 CRU North American Steel Price Index CRU North America Steel Price Index The CRU North American Steel Price Index has been published by the CRU since 1994. It's based on a survey of industry participants and is commonly used in the settlement of physical and financial contracts within the steel industry. The prices surveyed are purchases for forward delivery, according to lead time, which will vary by approximately one to two months. To better align with NCI's fiscal year, the values shown are from October of each year. (1994 Index = 100) NCI Plan |

| 16 Adjusted Operating Income and Adjusted EBITDA Dotted lines represent future projections Dollars in millions Square feet in billions Source: McGraw-Hill Dollars in millions a Before goodwill amortization for fiscal years 1999-2001 b Before goodwill and other intangible asset impairment, lower of cost or market charges, change in control charges, restructuring charges, asset impairment charges, environmental and other contingency adjustments and executive retirements for fiscal years 2008 and 2009. a, b |

| 17 Historical Performance and Steel Price Volatility Dollars in millions Index Value in October a Before goodwill amortization for fiscal years 1999-2001 b Before goodwill and other intangible asset impairment, lower of cost or market charges, change in control charges, restructuring charges, asset impairment charges, environmental and other contingency adjustments and executive retirements for fiscal years 2008 and 2009. The CRU North American Steel Price Index has been published by the CRU since 1994. It's based on a survey of industry participants and is commonly used in the settlement of physical and financial contracts within the steel industry. The prices surveyed are purchases for forward delivery, according to lead time, which will vary by approximately one to two months. To better align with NCI's fiscal year, the values shown are from October of each year. (1994 Index = 100) Dollars in millions a, b |

| NCI Overview |
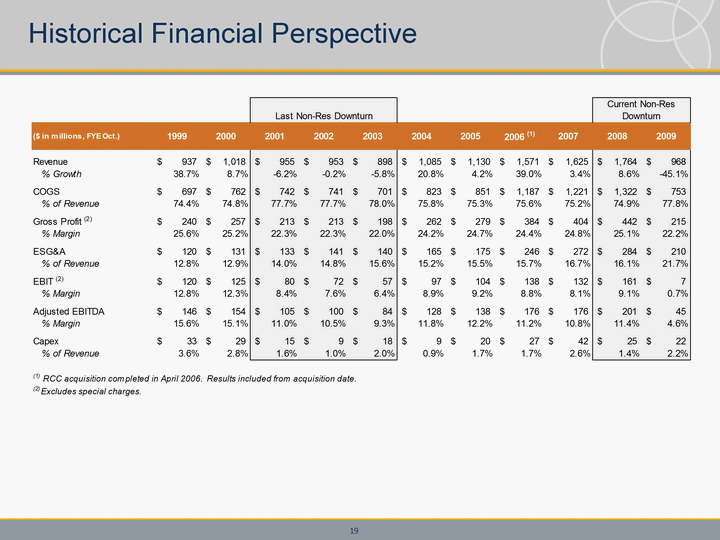
| Historical Financial Perspective 19 |

| 2009 Operational Restructuring Buildings Group Reduced manufacturing facilities from 16 to 9 Maintained customer touch points (sales/service) Transitioned to a single leadership role for both RCC & NCI buildings groups Manufacturing operations reorganized Engineering and Drafting reorganized Components Group Reduced manufacturing facilities from 22 to 18 Maintained the necessary footprint to service external customers and provide support for the Buildings group's needs 20 |
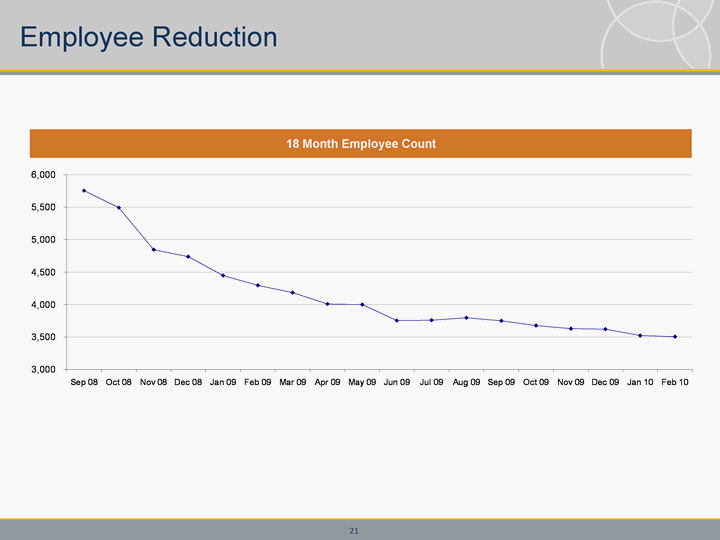
| Employee Reduction 18 Month Employee Count 21 |

| NCI Manufacturing Plants After Reductions MANUFACTURING PLANTS BEFORE AFTER COATERS COMPONENTS BUILDINGS TOTAL *white shapes indicate closed facilities 5 22 16 43 5 18 9 32 22 |

| Significant Cost Reductions Completed Cost Reduction Summary 23 |

| Strategy |

| 25 2008 Five-Year Growth Strategy Corporate-Wide Initiatives Successfully capture share of growing Green building market Continue to identify and assess opportunistic acquisitions Enhance plant utilization through expanded use of Hub & Spoke Distribution model Continue to focus on leveraging Technology and Automation to be lowest cost producer Implement common MRP platform, Financial Shared Services model and Supply Chain automation and efficiencies to allow for more cost reductions across all divisions Coatings Division Diversify external customer base to substantially increase toll and package sales Continue to leverage efficiency improvements to be lowest cost producer Components Division Expand Insulated Panel product offering utilizing our new state-of-the-art manufacturing facility in Jackson, MS Expand Nu-Roof retrofit roofing program Buildings Division Enhance and share Engineering and Drafting technologies across all Building Brands Continue product rationalization across both Building Groups Expand capabilities to serve High Complexity building market Expand material sales by offering Furnish & Erect services to key customers when required As construction markets recover, expand low-cost Frame production Deploy web-based pricing software for small buildings to NCI's Builder Networks |

| Insulated Panels: Product & Process Photos Polyisocyanurate Insulation Exterior Metal Skin Interior Metal Skin 26 |

| Retrofit Roofing: Before & After BEFORE STRUCTURAL BUILD-UP AFTER 27 |

| 28 Efficient Distribution Model 32 manufacturing facilities across the United States and Mexico, with additional sales and distribution offices throughout the nation and Canada. Places manufacturing and distribution operations closer to our customers Faster and lower cost delivery Reduces the need for substantial labor, machinery and inventory investments at each facility Reduces the impact of regional economic cycles NCI Metal Coil Coating NCI Metal Components NCI Engineered Building Systems Manufacturing Plants |
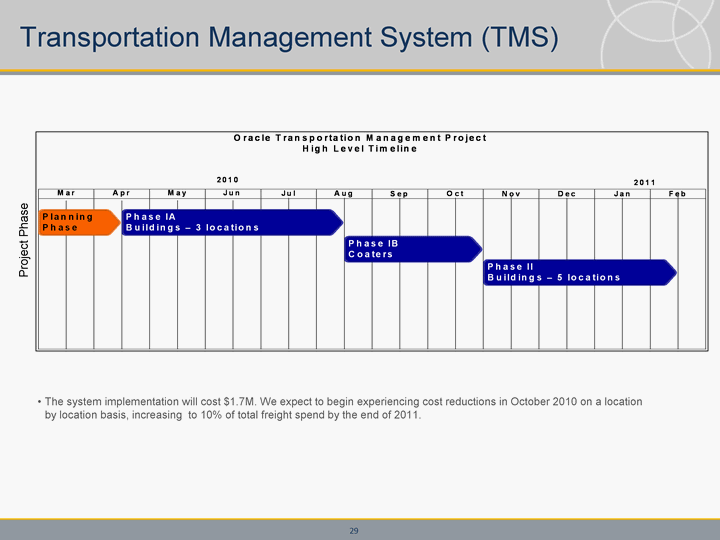
| Transportation Management System (TMS) Project Phase The system implementation will cost $1.7M. We expect to begin experiencing cost reductions in October 2010 on a location by location basis, increasing to 10% of total freight spend by the end of 2011. 29 |

| Financial Data |

| 31 NCI Performance vs. The Industry Overall Nonresidential Construction Spending Source: FW Dodge $234 $333 $408 Outstanding Debt Adjusted EBITDA LTM (in billions) (in millions) $865 $937 $1,018 $955 $953 $898 $1,085 $1,130 $1,571 $1,625 $1,764 $968 (in millions) |

| 32 Seasonal Trends For Fiscal Q1 2004 through Q4 2009 Adjusted EBITDA [in millions] SALES [in millions] |
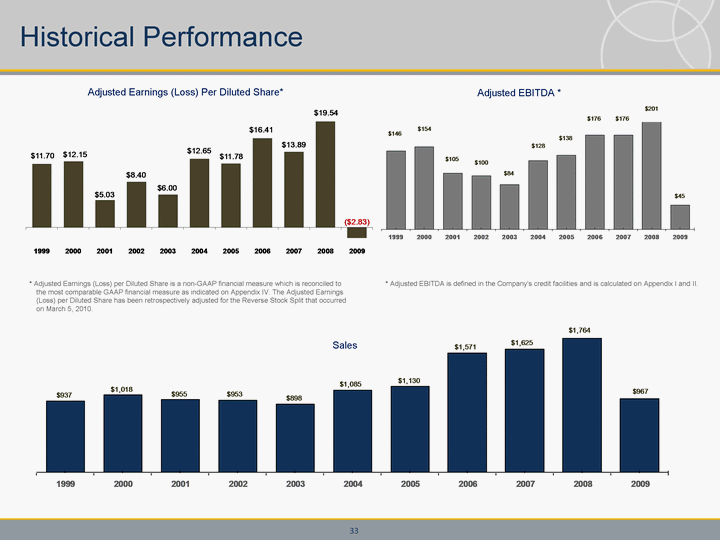
| Historical Performance 33 Sales Adjusted Earnings (Loss) Per Diluted Share* Adjusted EBITDA * * Adjusted Earnings (Loss) per Diluted Share is a non-GAAP financial measure which is reconciled to the most comparable GAAP financial measure as indicated on Appendix IV. The Adjusted Earnings (Loss) per Diluted Share has been retrospectively adjusted for the Reverse Stock Split that occurred on March 5, 2010. * Adjusted EBITDA is defined in the Company's credit facilities and is calculated on Appendix I and II. |
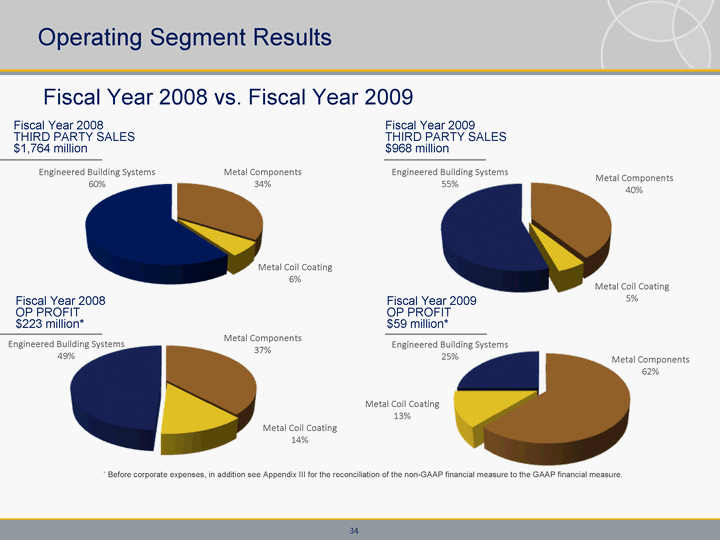
| 34 Operating Segment Results Fiscal Year 2008 vs. Fiscal Year 2009 Fiscal Year 2008 THIRD PARTY SALES $1,764 million Fiscal Year 2008 OP PROFIT $223 million* Fiscal Year 2009 THIRD PARTY SALES $968 million Fiscal Year 2009 OP PROFIT $59 million* Engineered Building Systems 60% Metal Components 34% Metal Coil Coating 6% Engineered Building Systems 49% Metal Components 37% Metal Coil Coating 14% Engineered Building Systems 25% Metal Components 62% Metal Coil Coating 13% Engineered Building Systems 55% Metal Components 40% Metal Coil Coating 5% * Before corporate expenses, in addition see Appendix III for the reconciliation of the non-GAAP financial measure to the GAAP financial measure. |
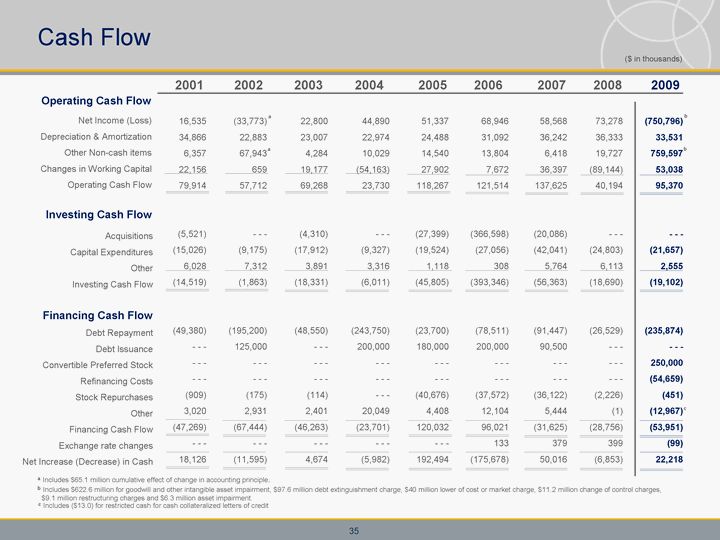
| 35 Cash Flow (750,796) 33,531 759,597 53,038 95,370 - - - (21,657) 2,555 (19,102) (235,874) - - - 250,000 (54,659) (451) (12,967) (53,951) (99) 22,218 a Includes $65.1 million cumulative effect of change in accounting principle. b Includes $622.6 million for goodwill and other intangible asset impairment, $97.6 million debt extinguishment charge, $40 million lower of cost or market charge, $11.2 million change of control charges, $9.1 million restructuring charges and $6.3 million asset impairment. 2007 2005 2004 2003 2002 2001 2006 2008 44,890 22,974 10,029 (54,163) 23,730 - - - (9,327) 3,316 (6,011) (243,750) 200,000 - - - - - - - 20,049 (23,701) - - - (5,982) 22,800 23,007 4,284 19,177 69,268 (4,310) (17,912) 3,891 (18,331) (48,550) - - - - - - - (114) 2,401 (46,263) - - - 4,674 (33,773) 22,883 67,943 659 57,712 - - - (9,175) 7,312 (1,863) (195,200) 125,000 - - - - (175) 2,931 (67,444) - - - (11,595) 16,535 34,866 6,357 22,156 79,914 (5,521) (15,026) 6,028 (14,519) (49,380) - - - - - - - (909) 3,020 (47,269) - - - 18,126 51,337 24,488 14,540 27,902 118,267 (27,399) (19,524) 1,118 (45,805) (23,700) 180,000 - - - - (40,676) 4,408 120,032 - - - 192,494 68,946 31,092 13,804 7,672 121,514 (366,598) (27,056) 308 (393,346) (78,511) 200,000 - - - - (37,572) 12,104 96,021 133 (175,678) 58,568 36,242 6,418 36,397 137,625 (20,086) (42,041) 5,764 (56,363) (91,447) 90,500 - - - - (36,122) 5,444 (31,625) 379 50,016 ($ in thousands) 2009 a Net Income (Loss) Depreciation & Amortization Other Non-cash items Changes in Working Capital Operating Cash Flow Acquisitions Capital Expenditures Other Investing Cash Flow Debt Repayment Debt Issuance Convertible Preferred Stock Refinancing Costs Stock Repurchases Other Financing Cash Flow Exchange rate changes Net Increase (Decrease) in Cash Operating Cash Flow Investing Cash Flow Financing Cash Flow a b b c 73,278 36,333 19,727 (89,144) 40,194 - - - (24,803) 6,113 (18,690) (26,529) - - - - - - - (2,226) (1) (28,756) 399 (6,853) c Includes ($13.0) for restricted cash for cash collateralized letters of credit |

| 36 Capitalization |

| 37 Appendix I Reconciliation of Quarterly Adjusted EBITDA To Net Income (Loss) Note: Adjusted EBITDA is defined in the Company's credit facilities, as amended from time to time. ($ in thousands) Trailing 12 mo. Q1 2006 12,893 8,252 1,991 6,267 1,895 - - - - - - - - - - - - - - - - - - 31,298 Q2 2006 11,179 7,186 3,603 6,776 2,138 - - - - - - - - - - - - - - - - - - 30,882 Q3 2006 21,675 12,655 7,227 8,554 2,111 - - - - - - - - - - - - - - - - - - 52,222 Q4 2006 28,049 17,143 6,662 8,692 1,017 - - - - - - - - - - - - - - - - - - 61,563 Q1 2007 Q2 2007 Q3 2007 Q4 2007 10,453 6,628 7,168 8,156 1,860 - - - - - - - - - - - - - - - - - - 34,265 6,511 4,309 7,305 7,918 2,288 - - - - - - - - - - - - - - - - - - 28,331 21,328 13,846 7,199 9,308 2,262 - - - - - - - - - - - - - - - - - - 53,943 25,437 16,313 6,419 9,301 2,200 - - - - - - - - - - - - - - - - - - 59,670 Net Income (Loss) Income Taxes Interest Expense Depreciation & Amortization Stock-Based Compensation Goodwill & Other Intangible Asset Impairment Cash Restructuring Charges Transaction Costs Lower of Cost or Market Adjustment, Net Asset Impairments (recovery) Gain on Embedded Derivative ADJUSTED EBITDA Q1 2008 6,100 3,823 8,522 9,144 2,871 - - - 226 - - - - - - - - - - - - 30,686 Q2 2008 13,466 8,537 7,748 8,645 3,442 - - - 640 - - - - - - - - - - - - 42,478 Q3 2008 30,494 18,554 7,463 8,665 1,563 - - - 43 - - - - - - - - - - - - 66,782 Q4 2008 23,218 17,092 7,761 8,334 1,628 - - - 150 - - - 2,739 157 - - - 61,079 Q1 2009 (529,981) (34,861) 6,623 8,324 1,372 517,628 2,479 - - - 29,378 623 - - - 1,585 Q2 2009 Q3 2009 Q4 2009 2,607 1,825 6,487 7,586 1,241 - - - 1,213 401 - - - 26 - - - 21,386 (101,851) (7,495) 9,578 7,640 1,045 - - - 1,564 107,718 - - - 347 - - - 18,546 (121,571) (16,382) 6,168 8,436 1,177 104,936 3,796 629 10,608 5,295 - - - 3,092 a On October 20, 2009, the Company amended and restated its Term Note facility which defines adjusted EBITDA. Adjusted EBITDA excludes non-cash charges for goodwill and other asset impairments, lower of cost or market charges and stock compensation as well as certain non-recurring charges. As such, the historical information is presented in accordance with the definition above. Concurrent with the amendment and restatement of the term note facility, the Company entered into an Asset-Backed Lending facility which has substantially the same definition of adjusted EBITDA except that the ABL facility caps certain non-recurring charges. The Company is disclosing adjusted EBITDA, which is a non-GAAP measure, because it is used by management and provided to investors to provide comparability of underlying operational results. a, b Q1 2010 (10,486) (5,779) 4,507 7,522 801 - - - 524 174 - - - 1,029 (919) (2,627) a (117,386) (16,985) 25,242 30,227 4,490 - - - 4,130 108,293 - - - 1,286 (923) 38,374 a, b a, b a, b a, b a, b a, b b Amounts have been retrospectively adjusted as a result of the adoption, effective November 2, 2009, of ASC Subtopic 470-20, "Debt with Conversion and Other Options." Q2 2010 (7,656) (5,536) 4,670 7,479 1,403 - - - 829 - - - - - - (116) (4) 1,069 a, b |
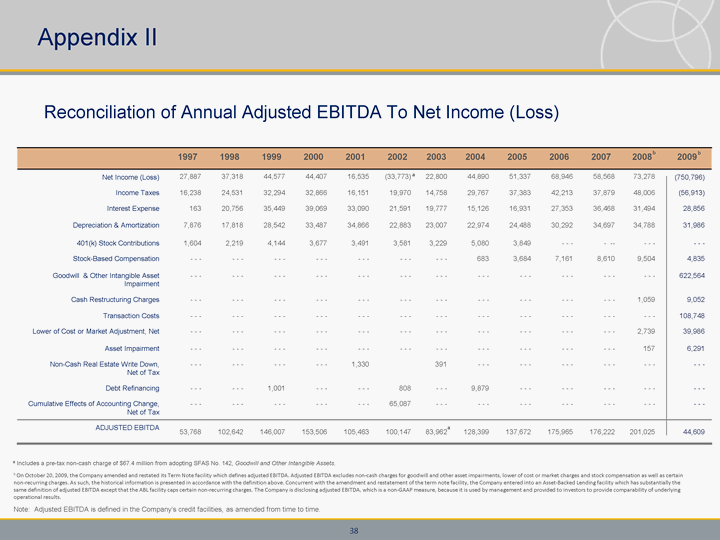
| 1997 1998 1999 2000 2001 2002 2003 2004 2005 2006 2007 2008 2009 Net Income (Loss) 27,887 37,318 44,577 44,407 16,535 (33,773) 22,800 44,890 51,337 68,946 58,568 73,278 (750,796) Income Taxes 16,238 24,531 32,294 32,866 16,151 19,970 14,758 29,767 37,383 42,213 37,879 48,006 (56,913) Interest Expense 163 20,756 35,449 39,069 33,090 21,591 19,777 15,126 16,931 27,353 36,468 31,494 28,856 Depreciation & Amortization 7,876 17,818 28,542 33,487 34,866 22,883 23,007 22,974 24,488 30,292 34,697 34,788 31,986 401(k) Stock Contributions 1,604 2,219 4,144 3,677 3,491 3,581 3,229 5,080 3,849 - - - - -- - - - - - - Stock-Based Compensation - - - - - - - - - - - - - - - - - - - - - 683 3,684 7,161 8,610 9,504 4,835 Goodwill & Other Intangible Asset Impairment - - - - - - - - - - - - - - - - - - - - - - - - - - - - - - - - - - - - 622,564 Cash Restructuring Charges - - - - - - - - - - - - - - - - - - - - - - - - - - - - - - - - - 1,059 9,052 Transaction Costs - - - - - - - - - - - - - - - - - - - - - - - - - - - - - - - - - - - - 108,748 Lower of Cost or Market Adjustment, Net - - - - - - - - - - - - - - - - - - - - - - - - - - - - - - - - - 2,739 39,986 Asset Impairment - - - - - - - - - - - - - - - - - - - - - - - - - - - - - - - - - 157 6,291 Non-Cash Real Estate Write Down, Net of Tax - - - - - - - - - - - - 1,330 391 - - - - - - - - - - - - - - - - - - Debt Refinancing - - - - - - 1,001 - - - - - - 808 - - - 9,879 - - - - - - - - - - - - - - - Cumulative Effects of Accounting Change, Net of Tax - - - - - - - - - - - - - - - 65,087 - - - - - - - - - - - - - - - - - - - - - ADJUSTED EBITDA 53,768 102,642 146,007 153,506 105,463 100,147 83,962 128,399 137,672 175,965 176,222 201,025 44,609 38 Appendix II Reconciliation of Annual Adjusted EBITDA To Net Income (Loss) Note: Adjusted EBITDA is defined in the Company's credit facilities, as amended from time to time. a Includes a pre-tax non-cash charge of $67.4 million from adopting SFAS No. 142, Goodwill and Other Intangible Assets. b On October 20, 2009, the Company amended and restated its Term Note facility which defines adjusted EBITDA. Adjusted EBITDA excludes non-cash charges for goodwill and other asset impairments, lower of cost or market charges and stock compensation as well as certain non-recurring charges. As such, the historical information is presented in accordance with the definition above. Concurrent with the amendment and restatement of the term note facility, the Company entered into an Asset-Backed Lending facility which has substantially the same definition of adjusted EBITDA except that the ABL facility caps certain non-recurring charges. The Company is disclosing adjusted EBITDA, which is a non-GAAP measure, because it is used by management and provided to investors to provide comparability of underlying operational results. a a b b |
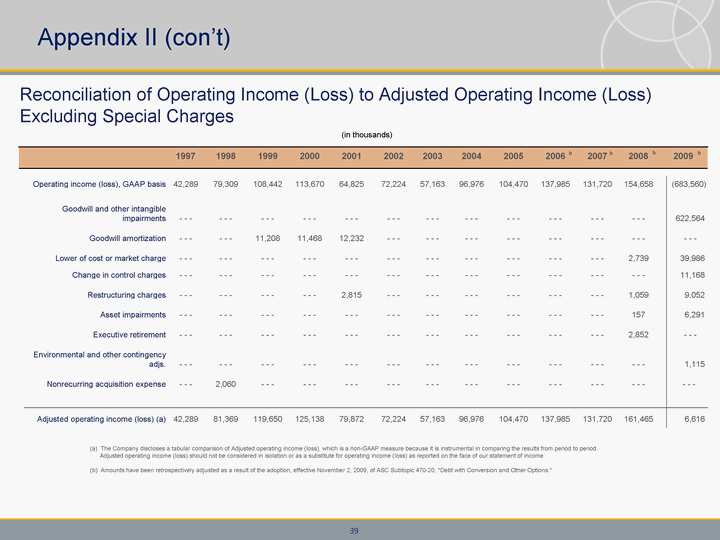
| 1997 1998 1999 2000 2001 2002 2003 2004 2005 2006 2007 2008 2009 Operating income (loss), GAAP basis 42,289 79,309 108,442 113,670 64,825 72,224 57,163 96,976 104,470 137,985 131,720 154,658 (683,560) Goodwill and other intangible impairments - - - - - - - - - - - - - - - - - - - - - - - - - - - - - - - - - - - - 622,564 Goodwill amortization - - - - - - 11,208 11,468 12,232 - - - - - - - - - - - - - - - - - - - - - - - - Lower of cost or market charge - - - - - - - - - - - - - - - - - - - - - - - - - - - - - - - - - 2,739 39,986 Change in control charges - - - - - - - - - - - - - - - - - - - - - - - - - - - - - - - - - - - - 11,168 Restructuring charges - - - - - - - - - - - - 2,815 - - - - - - - - - - - - - - - - - - 1,059 9,052 Asset impairments - - - - - - - - - - - - - - - - - - - - - - - - - - - - - - - - - 157 6,291 Executive retirement - - - - - - - - - - - - - - - - - - - - - - - - - - - - - - - - - 2,852 - - - Environmental and other contingency adjs. - - - - - - - - - - - - - - - - - - - - - - - - - - - - - - - - - - - - 1,115 Nonrecurring acquisition expense - - - 2,060 - - - - - - - - - - - - - - - - - - - - - - - - - - - - - - - - - Adjusted operating income (loss) (a) 42,289 81,369 119,650 125,138 79,872 72,224 57,163 96,976 104,470 137,985 131,720 161,465 6,616 39 Appendix II (con't) b b b b (in thousands) Reconciliation of Operating Income (Loss) to Adjusted Operating Income (Loss) Excluding Special Charges (a) The Company discloses a tabular comparison of Adjusted operating income (loss), which is a non-GAAP measure because it is instrumental in comparing the results from period to period. Adjusted operating income (loss) should not be considered in isolation or as a substitute for operating income (loss) as reported on the face of our statement of income. (b) Amounts have been retrospectively adjusted as a result of the adoption, effective November 2, 2009, of ASC Subtopic 470-20, "Debt with Conversion and Other Options." |

| 40 2009 Recapitalization * On March 5, 2010, the Company filed an amendment to its Certificate of Incorporation to effect the Reverse Stock Split at an exchange ratio of 1-to-5. As such, we have retrospectively adjusted the shares of common stock. |

| 41 41 Simplified Illustration of Diluted EPS Earnings are allocated between those securities that have rights to participate in future dividend distributions based on their relative weighted average ownership interests. Losses are not allocated to participating securities because they are not contractually obligated to fund or otherwise share in those losses. Example B assumes that stock options are dilutive after having applied the treasury stock method. If using the "if converted" method resulted in lower diluted earnings per share than the two class method, the lower amount would generally be reported. However, given the Company's capital structure, this is not likely to occur. |

| 42 42 Convertible Preferred Stock Key Terms Regarding Dividend Payments Dividends may be paid in cash (8% annual rate) or in-kind (12% annual rate) at the Company's option: Dividend payment dates: March 15th, June 15th, September 15th and December 15th. Credit facility restrictions: Both our ABL Facility and Term Loan Credit Facility restrict our ability to pay cash dividends until the first quarter of fiscal 2011. Thereafter, cash dividend payments are generally limited to 50% of the consolidated net income accumulated subsequent to August 2, 2009, subject to specified adjustments, less the sum of all previous distributions. Dividend Elimination or "knock-out": The dividend rate becomes 0% permanently, if at any time after April 2012 the trading price of our common stock exceeds $12.75 (adjusted for stock splits, etc.) for 20 consecutive trading days. However, in the event of a default, as defined, certain penalty dividends may be required. |

| 43 43 Simplified Beneficial Conversion Feature (BCF) Charge Illustration for Paid In-Kind Dividends The daily dividend amount is determined quarterly based on the underlying amount of convertible preferred stock outstanding. The daily dividend amount is accrued at an annual rate of 12% but if it is later paid in cash instead of in-kind, the excess 4% dividend and the related beneficial conversion feature charge would be eliminated in the period in which it is paid. The Company has the option to pay the dividends in cash at 8% or in-kind at 12%, subject to restrictions in the credit facilities for our term loan and ABL revolver. Further, if at any time after April 2012, our stock trades above $12.75 for 20 consecutive trading days, the underlying basic preferred stock dividends are permanently eliminated thereafter. The conversion price of $6.374 reflects the adjustment for the one-for-five reverse stock split that occurred in March 2010. The amount of the beneficial conversion feature charged in any quarter will be the sum of the daily BCF amounts calculated as illustrated above and will depend on the daily closing price of our stock in relation to the $6.374 conversion price. The charge is limited or "capped" at the underlying dividend amount. As an example, based on a daily stock price ranging between $8 and $15, the estimated quarterly charge would be $2 million to $7.9 million. The following table illustrates a few selected dates out of a full quarters calculation of the BCF charge on our Paid In-Kind Dividends: |

| 44 Appendix III Reconciliation of Operating Income (Loss) to Adjusted Operating Income (Loss) Excluding Special Charges Operating income (loss), GAAP basis Goodwill and other intangible asset impairment Lower of cost or market charge Change in control charges Restructuring charges Asset impairment Environmental and other contingency adjustments "Adjusted" operating income (loss) a Operating income (loss), GAAP basis Executive Retirement Lower of cost or market charge Restructuring charges Asset impairment "Adjusted" operating income (loss) a $(99,658) 98,959 8,102 - - - 103 - - - - - - $ 7,506 $29,354 - - - 2,739 - - - - - - $32,093 $(129,991) 147,239 17,152 - - - 1,306 714 - - - $ 36,420 $82,084 - - - - - - 972 - - - $83,056 $(389,328) 376,366 14,732 - - - 7,440 4,368 1,115 $ 14,693 $107,836 - - - - - - 60 157 $108,053 $(64,583) - - - - - - 11,168 203 1,209 - - - $(52,003) $(64,616) 2,852 - - - 27 - - - $(61,737) a The Company discloses a tabular comparison of "Adjusted" operating income (loss), which is a non-GAAP measure because it is referred to in the text of our press release and is instrumental in comparing the results from period to period. "Adjusted" operating income (loss) should not be considered in isolation or as a substitute for operating income (loss) as reported on the face of our statement of income. For the Year Ended November 1, 2009 For the Year Ended November 2, 2008 $(683,560) 622,564 39,986 11,168 9,052 6,291 1,115 $ 6,616 $154,658 2,852 2,739 1,059 157 $161,465 Metal Coil Coating Metal Components Engineered Building Systems Corporate Consolidated Metal Coil Coating Metal Components Engineered Building Systems Corporate Consolidated |

| 1999 2000 2001 2002 2003 2004 2005 2006 2007 2008 2009 Earnings (loss) per diluted share, GAAP basis $11.70 $12.15 $4.55 $(9.05) $6.00 $11.20 $12.08 $15.91 $13.89 $18.49 $(171.18) Goodwill and other intangible asset impairment - - - - - - - - - 17.45 - - - - - - - - - - - - - - - - - - 136.30 Debt extinguishment and refinancing costs - - - - - - - - - - - - - - - 1.45 - - - - - - - - - - - - 21.35 Lower of cost or market adjustment - - - - - - - - - - - - - - - - - - - - - - - - - - - 0.45 5.85 Convertible preferred stock beneficial conversion feature - - - - - - - - - - - - - - - - - - - - - - - - - - - - - - 0.75 Change in control charges - - - - - - - - - - - - - - - - - - - - - - - - - - - - - - 1.55 Restructuring charge - - - - - - 0.48 - - - - - - - - - - - - - - - - - - 0.15 1.25 Asset impairment - - - - - - - - - - - - - - - - - - - - - - - - - - - - - - 0.90 Interest rate swap - - - - - - - - - - - - - - - - - - - - - - - - - - - - - - 0.30 Environmental and other contingency adjustments - - - - - - - - - - - - - - - - - - - - - - - - - - - - - - 0.10 Executive retirement costs - - - - - - - - - - - - - - - - - - - - - - - - - - - 0.45 - - - Group medical benefit - - - - - - - - - - - - - - - - - - (0.30) - - - - - - - - - - - - Adoption of FAS 123 (R) - - - - - - - - - - - - - - - - - - - - - 0.50 - - - - - - - - - "Adjusted" diluted earnings (loss) per share $11.70 $12.15 $5.03 $8.40 $6.00 $12.65 $11.78 $16.41 $13.89 $19.54 $(2.83) 45 Adjusted Earnings(Loss) Per Diluted Share Appendix IV a The Company discloses a tabular comparison of "Adjusted" earnings (loss) per diluted share and net income (loss), which are non-GAAP measures because they are referred to in the text of our press releases and are instrumental in comparing the results from period to period. "Adjusted" diluted earnings (loss) per share and net income (loss) should not be considered in isolation or as a substitute for earnings (loss) per diluted share and net income (loss) as reported on the face of our statement income. a, b b On March 5, 2010, the Company filed an amendment to its Certificate of Incorporation to effect the Reverse Stock Split at an exchange ratio of 1-for-5. As such, we have retrospectively adjusted basic and diluted earnings per share, common stock, stock options, and common stock equivalents for the reverse stock split in all periods presented. |
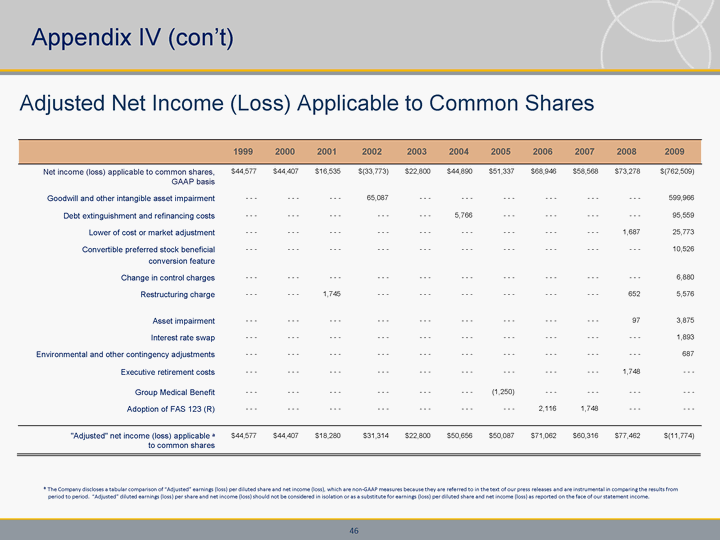
| 1999 2000 2001 2002 2003 2004 2005 2006 2007 2008 2009 Net income (loss) applicable to common shares, GAAP basis $44,577 $44,407 $16,535 $(33,773) $22,800 $44,890 $51,337 $68,946 $58,568 $73,278 $(762,509) Goodwill and other intangible asset impairment - - - - - - - - - 65,087 - - - - - - - - - - - - - - - - - - 599,966 Debt extinguishment and refinancing costs - - - - - - - - - - - - - - - 5,766 - - - - - - - - - - - - 95,559 Lower of cost or market adjustment - - - - - - - - - - - - - - - - - - - - - - - - - - - 1,687 25,773 Convertible preferred stock beneficial conversion feature - - - - - - - - - - - - - - - - - - - - - - - - - - - - - - 10,526 Change in control charges - - - - - - - - - - - - - - - - - - - - - - - - - - - - - - 6,880 Restructuring charge - - - - - - 1,745 - - - - - - - - - - - - - - - - - - 652 5,576 Asset impairment - - - - - - - - - - - - - - - - - - - - - - - - - - - 97 3,875 Interest rate swap - - - - - - - - - - - - - - - - - - - - - - - - - - - - - - 1,893 Environmental and other contingency adjustments - - - - - - - - - - - - - - - - - - - - - - - - - - - - - - 687 Executive retirement costs - - - - - - - - - - - - - - - - - - - - - - - - - - - 1,748 - - - Group Medical Benefit - - - - - - - - - - - - - - - - - - (1,250) - - - - - - - - - - - - Adoption of FAS 123 (R) - - - - - - - - - - - - - - - - - - - - - 2,116 1,748 - - - - - - "Adjusted" net income (loss) applicable a to common shares $44,577 $44,407 $18,280 $31,314 $22,800 $50,656 $50,087 $71,062 $60,316 $77,462 $(11,774) 46 Adjusted Net Income (Loss) Applicable to Common Shares Appendix IV (con't) a The Company discloses a tabular comparison of "Adjusted" earnings (loss) per diluted share and net income (loss), which are non-GAAP measures because they are referred to in the text of our press releases and are instrumental in comparing the results from period to period. "Adjusted" diluted earnings (loss) per share and net income (loss) should not be considered in isolation or as a substitute for earnings (loss) per diluted share and net income (loss) as reported on the face of our statement income. |

| 39,031 26,223 12,808 3,119 86,806 16,668 70,138 1,791 102,618 2,677 99,941 5,829 228,455 45,568 182,887 12,743 ( ) ( ) ( ) ( ) ( ) ( ) ( ) ( ) ( ) ( ) ( ) ( ) ( ) ( ) ( ) ( ) ( ) ( ) 47 Appendix V 59,219 42,788 16,431 4,643 146,093 22,838 123,255 8,839 229,169 9,354 219,815 23,948 434,481 74,980 359,501 24,233 14% 5% 28% 33% 34% 7% 53% 61% 11% 100% 100% 7% 62,275 42,893 19,382 2,695 145,167 21,804 123,363 9,522 226,399 7,655 218,744 20,438 433,841 72,352 361,489 18,496 ( ) ( ) ( ) ( ) Reconciliation of Segment Sales to Third Party Segment Sales Metal Coil Coating Total Sales Inter-segment Third Party Sales Operating Profit (Loss) Metal Components Total Sales Inter-segment Third Party Sales Operating Profit (Loss) Engineered Building Systems Total Sales Inter-segment Third Party Sales Operating Profit (Loss) Consolidated Total Sales Inter-segment Third Party Sales Operating Profit (Loss) Q1 2007 Q1 2008 14% 5% 14% 34% 34% 8% 52% 61% 9% 100% 100% 5% ($ in thousands) ( ) ( ) ( ) ( ) Q1 2010 17% 7% 24% 38% 38% 3% 45% 55% 6% 100% 100% 7% ( ) ( ) a Includes special charges: $517.6 million related to goodwill and intangible asset impairments; $29.4 million related to inventory lower of cost or market write downs; and $3.1 million related to plant closings and restructuring. a 41,501 30,077 11,424 63,760 121,480 20,438 101,042 128,607 152,409 4,511 147,898 352,283 315,390 55,026 260,364 557,902 Q1 2009 13% 4% 558% 39% 39% 127% 48% 57% 238% 100% 100% 214% b Amounts have been retrospectively adjusted as a result of the adoption, effective November 2, 2009, of ASC Subtopic 470-20, "Debt with Conversion and Other Options." |

| 48 Appendix V (con't) 63,844 43,019 20,825 5,761 149,684 23,376 126,308 7,548 229,861 9,082 220,779 17,315 443,389 75,477 367,912 17,475 14% 6% 28% 34% 34% 6% 52% 60% 8% 100% 100% 5% 142,446 95,776 46,670 9,400 310,551 47,835 262,716 24,693 486,052 17,806 468,246 45,730 939,049 161,417 777,632 48,008 123,063 85,807 37,256 10,404 295,777 46,214 249,563 16,387 459,030 18,436 440,594 41,263 877,870 150,457 727,413 41,708 80,171 52,883 27,288 6,705 165,384 26,031 139,353 15,171 259,653 10,151 249,502 25,292 505,208 89,065 416,143 29,512 Reconciliation of Segment Sales to Third Party Segment Sales Metal Coil Coating Total Sales Inter-segment Third Party Sales Operating Profit(Loss) Metal Components Total Sales Inter-segment Third Party Sales Operating Profit(Loss) Engineered Building Systems Total Sales Inter-segment Third Party Sales Operating Profit(Loss) Consolidated Total Sales Inter-segment Third Party Sales Operating Profit(Loss) Q2 2007 Q2 2008 YTD Q2 2007 YTD Q2 2008 15% 6% 20% 33% 34% 9% 52% 60% 10% 100% 100% 6% 14% 5% 28% 34% 34% 7% 52% 61% 9% 100% 100% 6% 16% 7% 25% 33% 33% 11% 51% 60% 10% 100% 100% 7% ($ in thousands) ( ) ( ) ( ) ( ) Q2 2010 YTD Q2 2009 17% 8% 24% 38% 37% 5% 45% 55% - 5% 100% 100% - 6% ( ) * Includes special charges: $104.9 million related to goodwill and intangible asset impairments ($622.6 million YTD); $10.6 million related to inventory lower of cost or market write downs ($40.0 million YTD); and $9.1 million related to plant closings and restructuring ($12.2 million YTD). * * 83,790 53,886 29,904 7,211 181,875 37,361 144,514 7,404 216,806 5,979 210,827 11,491 482,471 97,226 385,245 21,913 ( ) ( ) ( ) ( ) ( ) 39,526 27,313 12,213 42,982 101,554 14,874 86,680 28,117 129,233 3,407 125,826 46,376 270,313 45,594 224,719 132,044 ( ) ( ) ( ) ( ) ( ) ( ) ( ) Q2 2009 15% 5% n/a 37% 39% n/a 48% 56% n/a 100% 100% n/a 44,759 27,663 17,096 4,092 95,069 20,693 74,376 5,613 114,188 3,302 110,886 5,662 254,016 51,658 202,358 9,170 18% 8% 24% 37% 37% 8% 45% 55% - 5% 100% 100% - 5% ( ) ( ) ( ) ( ) ( ) ( ) YTD Q2 2010 ( ) ( ) ( ) ( ) ( ) ( ) ( ) ( ) 81,027 57,390 26,637 106,742 223,034 35,312 187,722 156,724 281,642 7,918 273,724 398,659 585,703 100,620 485,083 689,946 14% 5% n/a 38% 39% n/a 48% 56% n/a 100% 100% n/a ( ) ( ) ( ) ( ) ( ) ( ) ( ) ( ) ( ) ( ) ( ) ( ) ( ) |

| 49 72,275 49,013 23,262 8,165 178,312 26,849 151,463 14,153 271,151 11,795 259,356 33,575 521,738 87,657 434,081 42,247 14% 5% 35% 34% 35% 9% 52% 60% 13% 100% 100% 10% 233,178 158,618 74,560 20,760 513,377 82,202 431,175 56,867 778,767 29,274 749,493 74,244 1,525,322 270,094 1,255,228 103,723 ( ) ( ) ( ) ( ) 195,338 134,820 60,518 18,569 474,089 73,063 401,026 30,540 730,181 30,231 699,950 74,838 1,399,608 238,114 1,161,494 83,955 90,732 62,842 27,890 11,360 202,826 34,367 168,459 32,174 292,715 11,468 281,247 28,514 586,273 108,677 477,596 55,715 ( ) ( ) ( ) ( ) Reconciliation of Segment Sales to Third Party Segment Sales Metal Coil Coating Total Sales Inter-segment Third Party Sales Operating Profit (Loss) Metal Components Total Sales Inter-segment Third Party Sales Operating Profit (Loss) Engineered Building Systems Total Sales Inter-segment Third Party Sales Operating Profit (Loss) Consolidated Total Sales Inter-segment Third Party Sales Operating Profit (Loss) Q3 2007 Q3 2008 YTD Q3 2007 YTD Q3 2008 15% 6% 28% 34% 34% 13% 51% 60% 10% 100% 100% 8% 14% 5% 31% 34% 35% 8% 52% 60% 11% 100% 100% 7% 15% 6% 41% 35% 35% 19% 50% 59% 10% 100% 100% 12% ($ in thousands) ( ) ( ) ( ) ( ) ( ) ( ) ( ) ( ) 44,256 28,196 16,060 1,023 113,216 17,134 96,082 13,162 130,398 4,101 126,297 9,038 287,870 49,431 238,439 10,264 ( ) ( ) ( ) ( ) Q3 2009 15% 7% 6% 40% 40% 14% 45% 53% 7% 100% 100% 4% 125,283 85,586 39,697 105,675 336,250 52,446 283,804 143,536 412,040 12,019 400,021 389,806 873,573 150,051 723,522 679,797 ( ) ( ) ( ) ( ) ( ) ( ) ( ) YTD Q3 2009 14% 6% n/a 39% 39% n/a 47% 55% n/a 100% 100% n/a ( ) * * Includes special changes: goodwill and intangible asset impairments ($622.6 million YTD); inventory lower of cost or market write downs ($40.0 million YTD); and $1.2 million related to plant closings and restructuring ($13.4 million YTD). * Appendix V (con't) |
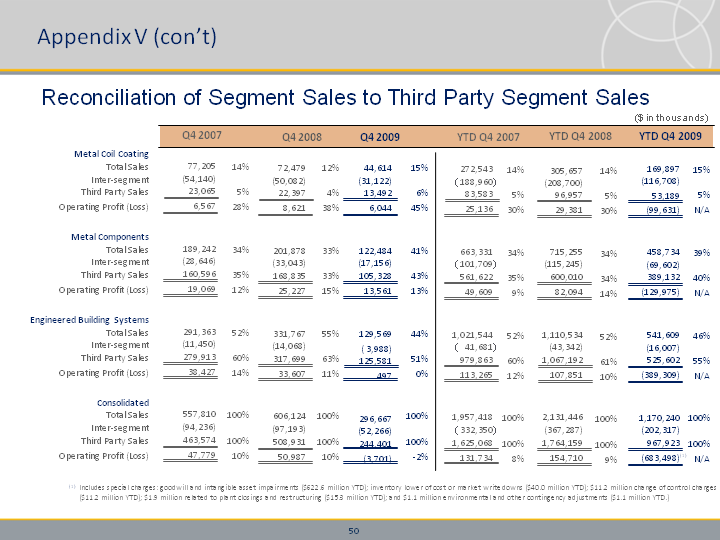
| 50 169,897 (116,708) 53,189 (99,631) 458,734 (69,602) 389,132 (129,975) 541,609 (16,007) 525,602 (389,309) 1,170,240 (202,317) 967,923 (683,498) 44,614 (31,122) 13,492 6,044 122,484 (17,156) 105,328 13,561 129,569 ( 3,988) 125,581 497 296,667 (52,266) 244,401 (3,701) Reconciliation of Segment Sales to Third Party Segment Sales Metal Coil Coating Total Sales Inter-segment Third Party Sales Operating Profit (Loss) Metal Components Total Sales Inter-segment Third Party Sales Operating Profit (Loss) Engineered Building Systems Total Sales Inter-segment Third Party Sales Operating Profit (Loss) Consolidated Total Sales Inter-segment Third Party Sales Operating Profit (Loss) Q4 2009 YTD Q4 2009 15% 5% N/A 39% 40% N/A 46% 55% N/A 100% 100% N/A 15% 6% 45% 41% 43% 13% 44% 51% 0% 100% 100% -2% ($ in thousands) Includes special changes: goodwill and intangible asset impairments ($622.6 million YTD); inventory lower of cost or market write downs ($40.0 million YTD); ($11.2 million YTD) and $1.9 million related to plant closings and restructuring ($15.3 million YTD); and $1.1 million environmental and other contingency adjustments ($1.1 million YTD.) 72,479 (50,082) 22,397 8,621 201,878 (33,043) 168,835 25,227 331,767 (14,068) 317,699 33,607 606,124 (97,193) 508,931 50,987 Q4 2008 12% 4% 38% 33% 33% 15% 55% 63% 11% 100% 100% 10% 305,657 (208,700) 96,957 29,381 715,255 (115,245) 600,010 82,094 1,110,534 (43,342) 1,067,192 107,851 2,131,446 (367,287) 1,764,159 154,710 YTD Q4 2008 14% 5% 30% 34% 34% 14% 52% 61% 10% 100% 100% 9% 77,205 (54,140) 23,065 6,567 189,242 (28,646) 160,596 19,069 291,363 (11,450) 279,913 38,427 557,810 (94,236) 463,574 47,779 14% 5% 28% 34% 35% 12% 52% 60% 14% 100% 100% 10% Q4 2007 272,543 188,960 83,583 25,136 663,331 101,709 561,622 49,609 1,021,544 41,681 979,863 113,265 1,957,418 332,350 1,625,068 131,734 YTD Q4 2007 14% 5% 30% 34% 35% 9% 52% 60% 12% 100% 100% 8% ( ) ( ) ( ) ( ) (1) (1) Appendix V (con't) |

| 10943 North Sam Houston Parkway West Houston, Texas 77064 www.ncilp.com 061810 |