Attached files
| file | filename |
|---|---|
| 8-K - FORM 8-K - PEABODY ENERGY CORP | c58684e8vk.htm |
Exhibit 99.1

| 2010 Analyst and Investor Forum June 17, 2010 |

| Statement on Forward-Looking Information Some of the following information contains forward-looking statements within the meaning of Section 27A of the Securities Act of 1933 and Section 21E of the Securities Exchange Act of 1934, as amended, and is intended to come within the safe-harbor protection provided by those sections. Our forward-looking statements are based on numerous assumptions that the company believes are reasonable, but they are open to a wide range of uncertainties and business risks that may cause actual results to differ materially from expectations as of June 17, 2010. These factors are difficult to accurately predict and may be beyond the company's control. The company does not undertake to update its forward-looking statements. Factors that could affect the company's results include, but are not limited to: demand for coal in United States and international power generation and steel production markets; price volatility and demand, particularly in higher-margin products and in our trading and brokerage businesses; reductions and/or deferrals of purchases by major customers and ability to renew sales contracts; credit and performance risks associated with customers, suppliers, trading, banks and other financial counterparties; geologic, equipment, permitting and operational risks related to mining; transportation availability, performance and costs; availability, timing of delivery and costs of key supplies, capital equipment or commodities such as diesel fuel, steel, explosives and tires; impact of weather on demand, production and transportation; successful implementation of business strategies, including our Btu Conversion and generation development initiatives; negotiation of labor contracts, employee relations and workforce availability; changes in postretirement benefit and pension obligations and funding requirements; replacement and development of coal reserves; access to capital and credit markets and availability and costs of credit, margin capacity, surety bonds, letters of credit, and insurance; effects of changes in interest rates and currency exchange rates (primarily the Australian dollar); effects of acquisitions or divestitures; economic strength and political stability of countries in which we have operations or serve customers; legislation, regulations and court decisions or other government actions, including new environmental requirements affecting the use of coal; litigation, including claims not yet asserted; and other risks detailed in the company's reports filed with the Securities and Exchange Commission (SEC). The use of "Peabody," "the company," and "our" relate to Peabody, its subsidiaries and majority-owned affiliates. EBITDA or Adjusted EBITDA is defined as income from continuing operations before deducting net interest expense, income taxes, asset retirement obligation expense, and depreciation, depletion and amortization. EBITDA, which is not calculated identically by all companies, is not a substitute for operating income, net income or cash flow as determined in accordance with United States generally accepted accounting principles. Management uses EBITDA as a key measure of operating performance and also believes it is a useful indicator of the company's ability to meet debt service and capital expenditure requirements. Adjusted Income from Continuing Operations and Adjusted EPS are defined as income from continuing operations and diluted earnings per share excluding the impact of the remeasurement of foreign income tax accounts. Management has included these measures because, in management's opinion, excluding such impact is a better indicator of the company's ongoing effective tax rate and diluted earnings per share, and is therefore more useful in comparing the company's results with prior and future periods. 06/17/10 |

| 2010 Analyst and Investor Forum We are at the early stages of a long-term supercycle for coal Peabody has a unique asset base, market position and growth prospects BTU has substantial valuation upside from both rising earnings and multiples Key Takeaways: Our View |
| Our Goal is to Create Exceptional Shareholder Value Capturing volume and pricing upside Expanding Australia met and thermal platform Seizing on PRB and Illinois Basin opportunities Stabilizing costs and expanding margins Expanding our global coal trading network Developing a 100 MTPA production base in Asia |
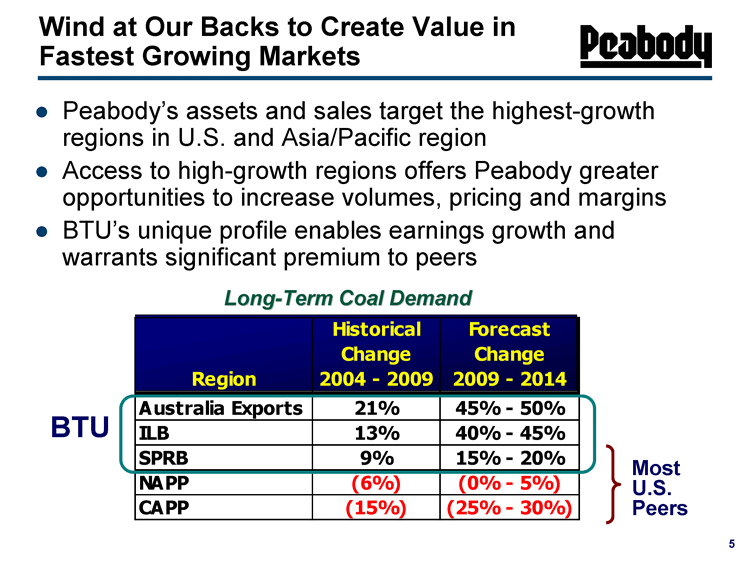
| Wind at Our Backs to Create Value in Fastest Growing Markets Peabody’s assets and sales target the highest-growth regions in U.S. and Asia/Pacific region A hih h i ff Access to high-growth regions offers Peabody greater opportunities to increase volumes, pricing and margins BTU’s unique profile enables earnings growth and warrants significant premium to peers Long-Term Coal Demand Region Historical Change 2004 - 2009 Forecast Change 2009 - 2014 Australia Exports 21% 45% - 50% ILB 13% 40% - 45% SPRB 9% 15% - 20% NAPP (6%) (0% 5%) BTU Most U S 5 - CAPP (15%) (25% - 30%) U.S. Peers |
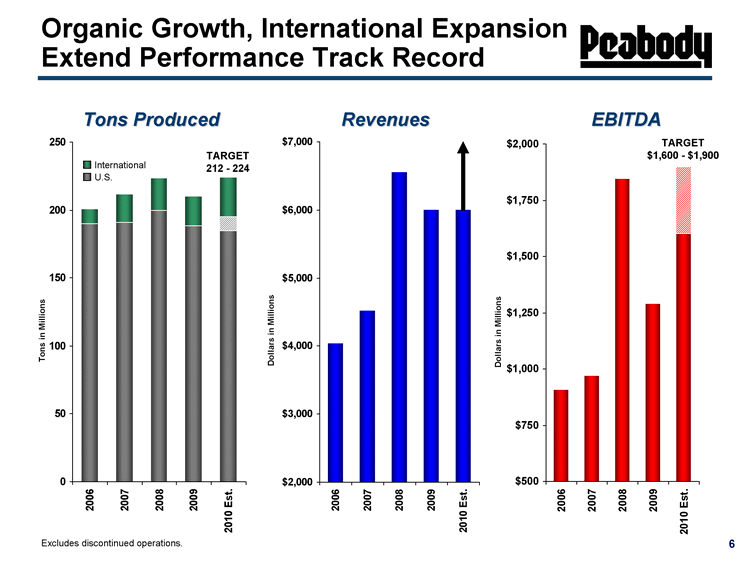
| Organic Growth, International Expansion Extend Performance Track Record 2006 2007 2008 2009 2010 Est. 4046 4524 6561 6012 6012 2006 2007 2008 2009 2010 Est. 910 970 1847 1290 1600 300 Dollars in Millions TARGET $1,600 - $1,900 Dollars in Millions Tons Produced 2006 2007 2008 2009 2010 Est. U.S. 190.1 191.1 199.7 188.3 185 Australia 10.5 20.6 24.1 21.7 10 29 Revenues EBITDA TARGET 212 - 224 Tons in Millions U.S. International Excludes discontinued operations. |
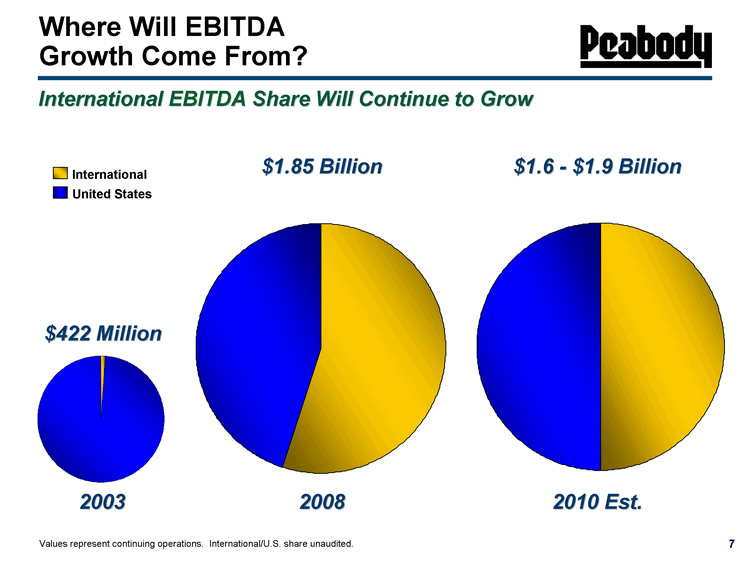
| Where Will EBITDA Growth Come From? 1st Qtr 2nd Qtr 1 99 2003 International EBITDA Share Will Continue to Grow United States International $422 Million Values represent continuing operations. International/U.S. share unaudited. International U.S. 50 50 2010 Est. $1.6 - $1.9 Billion 1st Qtr 2nd Qtr 55 45 2008 $1.85 Billion |
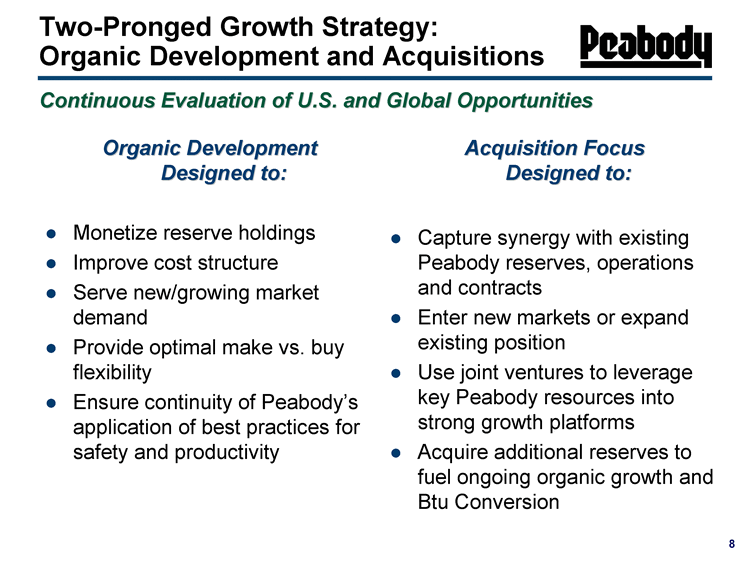
| Two-Pronged Growth Strategy: Organic Development and Acquisitions Continuous Evaluation of U.S. and Global Opportunities Acquisition Focus Designed to: Capture synergy with existing Peabody reserves, operations and contracts Enter new markets or expand existing position Use joint ventures to leverage key Peabody resources into strong growth platforms Acquire additional reserves to fuel ongoing organic growth and Btu Conversion Organic Development Designed to: Monetize reserve holdings Improve cost structure Serve new/growing market demand Provide optimal make vs. buy flexibility Ensure continuity of Peabody's application of best practices for safety and productivity |

| Peabody Advancing Robust China Project Pipeline 20 MTPA Open-Cut JV Project Shaxi Lu'an 15 MTPA Open-Cut JV Project 12 MTPA Open-Cut JV Fueling Coal- to-Chemicals Project 15 MTPA Open-Cut JV Fueling Clean Coal Project 15 MTPA Open-Cut JV Project Beijing 6% Equity Partner GreenGen Clean Coal Project Tianjin Shanghai Coal Supply Under Long-term Contracts Major Generation, Steel and Conversion Customers Xinjiang Inner Mongolia Yunnan Guangdong Hong Kong Fujian Zhejiang 15 MTPA Open-Cut JV Project 20 MTPA Open-Cut JV Project Legend Taiwan 30 MTPA Open-Cut JV Project Long-term Initiative Mid-term Initiative Near-to-long term Near-term Initiative Closed deal 9 |
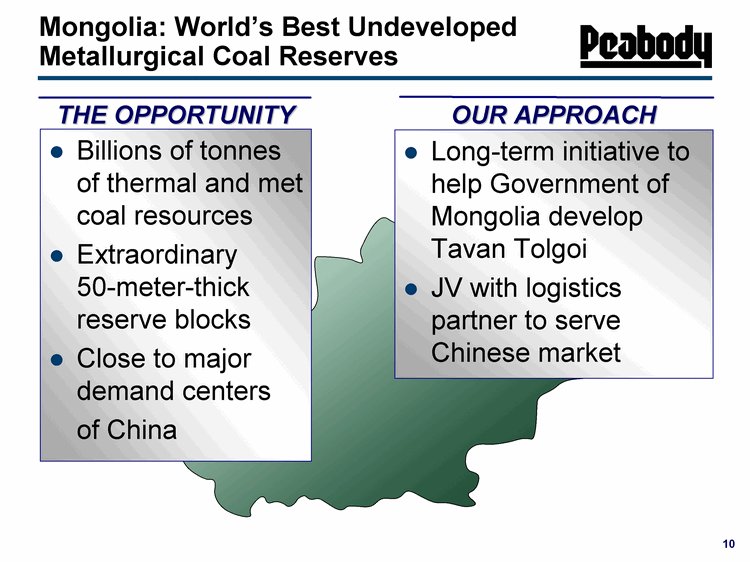
| Mongolia: World's Best Undeveloped Metallurgical Coal Reserves THE OPPORTUNITY OUR APPROACH Long-term initiative to help Government of Mongolia develop Tavan Tolgoi JV with logistics partner to serve Chinese market Billions of tonnes of thermal and met coal resources Extraordinary 50-meter-thick reserve blocks Close to major demand centers of China |

| Peabody JV Licenses and TT Close to Northern China Markets Source: SouthGobi Resources. High Priority Peabody-Polo Licenses Other Mines Railway Planned Railway Railway under construction Major paved road Other road Tavan Tolgoi SouthGobi Resources Production: 1.0MMtpa MAK - JV with Qinghua Group Production: 1.5MMtpa Oyu Tolgoi (Copper-Gold) MAK Production:3.0MMtpa MAK Production: 0.5MMtpa Gurvantes Val Hud Erds Khashaat Union Exports |
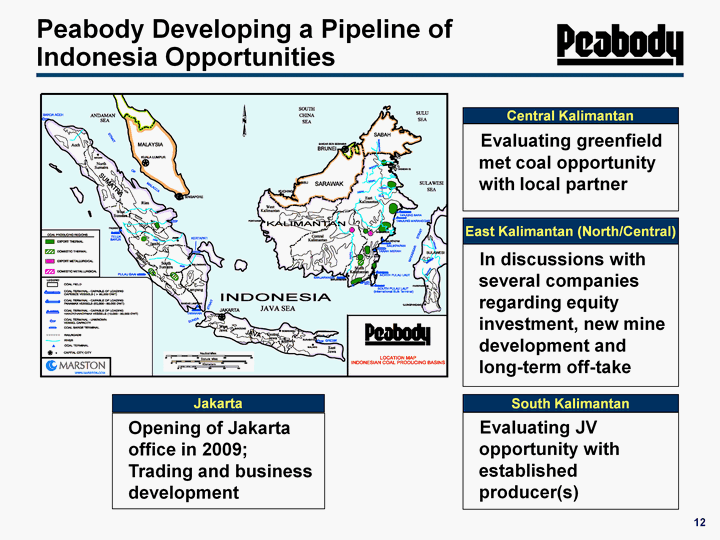
| East Kalimantan (North/Central) In discussions with several companies regarding equity investment, new mine development and long-term off-take South Kalimantan Evaluating JV opportunity with established producer(s) Peabody Developing a Pipeline of Indonesia Opportunities Central Kalimantan Evaluating greenfield met coal opportunity with local partner Jakarta Opening of Jakarta office in 2009; Trading and business development 12 |
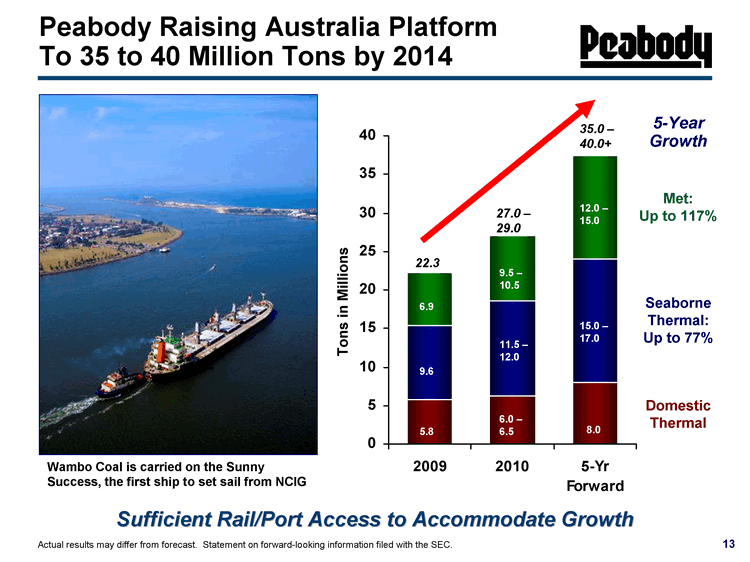
| 2009 2010 5-Yr Forward Domestic Thermal 5.8 6.25 8 Seaborne Thermal 9.6 12.25 16 Seaborne Met 6.9 8.5 13.5 1.5 2.5 2.5 6.0 - 6.5 11.5 - 12.0 9.5 - 10.5 8.0 15.0 - 17.0 12.0 - 15.0 27.0 - 29.0 35.0 - 40.0+ Peabody Raising Australia Platform To 35 to 40 Million Tons by 2014 Met: Up to 117% Seaborne Thermal: Up to 77% 5-Year Growth Tons in Millions Actual results may differ from forecast. Statement on forward-looking information filed with the SEC. Domestic Thermal 6.9 9.6 5.8 22.3 Wambo Coal is carried on the Sunny Success, the first ship to set sail from NCIG Sufficient Rail/Port Access to Accommodate Growth |
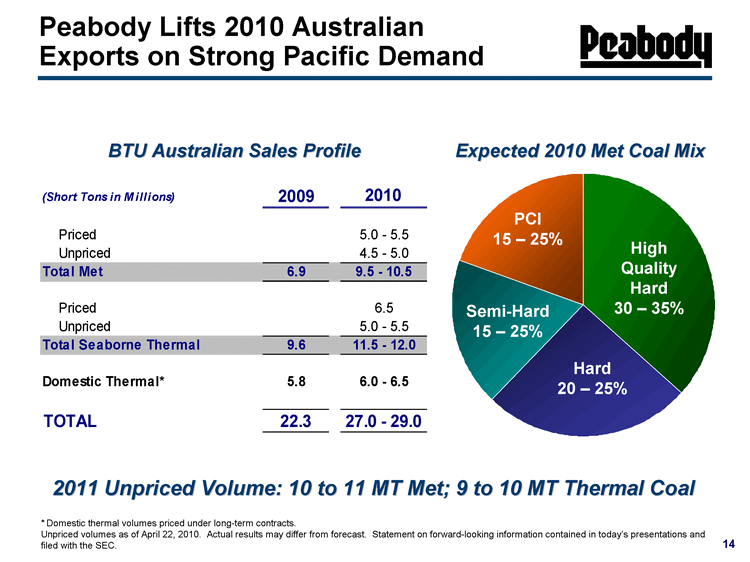
| Peabody Lifts 2010 Australian Exports on Strong Pacific Demand Peabody's Australian Sales Profile BTU Australian Sales Profile Expected 2010 Met Coal Mix (Short Tons in M illions) 2009 2010 Priced 5.0 - 5.5 eabody s ust a a Sa es o e PCI 15 25% p Unpriced 4.5 5.0 Total Met 6.9 9.5 10.5 Priced 6.5 High Quality Hard Semi-Hard 30 35% Unpriced 5.0 5.5 Total Seaborne Thermal 9.6 11.5 12.0 Domestic Thermal* 5.8 6.0 6.5 Hard 20 25% 15 25% TOTAL 22.3 27.0 29.0 U i d V l t M t t Th l C l 14 *Domestic thermal volumes priced under long-term contracts. Unpriced volumes as of April 22, 2010. Actual results may differ from forecast. Statement on forward-looking information contained in today’s presentations and filed with the SEC. 2011 Unpriced Volume: 10 to 11 MT Met; 9 to 10 MT Thermal Coal |
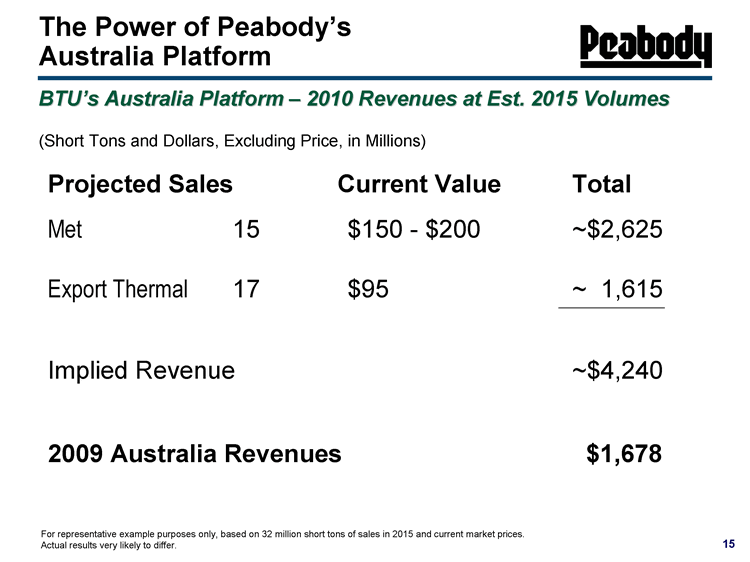
| Projected Sales Current Value Total Met 15 $150 - $200 ~$2,625 Export Thermal 17 $95 ~ 1,615 Implied Revenue ~$4,240 2009 Australia Revenues $1,678 The Power of Peabody’s Australia Platform BTU's Australia Platform - 2010 Revenues at Est. 2015 Volumes For representative example purposes only, based on 32 million short tons of sales in 2015 and current market prices. Actual results very likely to differ. (Short Tons and Dollars, Excluding Price, in Millions) |

| Australia 5-Year Project Pipeline Peabody's Australian Growth Projects Target Exports Short tons in millions. 'S' for surface, 'UG' for underground. Cap-ex per ton range excludes Denham development. Average Cap-Ex Per Ton: $50 to $70 for Thermal and Most Met ProjectsLikely Several Times That for Denham 16 |

| Australia Tax Proposal: Major Changes Are Likely Some form of the RSPT will likely be implemented, with concessionsWe continue to move ahead on all projects in the design and permitting stagesThe development lead time on organic growth projects allows flexibility as the proposal evolvesWe remain hopeful that meaningful improvements will be made toward a reasonable outcome 17 |
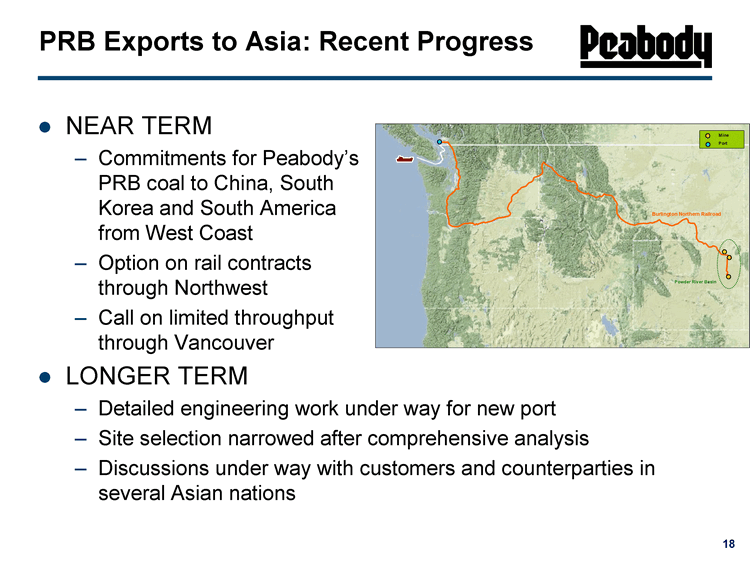
| PRB Exports to Asia: Recent Progress NEAR TERM Commitments for Peabody's PRB coal to China, South Korea and South America from West Coast Option on rail contracts through Northwest Call on limited throughput through Vancouver LONGER TERM Detailed engineering work under way for new port Site selection narrowed after comprehensive analysis Discussions under way with customers and counterparties in several Asian nations |
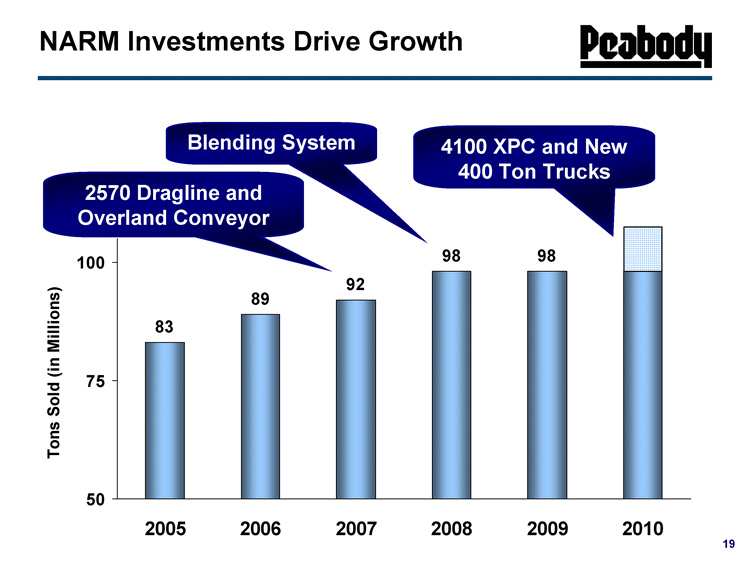
| 4 2005 2006 2007 2008 2009 2010 83 89 92 98 98 98 7 6.75 6.5 6.25 6 2570 Dragline and Overland Conveyor Blending System 4100 XPC and New 400 Ton Trucks NARM Investments Drive Growth |
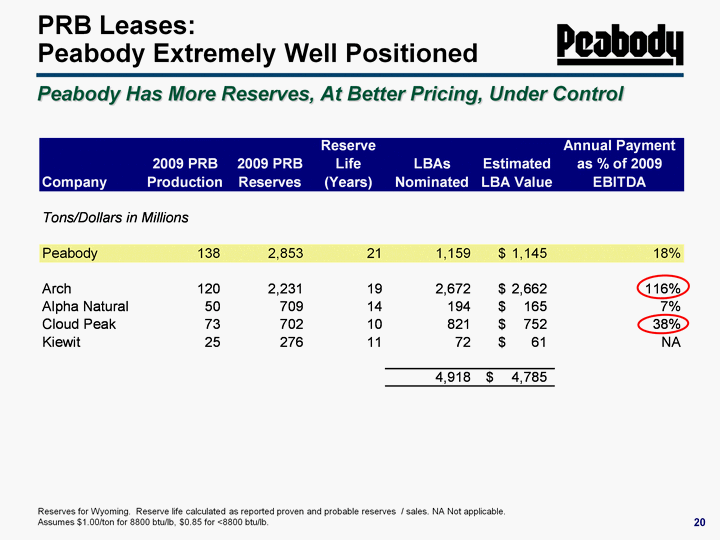
| t PRB Leases: Peabody Extremely Well Positioned Peabody Has More Reserves, At Better Pricing, Under Control Reserves for Wyoming. Reserve life calculated as reported proven and probable reserves / sales. NA Not applicable. Assumes $1.00/ton for 8800 btu/lb, $0.85 for <8800 btu/lb. 20 |
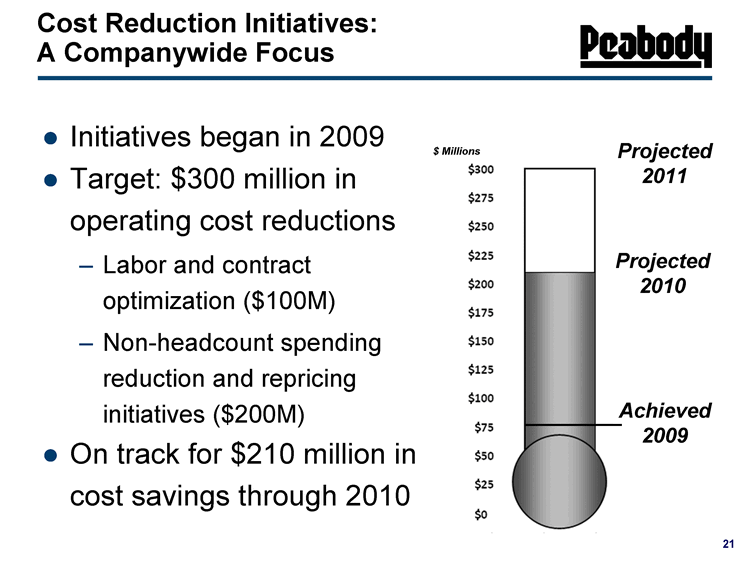
| Cost Reduction Initiatives: A Companywide Focus Initiatives began in 2009 Target: $300 million in operating cost reductions Labor and contract optimization ($100M) Non-headcount spending reduction and repricing initiatives ($200M) On track for $210 million in cost savings through 2010 Projected 2010 Achieved 2009 Projected 2011 $ Millions $0 $25 $50 $75 $100 $125 $150 $175 $200 $225 $250 $275 $300 |
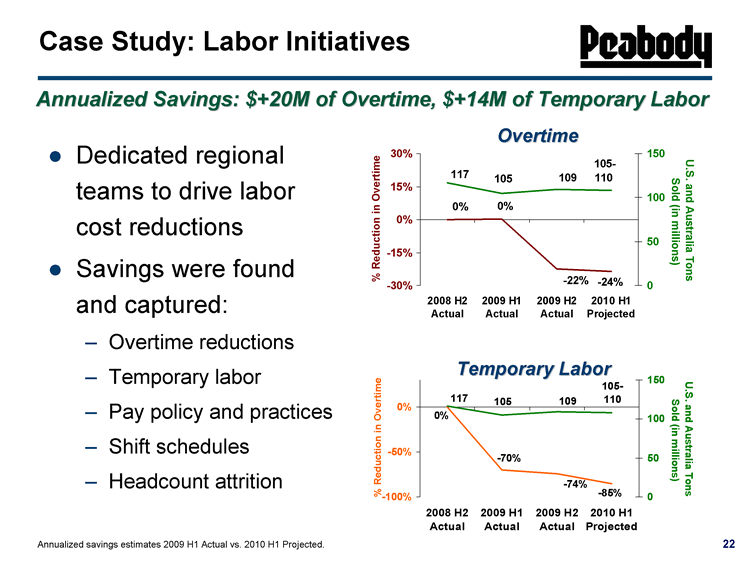
| Case Study: Labor Initiatives Dedicated regional teams to drive labor cost reductions Savings were found and captured: Overtime reductions Temporary labor Pay policy and practices Shift schedules Headcount attrition 2008 H2 Actual 2009 H1 Actual 2009 H2 Actual 2010 H1 Projected 0 0.0022 -0.2237 -0.2368 116.6 105 109.2 108.3 Annualized Savings: $+20M of Overtime, $+14M of Temporary Labor Overtime Temporary Labor Annualized savings estimates 2009 H1 Actual vs. 2010 H1 Projected. 2008 H2 Actual 2009 H1 Actual 2009 H2 Actual 2010 H1 Projected 0 -0.6974 -0.7434 -0.8509 116.6 105 109.2 108.3 |
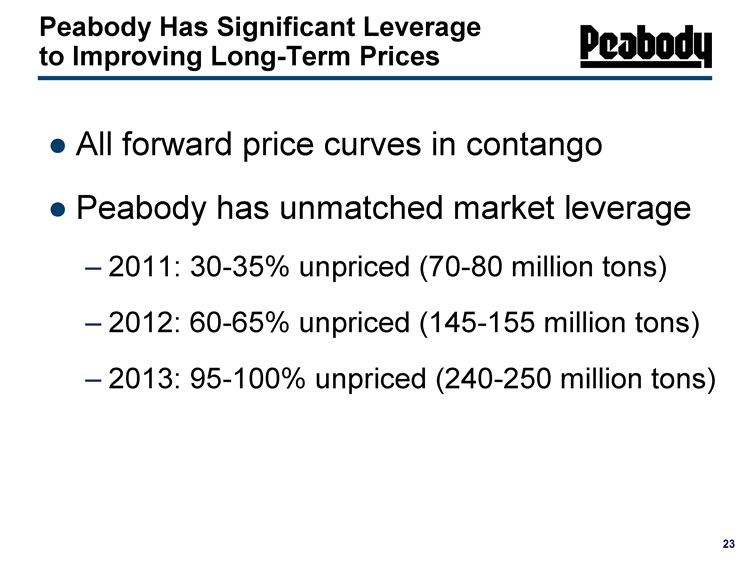
| Peabody Has Significant Leverage to Improving Long-Term Prices All forward price curves in contango Peabody has unmatched market leverage 2011: 30-35% unpriced (70-80 million tons) 2012: 60-65% unpriced (145-155 million tons) 2013: 95-100% unpriced (240-250 million tons) |
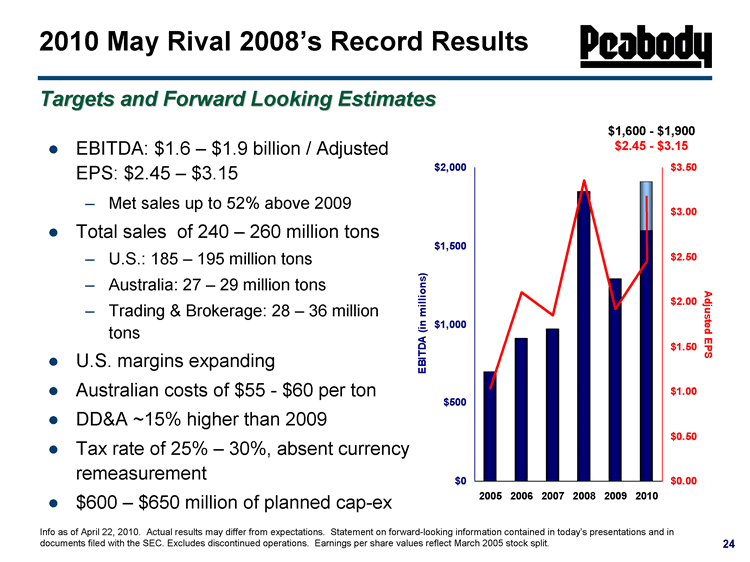
| 2010 May Rival 2008’s Record Results EBITDA: $1.6 - $1.9 billion / Adjusted EPS: $2.45 - $3.15 Met sales up to 52% above 2009 Total sales of 240 - 260 million tons U.S.: 185 - 195 million tons Australia: 27 - 29 million tons Trading & Brokerage: 28 - 36 million tons U.S. margins expanding Australian costs of $55 - $60 per ton DD&A ~15% higher than 2009 Tax rate of 25% - 30%, absent currency remeasurement $600 - $650 million of planned cap-ex Targets and Forward Looking Estimates Info as of April 22, 2010. Actual results may differ from expectations. Statement on forward-looking information contained in today's presentations and in documents filed with the SEC. Excludes discontinued operations. Earnings per share values reflect March 2005 stock split. 2005 2006 2007 2008 2009 2010 EBITDA 696.4 909.7 969.7 1846.9 1290.1 1600 Earnings Per Share 1.04 2.11 1.85 3.36 1.92 2.45 $1,600 - $1,900 $2.45 - $3.15 |
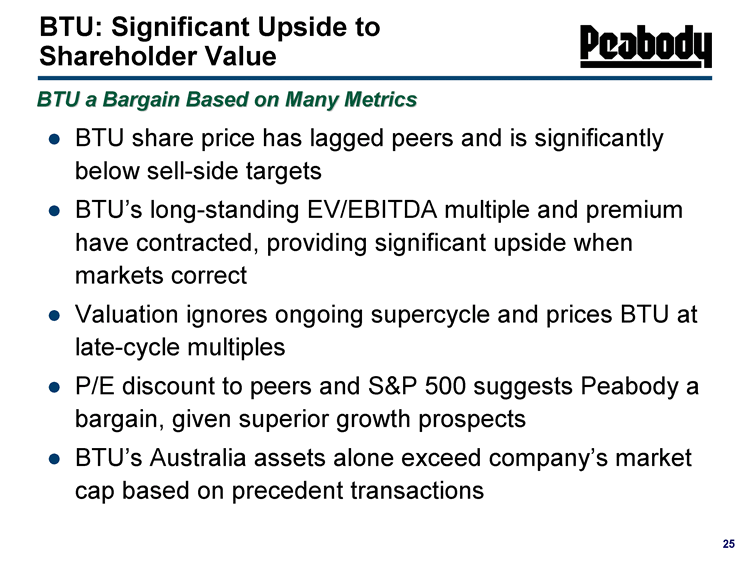
| 25 BTU: Significant Upside to Shareholder Value BTU share price has lagged peers and is significantly below sell-side targets BTU's long-standing EV/EBITDA multiple and premium have contracted, providing significant upside when markets correct Valuation ignores ongoing supercycle and prices BTU at late-cycle multiples P/E discount to peers and S&P 500 suggests Peabody a bargain, given superior growth prospects BTU's Australia assets alone exceed company's market cap based on precedent transactions BTU a Bargain Based on Many Metrics |
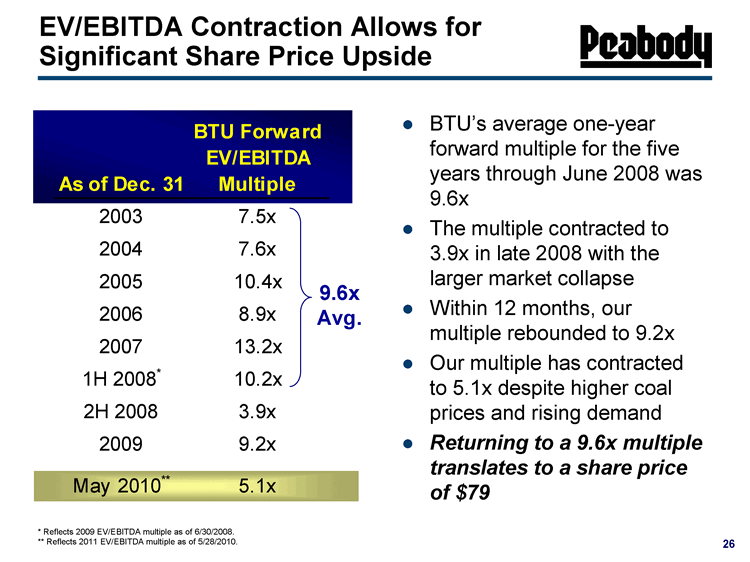
| EV/EBITDA Contraction Allows for Significant Share Price Upside BTU’s average one-year forward multiple for the five BTU Forward EV/EBITDA years through June 2008 was 9.6x The multiple contracted to As of Dec. 31 Multiple 2003 7.5x 3.9x in late 2008 with the larger market collapse Within 12 months, our 9.6x Avg 2004 7.6x 2005 10.4x 2006 8.9x multiple rebounded to 9.2x Our multiple has contracted to 5.1x despite higher coal Avg006 8 9 . 2007 13.2x 1H 2008* 10.2x prices and rising demand Returning to a 9.6x multiple translates to a share price 2H 2008 3.9x 2009 9.2x M 2010** 5 1 26 May 2010 5.1x of $79 * Reflects 2009 EV/EBITDA multiple as of 6/30/2008. ** Reflects 2011 EV/EBITDA multiple as of 5/28/2010. |

| EV/EBITDA Premium to Peers Just One-Third The 5-Year Average BTU’s five-year average U S EV/EBITDA Premium to U.S. Peers premium to U.S. peers has been 3x The current premium has 3x 3.0 contracted to 1x This occurred even as Peabody’s underlying 2.0 Peabody s markets are expanding much faster than U.S. 1x 1.0 peers Returning to a 3x premium 0 0 27 translates to a $56 share price 0.0 Current Multiple Premium 5-yr Avg. Multiple Premium Premium based on one-year forward multiple to U.S. peer average; 5 year period represents 2005 2009. |
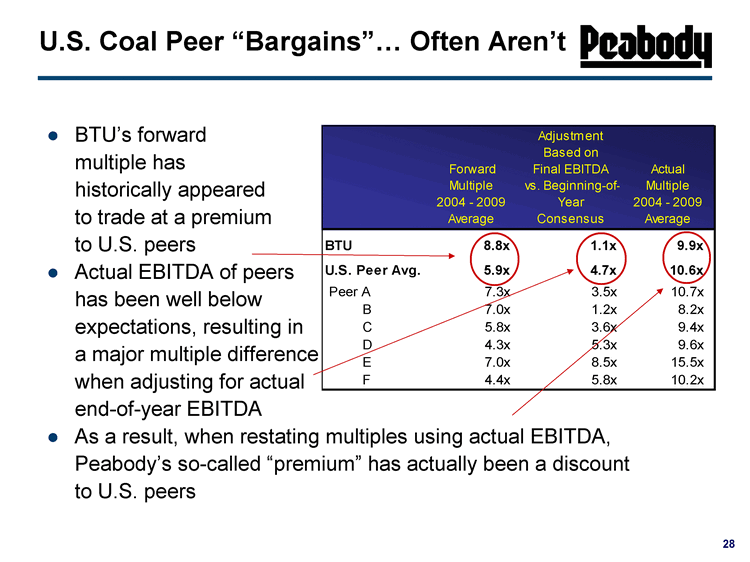
| U.S. Coal Peer “Bargains” Often Aren’t BTU’s forward Adjustment Based on multiple has historically appeared to trade at a premium U S peers Forward Multiple 2004 - 2009 Average Final EBITDA vs. Beginning-of- Year Consensus Actual Multiple 2004 - 2009 Average BTU to U.S. 8 8 1 1 9 9 Actual EBITDA of peers has been well below t ti lti i 8.8x 1.1x 9.9x U.S. Peer Avg. 5.9x 4.7x 10.6x Peer A 7.3x 3.5x 10.7x B 7.0x 1.2x 8.2x expectations, resulting in a major multiple difference when adjusting for actual d f EBITDA C 5.8x 3.6x 9.4x D 4.3x 5.3x 9.6x E 7.0x 8.5x 15.5x F 4.4x 5.8x 10.2x end-of-year As a result, when restating multiples using actual EBITDA, Peabody’s so-called “premium” has actually been a discount 28 to U.S. peers |

| Current BTU Multiple Doesn’t Reflect Market Fundamentals Market Comparison: The Last Time BTU Traded at 5.1x $ Then Now Benchmark Met $ Newcastle Thermal 200 $98 129 $70 PRB 8800 1-Yr Forward $8 $13 China Net Imports YTD Costs 50 MT Stable 7 MT Increasing Demand - Increasing globally - Recovering in U.S. - Uncertain globally - Declining in U.S. 29 g - Steel producers increasing shipments g - Steel producers deferring shipments Data compares April 2009 to April 2010. |

| 2010 Analyst and Investor Forum June 17, 2010 |
