Attached files
| file | filename |
|---|---|
| EX-99.1 - EXHIBIT 99.1 - GREIF, INC | c02439exv99w1.htm |
| 8-K - FORM 8-K - GREIF, INC | c02439e8vk.htm |
Exhibit 99.2

| Flexible Products & Services Investor Meeting New York June 15, 2010 |
| 1 Forward-Looking Statements This presentation and management's remarks may contain certain forward- looking information within the meaning of the Private Securities Litigation Reform Act of 1995. The words "believe," "expect," "anticipate," "estimate," "target," and similar expressions, among others, identify forward-looking statements. All forward-looking statements are based on information currently available to management. Such forward-looking statements are subject to certain risks and uncertainties that could cause events and the Company's actual results to differ materially from those expressed or implied. Please see the disclosure regarding forward-looking statements immediately preceding Part I of the Company's Annual Report on Form 10-K for the fiscal year ended October 31, 2009. The Company assumes no obligation to update any forward-looking statements. Safe Harbor |
| 2 Welcome and Introductions Safety reminder Speakers Chairman & CEO Mike Gasser President & COO David Fischer Executive Vice President & CFO Don Huml Greif senior executives SVP, People Services & Talent Development Karen Lane SVP, General Counsel and Secretary Gary Martz SVP and Divisional President, EMEA Ivan Signorelli FPS leaders Vice President, Middle East Development Daniel Lister Division President FPS Michael Mapes |

| 3 Greif Profile Founded in 1877 as a packaging company Initial public offering in 1926 Diversified business platform Leading industrial packaging company with more than 30% global product share More than 200 operations in over 50 countries |
| 4 Strategy Statement Continue to strengthen the core Industry consolidation Emerging markets Product line extensions Optimize and embed the Greif Business System throughout the enterprise to achieve top quartile profitability and lowest cost producer status while enhancing safety and quality Pursue adjacencies Emphasize sustainability in all of the company's activities to meet or exceed our stewardship responsibilities as a global citizen, and create long-term competitive and shareholder advantages Fix, sell or close underperforming assets |
| 5 Greif Advantages Global sourcing and distribution platform Raw materials Energy Logistics Industry leader with identified acquisition opportunities and a record of successful business integration Proven benefits of Greif Business System to unlock value Substantial percentage of customers who use both flexible and rigid industrial products |
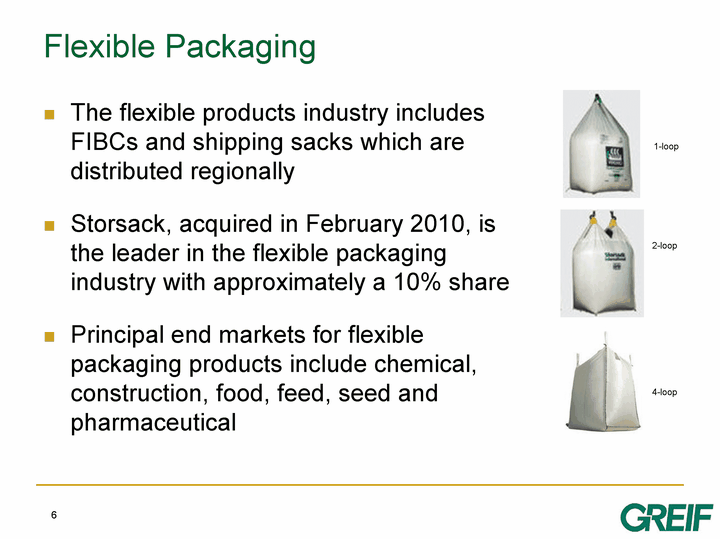
| 6 Flexible Packaging The flexible products industry includes FIBCs and shipping sacks which are distributed regionally Storsack, acquired in February 2010, is the leader in the flexible packaging industry with approximately a 10% share Principal end markets for flexible packaging products include chemical, construction, food, feed, seed and pharmaceutical 1-loop 2-loop 4-loop |
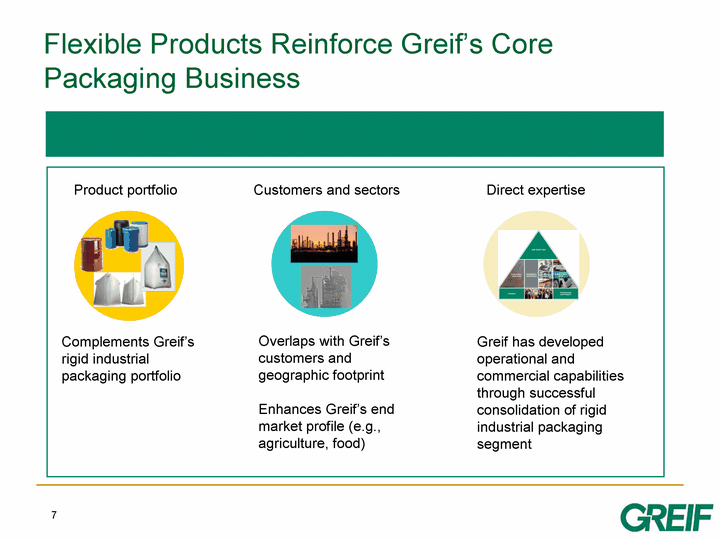
| 7 Overlaps with Greif's customers and geographic footprint Enhances Greif's end market profile (e.g., agriculture, food) Customers and sectors Greif has developed operational and commercial capabilities through successful consolidation of rigid industrial packaging segment Direct expertise Complements Greif's rigid industrial packaging portfolio Product portfolio Flexible Products Reinforce Greif's Core Packaging Business |
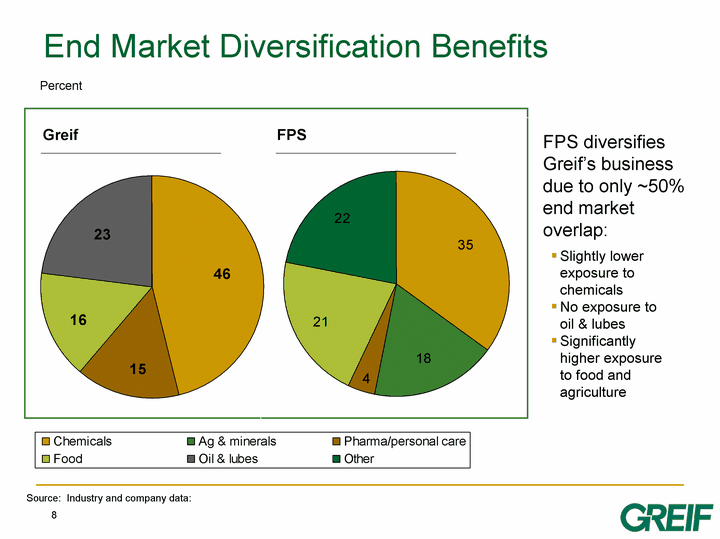
| 8 Source: Industry and company data: FPS 41 Greif End Market Diversification Benefits Chemicals Ag & minerals Pharma/personal care Food Oil & lubes Other Pie 2 35 18 4 21 0 22 Chemicals Ag & minerals Pharma/personal care Food Oil & lubes Other Pie 1 46 15 16 23 Percent FPS diversifies Greif's business due to only ~50% end market overlap: Slightly lower exposure to chemicals No exposure to oil & lubes Significantly higher exposure to food and agriculture |
| Flexible Products & Services Strategy President & COO David Fischer |
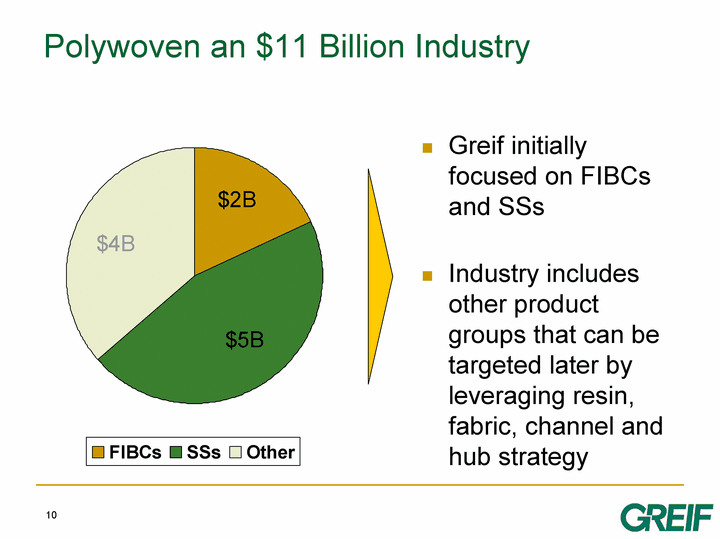
| 10 Polywoven an $11 Billion Industry FIBCs SSs Other 2 5 4 Greif initially focused on FIBCs and SSs Industry includes other product groups that can be targeted later by leveraging resin, fabric, channel and hub strategy |
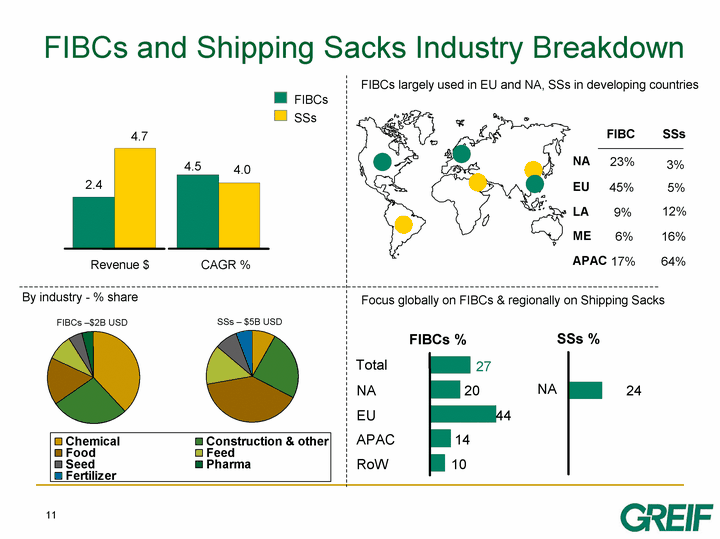
| 11 Chemical Construction & other Food Feed Seed Pharma Fertilizer 38 27 17 9 5 4 0 Pie 2 9 26 42 15 9 0 6 5.00 FIBCs largely used in EU and NA, SSs in developing countries By industry - % share FIBC SSs NA EU LA ME APAC 23% 45% 9% 6% 17% 2.4 4.7 Revenue $ FIBC SS FIBCs SSs 4.5 4.0 CAGR % Focus globally on FIBCs & regionally on Shipping Sacks RoW 10 APAC 14 EU 44 NA 20 FIBCs % 27 NA 24 SSs % 15 Total Chem Construction & other F00d Feed Seed Pharma Fertilizer FIBCs -$2B USD SSs - $5B USD FIBCs and Shipping Sacks Industry Breakdown 5% 3% 12% 16% 64% |
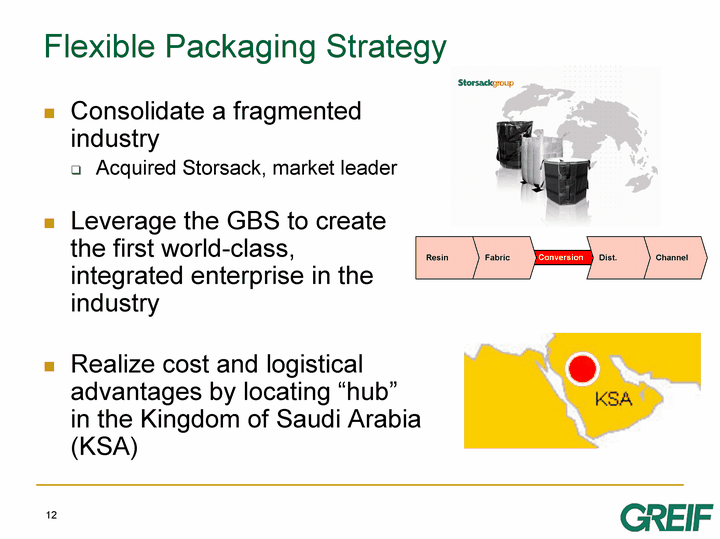
| 12 Flexible Packaging Strategy Consolidate a fragmented industry Acquired Storsack, market leader Leverage the GBS to create the first world-class, integrated enterprise in the industry Realize cost and logistical advantages by locating "hub" in the Kingdom of Saudi Arabia (KSA) Conversion |
| 13 KSA Advantages Gateway to the world market Growing population New and large port Ease of doing business Efficient tax system Access to capital financing Globally competitive energy costs Abundant and low-cost resins |
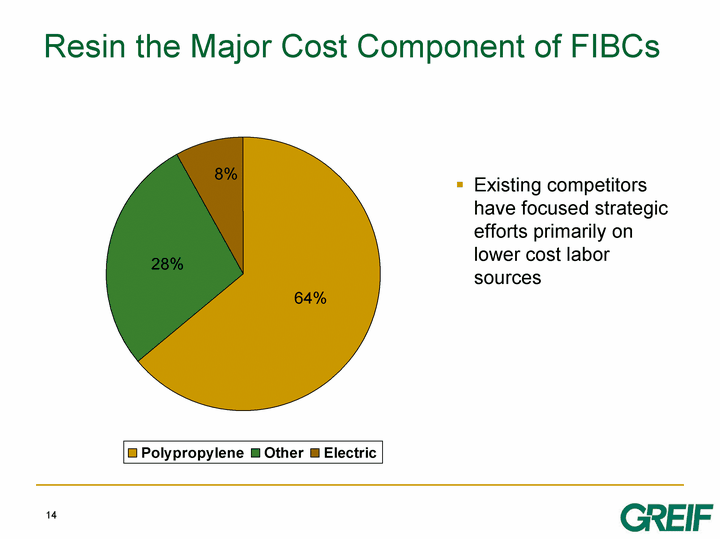
| 14 Resin the Major Cost Component of FIBCs Polypropylene Other Electric 64 28 8 Existing competitors have focused strategic efforts primarily on lower cost labor sources 64% 28% 8% |
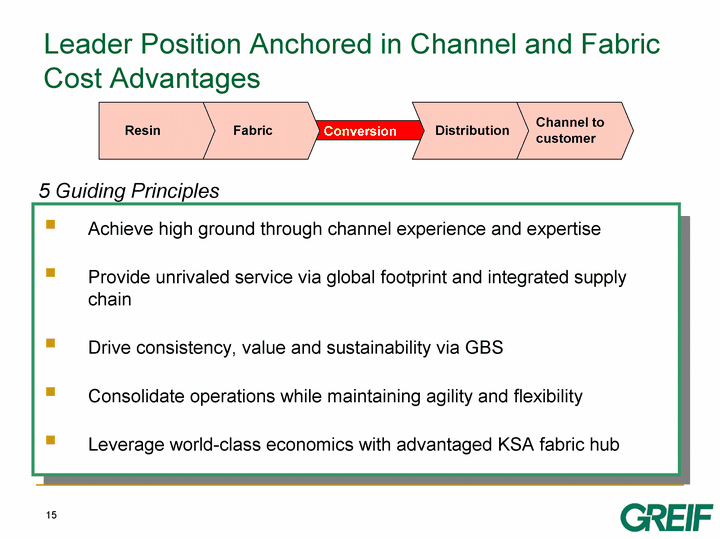
| 15 Achieve high ground through channel experience and expertise Provide unrivaled service via global footprint and integrated supply chain Drive consistency, value and sustainability via GBS Consolidate operations while maintaining agility and flexibility Leverage world-class economics with advantaged KSA fabric hub 5 Guiding Principles Conversion Leader Position Anchored in Channel and Fabric Cost Advantages |
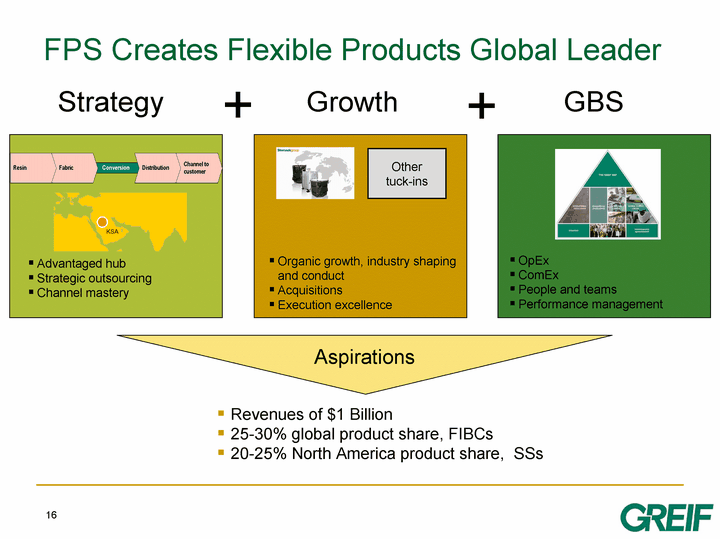
| 16 + + Strategy Growth GBS Aspirations Advantaged hub Strategic outsourcing Channel mastery Organic growth, industry shaping and conduct Acquisitions Execution excellence Other tuck-ins OpEx ComEx People and teams Performance management Revenues of $1 Billion 25-30% global product share, FIBCs 20-25% North America product share, SSs FPS Creates Flexible Products Global Leader |
| Flexible Products & Services Investment Rationale Executive Vice President & CFO Don Huml |
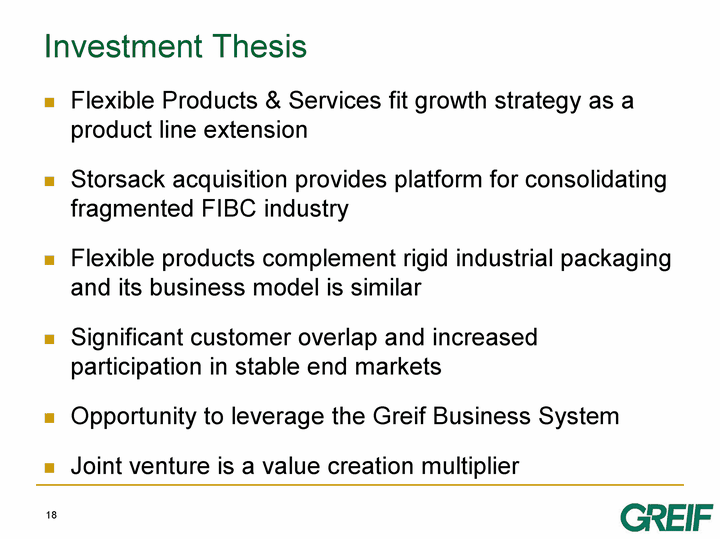
| 18 Investment Thesis Flexible Products & Services fit growth strategy as a product line extension Storsack acquisition provides platform for consolidating fragmented FIBC industry Flexible products complement rigid industrial packaging and its business model is similar Significant customer overlap and increased participation in stable end markets Opportunity to leverage the Greif Business System Joint venture is a value creation multiplier |
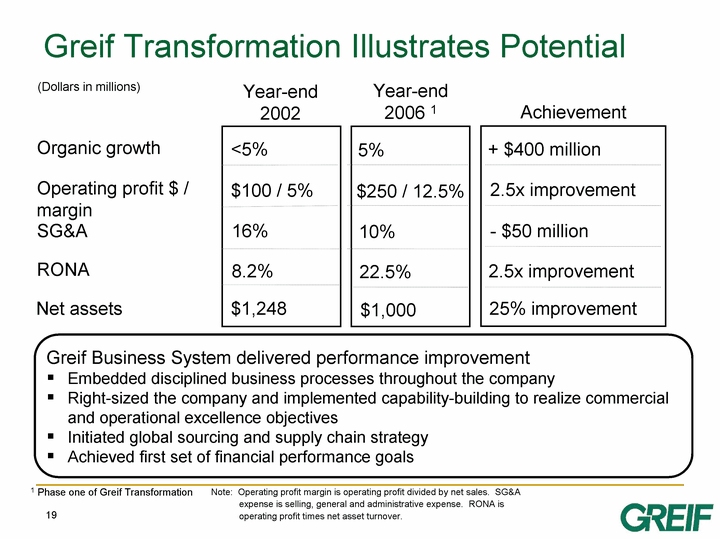
| 19 Greif Business System delivered performance improvement Embedded disciplined business processes throughout the company Right-sized the company and implemented capability-building to realize commercial and operational excellence objectives Initiated global sourcing and supply chain strategy Achieved first set of financial performance goals (Dollars in millions) Achievement 1 Phase one of Greif Transformation <5% + $400 million 5% $250 / 12.5% $100 / 5% 8.2% 2.5x improvement 16% - $50 million 10% 2.5x improvement $1,248 22.5% $1,000 25% improvement Greif Transformation Illustrates Potential Net assets RONA SG&A Operating profit $ / margin Organic growth Year-end 2006 1 Year-end 2002 Note: Operating profit margin is operating profit divided by net sales. SG&A expense is selling, general and administrative expense. RONA is operating profit times net asset turnover. |
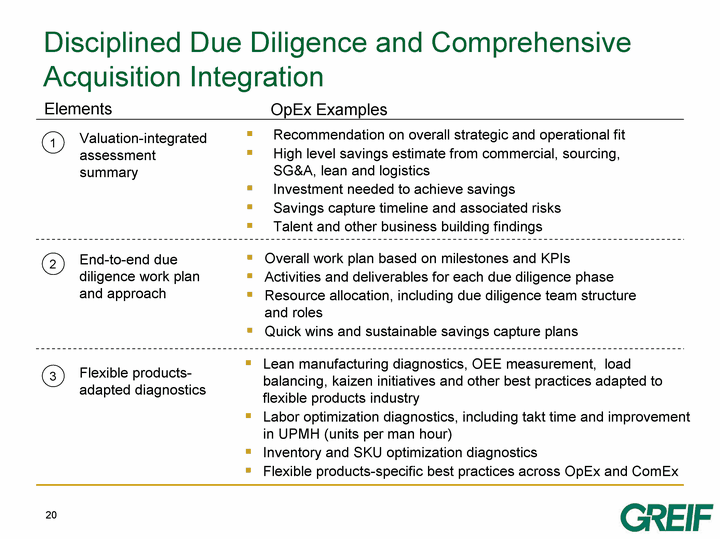
| 20 Disciplined Due Diligence and Comprehensive Acquisition Integration Recommendation on overall strategic and operational fit High level savings estimate from commercial, sourcing, SG&A, lean and logistics Investment needed to achieve savings Savings capture timeline and associated risks Talent and other business building findings Valuation-integrated assessment summary 1 Overall work plan based on milestones and KPIs Activities and deliverables for each due diligence phase Resource allocation, including due diligence team structure and roles Quick wins and sustainable savings capture plans End-to-end due diligence work plan and approach 2 Lean manufacturing diagnostics, OEE measurement, load balancing, kaizen initiatives and other best practices adapted to flexible products industry Labor optimization diagnostics, including takt time and improvement in UPMH (units per man hour) Inventory and SKU optimization diagnostics Flexible products-specific best practices across OpEx and ComEx Flexible products- adapted diagnostics 3 Elements OpEx Examples |
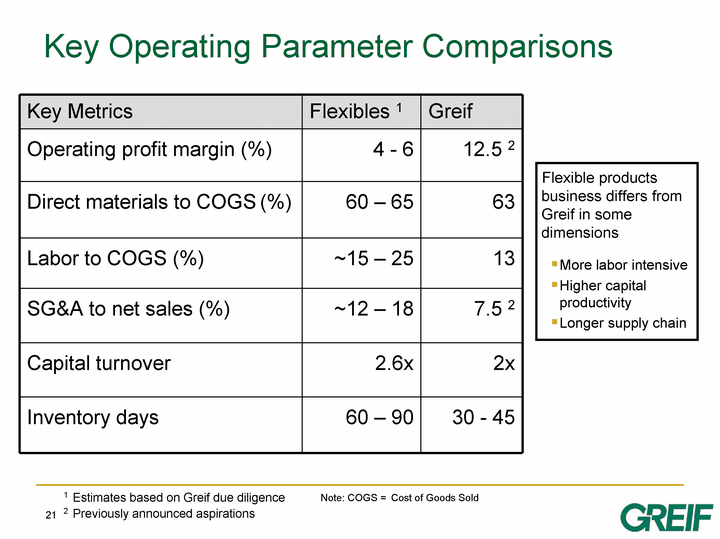
| 21 Key Operating Parameter Comparisons Note: COGS = Cost of Goods Sold Key Metrics Flexibles 1 Greif Operating profit margin (%) 4 - 6 12.5 2 Direct materials to COGS (%) 60 - 65 63 Labor to COGS (%) ~15 - 25 13 SG&A to net sales (%) ~12 - 18 7.5 2 Capital turnover 2.6x 2x Inventory days 60 - 90 30 - 45 Flexible products business differs from Greif in some dimensions More labor intensive Higher capital productivity Longer supply chain 1 Estimates based on Greif due diligence 2 Previously announced aspirations |
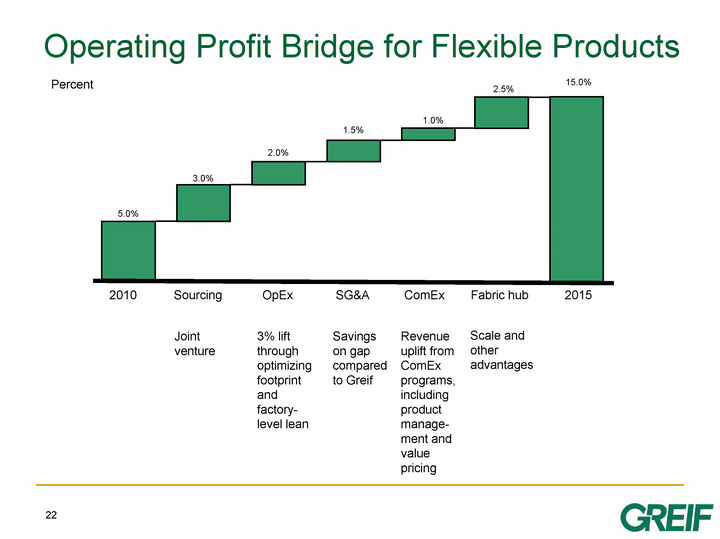
| 22 Operating Profit Bridge for Flexible Products 2010 Sourcing SG&A 2015 OpEx ComEx Fabric hub Joint venture 3% lift through optimizing footprint and factory- level lean Savings on gap compared to Greif Revenue uplift from ComEx programs, including product manage- ment and value pricing Scale and other advantages 15.0% 2.5% 1.0% 1.5% 2.0% 3.0% 5.0% Percent |
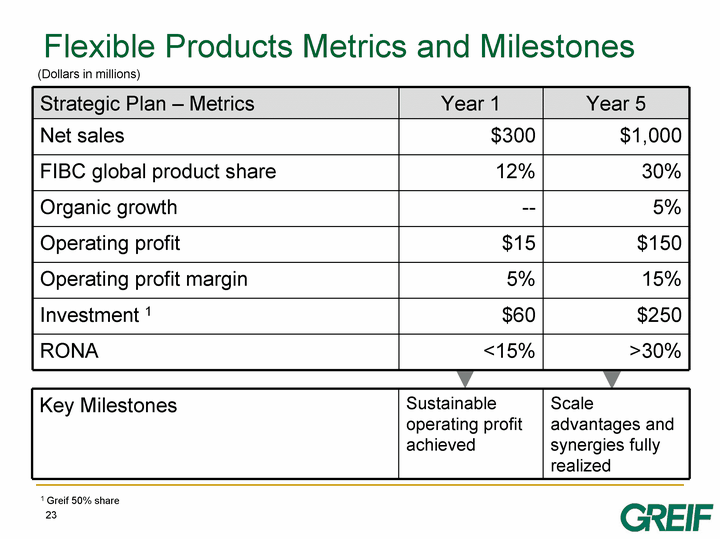
| 23 Flexible Products Metrics and Milestones Strategic Plan - Metrics Year 1 Year 5 Net sales $300 $1,000 FIBC global product share 12% 30% Organic growth -- 5% Operating profit $15 $150 Operating profit margin 5% 15% Investment 1 $60 $250 RONA <15% >30% (Dollars in millions) 1 Greif 50% share Key Milestones Sustainable operating profit achieved Scale advantages and synergies fully realized |
| Wrap-up and Q&A Chairman and CEO Mike Gasser |
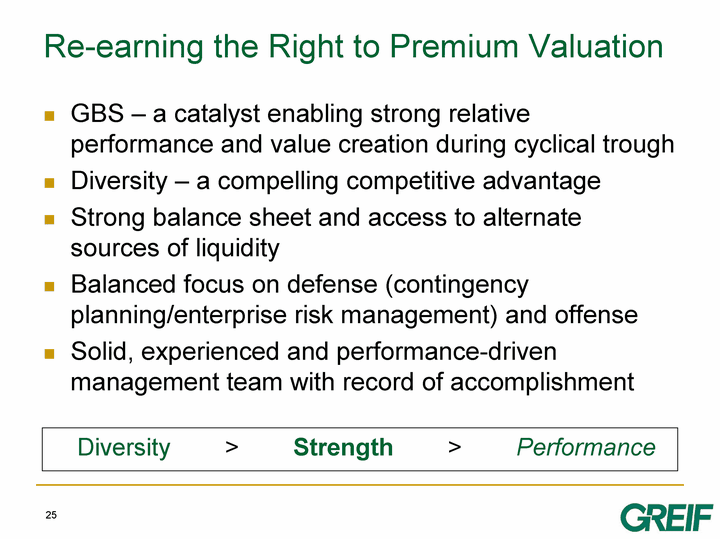
| 25 Diversity > Strength > Performance Re-earning the Right to Premium Valuation GBS - a catalyst enabling strong relative performance and value creation during cyclical trough Diversity - a compelling competitive advantage Strong balance sheet and access to alternate sources of liquidity Balanced focus on defense (contingency planning/enterprise risk management) and offense Solid, experienced and performance-driven management team with record of accomplishment |
