Attached files
| file | filename |
|---|---|
| 8-K - SUNOCO INC--FORM 8-K - SUNOCO INC | d8k.htm |
| EX-99.2 - PRESS RELEASE - SUNOCO INC | dex992.htm |
 Sunoco, Inc.
ANALYST MEETING
JUNE 16, 2010
Exhibit 99.1 |
 2
Statements in this presentation that are not historical facts are
forward-looking statements intended to be covered by the safe harbor
provisions of Section 27A of the Securities Act of 1933 and Section 21E of the
Securities
Exchange
Act
of
1934.
These
forward-looking
statements
are
based
upon
assumptions
by
Sunoco
concerning
future
conditions,
any
or
all
of
which
ultimately
may
prove
to
be
inaccurate,
and
upon
the
current
knowledge, beliefs and expectations of Sunoco management. These forward-looking
statements are not guarantees of future performance.
Forward-looking statements are inherently uncertain and involve significant
risks and uncertainties that could cause actual results to differ materially
from those described during this presentation. Such risks and uncertainties
include economic, business, competitive and/or regulatory factors affecting Sunoco's business,
as
well
as
uncertainties
related
to
the
outcomes
of
pending
or
future
litigation.
In
accordance
with
the
safe
harbor provisions of the Private Securities Litigation Reform Act of 1995, Sunoco
has included in its Annual Report on Form 10-K for the year ended
December 31, 2009, and in its subsequent Form 10-Q and Form 8- K
filings, cautionary language identifying important factors (though not necessarily all such factors) that could
cause
future
outcomes
to
differ
materially
from
those
set
forth
in
the
forward-looking
statements.
For
more
information concerning these factors, see Sunoco's Securities and Exchange
Commission filings, available on Sunoco's website at www.SunocoInc.com.
Sunoco expressly disclaims any obligation to update or alter its
forward-looking statements, whether as a result of new information, future events or otherwise.
This presentation includes certain non-GAAP financial measures intended to
supplement, not substitute for, comparable GAAP measures. Reconciliations of
non-GAAP financial measures to GAAP financial measures are
provided
in
the
Appendix
at
the
end
of
this
presentation.
Investors
are
urged
to
consider
carefully
the
comparable GAAP measures and the reconciliations to those measures provided in the
Appendix, or on our website at www.SunocoInc.com.
Safe Harbor Statement |
 3
Refining
& Supply
1,100
Chemicals
690
Logistics
1,070
Lynn Elsenhans, Chairman, CEO and President………..
15 minutes
Bob Owens, SVP of
Marketing…………………………….
30 minutes
Mike Hennigan, President and COO of
Sunoco Logistics Partners,
L.P…………………………… 30
minutes Anne-Marie Ainsworth, SVP of
Refining…………………. 30 minutes
Break………………………………………………………….
15 minutes
Mike Thomson, SVP and President of SunCoke………..
40 minutes
Brian MacDonald, SVP and
CFO…………………………. 20
minutes Q &
A………………………………………………………….
30 minutes
Agenda |
 Sunoco, Inc.
Lynn Elsenhans |
 5
Refining
& Supply
1,100
Chemicals
690
Logistics
1,070
Market demand for transportation fuels will exist for a long time
Biofuels
and other alternatives will become increasingly available
Sunoco wants to provide the alternatives that customers demand
Ownership and operation of terminals becomes essential to meet
these marketplace needs
Capability at terminals to blend a variety of fuels
Use Sunoco brand to pull those fuels through our network
Refining will be a source of supply through our network
Focus on safety, reliability and being cost competitive
Market View |
 6
Refining
& Supply
1,100
Chemicals
690
Logistics
1,070
Optimize the Refining/Logistics and Retail operations with
the aspiration of becoming the premier fuel supplier within
the markets in which we operate
Strengthen our fuels business through improved retail
operations and growth opportunities in both Logistics and
Retail Marketing
Improve the reliability of our refining assets
Maintain financial flexibility and discipline
Sunoco Strategy |
 Marketing
Bob Owens |
 |
 9
Optimize margins across all marketing channels
“Pull”
more volume thru high netback sites
Retail Marketing
Operations excellence is essential
Brand equity is a driver of value creation
Real estate aggressively managed
Supply and Distribution
Alignment with Retail Marketing
Opportunity to create value
BioFuels
–
Participate in the evolving transportation fuels
marketplace
Ethanol manufacturing
Distribution and marketing at retail sites
Value Creation |
 10
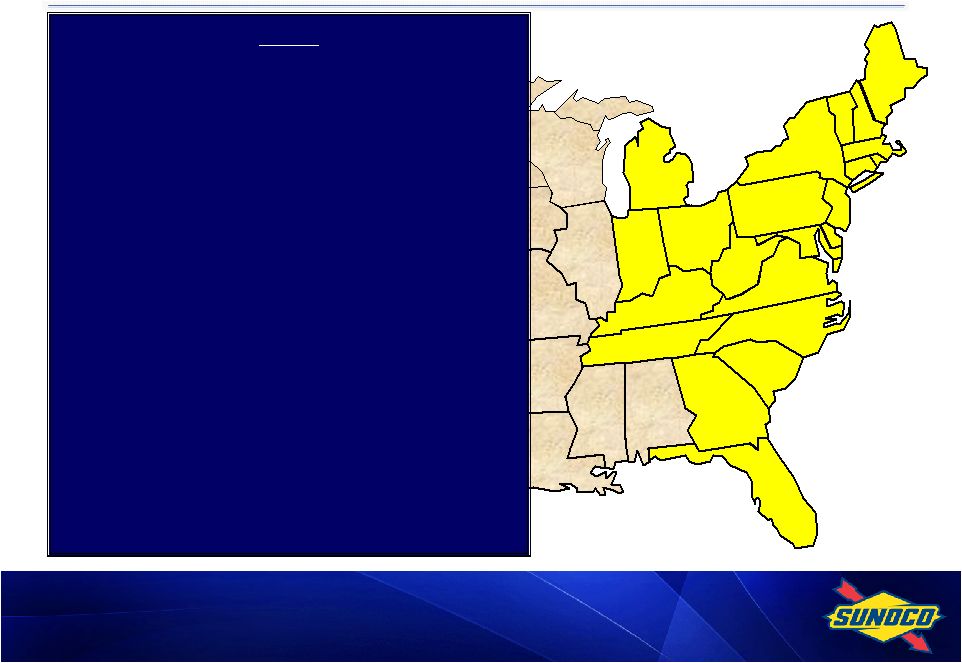
Retail
Marketing
Profile
FL
PA
WV
VA
FL
SC
NC
NY
ME
NH
VT
OH
MI
IN
KY
TN
GA
NJ
CT
DE
MD
2009
Refined Volume
4.9B gallons EBITDA
$241MM
EBITDA –
6 yr avg* $219MM
Total Retail Outlets 4,711
Distributors sites 3,312
Dealers sites
1,004
Co-op
sites 395
*Excludes 2008, when EBITDA=$439MM
MA
RI |
 11
Brand
Value –
Building Customer Loyalty
1
2
3
4
5
6
7
8
Exxon/Mobil
5
Shell
6
Chevron
4
Bronze
Texaco
3
Silver
Sunoco
2
Gold
BP
1
Brandweek
Customer
Loyalty
Award
Ranking
High quality performance
fuel
Strong station image and
customer service
Delivering effective
marketing programs
Competitive alternative
profit centers in APlus
convenience stores and
Ultra Service Centers
st
nd
rd
th
th
th |
 12
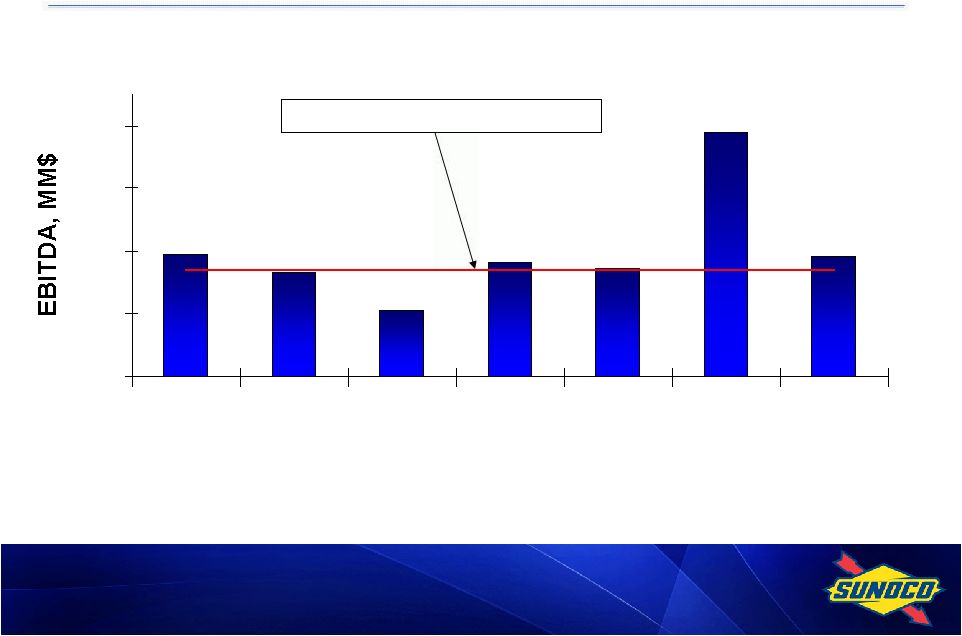
Financial Performance
6 year avg EBITDA, excluding 2008
* For reconciliation to Net Income, see Slide A1.
Retail Marketing Provides Steady Earnings & Cash Flow
244
221
439
241
155
233
217
50
150
250
350
450
2003
2004
2005
2006
2007
2008
2009 |
 13
0
20
40
60
80
100
120
140
2008
2009
2010P
"Stay in Business"
Income Improvement
$MM
Manage Capital Spending
Future “stay in business”
capital to average $80
million
Income improvement capital
includes turnpike
refurbishments and “raze
and rebuilds”
Capital allocated to growth
projects
Organic growth
Distributor conversion
Acquisitions |
 14
…within our markets, we must continue to strengthen
and leverage our Sunoco Brand, our market presence
and our integration on the U.S. East Coast
Pull >100% refinery gasoline output through our retail network,
growing organically and through acquisitions
Continue to grow our brand recognition and loyalty
Optimize and seek opportunities in supply, distribution and marketing
Continue to manage capital employed by high-grading retail portfolio
Position retail network for alternative fuels longer term
To Become the Premier Fuel Supplier… |
 Sunoco Logistics
Partners L.P. (NYSE: SXL)
Mike Hennigan |
 16
3
Serve key Northeast,
Midwest & Gulf Coast
production/refining centers
2,200 miles of refined
product pipelines
3,850 miles of crude
pipelines
41 refined product terminals
23 million barrels of crude oil
storage capacity
Asset Overview |
 17
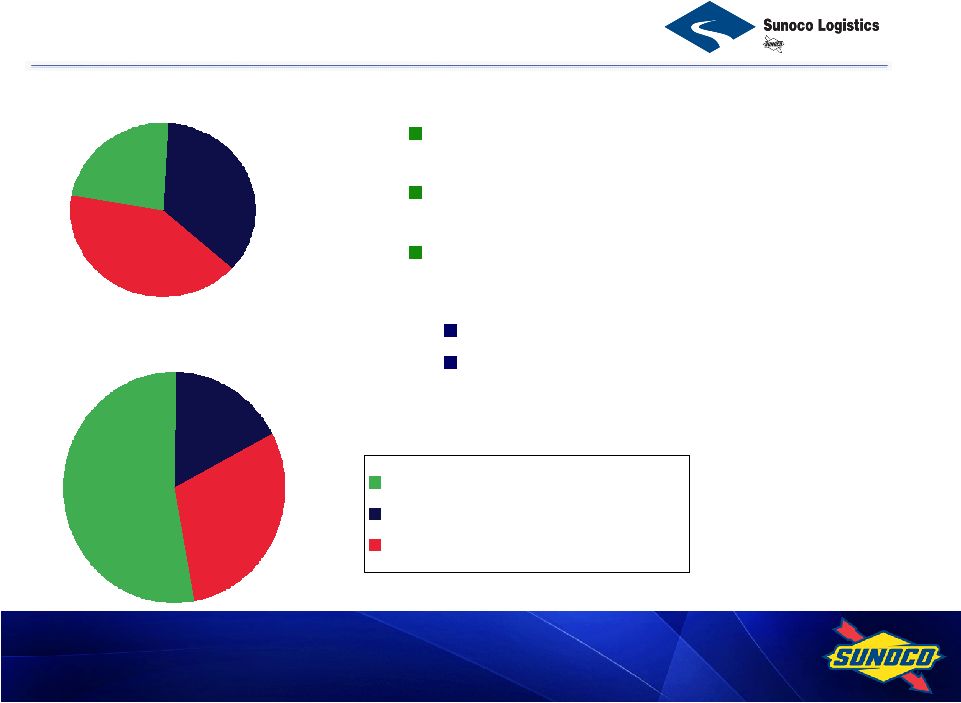
$22MM
23%
$ 35MM
36%
$40MM
41%
9
2009 EBITDA $343MM
2002 EBITDA $97MM
Growth Strategy
Crude Oil Pipeline System
Refined Products Pipeline System
Terminal Facilities
$182 MM
53%
$103MM
30%
$58MM
17%
Optimize current asset base
Invest in organic extensions
Opportunistically
acquire
complementary assets
Continue focus on platform growth
Successfully integrated 15
acquisitions since 2002 IPO
* For reconciliation to Net Income, see Slide A2.
|
 18
3
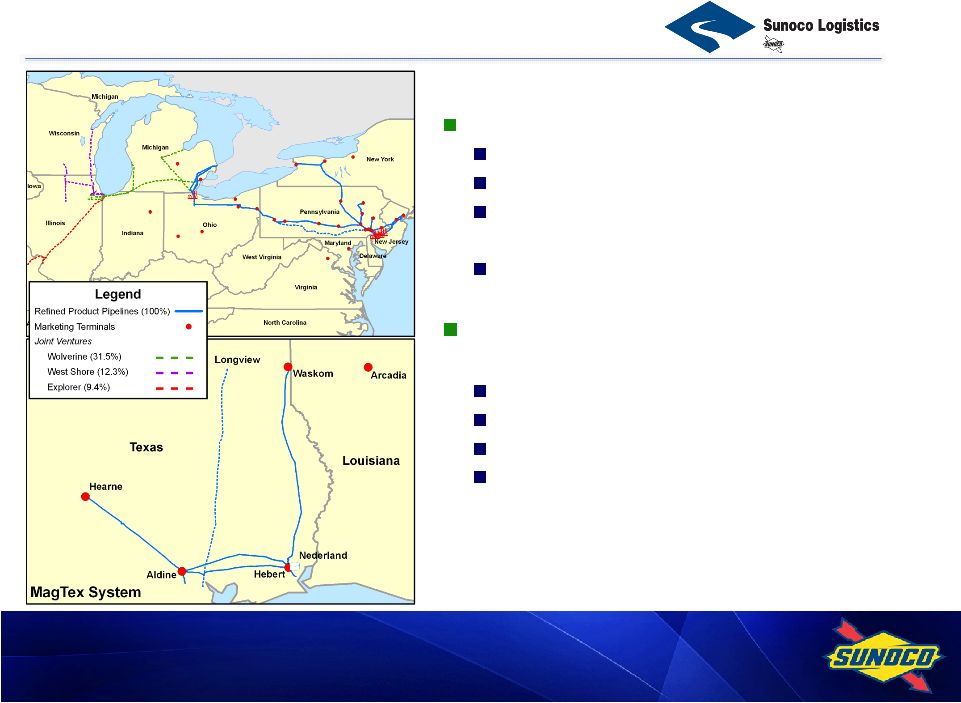
SXL Future Growth
Outside Sunoco footprint
Nederland terminal
MagTex
organic growth
Crude oil pipeline organic growth
Inside Sunoco footprint
Terminal services and pipeline infrastructure
Blending
Alternative fuels
Debottleneck where appropriate
Most of the historical growth has been outside the Sunoco
footprint. Future growth opportunities exist in both areas.
|
 19
11
Organic growth opportunities accelerate
Biodiesel
New terminal at Aldine, TX
Crude pipeline to products pipeline
conversion to supply Longview, TX
Marcellus Shale Mariner project
Blending services are becoming more
essential as market needs expand
Ethanol
Biodiesel
Additive package
More expected in the future
Refined Products Platform |
 20
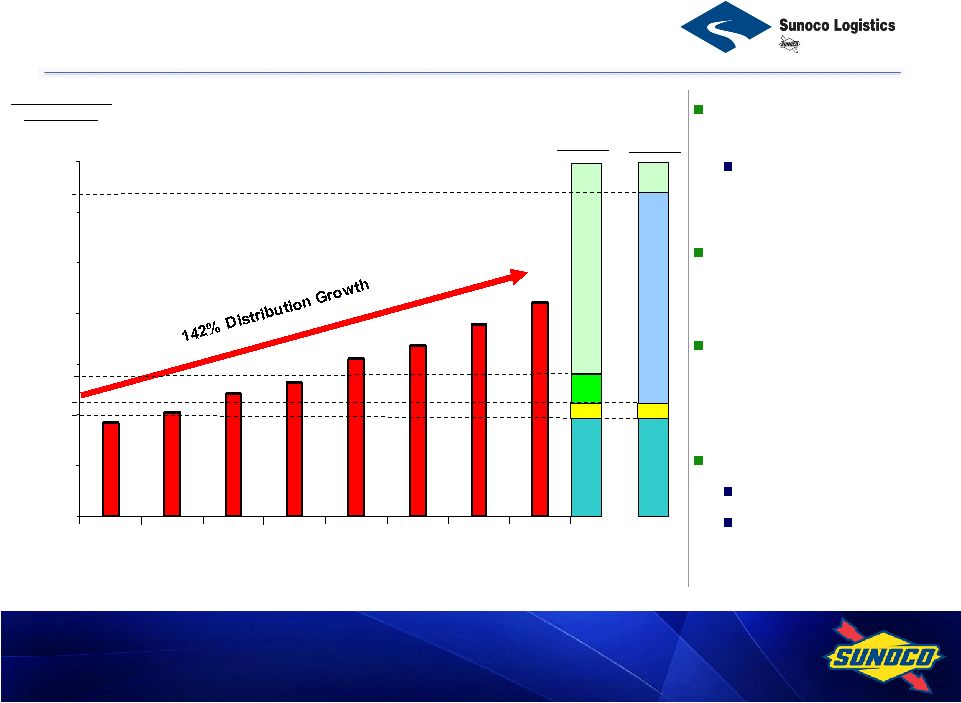
Value from SXL
Average Annual
Distribution
(per LP unit)
50/50
75/25
85/15
98/2
Cancelled
LP/GP
Split (%)
63/37
85/15
98/2
50/50
New
LP/GP
Split (%)
Latest 12 month
distribution growth: 10%
Highest in competitive
class
LP Distribution increased
in 27 of last 28 quarters
Current annualized
distribution of $4.46
(6.8% yield as of 5/28/10)
Strong balance sheet
3.6x Debt/EBITDA
Investment grade
2002
2003
2004
2005
2006
2007
2008
2009
$7.00
$6.00
$5.00
$4.00
$3.00
$2.00
$1.00
$0.00 |
 21
8
Summary
Consistent track record of distribution growth
Excellent prospects for future growth both outside and inside
the Sunoco footprint
Particular emphasis on the refined products system
Additional growth expected from integrated opportunities with Sunoco
Improve the refining/logistics/marketing integrated network
Identify possible terminal acquisitions
Work together on integrated opportunities (i.e. Marcellus Shale)
Supporting Sunoco’s aspiration to become the premier provider of
transportation fuels in its markets |
 Refining
Anne-Marie Ainsworth |
 23
Process Safety
Safe operations
Better environmental performance
Improved reliability
Margin capture improvements
Sustainable low cost structure
Driving Excellence |
 24
Protects people and the environment
Increases productivity and reduces cost
Improves reliability and product quality; supports Brand
Excellence in Process Safety |
 25
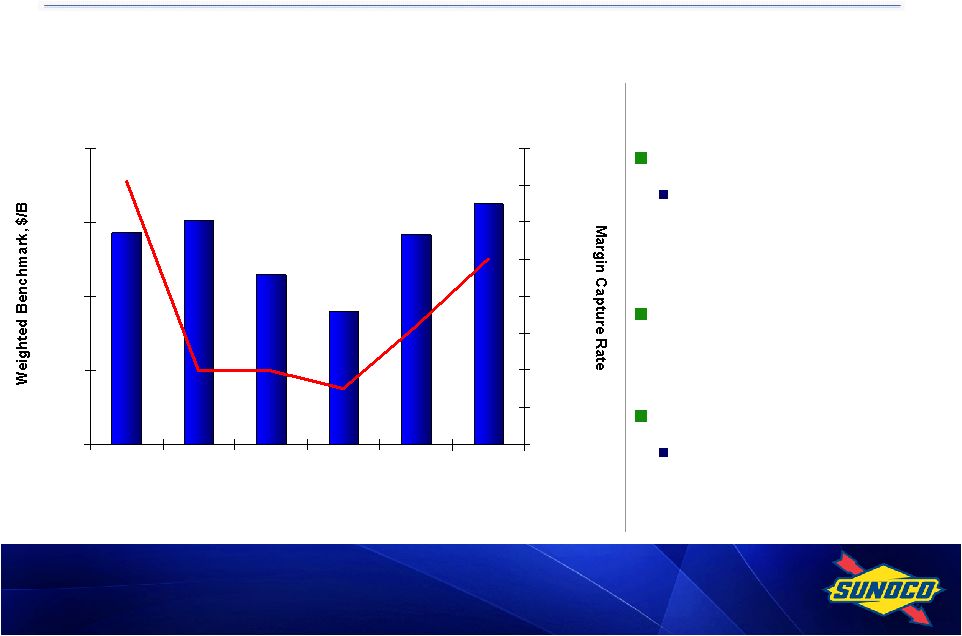
Margin Capture Improvements
Streamlined crude slate
Enables more stable
operations and lower
demurrage
Improved modeling and
scheduling tools
Product quality
Tighter adherence to product
specifications
Main Areas of Focus
4.57
3.59
5.67
6.50
5.71
6.05
0.00
2.00
4.00
6.00
8.00
1Q09
2Q09
3Q09
4Q09
1Q10
2Q10 to
date
40%
50%
60%
70%
80%
90%
100%
110%
120%
Margin capture improvement from 1Q 2010 expected to carry into 2Q
|
 26
Eagle Point shut down
November 2009
Increased utilization at
remaining NE system
Turnaround activity in
1Q10 reduced crude
utilization by 9%
Expect improved
utilization in 2Q10
Goal to run >90%
utilization in NE (subject
to market conditions)
Refining Utilization
79%
90%
85%
76%
90%
77%
89%
76%
0%
10%
20%
30%
40%
50%
60%
70%
80%
90%
100%
Crude Unit Utilization
Conversion Unit Utilization
Turnaround impact to
utilization: 9% crude
& 11% conversion
9/30/09
YTD
4Q09
1Q10
P 2Q10 |
 27
* Total
Refining
&
Supply
business
unit
cash
expenses
including
overhead
divided
by
net
production available for sale.
Steady reduction in
refinery cash costs
beginning in late 2008
Cost structure must
match reality of
competitive, import-
accessible market
Efforts continue to
further reduce
expenses while
optimizing production
Sustainable Low Cost Structure
Refining
Cash
Cost
Per
Barrel*,
Rolling Four Quarters (ex-Tulsa)
4.48
4.64
4.72
4.78
5.06
5.13
4.00
4.25
4.50
4.75
5.00
5.25
4Q08
1Q09
2Q09
3Q09
4Q09
1Q10
Four Quarters Ending |
 28
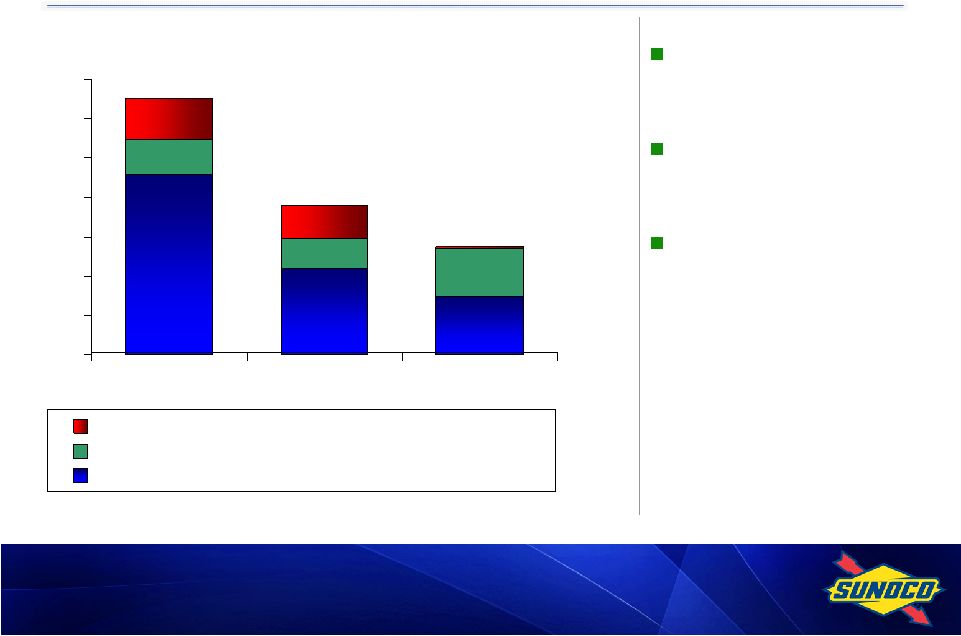
Reduced 2010 capital to
$275 million, in line with
depreciation expense
Pursuing lower cost
alternatives for future
requirements
Expect 2011 capital
spending to be below
DD&A
652
380
275*
0
100
200
300
400
500
600
700
2008
2009
2010P
Growth
Turnarounds
Legally Required and Base Infrastructure
Lower Capital Spending
($MM)
*
Excludes
Northeast
Biofuels
plant
start-up
capital |
 29
Summary
Driving excellence in process safety
Margin capture improvement
Competitive cost structure
Actions Yielding Results —
More to Come |
 SunCoke Energy
Mike Thomson |
 31
SunCoke Energy Today
Steel & Coke Industry Outlook
Markets & Business Development
Technology Development
SunCoke Energy Growth Potential
Strategy Execution
Agenda |
 32
Haverhill 1 & 2
(ArcelorMittal/AK
Steel/ Severstal )
Jewell Coal
1.3MM tpy
premium mid-vol
coal
(Expansion underway to
1.8MM tpy
by 2013)
Vitória*
(ArcelorMittal)
Brazil
Under construction
Existing facilities
Headquarters
Jewel Coke
(ArcelorMittal)
Indiana Harbor
(ArcelorMittal)
Knoxville
Granite City
(US Steel)
Middletown
(AK Steel)
SunCoke Energy Today
*SunCoke holds an equity ownership interest of $41 million in Vitória.
Jewell Coke
Indiana Harbor
Haverhill 1
Vitória*
Haverhill 2
Granite City
Middletown
0.0
1.0
2.0
3.0
4.0
5.0
6.0
7.0
2004
2005
2006
2007
2008
2009
2010
2011
2012 |
 33
33
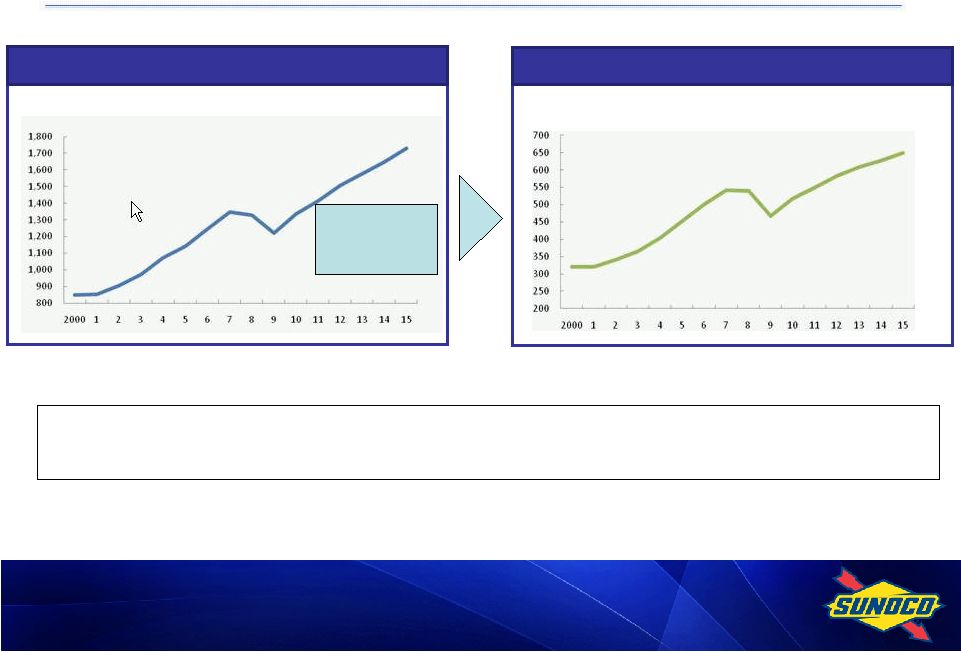
Global Growth Outlook for Steel and Coke
mmtpy
crude steel
Steel Production
mmtpy
Coke Production
5-5.5%
growth
expected
Prices for coking coal and coke have responded accordingly on tight
supplies and increasing demand
Sources: CRU, The Annual Outlook for Metallurgical Coke
and company analysis |
                34
Global Coke Market Opportunity in Next Decade
Americas
Rest of the World
Europe/CIS
India
China
6 -
9
3-4
<3
Replacement
8 -
14
New
Replacement
50+
New
80+
Replacement
20+
New
30+
Replacement
1 -
6
New
10+
Replacement
85+
New
125+
Global total
Number of coke plant projects*
(2010-2020)
*Average of ~1MM tpy
/ plant
Replacement
New |
             35
Current Development Activities
US/Canada
Leveraging existing
customer relationships
On-going discussions
with multiple customers
for integrated and
central plants
Contract renewals
Brazil
Leveraging Vitória facility
as strong reference plant
•Player in major Greenfield
developments
Europe
Early stages for both
central and integrated
plants in both Western
and Eastern Europe
India
Developing presence
on the ground in India
Brand recognition
with customers, EPC
firms and other
strategic players |
 36
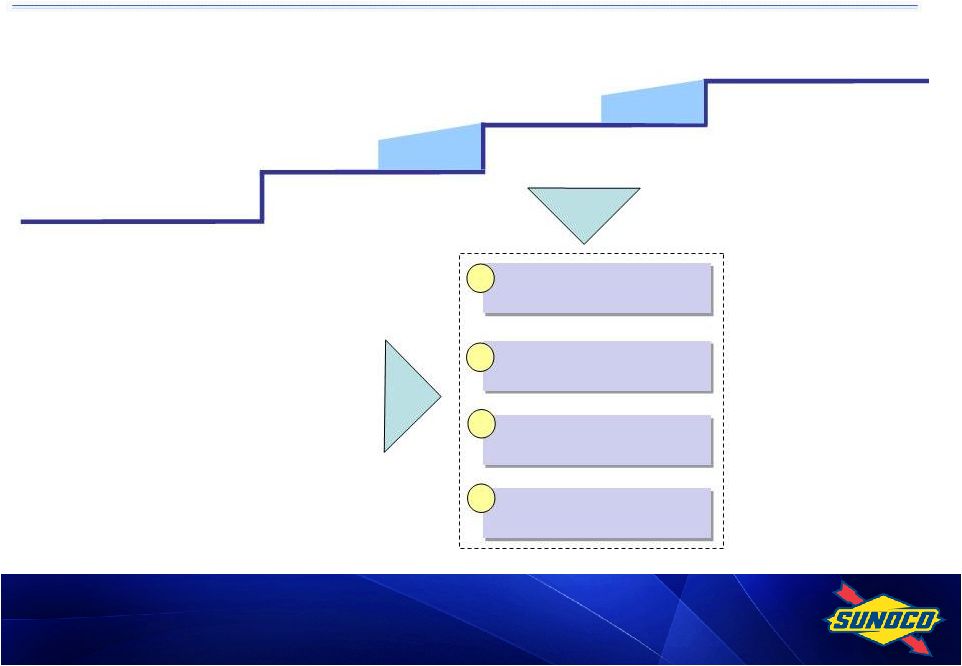
Technology Development
Perfect Core
Technology
Adapt Technology
for World Markets
Game-Changing
Technology
2015+
2010
2010-2014
Horizon 1
Horizon 2
Horizon 3
Key Drivers of
Coke Economics
Raw Material Cost
Production Flexibility
Conversion Cost/Efficiency
Capital Investment
1
2
3
4 |
 37
37
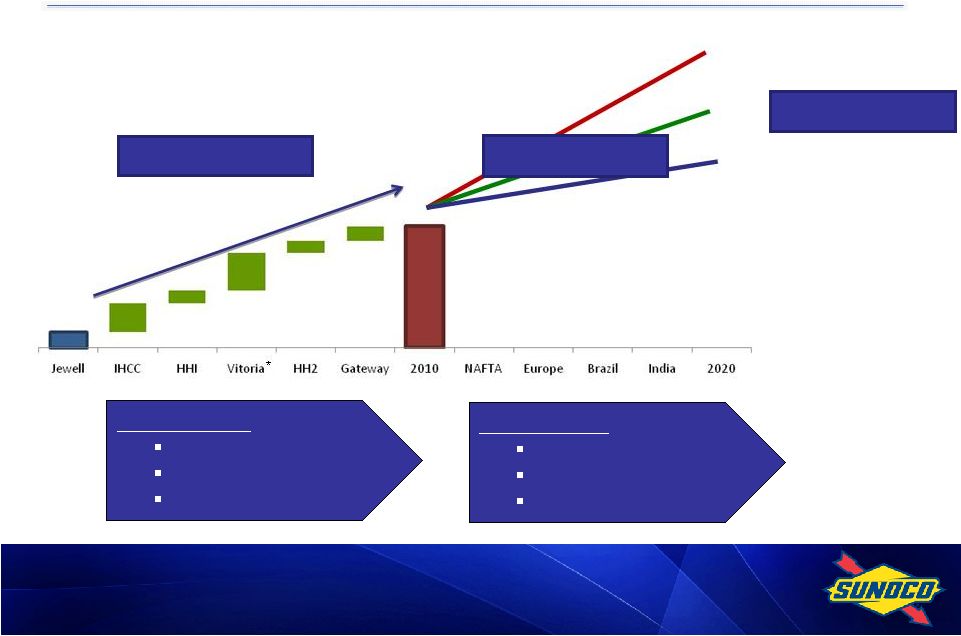
Coke Growth Potential
SunCoke: Tons of coke produced
mmtpy
Track record
11 years
5 projects
4.8 mm tons
0.7
5.5
14.5
‘98
‘05
‘07
‘08
‘09
Growth plan
10 years
6-10 projects (mid)
4-9 mm tons
~ 0.4 mm tons/yr
12.0
9.5
~ 0.6 mm tons/yr
*SunCoke holds an equity ownership interest of $41 million in Vitória.
*
Range of growth |
 38
Coal Expansion Opportunity
Coal expansion plan capital outlay of $25MM is expected to result in
40% increased production by the end of 2012
Current
2011
2012
Production: ~1.75mm tons
Employees: ~350
Production: ~1.40mm tons
Employees: ~315
Production: 1.25mm tons
Employees: 215 |
 39
Projected Growth
2010 Guidance
2012 Pro forma
$215-$235MM
$315-$355MM*
Middletown and Gateway
at full production
Coal expansion &
operational excellence
~ 45% growth projected based on existing projects underway
*Pro forma uses coal prices assumption of $125 to $135/ton.
|
 40
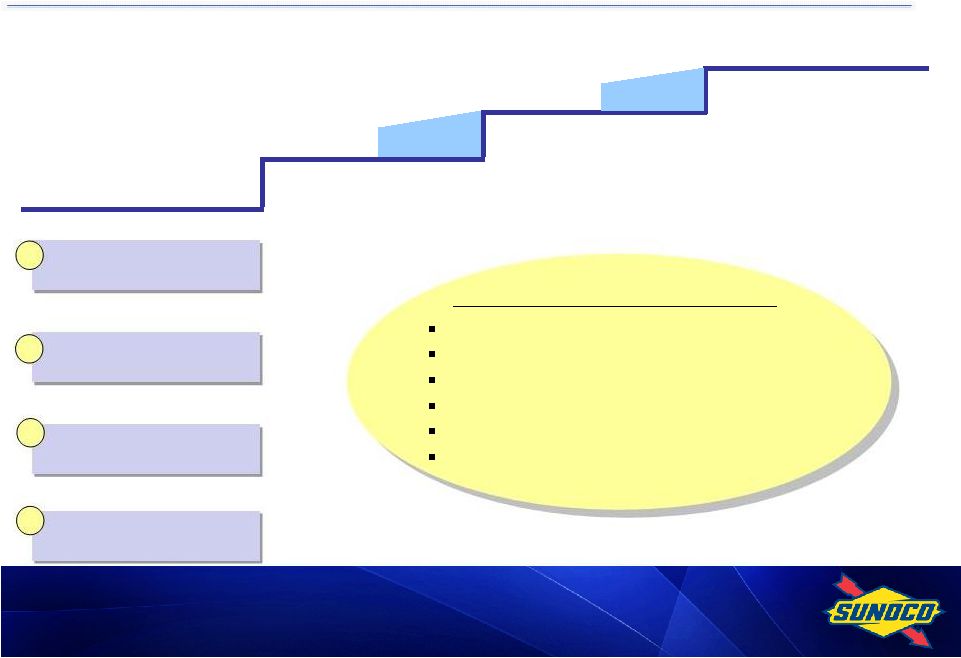
Horizon Outlook for Successful Coke Growth Strategy
Prepare for growth and
defend core position
Execute growth platform
Create options for new
opportunities
2014+
2009-2010
2011-2013
Horizon 1
Horizon 2
Horizon 3
Business Imperatives
for Growth
Customer Value Proposition
1
2
3
4
Proven reliability from reference plants
Leading know-how and expertise
Demonstrated product quality
Higher energy production
Capital funding
Competitive life-cycle costs
Operating reliability and
cost competitiveness
Capital cost
competitiveness
Technology development
Business development
capability |
 41
Summary
Successful track record of growth and demonstrated execution
Large and growing market for coke driven by steel demand in
emerging economies
SunCoke technology, operational capability and brand may
present growth opportunities in attractive markets
SunCoke management is executing a cohesive strategy
around four key pillars to position SunCoke for success
Operations: The SunCoke Way
Technology Development
Capital Cost Competitiveness
Business Development Capability |
 Financial Strategy
& Wrap Up Brian MacDonald |
 43
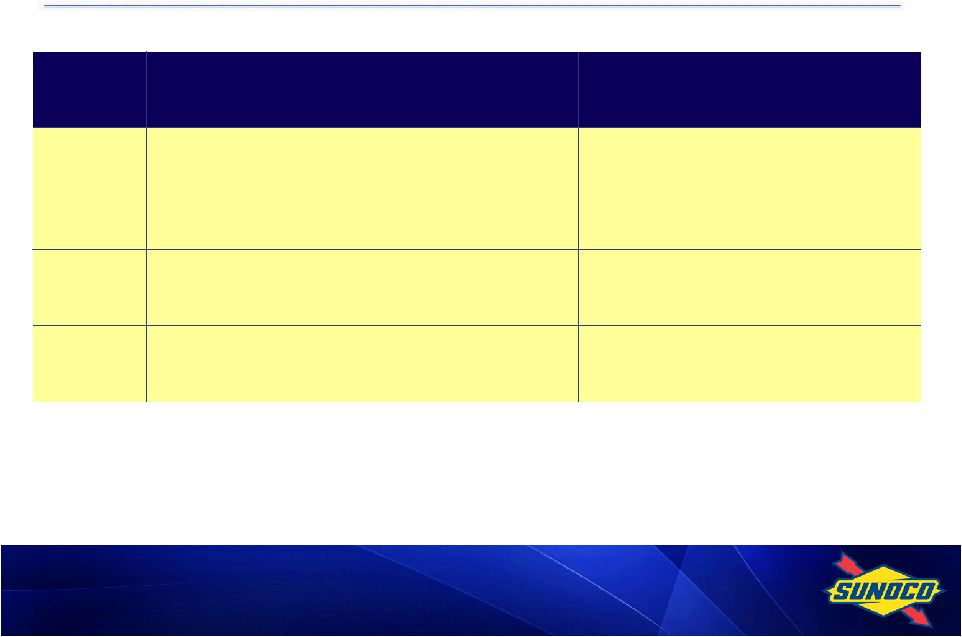
Reset the company’s cost
base
20% reduction in salaried workforce
$300MM annualized
Mar 09
Sep 09
Jun 09
Date
Action
Purpose
Sale of Tulsa Refinery ($157MM)
Focus on core refining assets
Sale of Retail Heating Oil business
($83MM)
Exit non-core business at
attractive price
2010 Annual Incentive Plan Metrics –
60% Pre-Tax Operating Income
Strategic & Financial Actions |
 44
Reset the company’s cost base,
preserve cash
Pension and retiree medical plan
freeze
Nov 09
Realign with broader market while
maintaining a competitive payout
versus peers
50% reduction in common stock
dividend
Oct 09
Oct 09
Date
Action
Purpose
Shutdown of Eagle Point refinery
Leverage underutilized capacity to
reduce refining cost per barrel
Strategic & Financial Actions |
 45
Exit non-core business that failed
to return its cost of capital
Sale of Polypropylene business
($351MM of proceeds)
Mar 10
Remove funding
overhang/optimize tax position
Pension plan contribution
($230MM)
Feb 10
Monetize and highlight a portion
of existing value
Reset SXL’s GP IDR (~$201MM)
and sale of Limited Partner units
(~$145MM)
Feb 10
Date
Action
Purpose
Strategic & Financial Actions |
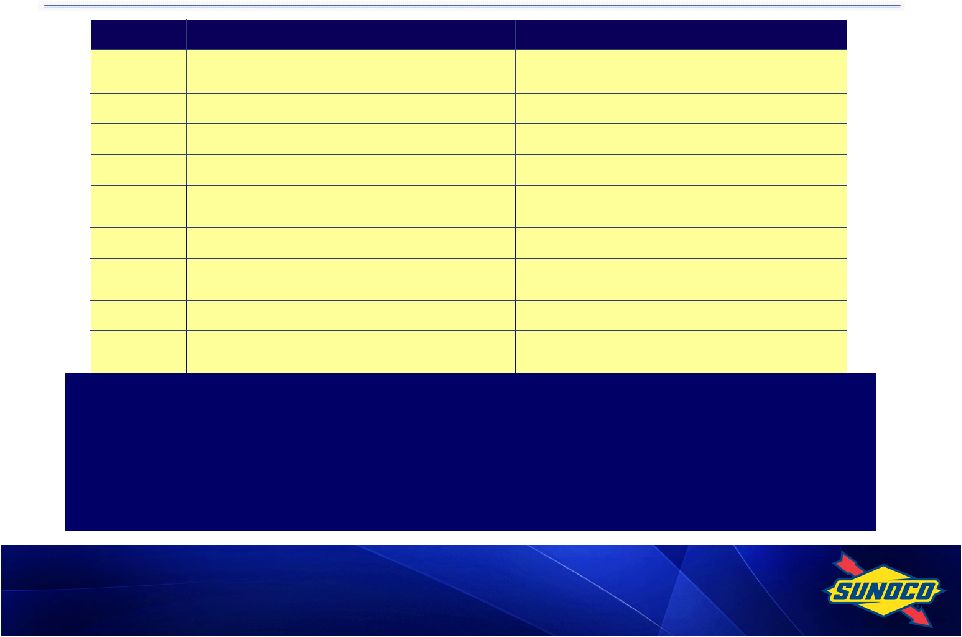 46
Exit non-core business that failed to return its cost of capital
Sale of Polypropylene business
($351MM of proceeds)
Mar 10
Remove funding overhang/optimize tax position
Pension plan contribution ($230MM)
Feb 10
Reset the company’s cost base, preserve cash
Pension and retiree medical plan freeze
Nov 09
Monetize and highlight a portion of existing value
Reset SXL’s GP IDR (~$201MM) and sale of Limited Partner units
(~$145MM)
Feb 10
Realign with broader market while maintaining a competitive payout versus
peers
50% reduction in common stock dividend
Oct 09
Reset the company’s cost base
20% reduction in salaried workforce
$300MM annualized
Mar 09
Oct 09
Sep 09
Jun 09
Date
Action
Purpose
Sale of Tulsa Refinery ($157MM)
Focus on core refining assets
Sale of Retail Heating Oil business ($83MM)
Exit non-core business at attractive price
Shutdown of Eagle Point refinery
Leverage underutilized capacity to reduce refining cost per barrel
Strategic & Financial Actions
Realigning the cost structure and
strengthening the balance sheet to
maximize value creation |
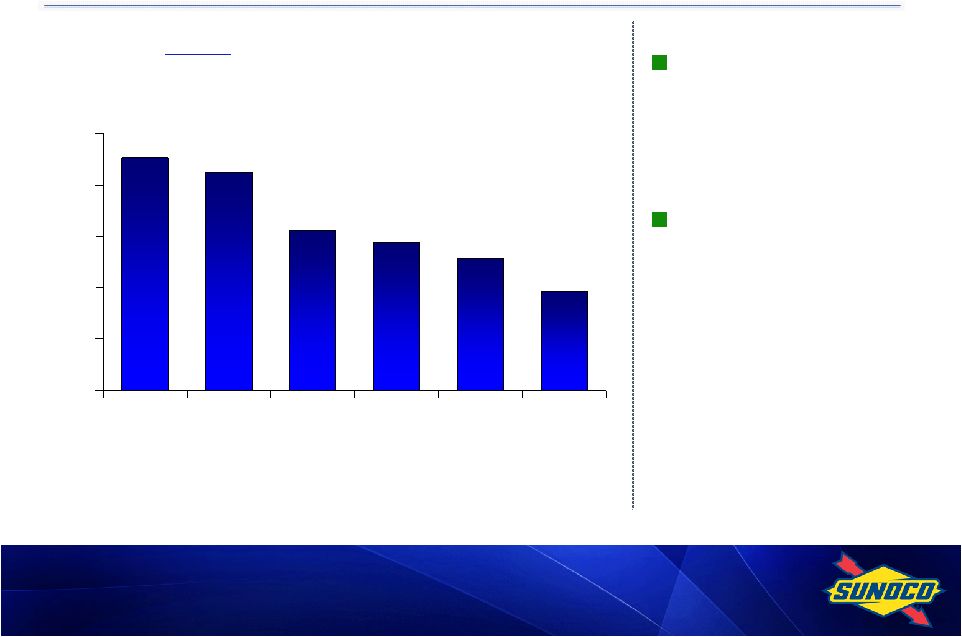 47
* Total
Refining
&
Supply
business
unit
cash
expenses
including
overhead
divided
by
net
production available for sale.
Steady reduction
in refinery cash
costs
Efforts continue to
further reduce
expenses while
optimizing reliable
and safe
operations
Results: Manufacturing Costs Coming Down
Refining
Cash
Cost
Per
Barrel*,
$/B
Rolling Four Quarters (ex-Tulsa)
4.48
4.64
4.72
4.78
5.06
5.13
4.00
4.25
4.50
4.75
5.00
5.25
4Q08
1Q09
2Q09
3Q09
4Q09
1Q10
Four Quarters Ending |
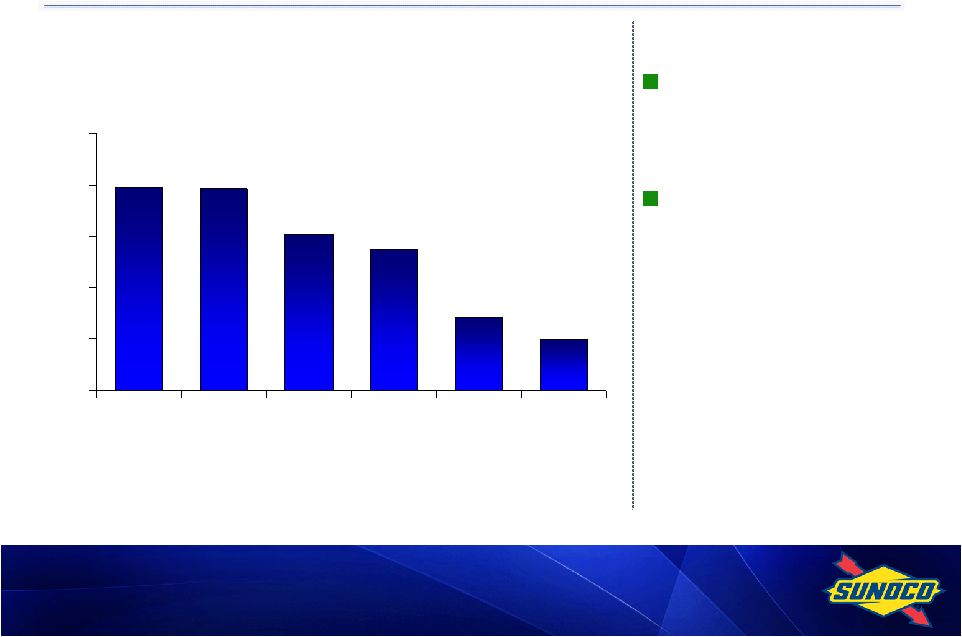 48
* Selling, general and administration expenses from Sunoco’s
Consolidated Statement of Operations, restated to treat the Tulsa refinery
that was sold on June 1, 2009 and the polypropylene chemical operations
that were sold on March 31, 2010 as discontinued operations.
Steady reduction in
SG&A costs
Moving to low-cost
culture --
essential to
maintain long-term
competitiveness
Results: Overhead Costs Coming Down
Total Sunoco SG&A*, MM$
Rolling Four Quarters
(ex-Tulsa and Polypropylene Operations)
649
671
737
752
796
798
600
650
700
750
800
850
4Q08
1Q09
2Q09
3Q09
4Q09
1Q10
Four Quarters Ending |
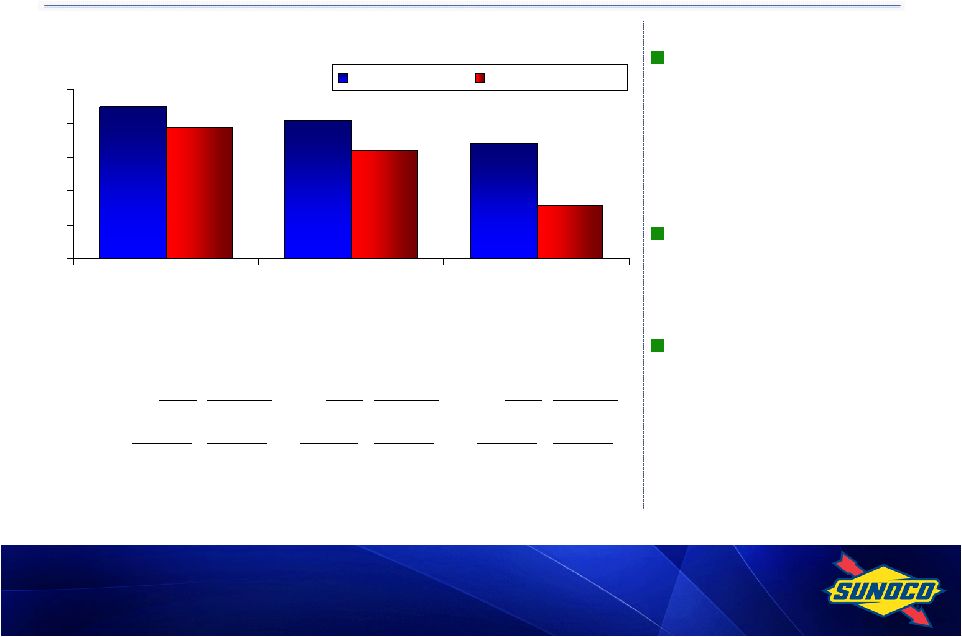 49
Recent actions led to
significant
strengthening in
balance sheet
$2.7 billion of liquidity
as of 3/31/10
$351 million proceeds
from sale of
polypropylene assets
received in April
Results: Strong Balance Sheet
34%
41%
45%
16%
32%
39%
0%
10%
20%
30%
40%
50%
9/30/09
12/31/09
3/31/10
Consolidated *
Sunoco (ex-SXL)
Net Debt-to-Capital Ratio, %
* Revolver Covenant basis. For calculation, see Slide A4.
Cash
Net Debt
Cash
Net Debt
Cash
Net Debt
SXL
2
887
2
866
2
1,139
SUN (ex SXL)
176
1,539
375
1,223
810
498
Consolidated
178
2,426
377
2,089
812
1,637
Balance Sheet Data, MM$
9/30/09
12/31/09
3/31/10 |
 50
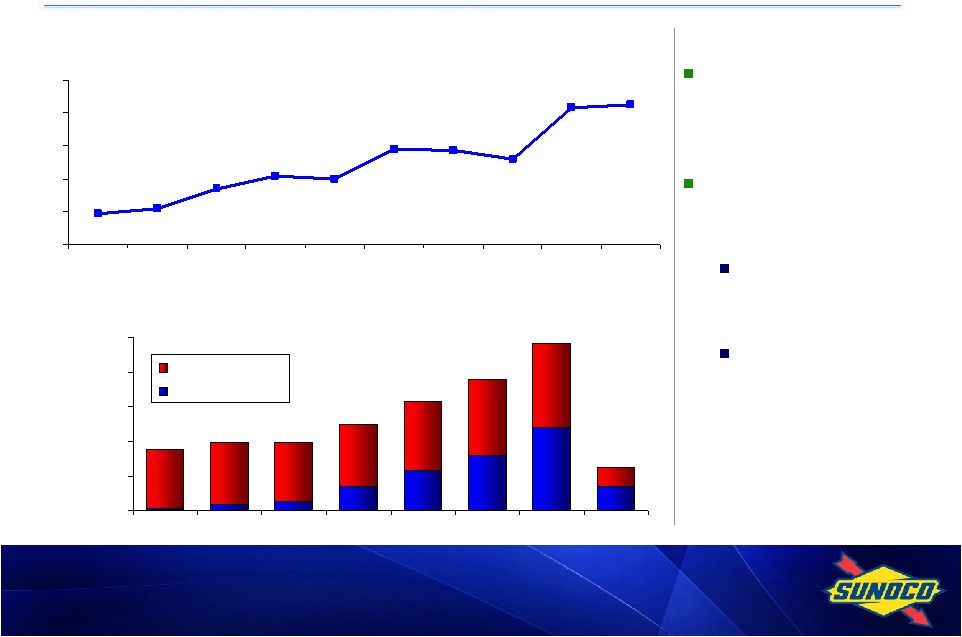
Results: Embedded Logistics Value
Currently, Sunoco
receives approximately
half of SXL’s cash
distribution
Implied value of Sunoco’s
combined interests =
$1.2B to $1.4B
10 million LP units
implying ~$600MM -
$700MM value
GP current
distributions of
~$40MM per year
implying ~$600MM -
$700MM value
SXL Market Capitalization, MM$
(LP Interest Only)
2,127
2,072
1,294
1,432
461
546
840
1,032
1,000
1,442
0
500
1,000
1,500
2,000
2,500
2/8/02
12/31/02
12/31/03
12/31/04
12/31/05
12/31/06
12/31/07
12/31/08
12/31/09
3/31/10
SXL Cash to Sunoco, Inc.,
MM$
(excludes cash from sales of LP units and IDR reset)
0
20
40
60
80
100
2003
2004
2005
2006
2007
2008
2009
1Q10
LP Distribution
GP
Distribution |
 51
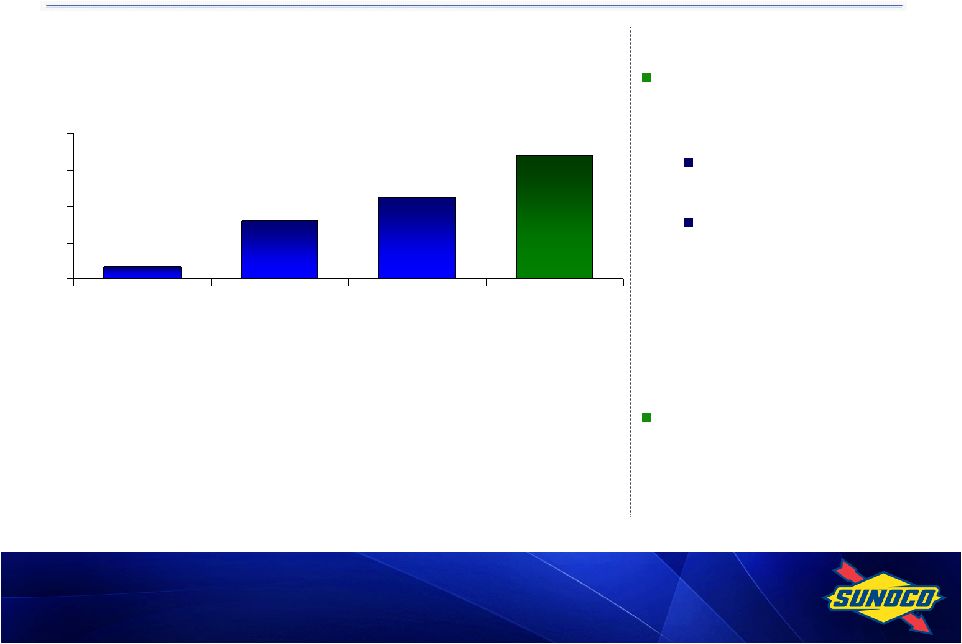
Results: Embedded Coke Value
Coke has strong earnings
growth profile with significant
improvement in pipeline
2010 EBITDA guidance of
$215MM -
$235MM
Pro forma EBITDA by
2012 of $315MM -
$355MM, with full run-rate
of Granite City,
Middletown and coal
expansion
Significant potential to unlock
value for SUN shareholders
and enhance both businesses
34
160
226
315-355
-
100
200
300
400
2007
2008
2009
Pro forma
2012**
Coke EBITDA*, MM$
* For reconciliation to Net Income, see Slide A3.
** Sunoco projection based on current projects. |
 52
Refining
& Supply
1,100
Chemicals
690
Logistics
1,070
Will create two well-positioned businesses:
Leading
high-quality
metallurgical
coke
manufacturer
with
operations in the U.S. and abroad
Streamlined fuels business that is better positioned to become the
premier provider of transportation fuels in its markets
Separation planned for first half of 2011
Evaluating a number of strategic options for separation
Will ultimately separate 100%
Enhances both businesses and allows each to pursue
more focused strategic plan
Unlocking Shareholder Value via SunCoke Separation |
 53
Refining
& Supply
1,100
Chemicals
690
Logistics
1,070
Protect balance sheet during continued challenging
economic downturn in refining industry
Pursue attractive growth opportunities in business lines
with best returns and growth prospects
Logistics
–
both
within
Sunoco
footprint
and
outside
Brand-led growth strategy in Retail Marketing
Support SunCoke growth opportunities prior to separation
Evaluate appropriate deleveraging for Sunoco
Path Forward: Cash Priorities |
 54
Strategic Goals
Premier provider of transportation fuels in our markets
Growing Coke business generating increased shareholder value as
a separate company
Significant progress made
Positive expense trends
Improved balance sheet
Improving margin capture
Continued growth in Coke and Logistics
Areas of forward focus
Further reduce expenses to maintain competitiveness
Protect the balance sheet
Redeploy capital toward the highest returns and best growth
prospects
Unlock the embedded value of portfolio
Path Forward: Strategic Summary |
 APPENDIX
|
 Retail
Marketing Financial Summary 2003
2004
2005
2006
2007
2008
2009
EBITDA, $MM
244
217
155
233
221
439
241
Less: Depreciation
99
106
105
104
108
110
95
Less: Income Tax
54
43
20
53
44
128
60
Net Income
91
68
30
76
69
201
86
A1 |
 Sunoco
Logistics Partners L.P. Financial Summary * Net of Capitalized Interest
A2
2002
2009
EBITDA, $MM
97
343
Less: Depreciation
31
48
Less: Income Tax
2
-
Less: Interest Cost & Debt Expense, Net*
17
45
Net Income
47
250 |
 SunCoke Financial Summary
*
Projected
**
Pro forma based on announced projects
A3
Proforma
2007
2008
2009
2010*
2012**
EBITDA, $MM
34
160
226
215-235
315-355
Less: Depreciation
20
25
33
42
55
Less: Income Tax
3
46
73
66-71
101-116
Plus: Tax Credits
18
16
19
18
16
Plus: Granite City
one-time tax credit
-
-
41
-
-
Net Income
29
105
180
125-140
175-200 |
 Net
Debt / Capital Calculation Financial Ratios, MM$ except ratios
*
Represents Partners’
Capital for SXL and Shareholders’
Equity for Sunoco
**
The Net Debt / Capital ratio is used by Sunoco management in its
internal financial analysis and by investors and
creditors in the assessment of Sunoco’s financial position
*** Capital excludes noncontrolling
interests
Proforma
Proforma
Proforma
SUN
SUN
SUN
SXL
(ex SXL)
Sunoco
SXL
(ex SXL)
Sunoco
SXL
(ex SXL)
Sunoco
Debt
889
1,713
2,602
868
1,596
2,464
1,141
1,306
2,447
Plus: Debt Guarantees
-
2
2
-
2
2
-
2
2
Less: Cash
(2)
(176)
(178)
(2)
(375)
(377)
(2)
(810)
(812)
Net Debt
887
1,539
2,426
866
1,223
2,089
1,139
498
1,637
Equity*
852
2,443
2,443
862
2,557
2,557
657
2,712
2,712
SXL Noncontrolling Interest
-
-
485
-
-
488
-
-
414
Capital
1,739
3,982
5,354
1,728
3,780
5,134
1,796
3,210
4,763
Net Debt / Capital (Sunoco
Revolver Covenant Basis)**
51%
39%
45%
50%
32%
41%
63%
16%
34%
Debt / Capital (GAAP Basis) ***
52%
49%
47%
12/31/2009
3/31/2010
9/30/2009
A4 |
