Attached files
| file | filename |
|---|---|
| EX-21 - EXHIBIT 21 - LASERCARD CORP | ex21.htm |
| EX-23.1 - EXHIBIT 23.1 - LASERCARD CORP | ex23-1.htm |
| EX-32.1 - EXHIBIT 32.1 - LASERCARD CORP | ex32-1.htm |
| EX-31.2 - EXHIBIT 31.2 - LASERCARD CORP | ex31-2.htm |
| EX-32.2 - EXHIBIT 32.2 - LASERCARD CORP | ex32-2.htm |
| EX-31.1 - EXHIBIT 31.1 - LASERCARD CORP | ex31-1.htm |
| EX-23.2 - EXHIBIT 23.2 - LASERCARD CORP | ex23-2.htm |
UNITED STATES
SECURITIES AND EXCHANGE COMMISSION
Washington, D.C. 20549
FORM 10-K
|
[Mark One]
|
||
|
x
|
ANNUAL REPORT PURSUANT TO SECTION 13 OR 15(d) OF
|
|
|
THE SECURITIES EXCHANGE ACT OF 1934
|
||
|
For the Fiscal Year Ended April 2, 2010
|
||
|
OR
|
||
|
o
|
TRANSITION REPORT PURSUANT TO SECTION 13 OR 15(d) OF
|
|
|
THE SECURITIES EXCHANGE ACT OF 1934
|
||
|
For the Transition Period from _____ to _____
|
||
|
Commission File Number: 0-6377
|
||
LASERCARD CORPORATION
(Exact name of registrant as specified in its charter)
|
Delaware
|
77-0176309
|
|||
|
(State or other jurisdiction of
|
(I.R.S. Employer
|
|||
|
incorporation or organization)
|
Identification No.)
|
|
1875 North Shoreline Boulevard, Mountain View, CA
|
94043-1601 | |||
|
(Address of principal executive offices)
|
(Zip Code)
|
|||
| (650) 969-4428 | ||
| (Registrant’s telephone number, including area code) | ||
|
Securities registered pursuant to Section 12(b) of the Act:
|
|||
|
Common Stock, $0.01 Par Value
|
The NASDAQ Stock Market LLC
|
||
|
(Title of each class)
|
(Name of each exchange on which registered) | ||
|
Securities registered pursuant to Section 12(g) of the Act:
|
|||
|
None
|
||
|
(Title of class)
|
||
Indicate by check mark if the registrant is a well-known seasoned issuer, as defined in Rule 405 of the Securities Act. o Yes x No
Indicate by check mark if the registrant is not required to file reports pursuant to Section 13 or Section 15(d) of the Act. o Yes x No
Indicate by check mark whether the registrant (1) has filed all reports required to be filed by Section 13 or 15(d) of the Securities Exchange Act of 1934 during the preceding 12 months (or for such shorter period that the registrant was required to file such reports), and (2) has been subject to such filing requirements for the past 90 days. x Yes o No
Indicate by check mark whether the registrant has submitted electronically and posted on its corporate Web site, if any, every Interactive Data File required to be submitted and posted pursuant to Rule 405 of Regulation S-T (§ 229.405 of this chapter) during the preceding 12 months (or for such shorter period that the registrant was required to submit and post such files). o Yes o No
Indicate by check mark if disclosure of delinquent filers pursuant to Item 405 of Regulation S-K (§ 229.405 of this chapter) is not contained herein, and will not be contained, to the best of registrant’s knowledge, in definitive proxy or information statements incorporated by reference in Part III of this Form 10-K or any amendment to this Form 10-K. o
Indicate by check mark whether the registrant is a large accelerated filer, an accelerated filer, a non-accelerated filer, or a smaller reporting company. See the definitions of “large accelerated filer,” “accelerated filer” and “smaller reporting company” in Rule 12b-2 of the Exchange Act.
|
Large accelerated filer o
|
Accelerated filer x
|
|
Non–accelerated filer o
|
Smaller reporting company o
|
Indicate by check mark whether the registrant is a shell company (as defined in Rule 12b-2 of the Act). o Yes x No
Based on the last trade price of our Common Stock on The Nasdaq Stock Market, Inc. on the last business day of the registrant’s most recently completed second fiscal quarter (September 30, 2009), the aggregate market value of the voting stock held by non-affiliates of the registrant was approximately $99,112,000. Shares of common stock held by officers, directors and other persons who may be “affiliates” of the Registrant have been excluded from this computation. This determination of affiliate status is not necessarily a conclusive determination for other purposes.
Indicate the number of outstanding shares of Common Stock, $.01 par value, at June 15, 2010: 12,264,882
DOCUMENTS INCORPORATED BY REFERENCE: Portions of the Registrant’s Definitive Proxy Statement in connection with its September 14, 2010 Annual Meeting of Stockholders are incorporated by reference into Part III of this Annual Report on Form 10-K.
2
PART I
|
Item 1.
|
Business
|
4
|
|
|
Forward-Looking Statements
|
4
|
||
|
General Development of Business
|
5
|
||
|
Financial Information about Segments
|
6
|
||
|
Narrative Description of Business
|
6
|
||
|
Item 1A.
|
Risk Factors
|
14
|
|
|
Item 1B.
|
Unresolved Staff Comments
|
21
|
|
|
Item 2.
|
Properties
|
21
|
|
|
Item 3.
|
Legal Proceedings
|
21
|
|
|
Item 4.
|
Removed and Reserved
|
21
|
|
|
PART II
|
|||
|
Item 5.
|
Market for Registrant’s Common Equity, Related Stockholder Matters and Issuer Purchases of Equity Securities
|
22
|
|
|
Item 6.
|
Selected Financial Data
|
24
|
|
|
Item 7.
|
Management’s Discussion and Analysis of Financial Condition and Results of Operations
|
25
|
|
|
Consolidated Results of Operations
|
27
|
||
|
Liquidity and Capital Resources
|
32
|
||
|
Contractual Obligations
|
34
|
||
|
Off-Balance Sheet Arrangements
|
34
|
||
|
Application of Critical Accounting Policies and Estimates
|
34
|
||
|
Recently Adopted Accounting Pronouncements
|
38
|
||
|
Recently Issued Accounting Pronouncements
|
38
|
||
|
Item 7A.
|
Quantitative and Qualitative Disclosures about Market Risk
|
40
|
|
|
Item 8.
|
Financial Statements and Supplementary Data
|
42
|
|
|
Report of Independent Registered Public Accounting Firm
|
42
|
||
|
Consolidated Financial Statements
|
44
|
||
|
Notes to Consolidated Financial Statements
|
48
|
||
|
Quarterly Financial Information (Unaudited)
|
73
|
||
|
Item 9.
|
Changes in and Disagreements with Accountants on Accounting and Financial Disclosure
|
74
|
|
|
Item 9A.
|
Controls and Procedures
|
74
|
|
|
Item 9B.
|
Other Information
|
75
|
|
|
PART III
|
|||
|
Item 10.
|
Directors, Executive Officers and Corporate Governance
|
76
|
|
|
Item 11.
|
Executive Compensation
|
76
|
|
|
Item 12.
|
Security Ownership of Certain Beneficial Owners and Management and Related Stockholder Matters
|
76
|
|
|
Item 13.
|
Certain Relationships and Related Transactions, and Director Independence
|
76
|
|
|
Item 14.
|
Principal Accountant Fees and Services
|
76
|
|
|
PART IV
|
|||
|
Item 15.
|
Exhibits and Financial Statement Schedules
|
77
|
|
| Signatures |
83
|
||
3
PART I
ITEM 1. BUSINESS
FORWARD-LOOKING STATEMENTS. All statements contained in this report that are not historical facts are forward-looking statements within the meaning of the federal securities laws. Forward-looking statements are not facts or guarantees of future performance or events. Rather, they are based on current expectations, estimates, beliefs, assumptions, and goals and objectives and are subject to risks and uncertainties that are difficult to predict. As a result, our actual results may differ materially from the statements made. Often such forward-looking statements can be identified by their use of words such as “may,” “will,” “intends,” “plans,” “believes,” “anticipates,” “visualizes,” “expects,” “estimates,” or similar language. Forward-looking statements made in this report include but are not limited to statements regarding our beliefs as to current and potential market segments, customers, and applications for and deployment of our products; the advantages of, potential income from, and duties to be performed under the sale of a second-source card manufacturing license to Global Investment Group (“GIG”)/Prevent Global družba za upravljanje, investicije in razvoj d.d. (“Prevent Global”); our expectations as to the continuation, production quantities, delivery rates and requested and actual delivery schedule, backlog, revenue, margins, and profit for our products for government ID card programs; our expectation of negative gross profit from the Drives, systems and professional services segment; the need for, expected success of, expense and potential benefits from our research and development efforts; our belief that available cash will be sufficient to execute our business plan for fiscal 2011 and fund our actual capital expenditures despite expected quarterly fluctuations; our projected liquidity in light of the issues surrounding our investments in auction rate securities (“ARSs”), and our ability to secure more contracts; and our belief as to the credit quality of our ARSs and the changes in the fair value of these securities and our belief that the Put Option (“Put Option”) received in the ARS “Rights” offering from UBS Financial Services (“UBS”) will be honored by UBS on June 30, 2010.
These forward-looking statements are based upon our assumptions about and assessment of the future, which may or may not prove true, and involve a number of risks and uncertainties including, but not limited to, whether there is a market for cards for homeland security in the U.S. and abroad, and if so, whether such market will utilize optical security media (“OSM”) cards as opposed to other technologies; significant customer concentration and reliance on continued U.S., Saudi Arabian, and Angolan government business; risks associated with doing business in and with foreign countries; whether the GIG/Prevent Global factory startup and training will occur; whether GIG/Prevent Global will make the balance of its required payments to us and to operate the facility and the results of our recently filed litigation in the UK regarding the proper counterparty to the GIG/Prevent Global agreements and any counterclaims related thereto; and if completed, whether the facility will efficiently produce high quality optical memory cards in volume that meet our standards; lengthy sales cycles and changes in and dependence on government policy-making; reliance on channel partners such as value-added resellers and system integrators to generate sales, perform customer system integration, develop application software, integrate OSM card systems with other technologies, test products, and work with governments to implement card programs; potential manufacturing difficulties, implementing new manufacturing processes, and outsourcing manufacturing; our ability to produce and sell read/write drives in volume; the unpredictability of customer demand for products and customer issuance and release of corresponding orders; the possibility that OSM cards will not be purchased for the full implementation of card programs in Italy, the Kingdom of Saudi Arabia, Angola, and India, or for Department of Homeland Security (“DHS”) programs in the U.S., or will not be selected for other government programs in the U.S. and abroad; whether UBS will purchase our ARSs, and the risks set forth in the section entitled “Risk Factors” and elsewhere in this report and our other SEC filings. These forward-looking statements speak only as of the date of this report, and, except as required by law, we undertake no obligation to publicly release updates or revisions to these statements whether as a result of new information, future events, or otherwise.
For purposes of presentation, we label our annual accounting period end as March 31 and our quarterly accounting period ends as June 30, September 30 and December 31. In fact, we operate and report based on quarterly periods ending on the Friday closest to month end. Fiscal year 2010 ended on April 2, 2010 and was comprised of 52 weeks. Fiscal year 2009 ended on April 3, 2009 and was comprised of 53 weeks. Fiscal year 2008 ended on March 28, 2008 and was comprised of 52 weeks.
4
GENERAL DEVELOPMENT OF BUSINESS
LaserCard Corporation and its subsidiaries (“LaserCard,” “we” or “us”) is a leading provider of secure identity (“ID”) solutions and associated professional services to governments and commercial clients around the world, and also manufactures a wide range of advanced, secure, ID credentials. These ID credentials feature sophisticated security features including high resolution security printing and are offered with a range of machine readable technologies, either singly or in combinations, such as contact and contactless integrated circuit chips (“smart” chips), radio frequency identification (“RFID”) tags and LaserCard’s own Optical Security Media (“OSM”). We also manufacture a wide range of high quality specialty cards and offer card personalization and ID management solutions under the CCD and Cards & More brands serving the European, Middle Eastern, African and Asian markets. Our cards and systems are used in countries around the world, such as the United States, Germany, Angola, Italy, India, Costa Rica and the Kingdom of Saudi Arabia, for demanding applications including government identification programs for citizens and foreign residents, vehicle registration, student campus card and driver license applications, service provision and facility access.
LaserCard Corporation was incorporated under the laws of the State of California on July 23, 1968 and was reincorporated as a Delaware corporation on June 24, 1987. Our operations are conducted through our two wholly-owned subsidiaries, Challenge Card Design Plastikkarten GmbH, a German company, (“CCD”) and LaserCard Corporation, a California corporation. Our mailing address and executive offices are located at 1875 North Shoreline Boulevard, Mountain View, California 94043 and our telephone number is (650) 969-4428.
Our annual report on Form 10-K, quarterly reports on Form 10-Q, current reports on Form 8-K and all amendments to reports filed pursuant to Sections 13(a) and 15(d) of the Securities Exchange Act of 1934, as amended (the “Exchange Act”) are filed with the Securities and Exchange Commission (“SEC”). Such reports and other information filed by the LaserCard with the SEC can be obtained free of charge as soon as reasonably practicable after such material is electronically filed or furnished to the SEC using the hypertext link to the SEC’s website via our website, www.lasercard.com. They also may be obtained directly from the SEC’s website, www.sec.gov/edgar/searchedgar/companysearch.html, under CIK code 30140. The public may also read and copy any materials filed by LaserCard with the SEC at the SEC’s Public Reference Room at 100 F Street, NE, Room 1580, Washington, DC 20549. The public may obtain information on the operation of the Public Reference Room by calling the SEC at 1-800-SEC-0330. The contents of these websites are not incorporated into this filing.
Trademarks. LaserCard® is our registered trademark. Optical/SmartTM card, OpticalProximityTM card, ConciergeCardTM, OptiChipTM, LaserPassTM, Personalized Embedded HologramHDTM, Optical IDLockTM and LaserBadgeTM are our other trademarks. We may also refer to trademarks of other corporations and organizations in this document.
LaserCard’s principal areas of business are the design, manufacture and sale of a broad range of high quality, advanced technology, secure identity credentials, the provision of the associated system solutions for client data capture, credential personalization and issuance, and the professional services that support the design and implementation of these systems. We believe our proprietary optical security media technology—invented, patented, developed and manufactured by us, is the most secure and counterfeit resistant visual and digital feature applied to card-based credentials.
As part of the high security aspects of OSM, it is possible to securely store up to 2.8 megabytes of digital data. This makes the OSM card ideal for portable and secure data storage and for off-line cardholder identification.
Current applications for LaserCard OSM include identification cards for citizens, non-citizen permanent residents, temporary foreign workers, and government employees, as well as vehicle registration.
Programs include:
o United States Permanent Resident Card (“Green Card”)
o Kingdom of Saudi Arabia National ID Card
o Angolan National ID Card
o Italian Citizen ID Card
o Government employee ID cards for two national agencies in Italy
o Costa Rica Foreign Resident ID Card program
o Vehicle registration cards for three states in India
5
FINANCIAL INFORMATION ABOUT SEGMENTS
Our three reportable segments are: (1) OSM cards, (2) Drives, systems and professional services, including OSM read/write drives, maintenance, system solutions and professional services, and (3) Specialty cards and card printers. The segments were determined based on the information used by the chief operating decision maker in making operating decisions for LaserCard. The OSM cards and Drives, systems and professional services reportable segments are not strategic business units which offer unrelated products and services; rather, these reportable segments utilize compatible technology and are marketed jointly. Specialty cards and card printers is a strategic business unit offering at times unrelated products and at times related products with the other reportable segments. Refer to “Segment Reporting” in Note 4 of the Notes to Consolidated Financial Statements in Item 8, “Financial Statements and Supplementary Data,” for additional industry segment information.
NARRATIVE DESCRIPTION OF BUSINESS
LaserCard Corporation is a leading provider of secure ID solutions and services to governments and commercial clients around the world, and manufactures a wide range of advanced, secure identity credentials. These ID credentials feature sophisticated security features including high resolution security printing and are offered with a range of machine readable technologies, either singly or in combinations, such as contact and contactless integrated circuit chips (“smart” chips), radio frequency identification (RFID) tags and LaserCard’s own Optical Security Media (“OSM”). We also manufacture a wide range of high quality specialty cards and offer card personalization and ID management solutions under the CCD and Cards & More brands serving the Europe, the Middle East, and Africa (the “EMEA”) and Asian markets. Our cards and systems are used in countries around the world, such as the United States, Germany, Angola, Italy, India, Costa Rica the Kingdom of Saudi Arabia and other Middle Eastern and European countries, for demanding applications including government identification programs for citizens and foreign residents, vehicle registration, student campus card and driver license applications, service provision and facility access.
Optical Security Media Cards:
LaserCard’s OSM card is a secure, counterfeit-resistant identity credential which is used by national and state governments primarily in secure identification applications. The selection of OSM is often based on its advanced security characteristics, including confident visual authentication, tamper-proof features and strong counterfeit resistance. Key advantages of OSM are:
|
|
o
|
Capacity for Portable Biometric Data Storage accommodating facial, fingerprint and/or iris images and templates supporting secure off-line identity verification.
|
|
|
o
|
Scalable and Secure Data Storage allowing customers to update, modify, or upgrade programs without needing to reissue credentials.
|
|
|
o
|
Can be combined with all major machine-readable credential technologies including contact and contactless IC chips, magnetic stripes, OCR-B, and RFID tags.
|
|
|
o
|
Ability to incorporate ultra high-resolution (25,000 dpi) security patterns, images and microtext; covert diffractive security features.
|
|
|
o
|
Ability to incorporate a “Personalized Embedded HologramHD”: a personalized, optical variable device containing the credential holder’s facial image and other data permanently laser etched into the OSM; this can be confidently authenticated by the human eye, the most commonly-used method (90% of the time).
|
|
|
o
|
Ability to incorporate forensic security features.
|
|
|
o
|
Durability, including supporting long life programs, withstanding harsh environmental conditions, and enhancing reliability.
|
6
We also market multi-technology cards to governments seeking credentials which will satisfy the needs of more than one application. This increasingly requires a combination of OSM with one or more chip technologies.
Examples of LaserCard multi-technology solutions include:
|
|
o
|
Kingdom of Saudi Arabia National ID Card
|
|
|
o
|
Vehicle registration cards for three states in India
|
|
|
o
|
Italian Citizen ID Card
|
|
|
o
|
The Employee ID badge of Italy’s National Police
|
Typical applications for the multi-technology card include the provision of e-government services via the chip while the OSM acts as a secure visual card authentication feature, backs up the chip in case of failure or tampering, and stores an audit trail of events in the card’s life for security and forensic purposes. In addition, the OSM can store a suite of original biometric images (for example, face, fingerprints and irises) to provide a means of ID verification across other government and private sector applications. Given that OSM can be used securely off-line, it is not necessary to have access to a Public Key Infrastructure at every transaction point, an extremely costly and complex system, thus enhancing the over-all cost-effectiveness of OSM.
Principal Markets: Government Identity Applications
The predominant application for our OSM and multi-technology credentials is secure identity in government programs, including immigration, border entry and citizenship. The counterfeit-resistant cards are typically replaced by the government customer every five or ten years. The following are examples of these government applications:
|
|
o
|
The Green Card, issued by the DHS, evidences that a non-US citizen is approved to reside and be employed in the United States.
|
|
|
o
|
In a program for the Kingdom of Saudi Arabia, our OSM/multi-technology cards are being issued as National Identification Cards.
|
|
|
o
|
The National ID card in Angola identifies the holder as a citizen.
|
|
|
o
|
A motor vehicle registration program in the States of Delhi, Maharashtra and Gujarat, India, in which the Optical/Smart™ card is used for storing the payment of road tax, vehicle registration, insurance, traffic and vehicle violations, vehicle fitness and owner/operator information.
|
|
|
o
|
The Foreign Resident ID Card program in Costa Rica evidences that a non-Costa Rican citizen is approved to reside and employed in Costa Rica.
|
|
|
o
|
The electronic Citizen ID Card of Italy identifies the holder as a citizen and confers upon the holder the rights and privileges to which a citizen is entitled; the card can also be used as an accepted document for crossing borders at over 32 different countries.
|
Card Manufacturing
Our principal OSM and multi-technology card manufacturing operations are located in Mountain View, California. We have an annual production capacity of up to 26 million cards depending upon the mix of product features. We also have card manufacturing operations located in Rastede, Germany described below under “Specialty Cards and Card Printers.”
Raw Materials
We establish ongoing relationships with principal qualified suppliers to maintain adequate raw material supplies for the manufacture of cards and, when commercially reasonable, we utilize multiple suppliers and consider alternate suppliers. We maintain raw materials inventory levels that take into account current expected demand, order-to-delivery lead times, supplier production cycles and minimum order quantities. If we are unable to buy raw materials in sufficient quantities and on a timely basis, we would not be able to deliver products to customers on time. Most of the raw materials used in the manufacture of cards are available from one or more qualified suppliers. Such materials include plastic films, which are available from multiple suppliers. Processing chemicals, inks and bonding adhesives are also obtained from various suppliers. Semiconductor chip modules and inlays for use in contact and contactless cards are available from multiple suppliers. Certain photographic films used in OSM cards are commercially available solely from Eastman Kodak Company (“Kodak”) of the United States. No assurance can be given that Kodak will continue to supply such photographic films on a satisfactory basis and in sufficient quantities to meet our requirements. We are researching other materials for use as OSM card media. All raw materials and components are subject to supply and demand limitations.
7
OSM Read/Write Drives; Manufacturing and Parts/Components
OSM cards are used in conjunction with a card read/write drive that connects to a personal computer. The price, performance and availability of read/write drives are factors in the commercialization of OSM cards. We maintain read/write drive manufacturing operations in our Mountain View, California facility and have licensed Ritel of Italy for drive manufacturing. We continuously seek to improve the performance and reduce the drive cost through design and procurement changes. Much higher production volumes would be required to significantly reduce our current cost and pricing.
To maintain adequacy of parts and components for the manufacture of read/write drives, we attempt to establish ongoing relationships with principal suppliers and obtain information about alternate suppliers. If we are unable to buy parts and components in sufficient quantities and on a timely basis, we would not be able to deliver products to customers on time. We purchase read/write drive parts for our anticipated read/write drive demand, taking into consideration the order-to-delivery lead times of vendors and the economic purchase order quantity for such parts. The optical recording head currently used is a custom part obtained from one supplier: Audio-Technica Corp., of Japan. If Audio-Technica were to discontinue doing business with us, alternate suppliers may be found but the technology transfer could delay production of read/write drives.
Professional Services
LaserCard offers value-added professional services designed to help our customers increase program roll-out predictability, accelerate start-up and avoid problems in their card issuance project implementation. Some of our key advantages are:
|
|
o
|
We are a trusted supplier and partner in government and commercial projects worldwide.
|
|
|
o
|
We are skilled in analyzing and structuring secure ID programs.
|
|
|
o
|
We design, develop and manufacture world-class credentials.
|
|
|
o
|
We offer customized, inclusive, innovative multi-technology approach.
|
|
|
o
|
We supply solutions customized individually for each program’s threat and risk profile.
|
|
|
o
|
We have an ecosystem of strong partners to support complex projects.
|
|
|
o
|
We provide personalized, expert consulting and support.
|
Specifically, our value-added professional services include:
|
|
o
|
Consulting
|
|
|
o
|
System architecture design
|
|
|
o
|
Application development
|
|
|
o
|
System integration
|
|
|
o
|
System installation and commissioning
|
|
|
o
|
Operator training and ongoing support
|
Custom Applications. We offer contract services for purchase by customers that require custom programming in the development and integration of their credential applications. We also make software available for purchase for demonstrating data storage, medical and security concepts involving the LaserCard OSM card. We also provide software-development tools for related peripherals and a card issuance application software package.
Specialty Cards and Card Printers
We provide specialty cards and card printers worldwide mainly through our German operations under the CCD and Cards and More brands. CCD offers a full range of specialty cards and is a recognized leader in Europe as a provider of contactless card solutions, primarily in the consumer, special event, and access control sectors including access control gate systems for sporting events and student ID cards for universities. We have the production capacity in Rastede, Germany to manufacture up to 20 million specialty cards per year—including contactless chip, magnetic stripe and plastic cards—and market cards, card printers, and personalization solutions worldwide under the Cards & More and CCD brands. Our facility in Mountain View, California also can provide significant advanced-technology specialty card manufacturing capacity.
8
Sales and Marketing
We market LaserCard products and solutions around the world, primarily through an indirect distribution channel comprised of agents, authorized Value Added Resellers (VARs) and System Integrators (SIs). We offer for sale through the channel all of the products, solutions and services in our three reportable segments. VARs and SIs typically add value in the form of application software development and system integration. Sales to national governments, our largest market by volume and value, are almost exclusively indirect, through VARs and SIs.
Revenues by geographic region are shown in Note 4 of the “Notes to Consolidated Financial Statements” in Item 8, “Financial Statements and Supplementary Data.”
The government ID sales and marketing activities for our OSM cards and Drives, systems and professional services are conducted through our offices in Mountain View, California; Huntington, New York; McLean, Virginia; Uruguay; and Ratingen, Germany. Our website (www.lasercard.com) supports worldwide marketing activities. Our general management and technical personnel work closely with our marketing and sales staff to provide end-customers and channel partners with pre-sales technical support.
Marketing Objectives
Our principal objectives are to:
|
|
o
|
Maintain, leverage and expand the OSM card and multi-technology user community of national and regional governments worldwide;
|
|
|
o
|
Increase customer base by offering professional services, such as consulting, custom software development and the development of integrated secure ID solutions, which can include data capture, personalization and quality assurance modules; and
|
|
|
o
|
Increase market share for specialized cards and associated ID management solutions, such as major event badging and access control and university student ID.
|
Competition
Government Market. Our primary application is in government-sponsored national level identity credential programs, specifically citizen and foreign resident identity, and secondarily in state level vehicle registration programs. We compete for business in these markets at two levels:
|
|
o
|
Primarily, at the level of card technology where our own OSM is generally in competition with IC chips, either contact or RF-enabled. Principal competitors include: Gemalto N.V. (“Gemalto”), Oberthur Card Systems, and Giesecke & Devrient GmbH.
|
|
|
o
|
Secondarily, at the level of the credential issuance system where competition comes from other companies that provide secure ID solutions. Principal competitors include: L-1 Identity Solutions, Sagem Sécurité, Bundesdruckerei GmbH, Thales Group, 3M Company, and Canadian Bank Note Company.
|
We believe that when comparing one card technology with another, each technology will either stand on its own merits when viewed against specific application requirements or a hybrid combination of technologies may deliver the “best of all worlds” solution. In fact, our customers increasingly require OSM in combination with chip technologies and we have partnered successfully with chip suppliers to satisfy these requirements. Currently, we are the only company to offer hybrid cards combining the OSM technology with an embedded IC Chip (Optical/Smart™) or RF-enabled chip (LaserPassTM). Nevertheless, competition for credential programs featuring a single technology is intense and the geographical coverage, financial and marketing resources of our major competitors are significantly greater than ours.
9
The cost of OSM reader technology is often compared directly to that of chip readers which are significantly less expensive. However, in our view, a more appropriate price comparison involves analyzing cost of ownership of the credential plus its infrastructure and support requirements. In this case, we believe that OSM can demonstrate an advantage because of the technology’s greater durability and less frequent replacement, plus the technology’s inherent ability to work securely off-line without the need for high cost networks supported by complex and costly Public Key Infrastructures. Nevertheless, centralized on-line databases combined with wide-area networks may limit the penetration of OSM cards in certain markets.
There are many competitors offering credential issuance systems, ranging from those that specialize in the field, as we do, to general system integrators. Our core skills in the implementation of OSM card issuance systems are second to none and we are increasingly involved in this aspect of the overall system. We believe that the value of these skill is being increasingly recognized by customers and industrial partners alike, increasing our opportunity to capture a greater share of the project value.
Commercial Market. Our commercial business includes specialty cards and card printers. Our specialty card business competes on the basis of added value in the form of high quality printing and manufacturing, strict quality assurance and high levels of customer service, which tends to differentiate us from the conventional card manufacturing company.
Our card printer business has historically focused on the distribution of third party manufactured printers, which then provided an entrée to customers for the sale of cards. We have recently transitioned to offerings with higher value-added content where our implementation and support resources are valued. This has reinforced the symbiotic relationship between printer and card sales so that we are increasingly selling a total solution.
Other Card Technologies. Experimental and potentially competitive card technologies are probably under development at other companies.
OTHER MATTERS
Research and Development
Our research and development expenses were $1.2 million for fiscal year 2010, $2.4 million for fiscal year 2009 and $2.9 million for fiscal year 2008. During fiscal 2010 and 2009, various R&D projects were realigned and cost reductions were implemented consistent with a ‘milestone’- based R&D strategy. We are continuing our effort to develop new OSM card and non-optical card features and structures, including various composite card structures to allow the insertion of contactless chips with RF capability, dual-interface (contact-contactless) with OSM, optically variable device (“OVD”) products, and other market-driven requirements. We are also developing new software demonstrations and tools to stimulate OSM card sales growth. We anticipate that these ongoing research and development efforts should result in enhanced card features and capabilities; however, there is no assurance that such product development efforts will be successful.
Patents and Trademarks
Optical Data Storage. As of March 31, 2010, we owned approximately 18 U.S. patents relating to optical data storage (including optical storage media, optical cards, formats, equipment, systems, software, the utilization of optical storage media, and e-commerce technology), and other U.S. and foreign patent applications have been filed. Approximately 3 counterpart patents of certain U.S. patents are issued in various foreign countries. However, we own certain U.S. patents as to which foreign counterparts have either not been filed or the examination process has been terminated without issuance of the foreign patents. From time to time, we elect to allow some of our U.S. or foreign patents to expire when maintenance fees become due if the patents are deemed no longer relevant. In addition, we protect as trade secrets some refinements to the optical media and cards and know-how related to card production. Also, our know-how and experience in volume card production; system development and software capabilities; brand-name recognition within our card markets; and leading-supplier status for OSM cards are of far greater importance than our patents. Therefore, at this time, we believe that our patent portfolio is helpful but is no longer materially meaningful for maintaining LaserCard’s market position.
10
Our U.S. patents have expiration dates ranging from 2010 to 2025, with the majority expiring during the first part of this period. Since 1998, both U.S and foreign patents expire 20 years from their priority date.
We cannot predict whether the expiration or invalidation of our patents would result in the introduction of competitive products which would adversely affect our future revenues. We presently intend to pursue any infringement of our patents either by litigation, arbitration or negotiation. However, there can be no assurance that any of our patents will be sufficiently broad in scope to afford protection from products with comparable characteristics that may be sold by competitors in the future. There also can be no assurance that the validity of any patents actually granted will not be challenged.
LaserCard® is a federally registered trademark of LaserCard Corporation. We believe that our LaserCard® brand name, trade name and other trademarks are important assets in marketing not only OSM card products but also our broader portfolio of credential offerings, our ID solutions and our professional services.
Employees
As of March 31, 2010, LaserCard employed 203 full-time, part-time, and agency personnel (including four executive officers). Our 123-person U.S. workforce consisted of 113 personnel in administration, marketing/sales, manufacturing, and research and development, plus 10 temporary personnel mainly engaged in card manufacturing. Our workforce in Germany consisted of 80 full and part-time personnel as of March 31, 2010. None of our employees are represented by a labor union.
Executive Officers of the Registrant
| Name, Principal Occupation, and Other Directorships |
|
Age
|
|
|
ROBERT T. DEVINCENZI, Director and Executive Officer
|
50
|
||
|
President and CEO (since June 2008). Independent consultant from December 2007 to June 2008. Senior Vice President of Corporate Development of Solectron Inc. (electronics manufacturing) from January 2005 to December 2007. Former President and Chief Executive Officer of Inkra Networks Inc. (Internet Protocol Network Equipment) from January 2004 to January 2005 and Ignis Optics Inc. (fiber-optic transceiver packaging) from January 2003 to January 2004. From 2000 to 2003, Mr. DeVincenzi was Senior Vice President of Ditech Communications, which acquired Atmosphere Networks Inc., where he was Vice President of Global Sales, Service and Field Marketing from 1999 to 2000.
|
|||
|
CHRISTOPHER J. DYBALL, Executive Officer
|
59
|
||
|
Chief Operating Officer since November 2004. Formerly President from November 2004 through September 2005, Co-Chief Executive Officer from August 2003 through November 2004 and Executive Vice President from 1992 through November 2003.
|
|||
|
STEVEN G. LARSON, Executive Officer
|
60
|
||
|
Vice President of Finance, Chief Financial Officer and Treasurer since 1987.
|
|||
|
STEPHEN D. PRICE-FRANCIS, Executive Officer
|
63
|
||
|
Vice President of Marketing since May 2008. Previously Vice President of Business Development from November 2004 to May 2008. Previously Vice President of Business Development from 1999 to November 2004 of LaserCard Systems Corporation, a former subsidiary of LaserCard Corporation.
|
|||
11
Dependence on Government Subcontracts through Sole Contractors
General Dynamics Information Technology (“GDIT”), a government prime contractor, is one of LaserCard’s major customers. GDIT is the government contractor for our LaserCard OSM product sales to the DHS. Under government contracts with GDIT, the DHS purchases U.S. Green Cards. Our government contracts with GDIT for the DOS Laser Visa Border Crossing Cards (“BCCs”), for the Department of Defense (“DOD”) Automated Manifest System cards, and for the Canadian government’s Permanent Resident Cards were discontinued during fiscal year 2010. Discontinued use of OSM cards in the BCC and Canada’s Permanent Resident Card programs caused and will continue to have an adverse impact on our future revenue. Our revenue from U.S. Green Cards increased in the latest fiscal year due to the transition to newly designed cards and is expected to return to normal in future periods. The table below presents percentages of consolidated OSM card revenues by major programs derived from our customer, GDIT, for the fiscal years ended March 31:
|
2010
|
2009
|
2008
|
||||||||||
|
U.S. Green Cards
|
27.0 | % | 13.3 | % | 17.4 | % | ||||||
|
Canada’s Permanent Resident Card Program
|
1.0 | % | 3.7 | % | 7.5 | % | ||||||
|
Automated Manifest Program
|
0.3 | % | 0.7 | % | 0.8 | % | ||||||
|
U.S. Department of State Border Crossing Cards
|
- | 0.4 | % | 2.7 | % | |||||||
Although not anticipated, if GDIT were to discontinue its participation as a contractor, another qualified contractor could be utilized by the government for purchasing our products. However, there can be no assurance that we will successfully develop relationships with any new contractor and the process of doing so could cause program delays and adversely affect our revenue.
Our revenues derived from sales of the Kingdom of Saudi Arabia for their National ID Card program represented approximately 13%, 26% and 23% of total revenue during fiscal years 2010, 2009 and 2008, respectively. Our customer for the first phase was Omar K. Alessayi Communications and Space Services Company Ltd. (“ACSS”) and Gemalto for the second and subsequent phases. The table below presents percentages of consolidated OSM card revenues for the Kingdom of Saudi Arabia National ID Card program for the fiscal years ended March 31:
|
2010
|
2009
|
2008
|
||||||||||
|
Omar K. Alessayi Communications and Space Services Company Ltd. (“ACSS”)
|
2.3 | % | 24.6 | % | 16.9 | % | ||||||
|
Gemalto N.V. (“Gemalto”)
|
11.1 | % | 1.9 | % | 6.3 | % | ||||||
In addition to the Saudi Arabia revenue shown in the table above, Gemalto also purchases cards from us for India’s vehicle registration card programs which accounted for approximately 8% of total revenues for each of the fiscal years 2010, 2009, and 2008.
Although not anticipated, if Gemalto were to discontinue its involvement, we believe that the customer or prime contract would to continue these programs through other qualified contractors.
Our revenues derived from sales of the Angolan National ID Card program through DGM-Sistemas, the prime contractor, represented 18% of total revenue for the fiscal year ended March 31, 2010 and less than 10% for the fiscal year ended March 31, 2009. We had no revenue from this customer during fiscal year 2008. Although not anticipated, if DGM-Sistemas were to discontinue its involvement, we believe that we would be able to continue with this program through other qualified contractors. However, no assurances can be given that a qualified partner could be found and authorized by the Angolan government.
Backlog
Some of our customers generally place orders for a period of several months to a year or more, and others place orders for immediate or fast turn delivery. Variations in order placement from a single customer can materially affect backlog. As a result, the relative size of our backlog has not been a reliable indicator of future revenue trends. Our backlog as of March 31, 2010 was $10.4 million for OSM cards and $3.0 million for Specialty cards and card printers. Our backlog as of March 31, 2009 was $21.4 million for OSM cards and $1.2 million for Specialty cards and card printers. Our backlog as of March 31, 2010 was $0.9 million for Drives, systems and professional services. There was no significant backlog for Drives, systems and professional services as of March 31, 2009.
12
FINANCIAL INFORMATION ABOUT GEOGRAPHIC AREAS
Financial information about geographic areas is described in Note 4 of the “Notes to the Consolidated Financial Statements” in Item 8, “Financial Statements and Supplementary Data.”
13
ITEM 1A. RISK FACTORS
OUR CURRENT AND FUTURE EXPECTED REVENUES ARE DERIVED FROM A SMALL NUMBER OF ULTIMATE CUSTOMERS SO THAT THE LOSS OF OR REDUCTIONS IN PURCHASES BY ANY ONE ULTIMATE CUSTOMER COULD MATERIALLY REDUCE OUR REVENUES AND LEAD TO LOSSES. During the fiscal year 2010 and each of the previous two fiscal years, we derived, on average, 68% of our revenues from seven programs. Due to the lengthy sales cycles, we believe that existing programs, with perhaps the addition of a few other programs, will be the basis for a majority of our revenues in the near-term. The loss of or reductions in purchases by any one of our largest customers due to program cutbacks, competition, or other reasons could materially reduce our revenue base. Annual or quarterly losses have occurred when there are material reductions, gaps or delays in card orders from our largest U.S. or foreign government programs or if such programs were to be reduced in scope, delayed, canceled, or not extended and not replaced by other card orders or other sources of income.
Revenues from the following major programs are shown below accounting for 10% or greater of our total revenues:
|
2010
|
2009
|
2008
|
||||||||||
|
United States Green Cards
|
27 | % | 14 | % | 17 | % | ||||||
|
Angola National ID Card program
|
18 | % |
<10
|
% | - | |||||||
|
Kingdom of Saudi Arabia National ID Card program
|
13 | % | 26 | % | 23 | % | ||||||
|
Other programs (each less than 10%):
|
||||||||||||
|
Foreign Resident ID Card program in Costa Rica
|
||||||||||||
|
Vehicle registration card programs in India
|
||||||||||||
|
Various card programs in Italy
|
||||||||||||
WE INCURRED NET LOSSES DURING THREE OF THE PREVIOUS FIVE YEARS AND WE MAY NOT BE ABLE TO GENERATE SUFFICIENT REVENUE IN THE FUTURE TO OBTAIN PROFITABILITY ON AN ANNUAL BASIS. In the past five years, only fiscal years 2006 and 2010 generated net income. There can be no assurance that we will generate enough revenues in the near term to attain annual profitability. We are relying principally upon our OSM technology to generate future product revenues, earnings and cash flows. If alternative technologies emerge or if we are otherwise unable to compete, we may not be able to sustain profitability.
OUR CONTRACTS WITH OUR LARGEST CUSTOMERS PROVIDE FOR AN INDEFINITE DELIVERY/INDEFINITE QUANTITY OF SUPPLIES OR SERVICES. We typically receive purchase orders where customers have the right to delay or cancel at any time. We have no long-term firm order commitments from any of our largest customers. Therefore delays in orders, contract cancellations or changes in technology decisions could result in decreased revenues and operating losses. Our revenue is predominantly dependent on the receipt of purchase orders on a recurring basis. Since we do not have contracts with firm commitments for deliveries over an extended period of time our revenue and earnings are subject to volatility.
OUR OSM CARD PRODUCT REVENUES WILL NOT GROW IF WE DO NOT MAINTAIN REVENUE FROM EXISTING PROGRAMS AND WIN NEW BUSINESS. There can be no assurance that revenue levels on existing programs will be maintained or that we will receive sizable orders for new programs, nor any assurance that we will be able to win any other new business which is necessary to grow or maintain our business to the level we desire.
SINCE THE SALES CYCLE FOR OUR SECURE ID PRODUCTS IS TYPICALLY LONG AND UNPREDICTABLE, WE HAVE DIFFICULTY PREDICTING WHEN NEW BUSINESS WILL CONTRIBUTE TO REVENUE GROWTH. Because our customers for secure ID credentials are large government entities, obtaining substantial orders usually involves a lengthy sales cycle, requiring marketing and technical time and often times significant expense with no guarantee that substantial orders will result. This long sales cycle results in uncertainties in predicting operating results, particularly on a quarterly basis. In addition, the equipment supply and consulting work we undertake on occasion for the set up of card manufacturing facilities involves substantial time from start to finish, with the potential for obstacles to intervene outside our control, such as delays in the construction and readying of facilities and site by the customer and the potential for our customer to request changed specifications for the facility’s throughput, so there can be substantial lags between when we sign a contract and receive a deposit and when we complete a project and recognize revenue.
14
WE COULD EXPERIENCE EQUIPMENT, RAW MATERIAL, QUALITY CONTROL, OR OTHER PRODUCTION PROBLEMS ESPECIALLY IN PERIODS OF INCREASING VOLUME. There can be no assurance that we will be able to meet our projected card manufacturing capacity if and when customer orders grow significantly. We have made and may continue to make significant capital expenditures to expand our card manufacturing capacity depending upon projected volume. However, since customer demand is difficult to predict, and we generally wait for such demand to materialize prior to making capital expenditure commitments, we may be unable to ramp up our production quickly enough to fill new customer orders in a timely fashion. This could cause us to lose new business and possibly existing business. In addition, if we overestimate customer demand, we could incur significant costs from creating excess capacity, such as was the case during fiscal years 2007 and 2008. The addition of fixed overhead costs increases our breakeven point and results in lower gross margins unless compensated for by increased product sales. When purchasing raw materials for our anticipated card demand, we take into consideration the order-to-delivery lead times of vendors and the economic purchase order quantity for such raw materials. If we over-estimate customer demand, excess raw material inventory and inventory write-offs can result. We may experience manufacturing complications associated with increasing our manufacturing capacity. We may also experience difficulties implementing new manufacturing processes, meeting customers’ quality or international standards requirements, or outsourcing some of our manufacturing.
WE ARE OUR OWN SOLE SOURCE OF OSM CARDS AND SEVERAL OF THE STEPS IN OUR CARD MANUFACTURING PROCESS HAVE NO BUILT-IN REDUNDANCY. THEREFORE, WE ARE SUSCEPTIBLE TO SUPPLY INTERRUPTIONS, INCLUDING IF CERTAIN MACHINERY WERE TO BREAK DOWN. MUCH OF OUR MANUFACTURING EQUIPMENT IS COMPRISED OF CUSTOM VERSIONS OF MACHINERY, SOME OF WHICH IS MORE THAN 20 YEARS OLD. IN ADDITION, WE ARE AT RISK OF LOSING OR NOT OBTAINING CERTAIN PROGRAMS SHOULD THEY REQUIRE A SECOND SOURCE. We use a proprietary manufacturing process with custom machinery and several of the steps in our card manufacturing process have no built-in redundancy, or in some cases, have only the redundancy located in Germany. We are susceptible to supply interruptions when our line goes down and when our line malfunctions. Much of our machinery is comprised of customized versions of machinery that has long lead times to replace and may be difficult to maintain or repair, requiring us to be self-reliant. Some of the machinery we use is more than 20 years old and is no longer produced by its manufacturer, which would require us to adapt a newer version to our needs if this machinery broke down and could not be repaired, which would involve additional delay, effort and expense. If current or potential customers require a second source for their card programs (which is a common business practice) they could decide to use one of our competitors that may have multiple sources of supply. This would harm our business and financial results.
IF WE ARE UNABLE TO BUY RAW MATERIALS IN SUFFICIENT QUANTITIES AND ON A TIMELY BASIS, WE WILL NOT BE ABLE TO DELIVER PRODUCTS TO CUSTOMERS ON TIME, WHICH COULD CAUSE US TO LOSE CUSTOMERS RESULTING IN A DECLINE IN REVENUES. Most of the raw materials used in the manufacture of cards are available from one or more qualified suppliers. Such materials include plastic film used in card production, which are available from multiple suppliers. Processing chemicals, inks and bonding adhesives are also obtained from various suppliers. We often order significant quantities of raw materials to prepare for expected demand. If the demand does not materialize as expected, raw material inventory supplies will grow as it takes longer to consume in production sized for actual sales volume. It is possible that this could lead to high levels of obsolescence and inventory write-downs if product designs change or demand decreases. Also, certain photographic films used in OSM cards are commercially available solely from Eastman Kodak Company (“Kodak”) of the United States. No assurance can be given that Kodak will continue to supply such photographic film on a satisfactory basis and in sufficient quantities to meet our requirements. If Kodak were to discontinue manufacturing the film from which our OSM is made, we would endeavor to establish an alternate supplier for such film, although the purchase price could increase and reliability and quality could decrease with a new supplier. No assurance can be given that we will have adequate demand to attract a second source. In addition, an alternate supplier could encounter technical issues in producing the film, as there may be know-how and manufacturing expertise which Kodak has developed over the years which an alternate supplier may have difficulty replicating. If Kodak announced that it would no longer offer film, we would request that Kodak provide us with a last-buy opportunity which we would plan to take maximum advantage of, although no assurance can be given that Kodak would provide us with such an opportunity. There can be no assurance that we would be able to procure an alternate source of supply of this film on reasonable terms or at all, which could force us to design new cards using different materials. This could be very disruptive to our business, result in increased costs and lower quality products, and cause us to lose sales. We are also researching other materials besides film for use as OSM. Even if developed or procured, there can be no assurance that other materials could be used as a replacement for Kodak film in our current product or be cost-effective. In addition, semiconductor modules available from multiple sources could become scarce in periods of high industry demand. All raw materials and components are subject to supply and demand limitations.
15
THE VOLATILITY IN THE COST OF PETROLEUM CAN NEGATIVELY IMPACT OUR OPERATING INCOME AND GROSS MARGIN IF THIS RESULTS IN INCREASES IN THE COST OF OUR PRODUCTION MATERIALS SUCH AS THE POLYCARBONATE-BASED PRODUCTS. The polycarbonate raw material used for our cards is petroleum based. The volatility in the cost of petroleum could impact our costs for such raw material and also lead to higher energy bills for running our manufacturing facilities. Long-term increases in petroleum prices could lead to a decline in our gross margins and income unless we are able to adjust our selling prices.
AN INTERRUPTION IN THE SUPPLY OF READ/WRITE DRIVE PARTS OR DIFFICULTIES ENCOUNTERED IN READ/WRITE DRIVE ASSEMBLY COULD CAUSE A DELAY IN DELIVERIES OF DRIVES AND OSM CARDS AND A POSSIBLE LOSS OF SALES, WHICH WOULD ADVERSELY AFFECT OUR OPERATING RESULTS. Several major components of our read/write drive are designed specifically for our products. For example, the optical recording head for the current drive is a part obtained from one supplier and at current production volumes; it is not economical to have more than one supplier for this custom component. While we carry a large inventory of safety stock for this item, any delays in or inability to obtain parts from this supplier could cause us to lose revenues while we source a second supplier. The ability to produce read/write drives in high-volume, if required, will be dependent upon maintaining or developing sources of supply for components that meet our requirements for high volume, quality, and cost. In addition, we could encounter quality control or other production problems at high-volume production of read/write drives. Any of this could cause us to lose OSM card sales as well as sales of our drives.
IF WE ARE UNABLE TO ADAPT TO TECHNOLOGICAL CHANGES IN THE SECURE ID CARD INDUSTRY AND IN THE INFORMATION TECHNOLOGY INDUSTRY GENERALLY, WE MAY NOT BE ABLE TO EFFECTIVELY COMPETE FOR FUTURE BUSINESS. The secure ID technology industry is characterized by rapidly changing technology and continuing product evolution. The future success and growth of our business will require us to maintain and enhance the technological capabilities of the LaserCard product line. There can be no assurance that our products currently being sold or under development will remain competitive or provide sustained revenue growth.
SEVERAL OF OUR PROGRAMS INVOLVE OUR CARDS AS PART OF A SOLUTION WHICH INCLUDES TECHNOLOGIES OF THIRD PARTIES. DIFFICULTIES ENCOUNTERED BY THESE THIRD PARTIES COULD CAUSE OUR ULTIMATE CUSTOMERS, GENERALLY GOVERNMENTS, TO FIND FAULT IN OSM CARDS AND SWITCH TO OTHER SOLUTIONS EVEN IF OUR OSM TECHNOLOGY IS NOT THE ROOT CAUSE OF ANY FAULT. In certain of our current programs various third-party technologies such as contact or contactless chips are added to our cards. The embedding or addition of other technologies to the LaserCard OSM card, especially when contracted to independent third parties, could potentially lead to technical, compatibility and other issues. In such circumstances, it may be difficult to determine whether a fault originated with our technology or that of a co-supplier or with the person embedding or adding the third party technology to our cards. If such faults occur, they could be difficult, expensive, and time-consuming to resolve. Such difficulties could lead to our ultimate customers, the foreign governments, switching to other technologies even if OSM technology is not the root cause of the fault(s). The resulting loss of customers would adversely affect our revenues.
WE ARE LARGELY DEPENDENT ON SYSTEMS INTEGRATORS FOR IMPLEMENTATION OF CARD PROGRAMS AND THEIR METHOD OF IMPLEMENTATION MAY NOT BE SUCCESSFUL DUE TO QUALITY OR COST. We mainly sell to VARs and system integrators who in turn sell solutions to the end customer. The system integrators may not follow the recommendations we provide for the handling, processing, and printing of our cards or for working with the end-user in the card issuing process. This could lead to low quality, high costs, or both, resulting in damage to our reputation, the LaserCard name and loss of the contract. In order to mitigate this risk, we work to train the integrators to avoid such situations but cannot control their work and may not always be successful in our training. We plan to continue to offer this support and then transition the card issuing process to local resources once the program is running successfully. There can be no assurance that issues with our systems integrators in the future will not damage our reputation, the LaserCard name, reduce our revenues, or cause us to lose various governmental programs.
16
OUR OSM CARDS HAVE A COMPLEX STRUCTURE THAT REQUIRES A HIGH DEGREE OF TECHNICAL KNOWLEDGE AND EXPERIENCE TO MEET INCREASINGLY STRINGENT PERFORMANCE REQUIREMENTS. WE HAVE IN THE PAST AND COULD IN THE FUTURE AGREE TO CERTAIN CHARACTERISTICS BEYOND THOSE REQUIRED IN INDEPENDENTLY PUBLISHED STANDARDS. THIS COULD INCREASE OUR COST OF MANUFACTURING CARDS OR RESULT IN ACCEPTING RETURNS OR GIVING CREDITS TO THE CUSTOMER IF WE FAIL TO COMPLY WITH THESE CHARACTERISTICS. MANY CUSTOMERS MAINTAIN SIGNIFICANT ADVANCE INVENTORY WHICH INCREASES THIS RISK. There can be no assurance that we will be able to meet customers’ quality or standards requirements consistently. This could lead to high manufacturing costs due to low product yields or unexpected product returns. We employ a rigorous quality control procedure, are ISO 9001:2000 certified, and strive to deliver products that meet published standards and customer expectations. Even so, we cannot give assurance that our products will meet customer expectations in all cases. We have in the past, and we may in the future, replace products held by customers or give credit for products previously delivered. Any failure to meet our customers’ standards may harm our reputation, result in product returns and inventory write downs, and may cause us to lose sales and customers.
IF WE FAIL TO PROTECT OUR INTELLECTUAL PROPERTY RIGHTS, COMPETITORS MAY BE ABLE TO USE OUR TECHNOLOGIES, WHICH COULD WEAKEN OUR COMPETITIVE POSITION, REDUCE REVENUES, OR INCREASE COSTS. We use a combination of patent, trademark, and trade secret laws, confidentiality procedures, and licensing arrangements to establish and protect our proprietary rights. Our existing and future patents may not be sufficiently broad to protect our proprietary technologies. Despite our efforts to protect proprietary rights, we cannot be certain that the steps we have taken will prevent the misappropriation or unauthorized use of our technologies, particularly in foreign countries where the laws may not protect proprietary rights as fully as U.S. law. Any patents we may obtain may not be adequate to protect our proprietary rights. Our competitors may independently develop similar technology, duplicate our products, or design around any of our issued patents or other intellectual property rights. Litigation may be necessary to enforce our intellectual property rights or to determine the validity or scope of the proprietary rights of others. This litigation could result in substantial costs and diversion of resources and may not ultimately be successful. Litigation, or the threat of litigation, may also cause us to have to license third-party technology, which would increase our costs and harm our margins, or to discontinue the sale of certain products. We cannot predict whether the expiration or invalidation of our patents would result in the introduction of competitive products that would affect our future revenues adversely.
THE MARKETS FOR OUR PRODUCTS ARE COMPETITIVE, AND IF WE ARE UNABLE TO COMPETE SUCCESSFULLY, REVENUES COULD DECLINE OR FAIL TO GROW. Our OSM cards may compete with OSM cards that can be manufactured and sold by three of our licensees (although none is currently doing so) and with other types of portable data storage technologies applied to ID cards. These may include RF enabled chip and RFID tags. Financial, personnel and marketing resources of some of the competing companies are significantly greater than our resources. Competitive product factors include system/card portability, interoperability, price-performance ratio of cards and associated equipment, durability, environmental tolerance, and card security. Although we believe our cards offer key technological and security advantages for certain applications, the current price of read/write drives could be a competitive disadvantage in some of our targeted markets. Nevertheless, we believe the cost of ownership of an optical card system is competitive in applications requiring large populations of cards because of the relatively high overall cost to implement a system based on our major competition, IC cards.
THE PRICE OF OUR COMMON STOCK IS SUBJECT TO SIGNIFICANT VOLATILITY. The price of our common stock is subject to significant volatility, which may be due to fluctuations in revenues, earnings, liquidity, press coverage, analyst recommendations, financial market interest, trading volume, and stock market conditions, as well as changes in technology and customer demand and preferences. As a result, our stock price might be low at the time a stockholder wants to sell the stock. For example, during fiscal year 2010 our stock price fluctuated from a high of $9.84 per share to a low of $2.48 per share. Also, since we have a relatively low number of shares outstanding (approximately 12 million shares) there will be more volatility in our stock if one or two major holders, for example, large institutional holders, attempt to sell a large number of shares in the open market. Furthermore, our trading volume is often small, meaning that a few trades may have disproportionate influence on our stock price. In addition, someone seeking to liquidate a sizeable position in our stock may have difficulty doing so except over an extended period or privately at a discount. Thus, if one or more stockholders were to sell or attempt to sell a large number of its shares within a short period of time, such sale or attempt could cause our stock price to decline. There can be no guarantee that stockholders will be able to sell the shares that they acquired at a price per share equal to or greater than the price they paid for the stock.
17
WE ARE SUBJECT TO RISKS ASSOCIATED WITH CHANGES IN FOREIGN CURRENCY EXCHANGE RATES. Part of the manufacturing process of certain of our products takes place in our operations in Germany. Also, some of the raw materials we use to manufacture OSM cards are sourced in Europe. These costs are denominated in Euros, the currency used in much of Europe. However, when we sell our finished products, the prices that we charge are denominated in U.S. dollars. Accordingly, we are subject to exposure when the exchange rate for Euros increases in relation to the U.S. dollar. When the U.S. dollar weakens against other currencies in which we transact business, particularly against Euro, generally sales and net income will be positively impacted. Conversely, when the U.S. dollar strengthens against other currencies in which we transact business, particularly against Euro, generally sales and net income will be negatively impacted. As of March 31, 2010, we had not entered into a forward exchange contract or other hedging transaction to hedge against or potentially minimize the foreign currency exchange risk related to transactions other than those related to intercompany transactions. The losses on foreign currency exchange related to purchase and intercompany transactions for these periods were immaterial, but we have no assurance that such losses will not be significant in the future.
WE HAVE INVESTED A SIGNIFICANT PORTION OF OUR CASH IN AUCTION RATE SECURITIES (“ARSs”), WHICH BECAME ILLIQUID IN FEBRUARY 2008. WE COULD RECORD FURTHER IMPAIRMENT CHARGES IF THE FAIR VALUE OF THESE INVESTMENTS DECLINES FURTHER. As of March 31, 2010, we held $11.9 million par value of marketable securities consisting of ARSs that we classified as current investments in our consolidated balance sheets. Previously, UBS offered and we accepted a “Rights” offering whereby UBS offered to purchase certain ARSs it placed, including those we hold, at par or face value. Also included in our short-term investment is the Put Option received in this rights offering from UBS recognized as a benefit with a fair value of approximately $0.8 million. There is no assurance that the fair value will continue to equal the PAR value in the future. UBS has the “Right” to purchase its ARSs at par at any time through July 3, 2012 and we have the “Right” to sell our ARSs at par to UBS at any time from June 30, 2010 through July 3, 2012. We intend to exercise our Put Option and sell our ARSs to UBS on June 30, 2010. As of March 31, 2010, we had borrowed $7.9 million from UBS under a credit line collateralized by the ARSs. We recognized a net loss of $0.3 million related to the fair values of the ARSs and the Put Option during the fiscal year ended March 31, 2009 and a gain of a like amount during our fiscal year ended March 31, 2010.
FUTURE TRANSACTIONS TO WHICH WE MAY BECOME A PARTY, INCLUDING STOCK ISSUANCES AND CERTAIN SHAREHOLDER STOCK TRANSACTIONS, MAY JEOPARDIZE OUR ABILITY TO USE SOME OR ALL OF OUR NOLS. Based on current tax law, we believe we had NOLs sufficient for U.S. federal and state income tax purposes to offset future taxable income in the amount of $10.9 million as of March 31, 2010. Our ability to utilize these NOLs may be subject to significant limitations under Section 382 of the Internal Revenue Code if we undergo an ownership change. An ownership change occurs for purposes of Section 382 of the Internal Revenue Code if, among other things, stockholders who own or have owned, directly or indirectly, 5% or more of our common stock (with certain groups of less-than-5% stockholders treated as a single stockholder for this purpose) increase their aggregate percentage ownership of our common stock by more than fifty percentage points above the lowest percentage of the stock owned by these stockholders at any time during the relevant three-year testing period. In the event of an ownership change, Section 382 imposes an annual limitation, based upon the value of the company at the time of the ownership change, on the amount of taxable income a corporation may offset with NOLs. Any unused annual limitation may be carried over to later years until the applicable expiration date for the respective NOLs. To the extent that these NOLs become significantly limited, we expect to be taxed on our income, if any, at the U.S. federal and state statutory rates. As a result, any inability to utilize these NOLs would adversely affect on our financial condition. In addition, the inability to use NOLs could harm the value at which we might be acquired by a third-party and would adversely affect our financial condition relative to our financial condition had the NOLs been available. In addition, California and certain states have suspended the use of NOLs, and other states are considering similar measures. As a result, we may incur higher state income tax expense in the future.
18
IN MARCH 2004, WE SOLD A CARD MANUFACTURING LICENSE UNDER WHICH WE WOULD PROVIDE CERTAIN FACTORY SET-UP AND TRAINING SERVICES IN SLOVENIA TO GLOBAL INVESTMENT GROUP LTD. (“GIG”) IN CONJUNCTION WITH PREVENT GLOBAL OF SLOVENIA (“PREVENT GLOBAL”). NEITHER GIG NOR PREVENT GLOBAL ARE CURRENT WITH THE OBLIGATIONS UNDER THE AGREEMENT. There have been certain agreements made between us and GIG in conjunction with Prevent Global regarding this contract. If certain payments are made, we would be obligated to deliver manufacturing equipment and installation support specified in the contract to GIG/Prevent Global for a card manufacturing facility in Slovenia when such facility is provided by the counterparty, to provide a targeted initial manufacturing capacity of 10 million optical cards annually. Our obligation arises under a March 2004 agreement with GIG which was assumed by Prevent Global in 2007. We have performed our obligations under the agreements and stand ready to complete the remaining obligations. However, payments due to us are in arrears and GIG has claimed that it still has rights to the agreement. We have filed a claim in the United Kingdom, the court of jurisdiction, for the determination of who between GIG and Prevent Global is the rightful counterparty to the agreements. Upon this determination, we intend to exercise our rights under the contract. It is possible that we, Prevent Global or GIG will initiate other litigation to enforce rights under the agreements. Any such litigation may be expensive to us and distracting to our management even if we ultimately prevail. In the opinion of our management, based on the review of information available at this time, the total cost of resolving this contingency at March 31, 2010 should not have a material adverse effect on our financial condition or results of operation. As appropriate, we will establish accruals for potential expenses or losses that we believe are probable and reasonably estimable if and when this occurs.
WE MAY NOT BE ABLE TO ATTRACT, RETAIN OR INTEGRATE KEY PERSONNEL, WHICH MAY PREVENT US FROM SUCCEEDING. We may not be able to retain our key personnel or attract other qualified personnel in the future. Our success will depend upon the continued service of key management personnel. The loss of services of any of the key members of our management team, including our chief executive officer, chief operating officer, vice president of finance and chief financial officer, the managing directors of our German operations, or our vice president of marketing, or our failure to attract and retain other key personnel could disrupt operations and have a negative effect on employee productivity and morale, thus decreasing production and harming our financial results. In addition, the competition to attract, retain and motivate qualified personnel is intense.
OUR CALIFORNIA FACILITIES ARE LOCATED IN AN EARTHQUAKE ZONE AND THESE OPERATIONS COULD BE INTERRUPTED IN THE EVENT OF AN EARTHQUAKE, FIRE, OR OTHER DISASTER. Our card manufacturing, corporate headquarters, and drive assembly operations, administrative, and product development activities are located near major earthquake fault lines. In the event of a major earthquake, we could experience business interruptions, destruction of facilities and/or loss of life, all of which could materially adversely affect us. Likewise, fires, floods, or other events could similarly disrupt our operations and interrupt our business.
FOREIGN GOVERNMENT REGULATIONS COULD ADVERSELY AFFECT RESULTS OF OPERATIONS. We sell our products worldwide and, therefore, our products must comply with various domestic and international laws, regulations and standards and our business could be subject to risks due to changes in a country’s or region’s political, regulatory or economic conditions. We may experience difficulty in securing required approvals, licenses or permits on commercially reasonable terms, or at all. Differing tax laws and changes in those laws may also affect our future results of operations. The implementation of unfavorable regulations or industry standards, or unfavorable interpretations of existing regulations by courts or regulatory bodies, could require us to incur significant compliance costs, cause the development of the affected products to become impractical or otherwise adversely affect our ability to produce or market our products. Failure to comply with existing or new laws or regulations, including export and import restrictions and barriers, or to obtain timely domestic or foreign regulatory approvals, licenses or permits could result in lost sales or increased costs.
DISRUPTIONS TO OUR BUSINESS OR THE BUSINESS OF OUR CUSTOMERS OR SUPPLIERS COULD ADVERSELY IMPACT OUR OPERATIONS AND FINANCIAL RESULTS. Business disruptions, including from severe weather events (such as hurricanes, floods and blizzards), from casualty events (such as explosions, fires or material equipment breakdown), from the occurrence of a pandemic (such as the Swine Flu), from acts of terrorism or acts of war, and from other similar events, as well as any lack of government readiness and support in those countries where we do business, may cause damage or disruption to our properties, business, employees, suppliers, distributors, resellers, and customers, which could have an adverse effect on our business, financial condition, and operating results. Such events may also result in an economic slowdown in the United States or elsewhere, which could adversely affect our business, financial condition, and operating results.
19
AS A RESULT OF OUR REQUIRED ANNUAL EVALUATION OF OUR INTERNAL CONTROLS OVER FINANCIAL REPORTING, WE MAY IDENTIFY INTERNAL CONTROL WEAKNESSES NEEDING REMEDIATION, WHICH COULD HARM OUR REPUTATION. We have completed the evaluation of our internal controls over financial reporting as required by Section 404 of the Sarbanes-Oxley Act of 2002 for the fiscal years ended March 31, 2010 and 2009. Although our assessment, testing and evaluation resulted in our conclusion that as of March 31, 2010 and 2009, our internal controls over financial reporting were effective, we cannot predict the outcome of our testing in future periods. Because of the inherent limitation of disclosure controls, no evaluation of such controls can provide absolute assurance that all control issues and instances of fraud, if any, within LaserCard have been detected. If our internal controls are found to be ineffective in future periods, our reputation could be harmed. We may incur additional expenses and commitment of management’s time in connection with further evaluations, both of which could materially increase our operating expenses and accordingly reduce our net income.
IF WE ENGAGE IN ACQUISITIONS, WE WOULD INCUR A VARIETY OF COSTS AND THE ANTICIPATED BENEFITS MIGHT NEVER BE REALIZED. In recent times, we have not made any acquisitions other than Challenge Card Design and Cards & More in March 2004 and there can be no assurance that we will be able to successfully integrate any business, products, technologies or personnel that we might acquire in the future. Future acquisitions may result in substantial dilution of our current stockholders’ percentage ownership; expenditure of our current limited cash resources; incurrence of debt, amortization of expenses related to goodwill, research and development and other intangible assets or large and immediate write-offs; and assumption of liabilities. Our operation of any acquired business will also involve numerous risks, including assimilating employees, operations, technologies and products; unanticipated costs; diverting our management’s time and attention from the day-to-day operation of our business; entering markets in which we have no or limited direct experience; potentially losing key employees from the acquired company; and adversely effecting our existing business relationships. If we fail to adequately manage these risks, we may not achieve the intended benefit of any acquisition.
WE MAY FACE RISKS FROM OUR FOREIGN OPERATIONS AND SUBSTANTIAL INTERNATIONAL SALES. Our LaserCard products are used in countries around the world in addition to the United States, such as Germany, United Kingdom, Switzerland, Angola, Italy, India, Costa Rica and the Kingdom of Saudi Arabia. International sales accounted for approximately 72% of our revenues for the year ended March 31, 2010, 84% for the year ended March 31, 2009 and 78% for the year ended March 31, 2008. We also operate a German subsidiary. Our international operations are subject to the following risks, among others: difficulty with staffing and managing international operations; transportation and supply chain disruptions and increased transportation expense as a result of epidemics, terrorist activity, acts of war or hostility, increased security and less developed infrastructure; political and economic uncertainty caused by changes in governments, epidemics, terrorism or acts of war or hostility; difficulties in collecting receivables and longer accounts receivable payment cycles; and potentially adverse tax consequences.
20
ITEM 1B. UNRESOLVED STAFF COMMENTS
Not applicable.
ITEM 2. PROPERTIES
As of March 31, 2010, approximately 70,000 square feet of floor space are leased by us on a long-term basis for card manufacturing, read/write drive production, administration, sales, and research and development, in two buildings located in Mountain View, California. One 27,000-square foot building is used for OSM card production and research and development; and one 43,000 square-foot building is used for OSM card production, read/write drive production, administration, sales, and research and development. These leases will expire in October 2013 and in March 2014 and include ten-year extension options. We also lease a 900 square-foot office in Huntington, New York for marketing activities, which lease will expire in December 2010. We lease a portion of a building in Ratingen, Germany, and a building in Rastede, Germany, totaling approximately 15,000 square feet, for optical and specialty card manufacturing, distribution, administration and sales. These leases will expire upon six-month’s notice and in March 2012, respectively. Also, we own land and an approximately 14,000 square foot building in Rastede, Germany that is used in production of specialty cards and research and development. We believe these leased and owned facilities to be satisfactory for our present operations. Upon expiration of the leases, we believe that these or other suitable buildings will be available to be leased on a reasonable basis.
ITEM 3. LEGAL PROCEEDINGS
From time to time we are a party to litigation matters and pending or threatened claims and assessments that are normal in the course of our operations. While we believe that the ultimate outcome of these matters will not have a material adverse effect on our consolidated financial position, consolidated results of operations or consolidated cash flows, the outcome of these matters is not determinable and negative outcomes may adversely affect our consolidated financial position, liquidity, or consolidated results of operations.
On October 9, 2009, we filed a claim against GIG and Prevent Global in the English High Court of Justice, Commercial Court. The claim relates to a series of agreements that we entered into in 2004 with GIG for a turn-key project in Slovenia to enable GIG to manufacture and distribute optical cards (the “Agreements”). In 2007, GIG assigned all of its rights, title and interest in the Agreements (including rights to equipment we hold) to Prevent Global and Prevent Global agreed to assume all of the obligations under the Agreements. However, a dispute has arisen regarding whether Prevent Global or GIG (i) is obliged to make payments owed to us under the Agreements; (ii) has title to certain equipment under the Agreements; and (iii) is subject to and bound by the arbitration provisions contained in the Agreements. We therefore are seeking a declaration from the English Court on these questions. We expect the court to provide its ruling in August 2010.
On May 7, 2010, Orbit Company Ltd., a Saudi Arabia company, filed a complaint against us in Superior Court of California, Santa Clara County. The complaint alleges breach of contract for services rendered and unjust enrichment. Orbit alleges that we improperly terminated one contract with Orbit and committed unspecified breaches of two additional contracts with Orbit. Orbit further alleges that we requested Orbit perform certain services, that Orbit performed those services, and that we have not compensated Orbit for its performance. Orbit claims damages of an unspecified amount but at least $3,000,000, plus attorneys’ fees and costs. We are currently analyzing the complaint and Orbit’s allegations and will respond in due course.
ITEM 4. REMOVED AND RESERVED
21
|
ITEM 5.
|
MARKET FOR REGISTRANT’S COMMON EQUITY, RELATED STOCKHOLDER MATTERS AND ISSUER PURCHASES OF EQUITY SECURITIES
|
Our only class of common stock, $0.01 par value, is traded on The Nasdaq Global Market under the symbol LCRD. The table below sets forth the high and low sale prices for our common stock (rounded to two decimal points) as reported by Nasdaq during the fiscal periods indicated.
QUARTERLY STOCK PRICES
|
Fiscal Year 2010
|
Fiscal Year 2009
|
|||||||||||||||
|
High Price
|
Low Price
|
High Price
|
Low Price
|
|||||||||||||
|
First Quarter
|
$ | 4.36 | $ | 2.48 | $ | 9.73 | $ | 4.55 | ||||||||
|
Second Quarter
|
9.67 | 3.15 | 6.19 | 3.55 | ||||||||||||
|
Third Quarter
|
9.84 | 4.86 | 6.10 | 2.54 | ||||||||||||
|
Fourth Quarter
|
6.86 | 5.16 | 4.40 | 2.05 | ||||||||||||
As of March 31, 2010, there were approximately 643 holders of record of our common stock as compared to 677 holders as of March 31, 2009. The total number of stockholders is believed by us to be several thousand higher since many holders’ shares are listed under their brokerage firms’ names.
We have never paid cash dividends on our common stock. We anticipate that for the foreseeable future we will retain any earnings for use and reinvestment in our business.
We did not repurchase any of our outstanding shares or other securities during fiscal years ended March 31, 2010 and 2009.
For information regarding securities authorized for issuance under equity compensation plans, see Part III, Item 12 below.
22
Stock Performance Graph
In the following stock performance graph, the cumulative total return on investment for our common stock over the past five fiscal years is compared with the Russell 2000 Stock Index (“Russell 2000”) and the University of Chicago Center for Research in Security Prices (“CRSP”) Total Return Index for the Nasdaq Stock Market Electronic Components industry group (“Nasdaq Electronic Components”). The Russell 2000 is a benchmark index for small capitalization stocks. The Nasdaq Electronic Components index is used because the majority of our revenues currently are derived from the sale of OSM cards. The chart assumes that the value of the investment in our stock and each index was $100 on March 31, 2005, and that any dividends were reinvested.
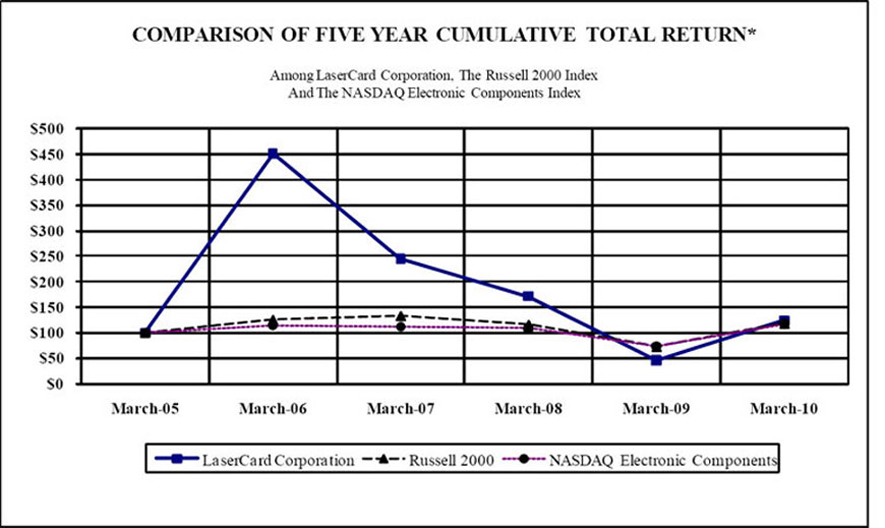
*$100 invested on 3/31/05 in stock or index-including reinvestment of dividend.
Fiscal year ending March 31.
The stock performance graph was plotted using the following data:
|
Fiscal Years Ended March 31,
|
||||||||||||||||||||||||
|
2005
|
2006
|
2007
|
2008
|
2009
|
2010
|
|||||||||||||||||||
|
LaserCard Corp.
|
$ | 100.00 | $ | 450.90 | $ | 244.78 | $ | 171.39 | $ | 45.88 | $ | 123.69 | ||||||||||||
|
Russell 2000
|
100.00 | 125.85 | 133.28 | 115.95 | 72.47 | 117.95 | ||||||||||||||||||
|
NASDAQ Electronic Components
|
100.00 | 113.61 | 111.27 | 108.45 | 73.53 | 116.98 | ||||||||||||||||||
23
The following selected consolidated financial information as of and for each of the five fiscal years in the period ended March 31, 2010 is derived from our consolidated financial statements. This financial data should be read in conjunction with the consolidated financial statements and “Management’s Discussion and Analysis of Financial Condition and Results of Operations” appearing in Item 7 of this report.
|
LASERCARD CORPORATION AND SUBSIDIARIES
|
|||||||||
|
FIVE-YEAR SUMMARY OF CONSOLIDATED FINANCIAL INFORMATION
|
|||||||||
|
Fiscal Years Ended March 31, 2006 - 2010
|
|||||||||
|
(In thousands, except per share amounts)
|
|
STATEMENT OF OPERATION DATA
|
2010
|
2009
|
2008
|
2007
|
2006
|
|||||||||||||||
|
Revenue
|
$ | 58,611 | $ | 49,771 | $ | 37,008 | $ | 32,270 | $ | 39,857 | ||||||||||
|
Cost of sales
|
34,603 | 32,600 | 27,009 | 25,406 | 24,804 | |||||||||||||||
|
Gross profit
|
24,008 | 17,171 | 9,999 | 6,864 | 15,053 | |||||||||||||||
|
Selling, general, and administrative expenses
|
16,306 | 15,424 | 15,253 | 13,575 | 11,949 | |||||||||||||||
|
Research and development expenses
|
1,172 | 2,366 | 2,878 | 3,095 | 2,338 | |||||||||||||||
|
Impairment of goodwill and intangible assets
|
— | — | — | 3,811 | — | |||||||||||||||
|
Interest and other income, net
|
726 | (235 | ) | 812 | 895 | 471 | ||||||||||||||
|
Income (loss) before income taxes
|
7,256 | (854 | ) | (7,320 | ) | (12,722 | ) | 1,237 | ||||||||||||
|
Income tax (benefit) provision
|
1,264 | 86 | (114 | ) | (351 | ) | 443 | |||||||||||||
|
Net income (loss)
|
$ | 5,992 | $ | (940 | ) | $ | (7,206 | ) | $ | (12,371 | ) | $ | 794 | |||||||
|
Net income (loss) per share:
|
||||||||||||||||||||
|
Basic
|
$ | 0.49 | $ | (0.08 | ) | $ | (0.60 | ) | $ | (1.05 | ) | $ | 0.07 | |||||||
|
Diluted
|
$ | 0.49 | $ | (0.08 | ) | $ | (0.60 | ) | $ | (1.05 | ) | $ | 0.07 | |||||||
|
Weighted average number of common
|
||||||||||||||||||||
|
and common equivalent shares:
|
||||||||||||||||||||
|
Basic
|
12,189 | 12,052 | 11,929 | 11,814 | 11,415 | |||||||||||||||
|
Diluted
|
12,226 | 12,052 | 11,929 | 11,814 | 11,587 | |||||||||||||||
|
BALANCE SHEET DATA
|
||||||||||||||||||||
|
Current assets
|
$ | 62,063 | $ | 41,814 | $ | 23,625 | $ | 37,304 | $ | 39,574 | ||||||||||
|
Current liabilities
|
21,235 | 22,886 | 9,866 | 9,083 | 9,228 | |||||||||||||||
|
Total assets
|
79,291 | 74,290 | 56,306 | 58,100 | 62,335 | |||||||||||||||
|
Long-term liabilities
|
29,150 | 31,556 | 28,714 | 26,418 | 21,090 | |||||||||||||||
|
Stockholders’ equity
|
28,906 | 19,848 | 17,726 | 22,599 | 32,017 | |||||||||||||||
24
This annual report on Form 10-K, including the following management’s discussion and analysis, contains forward-looking information that you should read in conjunction with the consolidated financial statements and notes to consolidated financial statements that we have included elsewhere in this annual report on Form 10-K. For this purpose, any statements contained in this report that are not statements of historical facts may be deemed to be forward-looking statements. Words such as “believes,” “plans,” “anticipates,” “expects,” “will” and similar expressions are intended to identify forward-looking statements. Our actual results may differ materially from the plans, intentions, or expectations we disclose in the forward-looking statements we make. We have included important factors under the heading “Risk Factors” in Item 1A above that we, among other factors, believe could cause actual results to differ materially from the forward-looking statements we make. We are not obligated to publicly update any forward-looking statements, whether as a result of new information, future events or otherwise.
Overview of Fiscal Year 2010
Headquartered in Mountain View, California, LaserCard Corporation, together with its subsidiaries, is a leading provider of secure ID solutions and offers associated professional services to governments and commercial clients around the world, and we also manufacture a wide range of advanced, secure identity credentials. Our subsidiary, CCD, manufactures and offers a wide range of high quality specialty cards, plus card personalization and ID management solutions serving the Europe, the Middle Eastern, and Africa (the “EMEA”) and Asian markets. Our cards and systems are used in countries around the world, such as the United States, Germany, Angola, Italy, India, Costa Rica, the Kingdom of Saudi Arabia and other Middle Eastern and European countries, for demanding applications including government identification programs for citizens and foreign residents, vehicle registration, student campus card and driver license applications, service provisions and facility access.
The majority of our revenue is from sales of products and services through partners such as value added resellers (“VARs”) and system integrators (“SIs”) who generally have specific experience in the development of markets and applications for LaserCard products. We have sales staff located in California, the Washington D.C. area, Uruguay and Germany, whose principal role is developing and supporting our VARs and SIs reseller channel.
We emphasize selling secure credentials into government programs for individual identification. We offer a range of products including cards that contain magnetic stripe, contactless chip, Radio Frequency Identification (“RFID”) tags, contact IC chip, optical security media (“OSM”), holograms, biometric identification, or a combination of such features. This allows us to sell to a wide range of customers around the world.
OSM cards are a proprietary product of LaserCard for which we hold 18 U.S. patents. In addition, we have years of know-how in the manufacture and use of cards, encoding devices, read/write drives, systems, professional services and software. This provides a basis for highly leveraged contribution margins in the OSM cards segment. Therefore, our strategy is to sell all card technologies with a goal to upgrade programs to OSM when possible.
We sell encoders and read/write drives at near direct manufacturing cost to enable sales of OSM cards. This often results in negative gross profits for our Drives, systems and professional services segment when equipment volume does not allow for the contribution necessary to cover fixed costs and we do not have sizable professional services revenue. Even at higher volume, the gross profit margin on encoders and read/write drives will probably not exceed 10%.
We provide professional services as a strategy to promote card sales. Examples include the furnishing of equipment, training and management of a card issuance system for the Kingdom of Saudi Arabia National ID Card program, and a complete data collection, data base, and card issuing system for the Costa Rica Foreign Resident ID Card program.
25
The following table presents our consolidated revenues and gross profit for the fiscal years ended March 31 (in thousands, except for percentages):
|
Change
|
Change
|
|||||||||||||||||||
|
2010
|
2009
|
2008
|
2010 vs 2009
|
2009 vs 2008
|
||||||||||||||||
|
Revenue
|
$ | 58,611 | $ | 49,771 | $ | 37,008 | $ | 8,840 | $ | 12,763 | ||||||||||
|
% change year-over-year
|
18 | % | 34 | % | ||||||||||||||||
|
Gross profit
|
$ | 24,008 | $ | 17,171 | $ | 9,999 | $ | 6,837 | $ | 7,172 | ||||||||||
|
% change year-over-year
|
40 | % | 72 | % | ||||||||||||||||
Revenues for our full fiscal year 2010 of $58.6 million are up 18% compared to fiscal year 2009, driven largely by strong optical security media card shipments into our customer programs in Angola, Kingdom of Saudi Arabia, India, and the United States. We also experienced addition of new card customers of significance in our Specialty cards and card printers segment. We had several smaller contracts secured in Hungary, the Middle East, and Italy. These programs range from secure international professional driver certificates to vehicle registration and government employee ID cards, demonstrating our ability to fulfill a diverse set of government ID requirements beyond our largest ID programs. Our stronger than expected level of shipments of U.S. Green Card for the DHS considering the largely one-time positive effect of transitioning from the first generation OSM-based Green Card to the newly designed multi-technology Green Card favorably impacted our financial results.
Our gross margin for fiscal year 2010 increased by $6.8 million or 40% as compared to fiscal year 2009 due to changes in product mix, increased sales volume, and cost containment initiatives.
Relative to our cost efforts during the year, we continued our multi-tier focus in the following areas:
|
|
o
|
We benefited from the full year effect of cost reduction activities implemented at the end of fiscal year 2009 and maintained this focus on cost control throughout the year.
|
|
|
o
|
We improved manufacturing efficiencies, enabling greater contributions to our operating results on higher volumes and revenues.
|
|
|
|
|
o
|
We broadened our solutions and technology offerings through our embrace of multi-technology credential designs and the expansion of our Optical Security Media feature set.
|
|
|
o
|
We reallocated resources to our sales and marketing functions. We believe these investments together with the broadening of our value proposition have increased our market presence and relevance and have resulted in improved relationships with clients, prospects and partners.
|
Our cash and cash equivalents plus investments less our short-term debt with UBS totaled $37.2 million as of March 31, 2010, compared with $20.6 million on March 31, 2009. Cash provided by operating activities was approximately $16.7 million in fiscal year 2010 and capital asset acquisitions totaled $1.1 million.
We currently expect to invest up to $2.0 million during fiscal year 2011 in additional capital equipment and leasehold improvement expenditures.
Accounting Period
For purposes of presentation, we label our annual accounting period end as March 31 and our quarterly accounting period ends as June 30, September 30 and December 31. In fact, we operate and report based on quarterly periods ending on the Friday closest to month end. Fiscal year 2010 ended on April 2, 2010 and was comprised of 52 weeks. Fiscal year 2009 ended on April 3, 2009 and was comprised of 53 weeks. Fiscal year 2008 ended on March 28, 2008 and was comprised of 52 weeks.
26
CONSOLIDATED RESULTS OF OPERATIONS
Revenues
The table below presents consolidated revenues recorded by our U.S. and German operations for the fiscal years ended March 31 (in thousands):
|
2010
|
2009
|
2008
|
||||||||||
|
U.S. operations
|
$ | 44,617 | $ | 33,978 | $ | 23,778 | ||||||
|
German operations
|
13,994 | 15,793 | 13,230 | |||||||||
| $ | 58,611 | $ | 49,771 | $ | 37,008 | |||||||
Revenues recorded by our U.S. operations are generally derived from a small number of government customers located throughout the world. Revenues recorded by our German operations, converted from Euros, are mainly from a relatively large number of commercial customers in EMEA, including universities in Germany for student identification cards and organizers of sporting events for secure access cards and equipment and consumables for the national ID card program in Angola.
Historically, a relatively small number of customers have accounted for a significant portion of our revenue. Our major customers are shown below as a percentage of total revenues for the fiscal years ended March 31:
|
2010
|
2009
|
2008
|
||||||||||
|
General Dynamics Information Technology (“GDIT”)
|
28 | % | 19 | % | 29 | % | ||||||
|
Gemalto N.V. (“Gemalto”)
|
19 | % | 10 | % | 14 | % | ||||||
|
DGM Sistemas, LDA
|
18 | % |
<10
|
% | - | |||||||
|
Omar K. Alessayi Communications and Space Services Company Ltd. (“ACSS”)
|
<10
|
% | 25 | % | 17 | % | ||||||
ACSS was our customer for the National ID card program in the Kingdom of Saudi Arabia until the quarter ended June 30, 2010. Subsequently, Gemalto became our customer for this program.
Our major government card programs are shown below as a percentage of total revenues for the fiscal years ended March 31:
|
2010
|
2009
|
2008
|
||||||||||
|
United States Green Cards
|
27 | % | 14 | % | 17 | % | ||||||
|
Angola National ID Card program
|
18 | % |
<10
|
% | - | |||||||
|
Kingdom of Saudi Arabia National ID Card program
|
13 | % | 26 | % | 23 | % | ||||||
|
Other programs (each less than 10%):
|
||||||||||||
|
Foreign Resident ID Card program in Costa Rica
|
||||||||||||
|
Vehicle registration card programs in India
|
||||||||||||
|
Various card programs in Italy
|
||||||||||||
Our total revenues consisted of sales in our three segments of (1) OSM cards, (2) Drives, systems and professional services, and (3) Specialty cards and card printers, as well as, at times, other miscellaneous items.
27
The following table presents our consolidated revenues by segment for the fiscal years ended March 31 (in thousands, except for percentages):
|
Change
|
Change
|
|||||||||||||||||||
|
2010
|
2009
|
2008
|
2010 vs 2009
|
2009 vs 2008
|
||||||||||||||||
|
Optical security media cards
|
$ | 43,267 | $ | 30,920 | $ | 22,139 | $ | 12,347 | $ | 8,781 | ||||||||||
|
% of total revenues
|
74 | % | 62 | % | 60 | % | ||||||||||||||
|
Drives, systems, and professional services
|
1,391 | 3,306 | 1,639 | (1,915 | ) | 1,667 | ||||||||||||||
|
% of total revenues
|
2 | % | 7 | % | 4 | % | ||||||||||||||
|
Specialty cards and card printers
|
14,099 | 15,789 | 13,230 | (1,690 | ) | 2,559 | ||||||||||||||
|
% of total revenues
|
24 | % | 32 | % | 36 | % | ||||||||||||||
|
Elimination of intersegment revenue
|
(146 | ) | (244 | ) | — | 98 | (244 | ) | ||||||||||||
|
% of total revenues
|
(0.2 | %) | (1 | %) | — | |||||||||||||||
|
Total revenues
|
$ | 58,611 | $ | 49,771 | $ | 37,008 | $ | 8,840 | $ | 12,763 | ||||||||||
|
% increase year-over-year
|
18 | % | 34 | % | ||||||||||||||||
The following table presents our OSM card revenues by major program for the fiscal years ended March 31 (in thousands):
|
Change
|
Change
|
|||||||||||||||||||
|
2010
|
2009
|
2008
|
2010 vs 2009
|
2009 vs 2008
|
||||||||||||||||
|
U.S. Green Cards & Laser Visas
|
$ | 15,838 | $ | 6,827 | $ | 7,432 | $ | 9,011 | $ | (605 | ) | |||||||||
|
Angolan National ID Cards
|
9,724 | — | — | 9,724 | — | |||||||||||||||
|
National ID Cards in the Kingdom of Saudi Arabia
|
7,346 | 12,429 | 7,650 | (5,083 | ) | 4,779 | ||||||||||||||
|
Vehicle Registration in India
|
5,006 | 4,342 | 3,487 | 664 | 855 | |||||||||||||||
|
Italian government ID Card Programs
|
4,190 | 2,694 | 208 | 1,496 | 2,486 | |||||||||||||||
|
Canadian Permanent Resident Cards
|
567 | 1,836 | 2,792 | (1,269 | ) | (956 | ) | |||||||||||||
|
Foreign Resident ID Card in Costa Rica
|
309 | 2,240 | — | (1,931 | ) | 2,240 | ||||||||||||||
|
All other programs
|
287 | 552 | 570 | (265 | ) | (18 | ) | |||||||||||||
|
Total optical security media card revenues
|
$ | 43,267 | $ | 30,920 | $ | 22,139 | $ | 12,347 | $ | 8,781 | ||||||||||
|
% increase year-over-year
|
40 | % | 40 | % | ||||||||||||||||
OSM card revenues for fiscal year 2010 increased by $12.3 million or 40% as compared to fiscal year 2009 due to increased shipments. We benefited from the largely one-time positive effect of transitioning from the first generation OSM-based U.S. Green Card to the newly designed multi-technology Green Card. We anticipate future Green Card program sales to average about $2.5 to $3.0 million per quarter. The roll-out of Angola’s national ID card program contributed about 22% in this segment’s total revenue. We expect lower quarterly revenue for Angola of between $1.3 million to $2.6 million in the coming quarters. There was a strong demand in the fourth quarter of fiscal year 2010 of our OSM cards for India’s three vehicle registration programs triggered by economic recovery and local tax incentives. We estimate revenues for these programs in India to average about $1.3 million per quarter for the next few quarters.
We do not expect ongoing revenues from the Italian government PSE (Foreign Resident Card) program due to the government decree which displaced optical security media as a security element on the credential. Our revenues from the PSE card program were approximately $3.9 million, $1.9 million, and $1.7 million for the fiscal years ended March 31, 2010, 2009, and 2008, respectively. We will continue to closely monitor and support our position in the Italian CIE Citizen ID Card program and Italian government agency ID programs.
OSM card revenues for fiscal year 2009 increased by $8.8 million or 40% as compared to fiscal year 2008 due to the increased shipments.
Revenue in the Drives, systems and professional services segment for fiscal year 2010 decreased by $1.9 million or 58% as compared to fiscal 2009 when the Costa Rica card issuing infrastructure was installed. Revenues in this segment are sporadic and driven by program implementations or infrastructure set-up and enhancements. We will plan to periodically deploy operational and consultative support to optimize the performance of our customer card issuing models which may enhance our revenue in this segment.
28
Revenues in the Drives, systems and professional services segment for fiscal year 2009 increased by $1.7 million or 102% as compared to fiscal year 2008 due to the implementation of the LaserCard-developed end-to-end credential issuance system in Costa Rica, and the implementation of the regionalized model for the national ID card program in the Kingdom of Saudi Arabia.
Specialty cards and card printers revenues for fiscal year 2010 decreased by $1.7 million or 11% as compared to fiscal year 2009 mainly due to equipment and consumables delivery for a complete ID management system in Angola being more significant during fiscal year 2009 than fiscal year 2010. We secured orders from new customers during fiscal year 2010 which we hope will turn into repeatable orders. We will execute on an order for $2.2 million of card personalization equipment and consumables in the first quarter of fiscal year 2011 to continue to support the infrastructure deployment of that country’s ID card program.
Specialty cards and card printers revenues for fiscal year 2009 increased by $2.6 million or 20% as compared to fiscal year 2008 due to our subsidiary’s focus on accreditation and access control applications for our core customers, including a major sporting event operator and our partners serving the majority of German universities. We also delivered equipment and consumables for a complete ID management system in Angola. The weakening world economy will probably have a negative effect on some portions of the Specialty cards and card printers segment.
Backlog
Some of our customers generally place orders for a period of several months to a year or more, and others place orders for immediate or fast turn delivery. Variations in order placement from a single customer can materially affect backlog. As a result, the relative size of our backlog has not been a reliable indicator of future revenue trends. Our backlog for OSM cards at March 31, 2010 was approximately $10.4 million and $3.0 million for Specialty cards and card printers. Our backlog for OSM cards as of March 31, 2009 was $21.4 million and $1.2 million for Specialty cards and card printers. Our backlog for Drives, systems and professional services as of March 31, 2010 was $0.9 million. There was no significant backlog for Drives, systems and professional services as of March 31, 2009.
Gross Profit
The following table presents our gross profit in absolute dollar amounts and as a percentage of revenue by segment for the fiscal years ended March 31 (in thousands, except for percentages):
|
Change
|
Change
|
|||||||||||||||||||
|
2010
|
2009
|
2008
|
2010 vs 2009
|
2009 vs 2008
|
||||||||||||||||
|
Optical security media cards
|
$ | 21,463 | $ | 13,268 | $ | 7,991 | $ | 8,195 | $ | 5,277 | ||||||||||
|
% of optical security media card revenues
|
50 | % | 43 | % | 35 | % | ||||||||||||||
|
Drives, systems and professional services
|
(1,180 | ) | (301 | ) | (633 | ) | (879 | ) | 332 | |||||||||||
|
% of optical card drive revenues
|
NM
|
NM
|
NM
|
|||||||||||||||||
|
Specialty cards and card printers
|
3,725 | 4,204 | 2,641 | (479 | ) | 1,563 | ||||||||||||||
|
% of specialty cards and card printers revenues
|
26 | % | 27 | % | 20 | % | ||||||||||||||
|
Total gross margin
|
$ | 24,008 | $ | 17,171 | $ | 9,999 | $ | 6,837 | $ | 7,172 | ||||||||||
|
% of total revenue
|
41 | % | 35 | % | 27 | % | ||||||||||||||
|
% change year-over-year
|
40 | % | 72 | % | ||||||||||||||||
OSM Cards. OSM card gross margin can vary significantly based upon changes in average selling price, production and sales volumes, mix of card types, production efficiency and yields, and changes in fixed costs. Production unit volume combined with the mix of card types greatly affects gross margin due to the absorption of fixed manufacturing costs. OSM card gross margin for fiscal year 2010 was 50% of OSM card revenue as compared to 43% of OSM card revenue for fiscal year 2009. The combined favorable impact of the increase in revenue, productivity improvements, and manufacturing cost reduction initiatives attributed to the increased gross margin. Depreciation and amortization was $1.8 million and $1.7 million for fiscal years 2010 and 2009, respectively. The non-cash charge for the reserve of obsolete inventory was $1.9 million and $0.3 million for fiscal years 2010 and 2009, respectively. We also recorded a $0.7 million of accrued bonus and incentive pay for fiscal year 2010 as compared with none in fiscal year 2009.
29
OSM card gross margin for fiscal year 2009 was 43% of OSM card revenue as compared to 35% of OSM card revenue for fiscal year 2008. The combined favorable impact of increased sales volume in several major ID card programs, productivity improvements, and manufacturing cost reduction initiatives attributed to the increased gross margin. Depreciation and amortization was $1.7 million and $1.8 million for fiscal years 2009 and 2008, respectively.
Drives, Systems and Professional Services. Except for the quarter ended June 30, 2008, Drives, systems and professional services gross margin has been negative over the past three years, inclusive of fixed overhead costs, due to low sales volume and our policy to price drives close to direct manufacturing cost to promote card sales resulting in the inability to cover fixed costs at current sales volumes. Depreciation and amortization was approximately $0.1 million and $0.2 million for fiscal years 2010 and 2009, respectively. We anticipate that Drives, systems and professional services negative gross margins will continue in the future unless equipment sales volume is sufficient to cover fixed costs or there is material amount of professional services revenue.
The increased costs associated with the implementation of professional services capabilities of $0.2 million, the non-cash charges of approximately $0.1 million for obsolete inventory and the $0.2 million write-off of obsolete equipment further attributed to the negative gross margin for this segment albeit revenue increased by 102% during fiscal year 2009 as compared to fiscal year 2008. Depreciation and amortization was approximately $0.2 million for each of the fiscal years 2009 and 2008.
Specialty Cards and Card Printers. The gross margin on Specialty cards and card printers was 26% of revenue for fiscal year 2010 as compared with 27% for fiscal year 2009. While we had an 11% decrease in revenue in fiscal year 2010 as compared to fiscal year 2009, we had secured some orders from new customers with higher margins and we continued with our productivity improvements and manufacturing cost reduction initiatives. We may not be able to mitigate fluctuations in foreign exchange through our forward contracts. This may cause adverse impact on our foreign operations.
The gross margin on Specialty cards and card printers was 27% for fiscal year 2009 as compared to gross margin of 20% for fiscal year 2008. Our long-term time and material contract in Serbia concluded during the quarter ended March 31, 2009 contributing approximately 11% to the overall gross margin in this segment. Productivity improvements and manufacturing cost reduction initiatives also attributed to the increase.
Operating Expenses
The following table presents operating expenses for the fiscal years ended March 31 (in thousands, except for percentages):
|
Change
|
Change
|
|||||||||||||||||||
|
2010
|
2009
|
2008
|
2010 vs 2009
|
2009 vs 2008
|
||||||||||||||||
|
Selling, general and administrative expenses
|
$ | 16,306 | $ | 15,424 | $ | 15,253 | $ | 882 | $ | 171 | ||||||||||
|
% of revenue
|
28 | % | 31 | % | 41 | % | ||||||||||||||
|
% of change from prior year
|
6 | % | 1 | % | ||||||||||||||||
|
Research and development expenses
|
1,172 | 2,366 | 2,878 | (1,194 | ) | (512 | ) | |||||||||||||
|
% of revenue
|
2 | % | 5 | % | 8 | % | ||||||||||||||
|
% of change from prior year
|
(50 | %) | (18 | %) | ||||||||||||||||
|
Total operating expenses
|
$ | 17,478 | $ | 17,790 | $ | 18,131 | $ | (312 | ) | $ | (341 | ) | ||||||||
Selling, General, and Administrative Expenses (“SG&A”). SG&A expenses for fiscal year 2010 increased by approximately $0.9 million, or 6% as compared to fiscal year 2009. The change was largely due to a $1.2 million increase for performance-based incentives. Also, sales commissions for fiscal 2010 of $1.7 million were up $0.3 million from 2009. These increases were partially offset by $0.6 million of decreases including; the employee stock purchase plan which was discontinued during fiscal year 2009, consulting fees, recruitment expenses, and other expenses. As a percentage of revenue, SG&A expenses were 28% in fiscal year 2010 compared to 31% in fiscal year 2009. SG&A expenses, net of commissions, are expected to average about $3.6 million per quarter for fiscal 2011, about the same as the previous year. We currently expect sales commissions to average about $0.9 million quarterly for fiscal 2011 depending upon product sales mix.
30
SG&A expenses for fiscal year 2009 increased by approximately $0.2 million, or 1% as compared to fiscal year 2008. As a percentage of revenue, SG&A expenses were 31% in fiscal year 2009, compared to 41% in fiscal year 2008. Selling and marketing expenses related to sales commissions for new programs increased by $1.0 million during fiscal year 2009 as compared to fiscal year 2008. This increase was offset by decreases in consulting, professional services, and approximately $0.9 million of a non-recurring severance expense related to our retiring CEO during fiscal year 2008.
Research and Development Expenses (“R&D”). R&D expenses for fiscal year 2010 decreased by $1.2 million, or 50% as compared to fiscal year 2009. As a percentage of revenue, R&D expenses were 2% in fiscal year 2010, compared to 5% in fiscal year 2009. During fiscal 2010, various R&D projects were realigned and cost reductions were implemented consistent with a ‘milestone’- based R&D strategy. We are continuing our effort to develop new OSM card and non-optical card features and structures, including various composite card structures to allow the insertion of contactless chips with RF capability, dual-interface (contact-contactless) with OSM, OVD products, and other market-driven requirements. We are also developing enhanced read/write drives for both increased reliability and ease of use and integration; and new software products and services in an effort to provide new products that can stimulate OSM card sales growth. We anticipate that these ongoing research and development efforts should result in enhanced card features and capabilities and drives with advanced security features and/or lower manufacturing costs; however, there is no assurance that such product development effort will be successful. These features are important for our existing and future OSM card markets. We anticipate R&D expenditures to average about $0.4 million per quarter during fiscal year 2011.
R&D expenses for fiscal year 2009 decreased by $0.5 million, or 18% as compared to fiscal year 2008. As a percentage of revenue, R&D expenses were 5% in fiscal year 2009, compared to 8% in fiscal year 2008.
Operating expenses include depreciation and amortization of approximately $0.6 million, $0.8 million, and $0.6 million for fiscal years 2010, 2009, and 2008, respectively.
Other Income (Expense), Net
The following table presents other income (expense), net, for the fiscal years ended March 31 (in thousands):
|
2010
|
2009
|
2008
|
||||||||||
|
Interest income
|
$ | 182 | $ | 365 | $ | 888 | ||||||
|
Interest expense
|
(176 | ) | (141 | ) | (72 | ) | ||||||
|
Unrealized gain/(loss) on trading securities (ARS)
|
261 | (261 | ) | - | ||||||||
|
Gain on termination of contract
|
495 | - | - | |||||||||
|
Other
|
(36 | ) | (198 | ) | (4 | ) | ||||||
| $ | 726 | $ | (235 | ) | $ | 812 | ||||||
Other Income (Expense), Net. Interest income for fiscal year 2010 decreased by $0.2 million, or 50% as compared to fiscal year 2009 due to the decline in interest rates during the year. The slight increase of interest expense for fiscal year 2010 as compared to fiscal year 2009 was largely due to the interest incurred on the credit line debt through UBS. We incurred an unrealized non-cash gain of $0.3 million during fiscal year ended March 31, 2010 due to recording our ARSs investment at fair value plus the fair value of the Put Option based on assumptions that we used for UBS’ credit risk fully recovering the loss of $0.3 million recorded during fiscal year 2009. Our contract to deliver a turn-key card manufacturing facility in the Kingdom of Saudi Arabia was terminated during fiscal year 2010 with a net gain of approximately $0.5 million recorded as other income and expense. Other expense was mainly due to net losses and gains on foreign exchange fluctuations.
Interest income for fiscal year 2009 decreased by $0.5 million, or 59% as compared to fiscal year 2008 due to a decline in interest rates during fiscal 2009. The increase of interest expense for fiscal year 2009 by $0.07 million, or 96% as compared to fiscal year 2008 was largely due to the effects on premiums from our forward currency contracts. The loss on fair value of the ARSs investments, net of gain on the fair value of the Put Option, resulted in approximately $0.3 million non-cash charge during fiscal year 2009.
31
Provision for Income Taxes
We recorded an income tax expense of approximately $1.3 million for fiscal year 2010, compared to $86,000 for fiscal year 2009. Pre-tax book income for the U.S. operations for fiscal year 2010 was approximately $5.9 million, compared to the U.S. pre-tax book loss of $1.3 million for fiscal year 2009. Taxable income for federal income tax purposes for the fiscal year ended March 31, 2010 was approximately $8.2 million, compared to $3.2 million for fiscal year ended March 31, 2009. A portion of our net operating loss carryover (“NOL”) was used to offset our taxable income. However, we were only allowed to offset 90% of our taxable income with NOL and we were subject to alternative minimum tax. Our Germany operations showed taxable income of approximately $1.4 million for fiscal year 2010, compared to $0.4 million for fiscal year 2009. We recorded an income tax expense of $184,000 for fiscal year 2010 for our Germany operations, compared to an income tax benefit of $13,000 for fiscal year 2009 as a majority of our German GAAP profit was offset by net operating losses.
We recorded an income tax expense of approximately $86,000 for fiscal year 2009, compared to an income tax benefit of $114,000 for fiscal year 2008. The tax benefit for fiscal year 2008 was due mainly to the reduction of deferred income tax liabilities in Germany offset by an adjustment related to a tax reserve for FIN 48. The payments from Prevent Global received through fiscal year ended March 31, 2008 were recorded as income on the federal tax return even though they were not recorded as income under U.S. generally accepted accounting principles (“GAAP”). This income was offset by NOLs generated in previous years. The book pre-tax loss for the U.S. operations was approximately $1.3 million, compared to a net loss for the U.S. operations of approximately $6.5 million for fiscal year 2008. Taxable income for federal income tax purposes for the fiscal year ended March 31, 2009 was approximately $3.2 million, compared to a taxable loss of $2.8 million for fiscal year 2008. A portion of our NOLs was used to offset our taxable income. However, we were only allowed to offset 90% of our taxable income with NOL and we were subject to alternative minimum tax. California also suspended the utilization of net operating losses for the tax years 2009 and 2008. Additionally, California limited the utilization of R&D credits to 50% of the tax liability without consideration for net operating losses. Our Germany operations showed taxable income of approximately $0.4 million for fiscal year 2009. We recorded an income tax benefit of $13,000 for fiscal year 2009 for our German operations as a majority of our taxable income was offset by net operating losses.
A full valuation allowance related to our U.S. operations was required at the end of fiscal years 2010, 2009, and 2008 considering both the positive and negative evidence regarding our ability to generate sufficient future taxable income to realize our deferred income tax assets.
LIQUIDITY AND CAPITAL RESOURCES
The following table summarizes cash, cash equivalents, investments and debt collateralized by investments as of March 31 (in thousands):
|
2010
|
2009
|
|||||||
|
Cash and cash equivalents
|
$ | 33,180 | $ | 15,912 | ||||
|
Short-term investments
|
$ | 11,907 | $ | 174 | ||||
|
Long-term investments
|
$ | - | $ | 13,239 | ||||
|
Short-term debt
|
$ | (7,865 | ) | $ | (8,681 | ) | ||
Our cash and cash equivalents increased by $17.3 million during fiscal year 2010 largely due to our higher income and changes in operating assets and liabilities. During fiscal year 2010, UBS redeemed $1.6 million of our ARS investments at par leaving investments of $11.9 million at par on March 31, 2010 as compared to investments of $13.5 million at par on March 31, 2009. These investments were recorded at their fair values and classified as Sort-term investments at March 31, 2010 and Long-term investments at March 31, 2009 in our consolidated balance sheet.
32
The following table displays the sources and uses of cash by activity for the fiscal years ended March 31 (in thousands):
|
2010
|
2009
|
2008
|
||||||||||
|
Net cash provided by (used in) operating activities
|
$ | 16,733 | $ | 4,097 | $ | (336 | ) | |||||
|
Net cash provided by (used in) investing activities
|
$ | 603 | $ | (2,797 | ) | $ | 2,580 | |||||
|
Net cash provided by (used in) financing activities
|
$ | (28 | ) | $ | 8,831 | $ | 694 | |||||
Net cash provided by operating activities for fiscal year 2010 was $16.7 million compared to net cash provided by operating activities of $4.1 million for fiscal year 2009. The $12.6 million increase in cash provided by operating activities for fiscal year 2010 as compared with fiscal 2009 was due to the $6.9 million increase in net income and the $5.7 million difference for cash provided by changes in operating assets and liabilities.
Net cash provided by operating activities was $4.1 million for fiscal year 2009, compared to net cash used by operating activities of $0.3 million for fiscal year 2008. The $4.1 million in cash provided by operating activities for fiscal year 2009 was due to $4.9 million provided by the net loss adjusted by non-cash charges of depreciation and amortization, stock-based compensation expense, the net effect of the loss due to fair value of the ARS investment and the gain on the Put Option and other miscellaneous items; all partially offset by the $0.9 million cash used in changes in operating assets and liabilities.
Net cash provided by investing activities was approximately $0.6 million for fiscal year 2010, compared to $2.8 million of cash used by investing activities for fiscal year 2009. Contributing mainly to this change were proceeds from the redemption of our ARS investment by UBS amounting to $1.6 million for fiscal year 2010 and the release of restricted cash balances of $0.2 million. Capital expenditures for fiscal year 2010 were $1.1 million primarily for production and leasehold improvement, compared to $2.5 million in capital expenditures for fiscal year 2009. We may further invest up to $2.0 million in additional capital equipment and leasehold improvement through March 31, 2011.
Net cash used in investing activities was $2.8 million for fiscal year 2009, compared to $2.6 million of cash provided by investing activities in fiscal year 2008. Capital expenditures for fiscal year 2009 were $2.5 million, mainly due to addition of new and improved production equipment in our OSM card business. Acquisition of patents and changes in the restricted cash balance contributed $0.3 million to the net balance.
Net cash used in financing activities was near zero for fiscal year 2010, compared to $8.8 million of cash provided by financing activities in fiscal year 2009. Our debt borrowing with UBS, collateralized by our ARS investments, at March 31, 2009 of $8.7 million decreased $0.8 million during fiscal year 2010. Also contributing to this change were proceeds from common stock option exercises of $0.2 million and the related excess tax benefit for fiscal year 2010 of $0.8 million, partially offset by about $0.1 million of taxes withheld and paid for restricted stocks and $0.1 million of principal payments on our capitalized leases. There was no related excess tax benefit recorded for fiscal year 2009.
Net cash provided by financing activities was $8.8 million for fiscal year 2009, compared to $0.7 million of cash provided by financing activities in fiscal year 2008. The increase in cash in financing activities for fiscal year 2009 was mainly due to the $8.7 million drawn from the UBS credit line and the $0.2 million net proceeds from the sale of common stock under our employee stock plans.
Current Borrowing Arrangements
In fiscal year 2009, we obtained a line of credit with UBS in the amount of $8.7 million that was collateralized by the ARS investments. During fiscal 2010, this debt was reduced by $0.8 million. The short-term debt will be fully extinguished by UBS with a portion of the proceeds from the sale of the ARS investments to UBS on June 30, 2010 or earlier if the ARS is called by UBS.
The intent of the credit line is to provide a no-cost loan until the ARS is sold where the interest rate charged on the credit line is equal to the interest rate earned on the ARS investments. Variable rate advances under the UBS Credit Line bear interest at a variable rate equal to the lesser of: (a) LIBOR, plus a percentage rate between 1.25% to 2.75%, depending on the amount of the advance, and (b) the then applicable weighted average rate of interest or dividend rate paid to us by the issuer of the ARSs, and in each case, such interest rate is subject to adjustment at any time and from time to time to reflect changes in the composition of the ARSs. When calculating the weighted average interest rate, the interest rate paid to us with respect to the ARSs equal to, (i) for the period up to and including January 21, 2009, the applicable coupon rate(s) and (ii) from January 22, 2009 and thereafter, the then applicable Taxable SLARC Maximum Auction Rate for the Taxable SLARSs.
33
The UBS Credit Line also provides, among other things, that:
|
|
o
|
UBS may demand full or partial payment of the credit line at its sole discretion and without cause at any time; and
|
|
|
o
|
UBS may at any time in its sole discretion terminate and cancel the credit line; provided, however, that UBS is required to provide to us alternative financing on substantially similar terms, unless the demand right was exercised as a result of certain specified events or the customer relationship between UBS and LaserCard is terminated for cause by UBS.
|
Refer to Note 2, caption 8, Cash and Cash Equivalents, Short-term Investments and Long-term Investments of the consolidated financial statement for further discussion of our noncurrent investments.
We believe that we have sufficient available cash to execute our business plan for fiscal year 2011. Operating cash flows could be negatively impacted to a significant degree if our largest government programs were to be delayed, reduced, canceled, or not extended; and if these programs are not replaced by other card orders or other sources of income.
CONTRACTUAL OBLIGATIONS:
The following table provides a summary of the effect on liquidity and cash flows from our contractual obligations for the following years ended March 31 (in thousands):
|
2011
|
2012
|
2013
|
2014
|
2015
|
Total
|
|||||||||||||||||||
|
Non-cancelable operating leases (1)
|
$ | 1,909 | $ | 1,840 | $ | 1,730 | $ | 1,457 | $ | 14 | $ | 6,950 | ||||||||||||
|
Non-cancelable purchase orders
|
1,857 | — | — | — | — | 1,857 | ||||||||||||||||||
|
Net borrowing on revolving credit with UBS (2)
|
7,865 | — | — | — | — | 7,865 | ||||||||||||||||||
|
Total
|
$ | 11,631 | $ | 1,840 | $ | 1,730 | $ | 1,457 | $ | 14 | $ | 16,672 | ||||||||||||
|
(1) Includes capitalized leases
|
||||||||||||||||||||||||
|
(2) For the purposes of this table, the obligation has been calculated without interest obligations.
|
||||||||||||||||||||||||
OFF-BALANCE SHEET ARRANGEMENTS
There were no off-balance sheet arrangements as of March 31, 2010 and March 31, 2009.
APPLICATION OF CRITICAL ACCOUNTING POLICIES AND ESTIMATES
Our discussion and analysis of financial condition and results of operations are based upon our consolidated financial statements, which have been prepared in accordance with U.S. generally accepted accounting principles. Note 2 of the Notes to Consolidated Financial Statements describe the significant accounting policies and methods used in the preparation of the consolidated financial statements. The preparation of these financial statements requires us to make estimates and judgments that affect the reported amounts of assets, liabilities, revenues and expenses. On an ongoing basis, we evaluate our estimates, including those related to our revenues, inventories, stock-based compensation, warranties, and income taxes. We base our estimates on historical experience and on various other assumptions that are believed to be reasonable under the circumstances, the results of which form the basis for making judgments about the carrying values of assets and liabilities that are not readily apparent from other sources.
Our critical accounting policies are those that both (1) are most important to the portrayal of the financial condition and results of operations and (2) require management’s most difficult, subjective, or complex judgments, often requiring estimates about matters that are inherently uncertain. These critical accounting policies reflect our significant judgments, assumptions, and estimates used in the preparation of the consolidated financial statements. Our management has discussed the development and selection of these critical accounting policies and estimates with the Audit Committee of our Board of Directors and the Audit Committee has reviewed our disclosures relating to them in this report. We consider the accounting policies described below to be our critical accounting policies:
34
Revenue Recognition. Product sales primarily consist of sales of OSM cards; Drives, systems and professional services; and Specialty cards and card printers. We recognize revenue from product sales when the following criteria are met: (1) persuasive evidence of an arrangement exists; (2) delivery has occurred; (3) the fee is fixed or determinable; and (4) collectability is reasonably assured. We recognize revenue on product sales at the time of shipment when shipping terms are F.O.B. shipping point, orders are placed pursuant to a pre-existing sales arrangement, and there are no post-shipment obligations other than customer acceptance criteria or, in the case of a U.S. government contract, warehousing. Where appropriate, provision is made at the time of shipment for estimated warranty costs and estimated returns.
The subcontract for Permanent Resident Cards for the U.S. government requires delivery into a secure LaserCard-controlled vault. Shipments are later made from the vault to a U.S. government site. The subcontract provides that the U.S. government is to take final delivery of any and all of its remaining inventory within six months of the end of the contract. At the time the cards are delivered into the vault, title to the cards is transferred to the U.S. government and all risks of ownership are transferred as well. The prime contractor is invoiced, with payment due within thirty days. Purchase orders do not contain any return (other than for warranty) or cancellation provisions. Pursuant to the provisions of SEC Staff Accounting Bulletin No. 605 ― Revenue Recognition (“ASC 605”), revenue is recognized on delivery into the vault as we have then fulfilled our contractual obligations and the earnings process is complete.
For contracts that include customer-specified acceptance criteria, we recognize revenue only after the acceptance criteria have been met and presuming that all other revenue criteria have been met. We defer revenue from services and recognize it over the contractual period, or as we render services and the customer accepts them.
We apply the provisions of the ASC 605-25, Revenue Arrangements with Multiple Deliverables, to revenue arrangements with multiple deliverables. ASC 605-25 provides criteria governing how to identify whether goods or services that are to be delivered separately in a bundled sales arrangement should be accounted for separately. Deliverables are accounted for separately if they meet all of the following criteria: (a) the delivered items have stand-alone value to the customer; (b) the fair value of any undelivered items can be reliably determined; and (c) if the arrangement includes a general right of return, delivery of the undelivered items is probable and substantially controlled by the seller. In situations where the deliverables fall within higher-level literature as defined by ASC 605-25, we apply the guidance in that higher-level literature. Deliverables that do not meet these criteria are combined with one or more other deliverables.
We apply the provisions of ASC 605-35, Accounting for Performance of Construction-Type and Certain Production-Type Contracts in applicable contracts. Revenues on time and materials contracts are recognized as services are rendered at contract labor rates plus material and other direct costs incurred. Revenues on fixed price contracts are recognized on the percentage of completion method based on the ratio of total costs incurred to date compared to estimated total costs to complete the contract. Estimates of costs to complete include material, direct labor, overhead and allowable general and administrative expenses. In circumstances where estimates of costs to complete a project cannot be reasonably estimated, but it is assured that a loss will not be incurred, the percentage-of-completion method based on a zero profit margin, rather than the completed-contract method, is used until more precise estimates can be made. The full amount of an estimated loss is charged to operations in the period it is determined that a loss will be realized from the performance of a contract. Our long-term program accounted for under ASC 605-35 concluded during the last quarter of fiscal year 2009 with revenue of approximately $540,000 during fiscal year 2009 and none during fiscal year 2010. For the year ended March 31, 2008, we recognized revenue of approximately $249,000 based on a zero profit margin.
We apply the provisions of ASC 605-15, Software Revenue Recognition, With Respect to Certain Transactions, to all transactions involving the sale of software products. Revenue from the license of our software products is recognized when persuasive evidence of an arrangement exists, the software product has been delivered, the fee is fixed or determinable, and collectability is probable, and, if applicable, upon acceptance when acceptance criteria are specified or upon expiration of the acceptance period. There was no software revenue recorded for fiscal year 2010. Software revenue was immaterial for fiscal years ended 2009, and 2008, respectively.
35
Product Warranty. Where appropriate, provision is made at the time of shipment for estimated warranty costs and estimated returns. We provide a limited warranty for the replacement of defective products. Our limited warranty requires us to repair or replace defective products at no cost to the customer within a specified time period after sale. We estimate the costs that may be incurred under our limited warranty and record a liability in the amount of such costs at the time product revenue is recognized. Factors that affect our estimate of warranty liability include the number of units sold, and historical and anticipated rates of warranty claims. We assess the adequacy of our recorded warranty liability and adjust the amount as necessary. We utilize historical trends and information received from our customers to assist in determining the appropriate estimated warranty accrual levels.
Accounting for Income Taxes. Income taxes are accounted for in accordance with ASC 740, Accounting for Income Taxes, which requires the use of the asset and liability method. Under this method, deferred tax assets and liabilities are determined based upon the differences between the financial reporting and the tax bases of assets and liabilities and are measured using enacted tax rules and laws that are anticipated to be in effect when the differences are expected to reverse. Net deferred tax assets are reduced by a valuation allowance to the extent that realization of the related deferred tax asset is not assured. We recorded a valuation allowance related to our U.S. operations for the full amount of our net deferred tax asset as of March 31, 2010 and March 31, 2009.
Significant judgment is required in determining our worldwide provision for income taxes and recording the related tax assets and liabilities. In the ordinary course of our business, there are operational decisions, transactions, facts and circumstances, and calculations for which the ultimate tax determination is not certain. Furthermore, our tax positions can be subject to challenge by the German and U.S. taxing authorities. Every quarter, we review our tax positions in each jurisdiction in the process of evaluating our unrecognized tax benefits. Adjustments are made to our unrecognized tax benefits when facts and circumstances regarding a tax position change that could lead to adjustments to our income tax expense or our effective tax rate. For fiscal year 2010, we recorded a provision for income tax expense of $1.3 million, compared with $0.1 million in fiscal year 2009. We recorded a benefit of $0.1 million in fiscal year 2008.
Inventories. We value our inventory at the lower of the actual cost to purchase and/or manufacture the inventory or market value with market value based on replacement cost or estimated realizable value less cost to sell. We regularly review inventory quantities on hand and record a provision for excess and obsolete inventory based primarily on forecasts of product demand. Demand for optical card drives can fluctuate significantly. In order to obtain favorable pricing, purchases of certain read/write drive parts are made in quantities that exceed the anticipated annual demand. We purchase drive parts for our anticipated demand and takes into consideration the order-to-delivery lead times of vendors and the economic purchase order quantity for such parts. In addition, we keep a supply of card raw materials that we deem necessary for anticipated demand. We use standard costs which approximate the first-in, first-out costing method.
We perform an analysis of the carrying value of inventory on a quarterly basis. With respect to inventory carrying values, we follow the principles articulated in ASC 330-10, Inventory-Overall-Initial Measurement as it relates to determining the appropriate cost basis of inventory and determining whether firm, noncancelable purchase commitments should be accrued as a loss if forecasted demand is not sufficient to utilize all such committed inventory purchases and the accounting for abnormal amounts of idle facility expense, freight, handling costs and wasted material (spoilage). Following ASC 330-10, we allocate fixed production overheads to the costs of conversion based on the normal capacity of the production facilities. We applied ASC 330-10 to inventory costs incurred effective April 1, 2006. The provisions of this statement were applied prospectively.
Management establishes lower of cost or market reserves and excess and obsolescence reserves. Inventory reserves are generally recorded when management determines that an item does not have a foreseeable revenue forecast. Inventory reserves are not relieved until the related inventory has been sold or scrapped. As part of our quarterly excess/obsolete inventory analysis, we also determine whether lower of cost or market adjustments (i.e., where selling prices less certain costs are not sufficient to recover inventory carrying values) are warranted.
Value of long-lived assets, including intangibles. We carry a variety of long-lived assets on our balance sheet including property and equipment, investments, and identifiable intangible assets. We periodically review the carrying value of all these assets based, in part, upon current estimated market values and our projections of anticipated future cash flows. We undertake this review when facts and circumstances suggest that cash flows related to those assets may be diminished. We did not record any impairment charge during fiscal year 2010 and 2009.
36
Share-Based Compensation. As described in detail in Note 2, Stock-Based Compensation, of the accompanying Notes to the Consolidated Financial Statements, effective April 1, 2006, we adopted the fair value recognition provisions of ASC 718, using the modified-prospective transition method. Under the fair value recognition provisions of ASC 718, share-based compensation cost is estimated at the grant date based on the fair value of the award and is recognized as expense, net of estimated forfeitures, ratably over the vesting period of the award. Calculating share-based compensation expense requires the input of highly subjective assumptions, including the expected term of the share-based awards, stock price volatility, and pre-vesting stock option forfeitures. We estimated the expected life of stock options granted during fiscal year ended March 31, 2010 based upon vesting provision and historical exercise, cancellation, and expiration patterns. We estimate the volatility of our common stock at the date of grant based on the historical volatility of our common stock. The assumptions used in calculating the fair value of stock-based awards represent our best estimates, but these estimates involve inherent uncertainties and the application of management judgment. As a result, if factors change and we use different assumptions, our share-based compensation expense could be materially different in the future. In addition, we are required to estimate the expected forfeiture rate and only recognize expense for those shares expected to vest. We estimate the forfeiture rate based on historical experience. If our actual forfeiture rate is materially different from our estimate, the stock-based compensation expense could be significantly different from what we have recorded in the current period.
As a result of adopting ASC 718 using the modified prospective method, our shared-based compensation expenses were $2.1 million, $2.4 million, and $2.1 million from stock options and Employee Stock Purchase Plan for the fiscal years 2010, 2009, and 2008, respectively. Our Employee Stock Purchase Plan was terminated during the last quarter of fiscal year 2009. As of March 31, 2010, $2.7 million of total unrecognized compensation cost related to unvested share-based compensation arrangements is expected to be recognized over the remaining vesting period through December 2013.
Short and Long-term Investments. Short-term investments include securities with maturities at date of purchase of more than three months and investments with remaining maturities of less than one year. All investments with maturities at date of purchase greater than one year are classified as long-term investments. Management determines the appropriate classification of debt securities at the time of purchase and re-evaluates the classification of investments as of each balance sheet date.
We account for our short-term marketable securities in accordance with ASC 320, Accounting for Certain Investments in Debt and Equity Securities. We consider all highly liquid investments, consisting primarily of commercial paper, discount notes, and U.S. government bonds with maturities of three months or less at date of purchase, to be cash equivalents. All investments with maturities at date of purchase of more than three months or current maturities of less than one year are classified as short-term investments. Investments with current maturities of more than one year are classified as long-term investments. We determine the length of our investments after considering our cash requirements and yields available for the type of investment considered by Management. Management determines the appropriate classification of debt and equity securities at the time of purchase and reevaluates the classification of investments as of each balance sheet date. We own investments in marketable securities that have been designated as “trading securities.” Trading securities are bought and sold principally for the purpose of selling them in the near term and are reported in the financial statements at fair value. Changes in the fair value from period to period are reported as a component of net income. We had classified all of our ARSs as short-term investments carried at its fair value plus the fair value of the Put Option as we plan to exercise our “Right” to sell our ARS at par to UBS on June 30, 2010. Our ARS plus the Put Option at March 31, 2010 were valued at $11.9 million. At March 31, 2009, we had these classified as long-term investments with combined fair values of $13.2 million. Our investments in certificates of deposits designated as available for sale as of March 31, 2010 was immaterial and we had none as of March 31, 2009.
Refer to Note 2, caption 8, Cash and Cash Equivalents, Short-term Investments and Long-term Investments of the consolidated financial statement for further discussion of our noncurrent investments.
37
RECENTLY ADOPTED ACCOUNTING PRONOUNCEMENTS
In June 2009, the Financial Accounting Standards Board (the “FASB”) Accounting Standards Codification™ (the “Codification”) became the single source of authoritative GAAP. The Codification did not create any new GAAP standards but incorporated existing accounting and reporting standards into a new topical structure with a new referencing system to identify authoritative accounting standards, replacing the prior references to Statement of Financial Accounting Standards (“SFAS”), Emerging Issues Task Force (“EITF”), FASB Staff Position (“FSP”), etc. Authoritative standards included in the Codification are designated by their Accounting Standards Codification (“ASC”) topical reference, and new standards will be designated as Accounting Standards Updates (“ASU”), with a year and assigned sequence number. References to prior standards have been updated to reflect the new referencing system.
In June 2009, the FASB concurrently issued amendments to ASC 860, Transfers and Servicing, and ASC 810, Consolidation, that change the way entities account for securitizations and other transfers of financial instruments. In addition to increased disclosure, these amendments eliminate the concept of qualifying special purpose entities and change the test for consolidation of variable interest entities. These amendments will be effective for LaserCard as of April 1, 2010. We have evaluated these amendments and believe they have no impact on our financial condition or results of operations.
RECENTLY ISSUED ACCOUNTING PRONOUNCEMENTS
In October 2009, the FASB concurrently issued the following Accounting Standards Updates: ASU No. 2009-14 - Software (Topic 985): Certain Revenue Arrangements That Include Software Elements. This standard removes tangible products from the scope of software revenue recognition guidance and also provides guidance on determining whether software deliverables in an arrangement that includes a tangible product, such as embedded software, are within the scope of the software revenue guidance.
ASU No. 2009-13 - Revenue Recognition (Topic 605): Multiple-Deliverable Revenue Arrangements. This standard modifies the revenue recognition guidance for arrangements that involve the delivery of multiple elements, such as product, software, services or support, to a customer at different times as part of a single revenue generating transaction. This standard provides principles and application guidance to determine whether multiple deliverables exist, how the individual deliverables should be separated and how to allocate the revenue in the arrangement among those separate deliverables. The standard also expands the disclosure requirements for multiple deliverable revenue arrangements.
These ASUs should be applied on a prospective basis for revenue arrangements entered into or materially modified in fiscal years beginning on or after June 15, 2010, with earlier application permitted. Alternatively, an entity can elect to adopt these standards on a retrospective basis, but both of these standards must be adopted in the same period using the same transition method. We expect to apply this standard on a prospective basis for revenue arrangements entered into or materially modified beginning April 1, 2010. We have evaluated these amendments and believe they will have no impact on our financial condition or results of operations.
ASU No. 2009-17 – Improvements to Financial Reporting by Enterprises Involved With Variable Interest Entities (Topic 810). The amendments in this Accounting Standards Update replace the quantitative-based risks and rewards calculation for determining which reporting entity, if any, has a controlling financial interest in a variable interest entity with an approach focused on identifying which reporting entity has the power to direct the activities of a variable interest entity that most significantly impact the entity’s economic performance and (1) the obligation to absorb losses of the entity or (2) the right to receive benefits from the entity. An approach that is expected to be primarily qualitative will be more effective for identifying which reporting entity has a controlling financial interest in a variable interest entity. The amendments in this Update also require additional disclosures about a reporting entity’s involvement in variable interest entities, which will enhance the information provided to users of financial statements. We have evaluated these amendments and believe they have no impact on our financial condition or results of operations.
38
In January 2010, the FASB issued guidance that expands the interim and annual disclosure requirements of fair value measurements, including the information about movement of assets between level 1 and 2 of the three-tier fair value hierarchy established under its fair value measurement guidance. This guidance also requires separate disclosure for each of purchases, sales, issuance, and settlements in the reconciliation for fair value measurements using significant unobservable inputs, level 3. Except for the detailed disclosure in the level 3 reconciliation, which is effective for the fiscal years beginning after December 15, 2010, all the other disclosures under this guidance are effective for the fiscal years beginning after December 15, 2009. We have evaluated these amendments and believe they will have no impact on our financial condition or results of operations.
39
ITEM 7A. QUANTITATIVE AND QUALITATIVE DISCLOSURES ABOUT MARKET RISKS
Interest Rate Risk. We invest our cash, beyond that needed for daily operations, in high quality debt securities for investment purposes. In doing so, we seek primarily to preserve the value and liquidity of our capital and, secondarily, to safely earn income from these investments. To accomplish these goals, we invest only in debt securities issued by (a) the U.S. Treasury and U.S. government agencies, state agencies and corporations and (b) debt instruments that meet the following criteria:
o Commercial paper rated A1/P1 or debt instruments rated AAA, as rated by the major rating services
o Can readily be sold for cash
Investments in both fixed rate and floating rate interest earning instruments carry a degree of interest rate risk. Fixed rate securities may have their fair market value adversely impacted because of a rise in interest rates, while floating rate securities may produce less income than expected if interest rates fall. Due in part to these factors, our future investment income may fall short of expectations because of changes in interest rates or we may suffer losses in principal if forced to sell securities that have seen a decline in market value because of changes in interest rates.
We are subject to interest rate risk on our short-term borrowings under our Credit Line Agreement with UBS valued at $7.9 million as of fiscal year ended March 31, 2010; secured by the ARSs we currently hold. However, the credit line provides a no-cost loan where the interest rate charged on the credit line is equal to the interest rate earned on the ARS. We entered into a Rights settlement whereby UBS offered to purchase certain ARSs it placed, including those we hold, at par or face value. UBS has the “Right” to purchase its ARSs at par at any time through July 3, 2012 and we have the “Right” to sell our ARSs at par to UBS beginning June 30, 2010 through July 3, 2012. We have no other short or long-term borrowings other than the credit line with UBS and capitalized lease agreements that would give rise to significant interest rate risk. Although our interest income is sensitive to changes in the general level of U.S. interest rates, particularly since some portion of our investments are in money market funds, we do not expect our operating results or cash flows to be affected to any significant degree by the effects of a change in market interest rates on our investments.
We do not enter into investments for trading purposes. Although our ARS investments had been designated as trading securities as of March 31, 2010, we expect to recover the par value of the ARSs based on our “Rights” agreement with UBS. We intend to sell them to UBS on June 30, 2010. Hence, we classified the ARSs investments as current assets, including the Put Option, at March 31, 2010. We believe that we have sufficient available cash to execute our business plan for fiscal year 2011 as we expect the estimated level of revenues to be sufficient to generate cash from operating activities over the same period.
Refer to Note 2, caption 8, Cash and Cash Equivalents, Short-term Investments and Long-term Investments of the consolidated financial statement for further discussion of our noncurrent investments.
Fair Value Fluctuation Risk: At March 31, 2010, there was insufficient observable ARSs market information available to determine the fair value of our ARS investments, or the Put Option. Therefore, in order to validate the fair value estimate of these securities, we incorporated assumptions such as credit quality or financial standing of the issuer, final stated maturities, estimates on the probability of the issue being called prior to final maturity, impact due to extended periods of maximum auction rates, liquidity risk premium, and broker quotes from independent valuators using widely accepted financial models. Management believes that these are reasonable estimates reflecting the unique circumstances of the subject SLARS and the method of valuing the Put Option as forward contracts is reasonable.
As of March 31, 2010, we held $11.9 million par value, with fair value of $11.1 million, of marketable securities consisting of ARSs. Also included in our current investments is the Put Option received in the rights offering from UBS with a fair value of approximately $0.8 million at March 31, 2010. UBS has the “Right” to purchase its ARSs at par at any time through July 3, 2012 and we have the “Right” to sell our ARSs at par to UBS beginning June 30, 2010 through July 3, 2012. Hence, we classified the ARS investments and the Put Options as current assets in our consolidated balance sheet at March 31, 2010. We recognized a net loss of $0.3 million related to the fair values of the ARSs and the Put Option during the fiscal year ended March 31, 2009 and a gain of a like amount during our fiscal year ended March 31, 2010. We believe that we will recover the full amount our ARSs investment at par until June 30, 2010 when we intend to exercise our Put Option with UBS. A plus or minus ten percent change on differential of UBS’ credit risk compared with market interest rates will not have a material impact on the valuation of our investments.
40
The following summarizes investments at fair value, weighted average yields and expected maturity dates for the fiscal years ended March 31 (in thousands):
|
Change in
|
||||||||||||
|
March 31, 2010
|
March 31, 2009
|
fair value
|
||||||||||
|
Auction rate securities at par
|
$ | 13,500 | $ | 13,500 | ||||||||
|
Redeemed at par
|
(1,600 | ) | - | |||||||||
|
Gross unrealized losses
|
(813 | ) | (1,267 | ) | 454 | |||||||
|
Estimated fair market value of ARS
|
11,087 | 12,233 | ||||||||||
|
Put Option
|
813 | 1,006 | (193 | ) | ||||||||
|
Estimated fair market value of ARS including Put Option at end of period
|
$ | 11,900 | (1) | $ | 13,239 | (2) | $ | 261 | ||||
|
Weighted average yield
|
1.46 | % | 1.57 | % | ||||||||
|
Maturity Dates
|
July 15, 2029 through January 25, 2047
|
July 15, 2029 through January 25, 2047
|
||||||||||
|
(1) classified as current assets
|
||||||||||||
|
(2) classified as non-current assets
|
||||||||||||
Foreign Currency Exchange Rate Risk. Our U.S. operations sell products in various international markets. During fiscal year 2010, revenue by our German subsidiary of approximately $14.0 million and net income of $1.3 million was denominated in foreign currency (Euro), respectively. In addition, some raw material purchases and purchased services were denominated in foreign currency.
We use short-term foreign exchange forward contracts to mitigate foreign currency risk associated primarily with inter-company receivables and payables, and loans receivable (denominated in Euros) to our German subsidiary. Our foreign exchange forward contracts are not designated for accounting purposes as hedging instruments under ASC815, Accounting for Derivative Instruments and Hedging Activities, as amended. Accordingly, any gains or losses resulting from changes in the fair value of the forward contract are reported in other income, net expenses. The gains and losses on these forward contracts generally offset gains and losses associated with the underlying foreign currency denominated inter-company receivables and payables, and loans receivable. At March 31, 2010, we had a foreign exchange forward contract with a maturity of less than 30 days to purchase 1.3 million Euros. The fair value of the forward contract was not material at March 31, 2010. A plus or minus ten percent change on differential of UBS’ credit risk compared with market interest rates will not have a material impact on the valuation of our investments.
41
ITEM 8. FINANCIAL STATEMENTS AND SUPPLEMENTARY DATA
REPORT OF INDEPENDENT REGISTERED PUBLIC ACCOUNTING FIRM
To the Board of Directors and Stockholders
LaserCard Corporation
We have audited the accompanying consolidated balance sheets of LaserCard Corporation and subsidiaries (collectively, the “Company”) as of March 31, 2010 and 2009, and the related consolidated statements of operations, stockholders’ equity, and cash flows for each of the two years in the period ended March 31, 2010. Our audits also included the financial statement schedule of LaserCard Corporation listed in Item 15(a). These financial statements and financial statement schedule are the responsibility of the Company’s management. Our responsibility is to express an opinion on these financial statements based on our audits.
We conducted our audits in accordance with the standards of the Public Company Accounting Oversight Board (United States). Those standards require that we plan and perform the audit to obtain reasonable assurance about whether the financial statements are free of material misstatement. An audit includes examining, on a test basis, evidence supporting the amounts and disclosures in the financial statements. An audit also includes assessing the accounting principles used and significant estimates made by management, as well as evaluating the overall financial statement presentation. We believe that our audits provide a reasonable basis for our opinion.
In our opinion, the consolidated financial statements referred to above present fairly, in all material respects, the financial position of LaserCard Corporation and subsidiaries as of March 31, 2010 and 2009, and the results of their operations and their cash flows for each of the two years in the period ended March 31, 2010, in conformity with U.S. generally accepted accounting principles. Also, in our opinion, the related financial statement schedule, when considered in relation to the basic consolidated financial statements taken as a whole, presents fairly in all material respects the information set forth therein.
We have also audited, in accordance with the standards of the Public Company Accounting Oversight Board (United States), LaserCard Corporation’s and subsidiaries’ internal control over financial reporting as of March 31, 2010, based on criteria established in Internal Control — Integrated Framework issued by the Committee of Sponsoring Organizations of the Treadway Commission, and our report dated June 15, 2010 expressed an unqualified opinion on the effectiveness of LaserCard Corporation and subsidiaries’ internal control over financial reporting.
/s/SingerLewak LLP
San Jose, California
June 15, 2010
42
REPORT OF INDEPENDENT REGISTERED PUBLIC ACCOUNTING FIRM
The Board of Directors and Stockholders of
LaserCard Corporation
We have audited the accompanying consolidated statements of operations, stockholders’ equity and cash flows of LaserCard Corporation and subsidiaries for the year ended March 31, 2008. These consolidated financial statements are the responsibility of the Company’s management. Our responsibility is to express an opinion on these consolidated financial statements based on our audit.
We conducted our audit in accordance with the standards of the Public Company Accounting Oversight Board (United States). Those standards require that we plan and perform the audit to obtain reasonable assurance about whether the financial statements are free of material misstatement. An audit includes examining, on a test basis, evidence supporting the amounts and disclosures in the financial statements. An audit also includes assessing the accounting principles used and significant estimates made by management, as well as evaluating the overall financial statement presentation. We believe that our audit provides a reasonable basis for our opinion.
In our opinion, the consolidated financial statements referred to above present fairly, in all material respects, the results of operations and cash flows of LaserCard Corporation and subsidiaries for the year ended March 31, 2008, in conformity with accounting principles generally accepted in the United States of America.
/s/ Odenberg, Ullakko, Muranishi & Co. LLP
San Francisco, California
June 4, 2008
43
CONSOLIDATED BALANCE SHEETS
March 31, 2010 and 2009
(In thousands, except share and per share amounts)
|
2010
|
2009
|
|||||||
|
ASSETS
|
||||||||
|
Current assets:
|
||||||||
|
Cash and cash equivalents
|
$ | 33,180 | $ | 15,912 | ||||
|
Short-term investments
|
11,907 | 174 | ||||||
|
Accounts receivable, net of allowance of $37 at March 31, 2010 and $59 at March 31, 2009
|
4,157 | 10,217 | ||||||
|
Inventories, net of reserves of $2,143 at March 31, 2010 and $863 at March 31, 2009
|
11,326 | 14,232 | ||||||
|
Deferred contract costs
|
213 | 345 | ||||||
|
Prepaid and other current assets
|
1,280 | 934 | ||||||
|
Total current assets
|
62,063 | 41,814 | ||||||
|
Property and equipment, net of accumulated depreciation of $23,904 at March 31, 2010 and $21,555 at March 31, 2009
|
9,409 | 10,872 | ||||||
|
Equipment held for resale
|
7,155 | 7,062 | ||||||
|
Long-term investments
|
- | 13,239 | ||||||
|
Patents and other intangibles, net
|
307 | 400 | ||||||
|
Notes receivable
|
230 | 227 | ||||||
|
Deferred contract costs
|
79 | 568 | ||||||
|
Other non-current assets
|
48 | 108 | ||||||
|
Total assets
|
$ | 79,291 | $ | 74,290 | ||||
|
LIABILITIES AND STOCKHOLDERS’ EQUITY
|
||||||||
|
Current liabilities:
|
||||||||
|
Accounts payable
|
$ | 1,236 | $ | 1,698 | ||||
|
Accrued liabilities
|
4,539 | 3,397 | ||||||
|
Deferred income tax liability
|
191 | 234 | ||||||
|
Advance payments from customers
|
6,525 | 7,958 | ||||||
|
Short-term debt
|
7,865 | 8,681 | ||||||
|
Deferred revenue
|
533 | 589 | ||||||
|
Deferred rent
|
270 | 257 | ||||||
|
Capital lease obligation
|
76 | 72 | ||||||
|
Total current liabilities
|
21,235 | 22,886 | ||||||
|
Capital lease obligation, net of current portion
|
77 | 166 | ||||||
|
Advance payments from customers, net of current portion
|
24,505 | 26,122 | ||||||
|
Deferred revenue, net of current portion
|
3,306 | 3,788 | ||||||
|
Deferred rent, net of current portion
|
954 | 1,203 | ||||||
|
Income tax payable
|
308 | 277 | ||||||
|
Total liabilities
|
50,385 | 54,442 | ||||||
|
Stockholders’ equity:
|
||||||||
|
Preferred stock, $0.01 par value:
|
||||||||
|
Authorized - 2,000,000 shares
|
||||||||
|
Issued - none
|
— | — | ||||||
|
Common stock, $0.01 par value
|
||||||||
|
Authorized - 30,000,000 shares
|
||||||||
|
Issued and outstanding - 12,234,882 shares at March 31, 2010 and 12,113,985 shares at March 31, 2009
|
||||||||
|
|
122 | 121 | ||||||
|
Additional paid-in capital
|
69,492 | 66,422 | ||||||
|
Accumulated deficit
|
(40,815 | ) | (46,807 | ) | ||||
|
Accumulated other comprehensive income
|
107 | 112 | ||||||
|
Total stockholders’ equity
|
28,906 | 19,848 | ||||||
|
Total liabilities and stockholders’ equity
|
$ | 79,291 | $ | 74,290 | ||||
The accompanying notes are an integral part of these consolidated financial statements.
44
LASERCARD CORPORATION AND SUBSIDIARIES
CONSOLIDATED STATEMENTS OF OPERATIONS
Fiscal Years Ended March 31, 2010, 2009, and 2008
(In thousands, except per share amounts)
|
2010
|
2009
|
2008
|
||||||||||
|
Revenue
|
$ | 58,611 | $ | 49,771 | $ | 37,008 | ||||||
|
Cost of product sales
|
34,603 | 32,600 | 27,009 | |||||||||
|
Gross profit
|
24,008 | 17,171 | 9,999 | |||||||||
|
Operating expenses:
|
||||||||||||
|
Selling, general, and administrative expenses
|
16,306 | 15,424 | 15,253 | |||||||||
|
Research and development expenses
|
1,172 | 2,366 | 2,878 | |||||||||
|
Total operating expenses
|
17,478 | 17,790 | 18,131 | |||||||||
|
Operating income (loss)
|
6,530 | (619 | ) | (8,132 | ) | |||||||
|
Other income (loss), net
|
726 | (235 | ) | 812 | ||||||||
|
Income (loss) before income taxes
|
7,256 | (854 | ) | (7,320 | ) | |||||||
|
Provision for income tax (benefit)
|
1,264 | 86 | (114 | ) | ||||||||
|
Net income (loss)
|
$ | 5,992 | $ | (940 | ) | $ | (7,206 | ) | ||||
|
Net income (loss) per share:
|
||||||||||||
|
Basic
|
$ | 0.49 | $ | (0.08 | ) | $ | (0.60 | ) | ||||
|
Diluted
|
$ | 0.49 | $ | (0.08 | ) | $ | (0.60 | ) | ||||
|
Weighted-average shares of common stock used in computing net income (loss) per share:
|
||||||||||||
|
Basic
|
12,189 | 12,052 | 11,929 | |||||||||
|
Diluted
|
12,226 | 12,052 | 11,929 | |||||||||
|
The accompanying notes are an integral part of these consolidated financial statements.
|
||||||||||||
45
LASERCARD CORPORATION AND SUBSIDIARIES
CONSOLIDATED STATEMENTS OF STOCKHOLDERS’ EQUITY AND COMPREHENSIVE INCOME (LOSS)
Fiscal Years Ended March 31, 2008, 2009, and 2010
(In thousands)
|
Common Stock
|
Additional
Paid-in
|
Accumulated
|
Accumulated
Other
Comprehensive
|
Treasury Stock
|
Total
Stockholders’
|
Comprehensive
|
||||||||||||||||||||||||||||||
|
Shares
|
Amount
|
Capital
|
Deficit
|
Income (loss)
|
Shares
|
Amount
|
Equity
|
Income (Loss)
|
||||||||||||||||||||||||||||
|
Balance, March 31, 2007
|
11,858 | $ | 119 | $ | 61,068 | $ | (38,722 | ) | $ | 134 | — | $ | — | $ | 22,599 | |||||||||||||||||||||
|
Adjustment due to FIN48
|
61 | 61 | ||||||||||||||||||||||||||||||||||
|
Shares issued under stock option and stock purchase plans
|
121 | 1 | 711 | ― | ― | ― | ― | 712 | ||||||||||||||||||||||||||||
|
Compensation related to stock plan activity
|
― | ― | 2,089 | ― | ― | ― | ― | 2,089 | ||||||||||||||||||||||||||||
|
Comprehensive loss:
|
||||||||||||||||||||||||||||||||||||
|
Foreign currency translation adjustments
|
— | — | — | ― | 96 | ― | ― | 96 | $ | 96 | ||||||||||||||||||||||||||
|
Unrealized loss
|
— | — | — | — | (625 | ) | (625 | ) | (625 | ) | ||||||||||||||||||||||||||
|
Net loss
|
— | — | — | (7,206 | ) | — | — | — | (7,206 | ) | (7,206 | ) | ||||||||||||||||||||||||
|
Total comprehensive loss
|
$ | (7,735 | ) | |||||||||||||||||||||||||||||||||
|
Balance, March 31, 2008
|
11,979 | $ | 120 | $ | 63,868 | $ | (45,867 | ) | $ | (395 | ) | — | $ | — | $ | 17,726 | ||||||||||||||||||||
|
Shares issued under stock option and stock purchase plans
|
135 | 1 | 197 | ― | ― | ― | ― | 198 | ||||||||||||||||||||||||||||
|
Compensation related to stock plan activity
|
― | ― | 2,357 | ― | ― | ― | ― | 2,357 | ||||||||||||||||||||||||||||
|
Comprehensive loss:
|
||||||||||||||||||||||||||||||||||||
|
Foreign currency translation adjustments
|
— | — | — | ― | (118 | ) | ― | ― | (118 | ) | $ | (118 | ) | |||||||||||||||||||||||
|
Unrealized loss
|
— | — | — | — | 625 | — | — | 625 | 625 | |||||||||||||||||||||||||||
|
Net loss
|
— | — | — | (940 | ) | — | — | — | (940 | ) | (940 | ) | ||||||||||||||||||||||||
|
Total comprehensive loss
|
$ | (433 | ) | |||||||||||||||||||||||||||||||||
|
Balance, March 31, 2009
|
12,114 | $ | 121 | $ | 66,422 | $ | (46,807 | ) | $ | 112 | — | $ | — | $ | 19,848 | |||||||||||||||||||||
|
Shares issued under stock option and related income tax benefits
|
121 | 1 | 878 | ― | ― | ― | ― | 879 | ||||||||||||||||||||||||||||
|
Compensation related to stock plan activity
|
― | ― | 2,192 | ― | ― | ― | ― | 2,192 | ||||||||||||||||||||||||||||
|
Comprehensive loss:
|
||||||||||||||||||||||||||||||||||||
|
Foreign currency translation adjustments
|
— | — | — | ― | (5 | ) | ― | ― | (5 | ) | $ | (5 | ) | |||||||||||||||||||||||
|
Net income
|
— | — | — | 5,992 | — | — | — | 5,992 | 5,992 | |||||||||||||||||||||||||||
|
Total comprehensive income
|
$ | 5,987 | ||||||||||||||||||||||||||||||||||
|
Balance, March 31, 2010
|
12,235 | $ | 122 | $ | 69,492 | $ | (40,815 | ) | $ | 107 | — | $ | — | $ | 28,906 | |||||||||||||||||||||
The accompanying notes are an integral part of these consolidated financial statements.
46
LASERCARD CORPORATION AND SUBSIDIARIES
CONSOLIDATED STATEMENTS OF CASH FLOWS
Fiscal Years Ended March 31, 2010, 2009, and 2008
(In thousands)
|
2010
|
2009
|
2008
|
||||||||||
|
Cash flows from operating activities:
|
||||||||||||
|
Net income (loss)
|
$ | 5,992 | $ | (940 | ) | $ | (7,206 | ) | ||||
|
Adjustments to reconcile net loss to net cash
|
||||||||||||
|
provided by (used in) operating activities:
|
||||||||||||
|
Depreciation and amortization
|
2,674 | 2,877 | 2,993 | |||||||||
|
Fixed Asset disposal
|
25 | 302 | (6 | ) | ||||||||
|
Provision for doubtful accounts receivable
|
53 | 32 | (39 | ) | ||||||||
|
Provision for excess and obsolete inventory
|
1,858 | 352 | 57 | |||||||||
|
Provision for warranty reserve
|
77 | 24 | 143 | |||||||||
|
Decrease in deferred tax asset
|
- | 92 | 181 | |||||||||
|
Stock-based compensation
|
2,192 | 2,357 | 2,090 | |||||||||
|
Put option, (gain) loss on fair value
|
193 | (1,006 | ) | - | ||||||||
|
Mark to market, trading (gain) loss
|
(454 | ) | 1,267 | - | ||||||||
|
Changes in operating assets and liabilities:
|
||||||||||||
|
Decrease (increase) in accounts receivable
|
6,027 | (7,547 | ) | 901 | ||||||||
|
Decrease (increase) in inventories
|
1,075 | (1,845 | ) | (1,347 | ) | |||||||
|
Decrease (inrease) in deferred contract costs
|
624 | (83 | ) | 91 | ||||||||
|
Decrease (increase) in other current assets
|
(288 | ) | 520 | 155 | ||||||||
|
Increase in equipment held for resale
|
(93 | ) | (373 | ) | (339 | ) | ||||||
|
Decrease in other non-current assets
|
60 | 168 | - | |||||||||
|
Increase (decrease) in accounts payable and accrued liabilities
|
618 | (249 | ) | 163 | ||||||||
|
Decrease in deferred income tax liabilities
|
(46 | ) | (128 | ) | (49 | ) | ||||||
|
Increase (decrease) in deferred revenue
|
(540 | ) | 380 | 371 | ||||||||
|
Increase (decrease) in deferred rent
|
(236 | ) | 291 | 304 | ||||||||
|
Increase (decrease) in advance payments from customers
|
(3,078 | ) | 7,606 | 1,201 | ||||||||
|
Net cash provided by (used in) operating activities
|
16,733 | 4,097 | (336 | ) | ||||||||
|
Cash flows from investing activities:
|
||||||||||||
|
Increase in non-current assets
|
- | - | (167 | ) | ||||||||
|
Purchases of property and equipment
|
(1,148 | ) | (2,496 | ) | (1,167 | ) | ||||||
|
Proceeds from sale of equipment
|
- | - | 29 | |||||||||
|
Acquisition of patents
|
(16 | ) | (127 | ) | (115 | ) | ||||||
|
Purchases of short-term investments
|
(7 | ) | - | (7,000 | ) | |||||||
|
Proceeds from maturities of short-term investments
|
1,600 | - | 11,000 | |||||||||
|
Changes in restricted cash balances
|
174 | (174 | ) | - | ||||||||
|
Net cash provided by (used in) investing activities
|
603 | (2,797 | ) | 2,580 | ||||||||
|
Cash flows from financing activities:
|
||||||||||||
|
Proceeds from sale of common stock through stock plans
|
230 | 241 | 712 | |||||||||
|
Tax benefit on carryforward of gain from exercise of common stock options
|
747 | - | - | |||||||||
|
Employee’s taxes withheld and paid for restricted stock
|
(98 | ) | (43 | ) | - | |||||||
|
Net borrowing on revolving credit agreement
|
(816 | ) | 8,681 | - | ||||||||
|
Principal payments on capital lease obligation
|
(91 | ) | (48 | ) | (18 | ) | ||||||
|
Net cash provided by financing activities
|
(28 | ) | 8,831 | 694 | ||||||||
|
Effect of exchange rate changes on cash and cash equivalents
|
(40 | ) | 198 | (381 | ) | |||||||
|
Net increase in cash and cash equivalents
|
17,268 | 10,329 | 2,557 | |||||||||
|
Cash and cash equivalents:
|
||||||||||||
|
Beginning of period
|
15,912 | 5,583 | 3,026 | |||||||||
|
End of period
|
$ | 33,180 | $ | 15,912 | $ | 5,583 | ||||||
|
Supplemental disclosures - cash payments for:
|
||||||||||||
|
Income taxes
|
$ | 290 | $ | - | $ | - | ||||||
|
Interest expense
|
$ | 236 | $ | 141 | $ | 71 | ||||||
|
Supplemental schedule of non-cash investing activities:
|
||||||||||||
|
Equipment acquired under capital lease
|
$ | - | $ | 198 | $ | 113 | ||||||
|
Unrealized loss (gain) in fair value of investments in other comprehensive income (loss)
|
$ | - | $ | (625 | ) | $ | 625 | |||||
|
Unrealized loss (gain) in fair value of investments in earnings
|
$ | (261 | ) | $ | 261 | $ | - | |||||
The accompanying notes are an integral part of these consolidated financial statements.
47
LASERCARD CORPORATION AND SUBSIDIARIES
NOTES TO CONSOLIDATED FINANCIAL STATEMENTS
1. Organization and Operations
LaserCard Corporation, a Delaware Corporation, and its wholly owned subsidiaries, LaserCard Corporation, a California Corporation, and Challenge Card Design Plastikkarten GmbH of Germany (“LaserCard,” “we” or “us”) develop, manufacture and integrate LaserCard optical security media (“OSM”) cards, optical card drives, peripherals and specialty cards and printers.
Our customers for OSM related products are mainly value-added reseller (“VAR”) companies worldwide, that develop applications for LaserCard products. Target markets for these products include government and commercial applications for portable, recordable, secure, identification cards and other unitary-record cards. Current applications include United States Green Card, Angola National ID card, Italian national and other government agency ID card programs, Kingdom of Saudi Arabia’s national ID card, India’s vehicle registration card in three states, Foreign Resident ID program of Costa Rica, biometric IDs and other card applications.
We supply other advanced-technology cards for various applications, card printers and systems integration for access control and ticketing. We may also supply and install state-of-the-art card production equipment, transfer manufacturing know-how, and provide training, and production support for card manufacturing.
We are subject to certain risks including, but not limited to, competition from substitute products and larger companies and dependence on certain suppliers and customers.
2. Summary of Significant Accounting Policies
(1.) Principles of Consolidation and Basis of Presentation. The accompanying consolidated financial statements have been prepared in accordance with U.S. GAAP. The consolidated financial statements include our accounts. All significant intercompany accounts and transactions have been eliminated upon consolidation.
(2.) Use of Estimates. The preparation of consolidated financial statements in conformity with U.S. GAAP requires management to make estimates and assumptions that affect the reported amounts of assets and liabilities and disclosure of contingent assets and liabilities at the date of the financial statements and the reported amounts of revenues and expenses during the reporting period. Actual results could differ from those estimates.
(3.) Fiscal Period. For purposes of presentation, we label our annual accounting period end as March 31 and our quarterly accounting period ends as June 30, September 30 and December 31. In fact, we operate and report based on quarterly periods ending on the Friday closest to month end. Fiscal year 2010 ended on April 2, 2010 and was comprised of 52 weeks. Fiscal year 2009 ended on April 3, 2009 and was comprised of 53 weeks. Fiscal year 2008 ended on March 28, 2008 and was comprised of 52 weeks.
(4.) Foreign Currency Transactions. The functional currency of our foreign subsidiary is the local currency. The financial statements of this subsidiary are translated to U.S. dollars using period-end rates of exchange for assets and liabilities and average rates of exchange for the year for revenues and expenses. Translation gains (losses) are recorded in accumulated other comprehensive income (loss) as a component of stockholders’ equity. Gains and losses resulting from foreign exchange transactions are netted and included in other income and expense and were not significant during the periods presented.
(5.) Derivative Financial Instruments. We use short-term foreign exchange forward contracts to mitigate foreign currency risk associated primarily with inter-company receivables and payables, and loan receivables (denominated in Euros) with our subsidiary in Germany. Our foreign exchange forward contracts are not designated for accounting purposes as hedging instruments under the provisions of ASC 815, Accounting for Derivative Instruments and Hedging Activities, as amended. Accordingly, any gains or losses resulting from changes in the fair value of the forward contracts are reported in other income (expense), net. The gains and losses on these forward contracts generally offset gains and losses associated with the underlying foreign currency denominated inter-company receivables and payables, and loans receivable. At March 31, 2010 and 2009, we had foreign exchange forward contracts with a maturity of less than 30 days to purchase 1.3 million Euros. The fair value of the forward contracts was not material at March 31, 2010 and 2009.
48
LASERCARD CORPORATION AND SUBSIDIARIES
NOTES TO CONSOLIDATED FINANCIAL STATEMENTS
Refer to Note 2, caption 8, Cash and Cash Equivalents, Short-term Investments and Long-term Investments of the consolidated financial statement for further discussion of our noncurrent investments.
(6.) Concentrations of Risk. Financial instruments that potentially subject LaserCard to significant concentrations of credit risk consist principally of cash, cash equivalents, short-term investments, long-term investments and accounts receivable. We place our cash, cash equivalents, short-term and long-term investments in high-credit quality financial institutions. We are exposed to credit risk in the event of default by these institutions to the extent of the amount recorded on the consolidated balance sheets. As of March 31, 2010, we held $11.9 million par value of marketable securities consisting of auction rate securities (“ARSs”) that were classified as short term investments in our consolidated balance sheet due to its trading securities classification and with a maturity of less than one year. Also included in our short-term investment is the Put Option received in this “Rights” offering from UBS Financial Services (“UBS”), recognized as a benefit with a fair value of approximately $0.8 million. UBS has the “Right” to purchase its ARSs at par at any time through July 3, 2012 and we have the “Right” to sell our ARSs at par to UBS beginning June 30, 2010 through July 3, 2012. We intend to exercise our Put Option and sell our ARSs to UBS on June 30, 2010. We have a loan from UBS in the amount of $7.9 million at March 31, 2010 under a credit line collateralized by the ARSs. As of March 31, 2009, our ARSs investment had a fair value of $12.2 million that were classified as non-current assets in our consolidated balance sheet and the Put Option was valued at $1.0 million. We had no investments in marketable securities designated as available for sale as of March 31, 2009 and it was immaterial as of March 31, 2010.
More detailed information about the reasons behind the designation and the risks we face with regard to its investment in the ARS can be found under Cash and Cash Equivalents, Short-term Investments and Long-term Investments below.
Accounts receivable are derived from revenue earned from customers primarily located in the Americas and EMEA. We perform ongoing credit evaluations of our customers’ financial condition and generally do not require collateral, however we may extend credit to certain customers without receiving financial information. We maintain reserves for potential credit losses and historically, such losses have been immaterial.
(7.) Major Customers. The following customers accounted for more than 10% of revenue for the fiscal years ended March 31 are:
|
2010
|
2009
|
2008
|
||||||||||
|
General Dynamics Information Technology (“GDIT”)
|
28 | % | 19 | % | 29 | % | ||||||
|
Gemalto N.V. (“Gemalto”)
|
19 | % | 10 | % | 14 | % | ||||||
|
DGM Sistemas, LDA
|
18 | % |
<10
|
% | - | |||||||
|
Omar K. Alessayi Communications and Space Services Company Ltd. (“ACSS”)
|
<10
|
% | 25 | % | 17 | % | ||||||
The revenue from these customers was attributable to both the OSM cards including multi-technology cards, the Drives, systems, and professional services, and Specialty cards and printers segments. No other customer accounted for more than 10% of revenue during these periods.
Two customers accounted for 28% and 17% of accounts receivable at March 31, 2010. Three customers accounted for 45%, 18%, and 10%, respectively, of accounts receivable as of March 31, 2009.
(8.) Cash and Cash Equivalents, Short-term Investments and Long-term Investments. We account for our short-term marketable securities in accordance with ASC 320, Accounting for Certain Investments in Debt and Equity Securities. We consider all highly liquid investments, consisting primarily of commercial paper, discount notes, U.S. government bonds, and ARSs, with maturities of three months or less at date of purchase, to be cash equivalents. All investments with maturities at date of purchase of more than three months or current maturities of less than one year are classified as short-term investments. Investments with current maturities of more than one year are classified as long-term investments. We determine the length of our investments after considering our cash requirements and yields available for the type of investment considered by Management. Management determines the appropriate classification of debt and equity securities at the time of purchase and reevaluates the classification of investments as of each balance sheet date. We own investments in marketable securities that have been designated as “trading securities.” Trading securities are bought and sold principally for the purpose of selling them in the near term and are reported in the financial statements at fair value. Changes in the fair value from period to period are reported as a component of net income.
49
LASERCARD CORPORATION AND SUBSIDIARIES
NOTES TO CONSOLIDATED FINANCIAL STATEMENTS
ARSs are structured with short-term interest rate reset dates of generally 28 to 35 days but with contractual maturities that are in some cases well in excess of ten years. Ninety-five and 8/10 percent (95.8%) of our investments in Student Loan Auction Rate Securities (“SLARSs”) have 95% of principal and interests guaranteed under the Federal Family Education Loan Program (“FFELP”) and are AAA rated. The remaining balance is privately financed and consists of an over-collateralized pool of graduate student loans. We believe that the credit quality of these securities is high based on the guarantees and collateralization. Until February 2008, at the end of each reset period, we could sell or continue to hold the securities at par value. This auction process historically provided a liquid market for ARSs. Since February 2008, however, auctions failed due to sell orders exceeding buy orders. The funds associated with failed auctions will not be accessible until a successful auction occurs, a buyer is found outside of the auction process, the underlying securities have matured or are recalled by the issuer, or UBS purchases them as described below. At March 31, 2010 and March 31, 2009, there was insufficient observable ARSs market information available to determine the fair value of the ARSs. Therefore, in order to validate the fair value estimate of these securities, we incorporated assumptions such as credit quality or financial standing of the issuer, final stated maturities, estimates on the probability of the issue being called prior to final maturity, impact due to extended periods of maximum auction rates, liquidity risk premium, and broker quotes from independent valuators using widely accepted financial models. Management believes that the resulting estimates are reasonable considering the unique circumstances of the subject SLARSs and the method of valuing the Put Option as forward contracts. We continue to earn interest at the contractual rate on the ARSs. As of March 31, 2010 and March 31, 2009, we held $11.9 million par value and $12.2 million, respectively, of marketable securities consisting of ARSs, which were classified as trading securities. They were classified as non-current assets in our consolidated balance sheet as of March 31, 2009 and as current assets on our balance sheet as of March 31, 2010, as we intend to exercise the Put Option and sell the ARSs to UBS on June 30, 2010.
UBS issued a prospectus dated October 7, 2008 for a “Rights” offering whereby UBS offered to purchase certain ARSs it placed, including those we hold, at par or face value. On October 29, 2008 (“Acceptance Date”), we submitted the acceptance form to participate in the “Rights” offering. UBS has the “Right” to purchase its ARSs at par at any time through July 3, 2012 and we have the “Right” to sell our ARSs at par to UBS beginning June 30, 2010 through July 3, 2012. As part of the offering, UBS offered a line of credit of about 75% of the fair value of the ARSs, as calculated by UBS, until they are purchased by UBS. The line of credit has certain restrictions described in the prospectus. We had borrowed a total outstanding amount of $7.9 million as of March 31, 2010, a decrease of $0.8 million from its balance as of March 31, 2009 of $8.7 million.
The “Rights” represent a firm agreement in accordance with ASC 815, Accounting for Derivative Instruments and Hedging Activities, which defines a firm agreement as an agreement with an unrelated party, binding on both parties and usually legally enforceable, with the following characteristics: a) the agreement specifies all significant terms, including the quantity to be exchanged, the fixed price, and the timing of the transaction, and b) the agreement includes a disincentive for nonperformance that is sufficiently large to make performance probable. The enforceability of the “Rights” results in a Put Option and should be recognized as a free standing derivative separate from the ARSs. By electing to participate in the Rights offering, we granted UBS the right, exercisable at any time prior to July 3, 2012, to purchase or cause the sale of its ARSs (the “Call Right”). UBS has agreed to pay us the par value of its ARSs within one day of settlement of any Call Right transaction. Notwithstanding the Call Right, we are permitted to sell ARSs to other parties besides UBS, in which case the Put Rights attached to the ARSs that are sold would be extinguished. Management elected to adopt ASC 825, The Fair Value Option for Financial Assets and Financial Liabilities, on December 31, 2008 on the Put Option and elected to change its treatment of the ARS portfolio from available-for-sale securities to trading securities. During the fiscal year ended March 31, 2010, we recognized a $0.3 million gain due to the change in fair value of the ARSs investment and the Put Option. We reclassified these investments from non-current assets on March 31, 2009 to current assets on March 31, 2010 to reflect management’s intent to exercise the Put Option on June 30, 2010. We believe that we will recover the value of the ARSs at par on June 30, 2010 when we intend to exercise the Put Option with UBS. For the fiscal year ended March 31, 2009, we recorded a net loss of about $0.3 million resulting from the fair values of the ARSs and the Put Option. We fully recovered our loss during fiscal year 2010 as the UBS credit assumptions improved.
50
LASERCARD CORPORATION AND SUBSIDIARIES
NOTES TO CONSOLIDATED FINANCIAL STATEMENTS
Cash equivalents and investments consist of the following (in thousands)
|
March 31, 2010
|
||||||||||||||||
|
Gross
|
Gross
|
|||||||||||||||
|
Unrealized
|
Unrealized
|
Estimated
|
||||||||||||||
|
Cost
|
Gains
|
Losses
|
Fair Value
|
|||||||||||||
|
Cash and cash equivalents
|
$ | 33,180 | $ | - | $ | - | $ | 33,180 | ||||||||
|
Short-term investments-ARS & other
|
11,907 | * | - | (813 | ) | 11,094 | ||||||||||
|
Put Option
|
- | 813 | - | 813 | ||||||||||||
| $ | 45,087 | $ | 813 | $ | (813 | ) | $ | 45,087 | ||||||||
| * Redeemed $1,600 | ||||||||||||||||
|
March 31, 2009
|
||||||||||||||||
|
Gross
|
Gross
|
|||||||||||||||
|
Unrealized
|
Unrealized
|
Estimated
|
||||||||||||||
|
Cost
|
Gains
|
Losses
|
Fair Value
|
|||||||||||||
|
Cash and cash equivalents
|
$ | 14,400 | $ | - | $ | - | $ | 14,400 | ||||||||
|
Short-term investment
|
174 | - | - | 174 | ||||||||||||
|
Long-term investments-ARS
|
13,500 | - | (1,267 | ) | 12,233 | |||||||||||
|
Put Option
|
- | 1,006 | - | 1,006 | ||||||||||||
| $ | 28,074 | $ | 1,006 | $ | (1,267 | ) | $ | 27,813 | ||||||||
(9.) Fair Value of Measurements. Effective April 1, 2008, we adopted ASC 820, Fair Value Measurements, except as it applies to the nonfinancial assets and nonfinancial liabilities subject to FSP 157-2. ASC 820 clarifies that fair value is an exit price, representing the amount that would be received to sell an asset or paid to transfer a liability in an orderly transaction between market participants. As such, fair value is a market-based measurement that is determined based on assumptions that market participants would use in pricing an asset or a liability. As a basis for considering such assumptions, ASC 820 establishes a three-tier value hierarchy, which prioritizes the inputs used in the valuation methodologies in measuring fair value:
|
|
Level 1 - Observable inputs that reflect quoted prices (unadjusted) for identical assets or liabilities in active markets.
|
|
|
Level 2 - Include other inputs that are directly or indirectly observable in the marketplace.
|
|
|
Level 3 - Unobservable inputs which are supported by little or no market activity.
|
The fair value hierarchy also requires an entity to maximize the use of observable inputs and minimize the use of unobservable inputs when measuring fair value.
In accordance with ASC 820, we measure our cash equivalents and marketable securities at fair value. Cash equivalents and marketable securities are primarily classified within Level 1 with the exception of our investments in ARSs, which are classified within Level 3. Cash equivalents and marketable securities are valued primarily using quoted market prices utilizing market observable inputs. Our investments in ARSs are classified within Level 3 because there are no active markets for the ARSs and therefore we are unable to obtain independent valuations from market sources. Therefore, the ARSs were valued using a discounted cash flow model. Some of the inputs to the cash flow model are unobservable in the market. The total amount of assets measured using Level 3 valuation methodologies represented 15% of total assets as of March 31, 2010.
51
LASERCARD CORPORATION AND SUBSIDIARIES
NOTES TO CONSOLIDATED FINANCIAL STATEMENTS
The table below shows, by level, financial assets that were accounted for at fair value as of March 31, 2010. The table does not include assets and liabilities which are measured at historical cost or any basis other than fair value (in thousands):
|
March 31, 2010
|
||||||||||||
|
Items measured at fair value on a recurring basis:
|
Portion of
Carrying Value Measured at Fair Value |
Level 1
|
Level 3
|
|||||||||
|
Cash equivalents: Money Market funds
|
$ | 31,977 | $ | 31,977 | $ | - | ||||||
|
Short-term investments: Auction Rate Securities & other
|
11,094 | 7 | 11,087 | |||||||||
|
Short-term investments: Put Option
|
813 | - | 813 | |||||||||
| $ | 43,884 | $ | 31,984 | $ | 11,900 | |||||||
|
March 31, 2009
|
||||||||||||
|
Items measured at fair value on a recurring basis:
|
Portion of
Carrying Value Measured at Fair Value |
Level 1
|
Level 3
|
|||||||||
|
Cash equivalents: Money Market funds
|
$ | 14,400 | $ | 14,400 | $ | - | ||||||
|
Short-term investmetns: Other
|
174 | 174 | - | |||||||||
|
Long-term investments: Auction Rate Securities
|
12,233 | - | 12,233 | |||||||||
|
Long-term investments: Put Option
|
1,006 | - | 1,006 | |||||||||
| $ | 27,813 | $ | 14,574 | $ | 13,239 | |||||||
The table below summarizes the change in fair values for Level 3 item as of March 31, 2010. The table does not include assets and liabilities which are measured at historical cost or any basis other than fair value (in thousands):
|
Auction Rate Securities
|
||||||||
|
March 31, 2010
|
March 31, 2009
|
|||||||
|
Balance at beginning of period
|
$ | 13,239 | $ | 12,875 | ||||
|
Redeemed at par
|
(1,600 | ) | - | |||||
|
Unrealized gain (loss) on FV of ARS included in income
|
340 | (1,267 | ) | |||||
|
Unrealized gain (loss) on FV of put option included in income
|
(79 | ) | 1,006 | |||||
|
Reversal of unrealized loss associated with transfer of securities to trading
|
625 | |||||||
|
Balance at end of period
|
$ | 11,900 | $ | 13,239 | ||||
52
LASERCARD CORPORATION AND SUBSIDIARIES
NOTES TO CONSOLIDATED FINANCIAL STATEMENTS
(10.) Accounts Receivable. Accounts receivable are net of allowance for doubtful accounts of $37,000 and $59,000 as of March 31, 2010 and 2009, respectively. We maintain allowances for doubtful accounts and product return reserves for anticipated losses resulting from the inability of our customers to make required payments and product returns. We generally compute our allowances based on specifically identifying accounts that are past due that are likely not collectible. Interest receivable is accrued from investments in ARSs and other interest-bearing securities. Other receivables are comprised of value added tax refunds and miscellaneous items. The components of accounts receivable as of March 31 are (in thousands):
|
March 31,
|
March 31,
|
||||||||
|
2010
|
2009
|
||||||||
|
Trade receivables
|
$ | 4,177 | $ | 10,193 | |||||
|
Allowance for doubtful accounts
|
(37 | ) | (59 | ) | |||||
|
Interest receivable
|
7 | 6 | |||||||
|
Other receivables
|
10 | 77 | |||||||
|
Total net receivables
|
$ | 4,157 | $ | 10,217 | |||||
(11.) Inventories. Inventories are stated at the lower of cost or market, with cost determined on a first-in, first-out basis and market based on replacement cost or estimated realizable value less cost to sell. The components of inventories as of March 31 are (in thousands):
| 2010 | 2009 | Change | |||||||||||
|
Raw materials
|
$ | 6,323 | $ | 6,996 | $ | (673 | ) | ||||||
|
Work-in-process
|
975 | 1,444 | (469 | ) | |||||||||
|
Finished goods
|
4,028 | 5,792 | (1,764 | ) | |||||||||
|
Total inventories, net
|
$ | 11,326 | $ | 14,232 | $ | (2,906 | ) | ||||||
Management establishes lower of cost or market reserves, excess and obsolescence reserves. Inventory reserves are generally recorded when management determines that an item does not have a foreseeable revenue forecast. Inventory reserves are not relieved until the related inventory has been sold or scrapped. For the fiscal years ended March 31, 2010, 2009 and 2008, we recorded inventory reserve expense of $1,858,000, $352,000, and $53,000, respectively, mainly due to obsolescence.
(12.) Equipment Held for Resale. Equipment held for resale consists primarily of parts, labor costs and other costs incurred to build equipment under contracts from which we have recorded $24.5 million in non-refundable advance payments and $3.3 million in deferred revenue as of March 31, 2010 and 2009. Direct incremental costs associated with the purchase or construction of these items is deferred until the related deferred revenue is recognized.
The components of equipment held for resale as of March 31 are (in thousands):
|
2010
|
2009
|
Change
|
|||||||||||
|
Parts
|
$ | 5,470 | $ | 5,463 | $ | 7 | |||||||
|
Labor costs
|
1,571 | 1,485 | 86 | ||||||||||
|
Other
|
113 | 114 | (1 | ) | |||||||||
|
Total equipment held for resale
|
$ | 7,154 | $ | 7,062 | $ | 92 | |||||||
53
LASERCARD CORPORATION AND SUBSIDIARIES
NOTES TO CONSOLIDATED FINANCIAL STATEMENTS
(13.) Property and Equipment, Net. The components of property and equipment as of March 31 (in thousands):
|
2010
|
2009
|
Change
|
||||||||||
|
Building and land
|
$ | 900 | $ | 887 | $ | 13 | ||||||
|
Equipment and furniture
|
26,538 | 26,001 | 537 | |||||||||
|
Construction in progress, including purchased equipment
|
563 | 338 | 225 | |||||||||
|
Leasehold improvements
|
5,312 | 5,201 | 111 | |||||||||
| 33,313 | 32,427 | 886 | ||||||||||
|
Less: accumulated depreciation and amortization
|
(23,904 | ) | (21,555 | ) | (2,349 | ) | ||||||
|
Total property and equipment, net
|
$ | 9,409 | $ | 10,872 | $ | (1,463 | ) | |||||
Property and equipment are recorded at cost. Depreciation is provided over the estimated useful lives which are four to seven years for equipment and furniture using the straight-line method and twenty-five years for the building using the straight-line method. Leasehold improvements are amortized over the shorter of the life of the asset or the life of the lease using the straight-line method. Depreciation and leasehold amortization expense for fiscal years 2010, 2009, and 2008 was $2.7 million, $2.8 million and $2.9 million, respectively. Maintenance and minor repairs and replacements are expensed when incurred. Disposition or retirement of property and equipment related gains and losses are charged to other income and expense.
(14.) Other Intangible Assets. Definite life intangible assets capitalized and accumulated amortization as of March 31 (in thousands):
|
2010
|
2009
|
Change
|
||||||||||
|
Patent expenditures
|
$ | 3,811 | $ | 3,795 | $ | 16 | ||||||
|
Technology transfer expenditures
|
545 | 545 | - | |||||||||
|
Total patent and other intangible expenditures
|
4,356 | 4,340 | 16 | |||||||||
|
Patent accumulated amortization
|
(3,504 | ) | (3,395 | ) | (109 | ) | ||||||
|
Technology transfer accumulated amortization
|
(545 | ) | (545 | ) | - | |||||||
| (4,049 | ) | (3,940 | ) | (109 | ) | |||||||
|
Amortizable patents and other intangibles, net
|
$ | 307 | $ | 400 | $ | (93 | ) | |||||
The weighted average remaining amortization periods for the fiscal years ended March 31 (in years):
|
2010
|
2009
|
||||||||
|
Patents
|
2.8 | 3.3 | |||||||
Legal expenses incurred in connection with patents are capitalized and amortized over the estimated remaining useful lives of the patents to seven years. Amortization expense on intangible assets for fiscal years 2010, 2009 and 2008 was $109,000, $128,000 and $125,000, respectively. The estimated amortization expense for each of the next five years on patents and other intangible assets with definite lives for the years ended March 31 (in thousands):
|
2011
|
2012
|
2013
|
2014
|
2015
|
||||||||||||||||
|
Patent amortization expense
|
$ | 73 | $ | 58 | $ | 41 | $ | 24 | $ | 8 | ||||||||||
54
LASERCARD CORPORATION AND SUBSIDIARIES
NOTES TO CONSOLIDATED FINANCIAL STATEMENTS
(15.) Assessment of Impairment of Tangible and Intangible Long-Lived Assets. In accordance with ASC 360, Accounting for the Impairment or Disposal of Long-Lived Assets, we assess the impairment of long-lived assets whenever events or changes in circumstances indicate that their carrying value may not be recoverable from the estimated future cash flows expected to result from their use and eventual disposition. Our long-lived assets subject to this evaluation include property and equipment and amortizable intangible assets. If our estimate of future undiscounted net cash flows is insufficient to recover the carrying value of the assets, we will record an impairment loss in the amount by which the carrying value of the assets exceeds the fair value. If assets are determined to be recoverable but the useful lives are shorter than originally estimated, we depreciate or amortize the net book value of the asset over the newly determined remaining useful lives. As of March 31, 2010, the fair value of long-lived assets exceeds their book value. We disposed of obsolete equipment which resulted in an immaterial loss recorded in cost of goods sold during fiscal year 2010. We disposed of obsolete equipment totaling approximately $1.5 million and recorded a loss of $0.3 million for parts tooling for a discontinued device recorded in costs of goods sold in fiscal year 2009. At March 31, 2010, based on our estimated future cash flow analysis and having had no triggering events such as a significant disposal of a portion of such assets, an adverse change in the market involving the business employing the related asset or a significant decrease in the benefits realized from an acquired business, management has determined that the fair value of long-lived assets exceeded their book value.
(16.) Accrued Liabilities. The components of accrued liabilities as of March 31, (in thousands):
|
2010
|
2009
|
Change
|
||||||||||
|
Bonus and performance incentive accrual
|
$ | 2,136 | $ | - | $ | 2,136 | ||||||
|
Other accrued liabilities
|
971 | 1,091 | (120 | ) | ||||||||
|
Accrued compensated absences
|
584 | 625 | (41 | ) | ||||||||
|
Sales commission accrual
|
480 | 483 | (3 | ) | ||||||||
|
Accrued payroll and fringe benefits
|
243 | 297 | (54 | ) | ||||||||
|
Warranty reserves
|
125 | 561 | (436 | ) | ||||||||
|
Deferred compensation
|
- | 340 | (340 | ) | ||||||||
|
Total accrued liabilities
|
$ | 4,539 | $ | 3,397 | $ | 1,142 | ||||||
Approximately $2.6 million was accrued at March 31, 2010 for performance-based incentives and sales commissions, as compared to $0.5 million of sales commissions accrued at March 31, 2009. There was no performance-based incentive accrued at March 31, 2009. The deferred compensation accrual related to the Planned Retirement Agreement with our former Chief Executive Officer and President was zero at March 31, 2010 and $340,000 at March 31, 2009.
LaserCard provides a limited warranty for the replacement of defective products. Where appropriate, provision is made at the time of shipment for estimated warranty costs. Our limited warranty specifies that we will repair or replace defective products at no cost to the customer within a specified time period after sale. We estimate the costs that may be incurred under our limited warranty and record a liability in the amount of such costs at the time product revenue is recognized. Factors that affect the estimate of warranty liability include the number of units sold, and historical and anticipated rates of warranty claims. We assess the adequacy of the recorded warranty liability quarterly and adjust the amount as necessary. We utilize historical trends and information received from our customers to assist in determining the appropriate estimated warranty accrual levels. Adjustments to the provision are made when actual return claim experience differs from estimates.
Warranty activities for the fiscal years ended March 31 are (in thousands):
|
2010
|
2009
|
2008
|
||||||||||
|
Beginning balance
|
$ | 561 | $ | 655 | $ | 743 | ||||||
|
Accruals for products sold
|
(14 | ) | 67 | 147 | ||||||||
|
Settlements
|
(422 | ) | (161 | ) | (235 | ) | ||||||
|
Ending balance
|
$ | 125 | $ | 561 | $ | 655 | ||||||
55
LASERCARD CORPORATION AND SUBSIDIARIES
NOTES TO CONSOLIDATED FINANCIAL STATEMENTS
(17.) Software Development Costs. Development costs incurred in the research and development of new software products for general distribution are expensed as incurred until technological feasibility in the form of a working model has been established. To date, our software development has been completed concurrent with the establishment of technological feasibility and, accordingly, all software development costs that do not meet capitalization criteria are charged to research and development expenses in the accompanying consolidated statements of operations. Software development costs incurred in the execution of contract obligations are capitalized and charged to cost of goods sold at the time the related revenue is recorded. There was no capitalized software cost as of March 31, 2010 and 2009.
(18.) Advance Payments from Customers or Deferred Revenue. We routinely receive advance payments on orders placed by our customers. The advance payments are recorded as a liability on the consolidated balance sheets until the related orders are shipped or services are performed or revenue would otherwise be recognized. Advance payments of approximately $24.5 million from Prevent Global družba za upravljanje, investicije in razvoj d.d. (“Prevent Global”), were classified as a noncurrent liability in the consolidated balance sheet at March 31, 2010 and March 31, 2009, as there is no certainty that this project will be completed within twelve months. The remaining advance payments were for orders expected to be completed within the first quarter of fiscal year 2011. Amounts billed to or collected from customers that cannot be recognized as revenue at the time of billing or collection on the basis that they have not met the general conditions for revenue recognition are classified as Deferred Revenue recorded as a liability on the consolidated balance sheets. Deferred revenues should represent the portion of the amount billed to or collected from the customer that is expected to ultimately be recognized as revenue. Our deferred revenue was $3.8 million and $4.4 million at March 31, 2010 and 2009, respectively, largely due to the $3.3 million of licensing and other fees related to Prevent Global.
(19.) Revenue Recognition. Product sales primarily consist of OSM card sales, sales of Drives, systems and professional services and sales of Specialty cards and card printers. We recognize revenue from product sales when the following criteria are met: (1) persuasive evidence of an arrangement exists; (2) delivery has occurred; (3) the fee is fixed or determinable; and (4) collectibility is reasonably assured. We recognize revenue on product sales at the time of shipment when shipping terms are F.O.B. shipping point, orders are placed pursuant to a pre-existing sales arrangement and there are no post-shipment obligations other than customer acceptance criteria or, in the case of a U.S. government contract, warehousing. Where appropriate, provision is made at the time of shipment for estimated warranty costs and estimated returns.
The subcontract for Permanent Resident cards for the U.S. government requires delivery into a secure LaserCard-controlled vault. Shipments are later made from the vault to a U.S. government site. The subcontract provides that the U.S. government is to take final delivery of any and all of its remaining inventory within six months of the end of the contract. At the time the cards are delivered into the vault, title to the cards is transferred to the U.S. government and all risks of ownership are transferred as well. The prime contractor is invoiced, with payment due within thirty days. Purchase orders do not contain any return (other than for warranty) or cancellation provisions. Pursuant to the provisions of SEC Staff Accounting Bulletin No. 605 ― Revenue Recognition (“ASC 605”), revenue is recognized on delivery into the vault as we have then fulfilled our contractual obligations and the earnings process is complete.
For contracts that include customer-specified acceptance criteria, we recognize revenue only after the acceptance criteria have been met and presuming that all other revenue criteria have been met. We defer revenue from services and recognize it over the contractual period or as we render services and the customer accepts them.
We apply the provisions of ASC 605-25, Revenue Arrangements with Multiple Deliverables, to revenue arrangements with multiple deliverables. ASC 605-25 provides criteria governing how to identify whether goods or services that are to be delivered separately in a bundled sales arrangement should be accounted for separately. Deliverables are accounted for separately if they meet all of the following criteria: a) the delivered items have stand-alone value to the customer; b) the fair value of any undelivered items can be reliably determined; and c) if the arrangement includes a general right of return, delivery of the undelivered items is probable and substantially controlled by the seller. In situations where the deliverables fall within higher-level literature as defined by ASC605-25, we apply the guidance in that higher-level literature. Deliverables that do not meet these criteria are combined with one or more other deliverables.
56
LASERCARD CORPORATION AND SUBSIDIARIES
NOTES TO CONSOLIDATED FINANCIAL STATEMENTS
We apply the provisions of ASC 605-35, Accounting for Performance of Construction-Type and Certain Production-Type Contracts, in applicable contracts. Revenues on time and materials contracts are recognized as services are rendered at contract labor rates plus material and other direct costs incurred. Revenues on fixed price contracts are recognized on the percentage of completion method based on the ratio of total costs incurred to date compared to estimated total costs to complete the contract. Estimates of costs to complete include material, direct labor, overhead and allowable general and administrative expenses. In circumstances where estimates of costs to complete a project cannot be reasonably estimated, but it is assured that a loss will not be incurred, the percentage-of-completion method based on a zero profit margin, rather than the completed-contract method, is used until more precise estimates can be made. The full amount of an estimated loss is charged to operations in the period it is determined that a loss will be realized from the performance of a contract. A long-term program accounted for under ASC 605-35 concluded during the last quarter of fiscal year 2009 with revenue of approximately $540,000. For the year ended March 31, 2008, we recognized revenue of approximately $249,000 based on a zero profit margin.
We supply cards for the centralized issuance of enhanced OSM cards for the national ID card program in the Kingdom of Saudi Arabia. We recognize revenue upon shipment of cards under the terms of this subcontract. We recognized revenue of approximately $6.5 million and $0.9 million for this subcontract during fiscal year 2010 and 2009, respectively. Under an earlier subcontract with a prime contractor for the Kingdom of Saudi Arabia, we provided card personalization work station integration for use in that country’s national ID card program with decentralized card issuance including OSM cards, hardware, and software. During the three-month period ended June 30, 2009, we were informed that no additional cards would be purchased under this subcontract. The subcontract called for multiple deliverables, installation, and certain client acceptance criteria, as defined in the agreement. In applying the guidance within ASC 605-25, we determined the deliverables are not to be accounted for as separate units, but rather as a bundled arrangement since the fair value of the undelivered items could not be readily determined. Due to the contract close-out for decentralized card issuance, we recognized as revenue all remaining deferred revenue during fiscal year 2010. We recognized revenue totaling $1.3 million, $12.2 million, and $6.3 million in fiscal years 2010, 2009, and 2008, respectively, under this subcontract.
We apply the provisions of ASC 605-15, Software Revenue Recognition With Respect to Certain Transactions, to all transactions involving the sale of software products. Revenue from the license of our software products is recognized when persuasive evidence of an arrangement exists, the software product has been delivered, the fee is fixed or determinable and collectability is probable, and, if applicable, upon acceptance when acceptance criteria are specified or upon expiration of the acceptance period. Software revenue was immaterial for fiscal years 2010, 2009 and 2008.
We entered into license and optical memory card (“OMC”) equipment purchase and support agreements, effective April 3, 2004, with GIG, based in Auckland, New Zealand, for OMC card manufacturing in Slovenia. GIG transferred the license and other agreements, with our approval, to Prevent Global in March 2007. The agreements provide for payments (other than interest on late payments) to us of about $29 million, for a 20-year license, the required manufacturing equipment for a targeted initial manufacturing capacity of 10 million OMCs annually and installation support, and a four-year training and support package. Of the $27.8 million we have received, $24.5 million was recorded as advance payments from the customer and $3.3 million for the licensing and other fees was recorded as deferred revenue. Both were classified as long term liabilities in the consolidated balance sheets. As of March 31, 2010, we held $7.2 million of acquired equipment, including direct and incremental expenses, classified as equipment held for resale on our consolidated balance sheets related to this contract as compared with $7 million on March 31, 2009. We are to ship this equipment to Prevent Global upon their request after a suitable facility is established by Prevent Global. We will inspect the facility when requested to assure it has the necessary services available for installation of the equipment. At this time, we do not know when Prevent Global will initiate such a request. Beginning April 1, 2008, the agreement provides for payments by Prevent Global of $3.0 million for a three-year support package, and options for thirteen additional years of support for payments of $1 million annually. In addition, Prevent Global is to pay royalties of $0.60 per card for each card produced under the license. The non-exclusive territories covered by the license include most of the European Union and Eastern European regions. We retain rights to utilize up to 20% of the new facility capacity as backup and a capacity buffer to augment our own card manufacturing facilities. The granting of this license to Prevent Global establishes a potential manufacturing facility supplier of OMCs for existing and prospective customers who may request multiple sources for cards. In accordance with ASC 605-25, Revenue Arrangements with Multiple Deliverables, the card manufacturing license, sale and installation of equipment, training and support package, have been accounted for as one unit of accounting, since we were unable to determine evidence of the fair value for the undelivered items other than ongoing support. We are able to determine evidence of fair value for the last predominant item to be delivered, which is the ongoing annual support. Accordingly, revenues for the arrangement have been deferred and will be recognized when the equipment is installed and accepted, with the exception of the value of the ongoing annual support of the manufacturing equipment which will be recognized quarterly as earned, beginning when the equipment is accepted and training has been completed, which date is dependent on Prevent Global establishing a suitable facility in Slovenia. Pursuant to ASC 605-20, Accounting for Separately Priced Extended Warranty and Product Maintenance Contracts, the support revenue will be recognized ratably over twelve months. During the fourth quarter of calendar year 2008, we began the training of employees prior to the expected transfer of the manufacturing equipment to a to-be-built facility in Slovenia. Since that time, GIG has asserted rights under the contract and Prevent Global has been reviewing this project to determine their next steps. We filed a claim in September 2009 in the United Kingdom requesting the court to designate who is the rightful counter-party such that we can proceed with the administration of this contract. Refer to risk factor, “We Sold a Card Manufacturing License Under Which We Will Provide Certain Factory Set-Up and Training Services in Slovenia to Global Investment Group Ltd. (“GIG”) in Conjunction With Prevent Global of Slovenia (“Prevent Global”). Neither GIG nor Prevent Global Are Current With the Obligations Under the Agreement” for more details.
57
LASERCARD CORPORATION AND SUBSIDIARIES
NOTES TO CONSOLIDATED FINANCIAL STATEMENTS
(20.) Research and Development Expenses. Costs related to research, design and development of products are charged to research and development expense as incurred. Research and development costs include salaries, contractor fees, building and utility costs, and depreciation.
(21.) Shipping and Handling Costs. We report shipping and handling costs in both the sales and the related cost of goods sold to the extent that they are billed to customers. In all other instances, they are reflected as a component of cost of goods sold.
(22.) Advertising Costs. Advertising costs consist of development and placement costs of advertising campaigns and are charged to expense when incurred. Advertising expense was approximately $234,000 for fiscal year 2010, $250,000 for fiscal year 2009, and $212,000 for fiscal year 2008.
(23.) Stock-based Compensation. Effective April 1, 2006, we adopted Share-Based Payment (ASC 718), which requires share-based payment transactions to be accounted for using a fair value based method and the recognition of the related expense in the results of operations. Prior to the adoption of ASC 718, we accounted for share-based payments to employees in accordance with Accounting Principles Board Opinion (“APB”) No. 25, Accounting for Stock Issued to Employees, utilizing the intrinsic value method. Therefore, we did not recognize compensation cost for employee and director stock options because there was no intrinsic value. ASC 718 allows companies to choose one of two transition methods: the modified prospective transition method or the modified retrospective transition method. We adopted ASC 718 using the modified prospective method of transition which requires compensation expense related to share-based payments to be recognized beginning on the adoption date over the requisite service period, generally the vesting period, for awards granted after April 1, 2006 and over the remaining service period for the unvested portion of awards granted prior to April 1, 2006. The consolidated financial statements for prior fiscal years have not been restated to reflect the impact of adopting ASC 718. The 2004 Equity Incentive Compensation Plan, as amended, (the “2004 Plan”) from which awards are granted is described more fully in Note 6, Common Stock of the consolidated financial statement.
With the adoption of ASC 718, we recorded stock-based employee compensation expense related to stock options, restricted stock units, and restricted shares net of estimated forfeitures in our consolidated statements of operations allocated as follows:
|
2010
|
2009
|
2008
|
||||||||||
|
Cost of sales
|
$ | 591 | $ | 670 | $ | 336 | ||||||
|
Selling, general and administrative expense
|
1,523 | 1,482 | 1,369 | |||||||||
|
Research and development expense
|
78 | 121 | 256 | |||||||||
|
Net stock-based compensation expense
|
$ | 2,192 | $ | 2,273 | $ | 1,961 | ||||||
We did not capitalize any such costs in the consolidated balance sheets other than in the general overhead pool for inventory costs.
58
LASERCARD CORPORATION AND SUBSIDIARIES
NOTES TO CONSOLIDATED FINANCIAL STATEMENTS
As of March 31, 2010, about $2.7 million of total unrecognized compensation cost related to unvested stock options, restricted share awards and restricted stock units is expected to be recognized over the remaining vesting period through December 31, 2013. As of March 31, 2009, about $4.3 million of total unrecognized compensation cost related to unvested stock options, restricted share awards and restricted stock units was expected to be recognized over the remaining vesting period through August 2012. We recorded no income tax benefit on stock-based compensation expense for the fiscal years ended March 31, 2010, 2009, and 2008, as we have cumulative operating loss carryforwards, for which a full valuation allowance has been established.
The ASC 718, Transition Election Related to Accounting for the Tax Effects of Share-Based Payment Awards requires an entity to follow either the transition guidance for the additional-paid-in-capital (“APIC”) pool as prescribed in ASC 718 or the alternative transition method described in FSP No. 123R-3. An entity that adopts ASC 718 using the modified prospective application may make a one-time election to adopt the transition method described in the ASC 718, and may take up to one year from the latter of its initial adoption of ASC 718 or the effective date of the ASC 718 to evaluate the available transition alternatives and make its one-time election. We have elected to use the simplified method provided for in ASC 718 to calculate our APIC pool effective April 1, 2007. The adoption of the ASC did not have a material impact on our consolidated financial position, results of operations or cash flows.
(24.) Income Taxes. Income taxes are accounted for in accordance with ASC 740, Accounting for Income Taxes, which requires the use of the asset and liability method. Under this method, deferred tax assets and liabilities are determined based upon the differences between the financial reporting and the tax bases of assets and liabilities and are measured using enacted tax rules and laws that are anticipated to be in effect when the differences are expected to reverse. Net deferred tax assets are reduced by a valuation allowance to the extent that realization of the related deferred tax asset is not assured. We recorded a valuation allowance for the full amount of our calculated deferred tax asset as of March 31, 2010 and 2009. Refer to Note 8, Income Taxes of the consolidated financial statement for further discussion.
(25.) Comprehensive Income (Loss). Under ASC 220, Reporting Comprehensive Income, comprehensive income (loss) is defined as the changes in equity of an enterprise except for those resulting from stockholders’ transactions. Comprehensive income (loss) for the fiscal years ended March 31 (in thousands):
|
2010
|
2009
|
2008
|
||||||||||
|
Net income (loss)
|
$ | 5,992 | $ | (940 | ) | $ | (7,206 | ) | ||||
|
Net change in cumulative foreign currency translation adjustments
|
(5 | ) | (118 | ) | 96 | |||||||
|
Unrealized loss on available-for-sale investments
|
- | 625 | (625 | ) | ||||||||
|
Comprehensive income (loss)
|
$ | 5,987 | $ | (433 | ) | $ | (7,735 | ) | ||||
(26.) Commitments and Contingencies.
Litigation. On October 9, 2009, we filed a claim against GIG and Prevent Global in the English High Court of Justice, Commercial Court. The claim relates to a series of agreements that we entered into in 2004 with GIG for a turn-key project in Slovenia to enable GIG to manufacture and distribute optical cards (the “Agreements”). In 2007, GIG assigned all of its rights, title and interest in the Agreements (including rights to equipment we hold) to Prevent Global and Prevent Global agreed to assume all of the obligations under the Agreements. However, a dispute has arisen regarding whether Prevent Global or GIG (i) is obliged to make payments owed to us under the Agreements; (ii) has title to certain equipment under the Agreements; and (iii) is subject to and bound by the arbitration provisions contained in the Agreements. We therefore are seeking a declaration from the English Court on these questions and awaiting responses from both GIG and Prevent Global. We expect the court to provide its ruling by August 2010.
Purchase Obligations. We have agreements with suppliers and other parties to purchase inventory, other goods and services. Noncancelable obligations under these agreements at March 31, 2010 for the first quarter of fiscal year 2011 were approximately $1.9 million.
59
LASERCARD CORPORATION AND SUBSIDIARIES
NOTES TO CONSOLIDATED FINANCIAL STATEMENTS
Leases. As of March 31, 2010, we lease approximately 70,000 square feet of floor space on a long-term basis for card manufacturing, read/write drive production, administration, sales, and research and development in two buildings located in Mountain View, California. One 27,000-square foot building is used for OSM card production and one 43,000 square-foot building is used for optical card production, read/write drive production, administration, sales, and research and development. These leases will expire in October 2013 and in March 2014 and include ten-year extension options. Upon expiration of the leases, we believe that these or other suitable buildings will be available to be leased on a reasonable basis. We lease a portion of a building in Ratingen, Germany, and a building in Rastede, Germany, totaling approximately 15,000 square feet, for optical and specialty card manufacturing, distribution, administration and sales. One of these leases is terminable by both parties upon six-month notice and the other will expire in March 2012. Also, we own land and an approximately 14,000 square foot building in Rastede, Germany that is used in production of specialty cards and research and development. We also lease a 900 square-foot office in Huntington, New York for marketing activities, which lease will expire in December 2010. We believe these leased and owned facilities to be satisfactory for our present operations. Upon expiration of the leases, we believe that these or other suitable buildings will be available to be leased on a reasonable basis. We lease certain equipment under capital lease agreements that expire at various dates through 2011.
The future minimum lease payments for all capital leases and operating leases were as follows (in thousands):
|
2011
|
2012
|
2013
|
2014
|
2015
|
Total
|
|||||||||||||||||||
|
Non-cancelable operating leases (1)
|
$ | 1,909 | $ | 1,840 | $ | 1,730 | $ | 1,457 | $ | 14 | $ | 6,950 | ||||||||||||
|
Non-cancelable purchase orders
|
1,857 | — | — | — | — | 1,857 | ||||||||||||||||||
|
Net borrowing on revolving credit with UBS (2)
|
7,865 | — | — | — | — | 7,865 | ||||||||||||||||||
|
Total
|
$ | 11,631 | $ | 1,840 | $ | 1,730 | $ | 1,457 | $ | 14 | $ | 16,672 | ||||||||||||
|
(1) Includes capitalized leases
|
|
(2) For the purposes of this table, the obligation has been calculated without interest obligations
|
Net Borrowing with UBS. Refer to Note 2, caption 8, Cash and Cash Equivalents, Short-term and Long-term Investments of the consolidated financial statement for further discussion on our net borrowing with UBS.
3. Net income (loss) per Share
Basic earnings per share was computed by dividing net income by the weighted-average number of common shares outstanding during the fiscal year ended March 31, 2010. Diluted earnings per share during the fiscal year ended March 31, 2010 was computed by dividing net income by the weighted-average number of common shares outstanding plus dilutive common stock equivalents, primarily shares issuable upon the exercise of stock options using the treasury stock method. Antidilutive securities include outstanding stock options with exercise prices in excess of the average fair market value of LaserCard’s common stock for the related period. Antidilutive options excluded from the calculation of diluted net income per share but that could become dilutive in the future for the fiscal year ended March 31, 2010 were 2 million shares. Basic net loss per share and diluted net loss per share were computed by dividing net loss by the weighted average number of shares of common stock outstanding during the fiscal years ended March 31, 2009 and 2008.
60
LASERCARD CORPORATION AND SUBSIDIARIES
NOTES TO CONSOLIDATED FINANCIAL STATEMENTS
The reconciliation of the denominators of the basic and diluted net loss per share computation for the fiscal years ended March 31, (in thousands, except per share data):
|
2010
|
2009
|
2008
|
||||||||||
|
Net income (loss)
|
$ | 5,992 | $ | (940 | ) | $ | (7,206 | ) | ||||
|
Basic net income (loss) per share:
|
||||||||||||
|
Weighted average common shares outstanding
|
12,189 | 12,052 | 11,929 | |||||||||
|
Basic net income (loss) per share
|
$ | 0.49 | $ | (0.08 | ) | $ | (0.60 | ) | ||||
|
Diluted net income (loss) per share:
|
||||||||||||
|
Weighted average common shares and common stock
|
||||||||||||
|
equivalents outstanding
|
12,226 | 12,052 | 11,929 | |||||||||
|
Diluted net income (loss) per share
|
$ | 0.49 | $ | (0.08 | ) | $ | (0.60 | ) | ||||
4. Segments
Segment Reporting.
We operate in three reportable segments: (1) OSM cards, (2) Drives, systems and professional services including read/write drives, maintenance, systems and professional services, and (3) Specialty cards and card printers. The segments were determined based on the information used by the chief operating decision maker. The OSM cards and Drives, systems and professional services reportable segments are not strategic business units which offer unrelated products and services; rather these reportable segments utilize compatible technology and are marketed jointly. Specialty cards and card printers is a strategic business unit offering at times unrelated products and at times related products with the other reportable segments.
The accounting policies used to derive reportable segment results are the same as those described in the “Summary of Significant Accounting Policies.” Resources are allocated to the OSM card and drives, system and professional services segments in a manner that optimizes OSM card revenues and to the Specialty card and card printers segment in a manner that optimizes consolidated income as determined by the chief operating decision maker. Segment revenues are comprised of sales to external customers. Segment gross profit (loss) includes all segment revenues less the related cost of sales. Accounts receivable, cash, deferred income taxes, prepaid expenses, fixed assets and inventory are not separately reported by segment to the chief operating decision maker. Therefore, we believe the amount of assets by segment is not meaningful. We reported intersegment sales of $146,000 and $244,000 in fiscal years ended March 31, 2010 and 2009, respectively. There were no intersegment sales or transfers in fiscal year ended March 31, 2008. All of our long-lived assets are attributable to the United States except for $1.8 million, $2.2 million, and $3.3 million attributable to Germany in fiscal years ended March 31, 2010, 2009, and 2008, respectively. A net decrease of $50,000 in long-lived assets at March 31, 2010 as compared to March 31, 2009 was offset by a $20,000 increase caused by fluctuation in foreign exchange. These long-lived assets were attributable to the operations in Germany, including long-lived assets owned by the U.S. operations located in Germany.
Our chief operating decision maker is currently our Chief Executive Officer. The chief operating decision maker reviews financial information presented on a consolidated basis that is accompanied by disaggregated information about revenues and gross profit (loss) by segment.
61
LASERCARD CORPORATION AND SUBSIDIARIES
NOTES TO CONSOLIDATED FINANCIAL STATEMENTS
The table below presents information for Optical security media cards, Drives, systems and professional services, and Specialty cards and card printers for the fiscal years ended March 31 (in thousands):
|
Fiscal Year Ended March 31, 2010
|
||||||||||||||||||||||||||||
|
Optical
|
Drives,
|
Specialty
|
||||||||||||||||||||||||||
|
security
|
systems &
|
cards &
|
||||||||||||||||||||||||||
|
media
|
professional
|
card
|
Segment
|
|||||||||||||||||||||||||
|
cards
|
services
|
printers
|
total
|
Intersegment
|
Other (a)
|
Total
|
||||||||||||||||||||||
|
Revenues
|
$ | 43,267 | $ | 1,391 | $ | 14,099 | $ | 58,757 | $ | (146 | ) | $ | - | $ | 58,611 | |||||||||||||
|
Cost of sales
|
21,804 | 2,571 | 10,374 | 34,749 | (146 | ) | - | 34,603 | ||||||||||||||||||||
|
Gross profit (loss)
|
21,463 | (1,180 | ) | 3,725 | 24,008 | - | - | 24,008 | ||||||||||||||||||||
|
Depreciation and
|
||||||||||||||||||||||||||||
|
amortization expenses
|
1,827 | 113 | 167 | 2,107 | - | 567 | 2,674 | |||||||||||||||||||||
|
Fiscal Year Ended March 31, 2009
|
||||||||||||||||||||||||||||
|
Optical
|
Drives,
|
Specialty
|
||||||||||||||||||||||||||
|
security
|
systems &
|
cards &
|
||||||||||||||||||||||||||
|
media
|
professional
|
card
|
Segment
|
|||||||||||||||||||||||||
|
cards
|
services
|
printers
|
total
|
Intersegment
|
Other (a)
|
Total
|
||||||||||||||||||||||
|
Revenues
|
$ | 30,920 | $ | 3,306 | $ | 15,789 | $ | 50,015 | $ | (244 | ) | $ | - | $ | 49,771 | |||||||||||||
|
Cost of sales
|
17,652 | 3,607 | 11,585 | 32,844 | (244 | ) | - | 32,600 | ||||||||||||||||||||
|
Gross profit (loss)
|
13,268 | (301 | ) | 4,204 | 17,171 | - | - | 17,171 | ||||||||||||||||||||
|
Depreciation and
|
||||||||||||||||||||||||||||
|
amortization expenses
|
1,724 | 155 | 344 | 2,223 | - | 654 | 2,877 | |||||||||||||||||||||
|
Fiscal Year Ended March 31, 2008
|
||||||||||||||||||||||||||||
|
Optical
|
Drives,
|
Specialty
|
||||||||||||||||||||||||||
|
security
|
systems &
|
cards &
|
||||||||||||||||||||||||||
|
media
|
professional
|
card
|
Segment
|
|||||||||||||||||||||||||
|
cards
|
services
|
printers
|
total
|
Intersegment
|
Other (a)
|
Total
|
||||||||||||||||||||||
|
Revenues
|
$ | 22,139 | $ | 1,639 | $ | 13,230 | $ | 37,008 | $ | - | $ | - | $ | 37,008 | ||||||||||||||
|
Cost of sales
|
14,148 | 2,272 | 10,589 | 27,009 | - | - | 27,009 | |||||||||||||||||||||
|
Gross profit (loss)
|
7,991 | (633 | ) | 2,641 | 9,999 | - | - | 9,999 | ||||||||||||||||||||
|
Depreciation and
|
||||||||||||||||||||||||||||
|
amortization expenses
|
1,852 | 188 | 312 | 2,352 | - | 641 | 2,993 | |||||||||||||||||||||
(a) Other depreciation and amortization expenses represent amounts charged to selling, general and administrative expenses and research and development expenses
62
LASERCARD CORPORATION AND SUBSIDIARIES
NOTES TO CONSOLIDATED FINANCIAL STATEMENTS
Sales by Geographic Region. Sales by geographic region are generally determined based upon the ship-to address on the invoice or the knowledge of program location. Revenues by geographic region for the fiscal years ended March 31, (in thousands):
|
2010
|
2009
|
2008
|
||||||||||
|
United States
|
$ | 16,248 | $ | 7,879 | $ | 8,300 | ||||||
|
Angola
|
10,468 | 2,679 | 26 | |||||||||
|
Europe, other
|
10,065 | 9,172 | 5,851 | |||||||||
|
Saudi Arabia
|
8,013 | 13,179 | 8,597 | |||||||||
|
Germany
|
6,254 | 6,760 | 6,763 | |||||||||
|
Asia
|
5,265 | 4,730 | 3,763 | |||||||||
|
Middle East and Africa, other
|
1,220 | 241 | 621 | |||||||||
|
Canada
|
576 | 1,885 | 2,927 | |||||||||
|
Rest of world
|
502 | 3,246 | 160 | |||||||||
| $ | 58,611 | $ | 49,771 | $ | 37,008 | |||||||
In fiscal years 2010, 2009 and 2008, sales to customers outside the United States in the amount of $44.6 million, $34.0 million and $15.6 million, respectively, were denominated in U.S. dollars and $14.0 million, $15.8 million and $13.1 million, respectively, were denominated in Euros.
5. Related-Party Transactions
Since October 21, 2001, we contracted with Wexler & Walker Public Policy Associates, a unit of Hill and Knowlton, Inc., (“Wexler”) to be lobbyists on our behalf. The Chairman of Wexler is Robert S. Walker, a brother of our director Walter F. Walker. The contract was terminated on December 1, 2008.
We paid Wexler $240,000 during fiscal year 2009, and $161,000 during fiscal year 2008. There were no related-party transactions during fiscal year 2010.
6. Common Stock
The 2004 Equity Incentive Compensation Plan, as amended, (the “2004 Plan”): In October 2004, LaserCard’s stockholders approved the 2004 Equity Incentive Compensation Plan, which replaced the 1991 Stock Option Plan. The 2004 Plan provides for the grant of restricted share awards, options, stock units and stock appreciation rights, any of which may or may not require the satisfaction of performance objectives, with respect to shares of LaserCard’s common stock to our directors, officers, employees and consultants. The 2004 Plan is administered by the Compensation Committee of the Board of Directors, which has complete discretion to select the participants and to establish the terms and conditions of each award, subject to the provisions of the 2004 Plan. Options granted under the 2004 Plan may be “incentive stock options” as defined in Section 422 of the Internal Revenue Code of 1986 (the “Code”), as amended, or nonqualified options. A total of 2,315,854 shares of common stock were reserved for issuance under the 1991 and 2004 Plans as of March 31, 2010. If any award granted under the 2004 Plan is forfeited or expires for any reason, then the shares subject to that award will once again be available for additional awards. If any outstanding option issued under the 1991 Plan expires or terminates for any reason without having been exercised in full, then the unpurchased shares subject to that option will be available for additional awards under the 2004 Plan. Under the 2004 Plan, the exercise price of incentive stock options may not be less than 100% of the fair market value of the common stock as of the date of grant (110% of the fair market value if the grant is to an employee who owns more than 10% of the total combined voting power of all classes of LaserCard’s capital stock). The Code currently limits the aggregate value of common stock for which incentive stock options may become exercisable in any calendar year to $100,000. Nonstatutory stock options may be granted under the 2004 Plan at an exercise price of not less than 100% of the fair market value of the common stock on the date of grant. Repricing a stock option or stock appreciation right is not permitted without stockholder approval. Subject to the limitations contained in the 2004 Plan, the Compensation Committee sets the terms of each option grant. Any options that were not exercisable on the date of termination of employment immediately terminate at that time. Options granted under the 2004 Plan may not be exercised more than 10 years after the date of grant (five years after the date of grant if the grant is an incentive stock option to an employee who owns more than 10% of the total combined voting power of all classes of LaserCard’s capital stock). Our Board of Directors specifies the term of options and the vesting schedule for exercise of options. No options were granted to consultants during the fiscal year 2010.
63
LASERCARD CORPORATION AND SUBSIDIARIES
NOTES TO CONSOLIDATED FINANCIAL STATEMENTS
On June 2, 2008, our chief executive officer (the “CEO”) was granted a non-statutory stock option (the “Time-Based Option”) outside the 2004 Plan to purchase 220,000 shares of Common Stock with an exercise price of $7.115 per share. The Time-Based Option has a term of 10 years and vests 25% on June 2, 2009 and 6.25% on each of the following 12 three-month anniversaries of such date, so that the Time-Based Option is fully vested on June 2, 2012. Additionally, the CEO was granted a non-statutory stock option (the “Market-Based Option”) outside the 2004 Plan to purchase 330,000 shares of common stock with an exercise price of $7.115 per share. The Market-Based Option has a term of 10 years and vests if, prior to June 2, 2013, the closing trading price of common stock for 20 consecutive days is greater than or equal to $10, $13, $16, $19, and $22 per share, with vesting of 60,000 shares for each of the first two price points achieved and of 70,000 shares for each of the last three price points achieved. For the Market Based Options and options granted to LaserCard officers with similar vesting schedules, we used the Lattice-model with the stated assumptions to value the stock-based employee compensation expenses.
As of March 31, 2008, 73,000 shares of common stock have been reserved outside of the 2004 Plan compared with 113,000 as of March 31, 2007, for issuance upon exercise of stock options granted under Nasdaq Rule No. 4350(i)(1)(A), in connection with the CCD-C&M acquisition. As an inducement to join LaserCard, each of the six key employees of the acquired companies were granted non-statutory stock options on March 31, 2004 with a term of five years to purchase 20,000 common shares. Some shares have expired under this category during fiscal year 2008.
Stock Options: Under the provisions of ASC 718, stock-based compensation cost is estimated at the grant date based on the fair value of the award and compensation cost is recognized as an expense over the requisite service period of the award, generally the vesting period. The fair value of non-vested stock awards was determined by reference to the fair market value of the LaserCard’s common stock on the date of grant. Consistent with the valuation method we used for disclosure-only purposes under the provisions of ASC 718, Accounting for Stock-Based Compensation, we used the Black-Scholes valuation model to estimate the fair value of option awards. Determining the appropriate fair value model and related assumptions requires judgment, including estimating stock price volatility, forfeiture rates and expected terms. For the Market Based Options granted to LaserCard officers with similar vesting schedules, we used the Lattice-model with the stated assumptions to value the stock-based employee compensation expenses.
The following assumptions were utilized to estimate the fair value of LaserCard’s stock option awards for the fiscal years ended March 31:
|
2010
|
2009
|
2008
|
||||||||||
|
Expected stock price volatility
|
55% to 60%
|
55% | 55% | |||||||||
|
Risk-free interest rates
|
1.65% to 2.34%
|
2.44% to 3.35%
|
2.65% to 4.93%
|
|||||||||
|
Expected life of options
|
4.4 years
|
4.4 to 5 years
|
4.4 to 5 years
|
|||||||||
|
Expected annual dividends
|
― | ― | ― | |||||||||
The expected volatility rate was based on the historical volatility of the LaserCard’s common stock. The expected life represents the average time options that vest are expected to be outstanding based on the vesting provisions and historical exercise, cancellation and expiration patterns. We estimated forfeitures based on historical rates when recognizing compensation expense. Forfeitures rates of 4.13% to 8% were estimated during fiscal year 2010 based on voluntary termination behavior, as well as an analysis of actual option forfeitures.
The risk-free interest rate was based on U.S. Treasury zero-coupon issues with a maturity approximating the expected life as of the week of the grant date. There was no annual dividend rate assumed as a cash dividend is not expected to be declared and paid in the foreseeable future. We update these assumptions at least annually and on an interim basis if significant changes to the assumptions are warranted.
64
LASERCARD CORPORATION AND SUBSIDIARIES
NOTES TO CONSOLIDATED FINANCIAL STATEMENTS
The following table lists stock option activity at fiscal years ended March 31 (in thousands, except for weighted average exercise price):
|
March 31, 2010
|
March 31, 2009
|
March 31, 2008
|
||||||||||||||||||||||
|
Number of Shares
|
Weighted Average Exercise Price
|
Number of Shares
|
Weighted Average Exercise Price
|
Number of Shares
|
Weighted Average Exercise Price
|
|||||||||||||||||||
|
Outstanding at beginning of year
|
2,513 | $ | 10.01 | 2,152 | $ | 12.75 | 2,213 | $ | 12.96 | |||||||||||||||
|
Granted
|
52 | 6.57 | 1,049 | 6.09 | 299 | 10.49 | ||||||||||||||||||
|
Exercised
|
(37 | ) | 6.23 | - | - | (52 | ) | 9.40 | ||||||||||||||||
|
Canceled
|
(118 | ) | 12.09 | (688 | ) | 12.59 | (308 | ) | 12.70 | |||||||||||||||
|
Outstanding at end of year
|
2,410 | $ | 9.89 | 2,513 | $ | 10.01 | 2,152 | $ | 12.74 | |||||||||||||||
|
Options vested and exercisable at end of year
|
1,368 | $ | 12.46 | 1,188 | $ | 13.13 | 1,541 | $ | 13.45 | |||||||||||||||
The weighted average grant-date fair value per share of options granted during the fiscal years ended March 31, 2010, 2009 and 2008 were $3.18, $3.03, and $5.29, respectively.
The weighted average remaining contractual term for outstanding options at fiscal years ended March 31, 2010, 2009 and 2008 were 5.5 years, 6.3 years, and 8.6 years, respectively.
Aggregate intrinsic value is the sum of the amounts by which the closing market price of LaserCard’s stock (on the last trading day) exceeds the exercise price of the options, for those options for which the quoted market price was in excess of the exercise price (“in-the-money-options”). The closing market price of LaserCard’s stock at March 31, 2010 (last trading day) was $6.61 per share. The aggregate intrinsic value of outstanding options and options vested and exercisable was approximately $1.2 million at March 31, 2010. The aggregate intrinsic value of options exercised on the dates the options were exercised was approximately $0.05 million for the fiscal years ended March 31, 2010. At March 31, 2009, the quoted market price was below the exercise price (“out-of-the-money-options”) for outstanding options and options vested and exercisable. Consequently, there was no aggregate intrinsic value of outstanding options, options vested and exercisable, and no options were exercised. The closing market price of LaserCard’s stock at March 31, 2008 (last trading day) was $8.50 per share. The aggregate intrinsic value of outstanding options and options vested and exercisable was approximately $1.8 million at March 31, 2008. The aggregate intrinsic value of options exercised on the dates the options were exercised was approximately $0.1 million for the fiscal years ended March 31, 2008.
65
LASERCARD CORPORATION AND SUBSIDIARIES
NOTES TO CONSOLIDATED FINANCIAL STATEMENTS
The following table summarizes information about stock options outstanding at March 31, 2010 and March 31, 2009, (in thousands, except for weighted average exercise price and contractual life):
|
March 31, 2010
|
||||||||||||||||||||
|
Options Outstanding
|
Exercisable
|
|||||||||||||||||||
|
Range of Exercise Price
|
Number of
Outstanding Vested/Unvested March 31, 2010 |
Weighted Average
Exercise Price |
Weighted Average
Remaining Contractual Life |
Number of Shares
Exercisable at March 31, 2010 |
Weighted Average
Exercise Price |
|||||||||||||||
|
$2.56 - $4.56
|
12 | $ | 3.53 | 6.14 | - | $ | - | |||||||||||||
|
$4.84 - $5.56
|
480 | 4.86 | 7.90 | 31 | 4.87 | |||||||||||||||
|
$6.05 - $6.05
|
196 | 6.05 | 5.14 | 196 | 6.05 | |||||||||||||||
|
$7.11 - $7.26
|
560 | 7.12 | 8.11 | 101 | 7.12 | |||||||||||||||
|
$7.50 - $10.40
|
267 | 9.90 | 5.15 | 179 | 10.03 | |||||||||||||||
|
$10.99 - $12.43
|
160 | 11.93 | 4.27 | 138 | 11.93 | |||||||||||||||
|
$13.13 - $15.34
|
274 | 13.93 | 2.43 | 274 | 13.93 | |||||||||||||||
|
$16.31 - $22.75
|
461 | 17.25 | 2.40 | 449 | 17.22 | |||||||||||||||
| 2,410 | $ | 9.90 | 5.50 | 1,368 | $ | 12.46 | ||||||||||||||
|
March 31, 2009
|
||||||||||||||||||||
|
Options Outstanding
|
Exercisable
|
|||||||||||||||||||
|
Range of Exercise Price
|
Number of
Outstanding Vested/Unvested at March 31, 2009 |
Weighted Average
Exercise Price |
Weighted Average
Remaining Contractual Life |
Number of Shares
Exercisable at March 31, 2009 |
Weighted Average
Exercise Price |
|||||||||||||||
|
$4.84 - $5.56
|
476 | $ | 4.85 | 8.90 | - | $ | - | |||||||||||||
|
$6.05 - $6.05
|
228 | 6.05 | 6.14 | 161 | 6.05 | |||||||||||||||
|
$7.11 - $7.26
|
560 | 7.12 | 9.11 | - | - | |||||||||||||||
|
$7.50 - $10.71
|
284 | 9.87 | 5.11 | 184 | 9.58 | |||||||||||||||
|
$10.99 - $12.43
|
168 | 11.94 | 5.12 | 119 | 11.93 | |||||||||||||||
|
$13.13 - $15.34
|
313 | 13.91 | 3.52 | 313 | 13.91 | |||||||||||||||
|
$16.31 - $22.75
|
484 | 17.20 | 3.40 | 411 | 17.25 | |||||||||||||||
| 2,513 | $ | 10.01 | 6.28 | 1,188 | $ | 13.13 | ||||||||||||||
Restricted Shares and Restricted Stock Units: Beginning September 21, 2007, restricted shares and restricted stock units were awarded to certain LaserCard employees and directors under the provisions of the 2004 Plan. These shares and units are subject to time-based vesting provisions, and were awarded at no cost to the recipients, and cannot be sold, assigned, transferred, or pledged during the restriction period. The restricted shares and units granted to the employees generally vest 25% on each of the first four one-year anniversaries from the date of their award. The restricted shares granted to independent directors generally vest in full on the eleventh month after the date of their award. The fair value of restricted shares and restricted units at the time of the award is expensed on a straight-line basis, primarily in selling, general and administrative expenses over the vesting period. As the restricted stock units vest, shares are issued in settlement; for employees, net of shares retained to satisfy tax withholding obligations. Recipients of the restricted shares have the right to vote such shares and receive dividends, whereas the recipients of restricted stock units do not have these same benefits.
On June 2, 2008, the CEO was granted 20,000 restricted shares (the “Restricted Stock”) outside the 2004 Plan in compliance with Nasdaq Rule No. 4350(i)(1)(A) and at no charge to the CEO. We registered the Restricted Stock with the SEC on a Form S-8 dated February 11, 2009.
66
LASERCARD CORPORATION AND SUBSIDIARIES
NOTES TO CONSOLIDATED FINANCIAL STATEMENTS
We had 97,000, 93,000 and 113,000 of unvested restricted stock units issued under the 2004 Plan outstanding for fiscal years ended March 31, 2010, 2009 and 2008, respectively. We had 15,000 and 20,000 of unvested restricted stock issued under Nasdaq Rule No. 4350(i)(1)(A) for fiscal years ended March 31, 2010 and 2009, respectively.
Employee Stock Purchase Plan
We discontinued the Employee Stock Purchase Plan (the “Stock Purchase Plan”) effective February, 2009, under which 29,300 and 94,185 shares were reserved as of March 31, 2009 and 2008, respectively, for future purchases by employees. Under the Stock Purchase Plan, eligible employees could designate from 2% to 6% of their compensation to be withheld for the purchase of shares of common stock at 67% of a trailing average price. The differential between fair market value and the average price of the shares sold under the Stock Purchase Plan was charged to operations as a compensation expense and taxed to the employee as income. Under the Stock Purchase Plan, employees purchased 64,885 shares for fiscal year 2009, 36,914 shares for fiscal year 2008, and 30,418 shares for fiscal year 2007. The weighted average purchase price per share was $3.36 for fiscal year 2009, $7.09 for fiscal year 2008, and $7.61 for fiscal year 2007. The weighted average market price per share for shares purchased was $5.01 for fiscal year 2009, $10.37 for fiscal year 2008, and $11.44 for fiscal year 2007.
Other Employee Benefit Plan
401(k) Plan. The 401(k) Plan provides participating employees with an opportunity to accumulate funds for retirement. Through March 4, 2009, LaserCard’s contribution to this Plan did not exceed the lesser of: (a) 25% of the maximum employee contribution allowed by IRS, (b) 25% of an employee’s contribution, or (c) 1.5% of an employee’s eligible earnings. LaserCard contributed approximately $69,000, $90,000, and $94,000, for fiscal years 2010, 2009, and 2008, respectively. Effective March 5, 2009, LaserCard has decided to make a modest reduction in the employer discretionary matching contribution from 25% of the first 6% of deferred funds to 20%.
Issuance of Warrants
At March 31, 2008, LaserCard had warrants outstanding to purchase 174,057 shares of LaserCard common stock. The warrants were issued in connection with the December 2003 sale of common stock in a private placement. The warrants had an exercise price of $17.26 per share and a life of five years. These warrants expired in December 2008.
7. Commitments and Contingencies
Lease. We occupy buildings under various operating leases. Rent expense relating to these buildings was approximately $1.4 million, $1.4 million, and $1.5 million for fiscal years 2010, 2009, and 2008, respectively.
We entered into an equipment lease arrangement in fiscal year 2009 for $0.2 million and $0.1 million in fiscal year 2008 that expire on dates from July 2011 and September 2011. This was recorded as a capitalized lease in accordance with ASC 840, Accounting for Leases. There were no new lease arrangements during fiscal year 2010.
Refer to Note 2, caption 26, Commitments and Contingencies of the consolidated financial statement for further discussion of our operating leases.
Purchase Commitment. We purchase services, software, and manufacturing equipment from a variety of vendors. As of March 31, 2010, we have non-cancelable purchase orders of $1.9 million for raw materials which will be delivered over the next two quarters of fiscal year 2011.
67
LASERCARD CORPORATION AND SUBSIDIARIES
NOTES TO CONSOLIDATED FINANCIAL STATEMENTS
The future minimum lease payments for all capital leases and operating leases were as follows (in thousands):
|
2011
|
2012
|
2013
|
2014
|
2015
|
Total
|
|||||||||||||||||||
|
Non-cancelable operating leases (1)
|
$ | 1,909 | $ | 1,840 | $ | 1,730 | $ | 1,457 | $ | 14 | $ | 6,950 | ||||||||||||
|
Non-cancelable purchase orders
|
1,857 | — | — | — | — | 1,857 | ||||||||||||||||||
|
Net borrowing on revolving credit with UBS (2)
|
7,865 | — | — | — | — | 7,865 | ||||||||||||||||||
|
Total
|
$ | 11,631 | $ | 1,840 | $ | 1,730 | $ | 1,457 | $ | 14 | $ | 16,672 | ||||||||||||
| (1) | Includes capitalized leases |
| (2) |
For the purposes of this table, the obligation has been calculated without interest obligations
|
Other Contingencies. In the normal course of business, we are subject to various claims. In the opinion of management, the ultimate disposition of such claims will not have a material adverse impact on the financial position and results of operation or cash flows.
Employment Agreements. On November 28, 2007, LaserCard entered into a Planned Retirement Agreement and an Age Discrimination Release Agreement with the then-CEO for his retirement on March 31, 2008. These agreements provided for the then-CEO to receive two years of separation pay at the per annum rate of $350,000; consulting retainer of $18,000 for nine months of consulting availability and services; and bonus of up to $100,000. We continued to pay the portion of his health care insurance premium under the COBRA coverage for up to 18 months. His stock options ceased vesting on the retirement date, other than the 18,750 options which vested on May 24, 2008 since he remained a consultant to LaserCard. He held 3,125 restricted shares which vested on September 21, 2008 but his other restricted shares had forfeited. LaserCard allocated the costs of the postretirement payments and the bonus using the discounted cash-flow basis over the remaining months of the total expected service. The stock options were remeasured using the Black-Scholes method. In addition, LaserCard has employment agreements with two other executives that provide for severance payments for a period of twelve (12) months following the employee’s termination of employment. LaserCard shall continue to pay the employee on a monthly basis one-twelfth of the employee’s per annum base salary as determined on the employee’s last day of employment. Specific provisions were also made for continued health insurance coverage and stock options. Certain conditions of severance payments were included, the details of which can be found in LaserCard’s Form 8-K filed on January 8, 2010.
8. Income Taxes
The domestic and foreign component of pretax income (loss) for the fiscal years ended March 31 (in thousands):
|
2010
|
2009
|
2008
|
||||||||||
|
Income (loss) before taxes:
|
||||||||||||
|
Domestic
|
$ | 5,866 | $ | (1,253 | ) | $ | (6,442 | ) | ||||
|
Foreign
|
1,390 | 399 | (878 | ) | ||||||||
|
Total
|
$ | 7,256 | $ | (854 | ) | $ | (7,320 | ) | ||||
68
LASERCARD CORPORATION AND SUBSIDIARIES
NOTES TO CONSOLIDATED FINANCIAL STATEMENTS
The provision for income taxes (benefit) for the fiscal years ended March 31 (in thousands):
|
2010
|
2009
|
2008
|
||||||||||
|
Current:
|
||||||||||||
|
Federal
|
$ | 922 | $ | 50 | $ | - | ||||||
|
State
|
158 | 49 | 15 | |||||||||
|
Foreign
|
184 | (13 | ) | - | ||||||||
| 1,264 | 86 | 15 | ||||||||||
|
Deferred:
|
||||||||||||
|
Federal
|
- | - | - | |||||||||
|
State
|
- | - | - | |||||||||
|
Foreign
|
- | - | (129 | ) | ||||||||
| - | - | (129 | ) | |||||||||
|
Income tax expense (benefit)
|
$ | 1,264 | $ | 86 | $ | (114 | ) | |||||
The effective tax rate differs from the statutory rate for the fiscal years ended March 31 as follows:
|
2010
|
2009
|
2008
|
||||||||||
|
Tax reconciliation:
|
||||||||||||
|
Federal statutory rate
|
34.0 | % | 34.0 | % | 34.0 | % | ||||||
|
State tax, net of federal benefit
|
3.7 | % | (109.9 | %) | - | |||||||
|
Foreign provision differential
|
(4.3 | %) | 17.4 | % | (2.3 | %) | ||||||
|
Change in valuation allowance
|
(22.3 | %) | 97.0 | % | (25.5 | %) | ||||||
|
Stock-based compensation
|
5.5 | % | (32.8 | %) | (4.2 | %) | ||||||
|
Change on deferred taxes
|
- | (13.7 | %) | - | ||||||||
|
Other
|
0.8 | % | (2.9 | %) | (0.4 | %) | ||||||
| 17.4 | % | (11.0 | %) | 1.5 | % | |||||||
69
LASERCARD CORPORATION AND SUBSIDIARIES
NOTES TO CONSOLIDATED FINANCIAL STATEMENTS
The major components of the net deferred tax assets/(liabilities) as of March 31 (in thousands):
|
2010
|
2009
|
|||||||
|
Deferred tax assets
|
||||||||
|
Advanced payments and deferred revenue
|
$ | 10,395 | $ | 10,257 | ||||
|
Net operating loss carryforward
|
200 | 1,055 | ||||||
|
Reserves and accruals
|
1,963 | 2,119 | ||||||
|
Stock compensation
|
1,328 | 1188 | ||||||
|
Depreciation and amortization
|
1,200 | 1,176 | ||||||
|
Research credit
|
394 | 891 | ||||||
|
Other
|
440 | 885 | ||||||
|
Gross deferred tax asset
|
15,920 | 17,571 | ||||||
|
Valuation allowance
|
(15,804 | ) | (17,424 | ) | ||||
|
Net deferred tax assets
|
116 | 147 | ||||||
|
Deferred tax liability
|
||||||||
|
German operations
|
(191 | ) | (234 | ) | ||||
|
Capitalized patent costs
|
(116 | ) | (147 | ) | ||||
|
Total deferred tax liability
|
(307 | ) | (381 | ) | ||||
|
Net deferred tax liability
|
$ | (191 | ) | $ | (234 | ) | ||
The net deferred income tax liability of $191,000 at March 31, 2010 and $234,000 at March 31, 2009 is attributable to the operations of our German subsidiary. As part of the process of preparing the consolidated financial statements, we are required to estimate income taxes in each of the jurisdictions in which we operate. This process involves estimating the actual current tax exposure together with assessing temporary differences resulting from differing treatment of items, such as deferred revenue, for tax and accounting purposes. These differences result in deferred income tax assets and liabilities, which are included within the consolidated balance sheets. We must then assess the likelihood that the deferred income tax assets will be recovered from future taxable income and to the extent that management believes recovery is not likely, we must establish a valuation allowance.
In fiscal year 2010, the valuation allowance decreased by $1.6 million. The change in valuation allowance related to the decrease in net operating loss carry-forwards (“NOLs”) of $0.9 million offset by other increases in our gross deferred income tax assets. In fiscal year 2009, the valuation allowance decreased by $0.9 million. The change in valuation allowance related to the decrease in net operating loss carry-forwards (“NOLs”) of $1.5 million offset by other increases in our gross deferred income tax assets.
Our federal NOLs as of March 31, 2010 were $10.9 million as compared to $19.2 million as of March 31, 2009. The NOLs will expire at various dates from 2012 through 2027, if not utilized. As of March 31, 2010, all of the remaining net operating losses represent NOLs related to windfall stock option deductions the benefit of which will be credited to stockholders’ equity when realized. Federal tax credits in the amount of $472,000 for alternative minimum taxes have no expiration. Federal R&D tax credits in the amount of $344,000 will expire on various dates from 2021 through 2029, if not utilized. Our state NOLs as of March 31, 2010 and as of March 31, 2009 were $3.8 million. The NOLs will expire at various dates from 2019 through 2020, if not utilized. Of this amount as of March 31, 2010, $333,000 represents NOLs relating to windfall stock option deductions, the benefit of which will be credited to stockholders’ equity when realized. California tax credits related to R&D and alternative minimum taxes as of March 31, 2010 in the amount of $61,000 have no expiration date.
70
LASERCARD CORPORATION AND SUBSIDIARIES
NOTES TO CONSOLIDATED FINANCIAL STATEMENTS
Our methodology for determining the realizability of our deferred income tax assets involves estimates of future taxable income based upon booked orders; the estimated impact of future stock option deductions; and the expiration dates and amounts of NOLs. We have had difficulty in the past, and expect to have continued difficulty in the future, in reliably forecasting our foreign business and the revenue to be received from it. This resulted in our basing our estimates of future income for these purposes on booked orders only. As circumstances change, we may in the future be able to estimate future revenue based upon our forecast revenues rather than only using booked orders, although we cannot predict when or if this will occur.
In concluding that a full valuation allowance was required at the end of fiscal year 2010, 2009 and 2008, respectively, we considered both the positive and negative evidence regarding our ability to generate sufficient future taxable income to realize their deferred income tax assets. Positive evidence included (1) the level of sales and business experienced under the contracts for the U.S. Green Card; (2) prospects in the Kingdom of Saudi Arabia for their national identification card programs; (3) orders of OMCs for the National ID card program in Angola, and (4) expected future orders. Negative evidence included (1) our reliance on a limited number of customers for a substantial portion of our business; (2) the uncertainty in timing of anticipated orders from our customers; (3) the impact of future stock option deductions on taxable income; (4) our experience of net NOLs expiring unused through fiscal year 2007; (5) the recent financial statement losses; and (6) the prior three years’ cumulative tax net operating losses exclusive of payments derived from the Prevent Global contract. In weighing the positive and negative evidence, we considered the “more likely than not” criteria pursuant to ASC 740, Accounting for Income Taxes, as well as the following risks related to our business: “dependence on VARs and on a limited number of customers,” “lengthy sales cycles,” “technological change,” and “competition”. As described, we concluded that the negative evidence outweighed the positive evidence and as a result we recorded a valuation allowance equal to the full amount of the deferred income tax asset as of March 31, 2010, March 31, 2009 and at March 31, 2008.
In the event that actual results differ from these estimates or that these estimates are adjusted in future periods, we may need to adjust the amount of the valuation allowance based on future determinations of whether it is more likely than not that some or all of our deferred income tax assets will be realized. A decrease in the valuation allowance would be recorded as an income tax benefit or a reduction of income tax expense. The net operating losses available to reduce future taxable income expire on various dates from fiscal year 2012 through fiscal year 2027. To the extent that we generate taxable income in jurisdictions where the deferred income tax asset relates to net operating losses that have been offset by a full valuation allowance, the utilization of these net operating losses would result in the reversal of the related valuation allowance.
We adopted the provisions of ASC 740-10-25 on April 1, 2007. Upon adoption of FIN 48 on April 1, 2007, we recognized a cumulative effect adjustment of $62,000, decreasing our income tax liability for unrecognized tax benefits, and decreasing the March 31, 2007 accumulated deficit balance.
A reconciliation of the beginning and ending amount of unrecognized tax benefit is as follows (in thousands):
|
2010
|
2009
|
|||||||
|
Beginning balance as of March 31,
|
$ | 229 | $ | 229 | ||||
|
Additions for tax positions related to prior year
|
- | - | ||||||
|
Additions for tax positions related to current year
|
- | - | ||||||
|
Ending balance as of March 31,
|
$ | 229 | $ | 229 | ||||
We recognize interest and penalties accrued on any unrecognized tax benefits as a component of our provision for income taxes. We accrued $31,000 and $14,000 for payment of interest and penalties related to unrecognized tax benefits as of March 31, 2010 and 2009, respectively. If the unrecognized tax benefit were recognized, it would result in a benefit to the effective tax rate. We do not currently anticipate that any significant increase or decrease to unrecognized tax benefits will be recorded during the next 12 months.
71
LASERCARD CORPORATION AND SUBSIDIARIES
NOTES TO CONSOLIDATED FINANCIAL STATEMENTS
Deferred tax liabilities have not been recognized for undistributed earnings of foreign subsidiaries because it is management’s intention to reinvest such undistributed earnings indefinitely in those foreign subsidiaries. Undistributed earnings of our foreign subsidiaries amounted to approximately $1.2 million at March 31, 2010. If we distribute these earnings, in the form of dividends and otherwise, we would be subject to both U.S. income taxes (net of applicable foreign tax credits) and withholding taxes payable to the foreign jurisdiction.
Although we file U.S. federal, various state, and foreign tax returns, our only major tax jurisdictions are the United States, California and Germany. Tax years 1993 through 2009 remain subject to examination by the appropriate governmental agencies, mainly the United States, due to tax loss carryovers from those years.
72
LASERCARD CORPORATION AND SUBSIDIARIES
SELECTED QUARTERLY FINANCIAL DATA (UNAUDITED)
(In thousands, except per share amounts)
|
1st Quarter
|
2nd Quarter
|
3rd Quarter
|
4th Quarter
|
Total
|
||||||||||||||||
|
Fiscal year 2010:
|
||||||||||||||||||||
|
Revenue
|
$ | 16,308 | $ | 15,716 | $ | 12,409 | $ | 14,178 | $ | 58,611 | ||||||||||
|
Cost of sales
|
9,705 | 8,927 | 6,827 | 9,144 | 34,603 | |||||||||||||||
|
Gross profit
|
6,603 | 6,789 | 5,582 | 5,034 | 24,008 | |||||||||||||||
|
Net income
|
1,943 | 1,847 | 1,349 | 853 | 5,992 | |||||||||||||||
|
Net income per share:
|
||||||||||||||||||||
|
Basic
|
$ | 0.16 | $ | 0.15 | $ | 0.11 | $ | 0.07 | $ | 0.49 | ||||||||||
|
Diluted
|
$ | 0.16 | $ | 0.15 | $ | 0.11 | $ | 0.07 | $ | 0.49 | ||||||||||
|
Weighted average number of common and common equivalent shares:
|
||||||||||||||||||||
|
Basic
|
12,113 | 12,172 | 12,234 | 12,235 | 12,189 | |||||||||||||||
|
Diluted
|
12,140 | 12,318 | 12,284 | 12,272 | 12,226 | |||||||||||||||
|
Fiscal year 2009:
|
||||||||||||||||||||
|
Revenue
|
$ | 10,722 | $ | 13,467 | $ | 10,906 | $ | 14,676 | $ | 49,771 | ||||||||||
|
Cost of sales
|
7,255 | 8,902 | 7,314 | 9,129 | 32,600 | |||||||||||||||
|
Gross profit
|
3,467 | 4,565 | 3,592 | 5,547 | 17,171 | |||||||||||||||
|
Net income (loss)
|
(1,274 | ) | 239 | (849 | ) | 944 | (940 | ) | ||||||||||||
|
Net income (loss) per share:
|
||||||||||||||||||||
|
Basic
|
$ | (0.11 | ) | $ | 0.02 | $ | (0.07 | ) | $ | 0.08 | $ | (0.08 | ) | |||||||
|
Diluted
|
$ | (0.11 | ) | $ | 0.02 | $ | (0.07 | ) | $ | 0.08 | $ | (0.08 | ) | |||||||
|
Weighted average number of common and common equivalent shares:
|
||||||||||||||||||||
|
Basic
|
11,991 | 12,027 | 12,085 | 12,104 | 12,052 | |||||||||||||||
|
Diluted
|
11,991 | 12,029 | 12,085 | 12,114 | 12,052 | |||||||||||||||
73
|
ITEM 9.
|
CHANGES IN AND DISAGREEMENTS WITH ACCOUNTANTS ON ACCOUNTING AND FINANCIAL DISCLOSURE
|
There have been no changes in or disagreements with our accountant on accounting and financial disclosure.
| ITEM 9A. | CONTROLS AND PROCEDURES |
(a) Evaluation of Disclosure Controls and Procedures. We maintain disclosure controls and procedures that are designed to ensure that information required to be disclosed by us in reports that we file or submit under the Securities Exchange Act of 1934 is recorded, processed, summarized, and reported within the time periods specified in SEC rules and forms, and that such information is accumulated and communicated to our management, including our Chief Executive Officer and Chief Financial Officer, as appropriate, to allow timely decisions regarding required disclosure. In designing and evaluating our disclosure controls and procedures, management recognized that disclosure controls and procedures, no matter how well conceived and operated, can provide only reasonable, not absolute, assurance that the objectives of the disclosure controls and procedures are met. Our disclosure controls and procedures have been designed to meet, and management believes that they meet, reasonable assurance standards. Additionally, in designing disclosure controls and procedures, our management necessarily was required to apply its judgment in evaluating the cost-benefit relationship of possible disclosure controls and procedures. The design of any disclosure controls and procedures also is based in part upon certain assumptions about the likelihood of future events, and there can be no assurance that any design will succeed in achieving its stated goals under all potential future conditions.
Based on their evaluation as of the end of the period covered by this Form 10-K, our Chief Executive Officer and Chief Financial Officer have concluded that, as of such dates, our disclosure controls and procedures were effective.
(b) Management’s Annual Report on Internal Control Over Financial Reporting: Internal control over financial reporting refers to the process designed by, or under the supervision of, our principal executive and principal financial officers, or persons performing similar functions, and effected by our board of directors, management and other personnel, to provide reasonable assurance regarding the reliability of financial reporting and the preparation of financial statements for external purposes in accordance with generally accepted accounting principles, and includes those policies and procedures that:
(1) Pertain to the maintenance of records that in reasonable detail accurately and fairly reflect the transactions and dispositions of our assets;
(2) Provide reasonable assurance that transactions are recorded as necessary to permit preparation of financial statements in accordance with generally accepted accounting principles, and that our receipts and expenditures are being made only in accordance with the authorization of our management and directors; and
(3) Provide reasonable assurance regarding prevention or timely detection of unauthorized acquisitions, use or disposition of our assets that could have a material effect on the financial statements.
Internal control over financial reporting cannot provide absolute assurance of achieving financial reporting objectives because of its inherent limitations. Internal control over financial reporting is a process that involves human diligence and compliance and is subject to lapses in judgment and breakdowns resulting from human failures. Internal control over financial reporting also can be circumvented by collusion or improper management override. Because of such limitations, there is a risk that material misstatements may not be prevented or detected on a timely basis by internal control over financial reporting. However, these inherent limitations are known features of the financial reporting process. Therefore, it is possible to design into the process safeguards to reduce, though not eliminate, this risk. Management is responsible for establishing and maintaining adequate internal control over financial reporting for LaserCard.
74
Management has used the framework set forth in the report entitled Internal Control—Integrated Framework, published by the Committee of Sponsoring Organizations of the Treadway Commission, to assess the effectiveness of our internal control over financial reporting as of March 31, 2010. Based on this assessment, management has concluded that our internal control over financial reporting was effective as of March 31, 2010. SingerLewak LLP, the independent registered public accounting firm that audited the consolidated financial statements included in the Annual Report on Form 10-K, also audited, and expressed an unqualified opinion on the effectiveness of our internal control over financial reporting as of March 31, 2010, which is presented under Item 8 of this Annual Report on Form 10-K.
(c) Changes in Internal Control over Financial Reporting. There were no significant changes in our internal control over financial reporting that occurred during the fourth quarter of fiscal year 2010 that have materially affected, or are reasonably likely to materially affect, our internal control over financial reporting.
ITEM 9B. OTHER INFORMATION
None.
75
PART III
| ITEM 10. | DIRECTORS, EXECUTIVE OFFICERS AND CORPORATE GOVERNANCE |
The information required to be disclosed by this Item pursuant to Item 401(b) and Item 401(e) of Regulation S-K with respect to our executive officers is contained in Part I of this Annual Report on Form 10-K under the caption, “Executive Officers of the Registrant.” The remaining information required to be disclosed by this Item pursuant to Item 401, Item 405 and Item 407 of Regulation S-K is contained in the definitive proxy statement for our annual meeting of stockholders to be held on September 14, 2010 (the “Proxy Statement”), under the captions “Proposal 1: Election of Directors”; “Information Relating to Our Board of Directors and Its Committees—Board Meetings and Committees”; “Information Relating to Our Board of Directors and Its Committees—Directors Nominations”; “Section 16(a) Beneficial Ownership Reporting Compliance” and “Other Matters For The 2010 Annual Meeting-Stockholder Proposals and Board Nominations For The 2011 Annual Meeting” and is incorporated in this Annual Report on Form 10-K by reference.
We have adopted a code of ethics, our Standards of Business Conduct, that applies to all of our directors and employees, including our principal executive officer, principal financial officer, principal accounting officer or controller and persons performing similar functions. Our Standards of Business Conduct, as well as our corporate governance guidelines and the charters for the audit, compensation and benefits, nominating and corporate governance, executive and finance committees of our Board of Directors, are each accessible under the “Corporate Governance” heading of the “Investor Relations” section of our website, www.lasercard.com. This information is also available in print to any stockholder who requests it by writing to LaserCard Corporation, 1875 N. Shoreline Blvd. Mountain View, CA 94043 USA, Attention: Investor Relations. We also intend to disclose in the same location on our website, any amendments to, or waivers from, our Standards of Business Conduct that are required to be disclosed pursuant to the disclosure requirements of Item 5.05 of Form 8-K.
| ITEM 11. | EXECUTIVE COMPENSATION |
The information required to be disclosed by this Item pursuant to Item 402, Item 407(e)(4) and Item 407(e)(5) of Regulation S-K is contained in the Proxy Statement under the captions “Information Relating to Our Board of Directors and Its Committees—Director Compensation”; “Compensation Committee Interlocks and Insider Participation”; “Compensation Committee Report” and “Executive Compensation” and is incorporated in this Annual Report on Form 10-K by reference.
|
ITEM 12.
|
SECURITY OWNERSHIP OF CERTAIN BENEFICIAL OWNERS AND MANAGEMENT AND RELATED STOCKHOLDER MATTERS
|
The information required to be disclosed by this Item pursuant to Item 201(d) and Item 403 of Regulation S-K is contained in the Proxy Statement under the captions “Executive Compensation—Equity Compensation Plan Information” and “Beneficial Ownership of Common Stock” and is incorporated in this Annual Report on Form 10-K by reference.
|
ITEM 13.
|
CERTAIN RELATIONSHIPS AND RELATED TRANSACTIONS AND DIRECTORS INDEPENDENCE
|
The information required to be disclosed by this Item pursuant to Item 404 and Item 407(a) of Regulation S-K is contained in the Proxy Statement under the caption “Information Relating to our Board of Directors and Its Committees—Certain Relationships and Related Transactions” and is incorporated in this Annual Report on Form 10-K by reference.
| ITEM 14. | PRINCIPAL ACCOUNTANT FEES AND SERVICES |
The information required to be disclosed by this Item pursuant to Item 9(e) of Schedule 14A is contained in the Proxy Statement under the caption “Audit Committee Report and Other Outside Accountant-Related Matters”, and is incorporated in this Annual Report on Form 10-K by reference.
76
PART IV
| ITEM 15. | EXHIBITS AND FINANCIAL STATEMENT SCHEDULES |
(a) List of Documents Filed as Part of this Report
1. Our consolidated financial statements filed herewith under Item 8 are as follows:
|
Description
|
|
Page
Number
|
|
|
(1) Reports of Independent Registered Public Accounting Firm
(2) Consolidated Balance Sheets at March 31, 2010 and March 31, 2009
(3) Consolidated Statements of Operations for Fiscal Years 2010, 2009 and 2008
(4) Consolidated Statements of Stockholders’ Equity and Comprehensive Loss for Fiscal Years 2010, 2009 and 2008
(5) Consolidated Statements of Cash Flows for Fiscal Years 2010, 2009 and 2008
(6) Notes to Consolidated Financial Statements
|
42
44
45
46
47
48
|
||
2. Financial Statement Schedules:
The schedule supporting our Consolidated Financial Statements, filed herewith under Item 14(d), is as follows:
|
Schedule
Number
|
Description
|
|
Page
Number
|
||
|
―
―
II
|
Report of Independent Registered Public Accounting Firm
Report of Odenberg, Ullakko, Muranishi & Co. LLP, Independent Registered Public Accounting Firm on Financial Statement Schedule for Fiscal 2008
Valuation and Qualifying Accounts
|
80
81
82
|
|||
Schedules not listed above are not applicable or not required, or the information required to be set forth therein is included in the consolidated financial statements or the notes thereto.
3. Exhibits:
The Exhibits to this Report, filed herewith under Item 15(b) or incorporated by reference from other documents previously filed with the SEC, as follows:
|
Exhibit
Number
|
Description
|
|
Filed Herewith or Incorporated
Herein by Reference to
|
|||
|
3(I)
3(II)
|
Amended and Restated Certificate of Incorporation
Amended and Restated By-Laws (to amend Section 3.2 re authorized number of directors by resolution)
|
Previously filed as Exhibit 3.1 to Annual Report on Form 10-K for the fiscal year ended March 31, 2005 and incorporated herein by reference
Previously filed as Exhibit 3.1 to Current Report on Form 8-K on July 29, 2009 and incorporated herein by reference
|
||||
77
|
10.1
|
Building lease agreement with Renault & Handley Employees Investment Co. for 2644-2648 Bayshore Pkwy., Mountain View, CA
|
Previously filed as Exhibit 10.1 to Quarterly Report on Form 10-Q for period ended December 31, 2003 and incorporated herein by reference
|
||
|
10.2
|
Building Lease Agreement with Shoreline Park LLC for 1395 Charleston Road, Mountain View, CA (mailing address 1875 North Shoreline Boulevard, Mountain View, CA)
|
Previously filed as Exhibit 10.2 to Annual Report on Form 10-K for fiscal year ended March 31, 2004 and incorporated herein by reference
|
||
|
10.3
|
*
|
Amended and Restated Stock Option Plan
|
Previously filed as Exhibit 10.4.1 to Quarterly Report on Form 10-Q for period ended September 30, 2002 and incorporated herein by reference
|
|
|
10.4
|
Optical Card Manufacturing License Agreement with Global Investments Group
|
Previously filed as Exhibit 10.8 to Annual Report on Form 10-K for fiscal year ended March 31, 2004 and incorporated herein by reference**
|
||
|
10.5
|
*
|
2004 Equity Incentive Compensation Plan (as Amended)
|
Previously filed as Appendix A to Schedule 14A Proxy Statement for 2005Annual Stockholders Meeting on September 6, 2005 and incorporated herein by reference
|
|
|
10.6
|
June 29, 2006 Amendment to License and Equipment Agreement with Global Investments Group
|
Previously filed as Exhibit 10.10 to Quarterly Report on Form 10-Q for period ended June 30, 2006 and incorporated herein by reference**
|
||
|
10.7
|
October 27, 2006 Modified Third Amendment to License and Equipment Agreement with Global Investments Group and Prevent LOK
|
Previously filed as Exhibit 10.11 to Current Report on Form 8-K dated on November 1, 2006 and incorporated herein by reference
|
||
|
10.8
|
*
|
Employee Stock Purchase Plan (as Amended)
|
Previously filed as Appendix A to Schedule 14A Proxy Statement For 2007 Annual Stockholders Meeting on August 3, 2007 and incorporated herein by reference
|
|
|
10.9
|
*
|
Planned Retirement Agreement and Age Discrimination Release Agreement with Richard M. Haddock
|
Previously filed as Exhibit 10.13 to Quarterly Report on Form 10-Q for period ended December 31, 2007 and incorporated herein by reference
|
|
|
10.10
|
*
|
Executive Employment Agreements with Christopher J. Dyball and Steven G. Larson
|
Previously filed as Exhibit 10.1 and Exhibit 10.2 to Current Report on Form 8-K on January 8, 2010 and incorporated herein by reference
|
|
|
10.11
|
UBS AG Credit Line Agreement and Approval dated December 5, 2008
|
Previously filed as Exhibit 10.1 to Quarterly Report on Form 10-Q for period ended December 31, 2008 and incorporated herein by reference
|
||
|
10.12
|
*
|
June 2, 2008, Executive Employment Agreement with Robert T. DeVincenzi
|
Previously filed as Exhibit 10.1 to Quarterly Report on Form 10-Q for period ended June 30, 2008 and incorporated herein by reference
|
78
|
10.13
|
*
|
June 2, 2008, Restricted Stock Award of Robert T. DeVincenzi
|
Previously filed as Exhibit 10.2 to Quarterly Report on Form 10-Q for period ended June 30, 2008 and incorporated herein by reference
|
|
|
10.14
|
*
|
June 2, 2008, Non-Statutory Stock Option Agreements of Robert T. DeVincenzi
|
Previously filed as Exhibit 10.3 to Quarterly Report on Form 10-Q for period ended June 30, 2008 and incorporated herein by reference
|
|
|
10.15
|
*
|
2004 Equity Incentive Compensation Plan (as Amended)
|
Previously filed as Exhibit 10.18 to Current Report on Form 8-K on September 22, 2008 and incorporated herein by reference
|
|
|
10.16
|
*
|
LaserCard Executive Bonus Plan
|
Previously filed as Exhibit 10.1 to Current Report on Form 8-K on July 29, 2009 and incorporated herein by reference
|
|
|
21
|
Subsidiaries of the Registrant
|
Filed herewith
|
||
|
23.1
|
Consent of SingerLewak LLP, Independent Registered Public Accounting Firm
|
Filed herewith
|
||
|
23.2
|
Consent of Odenberg, Ullakko, Muranishi & Co. LLP, Independent Registered Public Accounting Firm
|
Filed herewith
|
||
|
24
|
Power of attorney
|
Filed herewith
|
||
|
31.1
|
Chief Executive Officer Certification pursuant to Section 302 of the Sarbanes-Oxley Act of 2002
|
Filed herewith
|
||
|
31.2
|
Chief Financial Officer Certification pursuant to Section 302 of the Sarbanes-Oxley Act of 2002
|
Filed herewith
|
||
|
32.1
|
Chief Executive Officer Certification pursuant to 18 U.S.C. Section 1350, as adopted pursuant to Section 906 of the Sarbanes-Oxley Act of 2002
|
Filed herewith
|
||
|
32.2
|
Chief Executive Officer Certification pursuant to 18 U.S.C. Section 1350, as adopted pursuant to Section 906 of the Sarbanes-Oxley Act of 2002
|
Filed herewith
|
|
*
|
Indicates management contract or compensatory plan or arrangement.
|
|
**
|
Portions were omitted pursuant to request for confidential treatment.
|
|
(b)
|
Financial Statement Schedule
|
|
Schedule II to our consolidated financial statements and the Report of our Independent Registered Public Accounting Firms relating to the Financial Statement Schedule is below.
|
79
REPORT OF INDEPENDENT REGISTERED PUBLIC ACCOUNTING FIRM
To the Board of Directors and Stockholders
LaserCard Corporation
We have audited LaserCard Corporation and subsidiaries’ internal control over financial reporting as of March 31, 2010, based on criteria established in Internal Control — Integrated Framework issued by the Committee of Sponsoring Organizations of the Treadway Commission. LaserCard Corporation and subsidiaries’ management is responsible for maintaining effective internal control over financial reporting and for its assessment of the effectiveness of internal control over financial reporting included in Management’s Report on Internal Control over Financial Reporting under Item 9A. Our responsibility is to express an opinion on the Company’s internal control over financial reporting based on our audit.
We conducted our audit in accordance with the standards of the Public Company Accounting Oversight Board (United States). Those standards require that we plan and perform the audit to obtain reasonable assurance about whether effective internal control over financial reporting was maintained in all material respects. Our audit included obtaining an understanding of internal control over financial reporting, assessing the risk that a material weakness exists, and testing and evaluating the design and operating effectiveness of internal control based on the assessed risk. Our audit also included performing such other procedures as we considered necessary in the circumstances. We believe that our audit provides a reasonable basis for our opinion.
A company’s internal control over financial reporting is a process designed to provide reasonable assurance regarding the reliability of financial reporting and the preparation of financial statements for external purposes in accordance with generally accepted accounting principles. A company’s internal control over financial reporting includes those policies and procedures that (a) pertain to the maintenance of records that, in reasonable detail, accurately and fairly reflect the transactions and dispositions of the assets of the company; (b) provide reasonable assurance that transactions are recorded as necessary to permit preparation of financial statements in accordance with generally accepted accounting principles, and that receipts and expenditures of the company are being made only in accordance with authorizations of management and directors of the company; and (c) provide reasonable assurance regarding prevention or timely detection of unauthorized acquisition, use, or disposition of the company’s assets that could have a material effect on the financial statements.
Because of its inherent limitations, internal control over financial reporting may not prevent or detect misstatements. Also, projections of any evaluation of effectiveness to future periods are subject to the risk that controls may become inadequate because of changes in conditions, or that the degree of compliance with the policies or procedures may deteriorate.
In our opinion, LaserCard Corporation and subsidiaries maintained, in all material respects, effective internal control over financial reporting as of March 31, 2010, based on criteria established in Internal Control — Integrated Framework issued by the Committee of Sponsoring Organizations of the Treadway Commission.
We have also audited, in accordance with the standards of the Public Company Accounting Oversight Board (United States), the consolidated balance sheets of LaserCard Corporation and subsidiaries as of March 31, 2010 and 2009 and the related consolidated statements of operations, stockholders’ equity, and cash flows for each of the two years in the period ended March 31, 2010 and our report dated June 15, 2010 expressed an unqualified opinion.
/s/SingerLewak LLP
San Jose, California
June 15, 2010
80
REPORT OF ODENBERG, ULLAKKO, MURANISHI & CO. LLP,
INDEPENDENT REGISTERED PUBLIC ACCOUNTING FIRM
ON FINANCIAL STATEMENT SCHEDULE FOR FISCAL 2008
The Board of Directors and Stockholders of
LaserCard Corporation
The audit referred to in our report dated June 4, 2008 included the related financial statement schedule for the year ended March 31, 2008, included in this Annual Report on Form 10-K. The financial statement schedule is the responsibility of the Company’s management. Our responsibility is to express an opinion on the financial statement schedule based on our audit. In our opinion, such financial statement schedule, when considered in relation to the consolidated financial statements taken as a whole, presents fairly in all material respects the information set forth therein.
/s/Odenberg, Ullakko, Muranishi & Co. LLP
San Francisco, California
June 4, 2008
81
SCHEDULE II
LASERCARD CORPORATION AND SUBSIDIARIES
VALUATION AND QUALIFYING ACCOUNTS
For the Fiscal Years Ended March 31, 2008, 2009 and 2010
(In thousands)
| Description |
Balance at
Beginning
of Period
|
Additions (Deletions)
Charged (Credited)
to Profit & Loss
|
Additions/Deletions
Charged to
Other Accounts
|
Deductions/
Write-off
|
Balance at
End of
of Period
|
|||||||||||||||
|
Fiscal year 2008:
|
||||||||||||||||||||
|
Product return reserve
|
$ | 78 | $ | - | $ | - | $ | 78 | $ | - | ||||||||||
|
Bad debt reserve
|
$ | 66 | $ | 30 | $ | 15 | (1) | $ | 76 | $ | 35 | |||||||||
|
Inventory reserves
|
$ | 837 | $ | 53 | $ | 94 | (2) | $ | 71 | $ | 913 | |||||||||
|
Warranty reserve
|
$ | 743 | $ | 147 | $ | 2 | (1) | $ | 237 | $ | 655 | |||||||||
|
Deferred income tax asset valuation allowance
|
$ | 16,216 | $ | 2,509 | $ | - | $ | 473 | $ | 18,252 | ||||||||||
|
Fiscal year 2009:
|
||||||||||||||||||||
|
Bad debt reserve
|
$ | 35 | $ | 32 | $ | (10 | ) (1) | $ | (2 | ) | $ | 59 | ||||||||
|
Inventory reserves
|
$ | 913 | $ | 352 | $ | (12 | ) (1) | $ | 390 | $ | 863 | |||||||||
|
Warranty reserve
|
$ | 655 | $ | 24 | $ | (9 | ) (1) | $ | 109 | $ | 561 | |||||||||
|
Deferred income tax asset valuation allowance
|
$ | 18,252 | $ | 703 | $ | - | $ | 1,531 | $ | 17,424 | ||||||||||
|
Fiscal year 2010:
|
||||||||||||||||||||
|
Bad debt reserve
|
$ | 59 | $ | 53 | $ | (1 | ) (1) | $ | 74 | $ | 37 | |||||||||
|
Inventory reserves
|
$ | 863 | $ | 1,858 | $ | 1 | (1) | $ | 579 |
(2)
|
$ | 2,143 | ||||||||
|
Warranty reserve
|
$ | 561 | $ | (14 | ) | $ | - | $ | 422 | $ | 125 | |||||||||
|
Deferred income tax asset valuation allowance
|
$ | 17,424 | $ | (1,670 | ) | $ | 50 | $ | - | $ | 15,804 | |||||||||
Notes:
| (1) | Due to Foreign Exchange rate translation |
| (2) | FIFO adjustment for standard change of previously reserved obsolete inventory & granulation of obsolete inventory |
82
SIGNATURES
Pursuant to the requirements of Section 13 or 15(d) of the Securities Exchange Act of 1934, the registrant has duly caused this report to be signed on its behalf by the undersigned, thereunto duly authorized:
Dated: June 15, 2010
LASERCARD CORPORATION
| By: | /s/Robert T. DeVincenzi | |
| Robert T. DeVincenzi, Chief Executive Officer | ||
KNOW ALL PERSONS BY THESE PRESENTS, that each person whose signature appears below constitutes and appoints Robert T. DeVincenzi and Steven G. Larson and each of them, acting individually, as his attorney-in-fact, each with full power of substitution and resubstitution, for him and in his name, place and stead, in any and all capacities, to sign any and all amendments to this Annual Report on Form 10-K, and to file the same, with all exhibits thereto, and other documents in connection therewith, with the Securities and Exchange Commission, granting unto said attorneys-in-fact and agents, and each of them, full power and authority to do and perform each and every act and thing requisite and necessary to be done in connection therewith and about the premises, as fully to all intents and purposes as he might or could do in person, hereby ratifying and confirming all that said attorneys-in-fact and agents, or any of them, or their or his substitute or substitutes, may lawfully do or cause to be done by virtue hereof.
Pursuant to the requirements of the Securities Exchange Act of 1934, this report has been signed below by the following persons on behalf of the registrant and in the capacities and on the dates indicated:
| Signature |
Title
|
Date | ||||||||
| /s/ Robert T. DeVincenzi | Chief Executive Officer | June 15, 2010 | ||||||||
| Robert T. DeVincenzi | (Principal Executive Officer) | |||||||||
| Director | ||||||||||
| /s/ Steven G. Larson | Vice President of Finance and Treasurer | June 15, 2010 | ||||||||
| Steven G. Larson | (Principal Financial Officer and | |||||||||
| Principal Accounting Officer) | ||||||||||
| /s/ Bernard C. Bailey | Director | June 9, 2010 | ||||||||
| Bernard C. Bailey | ||||||||||
| /s/ Arthur H. Hausman | Director | June 9, 2010 | ||||||||
| Arthur H. Hausman | ||||||||||
| /s/ Donald E. Mattson | Director | June 9, 2010 | ||||||||
| Donald E. Mattson | ||||||||||
| /s/ Albert J. Moyer | Director | June 9, 2010 | ||||||||
| Albert J. Moyer | ||||||||||
| /s/ Walter F. Walker | Director | June 9, 2010 | ||||||||
Walter F. Walker
83
INDEX TO EXHIBITS
[ITEM 14(c)]
|
Exhibit
|
|||
|
Number
|
Description
|
||
|
3(I)
|
Amended and Restated Certificate of Incorporation; previously filed as Exhibit 3.1 to Annual Report on Form 10-K for the fiscal year ended March 31, 2005 and incorporated herein by reference
|
||
|
3(II)
|
Amended and Restated By-Laws; previously filed as Exhibit 3.1 to Current Report on Form 8-K on July 29, 2009 and incorporated herein by reference
|
||
|
10.1
|
Building lease agreement with Renault & Handley Employees Investment Co. for 2644-2648 Bayshore Parkway, Mountain View, CA; previously filed as Exhibit 10.1 to Quarterly Report on Form 10-Q for period ending December 31, 2003 and incorporated herein by reference
|
||
|
10.2
|
Building lease agreement with Shoreline Park LLC for 1395 Charleston Road, Mountain View, CA (mailing address 1875 North Shoreline Boulevard, Mountain View, CA); previously filed as Exhibit 10.2 to Annual Report on Form 10-K for fiscal year ended March 31, 2004 and incorporated herein by reference
|
||
|
10.3
|
Amended and Restated Stock Option Plan; previously filed as Exhibit 10.4.1 to Quarterly Report on Form 10-Q for period ended September 30, 2002 and incorporated herein by reference
|
||
|
10.4
|
Optical Card Manufacturing License Agreement with Global Investments Group; previously filed as Exhibit as Exhibit 10.8 to Annual Report on Form 10-K for fiscal year ended March 31, 2004 and incorporated herein by reference**
|
||
|
10.5*
|
2004 Equity Incentive Compensation Plan, as Amended; previously filed as Appendix A to Schedule 14A Proxy Statement for 2005 Annual Stockholders Meeting on September 6, 2005 and incorporated herein by reference
|
||
|
10.6
|
June 29, 2006 Amendment to License and Equipment Agreement with Global Investments Group and Prevent LOK; previously filed as Exhibit 10.10 to Report on Form 10-Q for period ending June 30, 2006 and incorporated herein by reference**
|
||
|
10.7
|
October 27, 2006 Modified Third Amendment to License and Equipment Agreements with Global Investments Group and Prevent LOK; previously filed as Exhibit 10.11 to Current Report on Form 8-K on November 1, 2006 and incorporated herein by reference
|
||
|
10.8*
|
Employee Stock Purchase Plan, as Amended; previously filed as Appendix A to amended Schedule 14A Proxy Statement for 2007 Annual Stockholders Meeting on August 3, 2007, and incorporated herein by reference
|
||
|
10.9*
|
November 28, 2007, Planned Retirement Agreement and Age Discrimination Release Agreement with Richard M. Haddock; previously filed as Exhibit 10.13 to Quarterly Report on Form 10-Q for period ended December 31, 2007 and incorporated herein by reference
|
||
|
10.10*
|
January 8, 2010, Executive Employment Agreements with Christopher J. Dyball and Steven G. Larson; previously filed as Exhibits 10.1 and 10.2, respectively, to Current Report on Form 8-K on January 8, 2010 and incorporated herein by reference
|
||
|
10.11
|
UBS AG Credit Line Agreement and Approval dated December 5, 2008 previously filed as Exhibit 10.1 to Quarterly Report on Form 10-Q for period ended December 31, 2008
|
||
|
10.12*
|
June 2, 2008, Executive Employment Agreement with Robert T. DeVincenzi; previously filed as Exhibit 10.1 to Quarterly Report on Form 10-Q for period ended June 30, 2008
|
||
84
|
10.13*
|
June 2, 2008, Restricted Stock Award of Robert T. DeVincenzi; previously filed as Exhibit 10.2 to Quarterly Report on Form 10-Q for period ended June 30, 2008
|
||
|
10.14*
|
June 2, 2008, Non-Statutory Stock Option Agreements of Robert T. DeVincenzi; previously filed as Exhibit 10.3 to Quarterly Report on Form 10-Q for period ended June 30, 2008
|
||
|
10.15*
|
2004 Equity Incentive Compensation Plan, as Amended; previously filed as Exhibit 10.18 to Current Report on Form 8-K on September 22, 2008 and incorporated herein by reference
|
||
|
10.16*
|
LaserCard Executive Bonus Plan; previously filed as Exhibit 10.1 to Current Report on Form 8-K on July 29, 2009 and incorporated herein by reference
|
||
|
21
|
Subsidiaries of the Registrant; filed herewith
|
||
|
23.1
|
Consent of SingerLewak LLP, Independent Registered Public Accounting Firm; filed herewith
|
||
|
23.2
|
Consent of Odenberg, Ullakko, Muranishi & Co. LLP, Independent Registered Public Accounting Firm; filed herewith
|
||
|
24
|
Power of Attorney; filed herewith
|
||
|
31.1
|
Chief Executive Officer Certification pursuant to Section 302 of the Sarbanes-Oxley Act of 2002; filed herewith
|
||
|
31.2
|
Chief Financial Officer Certification pursuant to Section 302 of the Sarbanes-Oxley Act of 2002; filed herewith
|
||
|
32.1
|
Chief Executive Officer Certification pursuant to 18 U.S.C. Section 1350, as adopted pursuant to Section 906 of the Sarbanes-Oxley Act of 2002; filed herewith
|
||
|
32.2
|
Chief Executive Officer Certification pursuant to 18 U.S.C. Section 1350, as adopted pursuant to Section 906 of the Sarbanes-Oxley Act of 2002; filed herewith
|
||
*Indicates management contract or compensatory plan or arrangement.
**Portions were omitted pursuant to a request for confidential treatment.
85