Attached files
| file | filename |
|---|---|
| 8-K - CURRENT REPORT ON FORM 8-K - DELTA AIR LINES, INC. | delta_8k-061510.htm |
| EX-99.2 - PRESS RELEASE - DELTA AIR LINES, INC. | delta_8k-ex9902.htm |
Exhibit 99.1
Delta: A Solid Flight Plan Ed Bastian, President June 15, 2010
Safe Harbor This presentation contains various projections and other forward-looking statements which represent Delta’s estimates or expectations regarding future events. All forward-looking statements involve a number of assumptions, risks and uncertainties, many of which are beyond Delta’s control, that could cause the actual results to differ materially from the projected results. Factors which could cause such differences include, without limitation, business, economic, competitive, industry, regulatory, market and financial uncertainties and contingencies, as well as the “Risk Factors” discussed in Delta’s Form 10-K filed with the SEC on February 24, 2010 as well as Delta’s Form 10-Q filed with the SEC on April 22, 2010. Caution should be taken not to place undue reliance on Delta’s forward-looking statements, which represent Delta’s views only as of the date of this presentation, and which Delta has no current intention to update. In this presentation, we will discuss certain non-GAAP financial measures. You can find the reconciliations of those measures to comparable GAAP measures on our website at delta.com.
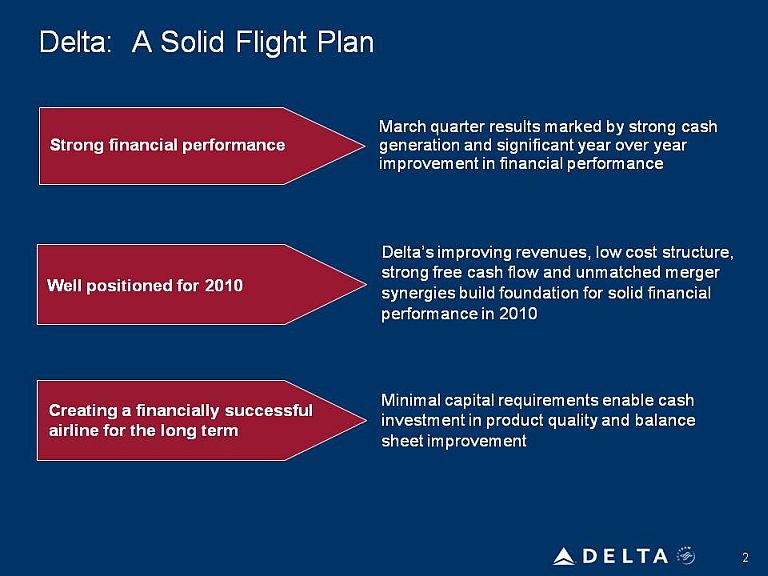
Strong financial performance Well positioned for 2010 Creating a financially successful airline for the long term March quarter results marked by strong cash generation and significant year over year improvement in financial performance Delta’s improving revenues, low cost structure, strong free cash flow and unmatched merger synergies build foundation for solid financial performance in 2010 Minimal capital requirements enable cash investment in product quality and balance sheet improvement
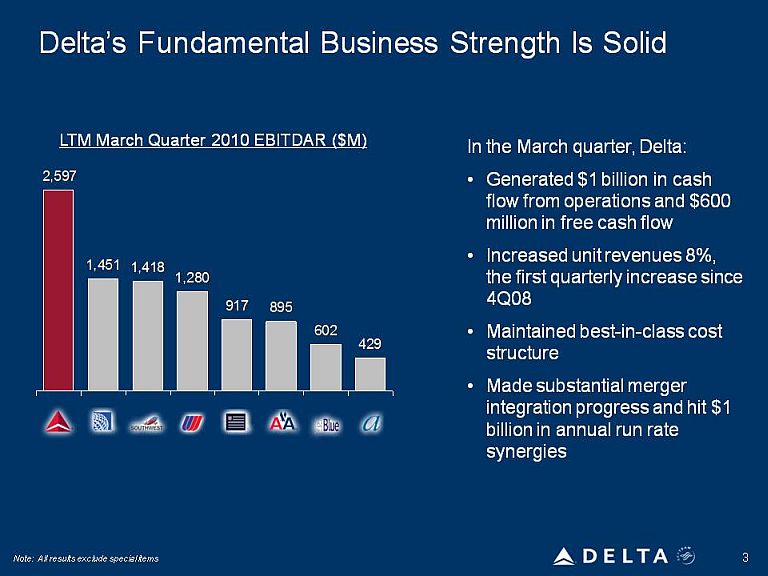
Delta’s Fundamental Business Strength Is Solid LTM March Quarter 2010 EBITDAR ($M) In the March quarter, Delta: Generated $1 billion in cash flow from operations and $600 million in free cash flow Increased unit revenues 8%, the first quarterly increase since 4Q08 Maintained best-in-class cost structure Made substantial merger integration progress and hit $1 billion in annual run rate synergies 2,597 1,451 1,418 1,280 917,895,602,429
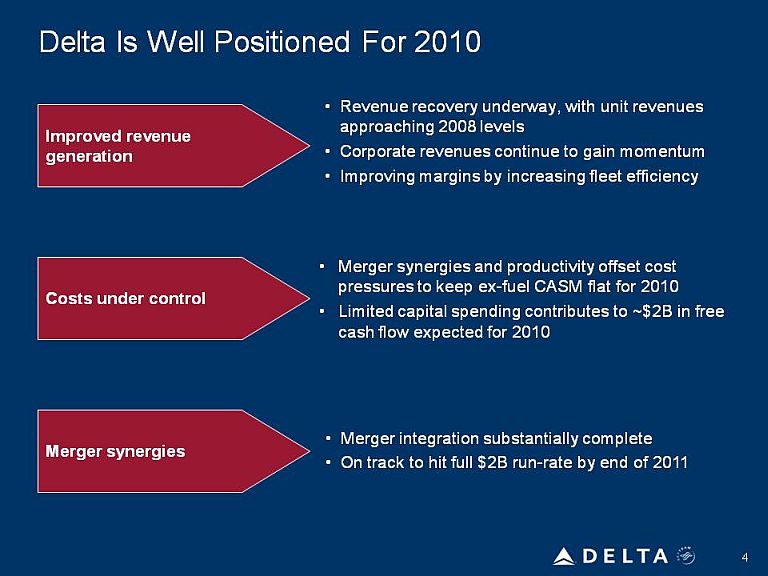
Delta Is Well Positioned For 2010 Improved revenue generation Costs under control Merger synergies Revenue recovery underway, with unit revenues approaching 2008 levels Corporate revenues continue to gain momentum Improving margins by increasing fleet efficiency Merger synergies and productivity offset cost pressures to keep ex-fuel CASM flat for 2010 Limited capital spending contributes to ~$2B in free cash flow expected for 2010 Merger integration substantially complete On track to hit full $2B run-rate by end of 2011
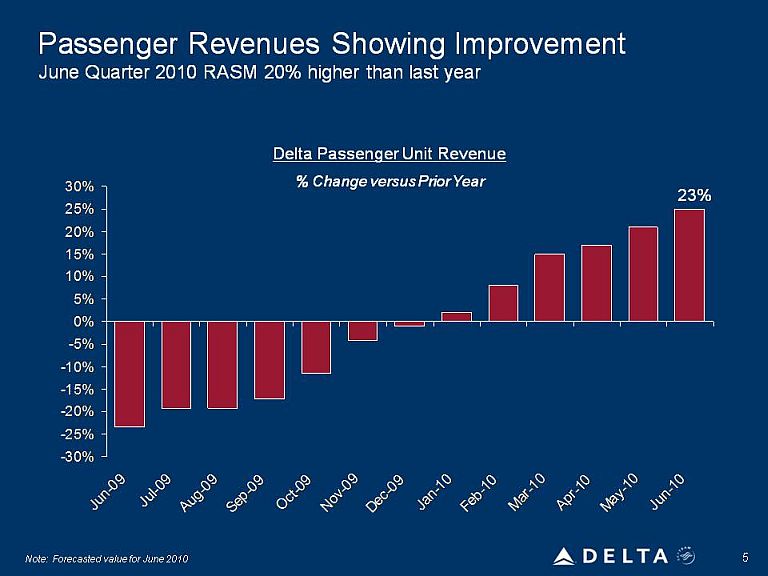
Passenger Revenues Showing Improvement June Quarter 2010 RASM 20% higher than last year Delta Passenger Unit Revenue % Change versus Prior Year
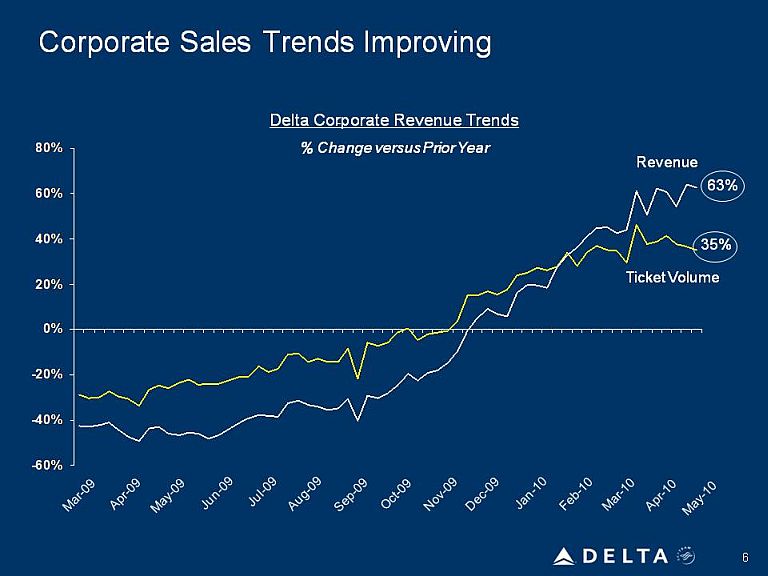
Corporate Sales Trends Improving Delta Corporate Revenue Trends % Change versus Prior Year
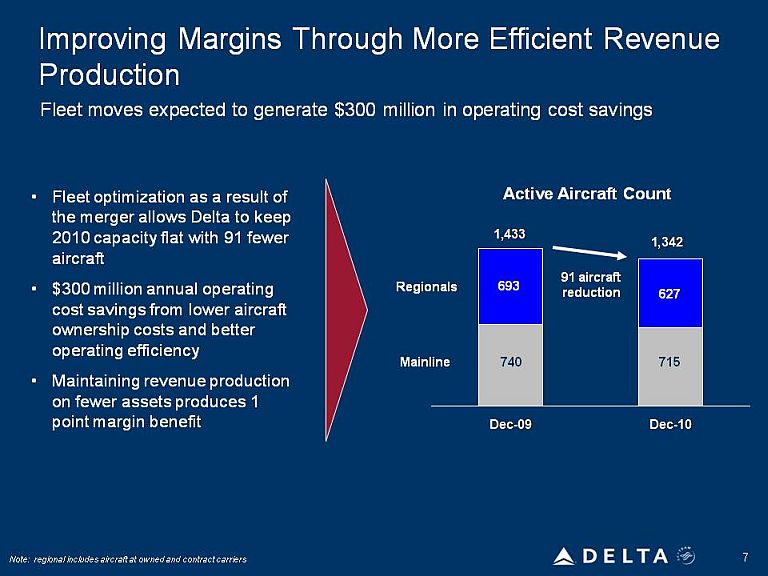
Improving Margins Through More Efficient Revenue Production Fleet moves expected to generate $300 million in operating cost savings Fleet optimization as a result of the merger allows Delta to keep 2010 capacity flat with 91 fewer aircraft $300 million annual operating cost savings from lower aircraft ownership costs and better operating efficiency Maintaining revenue production on fewer assets produces 1 point margin benefit Active Aircraft Count Regionals Mainline 91 aircraft reduction 1,433 1,342 693 740 627 715 Dec-09 Dec-10
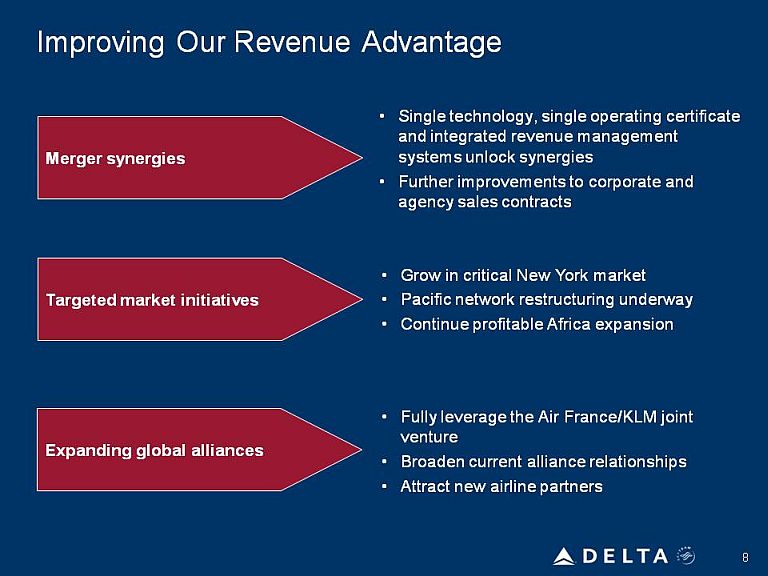
Improving Our Revenue Advantage Merger synergies Targeted market initiatives Expanding global alliances Single technology, single operating certificate and integrated revenue management systems unlock synergies Further improvements to corporate and agency sales contracts Grow in critical New York market Pacific network restructuring underway Continue profitable Africa expansion Fully leverage the Air France/KLM joint venture Broaden current alliance relationships Attract new airline partners
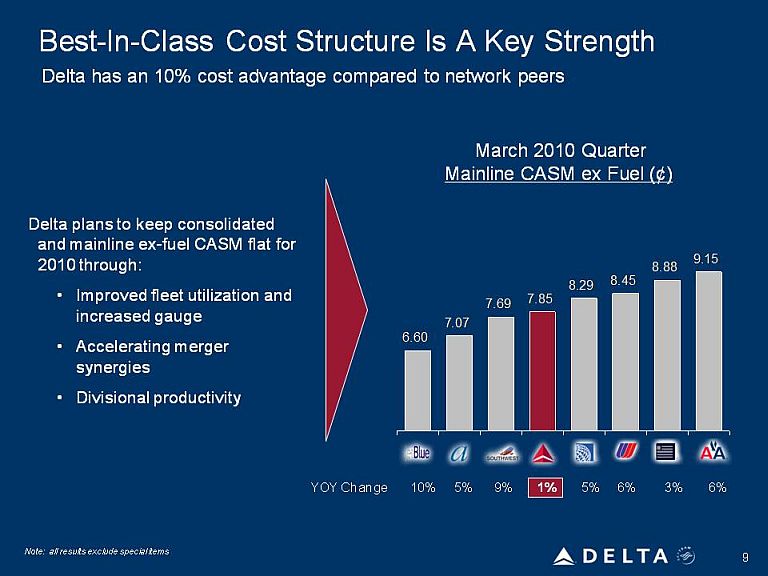
Best-In-Class Cost Structure Is A Key Strength Delta has an 10% cost advantage compared to network peers Delta plans to keep consolidated and mainline ex-fuel CASM flat for 2010 through: Improved fleet utilization and increased gauge Accelerating merger synergies Divisional productivity March 2010 Quarter Mainline CASM ex Fuel (¢) 6.60 7.07 7.69 7.85 8.29 8.45 8.88 9.15 10% 5% 9% 1! 5% 6% 3% 6%
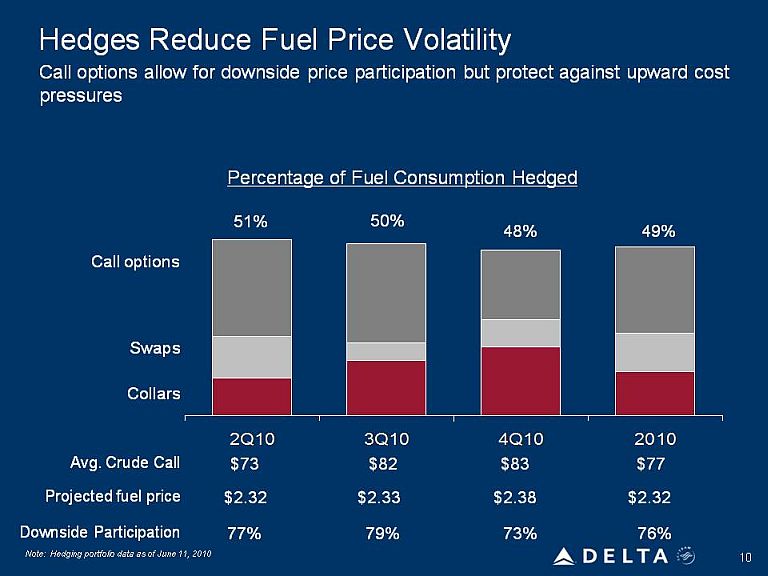
Hedges Reduce Fuel Price Volatility Call options allow for downside price participation but protect against upward cost pressures Percentage of Fuel Consumption Hedged Call options swaps collars Avg. Crude Call Projected fuel price Downside Participation 51% 50% 48% 49% 73 82 83 77 2.32 2.33 2.38 2.32 77 79 73 76 2Q10 3Q10 4Q10 2010
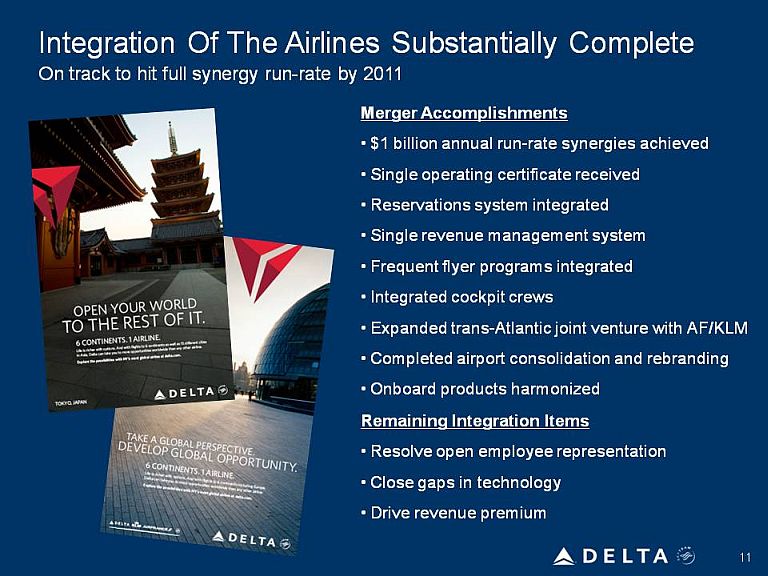
Integration Of The Airlines Substantially Complete On track to hit full synergy run-rate by 2011 Merger Accomplishments $1 billion annual run-rate synergies achieved Single operating certificate received Reservations system integrated Single revenue management system Frequent flyer programs integrated Integrated cockpit crews Expanded trans-Atlantic joint venture with AF/KLM Completed airport consolidation and rebranding Onboard products harmonized Remaining Integration Items Resolve open employee representation Close gaps in technology Drive revenue premium
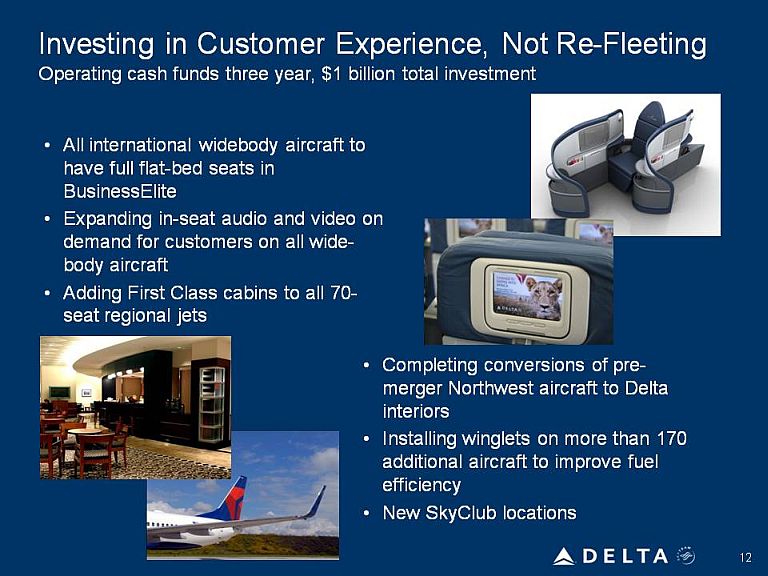
Investing in Customer Experience, Not Re-Fleeting Operating cash funds three year, $1 billion total investment All international widebody aircraft to have full flat-bed seats in BusinessElite Expanding in-seat audio and video on demand for customers on all wide-body aircraft Adding First Class cabins to all 70-seat regional jets Completing conversions of pre-merger Northwest aircraft to Delta interiors Installing winglets on more than 170 additional aircraft to improve fuel efficiency New SkyClub locations
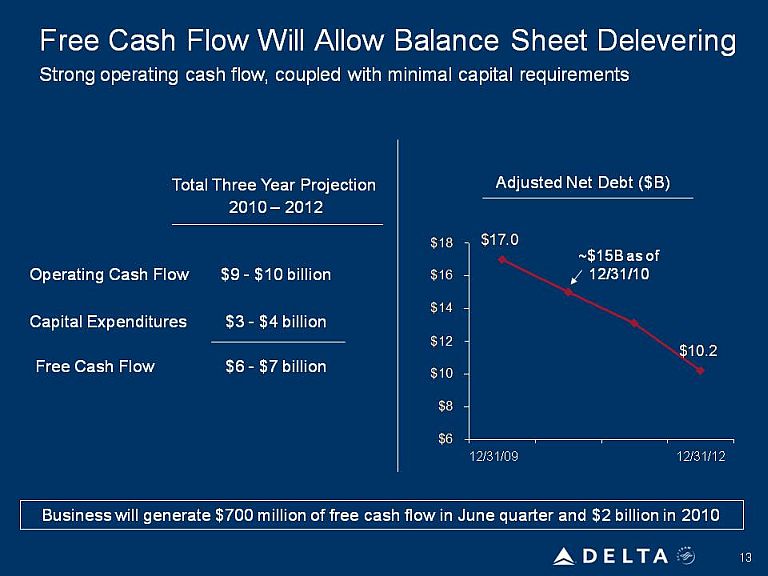
Free Cash Flow Will Allow Balance Sheet Delevering Strong operating cash flow, coupled with minimal capital requirements Total Three Year Projection 2010 – 2012 Operating Cash Flow Capital Expenditures Free Cash Flow Adjusted Net Debt ($B) Business will generate $700 million of free cash flow in June quarter and $2 billion in 2010
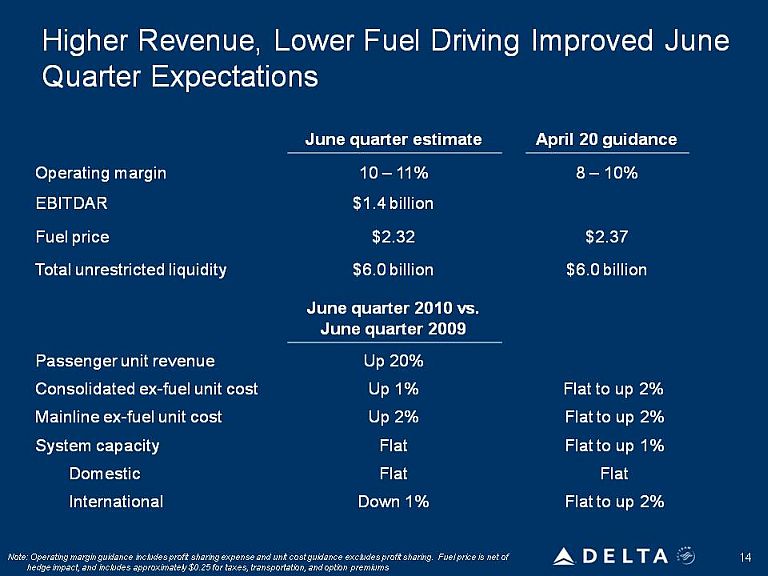
Higher Revenue, Lower Fuel Driving Improved June Quarter Expectations June quarter estimate April 20 guidance Operating margin EBITDAR Fuel price Total unrestricted liquidity June quarter 2010 vs. June quarter 2009 Passenger unit revenue Consolidated ex-fuel unit cost Mainline ex-fuel unit cost System capacity Domestic International Flat up to Up Down Note: Operating margin guidance includes profit sharing expense and unit cost guidance excludes profit sharing. Fuel price is net of hedge impact, and includes approximately $0.25 for taxes, transportation, and option premiums
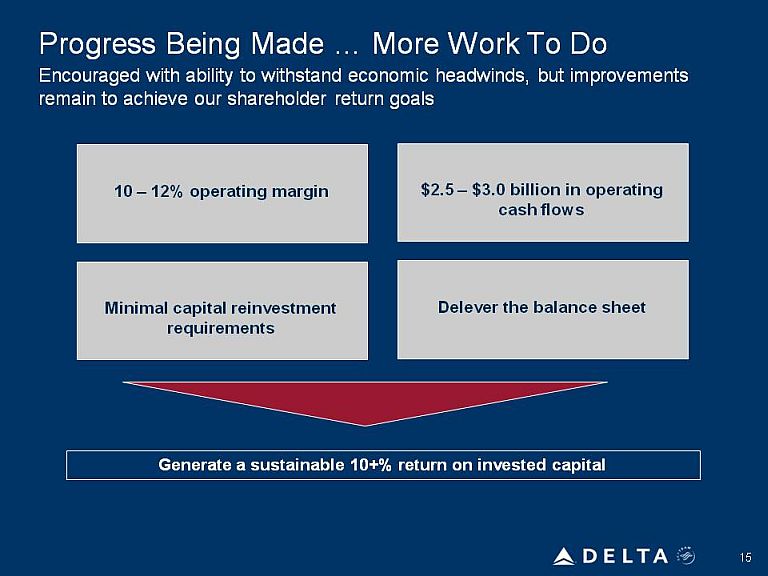
Progress Being Made … More Work To Do Encouraged with ability to withstand economic headwinds, but improvements remain to achieve our shareholder return goals 10 – 12% operating margin Minimal capital reinvestment requirements Minimal capital reinvestment requirements Delever the balance sheet Generate a sustainable 10+% return on invested capital
|
Non-GAAP Financial Measures
|
||||||||||
|
We sometimes use information that is derived from our Consolidated Financial Statements, but that is not presented in accordance with accounting principles generally accepted in the U.S. (“GAAP”). Certain of this information is considered “non-GAAP financial measures” under the U.S. Securities and Exchange Commission rules. The non-GAAP financial measures should be considered in addition to results prepared in accordance with GAAP, but should not be considered a substitute for or superior to GAAP results.
|
||||||||||
|
Delta is unable to reconcile certain forward-looking projections to GAAP as the nature or amount of special items cannot be estimated at this time.
|
||||||||||
|
Delta excludes special items because management believes the exclusion of these items is helpful to investors to evaluate the company's recurring operational performance.
|
||||||||||
|
Earnings before interest, taxes, depreciation, amortization and aircraft rent (EBITDAR) has been presented as management believes it is helpful to investors in utilizing EBITDAR as a proxy for operating cash flow on a period over period basis.
|
||||||||||
|
Delta presents free cash flow because management believes this is a widely used metric that is helpful to investors to evaluate cash available to enhance shareholder value.
|
||||||||||
|
Delta presents consolidated cost per available seat mile (CASM) excluding fuel expense and related taxes because management believes the volatility in fuel prices impacts the comparability of year-over-year financial performance.
Consolidated CASM excludes ancillary businesses not associated with the generation of a seat mile. These businesses include expenses related to Delta’s providing maintenance services (MRO), staffing services and dedicated freight operations as well as Delta’s vacation wholesale operations.
|
||||||||||
|
Delta uses adjusted total debt, including aircraft rent, in addition to long-term adjusted debt and capital leases, to present estimated
financial obligations. Delta reduces adjusted total debt by cash and cash equivalents and short-term investments, to present the amount of
additional assets needed to satisfy the debt.
|
||||||||||
|
The non-GAAP financial measures should be considered in addition to results prepared in accordance with GAAP, but should
not be considered a substitute for or superior to GAAP results.
|
||||||||||
|
EBITDAR
|
|
Last Twelve
|
||||
|
Months (LTM) Ended
|
||||
|
March 31, 2010
|
||||
|
(in millions)
|
||||
|
Pre-tax loss
|
$ | (1,033 | ) | |
|
Other non-operating expense, net
|
1,260 | |||
|
Depreciation and amortization
|
1,537 | |||
|
Aircraft rent
|
471 | |||
|
Items excluded:
|
||||
|
Restructuring and merger-related items
|
362 | |||
|
EBITDAR excluding special items
|
$ | 2,597 | ||
|
Free Cash Flow
|
|||
|
Three Months Ended
|
||||
|
(in millions)
|
March 31, 2010
|
|||
|
GAAP Net cash provided by operating activities
|
$ | 966 | ||
|
GAAP Net cash used in investing activities
|
(293 | ) | ||
|
|
||||
|
Change in short term investments
|
(73 | ) | ||
|
Aircraft purchases under seller financing
|
(21 | ) | ||
|
Payments under seller financing
|
6 | |||
|
Total free cash flow
|
$ | 585 | ||
|
Mainline Non-Fuel CASM
|
|
Three Months Ended
|
||||
|
(in millions, except per cent data)
|
March 31, 2010
|
|||
|
Consolidated operating expense
|
$ | 6,780 | ||
|
Less regional carriers operating expense
|
(1,482 | ) | ||
|
Mainline operating expense
|
$ | 5,298 | ||
|
Mainline CASM
|
11.62 | ¢ | ||
|
Items excluded:
|
||||
|
Ancillary businesses
|
(0.28 | ) | ||
|
Restructuring and merger-related items
|
(0.10 | ) | ||
|
Fuel expense and related taxes
|
(3.39 | ) | ||
|
Mainline CASM excluding fuel expense and related taxes and special items
|
7.85 | ¢ | ||
|
Available seat miles
|
45,610 | |||
|
Adjusted Net Debt
|
|
Year Ended
|
||||||||
|
(in billions)
|
December 31, 2009
|
|||||||
|
Debt and capital lease obligations
|
$ | 17.2 | ||||||
|
Plus: unamortized discount, net from purchase accounting and fresh start reporting
|
1.1 | |||||||
|
Adjusted debt and capital lease obligations
|
$ | 18.3 | ||||||
|
Plus: 7x last twelve months' aircraft rent
|
3.4 | |||||||
|
Adjusted total debt
|
21.7 | |||||||
|
Less: cash and cash equivalents and short-term investments
|
(4.7 | ) | ||||||
|
Adjusted net debt
|
$ | 17.0 | ||||||