Attached files
| file | filename |
|---|---|
| EX-31.1 - VALENCE TECHNOLOGY INC | ex31-1.htm |
| EX-21.1 - VALENCE TECHNOLOGY INC | ex21-1.htm |
| EX-32.2 - VALENCE TECHNOLOGY INC | ex32-2.htm |
| EX-23.1 - VALENCE TECHNOLOGY INC | ex23-1.htm |
| EX-31.2 - VALENCE TECHNOLOGY INC | ex31-2.htm |
| EX-32.1 - VALENCE TECHNOLOGY INC | ex32-1.htm |
UNITED STATES
SECURITIES AND EXCHANGE COMMISSION
WASHINGTON, D.C. 20549
FORM 10-K
|
x
|
ANNUAL REPORT PURSUANT TO SECTION 13 OR 15(d) OF THE SECURITIES AND EXCHANGE ACT OF 1934
|
For the fiscal year ended March 31, 2010
OR
|
o
|
TRANSITION REPORT PURSUANT TO SECTION 13 OR 15(d) OF THE SECURITIES EXCHANGE ACT OF 1934
|
For the transition period from to
Commission file number 0-20028
VALENCE TECHNOLOGY, INC.
(Exact name of Registrant as specified in its charter)
|
DELAWARE
|
77-0214673
|
|
|
(State or other jurisdiction of
|
(I.R.S. Employer
|
|
|
incorporation or organization)
|
Identification No.)
|
|
|
12303 TECHNOLOGY BOULEVARD, SUITE 950
|
||
|
AUSTIN, TEXAS
|
78727
|
|
|
(Address of principal executive offices)
|
(Zip Code)
|
Registrant’s telephone number, including area code: (512) 527-2900
Securities registered pursuant to Section 12(b) of the Act:
None
Securities registered pursuant to Section 12(g) of the Act:
Common stock, $.001 par value
Indicate by check mark if the Registrant is a well-known seasoned issuer, as defined in Rule 405 of the Securities Act. Yes o No x
Indicate by check mark if the Registrant is not required to file reports pursuant to Section 13 or Section 15(d) of the Exchange Act. Yes o No x
Indicate by check mark whether the Registrant: (1) has filed all reports required to be filed by Section 13 or 15(d) of the Securities Exchange Act of 1934 during the preceding 12 months and (2) has been subject to such filing requirements for the past 90 days. Yes x No o
Indicate by check mark whether the registrant has submitted electronically and posted on its corporate Web site, if any, every Interactive Data File required to be submitted and posted pursuant to Rule 405 of Regulation S-T (§ 229.405 of this chapter) during the preceding 12 months (or for such shorter period that the registrant was required to submit and post such files). Yes o No o
Indicate by check mark if disclosure of delinquent filers, pursuant to Item 405 of Regulation S-K is not contained herein, and will not be contained, to the best of the Registrant’s knowledge, in definitive proxy or information statements incorporated by reference in Part III of this Form 10-K or any amendment to this Form 10-K. o
Indicate by check mark whether the Registrant is a large accelerated filer, an accelerated filer or a non-accelerated filer. See definition of “accelerated filer” or “large accelerated filer” in Rule 12b-2 of the Exchange Act.
|
Large Accelerated Filer o
|
Accelerated Filer x
|
|
Non-accelerated filer o
|
Smaller reporting Company o
|
|
(do not check if a smaller reporting company)
|
Indicate by check mark whether the Registrant is a shell company (as defined in Rule 12b-2 of the Act). Yes o No x
The aggregate market value of the Registrant’s common equity held by non-affiliates was $105,316,757 as of September 30, 2009, the last business day of the registrant’s most recently completed second fiscal quarter and based upon the average bid and asked price of the Registrant’s common stock. This calculation excludes 66,672,813 shares of common stock held by directors, officers and holders of 5% or more of Registrant’s outstanding common stock and such exclusion of shares held by any person should not be construed to indicate that such person possesses the power, direct or indirect, to direct or cause the direction of the management or policies of the Registrant, or that such person is controlled by or under common control with the Registrant.
The number of shares outstanding of the Registrant’s common stock as of May 31, 2010, was 134,945,669.
VALENCE TECHNOLOGY, INC.
ANNUAL REPORT ON FORM 10-K
FISCAL YEAR ENDED MARCH 31, 2010
Table of Contents
| Page | |
|
Forward-Looking Statements
|
1
|
|
PART I
|
2
|
|
Item 1. Business
|
2
|
|
Item 1A. Risk Factors
|
10
|
|
Item 1B. Unresolved Staff Comments
|
23
|
|
Item 2. Properties
|
23
|
|
Item 3. Legal Proceedings
|
24
|
|
PART II
|
25
|
|
Item 4. Market for Registrant’s Common Equity, Related Stockholder Matters and Issuer Purchases of Equity Securities
|
25
|
|
Item 5. Selected Financial Data
|
27
|
|
Item 6. Management’s Discussion and Analysis of Financial Condition and Results of Operation
|
28
|
|
Item 6A. Quantitative and Qualitative Disclosures About Market Risk
|
36
|
|
Item 7. Financial Statements and Supplementary Data
|
38
|
|
Item 8. Changes in and Disagreements With Accountants on Accounting and Financial Disclosure
|
39
|
|
Item 8A. Controls and Procedures
|
39
|
|
Item 8B. Other Information
|
42
|
|
PART III
|
42
|
|
Item 9. Directors and Executive Officers of the Registrant
|
42
|
|
Item 10. Executive Compensation
|
42
|
|
Item 11. Security Ownership of Certain Beneficial Owners and Management and Related Stockholder Matters
|
42
|
|
Item 12. Certain Relationships and Related Transactions
|
42
|
|
Item 13. Principal Accountant Fees and Services
|
61
|
|
PART IV
|
42
|
|
Item 14. Exhibits and Financial Statement Schedules
|
42
|
|
Signatures
|
48
|
This Annual Report on Form 10-K, Form 10-K or this Report, contains statements that constitute “forward-looking statements” within the meaning of Section 21E of the Exchange Act and Section 27A of the Securities Act.
The words “may,” “will,” “expect,” “intend,” “anticipate,” “believe,” “estimate,” “continue,” “predict,” and similar expressions and variations thereof are intended to identify forward-looking statements. These statements appear in a number of places in this Report and the documents incorporated by reference herein and include statements regarding the intent, belief or current expectations of Valence Technology, Inc., to which we refer in this Report and the documents incorporated by reference herein as “Valence,” “we,” “us” or the Company, our directors or officers with respect to, among other things:
· trends affecting our financial condition or results of operations;
· our product development strategies;
· trends affecting our manufacturing capabilities;
· trends affecting the commercial acceptability of our products; and
· our business and growth strategies.
You are cautioned not to put undue reliance on forward-looking statements. Forward-looking statements are not guarantees of future performance and involve risks and uncertainties, and actual results may differ materially from those projected in this Report and the documents incorporated herein by reference. Factors that could cause actual results to differ materially include those discussed under “Risk Factors,” which include, but are not limited to the following:
· our ability to develop and market products that compete effectively in targeted market segments;
· market acceptance of our current and future products;
· our ability to meet customer demand;
· our ability to perform our obligations under our loan agreements;
· a loss of one of our key customers;
· our ability to implement our long-term business strategy that will be profitable and/or generate sufficient cash flow;
· the ability of our vendors to provide conforming materials for our products on a timely basis;
· the loss of any of our key executive officers;
· our ability to manage our foreign manufacturing and development operations;
· international business risks;
· our ability to attract skilled personnel;
· our ability to protect and enforce our current and future intellectual property;
· international business risks;
· our need for additional, dilutive financing or future acquisitions;
· our ability to meet the continued listing requirements of the NASDAQ Capital Market; and
· future economic, business and regulatory conditions.
We believe that it is important to communicate our future expectations to investors. However, there may be events in the future that we are not able to accurately predict or control. The factors discussed under “Item 1A - Risk Factors” or the documents incorporated by reference herein, as well as any cautionary language in this Report or the documents incorporated by reference herein, provide examples of risks, uncertainties and events that may cause our actual results to differ materially from the expectations we described in our forward-looking statements. Except as required by law, we undertake no obligation to update publicly any forward-looking statements, whether as a result of new information, future events or otherwise.
1
ITEM 1. BUSINESS
The Company was founded in 1989 and has commercialized the industry’s first lithium phosphate technology. We develop, manufacture and sell dynamic energy systems utilizing our proprietary phosphate-based lithium-ion technology. Our mission is to promote the wide adoption of high-performance, safe, long cycle life, environmentally friendly, low-cost energy storage systems. To accomplish our mission and address the significant market opportunity we believe is available to us, we utilize the numerous benefits of our latest energy storage technology, worldwide intellectual property portfolio and extensive experience of our management team. We are an international leader in the development of lithium iron magnesium phosphate dynamic energy storage systems. We have redefined lithium battery technology and performance by marketing the industry’s first safe, reliable and rechargeable lithium iron magnesium phosphate battery for diverse applications, with special emphasis on motive, marine, industrial and stationary markets.
In November 2009 we introduced a Revision 2 of our U-Charge® Lithium Phosphate Energy Storage Systems, which became commercially available in the fourth quarter of fiscal year 2010. Our U-Charge® systems feature our safe, long-life lithium phosphate technology which utilizes a phosphate-based cathode material. We believe that the improved features and functionality of the latest U-Charge® lithium phosphate energy storage systems are well suited for electric vehicle (EV), plug-in hybrid electric vehicle (PHEV) and similar applications. U-Charge® lithium phosphate energy storage systems address the safety and limited life weaknesses of other lithium technologies while offering a solution that is competitive in cost and performance. This Revision 2 of our U-Charge® system builds upon these features and adds improvements in state of charge monitoring, cell pack balancing, battery monitoring and diagnostics, and certain field repairability.
In addition to the U-Charge® family of products, we offer the materials, cells and systems, developed over 20 years, to address a large number of custom energy storage needs.
Markets
We have identified five key market sectors where we will focus our strategy:
Motive
We are enabling efficient transportation solutions from all-electric and hybrid personal transporters to commercial delivery vehicles and mass transit buses. These quiet, powerful, low to zero-emission vehicles need portable power solutions to operate efficiently. Our Lithium Iron Magnesium Phosphate Energy Storage System offers an enhanced combination of performance, safety, cost, reliability and environmental characteristics and lower lifetime cost. We are working with a global customer base to deliver motive solutions for hybrid electric vehicles (HEVs), PHEVs, EVs, and neighborhood electric vehicles (NEVs) including car, bus, truck, tram, scooter and motorbike applications.
Stationary
Stationary Energy Storage Systems are designed to provide electrical power to large systems during instances of power outages. They are used in equipment dedicated to stabilizing voltages by eliminating irregularities in systems that generate electrical power. The storage systems can hold large loads temporarily as utility power switches from one generation source to another. Hence, applications such as uninterruptible power supplies (UPS), DC power systems, frequency regulation, community storage, emergency lighting, starter systems, security alarms, and switchgear primarily drive the market for stationary batteries. Our Lithium Phosphate Energy Storage Systems offer large format back-up and UPS solutions for commercial and utilities applications.
Industrial
The Industrial market sector includes applications where the majority of the battery’s energy is used in cleaning and lifting, powering or handling goods or materials rather than propelling the application. This includes applications such as floor cleaners, forklifts, medical carts, defibrillators, wheelchairs, robotics and other industrial tools.
Military
The Military market sector includes applications from each of the above market sectors; however this market is different relative to its unique requirements and barriers to entry. The main focus for military applications include robotics, communications, survey equipment and auxiliary power systems. The motive applications in the Military sector include EVs, HEVs and PHEVs in armored and non-armored vehicles, as well as marine, submarine and aviation applications.
Marine
The Marine market sector includes applications such as hybrid yachts, tug boats, and other vessels that you would find on the open water. Harbors are one of the most polluted areas in the world in terms of both air and noise pollution. Our products enable yachts, such as those made by BJ Technologie, a subsidiary of Bénéteau Group, to enter and exit harbors in an all-electric, non-polluting mode.
2
Strategy
Our business plan and strategy focuses on the generation of revenue from product sales, while minimizing costs through partnerships with contract manufacturers and internal manufacturing efforts through our two wholly-owned subsidiaries in China. These subsidiaries initiated operations in late fiscal 2005. We expect to develop target markets through the sales of U-Charge® systems and dynamic energy storage systems based on programmable Command and Control Logic. In addition, we expect to pursue a licensing strategy to supply the lithium phosphate sector with advanced Valence material and components, including lithium phosphate cathode materials to fulfill other manufacturers’ needs.
Key elements of our business strategy include:
|
·
|
Develop and market differentiated battery solutions for a wide array of applications that leverage the advantages of our technologies. We are committed to the improvement of our technologies, our energy storage systems, integration of our energy storage systems into our customer applications and further development of worldwide suppliers to serve the rapidly expanding lithium phosphate sector. Our product development and marketing efforts are focused on large-format battery solutions, such as our U-Charge® Lithium Iron Magnesium Phosphate Energy Storage Systems and other custom battery solutions that feature advanced performance and technological advantages. These products are targeted for a broad range of applications in the motive, power and consumer appliance, telecommunication and utility industries, and as a substitute for certain applications using lead-acid batteries.
|
|
·
|
Manufacture high-quality, cost-competitive products using a combination of Company owned and contract manufacturing facilities. Our products are manufactured in China, using both internal and contract manufacturing resources. Our company-owned China facility includes two plants: one manufactures our advanced lithium iron magnesium phosphate materials with our patented carbon-thermal reduction process, and the second manufactures our advanced standard large-format packs such as U-Charge® and custom packs for customers such as Segway Inc. We have arrangements with contract manufacturers for cylindrical cell production. We believe this manufacturing strategy will allow us to directly control our intellectual property and operations management as well as deliver high-quality products that meet the needs of a broad range of customers and applications.
|
Our business strategy is being implemented in phases, each building on the previous one:
|
·
|
Current Phase: Our current business strategy is focused on developing applications that deliver superior energy storage solution to address the desired performance goals of the end user. Throughout this phase we have utilized our mature technology, the intellectual property developed during the 20 year life of Valence, and critical “on-the-road”, “on-line” experience to expand our commercial opportunities. Our current Revision 2 of our U-Charge® Dynamic Energy Systems is designed for a broad base of motive, marine, industrial, and stationary applications offering superior performance, safety, long life, lower lifetime cost and no maintenance.
|
|
·
|
Next Phase: We are now entering the next phase of our business strategy. During this growth phase we are utilizing the word-of-mouth recommendations of our early customers, the engineering benefits we enjoy with emerging development partners and reliable in-use experience to expand our presence in target global markets.
|
|
·
|
Transition Phase: Looking toward the immediate future our business strategy will entail the commercialization of our patented Lithium Vanadium Phosphate (LVP) and Lithium Vanadium Phosphate Fluoride (LVPF) cathode materials into large-format, high capacity cells. These materials offer superior performance and the protection for our customers afforded by our worldwide intellectual patent portfolio.
|
We believe our commercial growth strategy will allow us to expand into emerging market applications through the sales of Valence products based on our differentiated technology, design and application engineering capabilities, global fulfillment services and our proven lower cost, high volume manufacturing. Further we believe Valence is uniquely positioned to license our technology to key component and material manufacturers, such as manufacturers of lithium phosphate cells and packs to further accelerate growth within the worldwide lithium phosphate sector.
We believe we are uniquely positioned for growth due to the following:
|
·
|
Leading Technology. We believe that our phosphate-based lithium-ion technologies and manufacturing processes offers many performance advantages over competing battery technologies. The safety, long life and other advantages inherent in our technology enable the design of large-format, lower cost lithium-ion energy systems. As the first company in the battery industry to commercialize phosphates, we believe that we have a significant advantage in terms of time to market as well as chemistry, advanced energy storage system development and manufacturing expertise.
|
|
·
|
New Market Opportunities. Our technology enables the production of high energy density, large-format batteries while reducing the safety concerns presented by oxide-based lithium-ion batteries. Consequently, our lithium phosphate technology energy and power systems can be designed into a wide variety of products in markets not served by current oxide-based lithium-ion technology. We intend to expand the market opportunities for lithium-ion by designing our technology into a wide variety of products for the motive, power and consumer appliance, telecommunication and utility industries.
|
3
|
·
|
New Valence Market Focus. Over 20 years we have transitioned from a technology developer to a commercial provider of advanced energy storage systems. Our patent estate continues to expand. Our technology is maturing and has been tested in commercial applications. Our manufacturing capacity has been expanded and is ISO 9001 certified. Our application engineers are recognized experts in the integration of our systems into customer applications. We have strengthened our marketing and sales resources. Our full service fulfillment services in Europe, North America and China are on-line. We have developed what we believe to be a world-class supplier base of raw materials and components to support our manufacturing, and our senior management team has extensive international technology experience.
|
|
·
|
Lithium Phosphate-Based Technology: We developed and commercialized the first lithium phosphate energy power systems with our lithium iron magnesium phosphate technology. We have two following generations of cathode materials in our proprietary Lithium Vanadium Phosphate and Lithium Vanadium Fluorophosphates cathode applications, both positioned to advance lithium phosphate cathode applications to the next level of applications and use.
|
Fiscal Year 2010 Highlights
Following are some of the key Company events and accomplishments in pursuit of our strategy during the 2010 fiscal year:
|
·
|
We introduced a Revision 2 of our U-Charge® brand of intelligent battery packs.
|
|
·
|
In a growing number of cases our ongoing customer qualification tests are successfully concluding, and we are seeing these evaluation customers transition from evaluation mode to commercial production.
|
|
·
|
We continued to sign multi-year manufacturing agreements with major customers in motive, marine, stationary and industrial sectors.
|
|
·
|
We were awarded 4 new patents in the U.S. and 16 worldwide patents during the 2010 fiscal year.
|
Evolution of our Battery Technology
Continuing Development of Valence Lithium Phosphate Technology
Our first generation Lithium Iron Magnesium Phosphate Material was successfully commercially produced in 2002 using our proprietary Bellcore technology, and in fiscal 2004 it was introduced in a cylindrical construction. Throughout fiscal 2005, our development team focused on increasing capacity of the energy cell, offering other constructions, and designed a power cell configuration. In late fiscal 2005, our team implemented additional product changes which increased the capacity of the energy cell.
We continue to develop two, next-generation, lithium phosphate cathode materials: Lithium Vanadium Phosphate and Lithium Vanadium Fluorophosphate. These materials not only augment our current commercial lithium iron magnesium phosphate, but also offer superior performance with additional energy storage and higher voltage capabilities for the motive, power and consumer appliance, telecommunication, utility and other industries.
Development of Improvements to Our Battery Packs
We are committed to the improvement of our technologies, our energy storage systems, integration of our energy storage systems into our customer applications, and further development of worldwide suppliers to serve the rapidly expanding lithium phosphate sector. We are continuing to further our development of products including our latest U-Charge® Lithium Iron Magnesium Phosphate Energy Storage Systems which began selling in the fourth quarter of fiscal year 2010. This latest Revision 2 features improved battery management, reporting capability that is superior to other rechargeable battery packs, field serviceability, and many other advanced features. Our Command and Control Logic is programmable and can be quickly and easily configured to a variety of custom applications. Development of our Command and Control Logic is expected to dramatically reduce the level of effort and technical risk required to develop customized hardware and software for new product designs, thus reducing the development cycle time and expense.
Lithium Phosphate Energy Storage Systems
Lithium-ion cobalt-oxide technology was originally developed to meet consumer demand for high-energy, small battery solutions to power portable electronic devices. Lithium-ion cobalt-oxide technology was a significant advancement in battery technology for the small battery market. However, due to the safety concerns associated with producing and using traditional lithium-ion cobalt-oxide technology in large-format applications, many markets today such as automotive, industrial, UPS and telecommunications markets remain served by older technologies, such as lead-acid, nickel-cadmium, and nickel metal hydride, which offer low energy density and significant maintenance costs.
We believe all of our Lithium Iron Magnesium Phosphate Energy Storage Systems, which utilize safer and more environmentally friendly phosphate-based cathode materials in place of other less stable and more costly cathode materials, address the current challenges facing the rechargeable battery industry and provide us with several competitive advantages. Key attributes of our Lithium Iron Magnesium Phosphate Energy Storage Systems include:
4
|
·
|
Increased safety. We believe that our Lithium Phosphate Energy Storage Systems significantly reduce the safety risks associated with oxide-based lithium-ion technologies. The unique chemical properties of phosphates render them almost incombustible if mishandled during charging or discharging. As a result, we believe our technology is more stable under overcharge or short circuit conditions than existing lithium-ion oxide technology and has the ability to withstand higher temperatures and electrical stress. The thermal and chemical stability inherent in our technology provides safety over lithium metal oxides, enabling large-format, high energy density lithium-ion solutions.
|
|
·
|
Performance advantages. Our Lithium Iron Magnesium Phosphate Energy Storage Systems offer several performance advantages over the competing battery chemistries of lead-acid, nickel-cadmium, nickel metal hydride and traditional lithium-ion oxide technologies, including higher rate capability, longer cycle life, longer shelf life, and lower total cost of ownership. Other system advantages include lighter weight, excellent float characteristics, and high-energy efficiency during charge and discharge.
|
|
·
|
High energy density. In its large-format application, our Lithium Iron Magnesium Phosphate Energy Storage Systems exhibit an energy density that can exceed other battery chemistries such as lead-acid, nickel metal hydride and nickel-cadmium.
|
|
·
|
High rate capability. In the power cell construction, our Lithium Iron Magnesium Phosphate Energy Storage Systems offer an exceptional rate capability with sustained 10 to 15C discharges and low impedance of less than 20m Ohms. These two characteristics result in a cell that provides larger bursts of power while generating less heat than energy cells.
|
|
·
|
Increased exceptional cycle life. Current testing of our Lithium Iron Magnesium Phosphate Energy Storage Systems at 80% to 100% depth of discharge has yielded a cycle life of 4,500 cycles at 23°C to 80% of the battery’s initial capacity, representing a longer life span compared to existing solutions. At a 25% depth of discharge, our systems reached 30,000 cycles before we stopped the testing.
|
|
·
|
Maintenance-free. Our Lithium Iron Magnesium Phosphate Energy Storage Systems are maintenance-free.
|
|
·
|
Lower lifetime cost. We believe that our proprietary phosphate material used in our Lithium Iron Magnesium Phosphate Energy Storage Systems is less expensive than the cobalt-oxide material used in competing lithium-ion technologies. As a result, we believe that as production volume increases due to greater demand for Lithium Iron Magnesium Phosphate Energy Storage Systems, material costs should decrease. Finally, the lower maintenance costs, longer cycle life and longer service life associated with U-Charge® Lithium Phosphate Energy Storage Systems lead to a lower total cost of ownership in numerous applications. For example, our Revision 2 Lithium Phosphate Energy Storage Systems can also be field repaired, should certain failures occur, and placed back into service, resulting in lower cost to the consumer in the event of failure.
|
|
·
|
Flexibility. The logic of U-Charge® Lithium Iron Magnesium Phosphate Energy Storage System is programmable and therefore can easily be applied to custom energy storage systems of various sizes for various applications.
|
|
·
|
Environmental friendliness. Rechargeable batteries that contain nickel metal hydride, nickel-cadmium or lead-acid are toxic and harmful to the environment. In contrast, our proprietary phosphate technologies do not contain any heavy metals. Our Lithium Iron Magnesium Phosphate Energy Storage Systems incorporate an environmentally friendly, phosphate-based cathode material that reduces the disposal issues inherent in other types of batteries.
|
Products
The U-Charge® Energy Storage System
The U-Charge® Energy Storage System is a family of products based on Valence’s proprietary Lithium Iron Magnesium Phosphate technology and is designed to be a direct replacement for standard-sized lead-acid energy storage systems. These 12.8 and 19.2 volt energy storage systems offer twice the run-time and a third less weight than lead-acid systems, expanded calendar life and greater cycle life with full depth of discharge, resulting in significantly lower total costs of ownership. U-Charge® Energy Storage Systems are used in a variety of applications such as hybrid and full electric vehicles, wheelchairs, scooters, robotics, marine, remote power, military, back-up and many other devices. Announced in March 2009, the latest U-Charge® Energy Storage Systems became commercially available in the fourth quarter of fiscal year 2010. These systems are designed to offer significant performance advantages that include common communication protocol, programmable logic, advanced cell balancing and superior fuel gauge reporting. They also are backward compatible to prior U-Charge® products.
Product Milestones
In the fourth quarter of fiscal year 2010 we introduced a Revision 2 to our U-Charge® Lithium Iron Magnesium Phosphate Energy Storage Systems. This Revision 2 of our U-Charge® system features our safe, long-life lithium phosphate technology, which utilizes a phosphate-based cathode material. U-Charge® lithium iron magnesium phosphate energy storage systems address the safety and limited life weaknesses of other lithium technologies, while offering a solution that is competitive in cost and performance. This Revision 2 of our U-Charge® system builds upon these features and adds improvements in state of charge, balancing and some field repairability. We believe that the improved features and functionality of the latest U-Charge® lithium phosphate energy storage systems are well suited for electric vehicle, plug-in hybrid electric vehicle (PHEV), and similar applications.
5
In February 2008, we entered into a supply agreement with The Tanfield Group whereby we agreed to manufacture and supply Lithium Phosphate Energy Storage Systems to power zero emission, all-electric commercial delivery vehicles. Our battery systems are installed in leading edge vans and trucks produced by Tanfield’s UK-based trading division, Smith Electric Vehicles. Initial purchases which began in fiscal fourth quarter ended March 31, 2008, were fulfilled with our current U-Charge® Energy Storage Systems. Subsequent purchases were also made by Tanfield in fiscal year 2009.
In January 2006, we announced availability of eight new models of our large-format lithium iron magnesium phosphate U-Charge® XP Energy Storage Systems that feature built-in battery management electronics and power rates of 500 to 1,700 continuous watts, depending on the model.
In March 2005, we announced availability of a custom lithium phosphate energy storage system for Segway Inc.’s Personal Transporters. Our energy storage system doubled the range of Segway’s Personal Transporters compared to the nickel metal hydride energy storage systems that were previously used which enabled Segway to penetrate commercial law enforcement, tour operators and other extended range applications.
In February 2004, we introduced the U-Charge® Lithium Iron Magnesium Phosphate Energy Storage Systems. U-Charge® systems have been produced in our China facilities and are designed to power a variety of motive applications from hybrid and electric vehicles to scooters and wheelchairs, and can also be used in stationary applications.
In February 2002, Valence launched the N-Charge® Lithium Iron Magnesium Phosphate Energy Storage Systems into several channels for sales and distribution, including national and regional retailers, top tier computer manufacturers, and national resellers. We decided to discontinue the N-Charge ® Lithium Phosphate Energy Storage Systems product line during calendar year 2008 in order to focus on our U-Charge ® Energy Storage Systems.
Operational Achievements
Valence energy storage systems continue to be tested and qualified by multiple corporations. Our research, development and design efforts are focused on new products utilizing our Command and Control Logic and our patented lithium phosphate materials. Next generation patented lithium phosphate materials are currently under evaluation for energy storage solutions. As manufacturing volume continued to expand, significant reductions were made in the manufacturing cost due to lower raw material costs, reduced scrap and improved efficiency.
Significant new alliances to develop Valence energy storage systems and customers for Valence’s Lithium Iron Magnesium Phosphate Energy Storage Products include: Brammo, Oxygen PVI, EVI, and various government and military groups. We continue to ship Lithium Phosphate Energy Storage Systems to major customers that include Segway, Smith Electric Vehicles, Enova Inc., and The Wright Group (Wright Bus). Our battery pack, powder, and engineering operations are conducted in our two manufacturing plants located in Suzhou, China. We continue to improve the batch-to-batch yield of our proprietary Lithium Phosphate cathode materials and increase output with continuous versus batch process improvements. Pack assembly operations have been simplified and expanded. In addition, our engineering operations have been expanded to support continuous manufacturing processes and quality control improvements.
Development of our patented next-generation Lithium Vanadium Phosphate (LVP) and Lithium Vanadium Fluorophosphate (LVPF) cathode materials has been focused and accelerated. Recognized as the next generation of Lithium Phosphate energy solutions, we believe LVP and LVPF will offer higher performance solutions to a new generation of vehicular and other demanding applications.
Competition
Competition in the rechargeable battery industry is intense. In the rechargeable battery market, the principal competitive technologies currently marketed are lead-acid, nickel-cadmium, nickel metal hydride, liquid lithium-ion and lithium-ion polymer energy storage systems. The industry consists of major domestic and international companies with substantial financial, technical, marketing, sales, manufacturing, distribution and other resources available to them. We believe our principal competitors are Sanyo, Matsushita Industrial Co., Ltd. (Panasonic), Sony, Toshiba, SAFT, A123 Systems, and Ener1. Our principal competitors generally have greater financial and marketing resources than we do and they may therefore develop batteries similar or superior to ours or otherwise compete more successfully than we do. In addition, many of these companies have name recognition, established positions in the market, and long-standing relationships with OEMs and other customers. Further, a number of our competitors have received or may in the future receive grants, subsidies or incentives from federal, local and state governments, which may provide them with lower cost capital and a competitive advantage.
The performance characteristics of lithium-ion energy storage systems have consistently improved over time as market leaders continued to improve the technology. Other companies such as A123 Systems are undertaking research in rechargeable battery technologies, including work on lithium-ion phosphate technology. However, Valence intends to maintain competitive leadership in the lithium phosphate sector with patented Lithium Phosphate technologies and advanced energy storage solutions for today’s and tomorrow’s demanding high-energy applications.
6
We believe that we have several technological advantages over competitors in terms of our ability to compete in the rechargeable battery market. Our Lithium Iron Magnesium Phosphate energy storage solutions including materials, cells and intelligent technology, and our unique ability to integrate our packs into customer applications enable us to serve a wide range of markets that do not currently use lithium-ion energy storage systems.
Sales and Marketing
U-Charge® Energy Storage Systems are a family of standard form factor systems that can be configured to meet the energy storage needs of a wide range of customers’ applications. The customer evaluation and approval process is generally between six and twenty-four months. We anticipate sales will typically be made through separately negotiated supply agreements rather than standard purchase orders. U-Charge® Energy Storage Systems are expected to be sold in standard and custom configurations. In addition, we expect to design and sell custom battery systems based on our Lithium Phosphate technology and programmable Command and Control Logic. We also provide pack level application engineering services to assist our customers with the integration of our packs into their specific applications. We have not experienced seasonality in any of our product sales. None of our customers are contractually committed to purchase any minimum quantities of products from us, and orders are generally cancelable prior to shipment. As a result, we do not disclose our order backlog, since we believe that our order backlog at any particular date is not necessarily indicative of actual revenue for any future period.
Sales of products are typically denominated in U.S. dollars. Consequently, sales historically have not been subject to currency fluctuation risk.
Customers
Over the last three fiscal years, a limited number of our customers have accounted for a significant portion of our revenues as follows:
|
Fiscal Year ended March 31,
|
||||||||||||
|
2010
|
2009
|
2008
|
||||||||||
|
Segway, Inc.
|
25 | % | 46 | % | 55 | % | ||||||
|
Smith Electric Vehicles, US Corp
|
12 | — | — | |||||||||
|
The Tanfield Group, PLC
|
— | % | 16 | % | 12 | % | ||||||
During fiscal year 2010, approximately 66% of our sales were domestic and 34% international. (See Note 19 of Notes To Consolidated Financial Statements for financial information about geographic areas.)
Patents, Trade Secrets and Trademarks
Our ability to compete effectively depends in part on our ability to maintain the proprietary nature of our technology and manufacturing processes through a combination of patent, trademark and trade secret protection, non-disclosure agreements and cross-licensing agreements.
We rely on patent protection for certain designs and products. We hold approximately 128 U.S. patents, which have expiration dates through 2028, and we have about 41 patent applications pending in the U.S. We hold 119 world wide patents and have 132 world wide patent applications pending. We continually prepare new patent applications for filing in the U.S. and we also actively pursue patent protection in certain foreign countries.
In addition to potential patent protection, we rely on the laws of unfair competition and trade secrets to protect our proprietary rights. We attempt to protect our trade secrets and other proprietary information through agreements with customers and suppliers, proprietary information agreements with employees and consultants and other security measures.
We are engaged in certain legal proceedings related to our intellectual property, including certain legal proceedings related to our Saphion® I Technology. Please see Item 3. “Legal Proceedings”, for further discussion.
We own the registered trademarks of Valence, U-Charge®, and the common law trademark Epoch™ in the United States and abroad. All other trademarks, service marks or trade names referred to in this Report are the property of their respective owners.
7
Manufacturing and Raw Materials
Our base Lithium Iron Magnesium Phosphate Cathode Material is manufactured in a plant operated by one of our wholly owned foreign enterprises (or WOFEs) in Suzhou, China. We believe that we will have sufficient capacity to meet or exceed expected demands in fiscal year 2010. We depend on a limited number of suppliers for certain key raw materials used in manufacturing and developing our power systems. We currently depend on a sole supplier, Tianjin Lishen Battery Joint-Stock Co., Ltd., for our cylindrical cells, and a limited number of suppliers for certain other key raw materials, such as electrolyte and anode material, used in manufacturing and developing our power systems. We generally purchase raw materials pursuant to purchase orders placed from time to time and have no long-term contracts or other guaranteed supply arrangements with our sole or limited source suppliers. As a result, our suppliers may not be able to meet our requirements relative to specifications and volumes for key raw materials, and we may not be able to locate alternative sources of supply at an acceptable cost. For example, late in the fourth quarter of fiscal year 2010, we experienced production delays as a result of quality issues with cylindrical cells supplied by Lishen. In order to alleviate this in the future we are in the process of identifying a second source for this component. In the past, we have also experienced delays in product development due to the delivery of nonconforming raw materials from our suppliers. If in the future we are unable to obtain high quality raw materials in sufficient quantities, on competitive pricing terms and on a timely basis, it may delay battery production, impede our ability to fulfill existing or future purchase orders and harm our reputation and profitability.
Research and Product Development
We conduct materials research and development at our Las Vegas, Nevada facility, and new product development at our China facility. Our battery research and development group develops and improves the existing technology, materials and processing methods and develops the next generation of our energy storage systems. Our areas of expertise include: chemical engineering; process control; safety; anode, cathode, and electrolyte chemistry and physics; polymer and radiation chemistries; thin film technologies; coating technologies; analytical chemistry; material science and energy storage system Command and Control Logic development. Our research and development efforts over the past year have focused and will continue to focus on four areas:
|
·
|
Continuing development of our Lithium Phosphate technology in multiple constructions;
|
|
·
|
Development of our next generation Lithium Phosphate technology;
|
|
·
|
Large-format applications for Lithium Phosphate technology;
|
|
·
|
Development of next generation Standard and Custom Battery Packs.
|
We continuously seek to improve our technology, and are currently focusing on improving the energy density of our products and advancing these improvements into production. We also are working with new materials to make further improvements to the performance of our products. We believe the safety features of our technology and the ongoing improvements in the performance of our batteries will allow us to maintain our competitive advantage.
Research and product development expenses consist primarily of personnel, equipment, and materials to support our efforts to develop battery chemistry and products, as well as to improve our manufacturing processes. Research and product development expenses totaled $4.5 million in fiscal year 2010, $4.3 million in fiscal year 2009, and $3.8 million in fiscal year 2008.
Safety; Regulatory Matters; Environmental Considerations
Before we commercially introduce our batteries into certain markets, we may be required, or may voluntarily determine to obtain approval of our materials and/or products from one or more of the organizations engaged in regulating product safety. These approvals could require significant time and resources from our technical staff, and, if redesign were necessary, could result in a delay in the introduction of our products in those markets.
The United States Department of Transportation, or DOT, and the International Air Transport Association, or IATA, regulate the shipment of hazardous materials. The United Nations Committee of Experts for the Transportation of Dangerous Goods has adopted amendments to the international regulations for “lithium equivalency” tests to determine the aggregate lithium content of lithium-ion polymer batteries. In addition, IATA has adopted special size limitations for applying exemptions to these batteries. Under IATA, our U-Charge® Power System currently fall within the level such that they are not exempt and require a Class 9 designation for transportation. We comply with all safety-packaging requirements worldwide and future DOT or IATA regulations or enforcement policies could impose costly transportation requirements. In addition, compliance with any new DOT or IATA approval process could require significant time and resources from our technical staff and if redesign were necessary, could delay the introduction of new products.
The Nevada Occupational Safety and Health Administration and other regulatory agencies have jurisdiction over the operations of our Las Vegas, Nevada facility. Because of the risks generally associated with the use of flammable solvents and other hazardous materials, we expect rigorous enforcement of applicable health and safety regulations. In addition, we currently are regulated by the State Fire Marshall’s office and local Fire Departments. Frequent audits or changes in their regulations may cause unforeseen delays and require significant time and resources from our technical staff.
8
China’s “Management Methods for Controlling Pollution Caused by Electronic Information Products Regulation” (“China RoHS”) provides a broad regulatory framework including similar hazardous substance restrictions as are imposed by the European RoHS Directive, and applies to methods for the control and reduction of pollution and other public hazards to the environment caused during the production, sale, and import of electronic information products in China affecting a broad range of electronic products and parts, with an effective implementation date of March 1, 2007. However, these methods do not apply to the production of products destined for export. Our compliance system is sufficient to meet such requirements. Our current estimated costs associated with our compliance with this regulation based on our current market share are not significant. However, we continue to evaluate the effect of this regulation, and actual costs could differ from our current estimates.
National, state and local regulations impose various environmental controls on the storage, use and disposal of lithium batteries and of certain chemicals used in the manufacture of lithium batteries. Although we believe that our operations are in substantial compliance with current environmental regulations, there can be no assurance that changes in such laws and regulations will not impose costly compliance requirements on us or otherwise subject us to future liabilities. Moreover, state and local governments may enact additional restrictions relating to the disposal of lithium batteries used by our customers that could adversely affect the demand for our products. There can be no assurance that additional or modified regulations relating to the storage, use and disposal of chemicals used to manufacture batteries, or restricting disposal of batteries will not be imposed. In fiscal year 2010, we spent less than $0.1 million on environmental controls, including costs to properly dispose of potentially hazardous waste.
Employees
At April 30, 2010, we had a total of 349 regular full-time employees. In the U.S., we had a total of 41 employees at our Austin, Texas headquarters and our Las Vegas, Nevada research and development facility. We had 9 regular full-time employees in the areas of engineering and sales located in the United Kingdom and Northern Ireland. Our China operations, consisting of two WOFEs, had 299 regular full-time employees and one expatriate. None of our employees are covered by a collective bargaining agreement, and we consider our relations with our employees to be good.
Available Information
We make available on our website (www.valence.com) under “Investor Relations - SEC Filings,” free of charge, our Annual Reports on Form 10-K, Quarterly Reports on Form 10-Q, Current Reports on Form 8-K and amendments to those reports, as soon as reasonably practicable after we electronically file such material with the Securities and Exchange Commission. We will provide copies of these reports upon written request to 12303 Technology Blvd., Suite 950, Austin, Texas 78727. Our filings with the SEC are also available through the SEC website at www.sec.gov or at the SEC Public Reference Room at 100 F Street, N.E., Washington, D.C. 20549 or by calling 1-800-SEC-0330.
9
Risks Related to Our Company and Our Business
Due to our ongoing losses, lack of liquidity and debt obligations, there is doubt about our ability to continue as a going concern.
We have experienced significant operating losses in the current and prior years. At March 31, 2010 our principal sources of liquidity were cash and cash equivalents of $3.2 million. We do not expect that our cash on hand and cash generated by operations will be sufficient to fund our operating and capital needs for the next 12 months. As a result of our limited cash resources and history of operating losses, our auditors have expressed in their report on our consolidated financial statements that there is doubt about our ability to continue as a going concern. We presently have no further commitments for financing by affiliates of our Chairman Carl Berg. Recently, we have depended on our Common Stock Purchase Agreement with Seaside 88, L.P., and to a limited extent on sales of common stock under an At-Market Issuance Agreement with Wm. Smith & Co. Seaside 88’s bi-weekly common stock purchase obligations expire in October 2010, and are subject to certain conditions, including that our stock trade above a volume weighted average price of $1 in the period prior to each bi-weekly purchase, which we have violated on several occasions. If we are unable to obtain financing from affiliates of Mr. Berg or others on terms acceptable to us, or at all, we may not be able to fulfill our customer commitments and/or be forced to cease our operations and liquidate our assets.
General negative economic conditions, including concerns regarding the global recession and credit constraints, or unfavorable economic conditions in a particular region, business or industry sector, may lead our customers to delay or forego technology investments and could have other effects, including but not limited to our ability to access funds on credit and the valuation of our equity securities, any of which could adversely affect our business, financial condition, operating results and cash flow.
Unprecedented disruptions in the current credit and financial markets have had a significant material adverse effect on a number of financial institutions and have limited access to capital and credit for many companies. Failure or material business deterioration of investment banks, commercial banks and other intermediaries in the United States and elsewhere around the world, and significant reductions in asset values across businesses, households and individuals, combined with other financial and economic indicators, including most recently, sovereign debt concerns in Greece and other EU members, have had a profound effect on the global economy. Many industries, particularly the global automotive industry, are affected by these market conditions. Some of the key effects of the current financial market turmoil include contraction in credit markets resulting in a widening of credit risk, devaluations and high volatility in global equity, commodity and foreign exchange markets, and a lack of market liquidity. A “double-dip” recession or continued or worsened slowdown in the financial markets or other economic conditions, including but not limited to, consumer spending, employment rates, business conditions, inflation, fuel and energy costs, consumer debt levels, lack of available credit, the state of the financial markets, interest rates, and tax rates may result in reduced demand for products utilizing our advanced battery technology and difficulties in obtaining financing, which may adversely affect our growth and business prospects.
Risks we might face could include:
|
·
|
potential declines in revenues due to reduced orders or other factors caused by economic challenges faced by our customers and prospective customers;
|
|
·
|
potential adverse effects on our customers’ ability to pay, when due, amounts payable to us and related increases in our cost of capital associated with any increased working capital or borrowing needs we may have if this occurs, or to collect amounts payable to us in full (or at all) if any of our customers fail or seek protection under applicable bankruptcy or insolvency laws;
|
|
·
|
potential adverse effects on our ability to access credit and other financing sources (and the cost thereof). This may affect our ability to finance our operations or make significant capital expenditures relating to new products;
|
|
·
|
lengthening sales cycles and/or delayed or cancelled decisions to purchase our products and/or our technology; and
|
|
·
|
potential adverse effects on the valuation of our equity securities as a result of the devaluation and volatility of global stock markets.
|
The occurrence of such events could adversely affect our business, financial condition, operating results and cash flow. Such a prolonged general slowdown or “double-dip” recession in the global economy , as well as any intensification of EU-based sovereign debt concerns, is likely to materially affect the global banking system including individual institutions as well as a particular business or industry sector, which could cause further consolidations or failures in such a sector. These adverse financial events could also result in further government intervention in the United States and world markets. Any of these results could affect the manner in which we are able to conduct business including within a particular industry sector or market and could adversely affect our business, financial condition, operating results and cash flow or cash position.
Our limited financial resources could materially affect our business, our ability to commercially exploit our technology and our ability to respond to unanticipated development, and could place us at a disadvantage to our competitor.
10
Currently, we do not have sufficient capital resources or cash flow from operations to generate the cash flows required to meet our operating and capital needs. Our ability to raise capital may be affected by a variety of risks discussed elsewhere herein, including the volatility of the stock market and our ability to raise funds via equity sales under our arrangement with Seaside 88, LP, or Seaside. In October 2009 we entered into a Common Stock Purchase Agreement with Seaside which provides that, upon the terms and subject to the conditions set forth therein, we are required to issue and sell, and Seaside to purchase, up to 650,000 shares of our common stock once every two weeks, subject to the satisfaction of customary closing conditions, beginning on October 15, 2009 and ending on or about the date that is 52 weeks subsequent to the initial closing, for an aggregate sale to Seaside of up to 16,900,000 shares of common stock. Although we have sold a total of 5.8 million shares to Seaside as of the filing date of this Report, and 5.2 million shares remain available for future issuance, the sale of an aggregate of 5.9 million shares in nine closings was not, and will not ever be, consummated because the requirement that the volume weighted average price of our common stock for the three trading days prior to each such closings be above $1.00 per share was not met. In addition, since the date of the initial closing of the Seaside agreement, our stock price has declined, such that for each subsequent closing we do effect, we are raising less money on more dilutive terms than we had anticipated. Our inability to raise adequate funds, or any funds, via the Seaside agreement or other capital-raising transactions limits our financial resources and could materially affect our ability to commercially exploit our technologies and products. For example, it could:
|
·
|
limit the research and development resources we are able to commit to the further development of our technology and the development of products that can be commercially exploited in our marketplace;
|
|
·
|
limit the sales and marketing resources that we are able to commit to the marketing of our technology;
|
|
·
|
have an adverse effect on our ability to attract top-tier companies as our technology and marketing partners;
|
|
·
|
have an adverse effect on our ability to employ and retain qualified employees with the skills and expertise necessary to implement our business plan;
|
|
·
|
make us more vulnerable to failing to achieve our forecasted results, economic downturns, adverse industry conditions or catastrophic external events;
|
|
·
|
limit our ability to withstand competitive pressures and reduce our flexibility in planning for, or responding to, changing business and economic conditions; and
|
|
·
|
place us at a disadvantage to our competitors that have greater financial resources than we have.
|
We have a history of losses and an accumulated deficit and may never achieve or sustain significant revenues or profitability.
We have incurred operating losses each year since our inception in 1989 and had an accumulated deficit of $581 million as of March 31, 2010. We have sustained recurring losses related primarily to the research and development and marketing of our products combined with the lack of sufficient sales to provide for these needs. We anticipate that we will continue to incur operating losses and negative cash flows over the next fiscal year. We may never achieve or sustain sufficient revenues or profitability in the future.
We reported a net loss available to common stockholders of $23.2million for the fiscal year ended March 31, 2010. We have reported a net loss available to common stockholders of $21.4 million for the fiscal year ended March 31, 2009, and a net loss available to common stockholders of $19.6 million for the fiscal year ended March 31, 2008. If we cannot achieve a competitive cost structure, achieve profitability, and acquire access to capital markets on acceptable terms, we will be unable to fund our obligations and sustain our operations, and may be required to liquidate our assets.
Our working capital requirements may increase beyond those currently anticipated.
We have planned for an increase in sales and, if we experience sales in excess of our plan, our working capital needs and capital expenditures would likely increase from that currently anticipated. Our ability to meet this additional customer demand would depend on our ability to arrange for additional equity or debt financing since it is likely that cash flow from sales will lag behind these increased working capital requirements.
Our indebtedness and other obligations are substantial and could materially affect our business and our ability to incur additional debt to fund future needs.
We have and will continue to have a significant amount of indebtedness and other obligations. As of March 31, 2010, we had approximately $82.2 million of total consolidated indebtedness. Included in this amount are $34.9 million of loans outstanding, net of discount, to an affiliate of Carl Berg, $27.4 million of accumulated interest associated with those loans and $19.9 million of principal and interest outstanding with a third party finance company, iStar. The loan to iStar matures in fiscal 2011, beginning with monthly payments, starting in July 2010, of $1.0 million per month in principal plus accrued interest, with a final payment of $13 million in principal and accrued interest due in February 2011. Our outstanding shares of Series C-1 Convertible Preferred Stock and Series C-2 Convertible Preferred Stock held by affiliates of Carl Berg are redeemable by the holders for up to $8.6 million, plus accrued dividends which, as of March 31, 2010, which were approximately $0.8 million. Our substantial indebtedness and other obligations could negatively affect our current and future operations. For example, it could:
|
·
|
limit our ability to obtain additional financing for working capital, capital expenditures, acquisitions and general corporate purposes;
|
|
·
|
require us to dedicate a substantial portion of our cash flow from operations to the payment of principal of, and interest on, our indebtedness, thereby reducing the funds available to us for other purposes;
|
11
|
·
|
make us more vulnerable to failure to achieve our forecasted results, economic downturns, adverse industry conditions or catastrophic external events, limit our ability to withstand competitive pressures and reduce our flexibility in planning for, or responding to, changing business and economic conditions;
|
|
·
|
place us at a disadvantage to our competitors that have relatively less debt than we have; and/or
|
|
·
|
cause us to cease business and liquidate our assets and operations.
|
All of our assets are pledged as collateral under various loan agreements with Mr. Berg or related entities. If we fail to meet our obligations pursuant to these loan agreements, these lenders may declare all amounts borrowed from them, together with accrued and unpaid interest thereon, to be due and payable. If this were to occur, we would not have the financial resources to repay our debt and these lenders could proceed against our assets.
Our financial results may vary significantly from quarter to quarter.
Our product revenue, operating expenses and quarterly operating results have varied in the past and may fluctuate significantly from quarter to quarter in the future due to a variety of factors, many of which are outside of our control. As a result you should not rely on our operating results during any particular quarter as an indication of our future performance in any quarterly period or fiscal year. These factors include, among others:
|
·
|
timing of orders from our customers and the possibility that customers may change their order requirements with little or no notice to us;
|
|
·
|
rate of adoption of our energy storage systems;
|
|
·
|
deferral of customer orders in anticipation of new products from us or other providers of batteries and related technologies;
|
|
·
|
timing of deferred revenue components associated with large orders;
|
|
·
|
new product releases, licensing or pricing decisions by our competitors;
|
|
·
|
commodity and raw materials component prices;
|
|
·
|
lack of order backlog;
|
|
·
|
loss of a significant customer or distributor;
|
|
·
|
effect of changes to our product distribution strategy and pricing policies;
|
|
·
|
changes in the mix of domestic and international sales;
|
|
·
|
rate of growth of the markets for our products; and
|
|
·
|
other risks described below.
|
The market for our products is evolving and it is difficult to predict its potential size or future growth rate. Many of the organizations that may purchase our products have invested substantial resources in their existing power systems and, as a result, have been reluctant or slow to adopt a new approach, particularly during a period of reduced capital expenditures. Moreover, our current products are alternatives to existing systems and may never be accepted by our customers or may be made obsolete by other advances in related technologies.
Significant portions of our expenses are not variable in the short term and cannot be quickly reduced to respond to decreases in revenue. Therefore, if our revenue is below our expectations, our operating results are likely to be adversely and disproportionately affected. In addition, we may change our prices, modify our distribution strategy and policies, accelerate our investment in research and development, sales or marketing efforts in response to competitive pressures or to pursue new market opportunities. Any one of these activities may further limit our ability to adjust spending in response to revenue fluctuations. We use forecasted revenue to establish our expense budget. Because most of our expenses are fixed in the short term or incurred in advance of anticipated revenue, any shortfall in revenue may result in significant losses.
Our business will be adversely affected if our Saphion technology-based batteries are not commercially accepted.
We are researching and developing batteries based upon phosphate chemistry. Our batteries are designed and manufactured as components for other companies and end-user customers. Our success depends on the acceptance of our batteries and the products using our batteries in their markets. Technical issues may arise that may affect the acceptance of our products by our customers. Market acceptance may also depend on a variety of other factors, including educating the target market regarding the benefits of our products. Market acceptance and market share are also affected by the timing of market introduction of competitive products. If we, or our customers, are unable to gain any significant market acceptance for Saphion technology-based batteries, our business will be adversely affected. It is too early to determine if Saphion technology-based batteries will achieve significant market acceptance.
12
If we are unable to develop, manufacture and market products that gain wide customer acceptance, our business will be adversely affected.
The process of developing our products is complex and failure to anticipate our customers’ changing needs and to develop products that receive widespread customer acceptance could significantly harm our results of operations. We must make long-term investments and commit significant resources before knowing whether our predictions will eventually result in products that the market will accept. After a product is developed, we must be able to manufacture sufficient volumes quickly and at low costs. To accomplish this, we must accurately forecast volumes, mix of products and configurations that meet customer requirements, and we may not succeed. For example, if we are unable to develop, manufacture and market our Energy Storage Systems and gain wide customer acceptance of those systems, our business, results of operations and financial condition could be harmed.
The demand for batteries in the transportation and other markets depends on the continuation of current trends resulting from dependence on fossil fuels. Extended periods of low fuel prices could adversely affect demand for electric and hybrid electric vehicles.
We believe that much of the present and projected demand for advanced batteries in the transportation and other markets results from recent increases in the cost of oil, the dependency of the United States on oil from unstable or hostile countries, government regulations and economic incentives promoting fuel efficiency and alternate forms of energy, as well as the belief that climate change results in part from the burning of fossil fuels. If the cost of oil decreased significantly, the outlook for the long-term supply of oil to the United States improved, the government eliminated or modified its regulations or economic incentives related to fuel efficiency and alternate forms of energy, or if there is a change in the perception that the burning of fossil fuels negatively affects the environment, the demand for our batteries could be reduced, and our business, prospects and revenue may be harmed.
Gasoline, diesel and other fuel prices have been extremely volatile, and this continuing volatility is expected to persist. Lower fuel prices over extended periods of time may lower the perception in government and the private sector that cheaper, more readily available energy alternatives should be developed and produced. If fuel prices remain at deflated levels for extended periods of time, the demand for hybrid and electric vehicles may decrease, which would have a material adverse effect on our business and prospects.
Adverse business or financial conditions affecting the automotive industry may have a material adverse effect on our development and marketing partners and our battery business.
We are seeking to enter into certain agreements with certain worldwide automotive manufacturers and tier 1 suppliers regarding their PHEV and EV development efforts. Certain of these manufacturers and suppliers have in recent years experienced static or reduced revenues, increased costs, net losses, loss of market share, labor issues and other business and financial challenges, which have substantially worsened as a result of the current U.S. and global economic slowdown. The viability of the "Big Three" U.S. auto manufacturers, particularly GM and Chrysler, remains unclear. As a result, these and other automotive manufacturers may discontinue or delay their planned introduction of HEVs, PHEVs or EVs as a result of adverse changes in their financial condition or other factors. Automotive manufacturers may also seek alternative battery systems from other suppliers which may be more cost-effective or require fewer modifications in standard manufacturing processes than our products. Adverse business or financial conditions affecting individual automotive manufacturers or tier 1 suppliers or the automotive industry generally, including potential additional bankruptcies of automotive companies and their suppliers, as well as market disruption that could result from future consolidation in the automotive industry, could have a material adverse effect on our business.
Automotive manufacturers may discontinue or delay their planned introduction of PHEVs or EVs as a result of adverse changes in their financial condition or other factors. Automotive manufacturers may also seek alternative battery systems from other suppliers which may be more cost-effective or require fewer modifications in standard manufacturing processes than our products, or which such firms believe are more stable financially. We also may experience delays or losses with respect to the collection of payments due from customers in the automotive industry experiencing financial difficulties.
We depend on a small number of customers for our revenues, and our results of operations and financial condition could be harmed if we were to lose the business of any one of them.
To date, our existing purchase orders in commercial quantities are from a limited number of customers. During the fiscal year ended March 31, 2010, Segway Inc., and Smith Electric Vehicles, US Corp contributed 25%, and 12%, of our revenues, respectively. We anticipate that sales of our products to a limited number of key customers will continue to account for a significant portion of our total revenues. We do not have long-term agreements with any of these customers committing them to purchase any specified amount of our products. As a result, we face the substantial risk that one or more of the following events could occur:
|
·
|
reduction, delay or cancellation of orders from a customer;
|
|
·
|
development by a customer of other sources of supply;
|
|
·
|
selection by a customer of devices manufactured by one of our competitors for inclusion in future product generations;
|
|
·
|
loss of a customer or a disruption in our sales and distribution channels; or
|
|
·
|
failure of a customer to make timely payment of our invoices.
|
13
If we were to lose one or more customers, or if we were to lose revenues due to a customer’s inability or refusal to continue to purchase our batteries, our business, results of operations and financial condition could be harmed.
We have encountered problems in our production process that have limited our ability at times to produce sufficient batteries to meet the demands of our customers. If these issues recur and we are unable to timely resolve these problems, our inability to produce batteries will have a material adverse effect on our ability to grow revenues and maintain our customer base.
Problems in our production processes could limit our ability to produce a sufficient number of batteries to meet the demands of our customers. Production issues likely will have a negative effect on gross margins as manufacturing yields will suffer. Any inability to timely produce batteries and other products would have a material adverse effect on our ability to grow revenues and maintain our customer base.
We have underutilized manufacturing capacity that may limit our ability to become profitable.
Through our Chinese WOFEs, we lease and have equipped a 13,000 square meter facility for manufacturing and testing of our batteries. To be financially successful, and to fully utilize the capacity of this facility and allocate its associated overhead, we must achieve significantly higher sales volumes. We must accomplish this while also preserving the quality levels we achieved when manufacturing these products in more limited quantities. To date, we have not been successful at increasing our sales volume to a level that fully utilizes the capacity of the facility and we may never increase our sales volume to necessary levels. If we do not reach these necessary sales volume levels, or if we cannot sell our products at our suggested prices, our ability to reach profitability will be materially limited.
We have limited experience manufacturing our products in large quantities.
Achieving the necessary production levels presents a number of technological and engineering challenges for us. We have limited experience manufacturing our products in high volume. We do not know whether or when we will be able to develop efficient, low-cost manufacturing capability and processes that will enable us to meet the quality, price, engineering, design and product standards or production volumes required to successfully manufacture large quantities of our products. Even if we are successful in developing our manufacturing capability and processes, we do not know whether we will do so in time to meet our product commercialization schedule or to satisfy the requirements of our customers.
If our products fail to perform as expected, we could lose existing and future business, and our ability to develop, market and sell our batteries could be harmed.
The market perception of our products and related acceptance of the products is highly dependent upon the quality and reliability of the products that we build. Any quality problems attributable to our product lines may substantially impair our revenue prospects. Moreover, quality problems for our product lines could cause us to delay or cease shipments of products or have to recall or field upgrade products, thus adversely affecting our ability to meet revenue or cost targets. In addition, while we seek to limit our liability as a result of product failure or defects through warranty and other limitations, if one of our products fails, a customer could suffer a significant loss and seek to hold us responsible for that loss.
Our failure to cost-effectively manufacture our technologically-complex batteries in commercial quantities which satisfy our customers’ product specifications and their expectations for product quality and delivery could damage our customer relationships and result in significant lost business opportunities for us.
To be successful, we must cost-effectively manufacture commercial quantities of our technologically-complex batteries that meet our customer specifications for quality and timely delivery. To facilitate commercialization of our products, we will need to further reduce our manufacturing costs, which we intend to do through the effective utilization of manufacturing partners and continuous improvement of our manufacturing and development operations in our wholly owned foreign enterprises in China. We currently manufacture our batteries and assemble our products in China. We are dependent on the performance of our manufacturing partners, as well as our own manufacturing operations to manufacture and deliver our products to our customers. We have experienced production process issues, which have limited our ability to produce a sufficient number of batteries to meet current demand. For example, during the third quarter of fiscal year 2008, our anticipated revenue was adversely affected due to the temporary suspension of production and shipments at our China facility in order to implement a component change on a circuit board. If we fail to correct these issues in a manner that allows us to meet customer demand, or if any of our manufacturing partners are unable to manufacture products in commercial quantities on a timely and cost-effective basis, we could lose our customers and adversely affect our ability to attract future customers.
In addition to being used in our own product lines, our battery cells are intended to be incorporated into other products. If we do not form effective arrangements with OEMs to commercialize these products, our profitability could be impaired.
Our business strategy contemplates that we will be required to rely on assistance from OEMs to gain market acceptance for our products. We therefore will need to identify acceptable OEMs and enter into agreements with them. Once we identify acceptable OEMs and enter into agreements with them, we will need to meet these companies’ requirements by developing and introducing new products and enhanced or modified versions of our existing products on a timely basis. OEMs often require unique configurations or custom designs for batteries, which must be developed and integrated into their product well before the product is launched. This development process not only requires substantial lead-time between the commencement of design efforts for a customized power system and the commencement of volume shipments of the power systems to the customer, but also requires the cooperation and assistance of the OEMs for purposes of determining the requirements for each specific application. We may have technical issues that arise that may affect the acceptance of our product by OEMs. If we are unable to design, develop, and introduce products that meet OEMs’ requirements, we may lose opportunities to enter into additional purchase orders and our reputation may be damaged. As a result, we may not receive adequate assistance from OEMs or pack assemblers to successfully commercialize our products, which could impair our profitability.
14
Failure to implement an effective licensing business strategy will adversely affect our revenue, cash flow and profitability.
Our long-term business strategy anticipates achieving significant revenue from the licensing of our intellectual property assets, such as our Saphion technology. We have not entered into any licensing agreements for our Saphion technology. Our future operating results could be adversely affected by a variety of factors including:
|
·
|
our ability to secure and maintain significant licensees of our proprietary technology;
|
|
·
|
the extent to which our future licensees successfully incorporate our technology into their products;
|
|
·
|
the acceptance of new or enhanced versions of our technology;
|
|
·
|
the rate at which our licensees manufacture and distribute their products to OEMs; and
|
|
·
|
our ability to secure one-time license fees and ongoing royalties for our technology from licensees.
|
Our future success will also depend on our ability to execute our licensing operations simultaneously with our other business activities. If we fail to substantially expand our licensing activities while maintaining our other business activities, our results of operations and financial condition will be adversely affected.
Our dependence on a sole supplier or a limited number of suppliers for key raw materials may delay our production of batteries.
We currently depend on a sole supplier, Tianjin Lishen Battery Joint-Stock Co., Ltd., for our cylindrical cells, and a limited number of suppliers for certain other key raw materials, such as electrolyte and anode material, used in manufacturing and developing our power systems. We generally purchase raw materials pursuant to purchase orders placed from time to time and have no long-term contracts or other guaranteed supply arrangements with our sole or limited source suppliers. As a result, our suppliers may not be able to meet our requirements relative to specifications and volumes for key raw materials, and we may not be able to locate alternative sources of supply at an acceptable cost. For example, late in the fourth quarter of fiscal year 2010, we experienced production delays as a result of quality issues with cylindrical cells supplied by Lishen. In order to alleviate this in the future we are in the process of identifying a second source for this component. In the past, we have also experienced delays in product development due to the delivery of nonconforming raw materials from our suppliers. If in the future we are unable to obtain high quality raw materials in sufficient quantities, on competitive pricing terms and on a timely basis, it may delay battery production, impede our ability to fulfill existing or future purchase orders and harm our reputation and profitability.
We expect to sell an increasing portion of our products to, and derive a significant portion of our licensing income from, customers located outside the United States. Foreign government regulations, currency fluctuations and increased costs associated with international sales could make our products and licenses unaffordable in foreign markets, which would reduce our future profitability.
International sales of our product and licenses, as well as licensing royalties, represent a significant portion of our sales potential. International business can be subject to many inherent risks that are difficult or impossible for us to predict or control, including:
|
·
|
changes in foreign government regulations and technical standards, including additional regulation of rechargeable batteries, technology, or the transport of lithium or phosphate, which may reduce or eliminate our ability to sell or license in certain markets;
|
|
·
|
foreign governments may impose tariffs, quotas, and taxes on our batteries or our import of technology into their countries;
|
|
·
|
requirements or preferences of foreign nations for domestic products could reduce demand for our batteries and our technology;
|
|
·
|
fluctuations in currency exchange rates relative to the U.S. dollar could make our batteries and our technology unaffordable to foreign purchasers and licensees or more expensive compared to those of foreign manufacturers and licensors;
|
|
·
|
longer payment cycles typically associated with international sales and potential difficulties in collecting accounts receivable, which may reduce the future profitability of foreign sales and royalties;
|
|
·
|
import and export licensing requirements in Europe and other regions, including China, where we intend to conduct business, which may reduce or eliminate our ability to sell or license in certain markets; and
|
|
·
|
political and economic instability in countries, including China, where we intend to conduct business, which may reduce the demand for our batteries and our technology or our ability to market our batteries and our technology in those countries.
|
These risks may increase our costs of doing business internationally and reduce our sales and royalties or future profitability.
15
Our business depends on certain key personnel, the loss of whom could weaken our management team, and on attracting and retaining qualified personnel.
The growth of our business and our success depends in large part on our ability to attract and retain highly-skilled management, technical, research and development, manufacturing, sales and marketing and other operating and administrative personnel, particularly those who are familiar with and experienced in the battery industry. If we cannot attract and retain experienced sales and marketing executives, we may not achieve the visibility in the marketplace that we need to obtain purchase orders, which would have the result of lowering our sales and earnings. Our key personnel include Chief Executive Officer, Robert L. Kanode, all of our other executive officers and vice presidents, many of whom have very specialized scientific or operational knowledge regarding one or more of our key products. Such persons are in high demand and often receive competing employment offers from numerous other companies, including larger, more established competitors who have significantly greater financial resources than we do. We do not maintain key-person life insurance on any of our employees. The loss of the services of one or more of our key personnel or the inability to attract and retain additional personnel and develop expertise as needed could limit our ability to develop and commercialize our existing and future products.
We may need to expand our employee base and operations in order to effectively distribute our products commercially, which may strain our management and resources and could harm our business.
To implement our growth strategy successfully, we will have to increase our staff in China, with personnel in manufacturing, engineering, sales, marketing, and product support capabilities, as well as third party and direct distribution channels. However, we face the risk that we may not be able to attract new employees to sufficiently increase our staff or product support capabilities, or that we will not be successful in our sales and marketing efforts. In fiscal year 2010, we replaced the general manager of our China operation. In addition, our Director of Finance for our China operations resigned, and we are currently in the process of finding a suitable replacement. Turnover in these positions could impair our ability to execute our plans for growth and adversely affect our future profitability.
International political events and the threat of ongoing terrorist activities could interrupt manufacturing of our batteries and our products at our OEM facilities or our own facilities and cause us to lose sales and marketing opportunities.
The terrorist attacks that took place in the United States on September 11, 2001, along with the U.S. military campaigns against terrorism in Iraq, Afghanistan and elsewhere, and continued violence in the Middle East have created many economic and political uncertainties, some of which may materially harm our business and revenues. International political instability resulting from these events could temporarily or permanently disrupt manufacturing of our batteries and products at our OEM facilities or our own facilities in Asia and elsewhere, and have an immediate adverse effect on our business. Since September 11, 2001, some economic commentators have indicated that spending on capital equipment of the type that use our batteries has been weaker than spending in the economy as a whole, and many of our customers are in industries that also are viewed as under-performing in the overall economy, such as the telecommunications, industrial and utility industries. The long-term effects of these events on our customers, the market for our common stock, the markets for our products, and the U.S. economy as a whole are uncertain. The recent global economic recession exacerbated uncertainty in many aspects of the manufacture and sales of our products. Terrorist activities could temporarily or permanently interrupt our manufacturing, development, sales and marketing activities anywhere in the world. Any delays also could cause us to lose sales and marketing opportunities, as potential customers would find other vendors to meet their needs. The consequences of any additional terrorist attacks, or any expanded armed conflicts are unpredictable, and we may not be able to foresee events that could have an adverse effect on our markets or our business.
If we are sued on a product liability claim, our insurance policies may not be sufficient.
Although we maintain general liability insurance and product liability insurance, our insurance may not cover all potential types of product liability claims to which manufacturers are exposed or may not be adequate to indemnify us for all liability that may be imposed. Any imposition of liability that is not covered by insurance or is in excess of our insurance coverage could harm our business, including our relationships with current customers and our ability to attract and retain new customers for our products and technology.
Our patent applications may not result in issued patents, which would have a material adverse effect on our ability to commercially exploit our products.
Patent applications in the United States are maintained in secrecy until the patents are issued or are published. Since publication of discoveries in the scientific or patent literature tends to lag behind actual discoveries by several months, we cannot be certain that we are the first creator of inventions covered by pending patent applications or the first to file patent applications on these inventions. We also cannot be certain that our pending patent applications will result in issued patents or that any of our issued patents will afford protection against a competitor. In addition, patent applications filed in foreign countries are subject to laws, rules and procedures that differ from those of the United States, and thus we cannot be certain that foreign patent applications related to issued U.S. patents will be issued. Furthermore, if these patent applications issue, some foreign countries provide significantly less effective patent enforcement than in the United States.
The status of patents involves complex legal and factual questions and the breadth of claims allowed is uncertain. Accordingly, we cannot be certain that the patent applications that we file will result in patents being issued, or that our patents and any patents that may be issued to us in the near future will afford protection against competitors with similar technology. In addition, patents issued to us may be infringed upon or designed around by others and others may obtain patents that we need to license or design around, either of which would increase costs and may adversely affect our operations.
16
If we cannot protect or enforce our existing intellectual property rights or if our pending patent applications do not result in issued patents, we may lose the advantages of our research and manufacturing systems.
Our ability to compete successfully will depend on whether we can protect our existing proprietary technology and manufacturing processes. We have filed a lawsuit against a company in Canada alleging infringement of certain Canadian patents, as described in further detail in Item 3. “Legal Proceedings”. We rely on a combination of patent and trade secret protection, non-disclosure agreements and cross-licensing agreements. These measures may not be adequate to safeguard the proprietary technology underlying our batteries. Employees, consultants, and others who participate in the development of our products may breach their non-disclosure agreements with us, and we may not have adequate remedies in the event of their breaches. Furthermore, our competitors may be able to develop products that are equal or superior to our products without infringing on any of our intellectual property rights. We currently manufacture and export some of our products from China. The legal regime protecting intellectual property rights in China is weak. Because the Chinese legal system in general, and the intellectual property regime in particular, are relatively weak, it is often difficult to enforce intellectual property rights in China. Moreover, there are other countries where effective copyright, trademark and trade secret protection may be unavailable or limited. Even where intellectual property enforcement is strong, enforcing our intellectual property against competitors and other infringers is time-consuming and extremely expensive. Financial and human resources for further enforcement efforts concurrent with those already underway are limited. Accordingly, we may not be able to effectively protect our intellectual property rights outside of the United States.
Intellectual property infringement claims brought against us could be time-consuming and expensive to defend, and if any of our products or processes is found to be infringing, we may not be able to procure licenses to use patents necessary to our business at reasonable terms, if at all.
In recent years, there has been significant litigation in the United States involving patents and other intellectual property rights. For example, we have been named in a lawsuit which alleges that our Saphion I cathode material infringes two patents owned by the University of Texas that we describe in further detail in “Item 3. “Legal Proceedings”. An adverse decision in this litigation could force us to do one or more of the following:
|
·
|
stop selling, incorporating, or using our products that use the Saphion I cathode material challenged intellectual property;
|
|
·
|
pay damages for the use of Saphion I cathode material;
|
|
·
|
obtain a license to sell or use the Saphion I cathode material, which license may not be available on reasonable terms, or at all; or
|
|
·
|
redesign those products or manufacturing processes that use the Saphion I cathode material, which may not be economically or technologically feasible.
|
We may become involved in additional litigation and proceedings in the future. Likewise, we may in the future be subject to claims or an inquiry regarding our alleged unauthorized use of a third party’s intellectual property. An adverse outcome in such future litigation could result in similar risks as noted above with respect to the third party’s intellectual property. Whether or not an intellectual property litigation claim is valid, the cost of responding to it, in terms of legal fees and expenses and the diversion of management resources, could be expensive and harm our business.
In the past, we have identified material weaknesses in our internal control over financial reporting. Although we believe that we have remediated those material weaknesses and concluded our controls are effective as of March 31, 2010, if we fail to maintain proper and effective internal controls in the future, our ability to produce accurate and timely financial statements could be impaired, which could harm our operating results, our ability to operate our business and investors' views of us.
Pursuant to the Sarbanes-Oxley Act of 2002, we are required to provide a report by management on internal control over financial reporting, including management’s assessment of the effectiveness of such control. Internal control over financial reporting may not prevent or detect misstatements because of its inherent limitations, including the possibility of human error, the circumvention or overriding of controls, or fraud. Therefore, even effective internal controls can provide only reasonable assurance with respect to the preparation and fair presentation of financial statements. In addition, projections of any evaluation of effectiveness of internal control over financial reporting to future periods are subject to the risk that the control may become inadequate because of changes in conditions, or that the degree of compliance with the policies or procedures may deteriorate. Ensuring that we have adequate internal financial and accounting controls and procedures in place so that we can produce accurate financial statements on a timely basis is a costly and time-consuming effort that needs to be evaluated frequently.
In connection with our prior financial audits, we have identified material weaknesses in our internal control over financial reporting. A material weakness is defined as a deficiency, or combination of deficiencies, in internal control over financial reporting, such that there is a reasonable possibility that a material misstatement of the company's annual or interim financial statements will not be prevented or detected on a timely basis by the company's internal controls. These material weaknesses were as follows:
During the fiscal year ended March 31, 2009, the position of Chief Financial Officer was held three different people, acting consecutively. This caused management to determine that there was a failure to consistently adhere to certain control disciplines and to evaluate and properly record certain non-routine and complex transactions, which constituted a material weakness in internal control over financial reporting.
While we hired Ross A. Goolsby as our Chief Financial Officer in November 2008 and have otherwise expanded our finance, accounting and disclosure staff, we cannot assure you that similar material weaknesses or other material weaknesses will not recur.
17
Implementing any appropriate changes to our internal controls may distract our officers and employees, entail substantial costs to implement new processes and modify our existing processes and take significant time to complete. Moreover, these changes do not guarantee that we will be effective in maintaining the adequacy of our internal controls, and any failure to maintain that adequacy, or consequent inability to produce accurate financial statements on a timely basis, could increase our operating costs and harm our business. In addition, investors' perceptions that our internal controls are inadequate or that we are unable to produce accurate financial statements on a timely basis may harm our stock price and make it more difficult for us to effectively market and sell our products to new and existing customers. For a more detailed discussion regarding material weaknesses, see Item 8A. "Controls and Procedures".
Our international business operations could be disrupted.
Our headquarters is located in Austin, Texas and our research and development center is in Las Vegas, Nevada. We also operate a sales and service facility in Mallusk, Northern Ireland, and our manufacturing operations in Suzhou, China. If major disasters such as earthquakes, fires, floods, hurricanes, wars, terrorist attacks, computer viruses, pandemics or other events occur, or our information system or communications network breaks down or operates improperly, our facilities may be seriously damaged, or we may have to stop or delay production and shipment of our products. We may incur expenses relating to such damages. In addition, a renewed outbreak of SARS, avian flu, swine flu or another widespread public health problem in China or the United States could have a negative effect on our operations.
Risks Associated With Doing Business In China
Since our products are manufactured in China and we have transferred additional operations to China, we face risks if China loses normal trade relations status with the United States.
We manufacture and export our products from China. Our products sold in the United States are currently not subject to U.S. import duties. On September 19, 2000, the United States Senate voted to permanently normalize trade with China, which provides a favorable category of United States import duties. In addition, on December 11, 2001, China was accepted into the World Trade Organization, or WTO, a global international organization that regulates international trade. As a result of opposition to certain policies of the Chinese government and China’s growing trade surpluses with the United States, there has been, and in the future may be, opposition to the extension of Normal Trade Relations, or NTR, status for China. The loss of NTR status for China, changes in current tariff structures or adoption in the United States of other trade policies adverse to China could have an adverse affect on our business.
Furthermore, our business may be adversely affected by the diplomatic and political relationships between the United States and China. These influences may adversely affect our ability to operate in China. If the relationship between the United States and China were to materially deteriorate, it could negatively affect our ability to control our operations and relationships in China, enforce any agreements we have with Chinese manufacturers or otherwise deal with any assets or investments we may have in China.
Because the Chinese legal system in general, and the intellectual property regime in particular, are relatively weak, we may not be able to enforce intellectual property rights in China and elsewhere.
We currently manufacture and export our products from China. The legal regime protecting intellectual property rights in China is weak. Because the Chinese legal system in general, and the intellectual property regime in particular, are relatively weak, it is often difficult to enforce intellectual property rights in China.
Enforcing agreements and laws in China is difficult or may be impossible as China does not have a comprehensive system of laws.
We are dependent on our agreements with our Chinese manufacturing partners. Enforcement of agreements may be sporadic and implementation and interpretation of laws may be inconsistent. The Chinese judiciary is relatively inexperienced in interpreting agreements and enforcing the laws, leading to a higher than usual degree of uncertainty as to the outcome of any litigation. Even where adequate law exists in China, it may be impossible to obtain swift and equitable enforcement of such law, or to obtain enforcement of a judgment by a court of another jurisdiction.
The government of China may change or even reverse its policies of promoting private industry and foreign investment, in which case our assets and operations may be at risk.
China is a socialist state, which since 1949 has been, and is expected to continue to be, controlled by the Communist Party of China. Our existing and planned operations in China are subject to the general risks of doing business internationally and the specific risks related to the business, economic and political conditions in China, which include the possibility that the central government of China will change or even reverse its policies of promoting private industry and foreign investment in China. Many of the current reforms which support private business in China are unprecedented or experimental. Other political, economic and social factors, such as political changes, changes in the rates of economic growth, unemployment or inflation, or in the disparities of per capita wealth among citizens of China and between regions within China, could also lead to further readjustment of the government’s reform measures. It is not possible to predict whether the Chinese government will continue to be as supportive of private business in China, nor is it possible to predict how future reforms will affect our business.
18
The government of China continues to exercise substantial control over the Chinese economy which could have a negative effect on our business.
The government of China has exercised and continues to exercise substantial control over virtually every section of the Chinese economy through regulation and state ownership. China’s continued commitment to reform and the development of a vital private sector in that country have, to some extent, limited the practical effects of the control currently exercised by the government over individual enterprises. However, the economy continues to be subject to significant government controls, which, if directed towards our business activities, could have a significant adverse effect on us. For example, if the government were to limit the number of foreign personnel who could work in the country, substantially increase taxes on foreign businesses or impose any number of other possible types of limitations on our operations, our ability to conduct our business would be significantly adversely affected.
Changes in China’s political and economic policies could harm our business.
The economy of China has historically been a planned economy subject to governmental plans and quotas and has, in certain aspects, been transitioning to a more market-oriented economy. Although we believe that the economic reform and the macroeconomic measures adopted by the Chinese government have had a positive effect on the economic development of China, we cannot predict the future direction of these economic reforms or the effects these measures may have on our business, financial position or results of operations. In addition, the Chinese economy differs from the economies of most countries belonging to the Organization for Economic Cooperation and Development, or OECD. These differences include:
|
·
|
economic structure;
|
|
·
|
level of government involvement in the economy;
|
|
·
|
level of development;
|
|
·
|
level of capital reinvestment;
|
|
·
|
control of foreign exchange;
|
|
·
|
methods of allocating resources; and
|
|
·
|
balance of payments position.
|
As a result of these differences, our operations, including our current manufacturing operations in China, may not develop in the same way or at the same rate as might be expected if the Chinese economy were similar to the OECD member countries.
Business practices in China may entail greater risk and dependence upon the personal relationships of senior management than is common in North America and therefore some of our agreements with other parties in China could be difficult or impossible to enforce.
The business structure of China is, in most respects, different from the business culture in Western countries and may present some difficulty for Western investors reviewing contractual relationships among companies in China and evaluating the merits of an investment. Personal relationships among business principals of companies and business entities in China are very significant in the business culture. In some cases, because so much reliance is based upon personal relationships, written contracts among businesses in China may be less detailed and specific than is commonly accepted for similar written agreements in Western countries. In some cases, material terms of an understanding are not contained in the written agreement but exist as oral agreements only. In other cases, the terms of transactions which may involve material amounts of money are not documented at all. In addition, in contrast to Western business practices where a written agreement specifically defines the terms, rights and obligations of the parties in a legally-binding and enforceable manner, the parties to a written agreement in China may view that agreement more as a starting point for an ongoing business relationship which will evolve and require ongoing modification. As a result, written agreements in China may appear to the Western reader to look more like outline agreements that precede a formal written agreement. While these documents may appear incomplete or unenforceable to a Western reader, the parties to the agreement in China may feel that they have a more complete understanding than is apparent to someone who is only reading the written agreement without having attended the negotiations. As a result, contractual arrangements in China may be more difficult to review and understand. Also, despite legal developments in China over the past 20 years, adequate laws, comparable with Western standards, do not exist in all areas and it is unclear how many of our business arrangements would be interpreted or enforced by a court in China.
Our ongoing manufacturing and development operations in China are complex and having these remote operations may divert management’s attention, lead to disruptions in operations and delay implementation of our business strategy.
We have relocated most of our manufacturing and development operations to China. We may not be able to find or retain suitable employees in China and we may have to train personnel to perform necessary functions for our manufacturing, senior management and development operations. This may divert management’s attention, lead to disruptions in operations and delay implementation of our business strategy, all of which could negatively affect our profitability.
19
Our operations could be materially interrupted, and we may suffer significant loss, in the case of fire, casualty or theft at one of our manufacturing or other facilities.
Firefighting and disaster relief or assistance in China is substandard by Western standards. In the event of any material damage to, or loss of, the manufacturing plants where our products are or will be produced due to fire, casualty, theft, severe weather, flood or other similar causes, we would be forced to replace any assets lost in such disaster. Thus our financial position could be materially compromised or we might have to cease doing business. We maintain insurance in China to minimize this risk, but we cannot be sure that such insurance will be sufficient.
In October 2009, we experienced a fire in a leased, unoccupied, offsite warehouse facility housing certain of its raw materials, finished goods inventory, and fixed assets, in Suzhou, China. Management concluded that a material charge for impairment with respect to certain inventory and fixed assets was required under GAAP, and we recorded a liability for the payment of Chinese VAT with respect to certain inventory which was consumed by the fire. Although insurance proceeds covered a significant portion of this loss, we cannot be sure that a fire or other similarly destructive event at one of its facilities in the future would not materially affect our financial position or disrupt our operations in the future. In addition, as a result of this claim, our insurance costs may rise.
The system of taxation in China is uncertain and subject to unpredictable change that could affect our profitability.
Many tax rules are not published in China and those that are published can be ambiguous and contradictory, leaving a considerable amount of discretion to local tax authorities. China currently offers tax and other preferential incentives to encourage foreign investment. However, the country’s tax regime is undergoing review and there is no assurance that such tax and other incentives will continue to be made available. If we no longer receive such preferential incentives, our business, prospects and results of operations would be adversely affected.
It is uncertain whether we will be able to recover value-added taxes imposed by the Chinese taxing authority.
China’s turnover tax system consists of value-added tax, or VAT, consumption tax and business tax. Export sales are exempted under VAT rules and an exporter who incurs VAT on purchase or manufacture of goods should be able to claim a refund from Chinese tax authorities. However, due to a reduction in the VAT export refund rate of some goods, exporters might bear part of the VAT they incurred in conjunction with the exported goods. In 2003, changes to the Chinese value-added tax system were announced affecting the recoverability of input VAT beginning January 1, 2004. Our VAT expense will depend on the reaction of both our suppliers and customers. Continued efforts by the Chinese government to increase tax revenues could result in revisions to tax laws or their interpretation, which could increase our VAT and various tax liabilities.
Risks Associated With Our Industry
If competing technologies that outperform our batteries were developed and successfully introduced, then our products might not be able to compete effectively in our targeted market segments.
Rapid and ongoing changes in technology and product standards could quickly render our products less competitive, or even obsolete. Other companies who are seeking to enhance traditional battery technologies, such as lead-acid and nickel-cadmium, have recently introduced or are developing batteries based on nickel metal-hydride, liquid lithium-ion and other emerging and potential technologies. These competitors are engaged in significant development work on these various battery systems, and we believe that much of this effort is focused on achieving higher energy densities for low power applications such as portable electronics. One or more new, higher energy rechargeable battery technologies could be introduced which could be directly competitive with, or superior to, our technology. The capabilities of many of these competing technologies have improved over the past several years. Competing technologies that outperform our batteries could be developed and successfully introduced, and as a result, there is a risk that our products may not be able to compete effectively in our targeted market segments.
We have invested in research and development of next-generation technology in energy solutions. If we are not successful in developing and commercially exploiting new energy solutions based on new materials, or we experience delays in the development and exploitations of new energy solutions compared to our competitors, our future growth and revenues will be adversely affected.
Our principal competitors generally have greater financial and marketing resources than we do and they may therefore develop batteries similar or superior to ours or otherwise compete more successfully than we do.
Competition in the rechargeable battery industry is intense. The industry consists of several major and emerging domestic and international companies, most of which have financial, technical, marketing, sales, manufacturing, distribution and other resources substantially greater than ours. There is a risk that other companies may develop batteries similar or superior to ours. In addition, many of these companies have name recognition, established positions in the market, and long-standing relationships with OEMs and other customers. Further, a number of our competitors have received or may in the future receive grants, subsidies or incentives from federal, local and state governments, which may provide them with lower cost capital and a competitive advantage. We believe that our primary competitors are existing suppliers of cylindrical lithium-ion, nickel cadmium, nickel metal-hydride and in some cases, non-SLI lead-acid batteries. These suppliers include, but are not limited to; Sanyo, Matsushita Industrial Co., Ltd. (Panasonic), Sony, Toshiba, SAFT, A123 Systems, and Ener1, as well as numerous lead-acid manufacturers throughout the world. Most of these companies are very large and have substantial resources and market presence. We expect that we will compete against manufacturers of other types of batteries in our targeted application segments. There is also a risk that we may not be able to compete successfully against manufacturers of other types of batteries in any of our targeted applications.
20
Laws regulating the manufacture or transportation of batteries may be enacted which could result in a delay in the production of our batteries or the imposition of additional costs that could harm our ability to be profitable.
At the present time, international, federal, state and local laws do not directly regulate the storage, use and disposal of the component parts of our batteries. However, laws and regulations may be enacted in the future which could impose environmental, health and safety controls on the storage, use and disposal of certain chemicals and metals used in the manufacture of lithium polymer batteries. Satisfying any future laws or regulations could require significant time and resources from our technical staff, including those related to possible redesign which may result in substantial expenditures and delays in the production of our product, all of which could harm our business and reduce our future profitability.
The transportation of lithium-ion batteries is regulated both domestically and internationally. Our U-Charge® Power System is classified as a Class 9 hazardous material for shipping purposes pursuant to regulations published by the U.S. Department of Transportation (DOT) and the International Air Transport Association. We package and offer for transport the U-Charge® Power System in compliance with all DOT and IATA regulatory requirements. On January 11, 2010, the DOT proposed new regulations on lithium ion batteries. At present, it is not known if or when the proposed regulations would be adopted or whether these new regulations may eventually be adopted by IATA. Compliance with these new DOT regulations could result in additional costs for shipping the U-Charge® Power System and delay the introduction of new products.
Our international business operations could be disrupted.
Our headquarters is located in Austin, Texas and our research and development center is in Las Vegas, Nevada. We also operate a sales and service facility in Mallusk, Northern Ireland, and our manufacturing operations in Suzhou, China. If major disasters such as earthquakes, fires, floods, hurricanes, wars, terrorist attacks, computer viruses, pandemics or other events occur, or our information system or communications network breaks down or operates improperly, our facilities may be seriously damaged, or we may have to stop or delay production and shipment of our products. We may incur expenses relating to such damages. In addition, a renewed outbreak of SARS, avian flu, swine flu or another widespread public health problem in China or the United States could have a negative effect on our operations.
Risks Associated With Ownership of Our Stock
Corporate insiders or their affiliates will be able to exercise significant control over matters requiring stockholder approval that might not be in the best interests of our stockholders as a whole.
As of March 31, 2010, our officers, directors and their affiliates as a group beneficially owned approximately 54.8% of our outstanding common stock, of which our Chairman Carl Berg and his affiliates beneficially owned approximately 51.8% of our outstanding common stock. As a result, these stockholders will be able to exercise significant control over all matters requiring stockholder approval, including the election of directors and the approval of significant corporate transactions, which could delay or prevent someone from acquiring or merging with us. The interest of our officers and directors, when acting in their capacity as stockholders, may lead them to:
|
·
|
vote for the election of directors who agree with the incumbent officers’ or directors’ preferred corporate policy; or
|
|
·
|
oppose or support significant corporate transactions when these transactions further their interest as incumbent officers or directors, even if these interests diverge from their interests as stockholders per se and thus from the interests of other stockholders.
|
Some provisions of our charter documents may make takeover attempts difficult, which could depress the price of our stock and limit the price that potential acquirers may be willing to pay for our common stock.
Our Board of Directors has the authority, without any action by the outside stockholders, to issue additional shares of our preferred stock, which shares may be given superior voting, liquidation, distribution, and other rights as compared to those of our common stock. The rights of the holders of our capital stock will be subject to, and may be adversely affected by, the rights of the holders of any preferred stock that may be issued in the future. The issuance of additional shares of preferred stock could have the effect of making it more difficult for a third party to acquire a majority of our outstanding voting stock. These provisions may have the effect of delaying, deferring or preventing a change in control, may discourage bids for our common stock at a premium over its market price, may decrease the market price and may infringe upon the voting and other rights of the holders of our common stock.
At any given time we might not meet the continued listing requirements of the NASDAQ Capital Market.
Given the volatility of our stock and trends in the stock market in general, at any given time we might not meet the continued listing requirements of The NASDAQ Capital Market. Among other requirements, NASDAQ requires the minimum bid price of a company’s registered shares to be $1.00. On March 8, 2010, we received written notice from The NASDAQ Stock Market indicating that we were not in compliance with the $1.00 minimum bid price requirement for continued listing on The NASDAQ Capital Market, as set forth in Listing Rule 5550(a)(2). We were provided a 180-day grace period to regain compliance with the Listing Rule. On April 20, 2010, we received a letter from The NASDAQ Stock Market confirming that the closing bid price of our common stock had been at $1.00 per share or greater for at least 10 consecutive business days. As a result of our having satisfied the minimum bid price requirement for at least 10 consecutive business days, The NASDAQ Stock Market has informed us that this matter was closed. Subsequently, however, our stock price has continued to fluctuate, closing below $1.00 on several occasions in April, May, and June 2010. If we are not able to maintain the requirements for continued listing on The NASDAQ Capital Market, we could be de-listed and it could have a materially adverse effect on the price and liquidity of our common stock.
21
Our stock price is volatile, which could result in a loss of your investment.
The market price of our common stock has been and is likely to continue to be highly volatile. During the fiscal year ended March 31, 2010, the sales price of our common stock ranged from $0.75 to $2.30 per share. Factors that may have a significant effect on the market price of our common stock include the following:
|
·
|
fluctuation in our operating results,
|
|
·
|
announcements of technological innovations or new commercial products by us or our competitors,
|
|
·
|
failure to achieve operating results projected by securities analysts,
|
|
·
|
governmental regulation,
|
|
·
|
developments in our patent or other proprietary rights or our competitors’ developments,
|
|
·
|
our relationships with current or future collaborative partners, and
|
|
·
|
other factors and events beyond our control.
|
In addition, the stock market in general has experienced extreme volatility that often has been unrelated to the operating performance of particular companies. These broad market and industry fluctuations may adversely affect the trading price of our common stock, regardless of our actual operating performance. As a result of this potential stock price volatility, investors may be unable to sell their shares of our common stock at or above the cost of their purchase prices. In addition, companies that have experienced volatility in the market price of their stock have been the object of securities class action litigation. If we were the subject of securities class action litigation, this could result in substantial costs, a diversion of our management’s attention and resources and harm to our business and financial condition.
Future sales of currently outstanding shares could adversely affect our stock price.
The market price of our common stock could drop as a result of sales of a large number of shares in the market or in response to the perception that these sales could occur. In addition, these sales might make it more difficult for us to sell equity or equity-related securities in the future at a time and price that we deem appropriate. As of March 31, 2010, we had issued 131,972,224 shares of common stock and have 1,803,144 shares in treasury stock. In addition, at March 31, 2010, we had 8,303,952 shares of our common stock reserved for issuance under warrants and stock options plans. On April 30, 2009, our Board of Directors adopted the 2009 Equity Incentive Plan under which 3,000,000 shares (or share equivalents) were initially reserved for issuance. The shares (or share equivalents) available for issuance under this plan could increase to as much as 16,500,000 pursuant to the annual increase provisions of the plan. In connection with the potential conversion of the Series C-1 Convertible Preferred Stock and Series C-2 Convertible Preferred Stock, issued on December 1, 2004, we may need to issue up to 2,174,242 and 1,454,392 shares, respectively, of our common stock (based on a conversion price of $1.98 and $2.96, respectively) (in addition to any shares that may be issued with respect to the conversion of accrued dividends).
Equity transactions occurring in the future, including sales under our At Market Issuance Sales Agreement and sales of stock at a discount under our Common Stock Purchase Agreement with Seaside 88, LP, would result in immediate dilution to current equity holders and, as a result, our stock price may go down.
Future equity transactions, including the sale of shares of common stock or preferred stock, sales under our Common Stock Purchase Agreement with Seaside 88, LP, sales under our At Market Issuance Sales Agreement, or the exercise of options or warrants or other convertible securities, would result in dilution and, as a result, our stock price may go down. In October 2009 we entered into a Common Stock Purchase Agreement with Seaside 88, LP, or Seaside, which provides that, upon the terms and subject to the conditions set forth therein, we are required to issue and sell, and Seaside to purchase, up to 650,000 shares of our common stock once every two weeks, subject to the satisfaction of customary closing conditions, beginning on October 15, 2009 and ending on or about the date that is 52 weeks subsequent to the initial closing, for an aggregate sale to Seaside of up to 16,900,000 shares of common stock. The price of the shares that we sell to Seaside will be at a 12% discount to the volume weighted average trading price of the common stock for the ten consecutive trading days immediately preceding each closing date, which will result in immediate and substantial dilution to current holders. In addition, in February 2008 we entered into an At Market Issuance Sales Agreement with Wm. Smith & Co., amended in July 2009, which provides that, upon the terms and subject to the conditions set forth therein, we may, through Wm. Smith & Co. acting as sales agent, issue and sell up to 10 million shares of our common stock. To date, a total of 5.9 million of the aggregate shares authorized for sale through Wm. Smith & Co. have been sold and 4.1 million remain available for future issuance under the agreement. Further, as opportunities present themselves from time to time, we may sell restricted stock and warrants or convertible debt to investors in private placements conducted by broker-dealers, or in negotiated transactions. Because the securities may be restricted, the securities may be sold at a greater discount to market prices compared to a public securities offering, and the exercise price of the warrants may be at or even lower than market prices. These transactions cause dilution to existing stockholders. Also, from time to time, options may be issued to employees and third parties, with exercise prices equal to market. Exercise of in-the-money options, warrants and other convertible securities will result in dilution to existing stockholders; the amount of dilution will depend on the spread between market and exercise price, and the number of shares involved.
22
Our management team has broad discretion over the use of the net proceeds from any offering by us of our equity securities, including sales under our Common Stock Purchase Agreement with Seaside 88, LP and our At Market Issuance Sales Agreement.
Our management will use its discretion to direct the net proceeds from any offering of our equity securities. We intend to use all of the net proceeds of our equity offerings under our Common Stock Purchase Agreement with Seaside 88, LP, and, to the extent of any additional sales thereunder, our At Market Issuance Sales Agreement, together with cash on hand, for general corporate purposes, although we could use the proceeds for other purposes as well. General corporate purposes may include working capital, capital expenditures, development costs, strategic investments or possible acquisitions. Our management’s judgments may not result in positive returns on shareholders’ investments and our shareholders will not have an opportunity to evaluate the economic, financial or other information upon which our management bases its decisions.
We do not intend to pay dividends on our common stock, and therefore stockholders will be able to recover their investment in our common stock, if at all, only by selling the shares of stock that they hold.
Some investors favor companies that pay dividends on common stock. We have never declared or paid any cash dividends on our common stock. We currently intend to retain any future earnings for funding growth and we do not anticipate paying cash dividends on our common stock in the foreseeable future. Because we may not pay dividends, a return on an investment in our stock likely depends on the ability to sell our stock at a profit.
Our business is subject to changing regulations relating to corporate governance and public disclosure that has increased both our costs and the risk of noncompliance.
Because our common stock is publicly traded, we are subject to certain rules and regulations of federal, state and financial market exchange entities charged with the protection of investors and the oversight of companies whose securities are publicly traded. These entities, including the Public Company Accounting Oversight Board, the Commission, and NASDAQ, have recently issued new requirements and regulations and continue to develop additional regulations and requirements in response to recent laws enacted by Congress, most notably Section 404 of the Sarbanes-Oxley Act of 2002. Our efforts to comply with these new regulations have resulted in, and are likely to continue to result in, materially increased general and administrative expenses and a significant diversion of management time and attention from revenue-generating and cost-reduction activities to compliance activities.
In particular, our efforts to comply with Section 404 of the Sarbanes-Oxley Act of 2002 and the related regulations regarding our required assessment of our internal controls over financial reporting and our independent registered public accounting firm’s audit of that assessment has required, and continues to require, the commitment of significant financial and managerial resources. There is no assurance that these efforts will be completed on a timely and successful basis. Because these laws, regulations and standards are subject to varying interpretations, their application in practice may evolve over time as new guidance becomes available. This evolution may result in continuing uncertainty regarding compliance matters and additional costs necessitated by ongoing revisions to our disclosure and governance practices.
In the event that our Chief Executive Officer, Chief Financial Officer, or independent registered public accounting firm determines that our internal controls over financial reporting are not effective as defined under Section 404 of the Sarbanes-Oxley Act of 2002, there may be a material adverse effect in investor perceptions and a decline in the market price of our stock.
None.
Our corporate offices are located in a leased facility in Austin, Texas. We also have a leased research and development facility in Las Vegas, Nevada. Our two wholly owned foreign enterprises in China lease two separate facilities, totaling 13,000 square meters in Suzhou, China. Our sales and OEM manufacturing support center is located in Mallusk, Northern Ireland.
23
On January 31, 2007, we filed a claim against Phostech Lithium Inc. in the Federal Court in Canada (Valence Technology, Inc. v. Phostech Lithium Inc. Court File No. T-219-07) alleging infringement of Valence Canadian Patent 2,395,115. Subsequently, on April 2, 2007, we filed an amended claim alleging infringement of Valence’s Canadian Patents 2,483,918 and 2,466,366. The action is in the discovery phase. We are seeking monetary damages and injunctive relief for the acts of Phostech in manufacturing, using and selling phosphate cathode material that infringes the asserted Valence Canadian Patents.
On February 14, 2006, Hydro-Quebec filed an action against us in the United States District Court for the Western District of Texas (Hydro-Quebec v. Valence Technology, Civil Action No. A06CA111). In its amended complaint filed April 13, 2006, Hydro-Quebec alleges that Saphion® I Technology, the technology utilized in all of our commercial battery products, infringes U.S. Patent Nos. 5,910,382 and 6,514,640 exclusively licensed to Hydro-Quebec. Hydro-Quebec’s complaint seeks injunctive relief and monetary damages. The action was stayed by the Court pending a final determination of reexaminations of the two patents by the USPTO. The reexaminations are complete and Hydro-Quebec has filed an amended Complaint alleging infringement of certain amended claims in the two reexamined patents. We have filed a response denying the allegations in the amended complaint as well as filing a counter complaint seeking damages from Hydro-Quebec, the University of Texas, and Phostech. The litigation is now proceeding.
We are subject, from time to time, to various claims and litigation in the normal course of business. In our opinion, all pending legal matters will not have a material adverse effect on our consolidated financial statements.
24
ITEM 4. MARKET FOR REGISTRANT’S COMMON EQUITY, RELATED SHAREHOLDER MATTERS AND ISSUER PURCHASES OF EQUITY SECURITIES
Market Information
Our common stock is quoted on the NASDAQ Capital Market under the symbol “VLNC.” As of May 28, 2010, we had approximately 637 holders of record of our common stock, one of which is Cede & Co., a nominee for Depository Trust Company, or DTC. All of the shares of our common stock held by brokerage firms, banks and other financial institutions as nominees for beneficial owners are deposited into participant accounts at DTC, and are therefore considered to be held of record by Cede & Co. as one stockholder.
The following table sets forth the quarterly high and low closing sales prices of our common stock during fiscal years 2010 and 2009, respectively:
|
Closing Sales Prices
|
||||||||
|
High
|
Low
|
|||||||
|
Fiscal year 2010:
|
||||||||
|
Quarter ended June 30, 2009
|
$ | 2.30 | $ | 1.78 | ||||
|
Quarter ended September 30, 2009
|
1.95 | 1.36 | ||||||
|
Quarter ended December 31, 2009
|
1.78 | 0.84 | ||||||
|
Quarter ended March 31, 2010
|
1.09 | 0.75 | ||||||
|
Fiscal year 2009:
|
||||||||
|
Quarter ended June 30, 2008
|
$ | 4.82 | $ | 2.78 | ||||
|
Quarter ended September 30, 2008
|
4.43 | 2.24 | ||||||
|
Quarter ended December 31, 2008
|
3.49 | 1.24 | ||||||
|
Quarter ended March 31, 2009
|
2.30 | 1.09 | ||||||
The following table includes, as of March 31, 2010, information regarding common stock authorized for issuance under our equity compensation plans:
|
Plan Category
|
Number of securities to be issued
upon exercise of outstanding
options, warrants and rights
|
Weighted-average
exercise price of
outstanding options,
warrants and rights
|
Number of securities
remaining available
for future issuance
under equity
compensation plans
|
||||
|
Equity compensation plans approved
by security holders
|
4, 045,652
|
$
|
2.25
|
2,643,300
|
|||
|
Equity compensation plans not approved
by security holders (1)
|
1,500,000
|
1.61
|
—
|
||||
|
Total
|
5,545 ,652
|
$
|
2.08
|
2,643,300
|
|||
|
(1)
|
Options to purchase 1,500,000 shares were granted to Robert L. Kanode in March 2007 pursuant to his employment agreement. The exercise price of his shares is $1.61 per share and they vest as follows: 250,000 shares vested on September 13, 2007 and the remaining 1,250,000 shares monthly over the remaining two and a half years.
|
Recent Sales of Unregistered Securities
None, except as has been previously disclosed in our quarterly reports on Form 10-Q and current reports on Form 8-K filed with the Securities and Exchange Commission.
Dividends
We have never declared or paid any cash dividends on our common stock. We intend to retain earnings, if any, to finance future operations and expansion and, therefore, do not anticipate paying any cash dividends in the foreseeable future. Any future payment of dividends will depend upon our financial condition, capital requirements and earnings, as well as upon other factors that the Board of Directors may deem relevant.
25
Performance Graph
The graph below compares the cumulative 5-year total return of holders of Valence Technology, Inc.’s common stock with the cumulative total returns of the NASDAQ Composite index and the NASDAQ Electronic Components index. The graph tracks the performance of a $100 investment in our common stock and in each of the indexes (with the reinvestment of all dividends) from March 31, 2005 to March 31, 2010.
COMPARISON OF 5 YEAR CUMULATIVE TOTAL RETURN*
Among Valence Technology, Inc., The NASDAQ Composite Index
And The NASDAQ Electronic Components Index
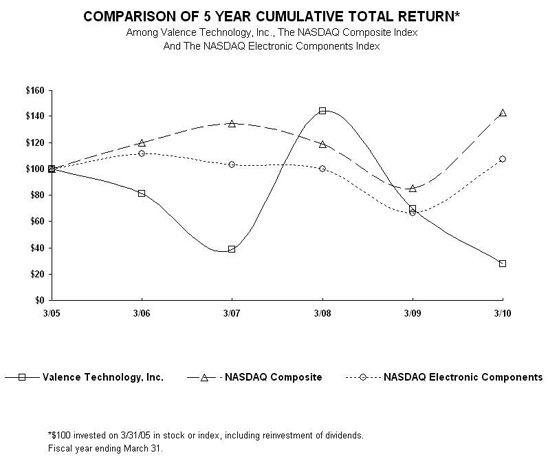
| 3/05 | 3/06 | 3/07 | 3/08 | 3/09 | 3/10 | |||||||||||||||||||
|
Valence Technology, Inc.
|
100.00 | 81.11 | 38.44 | 143.65 | 69.38 | 27.69 | ||||||||||||||||||
|
NASDAQ Composite
|
100.00 | 119.97 | 134.27 | 118.46 | 85.30 | 142.80 | ||||||||||||||||||
|
NASDAQ Electronic Components
|
100.00 | 111.52 | 103.15 | 100.10 | 66.59 | 107.00 |
The stock price performance included in this graph is not necessarily indicative of future stock price performance.
26
This section presents selected historical financial data of Valence Technology, Inc. The information should be read in conjunction with the “Management’s Discussion and Analysis of Financial Condition and Results of Operations” and our consolidated financial statements and notes thereto contained elsewhere in this document. Our financial data as of and for the periods indicated is derived from our audited financial statements for such periods. The following is not necessarily indicative of future results:
|
Fiscal Year ended March 31,
|
||||||||||||||||||||
|
(in thousands except per share data)
|
2010
|
2009
|
2008
|
2007
|
2006
|
|||||||||||||||
|
Statement of Operations Data
|
||||||||||||||||||||
|
Revenues
|
||||||||||||||||||||
|
Battery and systems sales
|
$ | 15,751 | $ | 24,814 | $ | 20,191 | $ | 15,971 | $ | 16,490 | ||||||||||
|
Licensing and royalty revenue
|
329 | 1,343 | 586 | 703 | 724 | |||||||||||||||
|
Total revenue
|
16,080 | 26,157 | 20,777 | 16,674 | 17,214 | |||||||||||||||
|
Cost of sales
|
14,093 | 25,682 | 18,956 | 16,366 | 25,454 | |||||||||||||||
|
Gross margin / (deficit)
|
1,987 | 475 | 1,821 | 308 | (8,240 | ) | ||||||||||||||
|
Operating Expenses :
|
||||||||||||||||||||
|
Research and product development
|
4,464 | 4,333 | 3,772 | 3,982 | 5,408 | |||||||||||||||
|
Selling, general and administrative
|
15,032 | 11,994 | 12,230 | 12,406 | 14,383 | |||||||||||||||
|
Loss / (gain) on disposal of assets
|
— | 137 | 16 | 62 | (445 | ) | ||||||||||||||
|
Asset impairment charge
|
301 | 731 | 154 | 52 | 170 | |||||||||||||||
|
Other
|
— | — | — | 24 | (108 | ) | ||||||||||||||
|
Total operating expenses
|
19,797 | 17,195 | 16,172 | 16,526 | 19,408 | |||||||||||||||
|
Operating loss
|
(17,810 | ) | (16,720 | ) | (14,351 | ) | (16,218 | ) | (27,648 | ) | ||||||||||
|
Foreign exchange gain
|
44 | 605 | 1,258 | 260 | 73 | |||||||||||||||
|
Interest (expense)/income, net
|
(4,950 | ) | (5,111 | ) | (6,347 | ) | (6,293 | ) | (5,003 | ) | ||||||||||
|
Casualty loss
|
(300 | ) | — | — | — | — | ||||||||||||||
|
Net Loss
|
(23,016 | ) | (21,226 | ) | (19,440 | ) | (22,251 | ) | (32,724 | ) | ||||||||||
|
Dividends on preferred stock
|
172 | 172 | 173 | 172 | 172 | |||||||||||||||
|
Preferred stock accretion
|
— | — | — | — | 28 | |||||||||||||||
|
Net loss attributable to common stockholders
|
$ | (23,188 | ) | $ | (21,398 | ) | $ | (19,613 | ) | $ | (22,423 | ) | $ | (32,924 | ) | |||||
|
Net loss per share-basic and diluted
|
$ | (0.18 | ) | $ | (0.18 | ) | $ | (0.18 | ) | $ | (0.22 | ) | $ | (0.37 | ) | |||||
|
Weighted average shares outstanding-basic and diluted
|
126,211 | 119,370 | 111,593 | 99,714 | 89,298 | |||||||||||||||
|
Balance Sheet Data :
|
||||||||||||||||||||
|
Cash and cash equivalents
|
3,172 | 4,009 | 2,616 | 1,168 | 612 | |||||||||||||||
|
Working (deficit) capital
|
(13,076 | ) | 13,889 | 11,200 | 7,382 | (4,250 | ) | |||||||||||||
|
Total assets
|
21,032 | 29,636 | 27,158 | 19,200 | 11,632 | |||||||||||||||
|
Long-term debt, and long-term debt to stockholder, net of discount
|
34,848 | 34,766 | 53,607 | 52,390 | 51,112 | |||||||||||||||
|
Redeemable convertible preferred stock
|
8,610 | 8,610 | 8,610 | 8,610 | 8,610 | |||||||||||||||
|
Accumulated deficit
|
(580,845 | ) | (557,657 | ) | (536,260 | ) | (516,647 | ) | (494,224 | ) | ||||||||||
|
Total stockholders’ deficit
|
(79,115 | ) | (67,185 | ) | (67,317 | ) | (67,918 | ) | (76,212 | ) | ||||||||||
27
General
We develop, manufacture and sell high-energy power systems utilizing our proprietary phosphate-based lithium-ion technology for diverse applications, with special emphasis on portable appliances and future generations of hybrid and electric vehicles. Our mission is to promote the wide adoption of high-performance, safe, long cycle life, environmentally friendly, low-cost energy storage systems and address the significant market opportunity we believe is available to us by drawing on the numerous benefits of our latest energy storage technology, deep intellectual property portfolio, and the extensive experience of our management team.
Total revenue in fiscal year 2010 was $16.1 million, a decrease of 39% compared to the prior fiscal year. We believe revenue will grow in fiscal year 2011, as compared to fiscal year 2010, from new customer sales due to the increasing demand in the U.S. and EMEA (Europe, Middle East and Africa) markets for alternative energy solution systems. We expanded the capacity of our China manufacturing and support operations in our two wholly-owned subsidiaries in anticipation of increased demand.
Going Concern
As a result of our limited cash resources and history of operating losses there is substantial doubt about our ability to continue as a going concern. We presently have no further commitments for financing by our Chairman Carl Berg and/or his affiliates. Recently, we have depended on our Common Stock Purchase Agreement with Seaside 88, L.P., and to a limited extent on sales of common stock under an At-Market Issuance Agreement with Wm. Smith & Co. Seaside 88’s bi-weekly common stock purchase obligations expire in October 2010, and are subject to certain conditions, including that our stock trade above a volume weighted average price of $1 in the period prior to each bi-weekly purchase, which we have violated on several occasions, resulting in our having failed to sell 5.9 million shares under this arrangement. If we are unable to obtain financing from Mr. Berg or others on terms acceptable to us, or at all, we may be forced to cease all operations and liquidate our assets. Our cash requirements may vary materially from those now planned because of changes in our operations, including the failure to achieve expected revenues, greater than expected expenses, changes in OEM relationships, market conditions, the failure to timely realize our product development goals, and other adverse developments. These events could have a negative effect on our available liquidity sources during fiscal 2011.
2010 Highlights
Key product introductions and milestones based on our Lithium Iron Magnesium Phosphate technology during the current year include:
|
·
|
In the fourth quarter of fiscal year 2010, we introduced a Revision 2 of our U-Charge® Lithium Phosphate Energy Storage Systems. Our U-Charge® systems feature our safe, long-life lithium phosphate technology which utilizes a phosphate-based cathode material. We believe that the improved features and functionality of the latest U-Charge® lithium phosphate energy storage systems are well suited for electric vehicle (EV), plug-in hybrid electric vehicle (PHEV) and similar applications. U-Charge® lithium phosphate energy storage systems address the safety and limited life weaknesses of other lithium technologies while offering a solution that is competitive in cost and performance. This Revision 2 of our U-Charge® system builds upon these features and adds improvements in state of charge monitoring, cell and pack balancing, battery monitoring and diagnostics, and certain field repairability.
|
|
·
|
Although we discontinued the manufacture and marketing of our Epoch™ line of commercial products in fiscal year 2009, we have continued the development of our Epoch™ battery management system technology, using Smart battery command and control logic. The benefits of the Epoch™ battery management system technology are being integrated into our U-Charge® product line. The attributes embodied in Epoch™ battery management system technology include communications, control, reliability, modularity and measurement feature enhancements. We believe that Epoch™ battery management system technology offers design and performance capabilities that will facilitate adoption in automotive, industrial, UPS, telecommunications, aerospace and military markets not traditionally served by other lithium-ion solutions. We believe that his technology will allow us to offer more customer focused solutions based upon our proven technology.
|
Our research and development efforts are focused on the design of new products utilizing our lithium iron magnesium phosphate chemistry, the continuous improvement of the manufacturing process of our second and third generation lithium phosphate technology, the development of different cell constructions to optimize power and size for new applications, as well as developing future materials based on our lithium ion phosphate technology platform.
Our business headquarters is in Austin, Texas. Our materials research and development center is in Las Vegas, Nevada. Our European sales and OEM manufacturing support center is in Mallusk, Northern Ireland. Our manufacturing and product development center is in Suzhou, China.
28
Result of Operations
Fiscal Years Ended March 31, 2010 (Fiscal Year 2010), March 31, 2009 (Fiscal Year 2009) and March 31, 2008 (Fiscal Year 2008)
The following table summarizes the results of our operations for the past three fiscal years (in thousands except for share data):
|
Fiscal year Ended
|
||||||||||||||||||||||||||||
|
Change
Increase/
(Decrease)1
|
Change
Increase/
(Decrease)
|
|||||||||||||||||||||||||||
|
|
3/31/2010
|
$
|
%
|
3/31/2009
|
$
|
%
|
3/31/2008
|
|||||||||||||||||||||
| Revenues: | ||||||||||||||||||||||||||||
|
Battery and system sales
|
$ | 15,751 | $ | (9,063 | ) | (37 | )% | $ | 24,814 | $ | 4,623 | 23 | % | $ | 20,191 | |||||||||||||
|
Licensing and royalty revenue
|
329 | (1,014 | ) | (76 | )% | 1,343 | 757 | 129 | % | 586 | ||||||||||||||||||
|
Total revenues
|
16,080 | (10,077 | ) | (39 | )% | 26,157 | 5,380 | 26 | % | 20,777 | ||||||||||||||||||
|
Cost of products sold
|
14,093 | (11,589 | ) | (45 | )% | 25,682 | 6,726 | 35 | % | 18,956 | ||||||||||||||||||
|
Gross margin
|
1,987 | 1,512 | 318 | % | 475 | (1,346 | (74 | )% | 1,821 | |||||||||||||||||||
|
Operating and other expenses
|
19,496 | 3,169 | 19 | % | 16,327 | 325 | 2 | % | 16,002 | |||||||||||||||||||
|
Loss /(gain) on disposal of assets
|
— | (137 | ) | (100 | )% | 137 | 121 | 756 | % | 16 | ||||||||||||||||||
|
Impairments, restructuring, contract
settlement charges
|
301 | (430 | ) | (430 | )% | 731 | 577 | 375 | % | 154 | ||||||||||||||||||
|
Total operating expenses
|
19,797 | 2,602 | 15 | % | 17,195 | 1,023 | 6 | % | 16,172 | |||||||||||||||||||
|
Operating loss
|
(17,810 | ) | (1,090 | ) | 7 | % | (16,720 | ) | (2,369 | ) | 17 | % | (14,351 | ) | ||||||||||||||
|
Other(expense) income, net
|
(5,206 | ) | (700 | ) | 16 | % | (4,506 | ) | 583 | (11 | )% | (5,089 | ) | |||||||||||||||
|
Net loss
|
(23,016 | ) | (1,790 | ) | 8 | % | (21,226 | ) | (1,786 | ) | 9 | % | (19,440 | ) | ||||||||||||||
|
Dividends and accretion on preferred stock
|
172 | (0 | ) | (0 | )% | 172 | (1 | ) | 1 | % | 173 | |||||||||||||||||
|
Net loss available to common stockholders
|
$ | (23,188 | ) | $ | (1,790 | ) | 8 | % | $ | (21,398 | ) | $ | (1,785 | ) | 9 | % | $ | (19,613 | ) | |||||||||
|
Net loss per share available to common
stockholders, basic and diluted
|
$ | (0.18 | ) | $ | (0 | ) | (0 | )% | $ | (0.18 | ) | $ | 0.00 | (23 | )% | $ | (0.18 | ) | ||||||||||
|
Shares used in computing net loss per share
available to common stockholders, basic
and diluted
|
126,211 | 6,841 | 6 | % | 119,370 | 11,879 | 7 | % | 111,593 | |||||||||||||||||||
Revenues and Gross Margin
Battery and system sales: Battery and systems sales totaled $15.8 million for the year ended March 31, 2010, as compared to $24.8 million for the year ended March 31, 2009, and $20.2 million for the year ended March 31, 2008. The decrease in revenue in fiscal year 2010, compared to fiscal year 2009, was primarily due to decreased demand of large-format battery sales of the U-Charge® products to existing customers and decreased demand for custom batteries designed for Segway. The increase in revenue in fiscal year 2009, compared to fiscal year 2008 was primarily due to higher large-format battery sales of the U-Charge® product to new and existing customers. The increase in revenues in fiscal year 2008, compared to fiscal year 2007, was primarily due to additional sales of the large-format batteries, to new and existing customers, which include U-Charge®, and custom batteries designed for Segway. We had approximately $0.1 million and $0.4 million in deferred revenue on our balance sheet at March 31, 2010 and March 31, 2009, respectively, primarily related to sales shipping in the end of the fourth quarter. Segway sales accounted for 25%, 46%, and 55% of our total product sales in fiscal years 2010, 2009, and 2008, respectively. The large-format battery system sales represent 65%, 45%, and 30%, of our total revenue for fiscal years 2010, 2009, and 2008, respectively. We expect sales of the large-format battery system to increase during fiscal 2011, due to the growing demand of alternative energy storage systems and the fulfillment of current sales agreements. The increase in demand in alternative energy solutions is driven largely by the sustained high cost of fossil fuels and a market focus on environmentally friendly energy solutions. We did not experience any material effect of inflation on our battery and system sales in the three most recent fiscal years.
29
Licensing and Royalty Revenue: Licensing and royalty revenues relate to revenue from licensing agreements for our battery construction technology. Fiscal year 2010 licensing and royalty revenue was $0.3 million, as compared to $1.3 million in fiscal year 2009, and $0.6 million in fiscal year 2008. Licensing and royalty revenue decreased during fiscal year 2010 due to decreased demand from the end customers that are supplied under our agreement with VARTA Microbattery GmbH. During fiscal year 2010, we continued to receive revenue from the agreement with Amperex Technology Limited. We expect to continue to pursue a licensing strategy as our lithium phosphate technology receives greater market acceptance.
Gross Margin/(Deficit): Gross margin as a percentage of revenue was 12% for the fiscal year ended March 31, 2010 as compared to 2% for the fiscal year ended March 31, 2009, and a gross margin of 9% for the fiscal year ended March 31, 2008. During fiscal year 2010, gross margin as a percentage of revenue increased mainly due to improved manufacturing efficiencies despite the decrease in overall demand, and the absence of significant material obsolescence charges for discontinued product lines, such as Epoch™ and N-Charge®, which occurred in fiscal year 2009. During fiscal year 2009, the gross margin decreased due to charges to cost of products sold related to the discontinued material costs of Epoch™ and N-Charge®, totaling $2.6 million, or 10% of revenue, as compared to fiscal year 2008. In fiscal year 2008, the improvement in our manufacturing efficiency contributed to the increase in our gross margin. In addition, during fiscal year 2008, a vendor agreed to provide a credit of approximately $0.4 million for defective materials that had been received and written off by the Company in fiscal year 2007. As a result, included in fiscal year 2008 gross margin is a $0.4 million reduction of cost of goods which contributed to our improved gross margin. We expect cost of sales, as a percentage of sales, to decrease as production volumes increase and as the lower-cost strategy improves the manufacturing efficiency. We did not experience any material effect of inflation on our gross margin or operating expense in the three most recent fiscal years.
Operating Expenses
The following table summarizes our operating expenses during each of the past three fiscal years (in thousands):
|
Fiscal Year Ended
|
||||||||||||||||||||||||||||
|
Change
|
Change
|
|||||||||||||||||||||||||||
|
3/31/2010
|
$ |
%
|
3/31/2009
|
$ |
%
|
3/31/2008
|
||||||||||||||||||||||
|
Operating expenses
|
||||||||||||||||||||||||||||
|
Research and product development
|
$ | 4,464 | $ | 131 | 3 | % | $ | 4,333 | $ | 564 | 15 | % | $ | 3,772 | ||||||||||||||
|
Marketing
|
2,614 | (308 | ) | (11 | )% | 2,922 | 475 | 19 | % | 2,447 | ||||||||||||||||||
|
General and administrative
|
12,418 | 3,346 | 37 | % | 9,072 | (516 | ) | (6 | )% | 9,784 | ||||||||||||||||||
|
Loss /(gain) on disposal of assets
|
— | (137 | ) | (100 | )% | 137 | 121 | 756 | % | 16 | ||||||||||||||||||
|
Asset impairment charge
|
301 | (430 | ) | (59 | )% | 731 | 577 | 375 | % | 154 | ||||||||||||||||||
|
Total operating expenses
|
$ | 19,797 | $ | 2,602 | 15 | % | $ | 17,195 | 1,023 | (2 | )% | $ | 16,172 | |||||||||||||||
|
Percent total revenue
|
123 | % | 66 | % | 62 | % | ||||||||||||||||||||||
Operating expenses as a percentage of revenue increased to 123% in fiscal year 2010, versus 66% in fiscal year 2009, and 62% in fiscal year 2008. The increase in fiscal year 2010 is mainly due to a year over year increase of approximately $1.9 million in litigation expenses resulting from the prosecution and defense of our intellectual property.
Research and Product Development: Research and product development expenses consist primarily of personnel, equipment, and materials to support our efforts to develop battery chemistry and products, as well as to improve our manufacturing processes. Research and product development expenses totaled $4.5 million in fiscal year 2010, $4.3 million in fiscal year 2009, and $3.8 million in fiscal year 2008. During fiscal year 2010, research and development remained relatively flat compared to fiscal year 2009. Research and development expenses increased by $0.6 million, or 15%, in fiscal year 2009, as compared to fiscal year 2008, primarily due to increased wage and salary expenses, and increased product development expenses. During fiscal year 2010, $0.6 million of share based compensation was allocated to research and development expenses as compared to $0.1 million in fiscal year 2009, and $0.3 million in fiscal year 2008. We expect research and development expenses to remain relatively steady as we create and develop new products.
Marketing: Marketing expenses consist primarily of costs related to sales and marketing personnel, and public relations and promotional materials. Marketing expenses in fiscal year 2010 were relatively flat, at $2.6 million, as compared to fiscal year 2009, which were $2.9 million. This represents a decrease of $0.3 million, or 11%, in fiscal year 2010, as compared to fiscal year 2009. Marketing expenses in fiscal year 2009 were $2.9 million, as compared to fiscal year 2008, which were $2.5 million. The increase in cost during fiscal year 2009, as compared to fiscal year 2008, was primarily related to additional wage and salary expenses related to new employees, and travel and trade show expenses. During fiscal year 2010, $0.2 million of share based compensation was allocated to marketing expenses as compared to $0.3 million in fiscal year 2009, and $0.3 million in fiscal year 2008. We expect marketing expenses to increase as we focus on building a stronger market presence and continue to reach new customers.
30
General and Administrative: General and administrative expenses consist primarily of wage and salary expenses, share based compensation expense, and other related costs for finance, human resources, facilities, information technology, legal, audit, insurance and corporate-related expenses. General and administrative expenses in fiscal year 2010 were $12.4 million, which was $3.4 million, or 37%, higher than fiscal year 2009, which had general and administrative expenses of $9.1 million. General and administrative expenses in fiscal year 2010 increased primarily due to a $1.9 million increase in legal costs associated with the defense of our intellectual property, and a $1.0 million increase in share based compensation expenses from the granting of stock option awards to directors and executives in fiscal year 2010. In addition, wages and salaries increased $0.4 million in fiscal year 2010, as compared to fiscal year 2009, as a result of the addition of several finance and executive level personnel in fiscal year 2010. Share based compensation expense was $1.4 million in fiscal year 2010, as compared to $0.3 million in fiscal year 2009, and $1.7 million in fiscal year 2008. Fiscal year 2009 general and administrative expenses of $9.1 million represented a decrease of $0.5 million, or 6%, over fiscal year 2008 expenses. We expect general and administrative expenses to increase in line with our associated needs as the company grows. We also expect litigation expenses to increase as the litigation matters continue and advance to trial.
Other Costs Related to Our Manufacturing Transition
Impairment Charge: Impairment charges of approximately $0.3 million, $0.7 million, and $0.2 million were recorded during fiscal years 2010, 2009 and 2008, respectively. The fiscal year 2010 impairment charge was the result of our annual fixed asset inventory count and audit for idle or damaged assets in our China production facility. The fiscal year 2009 impairment charge relates to fixed assets that were purchased for the expansion of our production facilities in China. These production assets were deemed to be impaired since the additional capacity provided by these acquisition of these assets will not be necessary to meet expected demand until later than initially expected. The 2008 impairment charge was related to a write-down of machinery and equipment as a result of our annual fixed asset inventory count and audit.
Gain/Loss on Sale of Assets: Loss on sales of assets amounted to approximately $0.1 million and less than $0.1 million, in fiscal years 2009, and 2008, respectively, and resulted primarily from consolidating our China operations into two plants in Suzhou, China, and the resulting sale of related equipment that was not required in our manufacturing and development operations in Suzhou, China.
Interest Expense
Interest Expense: Interest expense relates to our long-term debt with a stockholder and a third party creditor. Interest expense was $5.0 million, $5.2 million, and $6.4 million for the fiscal years 2010, 2009, and 2008, respectively. Interest expense fluctuations are a result of changes in the underlying interest rate on one of the loans, which is indexed to the Libor rate.
Casualty Loss
Property and Casualty Loss. In the second quarter of fiscal year 2010, we experienced a fire at an offsite warehouse in Suzhou, China, which contained certain fixed assets and inventory. We settled a claim with our insurance carrier during the fourth quarter of fiscal year 2010 for $3.2 million related to this fire. We continue to have clean up costs and expenses associated with the repair of the damaged building continuing into fiscal year 2011, and we have accrued for all expected liabilities and costs as of March 31, 2010. We have approximately $0.6 million in liabilities accrued as of March 31, 2010 for the expected costs associated with the clean up and remediation of the leased building which was damaged in the fire. The total amount of inventory consumed in the fire was approximately $2.7 million, and the total amount of fixed assets consumed in the fire was approximately $0.2 million. In addition, a Value Added Tax (“VAT”) liability was assessed on these items as they were carried without VAT being previously assessed on them. In December of 2009, a $0.6 million payment was made to local Chinese authorities against the previously recorded VAT liability.
Liquidity and Capital Resources
At March 31, 2010, our principal source of liquidity was cash and cash equivalents of $3.2 million. We do not expect our cash and cash equivalents will be sufficient to fund our operating and capital needs for the next twelve months following March 31, 2010, nor do we anticipate product sales during fiscal 2011 will be sufficient to cover our operating expenses. Historically, we have relied upon management’s ability to periodically arrange for additional equity or debt financing to meet our liquidity requirements. Unless our product sales are greater than management currently forecasts or there are other changes to our business plan, we will need to arrange for additional financing to fund operating and capital needs. This financing could take the form of debt or equity. Given our historical operating results and the amount of our existing debt, as well as the other factors, we may not be able to arrange for debt or equity financing on favorable terms or at all.
Our cash requirements may vary materially from those now planned because of changes in our operations including the failure to achieve expected revenues, greater than expected expenses, changes in OEM relationships, market conditions, the failure to timely realize the Company’s product development goals, and other adverse developments. These events could have a negative effect on our available liquidity sources during the remaining fiscal year.
31
The following table summarizes our statement of cash flows for the fiscal years ended March 31, 2010, 2009, and 2008 (in thousands):
|
Fiscal Year Ended March 31,
|
||||||||||||
|
2010
|
2009
|
2008
|
||||||||||
|
Net cash flows provided by (used in)
|
||||||||||||
|
Operating activities
|
$ | (9,691 | ) | $ | (15,423 | ) | $ | (14,660 | ) | |||
|
Investing activities
|
(231 | ) | (3,555 | ) | (1,628 | ) | ||||||
|
Financing activities
|
9,086 | 20,359 | 17,709 | |||||||||
|
Effect of foreign exchange rates
|
(1 | ) | 12 | (27 | ) | |||||||
|
Net (decrease) increase in cash and cash equivalents
|
$ | (837 | ) | $ | 1,393 | $ | 1,448 | |||||
Our use of cash from operations during fiscal year 2010, fiscal year 2009, and fiscal year 2008 was $9.7 million, $15.4 million, and $14.7 million, respectively. The cash used for operating activities during all periods was primarily for operating losses and working capital requirements. Cash used for operating activities in fiscal year 2010 was lower than in fiscal year 2009 mainly due to the receipt of insurance proceeds from a fire in an offsite warehouse in our China operations that consumed inventory and fixed assets, and the decrease in inventory due to management’s ongoing focus on reducing inventory levels in fiscal year 2010 to meet the reduced customer demand. Cash used for operating activities in fiscal year 2009 was higher than cash used for operating activities in fiscal year 2008 primarily due to increased spending on salaries and wages in fiscal year 2009, and the collection of accounts receivable in fiscal year 2009, as compared to fiscal year 2008.
In fiscal years 2010, 2009, and 2008, we spent net cash from investing activities of $0.2 million, $3.6 million, and $1.6 million, respectively, primarily on property, plant, and equipment for our China facilities.
We obtained net cash from financing activities of $9.1 million, $20.4 million, and $17.7 million during fiscal years 2010, 2009, and 2008, respectively. Net cash provided by financing activities in fiscal year 2010 includes $4.3 million of common stock sold under the Common Stock Purchase Agreement with Seaside, $3.5 million in sales of our common stock to Carl Berg, $1.2 million of common stock sold under our At Market Issuance Sales Agreement with Wm. Smith & Co, and $0.1 million received from the exercise of stock options by employees. The fiscal year 2009 financing activities include $10.2 million in sales of common stock to private investors, $9.2 million from the conversion of notes payable to common stock and the exercise of warrants held by Berg & Berg, and $0.9 million from the exercise of stock options by employees. The fiscal year 2008 financing includes $8.2 million in sales of common stock to private investors and $9.0 million in sales of common stock to Carl Berg and his affiliates.
On January 14, 2008, we filed a Form S-3 Registration Statement with the SEC utilizing a “shelf” registration process. On January 22, 2008, the Form S-3 Registration was declared effective by the SEC. Pursuant to this “shelf” registration statement, the Company may sell debt or equity securities described in the accompanying prospectus in one or more offerings up to a total public offering price of $50,000,000. We believe that this shelf registration statement provides us additional flexibility with regards to potential financings that we may undertake when market conditions permit or our financial condition may require.
On October 14, 2009, we entered into a Common Stock Purchase Agreement with Seaside 88 LP, or Seaside, which provides that, upon the terms and subject to the conditions set forth therein, we are required to issue and sell, and Seaside to purchase, up to 650,000 shares of our common stock once every two weeks, subject to the satisfaction of customary closing conditions, beginning on October 15, 2009 and ending on or about the date that is 52 weeks subsequent to the initial closing, for an aggregate sale to Seaside of up to 16,900,000 shares of common stock. The price of the shares that we sell to Seaside will be at a 12% discount to the volume weighted average trading price of the common stock for the ten consecutive trading days immediately preceding each closing date, which will result in immediate and substantial dilution to current stock holders. As of March 31, 2010, we have sold 3,900,000 shares to Seaside pursuant to this arrangement for aggregate gross proceeds of $4.5 million before offering expenses and finder’s fee. In the third and fourth quarter of fiscal year 2010, our stock price closed below $1.00 in trading on numerous occasions. A condition of our share sale agreement with Seaside requires that our stock maintain a three day volume weighted average price above $1.00 in order for a share sale to occur. As a result, the sale of 3,900,000 shares was not consummated in six different closes between December 2009 and March 31, 2010.
On February 22, 2008, we entered into an At Market Issuance Sales Agreement with Wm. Smith & Co., as sales agent (the “Sales Agent”). Concurrent with entering into this At Market Issuance Sales Agreement, we provided notice of termination of the Controlled Equity Offering Sales Agreement dated April 13, 2006 that we previously entered into with Cantor Fitzgerald & Co.
In accordance with terms of the At Market Issuance Sales Agreement, we may issue and sell up to 10,000,000 shares of common stock in a series of transactions over time as we may direct through the Sales Agent. Sales of shares may be made in privately negotiated transactions and/or any other method permitted by law, including sales deemed to be an “at the market” offering as defined in Rule 415 under the Securities Act of 1933, which includes sales made directly on the NASDAQ Capital Market, the existing trading market for the Company’s common stock, or sales made to or through a market maker other than on an exchange. The Sales Agent will make all sales on a best efforts basis using commercially reasonable efforts consistent with its normal trading and sales practices, on mutually agreed terms between the Sales Agent and the Company. Unless the Company and the Sales Agent agree to a lesser amount with respect to certain persons or classes of persons, the compensation to the Sales Agent for sales of common stock sold pursuant to the Agreement will be 6.0% of the gross proceeds of the sales price per share.
32
Through March 31, 2010, we had sold 4,898,907 shares with gross proceeds of $16.3 million under the At Market Issuance Sales Agreement. As of the date of this Report, we have made no further decisions as to whether or when we may seek to make additional sales under the At Market Issuance Sales Agreement.
At March 31, 2010, the redemption obligation for our Series C-1 Convertible Preferred Stock and Series C-2 Convertible Preferred Stock, all of which is currently held by Berg & Berg, is $8.6 million, plus accrued dividends, which as of March 31, 2010 totaled approximately $0.8 million. The preferred shares are currently subject to redemption or conversion at the holder’s discretion. We do not have sufficient resources to effect this redemption; however, Berg & Berg has agreed that our failure to redeem the Series C-1 Convertible Preferred Stock and the Series C-2 Convertible Preferred Stock does not constitute a default under the certificate of designations for either the Series C-1 Convertible Preferred Stock or the Series C-2 Convertible Preferred Stock and has waived the accrual of any default interest applicable. Berg & Berg also has agreed to defer the payment of dividends on the Series C-1 Convertible Preferred Stock and Series C-2 Convertible Preferred Stock. According to our agreement with Berg & Berg, dividends will continue to accrue (without interest) on the Series C-1 Convertible Preferred Stock and the Series C-2 Convertible Preferred Stock according to the terms of the applicable certificates of designation; and such dividends are not payable until such time as the parties mutually agree, or upon redemption or conversion in accordance with the terms of the applicable certificates of designation. We have no present intention to pay dividends on this preferred stock, including the accrued dividends. The Series C-1 Convertible Preferred Stock may be converted, at any time, into shares of our common stock at the lower of $4.00 or the closing price of our common stock on the conversion date, provided the conversion price can be no lower than $1.98, the closing price of the common stock on December 13, 2005. The Series C-2 Convertible Preferred Stock may be converted, at any time, into shares of our common stock at the lower of $4.00 or the closing price of our common stock on the conversion date, provided the conversion price can be no lower than $2.96, the closing bid price of our common stock on July 13, 2005.
As a result of our limited cash resources and history of operating losses, our auditors have expressed in their report on our consolidated financial statements, included in our audited March 31, 2010 consolidated financial statements, that there is substantial doubt about our ability to continue as a going concern. Our cash requirements may vary materially from those now planned because of changes in our operations, including the failure to achieve expected revenues, greater than expected expenses, changes in OEM relationships, market conditions, the failure to timely realize our product development goals, and other adverse developments. These events could have a negative effect on our available liquidity sources. We intend to improve our liquidity by continued monitoring and reduction of manufacturing, facility and administrative costs. However, there can be no assurance that these efforts will be successful or that the anticipated benefits would be realized in the near term.
Related Party Transactions
On February 22, 2010, Berg & Berg purchased 1,086,957 shares of common stock for cash at a price per share of $0.92 for an aggregate purchase price of $1.0 million. The purchase price per share equaled the closing bid price of the Company’s common stock as of February 22, 2010.
On October 13, 2009, Berg & Berg agreed to further extend the maturity date for the loan principal and interest for the 1998 Loan and the 2001 Loan from September 30, 2010 to September 30, 2012.
On June 11, 2009, Berg & Berg purchased 1,256,281 shares of common stock for cash at a price per share of $1.99 for an aggregate purchase price of $2.5 million. The purchase price per share equaled the closing bid price of the Company’s common stock as of June 10, 2009.
On November 15, 2008, Berg & Berg purchased approximately 1.7 million shares of the Company’s common stock. As payment of the purchase price of the common stock, Berg & Berg surrendered certain promissory notes issued on July 23, 2008 and amended September 30, 2008 ($542,000 in principal and approximately $14,000 in accrued interest), and June 26, 2008 ($2.5 million in principal and approximately $78,000 in accrued interest). The surrendered promissory notes were the second and first working capital loan installments, respectively, made pursuant to an agreement between the Company and Berg & Berg whereby Berg & Berg agreed to provide up to $10.0 million in interim working capital loans from time to time in order to supplement the Company’s working capital and other financial needs. This agreement expired on November 15, 2008, and accordingly, all outstanding amounts were paid on November 15, 2008. No future draws can be taken against this loan.
On April 24, 2008, Berg & Berg, an affiliate of our Chairman, Carl Berg, exercised a warrant to purchase 600,000 shares of the Company’s common stock. The purchase price was $ 2.74 per share as set forth in the warrant. On July 13, 2005, we entered into an agreement with SFT I, Inc., providing for a $20 million loan to Valence. In exchange for entry into the Loan Agreement and the guaranty of the loan, SFT I, Inc. and Berg & Berg were each issued three year warrants to purchase 600,000 shares of our common stock, at $2.74 per share, the closing price of our common stock on July 12, 2005.
On February 21, 2008, Berg & Berg purchased 280,112 shares of the Company’s common stock for $1.0 million. The purchase price of $3.57 per share equaled the closing bid price of the Company’s common stock as of February 27, 2008.
33
Capital Commitments and Debt
At March 31, 2010, we had no commitments for capital expenditures relating to manufacturing equipment. We do not anticipate that we will be required to make additional capital expenditures in order to meet greater demand levels for our products than are currently anticipated and/or to support our transition of operations to China.
At March 31, 2010, our cash obligations for short-term and long-term debt principal and interest consisted of (in thousands):
|
March 31,
2010
|
||||
|
2005 short-term debt
|
$
|
20,000
|
||
|
Current portion of interest on short-term debt
|
79
|
|||
|
1998 long-term debt to stockholder
|
14,950
|
|||
|
2001 long-term debt to stockholder
|
20,000
|
|||
|
Long term portion of interest on debt
|
27,383
|
|||
|
Total
|
$
|
82,412
|
||
At March 31, 2010, our repayment obligations of short-term and long-term debt principal are (in thousands):
|
Fiscal Year ended March 31,
|
||||||||||||||||||||||||||||
|
2011
|
2012
|
2013
|
2014
|
2015
|
Thereafter
|
Total
|
||||||||||||||||||||||
|
Principal repayments
|
$ | 20,000 | $ | — | $ | 34,950 | $ | — | $ | — | $ | — | $ | 54,950 | ||||||||||||||
We have and will continue to have a significant amount of indebtedness and other obligations. As of March 31, 2010, we had approximately $82.4 million of total consolidated indebtedness, including accrued interest. Included in this amount are $35.0 million of loans outstanding, to an affiliate of Carl Berg, $27.4 million of accumulated interest associated with those loans and $20.0 million of principal and interest outstanding with a third party finance company. The loans to a third party mature in fiscal year 2011, beginning with monthly payments, starting in July 2010, of $1.0 million per month plus accrued interest, with a final payment of $13.0 million in principal and accrued interest due in February 2011.
The terms of the certificates of designation for the Series C-1 Convertible Preferred Stock and the Series C-2 Convertible Preferred Stock initially provided that the deadline for redemption was December 15, 2005. Pursuant to assignment agreements entered into between the Company and Berg & Berg, Berg & Berg waived the requirement that the Series C-1 Convertible Preferred Stock and Series C-2 Convertible Preferred Stock be redeemed on this date. There currently are no redemption deadlines. As set forth above, although dividends are not due, they are continuing to accrue, which was approximately $0.8 million as of March 31, 2010. The total below for redemption of convertible preferred stock includes accrued dividends.
If cash flow from operations is not adequate to meet debt obligations, additional debt or equity financing will be required. There can be no assurance that we could obtain the additional financing.
Contractual Obligations
At March 31, 2010, our contractual obligations and payments due by period are as follows (in thousands):
|
Payments Due by Period
|
||||||||||||||||||||
|
Total
|
Less than
1 year
|
1-3
Years
|
3-5
Years
|
More
than 5
Years
|
||||||||||||||||
|
Short-term debt obligations, net of discount
|
$ | 19,853 | $ | 19,853 | $ | — | $ | — | $ | — | ||||||||||
|
Long-term debt obligations, net of discount
|
34,848 | — | 34,848 | — | — | |||||||||||||||
|
Current and long-term interest payable
|
27,462 | 79 | 27,383 | — | — | |||||||||||||||
|
Operating lease obligations
|
1,291 | 526 | 571 | 194 | — | |||||||||||||||
|
Purchase obligations
|
8,282 | 8,282 | — | — | — | |||||||||||||||
|
Redemption of convertible preferred stock
|
8,610 | 8,610 | — | — | — | |||||||||||||||
|
Total
|
$ | 100,346 | $ | 37,350 | $ | 62,802 | $ | 194 | $ | — | ||||||||||
Lease Commitments
The Company has no capital leases.
34
Off-Balance Sheet Arrangements
The Company has no off-balance sheet arrangements.
Basis of Presentation, Critical Accounting Policies and Estimates
We prepare our consolidated financial statements in conformity with generally accepted accounting principles in the U.S. The preparation of our financial statements requires us to make estimates and assumptions that affect reported amounts. We believe our most critical accounting policies and estimates relate to revenue recognition, impairment of long-lived assets, inventory reserves, inventory overhead absorption, warranty liabilities, and share based compensation expense. Our accounting policies are described in the Note 3 of Notes To Consolidated Financial Statements. The following further describes the methods and assumptions we use in our critical accounting policies and estimates.
Revenue Recognition
The Company generates revenues from sales of products, including batteries and battery systems, and from licensing fees and royalties per technology license agreements. Product sales are recognized when all of the following criteria are met: persuasive evidence of an arrangement exists, delivery has occurred, seller’s price to the buyer is fixed and determinable, and collection is reasonably assured. Product shipments that are not recognized as revenue during the period shipped, primarily product shipments to resellers that are subject to right of return, or shipments where transfer of title does not occur until the customer has accepted the product, are recorded as deferred revenue and reflected as a liability on the balance sheet. Products shipped with the rights of return or with shipping terms requiring customer acceptance of the product are included in finished goods inventory as the Company retains title to the products. For reseller shipments where revenue recognition is deferred, the Company records revenue and relieves inventory based upon the reseller-supplied reporting of sales to their end customers or their inventory reporting. For shipments where the transfer of title does not occur until the customer accepts the goods, the Company relies upon third party shipper notifications and notices of acceptance from the customer to recognize revenue. For all shipments, the Company estimates a return rate percentage based upon historical experience. From time to time, the Company provides sales incentives in the form of rebates or other price adjustments; these are generally recorded as reductions to revenue on the latter of the date the related revenue is recognized or at the time the rebate or sales incentive is offered. Licensing fees are recognized as revenue upon completion of an executed agreement and delivery of licensed information, and if there are no significant remaining vendor obligations and collection of the related receivable is reasonably assured. Royalty revenues are recognized upon licensee revenue reporting and when collection is reasonably assured.
Impairment of Long-Lived Assets
We perform a review of long-lived tangible and intangible assets for impairment whenever events or changes in circumstances indicate that the carrying amount of an asset may not be recoverable. Recoverability of these assets is measured by comparison of their carrying amounts to future undiscounted cash flows that the assets are expected to generate. If long-lived assets are considered to be impaired, the impairment to be recognized equals the amount by which the carrying value of the assets exceeds its fair value and is recorded in the period the determination was made. See Note 4 of Notes To Consolidated Financial Statements, regarding impairment of tangible and intangible assets.
Recent Accounting Pronouncements
In December 2007, the Financial Accounting Standards Board (“FASB”) issued Accounting Standard Codification (“ASC”) No. 805, Business Combinations (“ASC 805”), previously referred to as Statement of Financial Accounting Standard (“SFAS”) 141 (revised 2007), Business Combinations. ASC 805 will significantly change current practices regarding business combinations. Among the more significant changes, ASC 805 expands the definition of a business and a business combination; requires the acquirer to recognize the assets acquired, liabilities assumed and noncontrolling interests (including goodwill), measured at fair value at the acquisition date; requires acquisition-related expenses and restructuring costs to be recognized separately from the business combination; and requires in-process research and development to be capitalized at fair value as an indefinite-lived intangible asset. ASC 805 is effective for financial statements issued for fiscal years beginning after December 15, 2008. The Company adopted the provisions of ASC 805 on April 1, 2009, and its adoption did not have a material effect on its consolidated financial statements.
In April 2008, the FASB issued ASC No. 350-30, previously referred to as SFAS 142-3, Determination of the Useful Life of Intangible Assets. ASC No. 350-30 amends the factors that should be considered in developing renewal or extension assumptions used to determine the useful life of a recognized intangible asset under ASC 350 Intangibles – Goodwill and Other. ASC No. 350-30 is effective for financial statements issued for fiscal years beginning after December 15, 2008, and interim periods within those fiscal years. Effective July 1, 2009, the Company adopted ASC No. 350-30, and its adoption did not have a material effect on its consolidated financial statements
In June 2009, the FASB issued ASC No. 105, Generally Accepted Accounting Principles (“GAAP”) (“ASC 105” or “FASB Codification”), previously referred to as SFAS No. 168, The FASB Accounting Standards Codification and the Hierarchy of Generally Accepted Accounting Principles - a replacement of FASB Statement No 162 (“SFAS 168”). The effective date for use of the FASB Codification is for interim and annual periods ending after September 15, 2009. Companies should account for the adoption of the guidance on a prospective basis. Effective July 1, 2009, the Company adopted the FASB Codification and its adoption did not have a material effect on its consolidated financial statements.
35
On June 12, 2009, the FASB issued ASC No. 810, Consolidation, previously referred to as SFAS 167, Amendments to FASB Interpretation No. 46(R), which significantly changes the consolidation model for variable interest entities. ASC No. 810 requires companies to qualitatively assess the determination of the primary beneficiary of a variable interest entity (“VIE”) based on whether the entity (1) has the power to direct matters that most significantly affect the activities of the VIE, and (2) has the obligation to absorb losses or the right to receive benefits of the VIE that could potentially be significant to the VIE. The standard shall be effective as of the beginning of each reporting entity’s first annual reporting period that begins after November 15, 2009, for interim periods within that first annual reporting period, and for interim and annual reporting periods thereafter. Earlier application is prohibited. The Company does not expect that the adoption of ASC No. 810 will have a material effect on its financial position or results of operations.
In August 2009, the FASB issued Accounting Standards Update (“ASU”) No. 2009-05, Measuring Liabilities at Fair Value (“ASU 2009-05”). ASU 2009-05 provides clarification that in circumstances in which a quoted price in an active market for the identical liability is not available, a reporting entity is required to measure fair value of such liability using one or more of the techniques prescribed by the update. ASU 2009-05 is effective for the first reporting period beginning after issuance. The Company adopted ASU 2009-05 as of September 30, 2009, and there was no change to its consolidated financial statements due to the implementation of this guidance.
In January, 2010, the FASB issued ASU No. 2010-06, Fair Value Measurements and Disclosures (Topic 820): Improving Disclosures about Fair Value Measurements (“ASU 2010-06”). Reporting entities will have to provide information about movements of assets among Levels 1 and 2; and a reconciliation of purchases, sales, issuance, and settlements of activity valued with a Level 3 method, of the three-tier fair value hierarchy established by SFAS No. 157, Fair Value Measurements (ASC 820). The ASU 2010-06 also clarifies the existing guidance to require fair value measurement disclosures for each class of assets and liabilities. ASU 2010-06 is effective for interim and annual reporting periods beginning after December 15, 2009 for Level 1 and 2 disclosure requirements and after December 15, 2010 for Level 3 disclosure requirements. The Company adopted ASU No.2010-06 in its fiscal quarter ending March 31, 2010. and it did not have a material effect on its consolidated financial statements.
Risk Factors
See Item 1A of this Report.
We considered the provisions of Financial Reporting Release No. 48, “Disclosures of Accounting Policies for Derivative Financial Instruments and Derivative Commodity Instruments, and Disclosures of Quantitative and Qualitative Information about Market Risk Inherent in Derivative Commodity Instruments.”
We are exposed to financial market risks, including changes in foreign currency exchange rates and interest rates.
Foreign Currency Exchange Risk. As a result of our foreign operations, we have significant expenses, assets and liabilities that are denominated in foreign currencies. A significant number of our employees are located in Asia. Therefore, a substantial portion of our payroll as well as certain other operating expenses are paid in the China RMB. Additionally, we purchase materials and components from suppliers in Asia. While we pay many of these suppliers in U.S. dollars, their costs are typically based upon the local currency of the country in which they operate. The majority of our revenues are received in U.S. dollars.
As a consequence, our gross profit, operating results, profitability and cash flows are adversely impacted when the dollar depreciates relative to other foreign currencies. We have a particularly significant currency rate exposure to changes in the exchange rate between the RMB to the U.S. dollar. For example, to the extent that we need to convert U.S. dollars for our operations, appreciation of the RMB against the U.S. dollar would have an adverse effect on the amount we receive from the conversion.
We have not used any forward contracts, currency borrowings or derivative financial instruments for purposes of reducing our exposure to adverse fluctuations in foreign currency exchange rates.
Interest Rate Sensitivity. Our exposure to interest rate risk primarily relates to a $20.0 million loan agreement we entered into on July 13, 2005, with a third party finance company with an adjustable interest rate equal to the greater of 6.75% or the sum of the LIBOR rate plus 4.0% (6.75% at March 31, 2010).
36
The following table presents the principal cash flows by year of maturity for our total debt obligations held at March 31, 2010 (in thousands):
|
Expected Maturity Date
|
||||||||||||||||||||||||||||
|
2011
|
2012
|
2013
|
2014
|
2015
|
Thereafter
|
Total
|
||||||||||||||||||||||
|
Fixed rate debt
|
$ | — | $ | — | $ | 20,000 | $ | — | $ | — | $ | — | $ | 20,000 | ||||||||||||||
|
Variable rate debt
|
$ | 20,000 | $ | — | $ | 14,950 | $ | — | $ | — | $ | — | $ | 34,950 | ||||||||||||||
Based on borrowing rates currently available to use for loans with similar terms, the carrying value of our debt obligations approximates fair value.
37
VALENCE TECHNOLOGY, INC. AND SUBSIDIARIES
INDEX TO CONSOLIDATED FINANCIAL STATEMENTS
|
Page
|
|
|
Report of Independent Registered Public Accounting Firm
|
F-1
|
|
Consolidated Balance Sheets as of March 31, 2010 and 2009
|
F-2
|
|
Consolidated Statements of Operations and Comprehensive Loss for the years ended March 31, 2010, 2009, and 2008
|
F-3
|
|
Consolidated Statements of Stockholders’ Deficit for the years ended March 31, 2010, 2009, and 2008
|
F-4
|
|
Consolidated Statements of Cash Flows for the years ended March 31, 2010, 2009, and 2008
|
F-5
|
|
Notes to Consolidated Financial Statements
|
F-6
|
38
To the Board of Directors and Shareholders of Valence Technology, Inc. and Subsidiaries
We have audited the accompanying consolidated balance sheets of Valence Technology, Inc., and subsidiaries (the “Company”) as of March 31, 2010, and 2009, and the related consolidated statements of operations and comprehensive loss, stockholders’ deficit, and cash flows for the fiscal years then ended. These consolidated financial statements are the responsibility of the Company’s management. Our responsibility is to express an opinion on these consolidated financial statements based on our audit.
We conducted our audits in accordance with the standards of the Public Company Accounting Oversight Board (United States). Those standards require that we plan and perform the audit to obtain reasonable assurance about whether the consolidated financial statements are free of material misstatement. An audit includes examining, on a test basis, evidence supporting the amounts and disclosures in the consolidated financial statements. An audit also includes assessing the accounting principles used and significant estimates made by management, as well as evaluating the overall financial statement presentation. We believe that our audits provide a reasonable basis for our opinion.
In our opinion, such consolidated financial statements present fairly, in all material respects, the financial position of the Company as of March 31, 2010, 2009, and 2008, and the results of their operations and comprehensive loss and their cash flows for the fiscal years then ended, in conformity with accounting principles generally accepted in the United States of America.
The accompanying consolidated financial statements have been prepared assuming that the Company will continue as a going concern. As discussed in Note 2 of Notes To Consolidated Financial Statements, the Company’s recurring losses from operations, negative cash flows from operations and net stockholders’ capital deficiency raise substantial doubt about its ability to continue as a going concern. Management’s plans concerning these matters are also described in Note 2. The consolidated financial statements do not include any adjustments that might result from the outcome of this uncertainty.
We also have audited, in accordance with the standards of the Public Company Accounting Oversight Board (United States), the Company’s internal control over financial reporting as of March 31, 2010, based on criteria established in Internal Control — Integrated Framework issued by the Committee of Sponsoring Organizations of the Treadway Commission (COSO) and our report dated June 14, 2010 expressed an unqualified opinion on the effectiveness of the Company’s internal control over financial reporting.
PMB HELIN DONOVAN, LLP
Austin, Texas
June 14, 2010
F-1
VALENCE TECHNOLOGY, INC. AND SUBSIDIARIES
CONSOLIDATED BALANCE SHEETS
(AMOUNTS IN THOUSANDS EXCEPT FOR SHARE AMOUNTS)
|
March 31,
|
||||||||
|
2010
|
2009
|
|||||||
|
Assets
|
||||||||
|
Current assets:
|
||||||||
|
Cash and cash equivalents
|
$ | 3,172 | $ | 4,009 | ||||
|
Trade receivables, net of allowance of $43 and $191, respectively
|
2,919 | 3,592 | ||||||
|
Inventory, net
|
5,597 | 10,736 | ||||||
|
Shareholder receivable
|
— | 1,062 | ||||||
|
Prepaid and other current assets
|
4,413 | 3,946 | ||||||
|
Total current assets
|
16,101 | 23,345 | ||||||
|
Property, plant and equipment, net
|
4,931 | 6,291 | ||||||
|
Total assets
|
$ | 21,032 | $ | 29,636 | ||||
|
Liabilities, Preferred Stock and Stockholders’ Deficit
|
||||||||
|
Current liabilities:
|
||||||||
|
Accounts payable
|
$ | 1,815 | $ | 1,822 | ||||
|
Accrued expenses
|
7,422 | 7,279 | ||||||
|
Short-term debt, net of debt discount
|
19,853 | — | ||||||
|
Deferred revenue
|
87 | 355 | ||||||
|
Total current liabilities
|
29,177 | 9,456 | ||||||
|
Long-term interest payable to stockholder
|
27,383 | 24,415 | ||||||
|
Long-term debt, net of debt discount
|
— | 19,445 | ||||||
|
Long-term debt to stockholder, net of debt discount
|
34,848 | 34,766 | ||||||
|
Other long-term liabilities
|
129 | 129 | ||||||
|
Commitments and contingencies
|
||||||||
|
Preferred Stock
|
||||||||
|
Redeemable convertible preferred stock, $0.001 par value, 10,000,000 shares authorized,
861 issued and outstanding at March 31, 2010 and 2009, liquidation value $8,610
|
8,610 | 8,610 | ||||||
|
Stockholders’ deficit:
|
||||||||
|
Common stock, $0.001 par value, 200,000,000 shares authorized, 131,972,224 shares issued
and 130,169,080 shares outstanding, respectively, as of March 31, 2010, and 125,042,793
shares issued and 123,239,649 outstanding, respectively, as of March 31, 2009
|
132 | 125 | ||||||
|
Additional paid-in capital
|
509,909 | 498,646 | ||||||
|
Treasury shares, 1,803,144 at cost
|
(5,164 | ) | (5,164 | ) | ||||
|
Accumulated deficit
|
(580,845 | ) | (557,657 | ) | ||||
|
Accumulated other comprehensive loss
|
(3,147 | ) | (3,135 | ) | ||||
|
Total stockholders’ deficit
|
(79,115 | ) | (67,185 | ) | ||||
|
Total liabilities, preferred stock, and stockholders’ deficit
|
$ | 21,032 | $ | 29,636 | ||||
The accompanying notes are an integral part of these consolidated financial statements.
F-2
VALENCE TECHNOLOGY, INC. AND SUBSIDIARIES
CONSOLIDATED STATEMENTS OF OPERATIONS AND COMPREHENSIVE LOSS
(AMOUNTS IN THOUSANDS EXCEPT FOR PER SHARE AMOUNTS)
|
Year ended March 31,
|
||||||||||||
|
2010
|
2009
|
2008
|
||||||||||
|
Revenue:
|
||||||||||||
|
Battery and system sales
|
$ | 15,751 | $ | 24,814 | $ | 20,191 | ||||||
|
Licensing and royalty revenue
|
329 | 1,343 | 586 | |||||||||
|
Total revenues
|
16,080 | 26,157 | 20,777 | |||||||||
|
Cost of sales
|
14,093 | 25,682 | 18,956 | |||||||||
|
Gross margin
|
1,987 | 475 | 1,821 | |||||||||
|
Operating expenses:
|
||||||||||||
|
Research and product development
|
4,464 | 4,333 | 3,772 | |||||||||
|
Marketing
|
2,614 | 2,922 | 2,447 | |||||||||
|
General and administrative
|
12,418 | 9,072 | 9,784 | |||||||||
|
Loss on disposal of assets
|
— | 137 | 16 | |||||||||
|
Asset impairment charge
|
301 | 731 | 154 | |||||||||
|
Total operating expenses
|
19,797 | 17,195 | 16,172 | |||||||||
|
Operating loss
|
(17,810 | ) | (16,720 | ) | (14,351 | ) | ||||||
|
Foreign exchange gain
|
44 | 605 | 1,258 | |||||||||
|
Interest and other income
|
30 | 82 | 56 | |||||||||
|
Interest and other expense
|
(4,980 | ) | (5,193 | ) | (6,403 | ) | ||||||
|
Casualty loss
|
(300 | ) | — | — | ||||||||
|
Net loss
|
(23,016 | ) | (21,226 | ) | (19,440 | ) | ||||||
|
Dividends on preferred stock
|
172 | 172 | 173 | |||||||||
|
Net loss available to common stockholders, basic and diluted
|
$ | (23,188 | ) | $ | (21,398 | ) | $ | (19,613 | ) | |||
|
Other comprehensive loss:
|
||||||||||||
|
Net loss
|
$ | (23,016 | ) | $ | (21,226 | ) | $ | (19,440 | ) | |||
|
Change in foreign currency translation adjustments
|
(12 | ) | 532 | 156 | ||||||||
|
Comprehensive loss
|
$ | (23,028 | ) | $ | (20,694 | ) | $ | (19,284 | ) | |||
|
Net loss per share available to common stockholders, basic and diluted
|
$ | (0.18 | ) | $ | (0.18 | ) | (0.18 | ) | ||||
|
Shares used in computing net loss per share available to common stockholders, basic and diluted
|
126,211 | 119,370 | 111,593 | |||||||||
The accompanying notes are an integral part of these consolidated financial statements.
F-3
VALENCE TECHNOLOGY, INC. AND SUBSIDIARIES
CONSOLIDATED STATEMENTS OF STOCKHOLDERS’ DEFICIT
(IN THOUSANDS)
|
Common Stock
|
Treasury Stock
|
Additional
|
Notes
Receivable
|
Accumulated
|
Total
|
|||||||||||||||||||||||||||||||
|
Number
of Shares
|
Amount
|
Number
of Shares
|
Amount
|
Paid-In
Capital
|
from
Stockholder
|
Accumulated
Deficit
|
Comprehensive
Loss
|
Stockholders’
Deficit
|
||||||||||||||||||||||||||||
|
Balance at March 31, 2007
|
106,199 | $ | 106 | — | $ | — | $ | 457,611 | $ | (5,164 | ) | $ | (516,647 | ) | $ | (3,824 | ) | $ | (67,918 | ) | ||||||||||||||||
|
Sale of stock to private investors
|
4,029 | 4 | 8,243 | 8,247 | ||||||||||||||||||||||||||||||||
|
Sale of stock to related party
|
7,014 | 7 | — | — | 8,992 | — | — | — | 8,999 | |||||||||||||||||||||||||||
|
Cancellation of notes payable from stockholder in exchange for common shares
|
— | — | 1,803 | (5,164 | ) | — | 5,164 | — | — | — | ||||||||||||||||||||||||||
|
Exercise of stock options
|
197 | — | — | — | 463 | — | — | — | 463 | |||||||||||||||||||||||||||
|
Dividends on preferred stock
|
— | — | — | — | — | — | (173 | ) | — | (173 | ) | |||||||||||||||||||||||||
|
Share based compensation
|
— | — | — | — | 2,348 | — | — | — | 2,348 | |||||||||||||||||||||||||||
|
Net loss
|
— | — | — | — | — | — | (19,440 | ) | — | (19,440 | ) | |||||||||||||||||||||||||
|
Change in translation adjustment
|
— | — | — | — | — | — | — | 157 | 157 | ) | ||||||||||||||||||||||||||
|
Balance at March 31, 2008
|
117,439 | $ | 117 | 1,803 | $ | (5,164 | ) | $ | 477,657 | $ | — | $ | (536,260 | ) | $ | (3,667 | ) | $ | (67,317 | ) | ||||||||||||||||
|
Sale of stock to private investors
|
3,260 | 3 | 10,173 | 10,176 | ||||||||||||||||||||||||||||||||
|
Cancellation of debt as consideration for common stock warrants exercise
|
1,667 | 2 | — | — | 3,132 | — | — | — | 3,134 | |||||||||||||||||||||||||||
|
Exercise of stock options
|
444 | 1 | 905 | — | — | 906 | ||||||||||||||||||||||||||||||
|
Exercise of warrants
|
2,233 | 2 | — | — | 6,142 | — | — | — | 6,144 | |||||||||||||||||||||||||||
|
Dividends on preferred stock
|
— | — | — | — | — | — | (171 | ) | — | (171 | ) | |||||||||||||||||||||||||
|
Share based compensation
|
— | — | — | — | 637 | — | — | — | 637 | |||||||||||||||||||||||||||
|
Net loss
|
— | — | — | — | — | — | (21,226 | ) | — | (21,226 | ) | |||||||||||||||||||||||||
|
Change in translation adjustment
|
— | — | — | — | — | — | — | 532 | 532 | |||||||||||||||||||||||||||
|
Balance at March 31, 2009
|
125,043 | $ | 125 | 1,803 | $ | (5,164 | ) | $ | 498,646 | $ | — | $ | (557,657 | ) | $ | (3,135 | ) | $ | (67,185 | ) | ||||||||||||||||
|
Sale of stock to private investors
|
4,511 | 4 | — | — | 5,376 | — | — | — | 5,381 | |||||||||||||||||||||||||||
|
Sale of stock to a related party
|
2,342 | 2 | — | — | 3,498 | — | — | — | 3,500 | |||||||||||||||||||||||||||
|
Exercise of stock options
|
76 | 1 | — | — | 132 | — | — | — | 133 | |||||||||||||||||||||||||||
|
Dividends on preferred stock
|
— | — | — | — | — | — | (172 | ) | — | (172 | ) | |||||||||||||||||||||||||
|
Share based compensation
|
— | — | — | — | 2,184 | — | — | — | 2,184 | |||||||||||||||||||||||||||
|
Issuance of warrants
|
— | — | — | — | 73 | — | — | — | 73 | |||||||||||||||||||||||||||
|
Net loss
|
— | — | — | — | — | — | (23,016 | ) | — | (23,016 | ) | |||||||||||||||||||||||||
|
Change in translation adjustment
|
— | — | — | — | — | — | — | (12 | ) | (12 | ) | |||||||||||||||||||||||||
|
Balance at March 31, 2010
|
131,972
|
$
|
132
|
1,803
|
$
|
(5,164
|
)
|
$
|
509,909
|
$
|
$ |
(580,845
|
)
|
$ |
(3,147
|
) | $ |
(79,115
|
) | |||||||||||||||||
The accompanying notes are an integral part of these consolidated financial statements.
F-4
VALENCE TECHNOLOGY, INC. AND SUBSIDIARIES
CONSOLIDATED STATEMENTS OF CASH FLOWS
(IN THOUSANDS)
|
Year ended March 31,
|
||||||||||||
|
2010
|
2009
|
2008
|
||||||||||
|
Cash flows from operating activities:
|
||||||||||||
|
Net loss
|
$ | (23,016 | ) | $ | (21,226 | ) | $ | (19,440 | ) | |||
|
Adjustments to reconcile net loss to net cash used in operating activities:
|
||||||||||||
|
Depreciation and amortization
|
1,155 | 1,625 | 616 | |||||||||
|
Gain (loss) on disposal of assets
|
— | 137 | 16 | |||||||||
|
Bad debt expense (recoveries)
|
4 | 93 | (47 | ) | ||||||||
|
Accretion of debt discount and other
|
3,457 | 3,564 | 4,150 | |||||||||
|
Asset impairment charge
|
301 | 731 | 154 | |||||||||
|
Casualty loss
|
300 | — | — | |||||||||
|
Contract settlement charge, other
|
— | — | 24 | |||||||||
|
Share based compensation
|
2,185 | 637 | 2,348 | |||||||||
|
Reserve for obsolete inventory
|
908 | — | (2,392 | ) | ||||||||
|
Changes in operating assets and liabilities:
|
||||||||||||
|
Trade receivables
|
673 | 3,511 | (3,206 | ) | ||||||||
|
Inventory
|
3,596 | (1,484 | ) | (1,404 | ) | |||||||
|
Prepaid and other current assets
|
596 | (1,575 | ) | (1,296 | ) | |||||||
|
Accounts payable
|
(8 | ) | (2,350 | ) | 1,311 | |||||||
|
Accrued expenses and long-term interest
|
427 | 1,315 | 1,458 | |||||||||
|
Deferred revenue
|
(269 | ) | (401 | ) | 240 | |||||||
|
Net cash used in operating activities
|
(9,691 | ) | (15,423 | ) | (14,660 | ) | ||||||
|
Cash flows from investing activities:
|
||||||||||||
|
Purchases of property, plant, and equipment
|
(231 | ) | (3,607 | ) | (1,802 | ) | ||||||
|
Proceeds from disposal of property, plant, and equipment
|
— | 52 | 174 | |||||||||
|
Net cash used in investing activities
|
(231 | ) | (3,555 | ) | (1,628 | ) | ||||||
|
Cash flows from financing activities:
|
||||||||||||
|
Proceeds from convertible notes payable to stockholder
|
— | 4,502 | — | |||||||||
|
Proceeds from stock option exercises
|
132 | 906 | 463 | |||||||||
|
Proceeds from issuance of common stock & warrants, net of issuance costs
|
8,954 | 14,951 | 17,246 | |||||||||
|
Net cash provided by financing activities
|
9,086 | 20,359 | 17,709 | |||||||||
|
Effect of foreign exchange rates on cash and cash equivalents
|
(1 | ) | 12 | (27 | ) | |||||||
|
(Decrease) increase in cash and cash equivalents
|
(837 | ) | 1,393 | 1,448 | ||||||||
|
Cash and cash equivalents, beginning of year
|
4,009 | 2,616 | 1,168 | |||||||||
|
Cash and cash equivalents, end of year
|
$ | 3,172 | $ | 4,009 | $ | 2,616 | ||||||
|
Supplemental information:
|
||||||||||||
|
Interest paid
|
$ | 1,377 | $ | 1,519 | $ | 1,841 | ||||||
|
Cancellation of debt from stockholder in exchange for common shares
|
$ | — | $ | 4,502 | $ | — | ||||||
The accompanying notes are an integral part of these consolidated financial statements.
F-5
VALENCE TECHNOLOGY, INC. AND SUBSIDIARIES
1. BUSINESS AND BUSINESS STRATEGY:
Valence Technology, Inc. and subsidiaries (“the Company”), was founded in 1989 and has commercialized the industry’s first lithium phosphate technology. We develop, manufacture and sell high-energy power systems utilizing our proprietary phosphate-based lithium-ion technology for diverse applications, with special emphasis on portable appliances and future generations of hybrid and electric vehicles. Our mission is to promote the wide adoption of high-performance, safe, long cycle life, environmentally friendly, low-cost energy storage systems. To accomplish our mission and address the significant market opportunity we believe is available to us we utilize the numerous benefits of our latest energy storage technology, deep intellectual property portfolio and extensive experience of our management team.
In the fourth quarter of fiscal year 2010 we introduced a Revision 2 to our U-Charge® Lithium Phosphate Energy Storage Systems Our U-Charge® systems feature our safe, long-life lithium phosphate technology which utilizes a phosphate-based cathode material. We believe that the improved features and functionality of the latest U-Charge® lithium phosphate energy storage systems are well suited for electric vehicle (EV), plug-in hybrid electric vehicle (PHEV) and similar applications. U-Charge® lithium phosphate energy storage systems address the safety and limited life weaknesses of other lithium technologies while offering a solution that is competitive in cost and performance. This Revision 2 of our U-Charge® system builds upon these features and adds improvements in state of charge monitoring, cell and pack balancing, battery monitoring and diagnostics, and certain field repairability.
The Company’s business plan and strategy focus on the generation of revenue from product sales, while minimizing costs through partnerships with contract manufacturers and internal manufacturing efforts through the Company’s two wholly-owned subsidiaries in China. These subsidiaries initiated operations in late fiscal 2005. We expect to develop target markets through the sales of our Revision 2 U- Charge® system lithium phosphate energy storage systems and custom lithium phosphate energy storage systems based on programmable Command and Control Logic. In addition, we expect to pursue a licensing strategy to supply the lithium phosphate sector with advanced Valence material and components, including lithium phosphate cathode materials to fulfill other manufacturers’ needs.
2. GOING CONCERN AND LIQUIDITY AND CAPITAL RESOURCES:
GOING CONCERN:
The accompanying consolidated financial statements have been prepared assuming that the Company will continue as a going concern, which contemplates the realization of assets and satisfaction of liabilities in the normal course of business. The Company has incurred operating losses each year since its inception in 1989 and had an accumulated deficit of $581 million as of March 31, 2010. For the years ended March 31, 2010, 2009, and 2008 the Company sustained net losses available to common stockholders of $23.2 million, $21.4 million, and $19.6 million, respectively. These factors, among others, indicate that the Company may be unable to continue as a going concern for a reasonable period of time. The Company’s ability to continue as a going concern is contingent upon its ability to meet its liquidity requirements. If the Company is unable to arrange for debt or equity financing on favorable terms or at all the Company’s ability to continue as a going concern is uncertain. These financial statements do not give effect to any adjustments to the amounts and classifications of assets and liabilities which might be necessary should the Company be unable to continue as a going concern.
LIQUIDITY AND CAPITAL RESOURCES:
At March 31, 2010, the Company’s principal sources of liquidity were cash and cash equivalents of $3.2 million. The Company does not expect that its cash and cash equivalents will be sufficient to fund its operating and capital needs for the next twelve months following March 31, 2010, nor does the Company anticipate product sales during fiscal year 2010 will be sufficient to cover its operating expenses. Historically, the Company has relied upon management’s ability to periodically arrange for additional equity or debt financing to meet the Company’s liquidity requirements.
Unless the Company’s product sales are greater than management currently forecasts or there are other changes to the Company’s business plan, the Company will need to arrange for additional financing within the next three to six months to fund operating and capital needs. This financing could take the form of debt or equity. Given the Company’s historical operating results and the amount of existing debt, as well as the other factors, the Company may not be able to arrange for debt or equity financing from third parties on favorable terms or at all.
The Company’s cash requirements may vary materially from those now planned because of changes in the Company’s operations including the failure to achieve expected revenues, greater than expected expenses, changes in OEM relationships, market conditions, the failure to timely realize the Company’s product development goals, and other adverse developments. These events could have a negative effect on the Company’s available liquidity sources during the next 12 months.
F-6
VALENCE TECHNOLOGY, INC. AND SUBSIDIARIES
NOTES TO CONSOLIDATED FINANCIAL STATEMENTS
3. SUMMARY OF SIGNIFICANT ACCOUNTING POLICIES:
USE OF ESTIMATES:
The preparation of financial statements in conformity with accounting principles generally accepted in the U.S. requires management to make estimates and assumptions that affect the reported amounts of assets and liabilities and the disclosure of contingent assets and liabilities at the date of the financial statements, as well as the revenues and expenses for the period. The Company has made significant estimates in determining the amount of inventory reserves and inventory overhead absorption as discussed in Note 5, of Notes To The Consolidated Financial Statements, warranty liabilities as discussed in Note 12 of Notes To The Consolidated Financial Statements, and share based compensation as discussed in Note 14 of Notes To The Consolidated Financial Statements. Actual results could differ from those estimates.
PRINCIPLES OF CONSOLIDATION:
The consolidated financial statements include the accounts of the Company and its wholly-owned subsidiaries. The Company has the following subsidiaries:
Valence Technology (Nevada), Inc., Valence Technology Cayman Islands Inc., Valence Technology N.V., Valence Technology International, Inc., Valence Technology B.V., Valence Technology (Suzhou) Co., Ltd., and Valence Energy-Tech (Suzhou) Co., Ltd.
Intercompany balances and transactions are eliminated upon consolidation.
RECLASSIFICATIONS:
Where appropriate, the prior years’ financial statements have been reclassified to conform to current year presentation.
CASH AND CASH EQUIVALENTS:
The Company considers all highly liquid investments purchased with an original maturity of three months or less to be cash equivalents.
INVENTORY:
Inventory is stated at the lower of cost (determined using the first-in, first-out method) or market.
CONCENTRATION OF CREDIT RISK:
Financial instruments that potentially subject the Company to concentrations of credit risk are primarily accounts receivable and cash and cash equivalents. The Company provides an allowance for doubtful accounts based upon the expected ability to collect accounts receivable. Credit losses to date have been within the Company’s estimates.
Cash and cash equivalents are invested in deposits with a major financial institution. The Company has not experienced any losses on its deposits of cash and cash equivalents. Management believes that the financial institution is financially sound and, accordingly, minimal credit risk exists.
FAIR VALUE OF FINANCIAL INSTRUMENTS:
Financial instruments that potentially subject the Company to an interest and credit risk consist of cash and cash equivalents, trade receivables, accounts payable and accrued expenses, the carrying values of which are a reasonable estimate of their fair values due to their short maturities. Based upon borrowing rates currently available to the Company for loans with similar terms, the carrying value of its debt obligations approximates fair value.
PROPERTY, PLANT AND EQUIPMENT:
Property and equipment are stated at cost and depreciated using the straight-line method over their estimated useful lives, generally three to five years. Leasehold improvements are amortized over the lesser of their estimated useful life or the remaining lease term.
Expenditures for renewals and betterments are capitalized; repairs and maintenance are charged to expense as incurred. The cost and accumulated depreciation of assets sold or otherwise disposed of are removed from the accounts and any gain or loss thereon is reflected in operations.
F-7
VALENCE TECHNOLOGY, INC. AND SUBSIDIARIES
NOTES TO CONSOLIDATED FINANCIAL STATEMENTS
INTELLECTUAL PROPERTY:
Intellectual property consists of acquired patents and capitalized patent costs, and is recorded at cost based on the market value of the common stock used in their acquisition. The costs are amortized over the estimated remaining life of the patents.
IMPAIRMENT OF LONG-LIVED ASSETS:
The Company performs a review of long-lived tangible and intangible assets for impairment whenever events or changes in circumstances indicate that the carrying amount of an asset may not be recoverable. Recoverability of these assets is measured by comparison of their carrying amounts to future undiscounted cash flows that the assets are expected to generate. If long-lived assets are considered to be impaired, the impairment to be recognized equals the amount by which the carrying value of the assets exceeds its fair value and is recorded in the period the determination was made.
COMMON STOCK:
Common stock refers to the $0.001 par value capital stock as designated in the company’s Certificate of Incorporation. Treasury stock is accounted for using the cost method. When treasury stock is issued, the value is computed and recorded using a weighted-average basis.
REVENUE RECOGNITION:
The Company generates revenues from sales of products, including batteries and battery systems, and from licensing fees and royalties per technology license agreements. Product sales are recognized when all of the following criteria are met: persuasive evidence of an arrangement exists, delivery has occurred, seller’s price to the buyer is fixed and determinable, and collection is reasonably assured. Product shipments that are not recognized as revenue during the period shipped, primarily product shipments to resellers that are subject to right of return, or shipments where transfer of title does not occur until the customer has accepted the product, are recorded as deferred revenue and reflected as a liability on the balance sheet. Products shipped with the rights of return or with shipping terms requiring customer acceptance of the product are included in finished goods inventory as the Company retains title to the products. For reseller shipments where revenue recognition is deferred, the Company records revenue and relieves inventory based upon the reseller-supplied reporting of sales to their end customers or their inventory reporting. For shipments where the transfer of title does not occur until the customer accepts the goods, the Company relies upon third party shipper notifications and notices of acceptance from the customer to recognize revenue. For all shipments, the Company estimates a return rate percentage based upon historical experience. From time to time, the Company provides sales incentives in the form of rebates or other price adjustments; these are generally recorded as reductions to revenue on the latter of the date the related revenue is recognized or at the time the rebate or sales incentive is offered. Licensing fees are recognized as revenue upon completion of an executed agreement and delivery of licensed information, and if there are no significant remaining vendor obligations and collection of the related receivable is reasonably assured. Royalty revenues are recognized upon licensee revenue reporting and when collection is reasonably assured.
RESEARCH AND DEVELOPMENT:
Research and development costs are expensed as incurred.
WARRANTY:
The Company records warranty liabilities at the time of sale for the estimated costs that may be incurred under its basic limited warranty. The warranty terms and conditions generally provide for replacement of defective products. Factors that affect the Company’s warranty liability include the number of units currently under warranty, historical and anticipated rates of warranty claims on those units, and cost per claim to satisfy the Company’s warranty obligation. Each quarter, the Company re-evaluates its estimates to assess the adequacy of its recorded warranty liabilities and adjusts the amounts as necessary.
SHIPPING AND HANDLING COSTS:
The Company recognizes as revenue amounts billed to customers related to shipping and handling with related expenses recorded as a component of cost of sales.
ADVERTISING COSTS:
Advertising costs are charged to expense as incurred. Advertising expenses for fiscal years 2010, 2009 and 2008 were less than $0.1 million.
FOREIGN CURRENCY:
The assets and liabilities of the Company’s foreign subsidiaries have been translated to U.S. dollars using the exchange rate in effect at the balance sheet date. Results of operations and cash flows have been translated using the average exchange rate during the year. Resulting translation adjustments have been recorded as a separate component of stockholders’ deficit as accumulated other comprehensive loss. Foreign currency transaction gains and losses are included in the consolidated statement of operations as they occur.
F-8
VALENCE TECHNOLOGY, INC. AND SUBSIDIARIES
NOTES TO CONSOLIDATED FINANCIAL STATEMENTS
STOCK-BASED COMPENSATION:
The Company measures stock-based compensation expense for all share-based awards granted based on the estimated fair value of those awards at grant-date. The fair values of stock option awards are estimated using a Black-Scholes valuation model. The compensation costs are recognized net of any estimated forfeitures on a straight-line basis over the employee requisite service period. Forfeiture rates are estimated at grant date based on historical experience and adjusted in subsequent periods for any differences in actual forfeitures from those estimates. See Note 14 of Notes To Consolidated Financial Statements included for further discussion of stock-based compensation.
COMPREHENSIVE INCOME/LOSS:
Comprehensive income/loss is the change in stockholder’s deficit from foreign currency translation gains and losses.
INCOME TAXES:
The Company utilizes the asset and liability method to account for income taxes where deferred tax assets or liabilities are determined based on the differences between the financial reporting and tax reporting bases of assets and liabilities using enacted tax rates in effect for the year in which the differences are expected to affect taxable income. Valuation allowances are established when necessary to reduce deferred tax assets to the amounts expected to be realized.
NET LOSS PER SHARE:
Net loss per share is computed by dividing the net loss by the weighted average shares of common stock outstanding during the periods. The dilutive effect of the options and warrants to purchase common stock are excluded from the computation of diluted net loss per share, since their effect is antidilutive. The antidilutive instruments excluded from the diluted net loss per share computation were as follows at:
|
March 31,
|
||||||||||||
|
2010
|
2009
|
2008
|
||||||||||
|
Shares reserved for conversion of Series C-1 Convertible Preferred
Stock and Series C-2 Convertible Preferred Stock
|
3,628,634 | 3,628,634 | 3,628,634 | |||||||||
|
Common stock options
|
8,188,952 | 7,087,395 | 7,777,761 | |||||||||
|
Warrants to purchase common stock
|
115,000 | — | 2,955,643 | |||||||||
|
Total
|
11,932,586 | 10,716,029 | 14,362,038 | |||||||||
The number of shares listed above as reserved for conversion of Series C-1 Convertible Preferred Stock and Series C-2 Convertible Preferred Stock do not include shares related to accrued dividends that are convertible at the election of the Company, subject to certain limitations. At March 31, 2010, up to approximately $0.8 million in accrued dividends would be convertible into up to 911,925 shares of common stock based on the closing sales price of $0.85 on March 31, 2010.
RECENT ACCOUNTING PRONOUNCEMENTS:
In December 2007, the Financial Accounting Standards Board (“FASB”) issued Accounting Standard Codification (“ASC”) No. 805, Business Combinations (“ASC 805”), previously referred to as Statement of Financial Accounting Standard (“SFAS”) 141 (revised 2007), Business Combinations. ASC 805 will significantly change current practices regarding business combinations. Among the more significant changes, ASC 805 expands the definition of a business and a business combination; requires the acquirer to recognize the assets acquired, liabilities assumed and noncontrolling interests (including goodwill), measured at fair value at the acquisition date; requires acquisition-related expenses and restructuring costs to be recognized separately from the business combination; and requires in-process research and development to be capitalized at fair value as an indefinite-lived intangible asset. ASC 805 is effective for financial statements issued for fiscal years beginning after December 15, 2008. The Company adopted the provisions of ASC 805 on April 1, 2009, and its adoption did not have a material effect on its consolidated financial statements.
In April 2008, the FASB issued ASC No. 350-30, previously referred to as SFAS 142-3, Determination of the Useful Life of Intangible Assets. ASC No. 350-30 amends the factors that should be considered in developing renewal or extension assumptions used to determine the useful life of a recognized intangible asset under ASC 350 Intangibles – Goodwill and Other. ASC No. 350-30 is effective for financial statements issued for fiscal years beginning after December 15, 2008, and interim periods within those fiscal years. Effective July 1, 2009, the Company adopted ASC No. 350-30, and its adoption did not have a material effect on its consolidated financial statements
In June 2009, the FASB issued ASC No. 105, Generally Accepted Accounting Principles (“GAAP”) (“ASC 105” or “FASB Codification”), previously referred to as SFAS No. 168, The FASB Accounting Standards Codification and the Hierarchy of Generally Accepted Accounting Principles - a replacement of FASB Statement No 162 (“SFAS 168”). The effective date for use of the FASB Codification is for interim and annual periods ending after September 15, 2009. Companies should account for the adoption of the guidance on a prospective basis. Effective July 1, 2009, the Company adopted the FASB Codification and its adoption did not have a material effect on its consolidated financial statements.
F-9
VALENCE TECHNOLOGY, INC. AND SUBSIDIARIES
NOTES TO CONSOLIDATED FINANCIAL STATEMENTS
On June 12, 2009, the FASB issued ASC No. 810, Consolidation, previously referred to as SFAS 167, Amendments to FASB Interpretation No. 46(R), which significantly changes the consolidation model for variable interest entities. ASC No. 810 requires companies to qualitatively assess the determination of the primary beneficiary of a variable interest entity (“VIE”) based on whether the entity (1) has the power to direct matters that most significantly affect the activities of the VIE, and (2) has the obligation to absorb losses or the right to receive benefits of the VIE that could potentially be significant to the VIE. The standard shall be effective as of the beginning of each reporting entity’s first annual reporting period that begins after November 15, 2009, for interim periods within that first annual reporting period, and for interim and annual reporting periods thereafter. Earlier application is prohibited. The Company does not expect that the adoption of ASC No. 810 will have a material effect on its financial position or results of operations.
In August 2009, the FASB issued Accounting Standards Update (“ASU”) No. 2009-05, Measuring Liabilities at Fair Value (“ASU 2009-05”). ASU 2009-05 provides clarification that in circumstances in which a quoted price in an active market for the identical liability is not available, a reporting entity is required to measure fair value of such liability using one or more of the techniques prescribed by the update. ASU 2009-05 is effective for the first reporting period beginning after issuance. The Company adopted ASU 2009-05 as of September 30, 2009, and there was no change to its consolidated financial statements due to the implementation of this guidance.
In January, 2010, the FASB issued ASU No. 2010-06, Fair Value Measurements and Disclosures (Topic 820): Improving Disclosures about Fair Value Measurements (“ASU 2010-06”). Reporting entities will have to provide information about movements of assets among Levels 1 and 2; and a reconciliation of purchases, sales, issuance, and settlements of activity valued with a Level 3 method, of the three-tier fair value hierarchy established by SFAS No. 157, Fair Value Measurements (ASC 820). The ASU 2010-06 also clarifies the existing guidance to require fair value measurement disclosures for each class of assets and liabilities. ASU 2010-06 is effective for interim and annual reporting periods beginning after December 15, 2009 for Level 1 and 2 disclosure requirements and after December 15, 2010 for Level 3 disclosure requirements. The Company adopted ASU No.2010-06 in its fiscal quarter ending March 31, 2010. and it did not have a material effect on its consolidated financial statements.
4. IMPAIRMENT CHARGE:
Impairment charges of approximately $0.3 million, $0.7 million, and $0.2 million were recorded during fiscal years 2010, 2009 and 2008, respectively. The fiscal year 2010 impairment charge was the result of our annual fixed asset inventory count and audit for idle or damaged assets in our China production facility. The fiscal year 2009 impairment charge relates to fixed assets that were purchased for the expansion of our production facilities in China. These production assets were deemed to be impaired since the additional capacity provided by these acquisition of these assets will not be necessary to meet expected demand until later than initially expected. The fiscal year 2008 impairment charge was related to a write-down of machinery and equipment as a result of our annual fixed asset inventory count and audit.
5. INVENTORY:
Inventory consisted of the following at (in thousands):
|
March 31,
|
||||||||
|
2010
|
2009
|
|||||||
|
Raw materials
|
$ | 2,639 | $ | 3,711 | ||||
|
Work-in-process
|
1,143 | 3,575 | ||||||
|
Finished goods
|
1,815 | 3,450 | ||||||
|
Total Inventory
|
$ | 5,597 | $ | 10,736 | ||||
Included in inventory at March 31, 2010, and 2009, were valuation allowances of $1.7 million and $4.6 million to reduce their carrying values to the lower of cost or market, respectively. The $5.2 million decrease in the inventory is mainly related to a fire in an offsite warehouse which housed certain fixed assets and inventory in the second quarter of fiscal year 2010. It was determined that $2.7 million of raw materials, work in progress, and finished goods inventory were consumed by the fire and determined to be unrecoverable. The additional decrease in inventory as of March 31, 2010, as compared to March 31, 2009, relates to management’s ongoing focus on reducing inventory levels to better match expected demand. Management has valued overhead absorption related to work in process based on estimates of completion at March 31, 2010, and March 31, 2009.
F-10
VALENCE TECHNOLOGY, INC. AND SUBSIDIARIES
NOTES TO CONSOLIDATED FINANCIAL STATEMENTS
6. PREPAID AND OTHER CURRENT ASSETS:
Prepaid and other current assets consisted of the following at (in thousands):
|
March 31,
|
||||||||
|
2010
|
2009
|
|||||||
|
Other receivables
|
$ | 3,228 | $ | 2,854 | ||||
|
Deposits
|
362 | 432 | ||||||
|
Prepaid insurance
|
75 | 71 | ||||||
|
Other prepaids
|
748 | 589 | ||||||
|
Total prepaid and other current assets
|
$ | 4,413 | $ | 3,946 | ||||
7. PROPERTY, PLANT AND EQUIPMENT:
Property, plant and equipment, net of accumulated depreciation, amortization, and impairment charges, consisted of the following at (in thousands):
|
March 31,
|
||||||||
|
2010
|
2009
|
|||||||
|
Leasehold improvements
|
$ | 1,117 | $ | 1,116 | ||||
|
Machinery and equipment
|
7,332 | 8,021 | ||||||
|
Office and computer equipment
|
2,220 | 2,217 | ||||||
|
Construction in progress
|
29 | — | ||||||
|
Property, plant, and equipment, gross
|
10,698 | 11,354 | ||||||
|
Less: accumulated depreciation and amortization
|
(4,907 | ) | (4,204 | ) | ||||
|
Less: impairment charges
|
(860 | ) | (859 | ) | ||||
|
Total property, plant, and equipment, net
|
$ | 4,931 | $ | 6,291 | ||||
In the second quarter of fiscal year 2010, the Company experienced a fire at an offsite warehouse which contained certain fixed assets and inventory. As a result of this fire, management has reduced the carrying value of certain fixed assets by approximately $0.2 million. In addition, an impairment charge of approximately $0.3 million was recorded during fiscal year 2010, which was the result of our annual fixed asset inventory count and audit for idle or damaged assets in our China production facility. Depreciation expense was approximately $1.2 million, $1.6 million, and $0.6 million for the fiscal years end March 31, 2010, 2009, and 2008, respectively.
8. INTELLECTUAL PROPERTY
Amortization expense was approximately zero, less than $0.1 million, and less than $0.1 million, for the fiscal years ended March 31, 2010, 2009, and 2008, respectively.
9. ACCRUED EXPENSES:
Accrued expenses consisted of the following at (in thousands):
|
March 31,
|
||||||||
|
2010
|
2009
|
|||||||
|
Accrued compensation
|
$ | 587 | $ | 606 | ||||
|
Value added taxes payable
|
2,855 | 2,406 | ||||||
|
Professional services
|
606 | 302 | ||||||
|
Warranty reserve
|
641 | 968 | ||||||
|
Other accrued expenses
|
2,733 | 2,997 | ||||||
|
Total accrued expenses
|
$ | 7,422 | $ | 7,279 | ||||
F-11
VALENCE TECHNOLOGY, INC. AND SUBSIDIARIES
NOTES TO CONSOLIDATED FINANCIAL STATEMENTS
10. DEBT:
Short-term and long-term debt, net of discount, consisted of the following (in thousands) at:
|
March 31, 2010
|
March 31, 2009
|
|||||||
|
Short term debt
|
$
|
20,000
|
$
|
—
|
||||
|
Less: unaccreted debt discount
|
(147
|
)
|
—
|
|||||
|
Long-term debt
|
—
|
20,000
|
||||||
|
Less: unaccreted debt discount
|
—
|
(555
|
)
|
|||||
|
Short-term debt, net of debt discount
|
$
|
19,853
|
$
|
19,445
|
||||
On July 13, 2005, the Company secured a $20.0 million loan (the “2005 Loan”) from SFT I, Inc., the full amount of which has been drawn down. The 2005 Loan is guaranteed by Carl E. Berg, Chairman of the Board, and matures beginning in July, 2010. Interest is due monthly based on a floating interest rate equal to the greater of 6.75% or the sum of the LIBOR rate plus 4.0%. LIBOR was 2.75% at March 31, 2010, and the interest payable on the loan to a third party finance company was 6.75% at March 31, 2010. As of March 31, 2010, the 2005 Loan is payable within twelve months of the balance sheet date, and has been classified as short term debt. As of March 31, 2010, no amounts have been paid on the principal balance of the 2005 Loan.
In connection with the 2005 Loan, both SFT I, Inc. and Berg & Berg Enterprises, LLC (“Berg & Berg”), each received warrants to purchase 600,000 shares of the Company’s common stock at a price of $2.74 per share, the closing price of the Company’s common stock on July 12, 2005. The fair value assigned to these warrants, totaling approximately $2.0 million, has been recorded as a discount on the debt and will be accreted as interest expense over the life of the loan. The warrants were valued using the Black-Scholes valuation method using the assumptions of a life of 36 months, 96.45% volatility, and a risk-free rate of 3.88%. On April 24, 2008, Berg & Berg exercised its warrants by purchasing 600,000 shares of the Company’s common stock for an aggregate purchase price of $1.6 million. In addition, SFT I, Inc. completed cashless exercises of its warrants on June 4, 2008 and June 27, 2008 and received 230,767 common stock shares upon completion of the cashless exercises. Also in connection with the 2005 Loan, the Company incurred a loan commitment fee and attorneys’ fees which, in addition to the interest rate cap agreement, have been recorded as a discount on the debt and will be accreted as interest expense over the life of the loan. The rate cap agreement terminated on August 10, 2008. Through March 31, 2010, a total of approximately $2.2 million has been accreted and included as interest expense. Interest payments on the 2005 Loan are currently being paid on a monthly basis.
On March 30, 2010, the Company entered into an Amendment No. 2 to Loan and Security Agreement and Other Loan Documents (the “Amendment”) with iStar Tara LLC, a Delaware limited liability company (“iStar”), and Carl E. Berg, the Chairman of our Board of Directors, to amend the Loan and Security Agreement dated as of July 13, 2005 (as amended to date, the “Original Loan Agreement”) among the Company, iStar and Mr. Berg. Pursuant to the terms of the Original Loan Agreement, iStar’s predecessor in interest, SFT 1, Inc., extended a $20.0 million loan to the Company (the “Loan”), which is guaranteed by Mr. Berg and secured by certain of Mr. Berg’s assets.
The Amendment extends the maturity date of the Loan from July 13, 2010 to February 13, 2011 (the “New Maturity Date”). The Company will continue to make monthly interest payments to iStar, as set forth in the Original Loan Agreement; provided that, commencing with the monthly interest payment scheduled for July 2010 and monthly thereafter, the Company shall also begin making principal payments equal to $1.0 million per month, beginning in July, 2010. The remainder of the principal, $13.0 million, and any other outstanding obligations under the Loan shall be payable in full on the New Maturity Date.
Additionally, in connection with the Amendment the Company issued to iStar a Warrant to Purchase Common Stock of Valence Technology, Inc. (the “Warrant”), pursuant to which iStar may purchase up to 115,000 shares of the Company’s common stock, at an exercise price of $1.00 per share on or before March 30, 2013. The warrants were valued using the Black-Scholes valuation method using the assumptions of a life of 36 months, 87.13% volatility, and a risk-free rate of 2.82%, and approximately $0.1 million of additional unaccreted debt discount was recorded in the fourth quarter of fiscal year 2010 against the Loan, as a result of issuing these warrants, and the additional unaccreted debt discount will be amortized over the remaining life of the loan.
11. NOTES PAYABLE TO STOCKHOLDER:
Convertible Notes Payable to Stockholder: November 15, 2008, Berg & Berg purchased approximately 1.7 million shares of the Company’s common stock. As payment of the purchase price of the common stock, Berg & Berg surrendered certain promissory notes issued on July 23, 2008 and amended September 30, 2008 ($0.5 million in principal and less than $0.1 million in accrued interest), and June 26, 2008 ($2.5 million in principal and less than $0.1 million in accrued interest). The surrendered promissory notes were the second and first working capital loan installments, respectively, made pursuant to an agreement between the Company and Berg & Berg whereby Berg & Berg agreed to provide up to $10.0 million in interim working capital loans from time to time in order to supplement the Company’s working capital and other financial needs. This agreement expired on November 15, 2008, and accordingly, all outstanding amounts were paid on November 15, 2008. No future draws can be taken against this loan.
Non-Convertible Notes Payable to Stockholder: In October 2001, the Company entered into a loan agreement (“2001 Loan”) with Berg & Berg. Under the terms of the agreement, Berg & Berg agreed to advance the Company funds of up to $20.0 million between the date of the agreement and September 30, 2003. Interest on the 2001 Loan accrues at 8.0% per annum, payable from time to time. The maturity date of the 1990 Loan has been extended multiple times, most recently on October 13, 2009, at which time Berg & Berg agreed to further extend the maturity date for the loan principal and interest from September 30, 2010, to September 30, 2012. Interest payments are currently being deferred, and are recorded as long term interest payable to stockholder on the balance sheet.
F-12
VALENCE TECHNOLOGY, INC. AND SUBSIDIARIES
NOTES TO CONSOLIDATED FINANCIAL STATEMENTS
In conjunction with the 2001 Loan, Berg & Berg received a warrant to purchase 1,402,743 shares of the Company’s common stock at the price of $3.208 per share. These warrants were exercised on September 30, 2008 when Berg & Berg surrendered a short term note payable of $4.5 million to the Company as exercise consideration. The fair value assigned to these warrants, totaling approximately $5.1 million, has been reflected as additional consideration for the debt financing, recorded as a discount on the debt and accreted as interest expense over the life of the loan. The warrants were valued using the Black-Scholes method using the assumptions of a life of 47 months (extended to 84 months), 100% volatility, and a risk-free rate of 5.5%. Through March 31, 2010, a total of $5.0 million has been accreted and included as interest expense. The amount charged to interest expense on the outstanding balance of the loan for the fiscal years ended March 31, 2010, 2009, and 2008, is $1.6 million. Interest payments on the loan are currently being deferred, and are recorded as long-term interest. The accrued interest amounts for the 2001 Loan were $13.2 million and $11.6 million as of March 31, 2010, and March 31, 2009, respectively.
In July 1998, the Company entered into an amended loan agreement (“1998 Loan”) with Berg & Berg that allows the Company to borrow, prepay and re-borrow up to $10.0 million principal under a promissory note on a revolving basis. In November 2000, the 1998 Loan agreement was amended to increase the maximum amount to $15.0 million. As of March 31, 2010, and 2009, the Company had an outstanding balance of $15.0 million under the 1998 Loan agreement, respectively. The 1998 Loan bears interest at one percent over lender’s borrowing rate (approximately 9.0 % at March 31, 2010). The maturity date of the 1998 Loan has been extended multiple times, most recently on October 13, 2009, at which time Berg & Berg agreed to further extend the maturity date for the loan principal and interest from September 30, 2010 to September 30, 2012. Interest payments are currently being deferred, and are recorded as long term interest payable to stockholder on the balance sheet. The accrued interest amounts for the 1998 Loan were $14.2 million and $12.8 million as of March 31, 2010 and March 31, 2009, respectively.
All of the Company’s assets are pledged as collateral under the 2001 Loan and the 1998 Loan to stockholder.
Long-term debt to stockholder, net of discount, consisted of the following at (in thousands):
|
March 31,
|
||||||||
|
2010
|
2009
|
|||||||
|
2001 Loan
|
$ | 20,000 | $ | 20,000 | ||||
|
1998 Loan
|
14,950 | 14,950 | ||||||
|
Less: unaccreted debt discount
|
(102 | ) | (184 | ) | ||||
|
Long-term debt to stockholder, net of debt discount
|
$ | 34,848 | $ | 34,766 | ||||
Principal payments of long-term debt to stockholder are as follows (in thousands):
|
Fiscal Year ended March 31,
|
||||||||||||||||||||||||||||
|
2011
|
2012
|
2013
|
2014
|
2015
|
Thereafter
|
Total
|
||||||||||||||||||||||
|
2001 Loan
|
$ | — | $ | — | $ | 20,000 | $ | — | $ | — | $ | — | $ | 20,000 | ||||||||||||||
|
1998 Loan
|
$ | — | $ | — | $ | 14,950 | $ | — | $ | — | $ | — | $ | 14,950 | ||||||||||||||
|
Total debt to stockholder
|
$ | — | $ | — | $ | 34,950 | $ | — | $ | — | $ | — | $ | 34,950 | ||||||||||||||
12. COMMITMENTS AND CONTINGENCIES:
LEASES:
Total rent expense for the years ended March 31, 2010, 2009 and 2008, was approximately $0.5 million, $0.7 million and $0.5 million, respectively. Future minimum payments on operating leases for fiscal years following March 31, 2010 are (in thousands):
|
2011
|
$
|
526
|
||
|
2012
|
302
|
|||
|
2013
|
270
|
|||
|
2014
|
194
|
|||
|
2015 and thereafter
|
—
|
|||
|
Total minimum payments
|
$
|
1,292
|
||
WARRANTIES:
The Company has also established a warranty reserve in relation to the sale of U-Charge® Power Systems and other products. The warranty coverage period, which varies by product line and customer agreements, extends between 12 and 24 months after the date of sale, during which the Company would provide a replacement unit to the customer returning a purchased product because of a product performance issue.
F-13
VALENCE TECHNOLOGY, INC. AND SUBSIDIARIES
NOTES TO CONSOLIDATED FINANCIAL STATEMENTS
Product warranty liabilities are as follows at (in thousands):
|
March 31,
|
||||||||
|
2010
|
2009
|
|||||||
|
Beginning balance
|
$ | 968 | $ | 1,174 | ||||
|
Less: claims
|
(128 | ) | (284 | ) | ||||
|
Add: (adjustments) and accruals
|
(199 | ) | 78 | |||||
|
Ending balance
|
$ | 641 | $ | 968 | ||||
LITIGATION:
On January 31, 2007, the Company filed a claim against Phostech Lithium Inc. in the Federal Court in Canada (Valence Technology, Inc. v. Phostech Lithium Inc. Court File No. T-219-07) alleging infringement of Valence Canadian Patent 2,395,115. Subsequently, on April 2, 2007, the Company filed an amended claim alleging infringement of Valence’s Canadian Patents 2,483,918 and 2,466,366. The action is in the discovery phase. The Company is seeking monetary damages and injunctive relief for the acts of Phostech in manufacturing, using and selling phosphate cathode material that infringes the asserted Valence Canadian Patents.
On February 14, 2006, Hydro-Quebec filed an action against the Company in the United States District Court for the Western District of Texas (Hydro-Quebec v. Valence Technology, Civil Action No. A06CA111). In its amended complaint filed April 13, 2006, Hydro-Quebec alleges that Saphion® I Technology, the technology utilized in all of the Company’s commercial battery products, infringes U.S. Patent Nos. 5,910,382 and 6,514,640 exclusively licensed to Hydro-Quebec. Hydro-Quebec’s complaint seeks injunctive relief and monetary damages. The action was stayed by the Court pending a final determination of reexaminations of the two patents by the USPTO. The reexaminations are complete and Hydro-Quebec has filed an amended Complaint alleging infringement of certain amended claims in the two patents. The Company has filed a response denying the allegations in the amended complaint as well as filing a counter complaint seeking damages from Hydro-Quebec, the University of Texas, and Phostech. The litigation is now proceeding.
The Company is subject, from time to time, to various claims and litigation in the normal course of business. In the Company’s opinion, all pending legal matters will not have a material adverse effect on the Company’s consolidated financial statements.
13. REDEEMABLE CONVERTIBLE PREFERRED STOCK:
On November 30, 2004, the Company issued 431 shares of Series C-1 Convertible Preferred Stock, with a stated value of $4.3 million, and 430 shares of Series C-2 Convertible Preferred Stock, with a stated value of $4.3 million. When issued, the Series C-1 Convertible Preferred Stock and Series C-2 Convertible Preferred Stock were convertible into common stock at $4.00 per share. Each series carries a 2% annual dividend rate, payable quarterly in cash or shares of common stock, and were redeemable on December 15, 2005. The Company has the right to convert the preferred stock if the average of the dollar-volume weighted average price of the Company’s common stock for a ten-day trading period is at or above $6.38 per share. If the preferred shares are not redeemed in accordance with their terms, the holder of the preferred stock shall have the option to require the Company to convert all or part of the redeemed shares at a price of 95% of the lowest closing bid price of the Company’s common stock during the three days ending on and including the conversion date. The preferred shares are currently outstanding and subject to redemption or conversion at the holder’s discretion.
Pursuant to assignment agreements entered into between the Company and Berg & Berg Enterprises, LLC. on July 14, 2005 and December 14, 2005, Berg & Berg purchased all of the outstanding Series C-1 Convertible Preferred Stock and Series C-2 Convertible Preferred Stock from its original holder. Pursuant to the terms of the assignment agreement, Berg & Berg agreed that the failure of the Company to redeem the preferred stock on December 15, 2005 did not constitute a default under the certificate of designations and has waived the accrual of any default interest applicable in such circumstance. In exchange, the Company has agreed (i) that the Series C-1 Convertible Preferred Stock may be converted, at any time, into the Company’s common stock at the lower of $4.00 per share or the closing bid price of the Company’s common stock on December 13, 2005 ($1.98) and (ii) that the Series C-2 Convertible Preferred Stock may be converted, at any time, into the Company’s common stock at the lower of $4.00 per share or the closing bid price of the Company’s common stock on July 13, 2005 ($2.96). Berg & Berg has agreed to allow dividends to accrue on the preferred stock. At March 31, 2010, $0.8 million in preferred stock dividends had accrued.
14. SHARE BASED COMPENSATION:
In February 1996, the Board of Directors adopted the 1996 Non-Employee Director’s Stock Option Plan for outside directors (the “1996 Plan”). The 1996 Plan terminated in February 2006, and as of March 31, 2010, a total of 76,544 shares have been issued and are outstanding under this plan, and no shares are available to be granted under this plan.
In October 1997, the Board of Directors adopted the 1997 Non-Officer Stock Option Plan (the “1997 Plan”). The 1997 Plan terminated on October 3, 2007, and as of March 31, 2010, a total of 151,310 shares have been issued and are outstanding under this plan, and no shares are available to be granted under this plan.
F-14
VALENCE TECHNOLOGY, INC. AND SUBSIDIARIES
NOTES TO CONSOLIDATED FINANCIAL STATEMENTS
In January 2000, the Board of Directors adopted the 2000 Stock Option Plan (the “2000 Plan”). During fiscal year 2010, 361,300 shares were granted under the 2000 Plan. The plan terminated in January, 2010, and as of March 31, 2010, a total of 3,461,098 shares have been issued and are outstanding under this plan, and no shares are available to be granted under this plan.
On April 30, 2009, the Board of Directors adopted the Valence Technology, Inc. 2009 Equity Incentive Plan (the “2009 Plan”). The 2009 Plan is a broad-based incentive plan that provides for granting stock options, stock awards, performance awards, and other stock-based awards and substitute awards to employees, service providers and non-employee directors.
The maximum number of shares of the Company’s common stock initially reserved for issuance under the 2009 Plan with respect to awards is 3,000,000 shares. The 2009 Plan contains an “evergreen” provision whereby the number of shares of common stock available for issuance under the 2009 Plan shall automatically increase on the first trading day of April each fiscal year during the term of the 2009 Plan, beginning with the fiscal year ending March 31, 2011, by an amount (the “Annual Increase Amount”) equal to the lesser of (i) one percent (1%) of the total number of shares of common stock outstanding on the last trading day in March of the immediately preceding fiscal year, (ii) 1,500,000 shares and (iii) such lesser amount if set by the Board. The maximum number of shares of common stock that may be issued under the 2009 Plan pursuant to the exercise of incentive stock options is the lesser of (A) 3,000,000 shares, increased on the first trading day of April each fiscal year during the term of the 2009 Plan, beginning with the fiscal year ending March 31, 2011, by the Annual Increase Amount, and (B) 16,500,000 shares. The 2009 Plan also contains an automatic option grant program for the Company’s non-employee directors. Under the automatic option grant program, each individual who first becomes a non-employee board member at any time after the effective date of the 2009 Plan will receive an option grant to purchase 100,000 shares of common stock on the date such individual joins the board. In addition, on the date of each annual stockholders meeting held after the effective date of the 2009 Plan, each non-employee director who continues to serve as a non-employee director will automatically be granted an option to purchase 50,000 shares of common stock, provided such individual has served on the board for at least six months. All employees, service providers and directors of the Company and its affiliates are eligible to participate in the 2009 Plan. This plan will terminate on April 29, 2019. The 2009 Plan was approved by the Company’s stockholders at the annual meeting of stockholders on September 8, 2009. As of March 31, 2010, 356,700 shares have been granted and 2,643,300 shares remain available for grant under the 2009 Plan.
Aggregate option activity is as follows (shares and aggregate intrinsic value in thousands):
|
Number of
Shares
|
Weighted-
Average
Exercise
Price
|
Weighted-
Average
Contractual
Life
|
Aggregate
Intrinsic
Value
|
|||||||||
|
(in years)
|
||||||||||||
|
Outstanding at March 31, 2007
|
6,753 | $ | 3.84 | |||||||||
|
Granted
|
1,761 | 1.51 | ||||||||||
|
Exercised
|
(197 | ) | 2.35 | |||||||||
|
Canceled
|
(1,629 | ) | 5.17 | |||||||||
|
Outstanding at March 31, 2008
|
6,688 | 2.95 | ||||||||||
|
Granted
|
745 | 2.54 | ||||||||||
|
Exercised
|
(444 | ) | 2.04 | |||||||||
|
Canceled
|
(1,227 | ) | 5.52 | |||||||||
|
Outstanding at March 31, 2009
|
5,762 | 2.42 | ||||||||||
|
Granted
|
718 | 1.46 | ||||||||||
|
Exercised
|
(76 | ) | 1.75 | |||||||||
|
Canceled
|
(858 | ) | 3.86 | |||||||||
|
Outstanding at March 31, 2010
|
5,546 | $ | 2.08 |
6.7
|
$ | 10 | ||||||
|
Vested and expected to vest at March 31, 2010
|
5,318 | $ | 2.10 |
6.6
|
$ | 8 | ||||||
|
Exercisable at March 31, 2010
|
4,417 | $ | 2.16 |
6.3
|
$ | 3 | ||||||
F-15
VALENCE TECHNOLOGY, INC. AND SUBSIDIARIES
NOTES TO CONSOLIDATED FINANCIAL STATEMENTS
The following table summarizes information about fixed stock options outstanding at March 31, 2010 (shares in thousands):
|
Options Outstanding
|
Options Exercisable
|
|||||||||||||||||||||||||
|
Range of Exercise Prices
|
Number
Outstanding
|
Average
Remaining
Contractual
Life
|
Weighted-
Average
Exercise
Price
|
Number
Exercisable
|
Weighted-
Average
Exercise
Price
|
|||||||||||||||||||||
|
(in years)
|
||||||||||||||||||||||||||
| $ | 0.70 | - | $ | 1.00 | 324 | 9.4 | $ | 0.87 | 21 | $ | 0.71 | |||||||||||||||
| $ | 1.01 | - | $ | 1.99 | 3,982 | 7.1 | 1.62 | 3,352 | 1.61 | |||||||||||||||||
| $ | 2.00 | - | $ | 3.00 | 415 | 5.4 | 2.53 | 376 | 2.52 | |||||||||||||||||
| $ | 3.01 | - | $ | 4.00 | 609 | 5.5 | 3.61 | 458 | 3.61 | |||||||||||||||||
| $ | 4.01 | - | $ | 15.75 | 216 | 1.7 | 7.21 | 210 | 7.30 | |||||||||||||||||
| $ | 0.70 | - | $ | 15.75 | 5,546 | 6.7 | $ | 2.08 | 4,417 | $ | 2.16 | |||||||||||||||
Compensation expense for stock plans has been determined based on the fair value at the grant date for options granted in the current fiscal year. For the years ended March 31, 2010, 2009 and 2008, $2.2 million, $0.6 million, and $2.3 million, respectively, of share based compensation expense has been included in operating expenses in the consolidated statements of operations and comprehensive loss.
Share-based compensation expenses included in total cost of sales and operating expenses for the years ended March 31, 2010, 2009, and 2008 are summarized as follows (in thousands):
|
Year ended March 31,
|
||||||||||||
|
2010
|
2009
|
2008
|
||||||||||
|
Cost of sales
|
$ | 38 | 30 | 109 | ||||||||
|
Research and development
|
633 | 75 | 264 | |||||||||
|
Marketing
|
154 | 248 | 257 | |||||||||
|
General and administrative
|
1,359 | 285 | 1,718 | |||||||||
|
Total stock based compensation expense
|
$ | 2,184 | 638 | 2,348 | ||||||||
The aggregate intrinsic value of options exercisable at March 31, 2010 is less than $0.1 million and the intrinsic value of options exercised during fiscal year 2010 is less than $0.1 million. As of March 31, 2010 the Company had a total of $1.0 million in unrecognized compensation costs related to share-based compensation that is expected to be recognized over a weighted average remaining service period of 1.8 years for non-vested options. The fair value of each option grant is estimated at the date of grant using the Black-Scholes pricing model with the following weighted average assumptions for grants in fiscal years 2010, 2009, and 2008:
|
Year ended March 31,
|
||||||||||||
|
2010
|
2009
|
2008
|
||||||||||
|
Average expected life
|
5.8 years
|
5.9 years
|
5.9 years
|
|||||||||
|
Average expected volatility
|
87.08 | % | 81.49 | % | 80.49 | % | ||||||
|
Weighted average risk-free interest rate
|
2.83 | % | 2.67 | % | 4.27 | % | ||||||
|
Dividend yield
|
None
|
None
|
None
|
|||||||||
15. SIGNIFICANT CUSTOMERS:
Over the last three fiscal years, a limited number of the Company’s customers have accounted for a significant portion of revenues as follows (in thousands):
|
Year ended March 31,
|
||||||||||||
|
2010
|
2009
|
2008
|
||||||||||
|
Segway, Inc.
|
25 | % | 46 | % | 55 | % | ||||||
|
Smith Electric Vehicles, US Corp.
|
12 | % | — | — | ||||||||
|
The Tanfield Group, PLC
|
— | % | 16 | % | 12 | % | ||||||
|
Percent of total revenue
|
37 | % | 62 | % | 67 | % | ||||||
Over the last two fiscal years, a limited number of the Company’s customers have accounted for a significant portion of accounts receivable as follows (in thousands):
|
Year ended March 31,
|
||||||||
|
2010
|
2009
|
|||||||
|
Segway, Inc.
|
* | % | 57 | % | ||||
|
Smith Electric Vehicles, US Corp.
|
19 | % | — | |||||
|
The Tanfield Group, PLC
|
— | % | * | % | ||||
|
Percent of total trade accounts receivable
|
19 | % | 57 | % | ||||
* less than 10%
F-16
VALENCE TECHNOLOGY, INC. AND SUBSIDIARIES
NOTES TO CONSOLIDATED FINANCIAL STATEMENTS
16. INCOME TAXES:
There was no recorded income tax benefit related to the losses of fiscal years 2010, 2009, or 2008, due to the uncertainty of the Company generating taxable income to utilize its net operating loss carryforwards. The provision for income taxes due to continuing operations differs from the amount computed by applying the federal statutory rate of 34% to the loss before income taxes as follows:
|
Year ended March 31,
|
||||||||||||
|
2010
|
2009
|
2008
|
||||||||||
|
Federal tax benefit at statutory rate
|
$ | (7,285 | ) | $ | (7,217 | ) | $ | (6,610 | ) | |||
|
Effect of foreign operations
|
1,918 | 1,643 | 4,923 | |||||||||
|
Effect of change in Texas tax law
|
— | — | (1,194 | ) | ||||||||
|
State tax provision
|
19 | (45 | ) | (20 | ) | |||||||
|
Permanent items and other
|
(18 | ) | 7 | (20 | ) | |||||||
|
Stock compensation
|
152 | (295 | ) | 756 | ||||||||
|
Research and experimentation credit
|
(53 | ) | (52 | ) | (45 | ) | ||||||
|
Expired net operating losses
|
4,558 | 7,220 | 1,472 | |||||||||
|
Change in valuation allowance
|
1,249 | (1,261 | ) | 1,738 | ||||||||
|
Tax provision (benefit)
|
$ | — | $ | — | $ | — | ||||||
The components of the net deferred tax asset were as follows at (in thousands):
|
March 31,
|
||||||||
|
2010
|
2009
|
|||||||
|
Deferred tax assets:
|
||||||||
|
Current deferred tax assets:
|
||||||||
|
Accrued liabilities and other
|
$ | 444 | $ | 565 | ||||
|
Valuation allowance for current deferred tax assets
|
(442 | ) | (563 | ) | ||||
|
Net current deferred tax assets
|
2 | 2 | ||||||
|
Non-current deferred tax assets:
|
||||||||
|
Stock compensation
|
1,188 | 599 | ||||||
|
Research and experimentation credit carryforwards
|
2,073 | 2,271 | ||||||
|
Deferred rent
|
45 | 45 | ||||||
|
Net operating loss carryforwards — federal and state
|
64,680 | 64,798 | ||||||
|
Net operating loss carryforwards — foreign
|
46,433 | 45,804 | ||||||
|
Impairment reserve
|
726 | 731 | ||||||
|
State tax credits
|
329 | 788 | ||||||
|
Accrued interest
|
4,107 | 3,110 | ||||||
|
Valuation allowance for non-current deferred tax assets
|
(119,371 | ) | (118,003 | ) | ||||
|
Net non-current deferred tax assets
|
210 | 143 | ||||||
|
Deferred tax liabilities:
|
||||||||
|
Non-current deferred tax liabilities:
|
||||||||
|
Depreciation and amortization
|
(212 | ) | (145 | ) | ||||
|
Total non-current deferred tax liability
|
(212 | ) | (145 | ) | ||||
|
Net current deferred tax asset (liability)
|
$ | 2 | $ | 2 | ||||
|
Net non-current deferred tax asset (liability)
|
$ | (2 | ) | $ | (2 | ) | ||
At March 31, 2010, the Company had federal net operating loss carryforwards available to reduce future taxable income of approximately $190 million. The valuation allowance increased by approximately $1.2 million during the year ended March 31, 2010. The net decrease resulted primarily due to operating losses not benefitted. A portion of the valuation allowance relates to tax benefits for stock option deductions included in the net operating loss carryforward, which when realized, will be allocated directly to contributed capital.
The federal carryforwards expire from 2011 to 2030, if not used before such time to offset future taxable income.
For federal tax purposes, the Company’s net operating loss carryforwards are subject to certain limitations on annual utilization because of changes in ownership, as defined by federal tax law. The Company also has foreign operating loss carryforwards available to reduce future foreign income of approximately $170.1 million.
The Company adopted the provisions of Financial Standards Accounting Board Interpretation No. 48 Accounting for Uncertainty in Income Taxes (“FIN 48”) an interpretation of FASB Statement No. 109 (“SFAS 109”) on April 1, 2007. As a result of the implementation of FIN 48, the Company recognized no material adjustment in the liability for unrecognized income tax benefits. At March 31, 2008, 2009 and 2010, the Company had no material unrecognized tax benefits.
F-17
VALENCE TECHNOLOGY, INC. AND SUBSIDIARIES
NOTES TO CONSOLIDATED FINANCIAL STATEMENTS
The tax years 2005 through 2009 remain open to examination by the major taxing jurisdictions to which the Company is subject.
17. EMPLOYEE BENEFIT PLAN:
Valence has a 401(k) plan as allowed under Section 401(k) of the Internal Revenue Code. The 401(k) Plan provides for the tax deferral of compensation by all eligible employees. All U.S. employees meeting certain minimum age and service requirements are eligible to participate under the 401(k) Plan. Under the 401(k) Plan, participants may voluntarily defer up to 25% of their paid compensation, subject to specified annual limitations. The 401(k) Plan does not provide for contributions by the Company.
18. RELATED PARTY TRANSACTIONS:
On February 22, 2010, Berg & Berg purchased 1,086,957 shares of common stock for cash at a price per share of $0.92 for an aggregate purchase price of $1.0 million. The purchase price per share equaled the closing bid price of the Company’s common stock as of February 22, 2010.
On October 13, 2009, Berg & Berg agreed to further extend the maturity date for the loan principal and interest for the 1998 Loan and the 2001 Loan from September 30, 2010 to September 30, 2012.
On June 11, 2009, Berg & Berg purchased 1,256,281 shares of common stock for cash at a price per share of $1.99 for an aggregate purchase price of $2.5 million. The purchase price per share equaled the closing bid price of the Company’s common stock as of June 10, 2009.
On November 15, 2008, Berg & Berg purchased approximately 1.7 million shares of the Company’s common stock. As payment of the purchase price of the common stock, Berg & Berg surrendered certain promissory notes issued on July 23, 2008 and amended September 30, 2008 ($542,000 in principal and approximately $14,000 in accrued interest), and June 26, 2008 ($2.5 million in principal and approximately $78,000 in accrued interest). The surrendered promissory notes were the second and first working capital loan installments, respectively, made pursuant to an agreement between the Company and Berg & Berg whereby Berg & Berg agreed to provide up to $10.0 million in interim working capital loans from time to time in order to supplement the Company’s working capital and other financial needs. This agreement expired on November 15, 2008, and accordingly, all outstanding amounts were paid on November 15, 2008. No future draws can be taken against this loan.
On April 24, 2008, Berg & Berg, an affiliate of our Chairman, Carl Berg, exercised a warrant to purchase 600,000 shares of the Company’s common stock. The purchase price was $ 2.74 per share as set forth in the warrant. On July 13, 2005, we entered into an agreement with SFT I, Inc., providing for a $20.0 million loan to Valence. In exchange for entry into the Loan Agreement and the guaranty of the loan, SFT I, Inc. and Berg & Berg were each issued three year warrants to purchase 600,000 shares of our common stock, at $2.74 per share, the closing price of our common stock on July 12, 2005.
On February 21, 2008, Berg & Berg purchased 280,112 shares of the Company’s common stock for $1.0 million. The purchase price of $3.57 per share equaled the closing bid price of the Company’s common stock as of February 27, 2008.
19. SEGMENT AND GEOGRAPHIC INFORMATION:
The Company’s chief operating decision makers are its Chairman and Chief Executive Officer, who review operating results to make decisions about resource allocation and to assess performance. The Company’s chief operating decision makers view results of operations as a single operating segment and the development and marketing of the Company’s battery technology. The Company’s Chairman and Chief Executive Officer have organized the Company functionally to develop, market, and manufacture battery systems. The Company conducts its business in two geographic regions.
Long-lived asset information by geographic area is as follows (in thousands):
|
March 31,
|
||||||||
|
2010
|
2009
|
|||||||
|
United States
|
$ | 223 | $ | 236 | ||||
|
International
|
4,708 | 6,055 | ||||||
|
Total
|
$ | 4,931 | $ | 6,291 | ||||
Revenues by geographic area are as follows (in thousands):
|
Year Ended March 31,
|
||||||||||||
|
2010
|
2009
|
2008
|
||||||||||
|
United States
|
$ | 10,548 | $ | 15,614 | $ | 15,782 | ||||||
|
International
|
5,532 | 10,543 | 4,995 | |||||||||
|
Total
|
$ | 16,080 | $ | 26,157 | $ | 20,777 | ||||||
F-18
20. QUARTERLY FINANCIAL DATA (UNAUDITED):
The following tables present selected unaudited consolidated statement of operation and balance sheet information for each of the quarters in the years ended March 31, 2010 and 2009 (in thousands, except per share data):
|
Fiscal Year Ended March 31, 2010,
|
||||||||||||||||||||
|
1st Quarter
|
2nd Quarter
|
3rd Quarter
|
4th Quarter
|
Fiscal Year
|
||||||||||||||||
|
Revenue
|
$ | 4,717 | $ | 3,347 | $ | 4,113 | $ | 3,903 | $ | 16,080 | ||||||||||
|
Gross margin
|
807 | 234 | 493 | 453 | 1,987 | |||||||||||||||
|
Operating loss
|
(4,962 | ) | (4,354 | ) | (4,328 | ) | (4,166 | ) | (17,810 | ) | ||||||||||
|
Net loss available to common stockholders
|
(6,197 | ) | (6,236 | ) | (5,625 | ) | (5,130 | ) | (23,188 | ) | ||||||||||
|
Basic and diluted EPS (1)
|
$ | (0.05 | ) | $ | (0.05 | ) | $ | (0.04 | ) | $ | (0.04 | ) | $ | (0.18 | ) | |||||
|
Fiscal Year Ended March 31, 2009,
|
||||||||||||||||||||
|
1st Quarter
|
2nd Quarter
|
3rd Quarter
|
4th Quarter
|
Fiscal Year
|
||||||||||||||||
|
Revenue
|
$ | 10,990 | $ | 5,816 | $ | 4,682 | $ | 4,669 | $ | 26,157 | ||||||||||
|
Gross (loss) margin
|
(26 | ) | (171 | ) | 250 | 422 | 475 | |||||||||||||
|
Operating loss
|
(4,647 | ) | (5,016 | ) | (3,817 | ) | (3,240 | ) | (16,720 | ) | ||||||||||
|
Net loss available to common stockholders
|
(5,566 | ) | (6,225 | ) | (5,195 | ) | (4,412 | ) | (21,398 | ) | ||||||||||
|
Basic and diluted EPS (1)
|
$ | (0.05 | ) | $ | (0.05 | ) | $ | (0.04 | ) | $ | (0.04 | ) | $ | (0.18 | ) | |||||
(1) The sum of Basic and Diluted EPS for the four quarters may differ from the annual EPS due to the required method of computing weighted average number of shares in the respective periods.
21. SUBSEQUENT EVENTS:
None.
F-19
None.
Evaluation and Conclusion of Disclosure Controls and Procedures
The Company conducted an evaluation, under the supervision and with the participation of the Company’s principal executive officer and principal financial officer, of the effectiveness of the design and operation of the Company’s disclosure controls and procedures (as defined in the Securities Exchange Act of 1934 Rules 13a-15(e) and 15d-15(e), as amended) as of March 31, 2010
Based upon that evaluation, the Chief Executive Officer and Chief Financial Officer concluded that the Company’s disclosure controls and procedures as of the end of the period covered by this Report were effective.
Management’s Report on Internal Controls
Management is responsible for establishing and maintaining adequate internal control over financial reporting (as defined in the Securities Exchange Act of 1934 Rules 13a-15(f) and 15d-15(f), as amended) of the Company. Internal control over financial reporting is a process designed to provide reasonable assurance regarding the reliability of financial reporting and the preparation of financial statements for external purposes in accordance with accounting principles generally accepted in the United States.
The Company’s internal control over financial reporting includes those policies and procedures that (i) pertain to the maintenance of records that, in reasonable detail, accurately and fairly reflect the transactions and dispositions of the assets of the Company; (ii) provide reasonable assurance that transactions are recorded as necessary to permit preparation of financial statements in accordance with accounting principles generally accepted in the United States of America, and that receipts and expenditures of the Company are being made only in accordance with authorizations of management and directors of the Company; and (iii) provide reasonable assurance regarding prevention or timely detection of unauthorized acquisition, use or disposition of the Company’s assets that could have a material effect on the financial statements.
39
Management conducted an evaluation of the effectiveness of internal control over financial reporting based on the framework in Internal Control—Integrated Framework issued by the Committee of Sponsoring Organizations of the Treadway Commission. Based on this evaluation, management concluded that the Company’s internal control over financial reporting was effective as of March 31, 2010.
The effectiveness of the Company’s internal control over financial reporting as of March 31, 2010 has been audited by PMB Helin Donovan, LLP, an independent registered public accounting firm, as stated in their report, which is included herein.
Previously Disclosed Material Weakness
In connection with the audit of our consolidated financial statements for the fiscal year ended March 31, 2009, we identified a material weakness with respect to our internal control over financial reporting. A material weakness in internal control over financial reporting is a deficiency, or combination of deficiencies, in internal control over financial reporting such that there is a reasonable possibility that a material misstatement of the annual or interim financial statements would not be prevented or detected on a timely basis. Management determined that, as of March 31, 2009, a material weakness existed in our internal control over financial reporting that consisted of the position of CFO being held by three separate individuals, acting consecutively, over the course of fiscal year 2009. This caused management to determine that there was a failure to consistently adhere to certain control disciplines and to evaluate and properly record certain non-routine and complex transactions. While this did not result in any audit adjustments to the financial statements of our company and subsidiaries, this condition did result in a material weakness in internal control over financial reporting. As a result of the material weakness identified, management undertook the following remediation activities: the position of CFO has been held by a single individual, starting on November 2008, through the date of this filing, with extensive public company experience; the hiring of additional finance personnel with public company and internal control experience, and implementing new controls and procedures to assure that control disciplines are consistently applied and non-routine and complex transactions are properly recorded. As a result, management considers that the material weakness in internal control over financial reporting that existed as of March 31, 2009, has been remediated as of March 31, 2010, and there being no other material weaknesses detected as of March 31, 2010, management can conclude that the internal control over financial reporting was effective as of March 31, 2010.
Changes in Internal Control over Financial Reporting
During the fiscal year ended March 31, 2010, there was no change in our internal control over financial reporting identified in connection with the evaluation required by paragraph (d) of Rule 13a-15 or Rule 15d-15 that has materially affected, or is reasonably likely to materially affect, our internal control over financial reporting.
Inherent Limitations over Internal Controls
Our system of controls is designed to provide reasonable, not absolute, assurance regarding the reliability and integrity of accounting and financial reporting. Management does not expect that our disclosure controls and procedures or our internal control over financial reporting will prevent or detect all errors and all fraud. A control system, no matter how well designed and operated, can provide only reasonable, not absolute, assurance that the objectives of the control system will be met. These inherent limitations include the following:
|
|
·
|
Judgments in decision-making can be faulty, and control and process breakdowns can occur because of simple errors or mistakes.
|
|
|
·
|
Controls can be circumvented by individuals, acting alone or in collusion with each other, or by management override.
|
|
|
·
|
The design of any system of controls is based in part on certain assumptions about the likelihood of future events, and there can be no assurance that any design will succeed in achieving its stated goals under all potential future conditions.
|
|
|
·
|
Over time, controls may become inadequate because of changes in conditions or deterioration in the degree of compliance with associated policies or procedures.
|
|
|
·
|
The design of a control system must reflect the fact that resources are constrained, and the benefits of controls must be considered relative to their costs.
|
Because of the inherent limitations in all control systems, no evaluation of controls can provide absolute assurance that all control issues and instances of fraud, if any, have been detected.
40
ON INTERAL CONTROL OVER FINANCIAL REPORTING
To the Board of Directors and Shareholders of Valence Technology, Inc. and subsidiaries, Austin, Texas.
We have audited Valence Technology, Inc. and its subsidiaries’ (the “Company”) internal control over financial reporting as of , based on criteria established in Internal Control – Integrated Framework issued by the Committee of Sponsoring Organizations of the Treadway Commission (COSO). The Company’s management is responsible for maintaining effective internal control over financial reporting and for its assessment of the effectiveness of internal control over financial reporting, included in the accompanying Management’s Report on Internal Control. Our responsibility is to express an opinion on the Company's internal control over financial reporting based on our audit.
We conducted our audit in accordance with the standards of the Public Company Accounting Oversight Board (United States). Those standards require that we plan and perform the audit to obtain reasonable assurance about whether effective internal control over financial reporting was maintained in all material respects. Our audit of internal control over financial reporting included obtaining an understanding of internal control over financial reporting, assessing the risk that a material weakness exists, and testing and evaluating the design and operating effectiveness of internal control based on the assessed risk. Our audit also included performing such other procedures as we considered necessary in the circumstances. We believe that our audit provides a reasonable basis for our opinion.
A company’s internal control over financial reporting is a process designed to provide reasonable assurance regarding the reliability of financial reporting and the preparation of financial statements for external purposes in accordance with generally accepted accounting principles. A company's internal control over financial reporting includes those policies and procedures that (1) pertain to the maintenance of records that, in reasonable detail, accurately and fairly reflect the transactions and dispositions of the assets of the company; (2) provide reasonable assurance that transactions are recorded as necessary to permit preparation of financial statements in accordance with generally accepted accounting principles, and that receipts and expenditures of the company are being made only in accordance with authorizations of management and directors of the company; and (3) provide reasonable assurance regarding prevention or timely detection of unauthorized acquisition, use, or disposition of the company's assets that could have a material effect on the financial statements.
Because of its inherent limitations, internal control over financial reporting may not prevent or detect misstatements. Also, projections of any evaluation of effectiveness to future periods are subject to the risk that the controls may become inadequate because of changes in conditions, or that the degree of compliance with the policies or procedures may deteriorate.
In our opinion, management’s assessment that the Company maintained effective internal control over financial reporting as of , is fairly stated, in all material respects, based on the criteria established in Internal Control - Integrated Framework issued by COSO.
We have also audited, in accordance with the standards of the Public Company Accounting Oversight Board (United States), the consolidated financial statements as of and for the year ended , of the Company and our report dated June 14, 2010 expressed an unqualified opinion on those consolidated financial statements and included an explanatory paragraph concerning substantial doubt about the Company's ability to continue as a going concern on those consolidated financial statements.
PMB Helin Donovan, LLP
Austin, Texas
June 14, 2010
41
None.
The information required by this item is incorporated by reference to our definitive proxy statement, which will be filed no later than July 29, 2010.
The information required by this item is incorporated by reference to our definitive proxy statement, which will be filed no later than July 29, 2010.
ITEM 11. SECURITY OWNERSHIP OF CERTAIN BENEFICIAL OWNERS AND MANAGEMENT AND RELATED STOCKHOLDER MATTERS.
The information required by this item is incorporated by reference to our definitive proxy statement, which will be filed no later than July 29, 2010.
Certain information regarding related party transactions may be found in “Management’s Discussion and Analysis of Financial Condition and Results of Operations — Related Party Transactions” pursuant to Financial Reporting Release No. 61, “Commission Statement about Management’s Discussion and Analysis of Financial Condition and Results of Operations.”
In addition, the information required by this item is incorporated by reference to our definitive proxy statement, which will be filed no later than July 29, 2010.
The information required by this item is incorporated by reference to our definitive proxy statement, which will be filed no later than July 29, 2010.
(a) The following documents are filed as part of this report:
(1) Financial Statements:
The following consolidated financial statements of Valence Technology, Inc. and Subsidiaries contained under Item 7 of this Annual Report on Form 10-K are incorporated herein by reference:
Consolidated Balance Sheets as of March 31, 2010 and 2009, Consolidated Statements of Operations and Comprehensive Loss for the years ended March 31, 2010, 2009, and 2008, Consolidated Statements of Stockholders’ Deficit for the years ended March 31, 2010, 2009, and 2008, and Consolidated Statements of Cash Flows for the years ended March 31, 2010, 2009, and 2008.
(2) Financial Statement Schedules:
All financial statement schedules have been omitted because they are not applicable or are not required, or because the information required to be set forth therein is included in the Consolidated Financial Statements or Notes thereto.
42
(3) Exhibits:
The following exhibits are included as part of this filing and incorporated herein by this reference:
|
Number
|
Description of Exhibit
|
Method of Filing
|
|
3.1
|
Second Restated Certificate of Incorporation of the Company
|
Incorporated by reference to the exhibit so described in the Company’s Registration Statement on Form S-1 (File No. 33-46765), as amended, filed with the Securities and Exchange Commission on March 27, 1992.
|
||
|
3.2
|
Amendment to the Second Restated Certificate of Incorporation of the Company
|
Incorporated by reference to the exhibit so described in the Company’s Schedule 14A filed with the Securities and Exchange Commission on January 28, 2000.
|
||
|
3.3
|
Certificate of Designations, Preferences and Rights of Series C-1 Convertible Preferred Stock
|
Incorporated by reference to the exhibit so described in the Company’s Current Report on Form 8-K dated November 30, 2004, filed with the Securities and Exchange Commission on December 1, 2004.
|
||
|
3.4
|
Certificate of Designations, Preferences and Rights of Series C-2 Convertible Preferred Stock
|
Incorporated by reference to the exhibit so described in the Company’s Current Report on Form 8-K dated November 30, 2004, filed with the Securities and Exchange Commission on December 1, 2004.
|
||
|
3.5
|
Fourth Amended and Restated Bylaws of the Company
|
Incorporated by reference to the exhibit so described in the Company’s Current Report on Form 8-K, dated January 18, 2008, filed with the Securities and Exchange Commission on January 22, 2008.
|
||
|
4.1
|
Loan Agreement between the Company and Baccarat Electronics, Inc., dated July 17, 1990
|
Incorporated by reference to the exhibit so described in the Company’s Registration Statement on Form S-1 (File No. 33-46765), as amended, filed with the Securities and Exchange Commission on March 27, 1992.
|
||
|
4.2
|
Amendment No. 1 to Loan Agreement between the Company and Baccarat Electronics, Inc., dated March 15, 1991 (subsequently transferred to Berg & Berg Enterprises, LLC)
|
Incorporated by reference to the exhibit so described in the Company’s Registration Statement on Form S-1 (File No. 33-46765), as amended, filed with the Securities and Exchange Commission on March 27, 1992.
|
||
|
4.3
|
Amendment No. 2 to Loan Agreement between the Company and Baccarat Electronics, Inc., dated March 24, 1992 (subsequently transferred to Berg & Berg Enterprises, LLC)
|
Incorporated by reference to the exhibit so described in the Company’s Registration Statement on Form S-1 (File No. 33-46765), as amended, filed with the Securities and Exchange Commission on March 27, 1992.
|
||
|
4.4
|
Amendment No. 3 to Loan Agreement between the Company and Baccarat Electronics, Inc., dated August 17, 1992 (subsequently transferred to Berg & Berg Enterprises, LLC)
|
Incorporated by reference to the exhibit so described in the Company’s Registration Statement on Form S-1 (File No. 33-46765), as amended, filed with the Securities and Exchange Commission on March 27, 1992.
|
||
|
4.5
|
Amendment No. 4 to Loan Agreement between the Company and Baccarat Electronics, Inc., dated September 1, 1997 (subsequently transferred to Berg & Berg Enterprises, LLC)
|
Incorporated by reference to the exhibit so described in the Company’s Annual Report on Form 10-K for the fiscal year ended March 31, 2003, filed with the Securities and Exchange Commission on June 30, 2003.
|
||
|
4.6
|
Amendment No. 5 to Loan Agreement between the Company and Baccarat Electronics, Inc., dated July 17, 1998 (subsequently transferred to Berg & Berg Enterprises, LLC)
|
Incorporated by reference to the exhibit so described in the Company’s Current Report on Form 8-K dated July 27, 1998, and filed with the Securities and Exchange Commission on August 4, 1998.
|
||
|
4.7
|
Amendment No. 6 to Loan Agreement between the Company and Baccarat Electronics, Inc., dated November 27, 2000 (subsequently transferred to Berg & Berg Enterprises LLC)
|
Incorporated by reference to the exhibit so described in the Company’s Annual Report on Form 10-K for the fiscal year ended March 31, 2003, filed with the Securities and Exchange Commission on June 30, 2003.
|
43
|
Number
|
Description of Exhibit
|
Method of Filing
|
|
4.8
|
Second Amended Promissory Note dated November 27, 2000 issued by the Company to Baccarat Electronics, Inc. (subsequently transferred to Berg & Berg Enterprises, LLC)
|
Incorporated by reference to the exhibit so described in the Company’s Current Report on Form 8-K dated December 11, 1998, and filed with the Securities and Exchange Commission on December 21, 1998.
|
||
|
4.9
|
Amendment No. 7 to Original Loan Agreement between the Company and Berg & Berg Enterprises, LLC (previously with Baccarat Electronics, Inc.), dated October 10, 2001
|
Incorporated by reference to the exhibit so described in the Company’s Quarterly Report on Form 10-Q for the fiscal quarter ended December 31, 2001, and filed with the Securities and Exchange Commission on February 19, 2002.
|
||
|
4.10
|
Amendment No. 8 to Original Loan Agreement and Amendment to Second Amended Promissory Note between the Company and Berg & Berg Enterprises, LLC (previously with Baccarat Electronics, Inc.), dated February 11, 2002
|
Incorporated by reference to the exhibit so described in the Company’s Annual Report on Form 10-K for the fiscal year ended March 31, 2002, filed with the Securities and Exchange Commission on July 1, 2002.
|
||
|
4.11
|
Loan Agreement dated October 5, 2001 between the Company and Berg & Berg Enterprises, LLC
|
Incorporated by reference to the exhibit so described in the Company’s Quarterly Report on Form 10-Q for the fiscal quarter ended December 31, 2001, and filed with the Securities and Exchange Commission on February 19, 2002.
|
||
|
4.12
|
Security Agreement dated October 5, 2001 between the Company and Berg & Berg Enterprises, LLC
|
Incorporated by reference to the exhibit so described in the Company’s Quarterly Report on Form 10-Q for the fiscal quarter ended December 31, 2001, and filed with the Securities and Exchange Commission on February 19, 2002.
|
||
|
4.13
|
Promissory Note dated October 5, 2001 issued by the Company to Berg & Berg Enterprises, LLC
|
Incorporated by reference to the exhibit so described in the Company’s Quarterly Report on Form 10-Q for the fiscal quarter ended December 31, 2001, and filed with the Securities and Exchange Commission on February 19, 2002.
|
||
|
4.14
|
Amendment to Loan Agreements with Berg & Berg dated November 8, 2002 (Amendment No. 1 to October 5, 2001 Loan Agreement and Amendment No. 9 to 1990 Baccarat Loan Agreement)
|
Incorporated by reference to the exhibit so described in the Company’s Quarterly Report on Form 10-Q for the fiscal quarter ended September 30, 2002, filed with the Securities and Exchange Commission on November 14, 2002.
|
||
|
4.15
|
Amendment to Loan Agreements with Berg & Berg dated October 21, 2004 (Amendment No. 2 to October 5, 2001 Loan Agreement and Amendment No. 10 to 1990 Baccarat Loan Agreement)
|
Incorporated by reference to the exhibit so described in the Company’s Current Report on Form 8-K, dated November 3, 2004, filed with the Securities and Exchange Commission on November 5, 2004.
|
||
|
4.16
|
Amendment No. 11 and Amendment No. 3 to Loan Agreements, dated as of July 1, 2005
|
Incorporated by reference to the exhibit so described in the Company’s Current Report on Form 8-K, dated July 1, 2005, filed with the Securities and Exchange Commission on July 6, 2005.
|
||
|
4.17
|
Amendment No. 12 and Amendment No. 4 to Loan Agreements, dated as of July 13, 2005
|
Incorporated by reference to the exhibit so described in the Company’s Current Report on Form 8-K, dated July 13, 2005, filed with the Securities and Exchange Commission on July 15, 2005.
|
||
|
4.18
|
Amendment No. 13 and Amendment No. 5 to Loan Agreements, dated as of June 12, 2008
|
Incorporated by reference to the exhibit so described in the Company’s Current Report on Form 8-K, dated June 12, 2008, filed with the Securities and Exchange Commission on June 16, 2008.
|
44
|
Number
|
Description of Exhibit
|
Method of Filing
|
|
4.19
|
(Omnibus) Amendment No. 14 to Loan Agreement dated July 17, 1990 between the Company and Baccarat Electronics, Inc. (subsequently transferred to Berg & Berg Enterprises, LLC) and Amendment No. 6 to Loan Agreement dated October 5, 2001 between the Company and Berg & Berg Enterprises, LLC, each dated as of October 13, 2009
|
Incorporated by reference to the exhibit so described in the Company’s Current Report on Form 8-K, dated October 13, 2009, filed with the Securities and Exchange Commission on October 14, 2009.
|
||
|
4.20
|
Registration Rights Agreement with West Coast Venture Capital, Inc. (the 1981 Kara Ann Berg Trust) dated January 13, 2001
|
Incorporated by reference to the exhibit so described in the Company’s Annual Report on Form 10-K for the fiscal year ended March 31, 2001, filed with the Securities and Exchange Commission on July 2, 2001.
|
||
|
4.21
|
Warrant dated January 4, 2002 to Berg & Berg Enterprises, LLC
|
Incorporated by reference to the exhibit so described in the Company’s Quarterly Report on Form 10-Q for the fiscal quarter ended December 31, 2001, filed with the Securities and Exchange Commission on February 19, 2002.
|
||
|
4.22
|
Warrant to Purchase Common Stock, issued June 2, 2003 to Riverview Group LLC
|
Incorporated by reference to the exhibit so described in the Company’s Current Report on Form 8-K dated June 2, 2003, and filed with the Securities and Exchange Commission on June 3, 2003.
|
||
|
4.23
|
Securities Purchase Agreement, dated November 30, 2004 between Valence Technology, Inc. and Riverview Group LLC
|
Incorporated by reference to the exhibit so described in the Company’s Current Report on Form 8-K dated November 30, 2004, filed with the Securities and Exchange Commission on December 1, 2004.
|
||
|
4.24
|
Amendment and Exchange Agreement, dated November 30, 2004 between Valence Technology, Inc. and Riverview Group LLC
|
Incorporated by reference to the exhibit so described in the Company’s Current Report on Form 8-K dated November 30, 2004, filed with the Securities and Exchange Commission on December 1, 2004.
|
||
|
4.25
|
Assignment Agreement, dated July 14, 2005, by and between Valence Technology, Inc. and Berg & Berg Enterprises, LLC
|
Incorporated by reference to the exhibit so described in the Company’s Current Report on Form 8-K, dated July 13, 2005, filed with the Securities and Exchange Commission on July 15, 2005.
|
||
|
4.26
|
Assignment Agreement, dated December 14, 2005, by and between Valence Technology, Inc. and Berg & Berg Enterprises, LLC
|
Incorporated by reference to the exhibit so described in the Company’s Current Report on Form 8-K, dated December 14, 2005, filed with the Securities and Exchange Commission on December 16, 2005.
|
||
|
4.27
|
Option Agreement, dated as of July 8, 2005, by and between Valence Technology, Inc. and James R. Akridge
|
Incorporated by reference to the exhibit so described in the Company’s Current Report on Form 8-K, dated July 15, 2005, filed with the Securities and Exchange Commission on July 18, 2005.
|
||
|
4.28
|
Loan Agreement dated July 13, 2005, by and between Valence Technology, Inc. and SFT I, Inc.
|
Incorporated by reference to the exhibit so described in the Company’s Current Report on Form 8-K, dated July 13, 2005, filed with the Securities and Exchange Commission on July 15, 2005.
|
||
|
4.29
|
Registration Rights Agreement dated July 13, 2005 by and between Valence Technology, Inc. and SFT I, Inc.
|
Incorporated by reference to the exhibit so described in the Company’s Current Report on Form 8-K, dated July 13, 2005, filed with the Securities and Exchange Commission on July 15, 2005.
|
||
|
4.30
|
Warrant to Purchase Common Stock, issued July 13, 2005 (SFT I, Inc.)
|
Incorporated by reference to the exhibit so described in the Company’s Current Report on Form 8-K, dated July 13, 2005, filed with the Securities and Exchange Commission on July 15, 2005.
|
45
|
Number
|
Description of Exhibit
|
Method of Filing
|
|
4.31
|
Warrant to Purchase Common Stock, issued July 13, 2005 (Berg & Berg Enterprises, LLC)
|
Incorporated by reference to the exhibit so described in the Company’s Current Report on Form 8-K, dated July 13, 2005, filed with the Securities and Exchange Commission on July 15, 2005.
|
||
|
4.32
|
Amendment No. 2 to Loan and Security Agreement and Other Loan Documents dated March 30, 2010 by and among Valence Technology, Inc., Carl Berg and iStar Tara LLC, successor in interest to SFT 1, Inc.
|
Incorporated by reference to the exhibit so described in the Company’s Current Report on Form 8-K, dated April 5, 2010, filed with the Securities and Exchange Commission on April 5, 2010.
|
||
|
4.33
|
Warrant to Purchase Common Stock of Valence Technology, Inc. dated March 30, 2010 and issued to iStar Tara LLC
|
Incorporated by reference to the exhibit so described in the Company’s Current Report on Form 8-K, dated April 5, 2010, filed with the Securities and Exchange Commission on April 5, 2010.
|
||
|
4.34
|
At Market Issuance Sales Agreement, dated February 22, 2008, by and between Valence Technology, Inc. and Wm Smith & Co.
|
Incorporated by reference to the exhibit so described in the Company’s Current Report on Form 8-K, dated February 22, 2008, filed with the Securities and Exchange Commission on February 22, 2008.
|
||
|
4.35
|
Amendment No. 1 to At Market Issuance Sales Agreement, dated July 2, 2009, by and between Valence Technology, Inc. and Wm Smith & Co.
|
Incorporated by reference to the exhibit so described in the Company’s Current Report on Form 8-K, dated July 6, 2009, filed with the Securities and Exchange Commission on July 6, 2009.
|
||
|
4.36
|
Common Stock Purchase Agreement dated October 14, 2009 by and between Valence Technology, Inc. and Seaside 88, LP
|
Incorporated by reference to the exhibit so described in the Company’s Current Report on Form 8-K, dated October 15, 2009, filed with the Securities and Exchange Commission on October 15, 2009.
|
||
|
4.37
|
Letter Agreement, dated February 22, 2010, by and between Valence Technology, Inc. and Berg & Berg Enterprises, LLC
|
Incorporated by reference to the exhibit so described in the Company’s Current Report on Form 8-K, dated February 24, 2010, filed with the Securities and Exchange Commission on February 24, 2010.
|
||
|
10.1
|
Supply Agreement dated February 6, 2008 by and between The Tanfield Group PLC and Valence Technology, Inc (portions of this contract have been omitted pursuant to a request for confidential treatment)
|
Incorporated by reference to the exhibit so described in the Company’s Current Report on Form 8-K, dated February 6, 2008, filed with the Securities and Exchange Commission on February 12, 2008.
|
||
|
10.2
|
Letter Agreement, effective March 13, 2007, by and between Valence Technology, Inc. and Robert L. Kanode
|
Incorporated by reference to the exhibit so described in the Company’s Current Report on Form 8-K, dated March 13, 2007, filed with the Securities and Exchange Commission on March 14, 2007.
|
||
|
10.3
|
Employment Letter Agreement, dated October 1, 2008, by and between Valence Technology, Inc. and Ross A. Goolsby
|
Incorporated by reference to the exhibit so described in the Company’s Current Report on Form 8-K, dated October 1, 2008, filed with the Securities and Exchange Commission on October 1, 2008.
|
||
|
10.4
|
Employment Letter Agreement dated October 30, 2008, by and between Valence Technology Inc., and Koon Cheng Lim.
|
Incorporated by reference to the exhibit so described in the Company’s Current Report on Form 8-K, dated November 4, 2008, filed with the Securities and Exchange Commission on November 4, 2008.
|
||
|
10.5
|
Employment Letter Agreement by and between Valence Technology, Inc. and Randall J. Adleman.
|
Incorporated by reference to the exhibit so described in the Company’s Current Report on Form 8-K, effective March 1, 2010, filed with the Securities and Exchange Commission on February 17, 2010.
|
||
|
10.6
|
1990 Stock Option Plan as amended on October 3, 1997
|
Incorporated by reference to the exhibit so described in the Company’s Registration Statement on Form S-8 (File No 333-43203) filed with the Securities and Exchange Commission on December 24, 1997.
|
46
|
Number
|
Description of Exhibit
|
Method of Filing
|
|
10.7
|
1996 Non-Employee Directors’ Stock Option Plan as amended on October 3, 1997
|
Incorporated by reference to the exhibit so described in the Company’s Registration Statement on Form S-8 (File No. 333-74595) filed with the Securities and Exchange Commission on March 17, 1999.
|
||
|
10.8
|
Valence Technology, Inc. Amended and Restated 2000 Stock Option Plan
|
Incorporated by reference to the exhibit so described in the Company’s Registration Statement on Form S-8 (File No. 333-101708) filed with the Securities and Exchange Commission on December 6, 2002.
|
||
|
10.9
|
Valence Technology, Inc. 2009 Equity Incentive Plan
|
Incorporated by reference to the exhibit so described in the Company’s Current Report on Form 8-K, dated May 6, 2009, filed with the Securities and Exchange Commission on May 6, 2009.
|
||
|
10.10
|
Form of Indemnification Agreement entered into between the Company and its Directors and Officers
|
Incorporated by reference to the exhibit so described in the Company’s Current Report on Form 8-K, dated May 6, 2009, filed with the Securities and Exchange Commission on May 6, 2009.
|
||
|
21.1
|
List of subsidiaries of the Company
|
Filed herewith.
|
||
|
23.1
|
Consent of PMB Helin Donovan, LLP, an Independent Registered Public Accounting Firm
|
Filed herewith.
|
||
|
24.1
|
Power of Attorney
|
Included in signature page.
|
||
|
31.1
|
Certification of Robert L. Kanode, Principal Executive Officer, pursuant to Rule 13a-14 and 15d-14 of the Securities Exchange Act of 1934
|
Filed herewith.
|
||
|
31.2
|
Certification of Ross A. Goolsby, Principal Financial Officer, pursuant to Rule 13a-14 and 15d-14 of the Securities Exchange Act of 1934
|
Filed herewith.
|
||
|
32.1
|
Certification of Robert L. Kanode, Principal Executive Officer, pursuant to 18 U.S.C. Section 1350, as adopted pursuant to Section 906 of the Sarbanes-Oxley Act of 2002
|
Filed herewith.
|
||
|
32.2
|
Certification of Ross A. Goolsby, Principal Financial Officer, pursuant to 18 U.S.C. Section 1350, as adopted pursuant to Section 906 of the Sarbanes-Oxley Act of 2002
|
Filed herewith.
|
47
Pursuant to the requirements of Section 13 or 15(d) of the Securities Exchange Act of 1934, as amended, Registrant has duly caused this report to be signed on its behalf by the undersigned, thereunto duly authorized.
VALENCE TECHNOLOGY, INC.
|
Dated: June 14, 2010
|
||
|
/s/ Robert L. Kanode
|
||
|
Robert L. Kanode
|
||
|
President and Chief Executive Officer
|
||
48
POWER OF ATTORNEY
Each person whose signature appears below constitutes and appoints Robert L. Kanode and Ross A. Goolsby, and each of them, as his true and lawful attorneys-in-fact and agents with full power of substitution and resubstitution, for him and his name, place and stead, in any and all capacities, to sign any or all amendments to this Annual Report on Form 10-K and to file the same, with all exhibits thereto, and other documents in connection therewith, with the Securities and Exchange Commission, granting unto said attorneys-in-fact and agents, and each of them, full power and authority to do and perform each and every act and thing requisite and necessary to be done in and about the foregoing, as fully to all intents and purposes as he might or could do in person, hereby ratifying and confirming all that said attorneys-in-fact and agents, or either of them, or their substitutes, may lawfully do or cause to be done by virtue hereof.
Pursuant to the requirements of the Securities Exchange Act of 1934, as amended, this report has been signed below by the following persons on behalf of Registrant and in the capacities and on the dates indicated.
|
Name
|
Position
|
Date
|
||
|
/s/ Robert L. Kanode
|
President and Chief Executive Officer
|
June 14, 2010
|
||
|
Robert L. Kanode
|
(Principal Executive Officer) and Director
|
|||
|
/s/ Ross A. Goolsby
|
Chief Financial Officer (Principal Financial
|
June 14, 2010
|
||
|
Ross A. Goolsby
|
and Accounting Officer)
|
|||
|
/s/ Carl E. Berg
|
Director and Chairman of the Board
|
June 14, 2010
|
||
|
Carl E. Berg
|
||||
|
/s/ Vassilis G. Keramidas
|
Director
|
June 14, 2010
|
||
|
Vassilis G. Keramidas
|
||||
|
/s/ Donn Tognazzini
|
Director
|
June 14, 2010
|
||
|
Donn Tognazzini
|
||||
|
/s/ Bert C. Roberts, Jr.
|
Director
|
June 14, 2010
|
||
|
Bert C. Roberts, Jr.
|
49