Attached files
| file | filename |
|---|---|
| 8-K - FORM 8-K - CYS Investments, Inc. | d8k.htm |
 Investment Outlook
June, 2010
Kevin E. Grant, CFA
President & CEO
Exhibit 99.1 |
 1
Forward Looking Statements
This presentation contains forward-looking statements, within the meaning of
Section 27A of the Securities Act of 1933, as amended, and Section 21E of
the Securities Exchange Act of 1934, as amended, that are based on management’s beliefs
and assumptions, current expectations, estimates and projections. Such statements,
including information relating to the Company’s expectations for future
financial performance, are not considered historical facts and are considered forward-looking
information
under
the
federal
securities
laws.
This
information
may
contain
words
such
as
“believes,”
“plans,”
“expects,”
“intends,”
“estimates”
or similar expressions.
This information is not a guarantee of the Company’s future performance and
is subject to risks, uncertainties and other important factors that could
cause the Company’s actual performance or achievements to differ materially from those expressed
or implied by this forward-looking information and include, without limitation,
changes in the market value and yield of our assets, changes in interest
rates and the yield curve, net interest margin, return on equity, availability and terms of financing and hedging
and various other risks and uncertainties related to our business and the
economy. Given these uncertainties, you should not rely on
forward-looking information. The Company undertakes no obligations to update any forward-looking information, whether
as a result of new information, future events or otherwise
|
 2
CYS Overview
Target Assets
Objective
Senior Management
Focus on Cost
Efficiency
Ample Financing
Sources
Dividend Policy
A Real Estate Investment Trust formed in January 2006
Agency Residential Mortgage Backed Securities
Kevin Grant, CEO, President, Chairman
Frances Spark, CFO
Pay dividends and achieve capital appreciation throughout changing interest rate
and credit cycles
Be the most efficient Agency REIT in the market
Currently
financing
lines
with
25
lenders
Swap agreements with 6 counterparties
Company intends to distribute all or substantially all of its REIT taxable
income Scaled Management Fee: 1.0% to 1.5%
No Incentive Fee |
 3
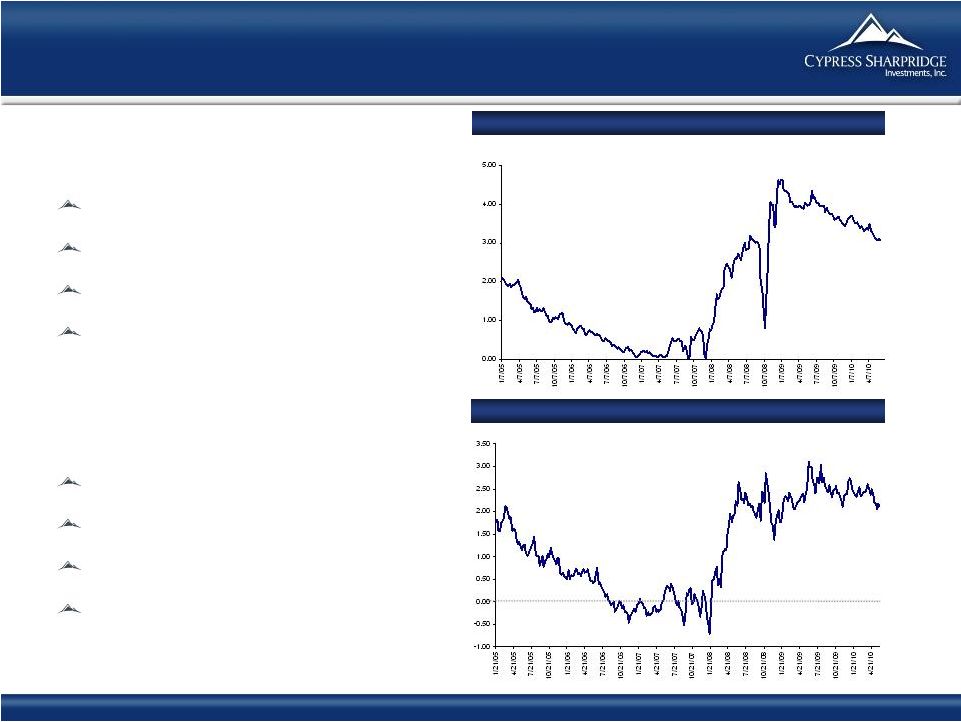
Attractive Environment Likely to Persist
Source: Bloomberg.
(1) As of June 4, 2010
5/1 Hybrid
Net
Interest
Margin:
1/05
–
6/10
6/4/10
5 Year Swap vs 1 Month
LIBOR:
1/05
–
6/10
6/4/10
Mortgage Yields Currently Attractive
Par-Priced
5/1
hybrid
rates
now
3.50
(1)
30
Year
fixed
rates
now
4.30%
(1)
15
Year
fixed
rates
now
3.60%
(1)
Hedging costs remain reasonable
Steep Curve
Creates significant positive carry
Significant ROE
Hedge flexibility very important
No signs of inflation |
 4
0.000
0.500
1.000
1.500
2.000
2.500
3.000
3.500
4.000
4.500
5.000
Wide Spreads Create Good Environment
Source: Bloomberg.
Note: Spreads
calculated
as:
(i)
5/1
Hybrids
Index
–
50/50
3-Year
Swaps/LIBOR,
and
(ii)
5/1
Hybrids
Index
–
1-Month
LIBOR
Index.
5/1
Hybrids
Hedged
with
Swaps:
1/05
–
6/10
Simple “Carry
Trade”
Borrow Short/
Lend Long
Hedged Hybrids
(i)
Unhedged Hybrids
(ii)
6/4/10
CYS
Investment Strategy |
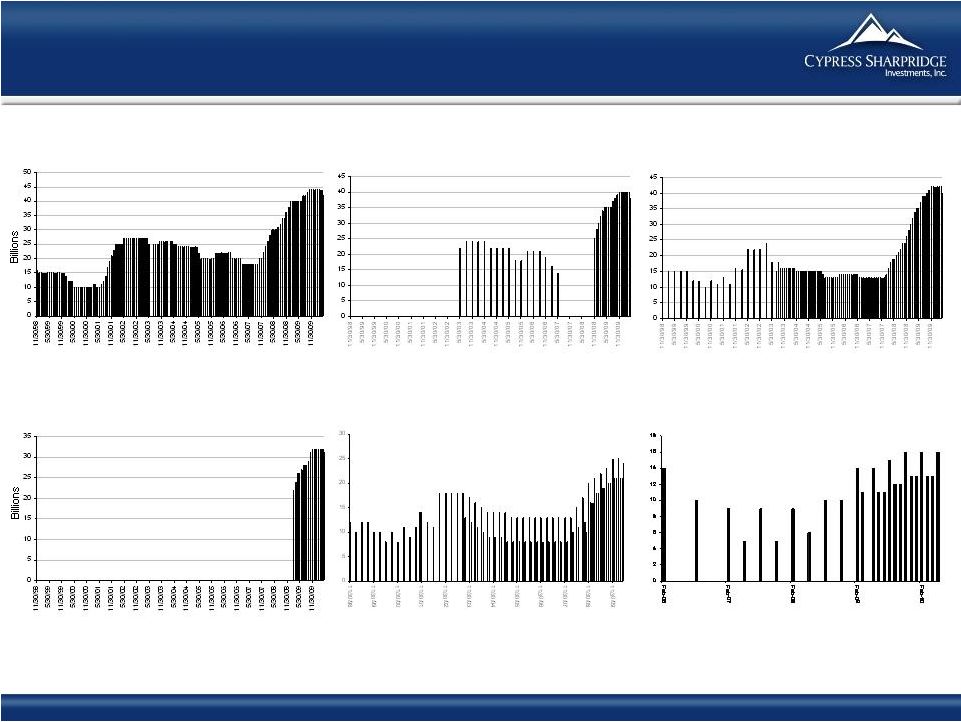 10
Year Treasury Note Auctions 11/98 –
5/10
Treasury Auction Volume Exploding
2 Year Treasury Note Auctions
2/00 –
5/10
3 Year Treasury Note Auctions
2/00 –
5/10
Source: Bloomberg, US Treasury
5 Year Treasury Note Auctions
2/00 –
5/10
7 Year Treasury Note Auctions
2/00 –
5/10
30 Year Treasury Note Auctions
2/00 –
5/10
5 |
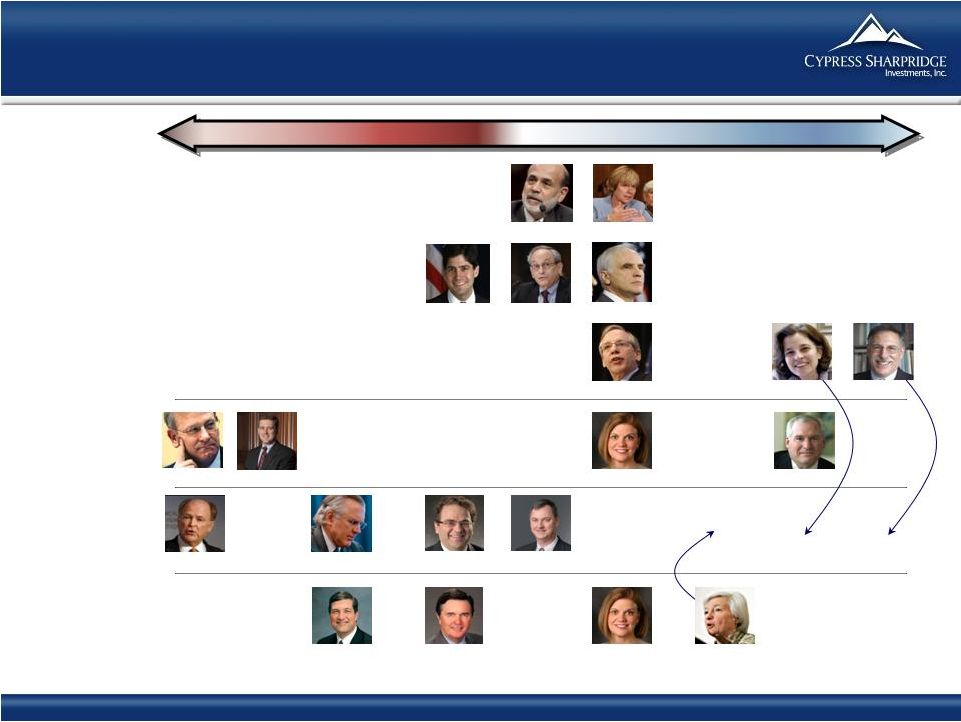 Fed
Board to Become More Dovish Hawkish
Dovish
Neutral
Hoenig
Bullard
Plosser
Fisher
Lacker
Duke
Tarullo
Evans
Dudley
Pianalto
Warsh
Kohn
Kocherlakota
Lockhart
Pianalto
Yellen
Rosengren
Raskin
Diamond
Bernanke
Obama Nominees
Governors
2010 Voters
2011 Voters
2012 Voters
6
Source: Bank of America Merrill Lynch, Bloomberg, Wall Street Journal, Indiana University,
Marketwatch, Thomson Reuters, Federal Reserve Bank of Atlanta, Federal Reserve Bank of Chicago,
Federal Reserve Bank of Cleveland, Maryland Consumer Rights Coalition, Boston Globe, Businessweek, Newsweek, Washington Post, CNBC.
|
 7
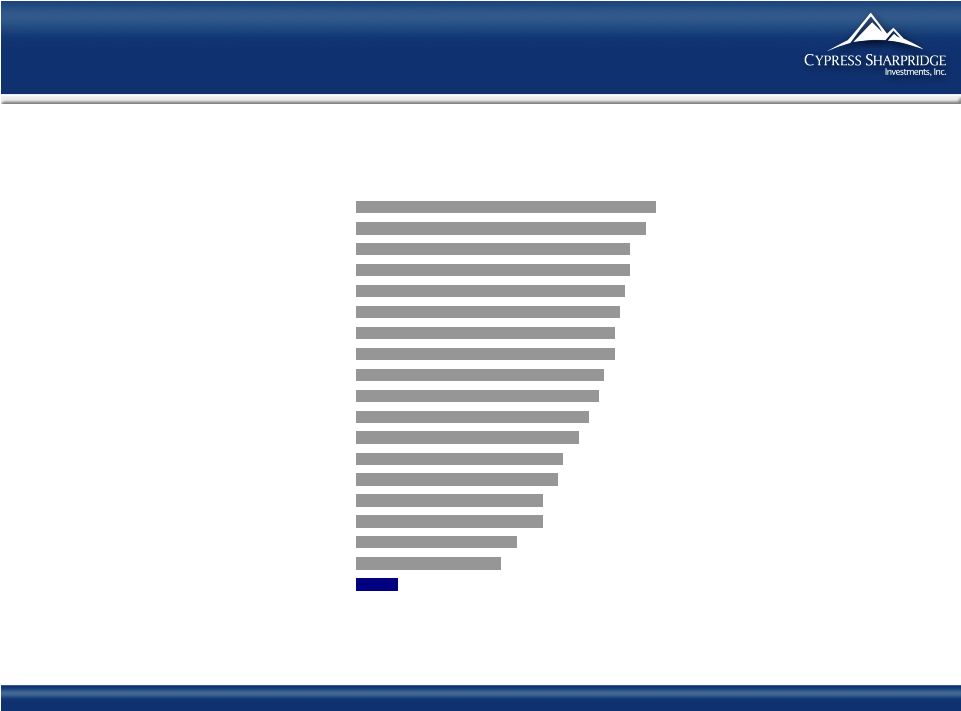
The Next 30 (78?) Months…
Cabinet Appointees with Private Sector Experience
¹
Source: JP Morgan Global Wealth Management
8%
28%
31%
36%
36%
39%
40%
43%
45%
47%
48%
50%
50%
51%
52%
53%
53%
56%
58%
Obama
Kennedy
Carter
T. Roosevelt
Clinton
Taft
Hoover
Ford
Johnson
Coolidge
Harding
F.D. Roosevelt
Truman
Wilson
G.H.W. Bush
Nixon
G.W. Bush
Reagan
Eisenhower
1
Secretaries of State, Commerce, Treasury, Agriculture, Interior, Labor, Transportation, Energy,
Housing and Urban Development |
 8
Economic Recovery Below Normal Pace
S&P/Case-Shiller U.S. National Home Price Indices
1988 –
Present
% Change -
Year to Year
Capacity Utilization: Manufacturing
1968 –
Present
%
Unemployment Rate
1940-present
%
Source: S&P, Fiserv, and Macromarkets LLC / Haver Analytics, BLS |
 9
Portfolio Characteristics
CYS Portfolio Characteristics
Source: Company data as of March 31, 2010; Bloomberg
(1)
Months to reset
(2)
Q1 2010
(3)
Interest Only loans
Par Value
Asset Type
(in thousands)
Cost
Price
MTR
1
Coupon
CPR
2
I/O Loans
3
Short Reset ARMs
203,252
$
101.35
$
104.10
$
10.0
3.9%
29.6%
50.0%
Hybrid ARMs
472,427
101.03
104.31
47.6
4.4%
32.8%
60.0%
Fixed Rate
1,055,675
101.58
103.22
NA
4.5%
12.3%
1.2%
Total/Weighted-Average
1,731,354
$
101.40
$
103.62
$
36.3
4.4%
22.0%
23.0%
Interest Rate Swaps
740mm
2.4 Year
2.03%
Weighted Average |
 10
CYS Exposure to FNMA/FHLMC Buyouts: Very Limited
FNMA 120 Day Delinquency Buckets
; Company data as of March 31, 2010
Per March 1 2010 FNMA Press Release
CYS Exposure
MBS Product
Year of
Issuance
Coupon <
4.5%
4.5% -
5%
5% -
5.5%
5.5% -
6%
6 -
6.5%
Face Value
(millions)
% of Total
Assets
Implied
Reinvestment Need
(millions)
30 Year (CL-prefix)
2009
0.02%
0.03%
0.17%
0.60%
1.59%
-
2008
1.33%
0.78%
1.81%
3.43%
7.07%
22
1.2%
1.56
2007
2.39%
3.22%
4.87%
6.52%
11.03%
-
2006
4.91%
2.74%
4.70%
6.72%
9.40%
-
2005
2.32%
1.99%
3.47%
5.72%
10.57%
-
15 & 10 Year (CI & CN-prefixes)
2009
0.01%
0.04%
0.13%
0.19%
0.46%
452
25.0%
0.16
2008
0.38%
0.35%
0.55%
0.83%
1.69%
44
2.4%
0.37
2007
1.44%
1.11%
1.34%
1.84%
3.04%
-
2006
1.24%
1.85%
1.67%
2.43%
3.62%
-
2005
0.86%
1.09%
1.60%
2.97%
5.72%
-
Interest Only
2009
0.00%
0.00%
0.55%
0.63%
0.93%
2008
0.00%
7.36%
5.09%
8.31%
13.22%
2007
0.00%
5.39%
13.08%
15.72%
22.56%
13
0.7%
2.93
2006
0.00%
2.08%
7.78%
12.75%
18.40%
2005
0.00%
6.80%
5.48%
10.00%
14.15%
ARMs: Amortizing
2009
0.03%
0.50%
1.02%
0.00%
0.00%
142
7.9%
0.04
2008
1.91%
3.73%
5.36%
9.62%
36.05%
22
1.2%
1.18
2007
2.76%
4.53%
11.29%
13.37%
11.94%
-
2006
29.09%
7.44%
10.96%
15.03%
21.08%
-
2005
16.19%
7.83%
9.87%
17.28%
6.60%
-
2004 and earlier
4.46%
4.20%
4.76%
7.57%
1.59%
98
5.4%
4.37
ARMs: Interest Only
2009
0.06%
0.16%
0.86%
5.61%
0.00%
166
9.2%
0.10
2008
6.22%
5.24%
6.54%
10.14%
18.74%
-
2007
10.20%
13.84%
17.45%
25.22%
32.25%
45
2.5%
11.35
2006
20.86%
11.23%
14.58%
21.36%
29.71%
30
1.7%
6.41
2005
14.41%
12.37%
12.86%
25.11%
12.95%
32
1.8%
3.96
2004 and earlier
8.55%
6.71%
6.24%
15.80%
11.51%
5
0.3%
0.43
-
-
-
-
$
$
Source: FNMA March 1 2010 Press Release, CYS Investments, Inc. refer to:
http://WWW.fanniemae.com/newsreleases/2010/4960.jhtml
|
 11
Attractive Repo Market Dynamics
Money Market Funds Awash in Cash
Assets remain very high
Flight to quality on asset mix
Agency RMBS a major beneficiary
Source: Bloomberg. Market data as of June 4, 2010.
LIBOR
vs
Fed
Funds:
10/07
–
6/10
Money
Market
Fund
Assets:
8/01
-
6/10
Lower Spreads Reduce Funding Costs and
Improved Availability
TARP
TSLF and TALF
Fed funds target rate: 0 to 0.25%
6/7/10
($ in billions)
(%)
6/4/10 |
 12
Non-Agency Legacy Assets Recovering
Source: Company data as of March 31, 2010.
CYS’
CLO & RESIX Securities
CLO Market has improved
Non-Agency assets represent approximately 74 cents of Book Value
Q1 Market appreciation of $4.5mm or 24 cents of Book Value
CLO Cash Distributions expected to resume
RESIX securities likely to be extinguished
Market
Value
NAV at
Market
(per share)
NAV
at Face Value
(per share)
Remaining
Life
CLO
$13.8 MM
$0.73
$1.75
8.3 years
RESIX
$0.1 MM
$0.01
$0.31
28.1 years
Total
$13.9 MM
$0.74
$2.06 |
 13
History of Transparent and Consistent
Financial Reporting
CYS uses Financial Reporting for Investment Companies
CYS
financial
reporting
–
Best
in
Class
Schedule of investments
NAVs
have reflected mark-to-market accounting since inception
No OCI account on balance sheet
Realized and unrealized losses taken through income statement
Losses expensed in period incurred
Competitors likely to move closer to CYS’
financial reporting standards
when FASB declares SOP 07-1 effective
Potential to create meaningful adjustments for the other companies
|
 14
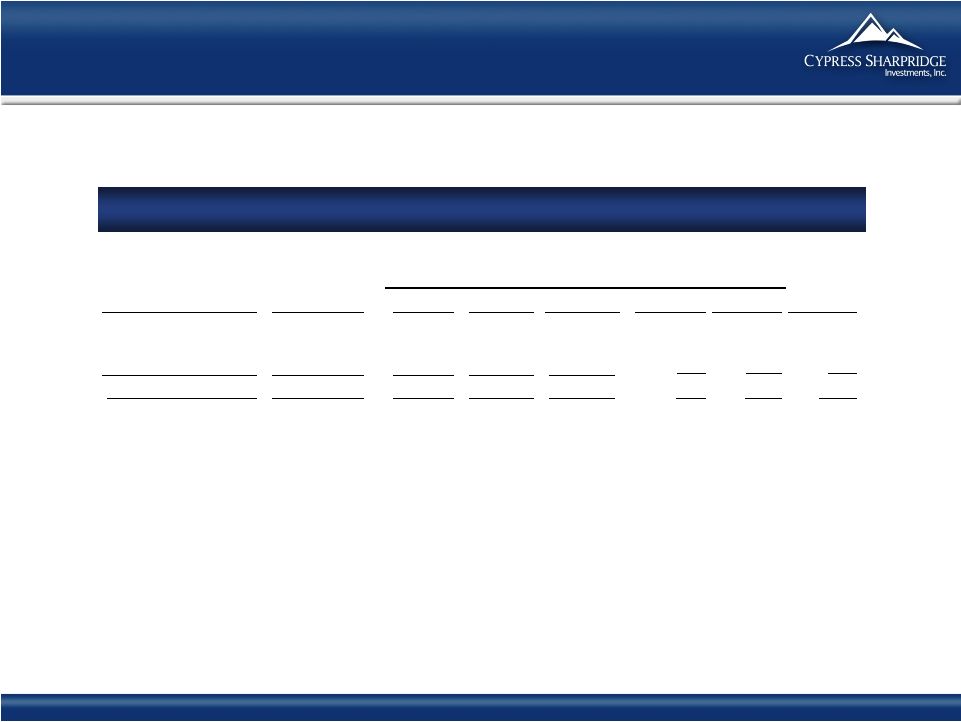
Historical Financials
(1)
Includes interest income on Agency RMBS and non-Agency securities.
(2)
Net
income
excluding
net
realized
gain
(loss)
on
investments
and
swap
contracts
and
net
unrealized
appreciation
(depreciation)
on
investments
and
swap
contracts.
(3)
Calculated
by
dividing
total
interest
income
from
Agency
RMBS
by
average
Agency
RMBS.
(4)
Calculated by dividing total interest expense, including net swap interest income
(expense) by average repurchase agreements. (5)
Calculated by subtracting average cost of funds & hedge from average yield on
Agency RMBS. (6)
Calculated by dividing total liabilities by net assets.
3/31/2010
12/31/2009
Income Statement Data
Investment Income – Interest Income (1)
$16,936.9
$15,767.5
Total expenses
3,217.8
3,102.6
Net Investment Income
13,719.1
12,664.9
Net gain (loss) from investments
6,464.3
(4,320.5)
Net gain (loss) from swap contracts
(10,040.2)
(1,307.5)
Net Income (Loss)
$10,143.2
$7,036.9
Net Income (Loss) Per Common Share (diluted)
$0.54
$0.37
Distributions per Common Share
$0.55
$0.55
Non-GAAP Measure
Core Earnings (2)
$10,424.7
$9,688.0
Non-GAAP Reconciliation
NET INCOME
$10,143.2
$7,036.9
Net (gain) loss from investments
($6,464.3)
$4,320.4
Net unrealized (appreciation) depreciation on swap contracts
$6,745.8
($1,669.3)
Core Earnings
$10,424.7
$9,688.0
Balance Sheet Data
Cash and Cash Equivalents
$775.7
$1,889.7
Total Assets
$1,840,877.9
$1,866,196.3
Repurchase Agreements
$1,487,589.2
$1,372,707.6
Net assets
$244,446.2
$244,291.0
Net assets per common share
$13.03
$13.02
Key Portfolio Statistics
Average Yield on Agency RMBS (3)
3.86%
4.01%
Average Cost of Funds & Hedge (4)
1.14%
1.21%
Interest Rate Spread Net of Hedge (5)
2.72%
2.80%
Leverage Ratio (at period end) (6)
6.5:1
6.6:1
Quarter Ended |
 15
Financial Highlights
Steep yield curve and attractive spreads in target assets
Tailwinds likely to continue
Reinvestment needs relatively low
Non-Agency assets recovering
Investment Company accounting provides transparency |
 16
Kevin E. Grant, CFA
President & CEO
Investment Outlook
June, 2010 |