Attached files
UNITED STATES
SECURITIES AND EXCHANGE COMMISSION
Washington, D.C. 20549
SECURITIES AND EXCHANGE COMMISSION
Washington, D.C. 20549
—————
Form 10-K
—————
Form 10-K
—————
| þ | Annual Report Pursuant to Section 13 or 15(d) of the Securities Exchange Act of 1934. | |
| For the fiscal year ended March 31, 2010 | ||
| or | ||
| o | Transition Report Pursuant to Section 13 or 15(d) of the Securities Exchange Act of 1934. | |
| For the Transition period from ____ to ____. | ||
Commission file number
001-32935
Arcadia Resources, Inc.
(Exact name of registrant as specified in its charter)
Arcadia Resources, Inc.
(Exact name of registrant as specified in its charter)
| NEVADA | 88-0331369 | |
| (State or other jurisdiction of | (I.R.S. Employer I.D. Number) | |
| incorporation or organization) | ||
| 9320 PRIORITY WAY WEST DRIVE | ||
| INDIANAPOLIS, INDIANA | 46240 | |
| (Address of principal executive offices) | (Zip Code) |
Registrant’s telephone number: (317)
569-8234
Securities registered
under Section 12(b) of the Exchange Act: Common Stock, $0.001 par
value.
Securities registered
under Section 12(g) of the Exchange Act: None.
Name of each exchange
on which securities are registered: American Stock Exchange
Indicate by a check
mark if the registrant is a well-known seasoned issuer, as defined in Rule 405
of the Securities Act. Yes o No þ
Indicate by a check
mark if the registrant is not required to file reports pursuant to Section 13 or
Section 15(d) of the Act. Yes o No þ
Indicate by check
mark whether the registrant (1) has filed all reports required to be filed by
Section 13 or 15(d) of the Securities Exchange Act of 1934 during the preceding
12 months (or for such shorter period that the registrant was required to file
such reports), and (2) has been subject to such filing requirements for the past
90 days. Yes þ No o
Indicate by check
mark if disclosure of delinquent filers pursuant to Item 405 of Regulation S-K
(§ 229.405 of this chapter) is not contained herein, and will not be contained,
to the best of registrant’s knowledge, in definitive proxy or information
statements incorporated by reference in Part III of this Form 10-K or any
amendment to this Form 10-K. o
Indicate by check
mark whether the registrant has submitted electronically and posted on its
corporate Web site, if any, every Interactive Data File required to be submitted
and posted pursuant Rule 405 of Regulation S-T during the preceding 12 months
(or for such shorter period that the registrant was required to submit and post
such files), Yes o No o
Indicate by check
mark whether the Registrant is a large accelerated filer, an accelerated filer,
non-accelerated filer or a smaller reporting company (as defined in Exchange Act
Rule 12b-2).
| Large Accelerated filer o | Accelerated filer þ | Non-accelerated filer o | Smaller Reporting Company o |
Indicate by check
mark whether the registrant is a shell company (as defined in Rule 12b-2 of the
Exchange Act). Yes o¨ No þ
The aggregate market
value of the Common Stock held by non-affiliates of the Registrant as of
September 30, 2009 based on $1.12 per share (the last reported sale price of our
Common Stock quoted on the NYSE Amex Exchange), was approximately $115 million.
For purposes of this computation only, all executive officers, directors and 10%
beneficial owners of the Registrant are assumed to be affiliates. This
determination of affiliate status is not necessarily a determination for other
purposes.
As of June 10 , 2010,
the Registrant had 177,918,000 shares of Common Stock outstanding.
Documents
incorporated by reference:
Portions of the
definitive Proxy Statement for the Registrant’s fiscal 2010 Annual Meeting of
Stockholders to be filed pursuant to Regulation 14A within 120 days after the
Registrant’s fiscal year end on March 31, 2010 are incorporated by reference
into Part III of this Report.
TABLE OF CONTENTS
| Page No. | ||||
| Part I | ||||
| Item 1. | Business | 4 | ||
| Item 1A. | Risk Factors | 9 | ||
| Item 1B. | Unresolved Staff Comments | 17 | ||
| Item 2. | Properties | 17 | ||
| Item 3. | Legal Proceedings | 17 | ||
| Item 4. | Reserved | 17 | ||
| Part II | ||||
| Item 5. | Market for Registrant’s Common Equity,
Related Stockholder Matters and Issuer Purchases of Equity Securities |
18 | ||
| Item 6. | Selected Financial Data | 20 | ||
| Item 7. | Management’s Discussion and Analysis of Financial Condition and Results of Operations | 21 | ||
| Item 7A. | Quantitative and Qualitative Disclosures About Market Risk | 45 | ||
| Item 8. | Financial Statements and Supplementary Data | 45 | ||
| Item 9. | Changes In and Disagreements With Accountants on Accounting and Financial Disclosure | 45 | ||
| Item 9A | Controls and Procedures | 45 | ||
| Item 9B. | Other Information | 46 | ||
| Part III | ||||
| Item 10. | Directors, Executive Officers and Corporate Governance | 46 | ||
| Item 11. | Executive Compensation | 46 | ||
| Item 12. | Security Ownership of Certain Beneficial Owners and Management and
Related Stockholder Matters |
47 | ||
| Item 13. | Certain Relationships and Related Transactions, and Director Independence | 47 | ||
| Item 14. | Principal Accountant Fees and Services | 47 | ||
| Part IV | ||||
| Item 15. | Exhibits and Financial Statement Schedules | 47 | ||
| Signatures | 49 | |||
| Exhibit 23.1 | CONSENT OF INDEPENDENT REGISTERED PUBLIC ACCOUNTING FIRM | |||
| Exhibit 31.1 | SECTION 302 CEO CERTIFICATION | |||
| Exhibit 31.2 | SECTION 302 CFO CERTIFICATION | |||
| Exhibit 32.1 | SECTION 906 CEO CERTIFICATION | |||
| Exhibit 32.2 | SECTION 906 CFO CERTIFICATION |
DISCLOSURE REGARDING FORWARD-LOOKING
STATEMENTS
We caution you that
certain statements contained in this report (including any of our documents
incorporated herein by reference), or which are otherwise made by us or on our
behalf, are forward-looking statements. Also, documents which we subsequently
file with the SEC and are incorporated herein by reference will contain
forward-looking statements.
Forward-looking
statements involve known and unknown risks, uncertainties and other factors,
which could cause actual financial or operating results, performances or
achievements expressed or implied by such forward-looking statements not to
occur or be realized. Such forward-looking statements generally are based on our
reasonable estimates of future results, performances or achievements, predicated
upon current conditions and the most recent results of the companies involved
and their respective industries. Forward-looking statements are also based on
economic and market factors and the industry in which we do business, among
other things. Although the Company believes that the expectations reflected in
such forward-looking statements are reasonable, it can give no assurance that
such expectations will prove to have been correct. Forward-looking statements
speak only as of the date hereof and are not guaranties of future performance.
Important factors that could cause actual results to differ materially from the
Company’s expectations are disclosed in this Form 10-K. We undertake no
obligation to publicly update any forward-looking statements, whether as a
result of new information, future events or otherwise.
Forward-looking
statements include statements that are predictive in nature and depend upon or
refer to future events or conditions. Forward-looking statements include words
such as “believe,” “plan,” “anticipate,” “estimate,” “expect,” “intend,” “seek,”
“may,” “can,” “will,” “could,” “should,” “project,” “predict,” “aim,”
“continue,” “potential,” “opportunity” or similar forward-looking terms,
variations of those terms or the negative of those terms or other variations of
those terms or comparable words or expressions. In addition, any statements
concerning future financial performance, ongoing business strategies or
prospects, and possible future actions, which may be provided by our management,
are also forward-looking statements.
Other parts of, or
documents incorporated by reference into, this report may also describe
forward-looking information. Forward-looking statements are based on current
expectations and projections about future events. Forward-looking statements are
subject to risks, uncertainties, and assumptions about our Company.
Forward-looking statements are also based on economic and market factors and the
industry in which we do business, among other things. These statements speak
only as of the date hereof and are not guaranties of future
performance.
Readers are urged to
carefully review and consider the various disclosures made by us in this Report
on Form 10-K and our other filings with the U.S. Securities and Exchange
Commission. These reports and filings attempt to advise interested parties
certain risks and factors that may affect our business, financial condition and
results of operations and prospects.
Unless otherwise
provided, “Arcadia,” “we,” “us,” “our,” and the “Company” refer to Arcadia
Resources, Inc. and its wholly-owned subsidiaries, and when we refer to 2010,
2009 and 2008, we mean the twelve-month period ended March 31 of those
respective years, unless otherwise provided.
3
Part I
ITEM 1. BUSINESS
Overview
Arcadia Resources,
Inc., a Nevada corporation, together with its wholly-owned subsidiaries, is a
national provider of home care, medical staffing, home health products and
pharmacy services operating under the service mark Arcadia HealthCare. In May
and June 2009, the Company disposed of its Home Health Equipment (“HHE”), retail
pharmacy software and industrial staffing businesses. Subsequent to these
divestitures, the Company operates in three reportable business segments: Home
Care/Medical Staffing Services (“Services”), Pharmacy and Catalog. The Company’s
corporate headquarters are located in Indianapolis, Indiana. The Company
conducts its business from approximately 70 facilities located in 18 states. The
Company operates pharmacies in Indiana, California and Minnesota and has
customer service centers in Michigan and Indiana.
Recent Events
On May 19, 2009, the
Company completed the sale of its HHE business in two separate transactions. The
net proceeds of these sales were approximately $8.5 million, of which $7.1
million of cash was received at close. $4.1 million of the proceeds were used to
repay existing long-term indebtedness, and the remaining proceeds will be used
by the Company for general corporate purposes. These transactions are summarized
in the Company’s report on Form 8-K filed May 21, 2009. The HHE business, which
made up the majority of the Company’s previously reported HHE business segment,
is classified as a discontinued operation for purposes of the 2010 fiscal year
results and results for prior years have been restated consistent with this
treatment.
On May 29, 2009, the
Company completed the sale of its industrial staffing business for $250,000 plus
a portion of the future earnings of the business. The sale of this business is
discussed in Note 3 to the Consolidated Financial Statements included under Item
8 of this report. The industrial staffing business’s financial results have
previously been reported as part of the Services segment. As a result of the
sale, this business has been classified as a discontinued operation for purposes
of the 2010 fiscal year results and results for prior years have been restated
consistent with this treatment.
On June 11, 2009, the
Company completed the sale of its JASCORP retail pharmacy software assets for
$2.2 million. The sale of these assets is discussed in Note 3 to the
Consolidated Financial Statements included under Item 8 of this report. The
retail pharmacy software business’s financial results have previously been
reported as part of the Pharmacy segment. As a result of the sale, this business
has been classified as a discontinued operation for purposes of the 2010 fiscal
year results and results for year periods have been restated consistent with
this treatment.
Business Strategy
The events described
in the “Recent Events” section were implemented as part of a plan to refocus the
Company’s lines of business. As a result of the events described above, the
Company currently has three reportable business segments – Services, Pharmacy,
and Catalog. The former “Home Health Equipment” segment, which included the
Company’s HHE business, is no longer a business segment of the Company and is
treated as a discontinued operation for purposes of the financial statements, as
more fully discussed below. The Company continues to operate its home-health
oriented products catalog/on-line business. This business was previously
included in the HHE segment.
The key elements of
the Company’s on-going business strategy are:
Business line focus. The Company has refocused its business
strategy to support its overall vision of “Keeping People at Home and Healthier
Longer”. Population demographics, the projected demand for home health care and
the need for more effective management of medication for targeted groups are key
drivers behind this strategic focus. The Company provides an array of health
care services and products that fulfill these market needs. These services and
products include home care services, home health products, specialty pharmacy
services and medication management services.
Brand strategy. The Company has adopted the Arcadia HealthCare service mark to better
reflect its strategic focus on the health care market. The Company is investing
in the promotion of the Arcadia HealthCare service mark as well as the DailyMed™
medication management brand in the health care markets.
4
Organic growth and potential acquisitions. In the short term the Company is focused on
organic growth of its home care services, medical staffing and specialty
pharmacy businesses. With the launch of its proprietary DailyMed™ medication
management program, the Company has experienced the largest organic growth (both
in percentage and revenue terms) in the Pharmacy business segment, and this
trend is expected to continue. In addition to organic growth, longer term, the
Company will consider acquisition opportunities in the specialty pharmacy and
home care markets, as capital availability permits.
Pharmacy growth plan. The Company has developed an aggressive growth plan for its DailyMed
pharmacy business. The DailyMed program is designed to improve compliance and
adherence for members with complex chronic drug regimens, improving the quality
of life for members living at home and cost reduction opportunities for at-risk
payers. The Company is primarily focused on marketing directly to the at-risk
payers and other delivery partners focused on cost-effective provision of health
care services with an emphasis on caring for people in their home environments.
Marketing efforts have been identified and developed to implement the Company’s
sales plans to this target group.
Leverage back office/IT systems and services. The Company provides payroll, billing,
credit and collection, finance, human resources, compliance and other support
services for the Services segment from a centralized location in Southfield,
Michigan. The goal of these centralized services is to provide a standardized
operating platform, enhance productivity and operating efficiency, and leverage
the transactional volume of the businesses to provide a cost-effective support
structure. For the Services segment, the business utilizes a common, integrated
information technology system across all locations. The system allows scheduling
of caregivers to be done efficiently and provides for flexibility and
customization of billing formats for our customers.
Reduction of SG&A expense. The Company continues to focus on reducing
its overall level of selling, general and administrative (“SG&A”) expense as
a percentage of consolidated net revenue. During the past three years, the
Company has implemented several actions designed to reduce SG&A expense,
including exiting unprofitable business lines, reducing headcount, closing and
consolidating executive and support offices, and reducing professional fees. The
Company constantly evaluates further cost reduction opportunities. In light of
the asset sales during the fiscal first quarter 2010 noted above, the revenue of
the Company has been reduced and the scope of its activities has been narrowed.
As a result, management made additional reductions in SG&A expenses during
fiscal 2010, principally at the corporate level, to bring these expenses more in
line with the size and scope of current business operations. Reductions in the
Services segment and corporate SG&A were offset by increases in the Pharmacy
segment SG&A as this segment grew significantly during fiscal
2010.
Centralized management with local delivery of products and
services. The
Company’s Executive Committee includes the Chief Financial Officer and Chief
Operating Officer and is chaired by the President/Chief Executive Officer. The
Executive Committee oversees all day-to-day aspects of the Company’s business
including the establishment of operational policies and procedures. Subject to
the review and approval of the Company’s Board of Directors, the Executive
Committee sets the strategic direction for each business segment and establishes
appropriate financial targets and controls. However, the strategies for delivery
of the Company’s services and products are done at a business segment and local
market level through more than 65 offices. Regional/local managers are given
responsibility for tailoring their service and product mix in each office to
meet the needs of the regional and local customers they serve.
Our Operating Segments
As indicated above,
the Company’s services and products are organized into three complementary
segments. These segments and their service and product offerings are discussed
in more detail below.
Services Segment. The Services segment provides home care and medical staffing services
across the United States. Operated principally through the Company’s
wholly-owned subsidiary, Arcadia Services, Inc. (“ASI”), this segment is a
national provider of home care services, including skilled and personal care;
and medical staffing services to numerous types of acute care and sub-acute care
medical facilities. The Services segment provides nurses, certified nursing
assistants, home health aides, homemakers and companions to home care clients.
It provides nurses, certified nursing assistants and various allied health
professionals to medical facilities. The medical staffing business provides per
diem, local contract and travel staffing services to its customers.
The Services segment
operates through a network of both company-owned offices, as well as affiliate
offices that are locally owned and operated under a contractual arrangement with
the Company. The Company and the affiliate offices share the gross margin on
business generated by the affiliate office using a revenue-based formula. The
affiliate offices market to local customers and service the contracts between
the Company and those customers. The affiliates also recruit local field staff,
which are employed by the Company, and manage the day-to-day assignment of the
field employees to meet customer needs. In the Services segment, sales through
affiliate offices represent approximately 65% of net revenue, with 35% of sales
being done through company-owned offices. The mix of company-owned sales has
increased over the past two years as the Company has converted several affiliate
offices into company-owned locations.
5
The sales activity
for home care and medical staffing services is primarily performed at
company-owned and affiliate offices in local markets across the United States.
In the home care market, these offices work with a wide range of referral
sources and also sell directly to consumers. Referral sources for home care
series include elder law attorneys, financial counselors, case managers,
geriatric care managers, physicians, medical social workers, facility discharge
planners and numerous other entities that influence the purchase of home care
services. Selling efforts focus on our ability to provide high quality,
cost-effective services, in a consistent, reliable fashion, performed by trained
caregivers who are employed directly by the Company. The Company serviced more
than 9,900 home care clients in fiscal 2010.
The sales activity
for medical staffing is also primarily performed at the local office level.
Sales are done via direct contacts with a wide variety of acute-care and
sub-acute care facilities, including hospitals, rehabilitation facilities,
skilled nursing facilities, hospices and others. Selling efforts focus on our
ability to provide highly-skilled staff, often on short notice, on a
cost-effective basis. Some facilities utilize vendor managed services (“VMS”)
providers who contract on their behalf for these services. The Company serviced
approximately 540 facilities in fiscal 2010.
The Company also has
a central contracting group that pursues contracts for home care and medical
staffing services on a national and regional level. These activities are
coordinated with the local offices expected to provide the
services.
Recruitment of home
care and medical staffing personnel is done at the local level. Each local
office has a different mix of clients and, therefore, has its own requirements
for the employees needed to service these clients. All employees hired by the
Company go through a rigorous screening process that includes criminal
background checks, drug screening and skills assessments.
Competition in the
Services segment consists of national and regional service providers, as well as
smaller locally-owned and operated companies. In the home care segment,
competition is highly fragmented with only a few national or regional providers.
Because the home care business largely consists of personal care,
homemaker/companion services and non-Medicare skilled care, the Company does not
compete directly with the larger publicly-traded, Medicare-certified home health
agencies. In the medical staffing segment, the Company competes with per diem
staffing agencies, as well as agencies focused primarily on travel staffing.
Competition in the travel staffing segment is dominated by several large,
publicly-traded companies that operate on much larger scale than the Company’s
travel staffing business.
Pharmacy Segment. The Pharmacy segment offers the Company’s DailyMed™ medication management
system, which was acquired as part of its purchase of PrairieStone Pharmacy, LLC
in February 2007. DailyMed™ transfers a patient’s prescriptions,
over-the-counter medications and vitamins and organizes them into pre-sorted
30-day supply packages marked with the date and time each dosage should be
taken. Our registered pharmacists review the patient’s panel of medications at
the time a patient is enrolled and periodically perform more detailed medication
therapy management (MTM) reviews to ensure the safety and effectiveness of the
patient’s medications. DailyMed™ is aimed at reducing medication errors,
improving medication adherence and ultimately lowering the cost of health care
for its target customers. The Company is focused on marketing its DailyMed™
products and services to managed care providers and others responsible for
managing the health care costs of the targeted population. The Company plans to
invest in DailyMed™ as the need for improved systems for medication management
creates growth opportunities for this segment.
Numerous companies
provide products and services in the pharmacy industry. These companies include
community-based retail pharmacies, some of whom operate on a national level, and
independents operating from a small number of locations; long-term care
pharmacies, who provide pharmacy products and services to long-term care
facilities such as assisted living and skilled nursing facilities; and providers
of MTM services. The Company believes it has a unique competitive position. The
Company has integrated various aspects of pharmacy product distribution and MTM
services into a method of providing an enhanced system of medication
management.
Catalog Segment. The Company also operates a home-health oriented products
catalog/on-line business to sell ambulatory and mobility products, respiratory
products, daily living aids, bathroom safety products and bathroom/home
modification products. We market these products via direct mail and through our
e-commerce website. In March 2005, the Company and Sears, Roebuck and Co.
executed a licensing agreement which allows the Company to sell similar
merchandise for their www.sears.com and mail order catalog businesses. Virtually
all of the catalog/on-line home products business is paid privately by the
customer.
6
Segment Financial
Information
Financial information
about the segments can be found in Item 7 of this report, Management’s
Discussion and Analysis of Financial Condition and Results of Operations and
Note 15 to the Consolidated Financial Statements included under Item 8 of this
report.
Government Regulation and Compliance
Our health
care-related businesses are subject to extensive government regulation. The
federal government and all states in which we currently operate (or intend to
operate) regulate various aspects of our health care-related businesses. In
particular, our operations are subject to numerous laws: (a) requiring licensing
and approvals to conduct certain activities; (b) targeting the prevention of
fraud and abuse; and (c) regulating reimbursement under various
government-funded programs. Our locations are subject to laws governing, among
other things, pharmacies, nursing services and certain types of home
care.
The marketing,
billing, documentation and other practices of health care companies are subject
to periodic review by regional insurance carriers and various government
agencies. These reviews include on-site audits, records reviews and
investigations of complaints. Violations of federal and state regulations can
result in criminal, civil and administrative penalties and sanctions, including
disqualification from Medicare and other reimbursement programs.
Our operations are
subject to: Medicare and Medicaid reimbursement laws; laws permitting Medicare,
Medicaid and other payors to audit claims and seek repayment when claims have
been improperly paid; laws such as the Health Insurance Portability and
Accountability Act (HIPPA) regulating the privacy of individually identifiable
health information; laws prohibiting kickbacks and the exchange of remuneration
as an inducement for the provision of reimbursable services or products; laws
regulating physician self-referral relationships; and laws prohibiting the
submission of false claims. Health care is an area of rapid regulatory change.
Changes in laws and regulations, as well as new interpretations of existing laws
and regulations, may affect permissible activities, the relative costs
associated with doing business and reimbursement amounts paid by federal, state
and other third party payors. We cannot predict the future changes in
legislations and regulations, but such changes could have a material adverse
impact on the Company.
The Company has a
dedicated credentialing and compliance group that manages our licensure,
contracting and regulatory compliance. The compliance group oversees the
Company’s quality assurance program, which includes periodic audits of the
Company’s locations. In addition, compliance with billing and invoicing
requirements is performed continually by billing center personnel. The Company
believes that it is in material compliance with all laws and regulations
applicable to its businesses.
Invoicing, Billing and Accounts Receivable
Management
The Company performs
most of its accounts receivable management at a national billing center covering
the Services segment. The Company also maintains a billing center for its
Pharmacy segment at its Indianapolis, Indiana pharmacy facility. Each of these
billing centers has unique information systems, experienced billing personnel
and established credit and collection procedures to support their business
segments. Within each segment, third-party reimbursement is a detailed and
complicated process that requires knowledge of and compliance with regulatory,
contractual and billing processing requirements. The majority of our business is
invoiced shortly after the time of service or at the time the product is
shipped. Accurate billing and successful collections are a key to our business
plan.
Employees
The Company employs
full-time management and administrative employees throughout the United States.
In addition, the Company employs a variety of field staff, including health care
professionals and caregivers, to service the needs of our customers. As of March
31, 2010, the Company had 232 full-time or part-time management and
administrative employees and employed approximately 4,000 field employees. We
have no unionized employees and do not have any collective bargaining
agreements. We believe our relationships with our employees are
good.
Supply
We purchase supplies
from various vendors. We are not dependent upon any single supplier and believe
that our product needs can be met by an adequate number of various
manufacturers.
7
Environmental Compliance
We believe we are
currently in compliance, in all material respects, with applicable federal,
state and local statutes and ordinances regulating the discharge of hazardous
materials into the environment. We do not believe the Company will be required
to expend any material amount to remain in compliance with these laws and
regulations or that such compliance will materially affect our capital
expenditures, earnings or competitive position.
Available Information
The Company files
annual, quarterly and current reports, proxy statements and other information
with the Securities and Exchange Commission (the “SEC”). Interested parties may
read and copy any documents filed with the SEC at the SEC’s public reference
room at 100 F Street, NE, Washington, DC 20549. Please call the SEC at
1-800-SEC-0330 for information on the public reference room. The SEC maintains
an internet site that contains annual, quarterly and current reports, proxy and
information statements and other information that issuers (including the
Company) file electronically with the SEC. The SEC’s internet site is
www.sec.gov.
Our internet site is
www.arcadiahealthcare.com. You can access our investor, media and corporate
governance information through our internet site, by clicking on the heading
“Investors.” We make available free of charge, on or through our Investors
webpage, our proxy statements, annual reports on Form 10-K, quarterly reports on
Form 10-Q, current reports on Form 8-K and any amendments to those reports filed
or furnished pursuant to the Securities Exchange Act of 1934, as amended (the
“Exchange Act”), as soon as reasonably practicable after such material is
electronically filed with, or furnished to, the SEC. Information on our website
does not constitute part of this 10-K report or any other report we file with or
furnish to the SEC.
Executive Officers
The following table
sets forth information concerning our executive officers, including their ages,
positions and tenure as of March 31, 2010:
| Name | Age | Position(s) | Served as Officer Since | |||
| Marvin R. Richardson | 52 | President and Chief Executive Officer | February 2007 | |||
| Matthew R. Middendorf | 40 | Chief Financial Officer, Secretary and Treasurer | February 2008 | |||
| Steven L. Zeller | 53 | Chief Operating Officer | September 2007 |
Marvin R. Richardson.
Mr. Richardson, who has over 30 years of health care and retail pharmacy
experience, joined the Company in conjunction with its acquisition of
PrairieStone Pharmacy, LLC in January, 2007. In 2003, he co-founded PrairieStone
Pharmacy LLC headquartered in Minneapolis, Minn. and served as President and
CEO. While at PrairieStone, DailyMed™ was launched – a comprehensive Medication
Therapy Management (MTM) program along with compliance packaging of
pharmaceuticals geared to help those in need better manage their conditions
while helping payers reduce unnecessary costs associated with medication waste,
avoidable hospitalizations and unintended long-term care admissions. The company
was named “Chain of the Year” by Drug Topics magazine in 2005 Prior to his
involvement with PrairieStone, Mr. Richardson held various management positions
with the Walgreen Co. and was Senior Vice President of Pharmacy Operations for
Rite Aid Corporation, overseeing Rite Aid’s 3,500 operating pharmacies.
Richardson is a 1980 graduate of Purdue University in West Lafayette, Ind.,
where he earned his Bachelor of Science degree in Pharmacy. He received the
Pharmacy Distinguished Alumni Award in 2008 and was named to the Purdue
University Foundation Development Council in 2008. He also serves on the Board
of Directors for the Mental Health America of Indiana Association. He has been
an advisor to several major government leaders on healthcare policy including
Vice President Dan Quayle and current New York City Deputy Mayor and former
Indianapolis Mayor Stephen Goldsmith.
Matthew R. Middendorf, Chief Financial Officer, Secretary and
Treasurer, joined the Company in February 2008 as Chief Financial Officer. Mr.
Middendorf previously served as a consultant to the Company, providing
day-to-day financial and accounting support to the Interim CFO and working on
special projects for the CEO. He has responsibility for internal and external
reporting, planning and analysis, and corporate and business unit accounting.
Mr. Middendorf formerly served as the Corporate Controller and Director of
Financial Reporting for Workstream, Inc., a publicly-traded software company. He
worked in public accounting for more than a decade, most recently with Grant
Thornton in its Seattle office; and, has significant experience working with
mid-size companies in the technology, healthcare and banking industries. Mr.
Middendorf holds a Bachelor of Science Degree in Accountancy from the University
of Illinois and passed the CPA Exam in 1992.
Steve L. Zeller, Chief Operating Officer, joined the Company in
September 2007 as part of the Executive Committee. Mr. Zeller is responsible for
managing the Company’s day-to-day operations that are reported to the Board and
Chief Executive Officer. From 2006 to September 2007, Mr. Zeller was President
of BestCare Travel Staffing, LLC, an Arcadia affiliate providing travel nursing
and allied health services, a position he held until February 2009. Prior to
becoming an Arcadia affiliate in 2006, Mr. Zeller served as a division president
for SPX Corporation from 2003 to 2005 and was employed for 18 years at Cummins,
Inc., where he last served as Vice President and Managing Director for a
European-headquartered power generation subsidiary. He received his Juris Doctor
degree from Indiana University in 1981 where he graduated Summa Cum Laude, and
received a B.A. in Economics from The College of William and Mary in
1978.
8
ITEM 1A. RISK FACTORS
This Annual Report,
including Management’s Discussion and Analysis of Financial Condition and
Results of Operations, contains forward-looking statements within the meaning of
Section 27A of the Securities Act of 1933 and Section 21E of the Securities
Exchange Act of 1934. We face a number of risks and uncertainties that could
cause actual results or events to differ materially from those contained in any
forward-looking statement. Factors that could cause or contribute to such
differences include, but are not limited to, the risks and uncertainties listed
below. If any of the following risks actually occur, our business, financial
condition or results of operations could be materially and adversely affected.
In that case, the trading price of our common stock could decline, and you may
lose all or part of your investment in us. You should carefully consider and
evaluate the risks and uncertainties listed below, as well as the other
information set forth in this Report.
We have a history of operating losses and
negative cash flow that may continue into the foreseeable future.
We have a history of
operating losses and negative cash flow. While we have achieved positive cash
flow from operations in some recent quarters, which was partially due to
deferring certain interest amounts, net cash flow has been negative, and we
continue to follow a very disciplined approach to cash management. If we fail to
execute our strategy to achieve and maintain profitability in the future,
investors could lose confidence in the value of our common stock, which could
cause our stock price to decline, adversely affect our ability to raise
additional capital, and adversely affect our ability to meet the financial
covenants contained in our credit agreements. Further, if we continue to incur
operating losses and negative cash flow, we may have to implement further
significant cost cutting measures, which could include a substantial reduction
in work force, location closures, and/or the sale or disposition of certain
assets or subsidiaries. We cannot assure that any of the cost cutting measures
we implement will be effective or result in profitability or positive cash flow.
To achieve profitability, we will also need to, among other things, increase our
revenue base, reduce our cost structure and realize economies of scale. If we
are unable to achieve and maintain profitability, our stock price could be
materially adversely affected.
Our indebtedness could adversely affect our
financial condition and operations, prevent us from fulfilling our debt service
obligations and adversely affect our ability to operate our business.
Our indebtedness
could have important consequences, including, but not limited to:
- We may be unable to obtain additional financing for working capital, capital expenditures, acquisitions and general corporate or other purposes.
- We may be unable to plan for, or react to, changes in our business and general market conditions.
- We may be more vulnerable in a volatile market and at a competitive disadvantage to less leveraged competitors.
- Our operating flexibility is more limited due to financial and other restrictive covenants, including restrictions on incurring additional debt, creating liens on our properties, making acquisitions and paying dividends.
- We are subject to the risks that interest rates and our interest expense will increase.
- Our ability to use operating cash flow in other areas of our business may be limited because we must dedicate a substantial portion of these funds to make principal and interest payments on our indebtedness.
- Our ability to make investments or take other actions or borrow additional funds may be limited based on the financial and other restrictive covenants in our indebtedness.
- The amount we are permitted to draw on our revolving credit facilities may be limited and we may be unable to fund our early-stage pharmacy product and patient care services and home care staffing business strategies.
- We may be forced to implement cost reductions, which could impact our product and service offerings.
- We may be unable to successfully implement our growth strategy and spread our cost structure over a larger revenue base and ultimately become profitable.
Due to our debt level, our history of
operating losses and negative cash flows, and the current conditions in the
credit markets, we may not be able to increase the amount we can draw on our
revolving credit facility with Comerica Bank, or to obtain credit from other
sources, to fund our future needs for working capital, funding early-stage
strategies and ongoing business operations, or acquisitions.
9
Due to our debt level
and the current conditions in the credit market, there is the risk that Comerica
Bank or other sources of credit may decline to increase the amount we are
permitted to draw on the revolving credit facilities or to lend additional funds
for working capital, funding our early-stage pharmacy product and patient care
services and home care staffing business strategies, making acquisitions and for
other purposes. This development could result in various consequences to the
Company, ranging from implementation of cost reductions, which could impact our
product and service offerings, to the need to revise management’s business plan
for fiscal 2011 that depends on improvements in profitability and a disciplined
approach to cash management, to the modification or abandonment of these
strategies.
We may not be able to meet the financial
covenants contained in our credit facilities, and we may not be able to obtain
waivers for any violations of those covenants should they occur.
Under certain of our
existing credit facilities, we are required to adhere to certain financial
covenants. We were not in compliance with one financial covenant under our
Comerica Bank line of credit as of March 31, 2010, but we received a waiver of
this non-compliance from the bank. If there are future covenant violations, our
lenders could declare a default under the applicable credit facility and, among
other actions, refuse to make additional advances, increase our borrowing costs,
further restrict our operations, take possession or control of any asset
(including our cash) and demand the immediate repayment of all amounts
outstanding under the credit facility. Any of these actions could have a
material adverse affect on our financial condition and liquidity. Based on our
history of operating losses, we cannot guarantee that we would be able to
refinance our existing credit facility or obtain alternative financing.
In addition to the
financial covenants, our existing credit facility with Comerica Bank includes a
subjective acceleration clause and requires the Company to maintain a lockbox.
Currently, the Company has the ability to control the funds in the deposit
account and determine the amount issued to pay down the line of credit balance.
The bank reserves the right under the security agreement to request that the
indebtedness be on a remittance basis in the future, whether or not an event of
default has occurred. If the bank exercises this right, then the Company would
be forced to use its cash to pay down this indebtedness rather than for other
needs, including day-to-day operations, expansion initiatives or the pay down of
debt which accrues interest at a higher rate.
The terms of our credit agreements with
various lenders subject us to the risk of foreclosure on certain property.
Our wholly-owned
subsidiary RKDA, Inc. granted Comerica Bank a first-priority security interest
in all of the issued and outstanding capital stock of its wholly-owned
subsidiary, Arcadia Services, Inc. and Arcadia Services, Inc. and its
subsidiaries granted Comerica Bank security interests in all of their assets.
Effective April 2010, we granted H.D. Smith Wholesale Drug Co. a first priority
security interest in all of the issued and outstanding ownership interest of its
wholly-owned subsidiary PrairieStone Pharmacy, LLC, and PrairieStone granted
H.D. Smith a security interest in all of its assets. Additionally,
PrairieStone provided our lenders, JANA Master Fund, Ltd. (“JANA”), Vicis
Capital Master Fund (“Vicis”), and LSP Partners, LP (“LSP”),a subordinated
security interest in its assets. If an event of default occurs under the
applicable credit agreements, each lender may, at its option, accelerate the
maturity of the debt and exercise its respective right to foreclose on the
issued and outstanding capital stock and/or on all of the assets of Arcadia
Services, Inc. and its subsidiaries, and/or PrairieStone Pharmacy, LLC and its
subsidiaries. Any such default and resulting foreclosure would have a material
adverse effect on our financial condition and our ability to continue
operations.
In order to fund operations, repay our debt
obligations, or pursue our growth strategies, we may seek additional equity
financing, which could result in dilution to our security holders and adversely
affect our stock price.
On November 17, 2009,
the Company sold certain institutional investors an aggregate of 15,857,141
shares of common stock and 7,135,713 warrants to purchase common stock. The
Company raised $10.2 million in net proceeds from this transaction. We may
continue to raise additional financing through the equity markets to repay debt
obligations and to fund operations. We also plan to continue to expand product
and service offerings. Because of the capital requirements needed to pursue our
early-stage pharmacy growth strategies, we may access the public or private
equity markets whenever conditions appear to us to be favorable, even if we do
not have an immediate need for additional capital at that time. To the extent we
access the equity markets, the price at which we sell shares may be lower than
the current market prices for our common stock. If we obtain financing through
the sale of additional equity or convertible debt securities, this could result
in dilution to our security holders by increasing the number of shares of
outstanding stock. We cannot predict the effect this dilution may have on the
price of our common stock.
10
To the extent we are unable to generate
sufficient cash from operations or raise adequate funds from the equity or debt
markets, we would need to sell assets or modify or abandon our growth
strategy.
In addition to the
$10.2 million of equity financing raised in November 2009, we finalized an
additional $5 million of debt financing in April 2010. The net proceeds from
these financing transactions, combined with our cash on hand and line of credit
availability, may not be adequate to satisfy our cash needs over the long-term.
To the extent that we are unable to generate sufficient cash from operations, or
to raise additional funds from the equity or debt markets, we may be required to
sell assets or modify or abandon our growth strategy. Asset sales and
modification or abandonment of our growth strategy could negatively impact our
profitability and financial position, which in turn could negatively impact the
price of our common stock.
Due to our operating losses during recent
fiscal years, our stock could be at risk of being delisted by the NYSE Amex
Equities Exchange.
Our stock currently
trades on the NYSE Amex Equities Exchange (“Amex”). The Amex, as a matter of
policy, will consider the suspension of trading in, or removal from listing of
any stock when, in the opinion of the Amex (i) the financial condition and/or
operating results of an issuer of stock listed on the Amex appear to be
unsatisfactory, (ii) it appears that the extent of public distribution or the
aggregate market value of the stock has become so reduced as to make further
dealings on the Amex inadvisable, (iii) the issuer has sold or otherwise
disposed of its principal operating assets, or (iv) the issuer has sustained
losses which are so substantial in relation to its overall operations or its
existing financial condition has become so impaired that it appears
questionable, in the opinion of the Amex, whether the issuer will be able to
continue operations and/or meet its obligations as they mature. We have
sustained net losses, we had a stockholders deficit as of March 31, 2010
and our stock has been trading at relatively low prices. Delisting of our common
stock would adversely affect the price and liquidity of our common
stock.
Changes in federal and state laws that govern
our financial relationships with physicians and other health care providers may
impact potential or current referral sources.
We offer certain
healthcare-related products and services that are subject to federal and state
laws restricting our relationship with physicians and other healthcare
providers. Generally referred to as “anti-kickback laws,” these laws prohibit
certain direct and indirect payments or other financial arrangements that are
designed to encourage the referral of patients to a particular medical services
provider. In addition, certain financial relationships, including ownership
interests and compensation arrangements, between physicians and providers of
designated health services, such as our Company, to whom those physicians refer
patients, are prohibited by the federal physician self-referral prohibition,
known as the “Stark Law,” and similar state laws. Violations of these laws could
lead to fines or sanctions that could have a material adverse effect on our
business. In addition, changes in healthcare law or new interpretations of
existing laws may have a material impact on our business and results of
operations.
We are required to comply with laws governing
the transmission of privacy of health information.
The Health Insurance
Portability and Accountability Act of 1996, or HIPAA, requires us to comply with
standards for the exchange of health information within our Company and with
third parties, such as payers, business associates and consumers. These include
standards for common health care transactions, such as claims information, plan
eligibility, payment information, the use of electronic signatures, unique
identifiers for providers, employers, health plans and individuals and security,
privacy and enforcement. New standards and regulations may be adopted governing
the use, disclosure and transmission of health information with which we may be
required to comply. We could be subject to criminal penalties and civil
sanctions if we fail to comply with these standards. In addition, compliance
with new standards and regulations could increase our costs and adversely affect
our results of operations.
Because we depend on key management, the loss
of the services or advice of any of these persons could have a material adverse
effect on our business and prospects.
Our success is
dependent on our ability to attract and retain qualified and experienced
management and personnel. We do not presently maintain key person life insurance
for any of our personnel. There can be no assurance that we will be able to
attract and retain key personnel in the future, and our inability to do so could
have a material adverse effect on us. Our management team will need to work
together effectively to successfully develop and implement our business
strategies and financial operations. In addition, management will need to devote
significant attention and resources to preserve and strengthen relationships
with employees, customers and the investor community. If our management team is
unable to achieve these goals, our ability to grow our business and successfully
meet operational challenges could be impaired.
11
We do not have long-term agreements or
exclusive guaranteed order contracts with our home care, hospital and healthcare
facility clients.
The success of our
Home Care and Medical Staffing business depends upon our ability to continually
secure new orders from home care clients, hospitals and other healthcare
facilities and to fill those orders with our temporary healthcare professionals.
We do not have long-term agreements or exclusive guaranteed order contracts with
our home care, hospital and health care facility clients. We rely on our
agencies to establish and maintain positive relationships with these clients. If
we, or our agents, fail to maintain positive relationships with our home care,
hospital and healthcare facility clients, we may be unable to generate new
temporary healthcare professional orders and our business may be adversely
affected. In addition, many of these clients may have devised strategies to
reduce the expenditures on temporary healthcare workers and to limit overall
agency utilization. If current pressures to control agency usage continue and
escalate, we will have fewer business opportunities, which could harm our
business.
Sales and profitability in our Pharmacy
segment depends on continued demonstration of the effectiveness of our DailyMed™
business model, which is in its early stages of a broad market
roll-out.
The success of our
Pharmacy segment is dependent on the viability and continued demonstration of
the effectiveness of the DailyMed™ business model,
which is in the early stages of market roll-out. As an innovative, first to
market pharmacy care model, DailyMed™ is challenging
the approach of traditional community based retail pharmacies and others to
providing pharmacy products and services. It is providing a unique opportunity
for at-risk payers to substantially reduce health care costs. Market adoption
and customer acceptance are key to continued growth in revenues as is payer
adoption of DailyMed™ as part of
efforts to reduce overall health care spend. To date, competitive responses to
DailyMed™ have yet to evolve. Our ability to grow
revenue and receive compensation for the value-added services we provide are
keys to the long-term financial viability of the DailyMed™ business
model.
Our Pharmacy segment revenue is highly
dependent upon our relationships with key state Medicaid programs, managed care
organizations, health plans and other payers.
A significant portion
of our current Pharmacy segment revenue is generated from programs that we have
in place with several key state Medicaid programs, managed care organizations,
health plans and other payers, including Indiana Medicaid and WellPoint. The
rate of growth in the Pharmacy segment is highly dependent on maintaining our
on-going relationships with these parties. While we have contractual
arrangements with some of these entities, including WellPoint, at present these
agreements may be terminated after a relatively short notice period. As a
result, our ability to grow revenue under these arrangements is dependent upon
several factors, including the rate of enrollment of their members into the
program, the quality of our services and our ability to help at-risk payers
achieve health care cost containment and reduction. In addition, our ability to
grow revenue under these programs depends upon factors outside of our control,
including state appropriations and funding and changes in eligibility
requirements. If we provide the service levels and results we anticipate from
the DailyMed™ program, we would expect to be able to enter
into longer-term agreements with many of these payers that have the assurance of
substantial future revenue to the Company. However, our inability to maintain
these relationships, and specifically our agreement with WellPoint, would
negatively impact current and future Pharmacy segment revenue. There can be no
assurance that the loss of these relationships would be offset by relationships
with new or additional payers.
Our operations subject us to risk of
litigation.
Operating in the
homecare industry exposes us to an inherent risk of wrongful death, personal
injury, professional malpractice and other potential claims or litigation
brought by our consumers and employees. These claims may include, for example,
allegations that we did not properly treat or care for a consumer or that we
failed to follow internal or external procedures that resulted in death or harm
to a consumer.
In addition,
regulatory agencies may initiate administrative proceedings alleging violations
of statutes and regulations arising from our services and seek to impose
monetary penalties on us. We could be required to pay substantial amounts to
respond to regulatory investigations or, if we do not prevail, damages or
penalties arising from these legal proceedings. We also are subject to potential
lawsuits under the False Claims Act or other federal and state whistleblower
statutes designed to combat fraud and abuse in our industry. These lawsuits can
involve significant monetary awards or penalties which may not be covered by our
insurance. If our third-party insurance coverage and self-insurance reserves are
not adequate to cover these claims, it could have a material adverse effect on
our business, results of operations and financial condition. Even if we are
successful in our defense, civil lawsuits or regulatory proceedings could
distract management from running our business or irreparably damage our
reputation.
12
A significant decline in sales in our home
care and staffing businesses would adversely impact our revenue, operating
income and cash flow and our ability to repay indebtedness and invest in new
products and services.
Our home care and
medical staffing business has traditionally accounted for the majority of our
revenue, operating profit and cash flow. Our business strategy is premised upon
continued growth in this segment consistent with underlying market trends. While
we believe we are well-positioned to increase sales in this segment, there can
be no assurance that we will do so. Failure to achieve our sales targets in this
market segment would adversely impact our revenue. While operating expense
reductions and other actions would be taken in response to a decline in
projected sales, such a reduction could adversely affect our projected operating
income and cash flow. If this were to occur, we would have less cash available
to repay short-term and long-term indebtedness. We may also have to reduce our
investment in other segments of the business and modify our business
strategy.
Sales of certain of our services and products
are largely dependent upon payments from governmental programs and private
insurance, and cost containment initiatives by these payers may reduce our
revenues, thereby harming our performance.
In the U.S.,
healthcare providers and consumers who purchase home care services, prescription
drug products and related products and services generally rely on third party
payers, such as Medicare and Medicaid, to reimburse all or part of the cost of
the healthcare product or service. Our sales and profitability are affected by
the efforts of healthcare payers to contain or reduce the cost of healthcare by
lowering reimbursement rates, limiting the scope of covered services, and
negotiating reduced or capitated pricing arrangements. Any changes which lower
reimbursement levels under Medicare, Medicaid or private pay programs, including
managed care contracts, could reduce our future revenue. Furthermore, other
changes in these reimbursement programs or in related regulations could reduce
our future revenue. These changes may include modifications in the timing or
processing of payments and other changes intended to limit or decrease the
growth of Medicare, Medicaid or third party expenditures. In addition, our
profitability may be adversely affected by any efforts of our suppliers to shift
healthcare costs by increasing the net prices on the products we obtain from
them.
The markets in which we operate are highly
competitive and we may be unable to compete successfully against competitors
with greater resources.
We compete in markets
that are constantly changing, intensely competitive (given low barriers to
entry), highly fragmented and subject to dynamic economic conditions. Increased
competition is likely to result in price reductions, reduced gross margins, loss
of customers, and loss of market share, any of which could adversely affect our
net revenue and results of operations. Many of our competitors and potential
competitors have more capital and marketing and technical resources than we do.
These competitors and potential competitors include large drugstore chains,
pharmacy benefits managers, on-line marketers, national wholesalers, and
national and regional distributors. Further, the Company may face a significant
competitive challenge from alliances entered into between and among its
competitors, major HMO’s or chain drugstores, as well as from larger competitors
created through industry consolidation. These potential competitors may be able
to respond more quickly than we can to emerging market changes or changes in
customer needs. To the extent competitors seek to gain or retain market share by
reducing prices or increasing marketing expenditures, we could lose revenues or
clients. In addition, relatively few barriers to entry exist in local healthcare
markets. As a result, we could encounter increased competition in the future
that may increase pricing pressure and limit our ability to maintain or increase
our market share for our mail order pharmacy and related
businesses.
We cannot predict the impact that registration
of shares may have on the price of our common stock.
We cannot predict the
impact, if any, that sales of, or the availability for sale of, shares of our
common stock by selling security holders pursuant to a prospectus or otherwise
will have on the market price of our securities prevailing from time to time.
The possibility that substantial amounts of our common stock might enter the
public market could adversely affect the prevailing market price of our common
stock and could impair our ability to fund acquisitions or to raise capital in
the future through the sales of securities. Sales of substantial amounts of our
securities, including shares issued upon the exercise of options or warrants, or
the perception that such sales could occur, could adversely affect prevailing
market prices for our securities.
13
The price of our common stock has been, and
will likely continue to be, volatile, which could diminish the ability to recoup
an investment, or to earn a return on an investment, in our common
stock.
The market price of
our common stock has fluctuated over a wide range, and it is likely that it will
continue to do so in the future. Limited demand for our common stock has
resulted in limited liquidity, and it may be difficult to dispose of our
securities. Due to the volatility of the price of our common stock, an investor
may be unable to resell shares of our common stock at or above the price paid
for them, thereby exposing an investor to the risk that he may not recoup an
investment in our common stock or earn a return on such an investment. In the
past, securities class action litigation has been brought against companies
following periods of volatility in the market price of their securities. If we
are the target of similar litigation in the future, we would be exposed to
incurring significant litigation costs. This would also divert management’s
attention and resources, all of which could substantially harm our business and
results of operations.
Resale of our securities by any holder may be
limited and affected by state blue-sky laws, which could adversely affect the
price of our securities and the holder’s investment in our
Company.
Under the securities
laws of some states, shares of common stock and warrants can be sold in such
states only through registered or licensed brokers or dealers. In addition, in
some states, warrants and shares of common stock may not be sold unless these
shares have been registered or qualified for sale in the state or an exemption
from registration or qualification is available and is complied with. The
requirement of a seller to comply with the requirements of state blue sky laws
may lead to delay or inability of a holder of our securities to dispose of such
securities, thereby causing an adverse effect on the resale price of our
securities.
The issuance of our preferred stock could
materially impact the market price of our common stock and the rights of holders
of our common stock.
We are authorized to
issue 5,000,000 shares of serial preferred stock, par value $0.001. Shares of
preferred stock may be issued from time to time in one or more series as may be
determined by our Board of Directors. Except as otherwise provided in our
Restated Articles of Incorporation, the Board of Directors has the authority to
fix by resolution adopted before the issuance of any shares of each particular
series of preferred stock, the designation, powers, preferences, and relative
participating, optional redemption and other rights, and the qualifications,
limitations, and restrictions of that series. The issuance of our preferred
stock could materially impact the price of our common stock and the rights of
holders of our common stock, including voting rights. The issuance of preferred
stock could decrease the amount of earnings and assets available for
distribution to holders of common stock, and may have the effect of delaying,
deferring or preventing a change in control of our company, despite such change
of control being in the best interest of the holders of our common stock. The
existence of authorized but unissued preferred stock may enable the Board of
Directors to render more difficult or to discourage an attempt to obtain control
of us by means of a merger, tender offer, proxy contest or
otherwise.
The exercise of common stock warrants and
stock options may depress our stock price and may result in dilution to our
common security holders.
Warrants to purchase
approximately 11.1 million shares of our common stock were issued and
outstanding as of March 31, 2010. Options to purchase approximately 8.3 million
shares of our common stock were issued and outstanding as of March 31, 2010. The
Arcadia Resources, Inc. 2006 Equity Incentive Plan (the “Plan”), as amended on
October 14, 2009, allows for the granting of additional incentive stock options,
non-qualified stock options, stock appreciation rights and restricted shares up
to 15 million shares (5.0% of our authorized shares of common stock as of the
date the Plan was approved), of which the Company had available approximately
5.1 million shares as of March 31, 2010 for future grants.
If the market price
of our common stock is above the exercise price of some of the outstanding
warrants or options; the holders of those warrants or options may exercise their
warrants or options and sell the common stock they acquire upon exercise in the
public market. Sales of a substantial number of shares of our common stock in
the public market may depress the prevailing market price for our common stock
and could impair our ability to raise capital through the future sale of our
equity securities. Additionally, if the holders of outstanding warrants exercise
those warrants, our common security holders will suffer dilution in their voting
power. The exercise price and the number of shares subject to the warrant or
option is subject to adjustment upon stock dividends, splits and combinations,
as well as certain anti-dilution adjustments as set forth in the respective
common stock warrants.
14
We depend on our affiliated agencies and our
internal sales force to sell our services and products, the loss of which could
adversely affect our business.
We rely upon our
affiliated agencies and our internal sales force to sell our staffing and home
care services and our internal sales force to sell our pharmacy products and
services. Arcadia Services’ affiliated agencies are owner-operated businesses.
The primary responsibilities of Arcadia Services’ affiliated agencies include
the recruitment and training of field staff employed by Arcadia Services and
generating and maintaining sales to Arcadia Services’ customers. The
arrangements with affiliated agencies are formalized through a standard
contractual agreement, which states performance requirements of the affiliated
agencies. Our employees provide the services to our customers, and the
affiliated agents and internal sales force are restricted by non-competition
agreements. In the event of loss of our affiliated agents or internal sales
force personnel, we would recruit new sales and marketing personnel and/or
affiliated agents, which could cause our operating costs to increase and our
sales to fall in the interim.
Declines in prescription volumes may
negatively affect our net revenues and profitability.
We dispense
significant volumes of brand-name and generic drugs as part of our Pharmacy
business, which we expect to be a significant source of our net revenues and
profitability. Demand for prescription drugs can be negatively affected by a
number of factors, including increased safety risk problems, manufacturing
issues, regulatory action, and negative press or media coverage. Certain
prescriptions may also be withdrawn by their manufacturer or transition to
over-the-counter products. A reduction in the use of prescription drugs may
negatively affect our volumes, net revenues, profitability and cash
flows.
The success of our business depends on
maintaining a well-secured pharmacy operation and technology infrastructure and
failure to do so could adversely impact our business.
We depend on our
infrastructure, including our information systems, for many aspects of our
business operations, particularly our pharmacy operations. A fundamental
requirement for our business is the secure storage and transmission of personal
health information and other confidential data and we must maintain our business
processes and information systems, and the integrity of our confidential
information. Although we have developed systems and processes that are designed
to protect information against security breaches, failure to protect such
information or mitigate any such breaches may adversely affect our operations.
Malfunctions in our business processes, breaches of our information systems or
the failure to maintain effective and up-to-date information systems could
disrupt our business operations, result in customer and member disputes, damage
our reputation, expose us to risk of loss or litigation, result in regulatory
violations, increase administrative expenses or lead to other adverse
consequences.
Any additional impairment of goodwill and
other intangible assets could negatively impact our results of
operations.
During fiscal 2010
and 2009, we wrote off an aggregate of $14.6 million and $23.5 million,
respectively, of goodwill and other intangible assets. As of March 31, 2010, we
have $2.5 million of goodwill and $7.7 million of other intangible assets
remaining on our balance sheet. These intangibles are subject to an impairment
test on an annual basis and are also tested whenever events and circumstances
indicate possible impairment. Any excess goodwill resulting from the impairment
test must be written off in the period of determination. Intangible assets
(other than goodwill) are generally amortized over the useful life of such
assets. In addition, from time to time, we may acquire or make an investment in
a business which will require us to record goodwill based on the purchase price
and the value of the acquired assets. We may subsequently experience unforeseen
issues with such business which adversely affect the anticipated returns of the
business or value of the intangible assets and trigger an evaluation of the
recoverability of the recorded goodwill and intangible assets for such business.
Future determinations of significant write-offs of goodwill or intangible assets
as a result of an impairment test or any accelerated amortization of other
intangible assets could have a negative impact on our results of operations and
financial condition.
Negative publicity or changes in public
perception of our services may adversely affect our ability to receive
referrals, obtain new agreements and renew existing
agreements.
Our success in
receiving referrals, obtaining new agreements and renewing our existing
agreements depends upon maintaining our reputation as a quality service provider
among governmental authorities, physicians, hospitals, discharge planning
departments, case managers, nursing homes, rehabilitation centers, advocacy
groups, consumers and their families, other referral sources and the public.
Negative publicity, changes in public perceptions of our services or government
investigations of our operations could damage our reputation and hinder our
ability to receive referrals, retain agreements or obtain new agreements.
Increased government scrutiny may
also contribute to an increase in compliance costs and could discourage
consumers from using our services. Any of these events could have a negative
effect on our business, financial condition and operating results.
15
Several anti-takeover measures under Nevada
law could delay or prevent a change of control, despite such change of control
being in the best interest of the holders of our common
stock.
Several anti-takeover
measures under Nevada law could delay or prevent a change of control, despite
such change of control being in the best interest of the holders of our common
stock. This could make it more difficult or discourage an attempt to obtain
control of us by means of a merger, tender offer, proxy contest or otherwise.
This could negatively impact the value of an investment in our common stock, by
discouraging a potential suitor who may otherwise be willing to offer a premium
for shares of our common stock.
Delays in reimbursement due to state budget
deficits or otherwise have decreased, and may in the future further decrease,
our liquidity.
There is generally a
delay between the time that we provide services and the time that we receive
reimbursement or payment for these services. A majority of states are facing
budget deficits and other states may in the future delay reimbursement, which
would adversely affect our liquidity. From time to time, procedural issues
require us to resubmit claims before payment is remitted, which contributes to
our aged receivables. Additionally, unanticipated delays in receiving
reimbursement from state programs due to changes in their policies or billing or
audit procedures may adversely impact our liquidity and working capital. Because
we fund our operations primarily through the collection of accounts receivable,
any delays in reimbursement would result in the need to increase borrowings
under our credit facility.
We are subject to extensive government
regulation. Changes to the laws and regulations governing our business could
negatively impact our profitability and any failure to comply with these
regulations could adversely affect our business.
The federal
government and the states in which we operate regulate our industry extensively.
The laws and regulations governing our operations, along with the terms of
participation in various government programs, impose certain requirements on the
way in which we do business, the services we offer, and our interactions with
consumers and the public. These requirements relate to:
- Licensure and
certification;
- Adequacy and quality of health
care services;
- qualifications and training of
health care and support personnel;
- confidentiality, maintenance and
security issues associated with medical records and claims
processing;
- relationships with physicians and
other referral sources;
- Operating policies and
procedures;
- addition of facilities and
services; and
- billing for services.
These laws and
regulations, and their interpretations, are subject to frequent change. These
changes could reduce our profitability by increasing our liability, increasing
our administrative and other costs, increasing or decreasing mandated services,
forcing us to restructure our relationships with referral sources and providers
or requiring us to implement additional or different programs and systems.
Failure to comply could lead to the termination of rights to participate in
federal and state-sponsored programs, the suspension or revocation of licenses
and other civil and criminal penalties and a delay in our ability to bill and
collect for services provided.
On March 23, 2010,
the President signed into law the Health Reform Law. The Health Reform Law is
broad, sweeping reform, and is subject to change, including through the adoption
of related regulations, the way in which its provisions are interpreted and the
manner in which it is enforced. We cannot assure you that such provisions of the
Health Reform Law, will not adversely impact our business, results of operations
or financial results. We may be unable to mitigate any adverse effects resulting
from the Health Reform Act.
16
The HITECH Act
established certain health information security breach notification
requirements. A covered entity must notify any individual whose protected health
information is breached. While we believe that we protect individuals’ health
information, if our information systems are breached, we may experience
reputational harm that could adversely affect our business. In addition, failure
to comply with the HITECH Act could result in fines and penalties that could
have a material adverse effect on us.
We are subject to reviews, compliance audits
and investigations that could result in adverse findings that negatively affect
our net service revenues and profitability.
As a result of our
participation in Medicaid and other governmental programs, and pursuant to
certain of our contractual relationships, we are subject to various reviews,
audits and investigations by governmental authorities and other third parties to
verify our compliance with these programs and agreements as well as applicable
laws, regulations and conditions of participation. If we fail to meet any of the
conditions of participation or coverage, we may receive a notice of deficiency
from the applicable surveyor or authority. Failure to institute a plan of action
to correct the deficiency within the period provided by the surveyor or
authority could result in civil or criminal penalties, the imposition of fines
or other sanctions, damage to our reputation, cancellation of our agreements,
suspension or revocation of our licenses or disqualification from federal and
state reimbursement programs. These actions may adversely affect our ability to
provide certain services, to receive payments from other payors and to continue
to operate. Additionally, actions taken against one of our locations may subject
our other locations to adverse consequences. Any termination of one or more of
our locations from a government program for failure to satisfy such program’s
conditions of participation could adversely affect our net service revenues and
profitability.
Payments we receive
in respect of Medicaid can be retroactively adjusted after a new examination
during the claims settlement process or as a result of pre- or post-payment
audits. Federal, state and local government payors may disallow our requests for
reimbursement based on determinations that certain costs are not reimbursable
because proper documentation was not provided or because certain services were
not covered or deemed necessary. In addition, other third-party payors may
reserve rights to conduct audits and make reimbursement adjustments in
connection with or exclusive of audit activities. Significant adjustments as a
result of these audits could adversely affect our revenues and
profitability.
We are exposed to certain risks related to the
frequency and rate of the introduction of generic drugs and brand-name
prescription products.
The profitability of
retail and mail order pharmacy businesses are dependent upon the utilization of
prescription drug products. Utilization trends are affected by the introduction
of new and successful prescription pharmaceuticals as well as lower-priced
generic alternatives to existing brand-name products. Accordingly, a slowdown in
the introduction of new and successful prescription pharmaceuticals and/or
generic alternatives (the sale of which normally yield higher gross profit
margins than brand-name equivalents) could adversely affect our business,
financial position and results of operations.
ITEM 1B. UNRESOLVED STAFF
COMMENTS.
None.
ITEM 2. PROPERTIES
Our corporate
headquarters and administrative support offices are located in Indianapolis,
Indiana and Southfield, Michigan, respectively. We operate on a national basis
with a presence in 18 states and approximately 70 locations. All facilities are
leased and have lease expiration dates ranging from 2010 to 2017. As of March
31, 2010, we have two material operating leases: our Indianapolis location,
which combines our corporate headquarters and one of our pharmacy locations; and
the Southfield, Michigan administrative support offices.
We do not own any
real estate.
ITEM 3. LEGAL PROCEEDINGS
We are a defendant
from time to time in lawsuits incidental to our business in the ordinary course
of business. We are not currently subject to, and none of our subsidiaries are
subject to, any material legal proceedings.
ITEM 4. RESERVED
17
Part II
ITEM 5. MARKET FOR REGISTRANT’S COMMON EQUITY,
RELATED STOCKHOLDER MATTERS AND ISSUER PURCHASES OF EQUITY
SECURITIES
Shares of our common
stock are currently quoted on the NYSE Amex Exchange (“NYSE Amex”) under the
symbol “KAD.” The following table sets forth the quarterly high and
low sale prices for our common stock for the periods
indicated.
| Fiscal Year Ended March 31, 2010 | ||||||||||||
| 4th Quarter | 3rd Quarter | 2nd Quarter | 1st Quarter | |||||||||
| High | $ | 0.74 | $ | 1.09 | $ | 1.24 | $ | 0.74 | ||||
| Low | $ | 0.35 | $ | 0.38 | $ | 0.57 | $ | 0.38 | ||||
| Fiscal Year Ended March 31, 2009 | ||||||||||||
| 4th Quarter | 3rd Quarter | 2nd Quarter | 1st Quarter | |||||||||
| High | $ | 0.50 | $ | 0.53 | $ | 0.57 | $ | 0.77 | ||||
| Low | $ | 0.23 | $ | 0.18 | $ | 0.19 | $ | 0.56 | ||||
There is no
established market for our warrants to purchase common stock. The Company’s
warrants are not quoted by NYSE Amex, nor are they listed on any exchange. We do
not expect our warrants to be quoted by the NYSE Amex or listed on any exchange.
As a result, an investor may find it difficult to trade, dispose of, or to
obtain accurate quotations of the price of our warrants.
There are 277 record
holders of our common stock as of May 3, 2010. The number of record holders of
our common stock excludes an estimate of the number of beneficial owners of
common stock held in street name, totaling approximately 146.5 million shares
held by approximately 2,000 shareholders. The transfer agent and registrar for
our common stock is Computershare, 7530 Lucerne Drive, Ste. 305, Cleveland,
Ohio, 44130 (440-239-7361).
We have never paid
cash dividends on our common shares, and we do not anticipate that we will pay
dividends with respect to those securities in the foreseeable future. Our
current business plan is to retain any future earnings to finance the expansion
and development of our business. Any future determination to pay cash dividends
will be at the discretion of our Board of Directors, and will be dependent upon
our financial condition, results of operations, capital requirements, debt
agreement restrictions and other factors as our Board may deem relevant at that
time.
18
Stock Performance Graph
The following graph
compares the percentage change in the cumulative total shareholder return on the
Company’ Common Stock during the period beginning April 1, 2005 and ending March
31, 2010 with the American Stock Exchange Composite index, a peer group index
comprised of the following companies: Almost Family, Inc., Amedisys, Inc.,
Genitiva Health Services, Inc., LHC Group, Inc., Omnicare, Inc., and Pharmerica
Corp. The stock prices shown are historical and do not determine future
performance.
COMPARISON OF 5 YEAR CUMULATIVE TOTAL
RETURN*
Among Arcadia Resources Inc, The NYSE Amex Composite Index
And A Peer Group
Among Arcadia Resources Inc, The NYSE Amex Composite Index
And A Peer Group
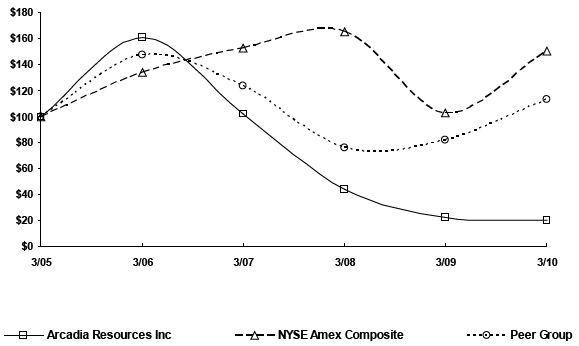 |
| *$100 invested on 3/31/05 in stock or
index, including reinvestment of dividends. Fiscal year ending March 31. |
| 3/05 | 3/06 | 3/07 | 3/08 | 3/09 | 3/10 | |||||||
| Arcadia Resources Inc | 100.00 | 161.03 | 101.54 | 44.10 | 22.08 | 20.36 | ||||||
| NYSE Amex Composite | 100.00 | 133.63 | 152.48 | 165.33 | 102.33 | 150.42 | ||||||
| Peer Group | 100.00 | 147.59 | 123.65 | 75.52 | 81.48 | 113.12 |
19
ITEM 6. SELECTED FINANCIAL
DATA
The selected
consolidated summary financial data is set forth in the table below. You should
read the following summary consolidated financial data in conjunction with the
audited consolidated financial statements and notes thereto included elsewhere
in this Form 10-K.
(In thousands, except
per share data)
| Year Ended | Year Ended | Year Ended | Year Ended | Year Ended | ||||||||||||||||
| March 31, | March 31, | March 31, | March 31, | March 31, | ||||||||||||||||
| 2010 | 2009 | 2008 | 2007 | 2006 | ||||||||||||||||
| Revenues, net | $ | 103,602 | $ | 106,132 | $ | 104,819 | $ | 106,125 | $ | 99,100 | ||||||||||
| Cost of revenues | 74,374 | 74,370 | 74,230 | 74,709 | 69,956 | |||||||||||||||
| Gross profit | 29,228 | 31,762 | 30,589 | 31,416 | 29,144 | |||||||||||||||
| Selling, general and administrative expenses | 40,279 | 40,483 | 37,976 | 35,645 | 29,996 | |||||||||||||||
| Depreciation and amortization | 1,850 | 2,016 | 1,860 | 1,673 | 1,667 | |||||||||||||||
| Goodwill and intangible asset impairment | 14,599 | 23,511 | - | - | - | |||||||||||||||
| Operating loss | (27,500 | ) | (34,248 | ) | (9,247 | ) | (5,902 | ) | (2,519 | ) | ||||||||||
| Total other expenses (income) | 2,422 | 8,634 | 4,446 | 3,572 | 2,457 | |||||||||||||||
| Loss from continuing operations before income taxes | (29,922 | ) | (42,882 | ) | (13,693 | ) | (9,474 | ) | (4,976 | ) | ||||||||||
| Current income tax expense | 29 | 122 | 535 | 138 | 119 | |||||||||||||||
| Loss from continuing operations | (29,951 | ) | (43,004 | ) | (14,228 | ) | (9,612 | ) | (5,095 | ) | ||||||||||
| Discontinued operations: | ||||||||||||||||||||
| Income (loss) from discontinued operations | (1,692 | ) | (2,208 | ) | (6,781 | ) | (34,160 | ) | 384 | |||||||||||
| Net gain (loss) on disposal | 557 | (1,258 | ) | (2,389 | ) | - | - | |||||||||||||
| (1,135 | ) | (3,466 | ) | (9,170 | ) | (34,160 | ) | 384 | ||||||||||||
| NET LOSS | $ | (31,086 | ) | $ | (46,470 | ) | $ | (23,398 | ) | $ | (43,772 | ) | $ | (4,711 | ) | |||||
| Basic and diluted loss per share: | ||||||||||||||||||||
| Loss from continuing operations | $ | (0.18 | ) | $ | (0.32 | ) | $ | (0.12 | ) | $ | (0.11 | ) | $ | (0.06 | ) | |||||
| Loss from discontinued operations | (0.01 | ) | (0.03 | ) | (0.07 | ) | (0.37 | ) | - | |||||||||||
| $ | (0.19 | ) | $ | (0.35 | ) | $ | (0.19 | ) | $ | (0.48 | ) | $ | (0.06 | ) | ||||||
| Weighted average number of basic and diluted | ||||||||||||||||||||
| common shares outstanding | 166,840 | 134,583 | 122,828 | 91,433 | 83,834 | |||||||||||||||
| As of March 31, | |||||||||||||||||
| 2010 | 2009 | 2008 | 2007 | 2006 | |||||||||||||
| Balance Sheet Data (excluding assets/liabilities of | |||||||||||||||||
| discontinued operations): | |||||||||||||||||
| Total current assets | $ | 20,376 | $ | 19,828 | $ | 25,295 | $ | 24,345 | $ | 22,036 | |||||||
| Working capital | 8,390 | 10,150 | 18,648 | (9,505 | ) | 13,790 | |||||||||||
| Total assets | 33,196 | 48,084 | 76,565 | 82,985 | 51,008 | ||||||||||||
| Total long-term debt, including current maturities | 33,993 | 38,936 | 38,735 | 44,044 | 14,619 | ||||||||||||
| Total liabilities | 44,971 | 47,522 | 44,937 | 54,466 | 22,529 | ||||||||||||
| Total stockholders’ equity (deficit) | (11,775 | ) | 9,833 | 49,797 | 54,084 | 57,044 | |||||||||||
20
ITEM 7. MANAGEMENT’S DISCUSSION AND ANALYSIS
OF FINANCIAL CONDITION AND RESULTS OF OPERATIONS
Cautionary Statement Concerning
Forward-Looking Statements
The MD&A should
be read in conjunction with the other sections of this report, including the
consolidated financial statements and notes thereto beginning on page F-1 of
this report and the subsection captioned “Disclosure Regarding Forward-Looking
Statements” above. Historical results set forth in Selected Consolidated
Financial Information and the Financial Statements beginning on page F-4 and
this section should not be taken as indicative of our future operations.
Critical Accounting
Policies
The preparation of
financial statements in conformity with accounting principles generally accepted
in the United States requires management to make estimates and assumptions that
affect the reported amounts of assets and liabilities and disclosure of
contingent assets and liabilities at the date of the financial statements and
the reported amounts of revenues and expenses during the reporting period.
Actual results could differ from those estimates.
Identified below are
some of the more significant accounting policies followed by the Company in
preparing the accompanying consolidated financial statements. For further
discussion of our accounting policies see “Note 1 – Description of Company and
Significant Accounting Policies” in the notes to the consolidated financial
statements.
Revenue Recognition
In general, the
Company recognizes revenue when all revenue recognition criteria are met, which
typically is when:
- Evidence of an arrangement
exists;
- Services have been provided or
goods have been delivered;
- The price is fixed or
determinable; and
- Collection is reasonably assured.
Revenues for services
are recorded in the period the services are rendered. Revenues for products are
recorded in the period delivered based on sales prices established with the
client or its insurer prior to delivery.
Allowance for Doubtful Accounts
The Company reviews
its accounts receivable balances on a periodic basis. Accounts receivable have
been reduced by the estimated allowance for doubtful accounts.
The provision for
doubtful accounts is primarily based on historical analysis of the Company’s
records. The analysis is based on patient and institutional client payment
histories, the aging of the accounts receivable, and specific review of patient
and institutional client records. As actual collection experience changes,
revisions to the allowance may be required. Any unanticipated change in
customers’ creditworthiness or other matters affecting the collectability of
amounts due from customers could have a material effect on the results of
operations in the period in which such changes or events occur. After all
reasonable attempts to collect a receivable have failed, the receivable is
written off against the allowance.
Goodwill
The Company has
acquired several entities resulting in the recording of intangible assets,
including goodwill, which represents the excess of the purchase price over the
fair value of the net assets of businesses acquired.
21
The Company has three
reporting units included in continuing operations: Services, Pharmacy and
Catalog. These reporting units are also the Company’s three reportable business
segments. The following table represents goodwill by reporting unit as of March
31:
| 2010 | 2009 | |||||
| Services | $ | - | $ | 14,553 | ||
| Pharmacy | 2,500 | 2,500 | ||||
| Total | $ | 2,500 | $ | 17,053 | ||
The Company conducts
its annual goodwill impairment assessment during its fiscal fourth quarter. We
test for impairment between annual goodwill impairment assessments if events
occur or circumstances change that would more likely than not reduce the fair
value of a reporting unit below its carrying amount. Examples of such events or
circumstances include, but are not limited to, the following: (i) a significant
adverse change in business climate; (ii) an adverse action or assessment by a
regulator; (iii) unanticipated competition; or (iv) a decline in the market
capitalization below net book value.
Goodwill is tested
using a two-step process. The first step of the goodwill impairment assessment,
used to identify potential impairment, compares the fair value of a reporting
unit with its carrying amount, including goodwill (“net book value”). If the
fair value of a reporting unit exceeds its net book value, goodwill of the
reporting unit is considered not impaired, thus the second step of the
impairment test is unnecessary. If net book value of a reporting unit exceeds
its fair value, the second step of the goodwill impairment test will be
performed to measure the amount of impairment loss, if any. The second step of
the goodwill impairment assessment, used to measure the amount of impairment
loss, if any, compares the implied fair value of reporting unit goodwill, which
is determined in the same manner as the amount of goodwill recognized in a
business combination, with the carrying amount of that goodwill. If the carrying
amount of reporting unit goodwill exceeds the implied fair value of that
goodwill, an impairment loss islrecognized in an amount equal to that
excess.
In the first step of
the goodwill impairment assessment, the Company uses an income approach to
derive a present value of the reporting unit's projected future annual cash
flows and the present residual value of the reporting unit. The fair value is
calculated as the sum of the projected discounted cash flows of the reporting
unit over the next five years and the terminal value at the end of those five
years. The Company uses a variety of underlying assumptions to estimate these
future cash flows, which vary for each of the reporting units and include (i)
future revenue growth rates, (ii) future operating profitability, (iii) the
weighted-average cost of capital and (iv) a terminal growth rate. In addition,
the Company makes certain judgments about the allocation of corporate overhead
costs in order to calculate the fair values of each of the Company’s reporting
units. Estimates of future revenue and expenses associated with each reporting
unit are the most sensitive of estimates related to the fair value calculations.
Other factors considered in the fair value calculations include assumptions as
to the business climate, industry and economic conditions. The assumptions are
subjective and different estimates could have a significant impact on the
results of the impairment analyses. In determining the appropriate assumptions,
management considers historic trends as well as current activities and
initiatives. If the Company’s estimates and assumptions used in the discounted
future cash flows should change at some future date, the Company could incur an
impairment charge which could have a material adverse effect on the results of
operations for the period in which the impairment occurs.
In addition to
estimating fair value of the Company’s reporting units using the income
approach, the Company also estimates fair value using a market-based approach
which relies on values based on market multiples derived from comparable public
companies. The Company uses the estimated fair value of the reporting units
under the market-based approach to validate the estimated fair value of the
reporting units under the income approach.
Intangible Assets
Acquired finite-lived
intangible assets are amortized using the economic benefit method when reliable
information regarding future cash flows is available and the straight-line
method when this information is unavailable. The estimated useful lives are as
follows:
| Trade name | 30 years | |
| Customer relationships (depending on the type of business purchased) | 5 to 15 years |
Income Taxes
Income taxes are
accounted for under the asset and liability method. Accordingly, deferred tax
assets and liabilities are recognized currently for the future tax consequences
attributable to the temporary differences between the financial statement
carrying amounts of assets and liabilities and their respective tax bases, as
well as for tax credit carryforwards. Deferred tax assets and liabilities are
measured using enacted tax rates in
effect for the year in which those temporary differences are expected to be
recovered or settled. A valuation allowance is recorded to reduce the carrying
amounts of deferred tax assets if it is more likely than not that such assets
will not be realized.
22
We consider all
available evidence, both positive and negative, to determine whether, based on
the weight of that evidence, a valuation allowance is needed for some portion or
all of a net deferred tax asset. Judgment is used in considering the relative
impact of negative and positive evidence. In arriving at these judgments, the
weight given to the potential effect of negative and positive evidence is
commensurate with the extent to which it can be objectively verified. We record
a valuation allowance to reduce our deferred tax assets and review the amount of
such allowance periodically. When we determine certain deferred tax assets are
more likely than not to be utilized, we will reduce our valuation allowance
accordingly. Realization of deferred tax assets is dependent on future earnings,
if any, the timing and amount of which are uncertain.
Internal Revenue Code
Section 382 rules limit the utilization of net operating losses following a
change in control of a company. It has been determined that a change in control
of the Company took place at the time of the reverse merger in 2004. Therefore,
the Company’s ability to utilize certain net operating losses generated by
Critical Home Care will be subject to severe limitations in future periods,
which could have an effect of eliminating substantially all the future income
tax benefits of the respective net operating losses. Tax benefits from the
utilization of net operating loss carryforwards will be recorded at such time as
they are considered more likely than not to be realized.
Fiscal Year Ended March 31, 2010 Compared
to the Fiscal Year Ended March 31, 2009
Results of Continuing Operations (in
thousands, except per share amounts)
| Years Ended | ||||||||
| March 31, | ||||||||
| 2010 | 2009 | |||||||
| Revenues, net | $ | 103,602 | $ | 106,132 | ||||
| Cost of revenues | 74,374 | 74,370 | ||||||
| Gross profit | 29,228 | 31,762 | ||||||
| Selling, general and administrative expenses | 40,279 | 40,483 | ||||||
| Depreciation and amortization | 1,850 | 2,016 | ||||||
| Goodwill and intangible asset impairment | 14,599 | 23,511 | ||||||
| Total operating expenses | 56,728 | 66,010 | ||||||
| Operating loss | (27,500 | ) | (34,248 | ) | ||||
| Other expenses (income): | ||||||||
| Interest expense, net | 3,371 | 4,072 | ||||||
| Loss on extinguishment of debt | - | 4,487 | ||||||
| Change in fair value of warrant liability | (979 | ) | - | |||||
| Other | 30 | 75 | ||||||
| Total other expenses (income) | 2,422 | 8,634 | ||||||
| Net loss before income tax expense | (29,922 | ) | (42,882 | ) | ||||
| Income tax expense | 29 | 122 | ||||||
| Net loss from continuing operations | $ | (29,951 | ) | $ | (43,004 | ) | ||
| Weighted average number of shares — basic and diluted | 166,840 | 134,583 | ||||||
| Net loss from continuing operations per share — basic and diluted | $ | (0.18 | ) | $ | (0.32 | ) | ||
23
Revenues, Cost of Revenues and Gross Profits
The following table
summarizes revenues, cost of revenues and gross profit by segment for the fiscal
years ended March 31, (in thousands):
| % of Total | % of Total | $ Increase/ | % Increase/ | ||||||||||||||||
| 2010 | Revenue | 2009 | Revenue | (Decrease) | (Decrease) | ||||||||||||||
| Revenues, net: | |||||||||||||||||||
| Services | $ | 86,635 | 83.6 | % | $ | 97,537 | 92.0 | % | $ | (10,902 | ) | -11.2 | % | ||||||
| Pharmacy | 15,154 | 14.6 | % | 6,019 | 5.7 | % | 9,135 | 151.8 | % | ||||||||||
| Catalog | 1,813 | 1.7 | % | 2,576 | 2.4 | % | (763 | ) | -29.6 | % | |||||||||
| 103,602 | 100.0 | % | 106,132 | 100.0 | % | (2,530 | ) | -2.4 | % | ||||||||||
| Cost of revenues: | |||||||||||||||||||
| Services | 60,247 | 67,779 | (7,532 | ) | -11.1 | % | |||||||||||||
| Pharmacy | 13,032 | 4,997 | 8,035 | 160.8 | % | ||||||||||||||
| Catalog | 1,095 | 1,594 | (499 | ) | -31.3 | % | |||||||||||||
| 74,374 | 74,370 | 4 | 0.0 | % | |||||||||||||||
| Gross | Gross | ||||||||||||||||||
| Margin % | Margin % | ||||||||||||||||||
| Gross margins: | |||||||||||||||||||
| Services | 26,388 | 30.5 | % | 29,758 | 30.5 | % | (3,370 | ) | -11.3 | % | |||||||||
| Pharmacy | 2,122 | 14.0 | % | 1,022 | 17.0 | % | 1,100 | 107.6 | % | ||||||||||
| Catalog | 718 | 39.6 | % | 982 | 38.1 | % | (264 | ) | -26.9 | % | |||||||||
| $ | 29,228 | 28.2 | % | $ | 31,762 | 29.9 | % | $ | (2,534 | ) | -8.0 | % | |||||||
The following table
summarizes the components of the Services segment revenues for the fiscal years
ended March 31, (in thousands):
| % of Total | % of Total | $ Increase/ | % Increase/ | ||||||||||||||||
| 2010 | Revenue | 2009 | Revenue | (Decrease) | (Decrease) | ||||||||||||||
| Home care | $ | 68,511 | 79.2 | % | $ | 69,204 | 71.0 | % | $ | (693 | ) | -1.0 | % | ||||||
| Medical staffing | 12,296 | 14.2 | % | 18,779 | 19.2 | % | (6,483 | ) | -34.5 | % | |||||||||
| Travel staffing | 5,828 | 6.6 | % | 9,554 | 9.8 | % | (3,726 | ) | -39.0 | % | |||||||||
| Total Services | $ | 86,635 | 100.0 | % | $ | 97,537 | 100.0 | % | $ | (10,902 | ) | -11.2 | % | ||||||
Services Segment
The Services segment
remains the largest source of revenue for the Company. Home care revenue as a
percentage of the total segment revenue continues to increase, reaching 79.2% of
such revenue during fiscal 2010. Home care revenues fell by $693,000, or 1.0%,
from $69,204,000 to $68,511,000 over the prior year. Home care revenues were
adversely affected by several factors, including reductions in
hours/reimbursement rates by state-sponsored programs in some of the Company’s
key markets such as Arizona, North Carolina, Washington and California; high
unemployment rates, particularly in the State of Michigan where the Company has
substantial operations, resulting in increased availability of family caregivers
to provide care in lieu of our services; and the significant reduction in the
value of individual retirement savings and investment accounts during 2008 and
2009, resulting in some reduction in the hours of services
purchased.
24
The negative trends
in the medical staffing and travel staffing markets continued during fiscal
2010. Medical staffing and travel staffing declined by 34.5% and 39.0%,
respectively, as compared with the prior year. Several factors have contributed
to the lower level of overall sales. Market conditions for temporary medical
staffing are currently not favorable, driven by lower patient censuses in
facilities; constraints on facility staffing budgets; the return of part-time
staff to full-time status and increases in overtime accepted by permanent staff
of our potential customers, largely in response to overall economic conditions;
and delays in the construction and opening of new facilities that often drives
short-term staffing requirements. In addition to these market conditions, travel
staffing revenues have been adversely affected by state budget constraints with
a major correctional institution customer.
Gross margin in the
Home Care and Medical Staffing business was 30.5% for both fiscal 2010 and 2009.
While the overall mix of higher margin home care business increased as a
percentage of total revenues, this gross margin benefit was offset by several
factors. These factors included a reduction in margins on several
state-sponsored home care programs, such as Arizona, North Carolina, Washington
and California; a reduction in the percentage of business generated in some of
the Company’s higher margin offices and markets, including the state of
Michigan; and an overall decline in the margins in the medical staffing business
due to changes in staffing business mix. In addition, in the fiscal fourth
quarter 2010, the Company experienced an increase in state unemployment taxes in
many of the states in which it operates.
Pharmacy Segment
The revenue in the
Pharmacy segment increased by $9,135,000, or 151.8%, to $15,154,000 during
fiscal 2010 compared to the prior year. This growth was driven by the Company’s
DailyMed program. During the second half of fiscal 2009, revenue generated from
the DailyMed medication management program began to increase at a rapid pace,
and the Company continues to pursue additional opportunities with government
entities and managed care organizations. The revenue growth in fiscal 2010 was
primarily driven by the Company’s relationship with WellPoint. The Company
continues to work with the Indiana Medicaid program and its managed care
providers to identify and enroll those patients who will benefit most from
participation in the DailyMed program. Additionally, in June 2009, the Company
announced the signing of an agreement with WellPoint. Under this agreement, the
Company will initiate the DailyMed medication management program to WellPoint’s
high-risk Medicaid members in five states where WellPoint companies provide
Medicaid managed care benefits. The five states are: California, Virginia, New
York, Kansas and South Carolina. The program was launched to WellPoint’s high
risk members in Virginia in August 2009, and the Company began recognizing
revenue from these patients in September 2009. The program was rolled out to
WellPoint’s California patients during fiscal fourth quarter 2010, and it will
be rolled out to patients in the remaining three states during the first half of
fiscal 2011. The Company anticipates the majority of its Pharmacy revenue growth
over the next several quarters to be attributable to the WellPoint
arrangement.
The costs of revenue
in the Pharmacy segment include the cost of medications and packaging for the
DailyMed proprietary dispensing system. Gross margins for fiscal 2010 were 14.0%
compared to 17.0% for the prior year. In general, the margins have been
negatively impacted by shifts in the payer and patient mix as the Pharmacy
segment’s revenue grows. The revenue growth during fiscal 2010 was primarily
driven by the Indiana Medicaid program and the WellPoint patients in Virginia.
The margins associated with these patients are lower due to a combination of
lower reimbursement rates and the brand/generic drug mix where generic drugs
have lower margins than brand drugs. Management expects margins to improve
during fiscal 2011 due to a new prime vendor agreement entered into in April
2010 as well as other on-going operational initiatives, including more
aggressive purchasing efforts, and technology improvements. In the future,
margins will continue to be impacted by the changing payer and patient mix as
the Pharmacy patient and revenue base grows.
Catalog Segment
Revenue from the
Company’s catalog and internet-based home health products business decreased
29.6% to $1,813,000 during fiscal 2010 compared to the prior year. The decrease
in revenue is due in part to the reduction in catalog mailing to a more targeted
audience, and in part due to economic conditions as virtually all of this
business is cash and/or credit business.
The gross margin
increased to 39.6% during fiscal 2010 compared to 38.1% for the prior year. The
increase in gross margin is largely related to the mix of business between our
mail order catalog and on-line sales revenue.
25
Selling, General and Administrative
The following table
summarizes selling, general and administrative expenses by segment for the
fiscal years ended March 31 (in thousands):
| % of Total | % of Total | $ Increase/ | % Increase/ | ||||||||||||||||
| 2010 | SG&A | 2009 | SG&A | (Decrease) | (Decrease) | ||||||||||||||
| Services | $ | 21,968 | 54.5 | % | $ | 25,194 | 62.2 | % | $ | (3,226 | ) | -12.8 | % | ||||||
| Pharmacy | 8,088 | 20.1 | % | 4,522 | 11.1 | % | 3,566 | 78.9 | % | ||||||||||
| Catalog | 795 | 2.0 | % | 1,130 | 2.8 | % | (335 | ) | -29.6 | % | |||||||||
| Corporate | 9,428 | 23.4 | % | 9,637 | 23.8 | % | (209 | ) | -2.2 | % | |||||||||
| $ | 40,279 | 100.0 | % | $ | 40,483 | 100.0 | % | $ | (204 | ) | -(0.5 | %) | |||||||
| SG&A as a % of net revenue | 38.9% | 38.1% | |||||||||||||||||
Services Segment
The Services segment
selling, general and administrative expense decreased to $21,968,000 for fiscal
2010 compared to $25,194,000 for fiscal 2009. This $3,226,000, or 12.8%,
decrease was primarily due to a $1,346,000 decrease in commissions paid to the
affiliates, a $838,000 decrease in bad debt expense and a $674,000 decrease in
labor costs. Affiliate commissions are based on the gross margins of the
individual affiliates, and the decrease reflects a decrease in revenues and
gross margins generated from the affiliate owned locations. The decrease in bad
debt expense is due to a combination of higher than normal bad debt expense in
the prior year and an increased focus on collection efforts during fiscal 2010.
The decrease in labor costs was a direct result of the Company’s efforts to
reduce headcount in certain areas.
Pharmacy Segment
The Pharmacy segment
selling, general and administrative expense increased by $3,566,000, or 78.9%,
to $8,088,000 during fiscal 2010 compared to fiscal 2009. In general, the
increase in Pharmacy expenses was due to the significant growth in revenue in
this segment year over year. Specifically, total labor costs increased by
$1,635,000 during fiscal 2010 as the Company hired additional pharmacists,
pharmacy technicians, and customer service representatives in order to process
the increased volume and to support the patient care component of the DailyMed
program. With patient enrollment efforts associated with the WellPoint
agreement, the Company also incurred $472,000 in costs associated with an
external call center during fiscal 2010. Shipping costs and bad debt expense
also increased during the period by $393,000 and $147,000, respectively, which
was consistent with the revenue growth. The remaining increase during the
current year was due to various other administrative expenses, including travel,
marketing materials, and various service fees, that increased with the growth in
revenue and headcount that has occurred over the last year.
The DailyMed program
includes a significant level of patient care and value-added services designed
to improve compliance, adherence and safety of a patient’s medication regimen.
These pharmacy services include consolidation, synchronization and transfer of
prescriptions and medication therapy management (MTM) services. The Company
makes a significant investment in these services as they are a key part to
achieving the patient benefits and health care cost reductions associated with
DailyMed. The Company’s business model contemplates that payers will be willing
to share some of these cost savings as they are realized either through a “per
member per month” fee or some type of cost savings arrangement. To date, the
Company has not recognized any revenue for these services. The Company has
elected to provide these services to Indiana Medicaid customers without a
cost-sharing arrangement as Indiana Medicaid has entered into a research
agreement with the Purdue University School of Pharmacy to study DailyMed’s
ability to reduce total health care costs.
Catalog Segment
The Catalog segment
selling, general and administrative expense decreased by $335,000, or 29.6%,
during fiscal 2010. These decreases were primarily due to a $301,000 decrease in
the costs to produce and mail catalogs.
26
Corporate
Corporate selling,
general and administrative expense decreased by $209,000, or 2.2%, to $9,428,000
for fiscal 2010 compared to $9,637,000 for the prior year. The slight decrease
reflects a general reduction in the Corporate overhead necessary to operate the
business subsequent to the various business divestitures during the fiscal first
quarter 2010. These reductions were offset by increases in:
- legal fees as the number of claims and disputes arising during the normal course of business was higher in fiscal 2010 than fiscal 2009; and,
- equity compensation, which was higher in fiscal 2010 due to a stock option grant to senior management in March 2010 which vested immediately resulting in a $464,000 charge during fiscal fourth quarter 2010.
Depreciation and Amortization
The following table
summarizes depreciation and amortization expense for the fiscal years ended
March 31 (in thousands):
| $ Increase/ | % Increase/ | ||||||||||||
| 2010 | 2009 | (Decrease) | (Decrease) | ||||||||||
| Depreciation and amortization of property and equipment | $ | 1,215 | $ | 1,066 | 149 | 14.0 | % | ||||||
| Amortization of acquired intangible assets | 635 | 950 | (315 | ) | -33.2 | % | |||||||
| Depreciation and amortization – operating expense | $ | 1,850 | $ | 2,016 | $ | (166 | ) | -8.2 | % | ||||
Depreciation and
amortization of property and equipment increased by $149,000 or 14.0%, during
fiscal 2010 compared to the prior year. The increase reflects the increase in
depreciation associated with Pharmacy equipment acquired during the last year
and various software.
Amortization of
acquired intangible assets decreased by $315,000, or 33.2%, during fiscal 2010
compared to the prior year. The decrease reflects the fact that as of March 31,
2009, the Company recognized certain impairment charges relating to amortizable
intangible assets associated with the Pharmacy and Catalog segments, which
ultimately reduced 2010 amortization expense.
Goodwill and Intangible Asset Impairment
As of the end of
fiscal year 2010, the Company performed the first step of the goodwill
impairment analysis for the two reporting units with remaining goodwill balances
at that time: Services and Pharmacy.
The Service segment
is a mature business that has been in existence for more than 30 years. Over
this period of time, the business has experienced periods of growth and decline,
similar to other businesses and industries. Over the last two years, the segment
as a whole has seen declining revenue, and this decline has been primarily
driven by a decline in the medical staffing and travel staffing businesses. Many
of the Service’s segments locations provide both home care and medical staffing
services. During fiscal 2010, home care accounted for 79% of total segment
revenue, and medical staffing and travel staffing, in the aggregate, accounted
for the remaining 21% of revenue. The medical staffing and travel staffing
business experienced a 46% decline in revenue from fiscal 2008 to fiscal 2010.
During this same period, home care revenue increased by 9%, but fiscal 2010
revenue was approximately 1% lower than fiscal 2009. While management believes
that the market for temporary medical staffing services will eventually improve,
the timing and extent of such improvement is uncertain and there could be
further declines before such recovery occurs. In addition, while management
believes that its home care business will grow as population demographics drive
increased demand, in the near-term, such growth will depend in part on the
improvement in the overall U.S. economy and the extent to which state-funded
programs experience additional funding cut-backs. Because management’s ability
to predict the timing and extent of these factors is subject to some
uncertainty, it focused on more recent trends in the annual impairment analysis,
which resulted in lower future cash flow projections than in prior years’
analyses. The impairment analysis resulted in a $14,599,000 goodwill impairment
charge for fiscal 2010, and subsequent to this charge, there is no remaining
goodwill associated with the Services segment.
27
In conjunction with
the fiscal 2009 goodwill impairment analysis (as described below), the Company
recognized a $13,217,000 goodwill impairment charge in the Pharmacy reporting
unit. Subsequent to the impairment charge, the Pharmacy segment has $2,500,000
of remaining goodwill. As evidenced by the growth in its year-over-year revenue
from $6.0 million in fiscal 2009 to $15.2 million in fiscal 2010, the Pharmacy
segment continued to advance its DailyMed business during fiscal 2010, but it
remains in the early stages of development. Management believes that the
DailyMed program will be the primary growth driver for the Company as a whole
over the next several years. In performing the goodwill impairment analysis for
the Pharmacy reporting unit during the fiscal fourth quarter 2010, management
relied on recent trends and future expectations based on these trends and
industry experience to project future operating results. The fiscal 2011 revenue
estimates were based on payer relationships that existed as of the time of the
analysis. The revenue estimates in the future years assume new payer
relationships similar to the WellPoint relationship. Additionally, management
assumed margin improvement over the next five years due to increased volume,
operational improvements and additional revenue from medication adherence
services, which are expected to generate higher margins than drug revenue.
Management also estimated that SG&A as a percentage of revenue will improve
due to software and technological enhancements as well as efficiencies gained
through volume and experience. As of March 31, 2010, the Pharmacy reporting unit
analysis indicated that its fair value was in excess of it carrying value by
approximately 40% so the second step of the analysis was not considered
necessary. The primary events that could negatively affect the Pharmacy
assumptions would be the inability to: add additional payer relationships;
improve margins; and/or reduce the labor costs as much as expected.
Fiscal 2009
The following
summarizes the goodwill and intangible asset impairment expense for fiscal 2009:
| Acquired | |||||||||
| Intangible | |||||||||
| Goodwill | Assets | Total | |||||||
| Pharmacy | $ | 13,217 | $ | 9,402 | $ | 22,619 | |||
| Catalog | 811 | 81 | 892 | ||||||
| Goodwill and intangible asset impairment - total | $ | 14,028 | $ | 9,483 | $ | 23,511 | |||
As of the end of
fiscal 2009, the Company performed the first step of the goodwill impairment
analysis for all three of its reporting units: Services, Catalog and
Pharmacy.
In the impairment
analysis of the Services reporting unit performed as of March 31, 2009,
management assumed a modest revenue growth rate in future years, which was
approximately consistent with the recent trends in the home health care
industry. Management also assumed that margins over the next five years would
remain consistent and that SG&A would improve in fiscal 2010 and then
increase slightly in the years thereafter. As of March 31, 2009, the Services
reporting unit analysis indicated that its fair value was in excess of it
carrying value by approximately 5% so the second step of the analysis was not
considered necessary.
The Pharmacy goodwill
was originally recognized during the fiscal year ended March 31, 2007 in
conjunction with the PrairieStone Pharmacy, LLC acquisition in February 2007. At
the time of the acquisition, PrairieStone marketed several pharmacy-related
products and services, including the DailyMed medication management system and a
license service model whereby it contracted with regional retail chain
pharmacies to provide pharmacy expertise and access to a restricted third party
network. The various PrairieStone offerings were in the early stages of
development, and Company management believed that they could complement the
goods and services being offered by Arcadia Resources, Inc. at the time.
Subsequent to the acquisition, management began to focus on the DailyMed product
because of its perceived potential, and, to date, the Company has not worked to
expand the other PrairieStone offerings. As of March 31, 2009, the DailyMed
business was in its early stages and lacked meaningful historic financial
trends. Additionally, the anticipated growth in the Pharmacy reporting unit had
experienced several delays. In performing the goodwill impairment analysis for
the Pharmacy unit during fiscal fourth quarter 2009, management acknowledged
these issues and the difficulty in projecting the timing and amount of future
revenue and cash flow streams, which are the basis for the fair value estimates
of the reporting unit. Management was obligated to temper its estimates of
future cash flows from the Pharmacy business until such time as those cash flows
have started to actually be realized with sustained regularity. The impairment
analysis resulted in a $13,217,000 impairment charge for fiscal 2009. Subsequent
to the impairment charge, $2,500,000 of goodwill remains in the Pharmacy
reporting unit. In conjunction with the goodwill impairment, the Company also
recognized an impairment expense relating to the Pharmacy segment’s customer
relationships of $9,402,000.
28
During the fourth
quarter fiscal 2009, the Company performed the goodwill impairment analysis for
the Catalog reporting unit. The analysis indicated that the carrying value was
in excess of the fair value due to the financial performance of this business
unit falling short of original projections and the general expectation that the
Catalog business may not grow significantly in the near term due to management’s
focus on the other lines of business. The Company recorded an impairment charge
relating to the Catalog reporting unit of $811,000. Subsequent to the impairment
charge, no goodwill remains related to the Catalog reporting unit. The Company
also recognized a $81,000 impairment of the Catalog’s customer
relationships.
Interest Expense and Income
The following table
summarizes interest expense and income for the fiscal years ended March 31 (in
thousands):
| $ Increase/ | % Increase/ | ||||||||||||||
| 2010 | 2009 | (Decrease) | (Decrease) | ||||||||||||
| Interest expense | $ | 3,395 | $ | 4,123 | $ | (728 | ) | -17.7 | % | ||||||
| Interest income | (24 | ) | (51 | ) | 27 | -52.9 | % | ||||||||
| $ | 3,371 | $ | 4,072 | $ | (701 | ) | -17.2 | % | |||||||
Interest expense for
fiscal 2010 decreased by $728,000, or 17.7%, to $3,395,000 as compared to the
prior year. Total interest expense includes the amortization of debt discounts
and deferred financing costs of $332,000 and $972,000 for fiscal 2010 and 2009,
respectively. The average interest bearing liabilities balance (sum of the
balances at the end of each quarter divided by the number of quarters) for
fiscal 2010 was $35.0 million compared to $37.9 million for fiscal 2009, which
represents a reduction of 7.5%. The overall reduction of debt combined with the
reduction in the amount of amortization of debt discounts and deferred financing
costs resulted in the decrease in interest expense.
Loss on Extinguishment of Debt
The following table
summarizes the components of the loss on extinguishment of debt for the fiscal
year ended March 31, 2009 (in thousands):
| 2009 | |||
| JANA/Vicis debt refinancing - value of equity | $ | 3,769 | |
| Write off of remaining debt discount | 470 | ||
| AmerisourceBergen line of credit amendment | 248 | ||
| Loss on extinguishment of debt - total | $ | 4,487 | |
In conjunction with
the March 25, 2009 debt refinancing with JANA and Vicis, the Company recognized
$3,769,000 as a loss on extinguishment of debt. The Company issued 6,056,499
shares of common stock valued at $2,059,000 to the lenders as consideration for
providing the additional financing and extending the maturity date of the
previously existing debt. The Company also exchanged 4,683,111 warrants held by
two of the lenders (Vicis and JANA) for 5,616,444 shares of common stock and the
incremental fair value was determined to be $1,145,000. Concurrent with the debt
refinancing, the holders of the warrants issued in conjunction with the May 2007
private placement transaction agreed to exchange a total of 2,754,726 warrants
for 2,754,726 shares of common stock with an incremental fair value of
$565,000.
On March 31, 2008,
the Company entered into a $5,000,000 note payable agreement with Vicis, which
had a corresponding debt discount of $1,202,000. In conjunction with the March
25, 2009 debt refinancing with JANA and Vicis, the remaining debt discount of
$470,000 was charged to loss on extinguishment of debt.
On June 5, 2008, the
Company issued AmerisourceBergen 490,000 warrants to purchase common stock at an
exercise price of $0.75 per share. The fair value of the warrants was determined
to be $248,000 and was recorded as a loss on extinguishment of
debt.
No similar expense
was recognized during fiscal 2010.
29
Change in Fair Value of Warrant Liability
As discussed in Note
9 to the consolidated financial statements, the 7,135,713 warrants issued in
November 2009 in conjunction with the equity financing transaction are recorded
as a liability at fair value with subsequent changes in fair value recorded in
earnings. The fair value of the warrants are determined using the Black-Scholes
pricing model and is affected by changes in inputs to that model, including: our
stock price, expected stock price volatility, and contractual terms. To the
extent that the fair value of the warrant liability increases or decreases, the
Company records a loss or gain in the statement of operations. The gain of
$979,000 on the change in fair value of the warrant liability during fiscal 2010
was primarily due to the changes in our stock price.
Income Taxes
Income tax expense
was $29,000 for the year ended March 31, 2010 compared to $122,000 for the year
ended March 31, 2009, a decrease of $93,000. This income tax reduction is
primarily a result of a decrease in the estimated amounts due for Michigan
Business Tax and refunds resulting from overpayments of fiscal 2009 state tax
returns as filed.
Due to the Company’s
losses in recent years, it has paid nominal federal income taxes. For federal
income tax purposes, the Company had significant permanent and timing
differences between book income and taxable income resulting in combined net
deferred tax asset balance to be utilized by the Company for which an offsetting
valuation allowance has been established for the entire amount. The Company has
a net operating loss carryforward for tax purposes totaling $63.3 million that
expires at various dates through 2029. Internal Revenue Code Section 382 rules
limit the utilization of certain of these net operating loss carryforwards upon
a change of control of the Company. It has been determined that a change in
control took place at the time of the reverse merger in 2004, and as such, the
utilization of $700,000 of the net operating loss carryforwards will be subject
to severe limitations in future periods.
Earnings (Loss) from Discontinued Operations
The following table
summarizes the components of the loss from discontinued operations for the
fiscal years ended March 31, (in thousands):
| 2010 | 2009 | |||||||
| Revenues, net: | ||||||||
| Services - Industrial Staffing | $ | 1,223 | $ | 15,842 | ||||
| Home Health Equipment | 1,423 | 17,643 | ||||||
| Pharmacy - Software / Florida | 348 | 2,133 | ||||||
| $ | 2,994 | $ | 35,618 | |||||
| Earnings (loss) from operations: | ||||||||
| Services - Industrial Staffing | $ | (85 | ) | $ | (1,791 | ) | ||
| Home Health Equipment | (1,425 | ) | (352 | ) | ||||
| Pharmacy - Software / Florida | (182 | ) | (65 | ) | ||||
| $ | (1,692 | ) | $ | (2,208 | ) | |||
| Gain (loss) on disposal: | ||||||||
| Services - Industrial Staffing | $ | 201 | $ | - | ||||
| Home Health Equipment | 386 | (1,258 | ) | |||||
| Pharmacy - Software | (30 | ) | - | |||||
| $ | 557 | $ | (1,258 | ) | ||||
| Earnings (loss) from discontinued operations: | ||||||||
| Services - Industrial Staffing | $ | 116 | $ | (1,791 | ) | |||
| Home Health Equipment | (1,039 | ) | (1,610 | ) | ||||
| Pharmacy - Software | (212 | ) | (65 | ) | ||||
| $ | (1,135 | ) | $ | (3,466 | ) | |||
30
Industrial Staffing
Operations
On May 29, 2009, the
Company finalized the sale of substantially all of the assets of its industrial
and non-medical staffing business for cash proceeds of $250,000, which was paid
in five equal installments through September 2009. Additionally, the Company is
to receive 50% of the future earnings of the business until the total payments
equal $1,600,000. During fiscal 2010, the Company received $72,000 in earn out
payments and recorded this amount as an additional gain on the transaction. The
Company retained all accounts receivable for services provided prior to May 29,
2009.
For the year ended
March 31, 2010, the net loss for the Industrial Staffing discontinued operations
was $85,000, and the Company recognized a $201,000 gain on the disposal of
discontinued operations.
HHE Operations
On May 18, 2009, the
Company completed the sale of its ownership interest in Lovell Medical Supply,
Inc., Beacon Respiratory Services of Georgia, Inc., and Trinity Healthcare of
Winston-Salem, Inc. to Aerocare Holdings, Inc. for total proceeds of $4,750,000,
less fees of $150,000. At the time of closing, $475,000 of the purchase price
was held by the buyer to cover the Company’s contingent obligations. During
fiscal 2010, the buyer released $267,000 of this amount, which was recognized as
an additional gain on the sale. In May 2010, the Company received the final
payment of $155,000. A total of $53,000 was retained by the buyer to cover
certain obligations of the Company. The entities sold represented the Southeast
region of the Company’s HHE business.
On May 19, 2009, the
Company entered into an Asset Purchase Agreement with Braden Partners, L.P. to
sell the assets of its Midwest region of the Company’s HHE business. Total
proceeds were $4,000,000, less fees of $150,000. $1,000,000 of the purchase
price was held by the buyer to cover the Company’s contingent obligations. The
Company retained all accounts receivable for services provided prior to May
2009. Subsequent to the transaction date, the buyer made certain claims, and in
June 2010, the buyer and the Company agreed to a final settlement to resolve
these claims. On June 7, 2010, a final payment relating to this transaction of
$500,000 was released to the Company.
As of May 2009, the
Company had sold all of its HHE operations.
For the year ended
March 31, 2010, the net loss for the HHE discontinued operations was $1,425,000
and the Company recognized a $386,000 gain on the disposal of discontinued
operations.
Pharmacy Operations
On June 11, 2009, the
Company entered into an Asset Purchase Agreement with a leading pharmacy
management company to sell substantially all of the assets of JASCORP, LLC
(“JASCORP”) for proceeds of $2,200,000, less fees of $185,000. $220,000 of the
purchase price is being held back by the buyer until December 2011 in order to
cover the Company’s contingent obligations. JASCORP operated the retail pharmacy
software business that the Company acquired in July 2007. As part of the
divestiture, the Company entered into a License and Services Agreement with the
buyer which provides the Company the right to continue to use the software for
internal purposes.
For the year ended
March 31, 2010, the net loss for the Pharmacy discontinued operations was
$182,000, and the Company recognized a $30,000 loss on the disposal of
discontinued operations.
31
Fiscal Year Ended March 31, 2009 Compared to
the Fiscal Year Ended March 31, 2008
Results of Continuing Operations (in
thousands, except per share amounts)
| Years Ended | ||||||||
| March 31, | ||||||||
| 2009 | 2008 | |||||||
| Revenues, net | $ | 106,132 | $ | 104,819 | ||||
| Cost of revenues | 74,370 | 74,230 | ||||||
| Gross profit | 31,762 | 30,589 | ||||||
| Selling, general and administrative expenses | 40,483 | 37,976 | ||||||
| Depreciation and amortization | 2,016 | 1,860 | ||||||
| Goodwill and intangible asset impairment | 23,511 | - | ||||||
| Total operating expenses | 66,010 | 39,836 | ||||||
| Operating loss | (34,248 | ) | (9,247 | ) | ||||
| Other expenses: | ||||||||
| Interest expense, net | 4,072 | 4,317 | ||||||
| Loss on extinguishment of debt | 4,487 | - | ||||||
| Other | 75 | 129 | ||||||
| Total other expenses | 8,634 | 4,446 | ||||||
| Net loss before income tax expense | (42,882 | ) | (13,693 | ) | ||||
| Income tax expense | 122 | 535 | ||||||
| Net loss from continuing operations | $ | (43,004 | ) | $ | (14,228 | ) | ||
| Weighted average number of shares — basic and diluted | 134,583 | 122,828 | ||||||
| Net loss from continuing operations per share — basic and diluted | $ | (0.32 | ) | $ | (0.12 | ) | ||
32
Revenues, Cost of Revenues and Gross Profits
The following table
summarizes revenues, cost of revenues and gross profits by segment for the
fiscal years ended March 31, (in thousands):
| 2009 | % of Total Revenue |
2008 | % of Total Revenue |
$
Increase/ (Decrease) |
% Increase/ (Decrease) |
||||||||||||||
| Revenues, net: | |||||||||||||||||||
| Services | $ | 97,537 | 91.9 | % | $ | 96,589 | 92.2 | % | $ | 948 | 1.0 | % | |||||||
| Pharmacy | 6,019 | 5.7 | % | 5,071 | 4.8 | % | 948 | 18.7 | % | ||||||||||
| Catalog | 2,576 | 2.4 | % | 3,159 | 3.0 | % | (583 | ) | -18.5 | % | |||||||||
| 106,132 | 100.0 | % | 104,819 | 100.0 | % | 1,313 | 1.3 | % | |||||||||||
| Cost of revenues: | |||||||||||||||||||
| Services | 67,779 | 68,395 | (616 | ) | -0.9 | % | |||||||||||||
| Pharmacy | 4,997 | 3,905 | 1,092 | 28.0 | % | ||||||||||||||
| Catalog | 1,594 | 1,930 | (336 | ) | -17.4 | % | |||||||||||||
| 74,370 | 74,230 | 140 | 0.2 | % | |||||||||||||||
| Gross | Gross | ||||||||||||||||||
| Margin % | Margin % | ||||||||||||||||||
| Gross margins: | |||||||||||||||||||
| Services | 29,758 | 30.5 | % | 28,194 | 29.2 | % | 1,564 | 5.5 | % | ||||||||||
| Pharmacy | 1,022 | 17.0 | % | 1,166 | 23.0 | % | (144 | ) | -12.3 | % | |||||||||
| Catalog | 982 | 38.1 | % | 1,229 | 38.9 | % | (247 | ) | -20.1 | % | |||||||||
| $ | 31,762 | 29.9 | % | $ | 30,589 | 29.2 | % | $ | 1,173 | 3.8 | % | ||||||||
The following table
summarizes the components of the Services segment revenues for the fiscal years
ended March 31, (in thousands):
| % of Total | % of Total | $ Increase/ | % Increase/ | ||||||||||||||||
| 2009 | Revenue | 2008 | Revenue | (Decrease) | (Decrease) | ||||||||||||||
| Home care | $ | 69,204 | 71.0 | % | $ | 63,050 | 65.3 | % | $ | 6,154 | 9.8 | % | |||||||
| Medical staffing | 18,779 | 19.3 | % | 21,370 | 22.1 | % | (2,591 | ) | -12.1 | % | |||||||||
| Travel staffing | 9,554 | 9.7 | % | 12,169 | 12.6 | % | (2,615 | ) | -21.5 | % | |||||||||
| Total Services | $ | 97,537 | 100.0 | % | $ | 96,589 | 100.0 | % | $ | 948 | 1.0 | % | |||||||
Services Segment
The Services segment
remains the largest source of revenue for the Company. During fiscal 2009, home
care revenues increased approximately 10% over the same period in the previous
year. A majority of this increase represents organic growth in several of the
Company’s main geographic markets. The increase in sales included growth in
government programs served, as well as private pay and insurance
clients.
The growth in home
care revenues was approximately offset by significant year-over-year declines in
revenue in the medical staffing and travel staffing markets, which declined by
approximately 12% and 22%, respectively, as compared with the prior year. Demand
for the Company’s per diem and travel medical staffing services declined as
compared with the same period a year ago. Several factors have contributed to
the lower level of overall demand, including lower patient censuses in
facilities; constraints on facility staffing budgets; the return of part-time
staff to full-time status and increases in overtime accepted by permanent staff
of our potential customers, largely in response to overall economic conditions;
and delays in the construction and opening of new facilities that often drives
short-term staffing requirements.
33
Gross margins in the
Home Care/Medical Staffing segment increased from 29.2% in fiscal 2008 to 30.5%
in fiscal 2009. The cost of revenues in this segment consists primarily of
employee costs, including wages, taxes, fringe benefits and workers’
compensation expense. The year-over-year improvement in gross margins was driven
primarily by two factors. The first was a reduction in workers’ compensation
expense, reflecting the success of the Company’s on-going efforts to control and
reduce these costs through improved training, timelier reporting and
investigation of claims, and reduced administrative costs. The second factor was
the increased mix of home care revenue as a percentage of sales, with margins in
this market being significantly higher than gross margins in medical and travel
staffing.
Pharmacy Segment
The revenue in the
Pharmacy segment increased by 18.7% during fiscal 2009 compared to fiscal 2008
primarily due to its DailyMed™ programs. During the third and fourth quarters of
fiscal 2009, revenue generated from the Company’s DailyMed™ medication
management program began to increase at a more rapid pace than in previous
quarters. Pharmacy revenue in fiscal 2008 included $641,000 of revenue for
retail pharmacy management services. No such revenue was generated in fiscal
2009.
The costs of revenue
in the Pharmacy segment include the cost of medications sold to clients and
packaging costs for the DailyMed™ proprietary dispensing system. The reduction
in the gross margin percentage from 23% in fiscal 2008 to 17% in fiscal 2009 was
primarily due to the change in revenue mix. Specifically, the pharmacy
management services revenue generated in fiscal 2008 had nominal costs of
revenue associated with it.
Catalog Segment
Revenue from the
Company’s catalog and internet-based home health products business were
previously included as part of the HHE business segment. Catalog business sales
decreased from $3,159,000 in fiscal 2008 to $2,576,000 in fiscal 2009. The 18.5%
decrease in revenue is consistent the Company’s change in approach, which began
in mid-2008, with the goal of becoming more profitable in part by printing and
with fewer catalogs to a more targeted audience. The cost of revenue remained
relatively consistent at 38.1% in fiscal 2009 compared to 38.9% in fiscal 2008.
Selling, General and Administrative
The following table
summarizes selling, general and administrative expenses by segment for the
fiscal years ended March 31 (in thousands):
| % of Total | % of Total | $ Increase/ | % Increase/ | ||||||||||||||||||
| 2009 | SG&A | 2008 | SG&A | (Decrease) | (Decrease) | ||||||||||||||||
| Services | $ | 25,194 | 62.2 | % | $ | 25,061 | 66.0 | % | $ | 133 | 0.5 | % | |||||||||
| Pharmacy | 4,522 | 11.2 | % | 2,379 | 6.2 | % | 2,143 | 90.1 | % | ||||||||||||
| Catalog | 1,130 | 2.8 | % | 1,551 | 4.1 | % | (421 | ) | -27.1 | % | |||||||||||
| Corporate | 9,637 | 23.8 | % | 8,985 | 23.7 | % | 652 | 7.3 | % | ||||||||||||
| $ | 40,483 | 100.0 | % | $ | 37,976 | 100.0 | % | $ | 2,507 | (6.6 | %) | ||||||||||
| SG&A as a % of net revenue | 38.1 | % | 36.2 | % | |||||||||||||||||
Services Segment
The Services segment
selling, general and administrative expense increased slightly to $25,194,000
for fiscal 2009 compared to $25,061,000 for fiscal 2008. The Carolina Care, LLC
acquisition in April 2008 contributed an additional $400,000 of total expenses
during fiscal 2009. In addition, the increase reflects an increase in bad debt
expense of $749,000 approximately offset by a decrease in the commissions paid
to the affiliate agencies of $892,000. Affiliate commissions are based on the
gross margins of the individual affiliates, and the decrease reflects a decrease
in revenues and gross margins generated from the affiliate owned locations for
fiscal 2009 compared to the prior year.
34
Pharmacy Segment
The increase in the
Pharmacy segment selling, general and administrative expense from $2,379,000 in
fiscal 2008 to $4,522,000 in fiscal 2009 was due to the following:
- The Company’s investment in the infrastructure and additional employees necessary to support the expected growth in the Pharmacy segment. Management anticipates the Pharmacy SG&A as a percentage of revenue to decrease moving forward as the additional investments in infrastructure decrease.
- The Company consolidated its Paducah, Kentucky pharmacy operations into its new Indianapolis, Indiana pharmacy during the fiscal quarter ended December 31, 2008. During the transition period, both pharmacies were open for approximately two months. The Company incurred severance costs associated with the ultimate closure of the Paducah location. The Company incurred approximately $500,000 in expenses relating to the wind down of the Paducah pharmacy and the severance costs.
Catalog Segment
The Catalog segment
selling, general and administrative expense decreased by $421,000, or 27.1%, in
fiscal 2009 compared to the prior year. This decrease was due to a decrease in
catalog production and mailing costs as the Company changed its approach in an
attempt to increase profitability by printing and sending fewer catalogs to a
more targeted audience.
Corporate
The $652,000 increase
in Corporate selling, general and administrative expense during fiscal 2009 was
due to the following:
- A change in the classification of certain employees who were previously included in the Services segment to Corporate. Historically, employees in the Southfield, Michigan location supported the Services segment almost exclusively. During fiscal 2008, the Company centralized many of its corporate functions in Southfield, Michigan, and these employees now support the entire organization. Beginning in fiscal 2009, the Company began to more accurately separate and record these corporate functions from the segment specific functions; and
- Beginning in fiscal 2009, Corporate absorbed all insurance expense in a effort to consolidate and review all policies. During fiscal 2008, insurance expense was charged to the various segments. This resulted in a $936,000 increase in Corporate SG&A expenses. On a consolidated basis, insurance expense increased by approximately $200,000 in fiscal 2009.
These increases were
partially offset by the following:
- In the third quarter of fiscal 2008, the Company hired an in-house legal counsel, and as a result, legal fees decreased significantly during fiscal 2009. Additionally, audit fees and fees relating to Sarbanes-Oxley requirements decreased due to the reduced audit requirements when the Company became a non-accelerated filer in fiscal 2009. In the aggregate, professional fees decreased by approximately $1,033,000 during fiscal 2009.
- The reduction of equity compensation expense. During the fiscal 2008 second quarter, the Company recognized approximately $700,000 relating to the vesting of certain stock options consistent with the former CEO’s separation agreement executed in July 2007. The expense did not repeat in fiscal 2009.
Depreciation and Amortization
The following table
summarizes depreciation and amortization expense for the fiscal years ended
March 31 (in thousands):
| $ Increase/ | % Increase/ | ||||||||||||
| 2009 | 2008 | (Decrease) | (Decrease) | ||||||||||
| Depreciation and amortization of property and equipment | $ | 1,066 | $ | 732 | 334 | 45.6 | % | ||||||
| Amortization of acquired intangible assets | 950 | 1,128 | (178 | ) | -15.8 | % | |||||||
| Depreciation and amortization – operating expense | $ | 2,016 | $ | 1,860 | $ | 156 | 8.4 | % | |||||
35
Depreciation and
amortization of property and equipment increased by approximately $334,000, or
45.6%, during the year ended March 31, 2009 compared to the prior year. This
increase reflects the increase in depreciation associated with various software
and computer equipment acquired over the last two years.
Amortization of
acquired intangible assets decreased by $178,000, or 15.8%, during the year
ended March 31, 2009. The decrease reflects the decrease in the amortization
associated with customer relationships. The Company primarily uses the economic
benefit method of amortizing intangible assets, which attempts to match the
amortization expense with the anticipated economic benefit of the asset as
determined at the time of the acquisition. The estimated economic benefit
typically decreases as more time passes since the acquisition. As such, the
corresponding amortization expense also decreases.
As discussed below,
the Company wrote off $9,483,000 in acquired amortizable intangible assets
during the fiscal fourth quarter of 2009. This will significantly reduce the
amortization expense in future years.
Goodwill and Intangible Asset Impairment
No goodwill or
intangible asset impairment expense was recognized in continuing operations
during fiscal 2008. The following summarizes the goodwill and intangible asset
impairment expense for fiscal 2009:
| Acquired | |||||||||
| Intangible | |||||||||
| Goodwill | Assets | Total | |||||||
| Pharmacy | $ | 13,217 | $ | 9,402 | $ | 22,619 | |||
| Catalog | 811 | 81 | 892 | ||||||
| Goodwill and intangible asset impairment - total | $ | 14,028 | $ | 9,483 | $ | 23,511 | |||
In accordance with
our policy, as of the end of fiscal year 2009, the Company performed the first
step of the goodwill impairment analysis for all three of our reporting units:
Services, Catalog and Pharmacy.
The Services
reporting unit is a mature business so historic trends within this business unit
and the industry are the primary consideration in determining appropriate
assumptions. Revenue estimates are based on a combination of recent trends and
future expectations within the reporting unit and the industry as a whole.
Expense estimates are primarily based on internal trends and likely changes to
these trends based on known information or current initiatives. In our
impairment analysis performed as of March 31, 2009, management assumed revenue
growth rates consistent with recent trends in the home health care industry.
Management also assumed that margins over the next five years would remain
consistent at between 30.0% and 30.5% compared to margins of 30.5% recognized in
fiscal 2009. With regards to total selling, general and administrative expenses
(“SG&A”) for the Services reporting unit, management assumed that it would
decrease by approximately 2% for the year ended March 31, 2010 and then slightly
increase in the years thereafter. The decrease in SG&A expenses in the first
year of the projections reflects the impact of certain charges taken fiscal 2009
as well as the benefits of various cost reduction initiatives. In the
projections, the total SG&A is impacted by the amount of corporate
allocation charged to the Services segment. The Company believes that the
Pharmacy segment will grow significantly over the next several years, and as
this growth occurs, the amount of fixed corporate overhead allocated to the
Pharmacy will increase with a corresponding decrease to the Services segment. As
of March 31, 2009, the Services reporting unit analysis indicated that its fair
value was in excess of it carrying value by approximately 5% so the second step
of the analysis was not considered necessary. The primary events that could
negatively affect the Services assumptions would be the inability to grow
revenue either due to lack of internal execution or to overall economic
conditions or a combination thereof.
The Pharmacy goodwill
was originally recognized during the fiscal year ended March 31, 2007 in
conjunction with the PrairieStone Pharmacy, LLC (“PrairieStone”) acquisition in
February 2007. At the time of the acquisition, PrairieStone marketed several
pharmacy-related products and services, including the DailyMed medication
management system and a license service model whereby it contracted with
regional retail chain pharmacies to provide pharmacy expertise and access to a
restricted third party network. The various PrairieStone offerings were in the
early stages of development, and Company management believed that they could
complement the goods and services being offered by the Company at the time.
Subsequent to the acquisition, management began to focus on the DailyMed product
because of its perceived potential, and the Company has not worked to expand the
other PrairieStone offerings. The DailyMed business is in its early stages and
lacks meaningful historic financial trends. Additionally, the anticipated growth
in the Pharmacy reporting unit has experienced several delays to date. In
performing the goodwill impairment analysis for the Pharmacy unit during fiscal
fourth quarter 2009, management acknowledged these issues and the difficulty in
projecting the timing and amount of future revenue and cash flow streams, which
are the basis for the fair value estimates of the reporting unit. Management was
obligated to temper its estimates of future cash flows from the Pharmacy
business until such time as those cash flows have started to actually be
realized with sustained regularity. The impairment analysis resulted in a
$13,217,000 impairment charge for fiscal 2009. Subsequent to the impairment
charge, $2,500,000 of goodwill remains in the Pharmacy reporting unit.
Management does not believe that the historic financial performance of the
Pharmacy segment is indicative of future results and continues to believe that
the Pharmacy business is the primary revenue growth driver for the Company as a
whole.
36
In conjunction with
the goodwill impairment, the Company recognized also an impairment expense
relating to the Pharmacy segment’s customer relationships of
$9,402,000.
During the fourth
quarter of fiscal 2009, the Company performed the goodwill impairment analysis
for the Catalog reporting unit. The analysis indicated that the carrying value
was in excess of the fair value due to the financial performance of this
business unit falling short of original projections and the general expectation
that the Catalog business may not grow significantly in the near term due to
management’s focus on the other lines of business. The Company recorded an
impairment charge relating to the Catalog reporting unit of $811,000. Subsequent
to the impairment charge, no goodwill remains related to the Catalog reporting
unit.
Interest Expense, Net
The following table
summarizes net interest expense for the fiscal years ended March 31 (in
thousands):
| $ Increase/ | % Increase/ | ||||||||||||||
| 2009 | 2008 | (Decrease) | (Decrease) | ||||||||||||
| Interest expense | $ | 4,123 | $ | 4,395 | $ | (272 | ) | -6.2 | % | ||||||
| Interest income | (51 | ) | (78 | ) | 27 | -34.6 | % | ||||||||
| $ | 4,072 | $ | 4,317 | $ | (245 | ) | -5.7 | % | |||||||
The average interest
bearing liabilities balance (balance as of each quarter end during the fiscal
year and the beginning year balance divided by five) for fiscal 2009 was $37.9
million compared to $39.0 million for fiscal 2008, which represents a reduction
of 2.9%. The decrease in interest expense during the current year was due to the
reduction in interest-bearing liabilities as well as a reduction in the interest
rates on certain borrowings. Interest income for both fiscal 2009 and 2008 was
nominal as the Company uses available cash to reduce the outstanding balance on
its working capital line of credit.
Loss on Extinguishment of Debt
The following table
summarizes the components of the loss on extinguishment of debt for the fiscal
year ended March 31 (in thousands):
| 2009 | |||
| JANA/Vicis debt refinancing - value of equity | $ | 3,769 | |
| Write off of remaining debt discount | 470 | ||
| AmerisourceBergen line of credit amendment | 248 | ||
| Loss on extinguishment of debt - total | $ | 4,487 | |
In conjunction with
the March 25, 2009 debt refinancing with JANA and Vicis, the Company recognized
$3,769,000 as a loss on extinguishment of debt. The Company issued 6,056,4999
shares of common stock valued at $2,059,000 to the lenders as consideration for
providing the additional financing and extending the maturity date of the
previously existing debt. The Company also exchanged 4,683,111 warrants held by
two of the lenders (Vicis and JANA) for 5,616,444 shares of common stock and the
incremental fair value was determined to be $1,145,000. Concurrent with the debt
refinancing, the holders of the warrants issued in conjunction with the May 2007
private placement transaction agreed to exchange a total of 2,754,726 warrants
for 2,754,726 shares of common stock with an incremental fair value of
$565,000.
37
On March 31, 2008,
the Company entered into a $5,000,000 note payable agreement with Vicis, which
had a corresponding debt discount of $1,202,000. In conjunction with the March
25, 2009 debt refinancing with JANA and Vicis, the remaining debt discount of
$470,000 was charged to loss on extinguishment of debt.
On June 5, 2008, the
Company issued AmerisourceBergen 490,000 warrants to purchase common stock at an
exercise price of $0.75 per share. The fair value of the warrants was determined
to be $248,000 and was recorded as a loss on extinguishment of
debt.
Income Taxes
Income tax expense
was $122,000 for the year ended March 31, 2009 compared to $535,000 for the year
ended March 31, 2008, a decrease of $413,000. This income tax reduction is
primarily the result of adjusting the March 31, 2008 accrued state income tax
liabilities for the State of Michigan as a result of a change in the method of
taxation for businesses effective January 1, 2008. Previous to this change, the
expense related to the Single Business Tax (“SBT”) was primarily a tax on
compensation. The cost of revenues for the Services segment is primarily
compensation and, as such, the SBT expense was included in the cost of revenues.
Effective January 1, 2008, the expenses associated with the new Michigan
Business Tax were recorded in the Income Tax line item due to its primary
taxation on income as opposed to compensation.
Due to the Company’s
losses in recent years, it has paid nominal federal income taxes. For federal
income tax purposes, the Company had significant permanent and timing
differences between book income and taxable income resulting in combined net
deferred tax assets of $32 million to be utilized by the Company for which an
offsetting valuation allowance has been established for the entire amount. The
Company has a net operating loss carryforward for tax purposes totaling $59.2
million that expires at various dates through 2029. Internal Revenue Code
Section 382 rules limit the utilization of certain of these net operating loss
carryforwards upon a change of control of the Company. It has been determined
that a change in control took place at the time of the reverse merger in 2004,
and as such, the utilization of $700,000 of the net operating loss carryforwards
will be subject to severe limitations in future periods.
38
Loss from Discontinued Operations
The following table
summarizes the components of the loss from discontinued operations for the
fiscal years ended March 31, (in thousands):
| 2009 | 2008 | |||||||
| Revenues, net: | ||||||||
| Services - Industrial Staffing | $ | 15,842 | $ | 26,119 | ||||
| Home Health Equipment | 17,643 | 22,841 | ||||||
| Pharmacy - Software / Florida | 2,133 | 3,313 | ||||||
| Retail operations | - | 377 | ||||||
| Care Clinic, Inc. | - | 202 | ||||||
| $ | 35,618 | $ | 52,852 | |||||
| Earnings (loss) from operations: | ||||||||
| Services - Industrial Staffing | $ | (1,791 | ) | $ | 1,766 | |||
| Home Health Equipment | (352 | ) | (1,081 | ) | ||||
| Pharmacy - Software / Florida | (65 | ) | (1,207 | ) | ||||
| Retail operations | - | (597 | ) | |||||
| Care Clinic, Inc. | - | (5,662 | ) | |||||
| $ | (2,208 | ) | $ | (6,781 | ) | |||
| Gain (loss) on disposal: | ||||||||
| Home Health Equipment | $ | (1,258 | ) | $ | (1,458 | ) | ||
| Retail operations | - | (161 | ) | |||||
| Care Clinic, Inc. | - | (770 | ) | |||||
| $ | (1,258 | ) | $ | (2,389 | ) | |||
| Earnings (loss) from discontinued operations: | ||||||||
| Services - Industrial Staffing | $ | (1,791 | ) | $ | 1,766 | |||
| Home Health Equipment | (1,610 | ) | (2,539 | ) | ||||
| Pharmacy - Software / Florida | (65 | ) | (1,207 | ) | ||||
| Retail operations | - | (758 | ) | |||||
| Care Clinic, Inc. | - | (6,432 | ) | |||||
| $ | (3,466 | ) | $ | (9,170 | ) | |||
HHE Operations
In October 2008, the
Company recognized $696,000 in additional loss on the sale of its ownership
interest in Beacon Respiratory Services, Inc. (“Beacon”), which was divested of
in September 2007. See Note 9 – “Stockholders’ Equity” for a more detailed
discussion of this transaction.
On January 5, 2009,
the Company entered into an Asset Purchase Agreement with Braden Partners, L.P.
to sell the assets of its HHE business in San Fernando, California. Total
proceeds were $503,000, less fees of $24,000. $126,000 of the purchase price was
originally held by the buyer to cover the Company’s contingent obligations. The
Company retained all accounts receivables for services provided prior to January
2009.
On May 18, 2009, the
Company completed the sale of its ownership interest in Lovell Medical Supply,
Inc., Beacon Respiratory Services of Georgia, Inc., and Trinity Healthcare of
Winston-Salem, Inc. to Aerocare Holdings, Inc. for total proceeds of $4,750,000,
less fees of $150,000. $475,000 of the purchase price was originally held by the
buyer to cover the Company’s contingent obligations. The entities sold
represented the Southeast region of the Company’s HHE business.
39
On May 19, 2009, the
Company entered into an Asset Purchase Agreement with Braden Partners, L.P. to
sell the assets of its Midwest region of the Company’s HHE business. Total
proceeds were $4,000,000, less fees of $150,000. $1,000,000 of the purchase
price was originally held by the buyer to cover the Company’s contingent
obligations. The Company retained all accounts receivable for services provided
prior to May 2009.
Based on the combined
sales price of the HHE business, the Company recorded an impairment charge of
$540,000 in the fourth quarter of fiscal 2009.
The net loss for the
HHE discontinued operations was $352,000, and an additional loss on the disposal
of discontinued operations of $1,258,000 was recorded.
Pharmacy Operations
On June 11, 2009, the
Company entered into an Asset Purchase Agreement with a leading pharmacy
management company to sell substantially all of the assets of JASCORP, LLC
(“JASCORP”) for proceeds of $2,200,000, less estimated fees of $100,000.
$220,000 of the purchase price was held back by the buyer until December 2011 in
order to cover the Company’s contingent obligations. JASCORP operates the retail
pharmacy software business that the Company acquired in September 2007. As part
of the divestiture, the Company entered into a License and Services Agreement
with the buyer that provides the Company the right to use the software for
internal purposes.
The net loss for the
Pharmacy discontinued operations was $65,000.
Industrial Staffing
Operations
On May 29, 2009, the
Company finalized the sale of substantially all of the assets of its industrial
and non-medical staffing business for cash proceeds of $250,000, which will be
paid in five equal installments through September 2009. Additionally, the
Company will receive 50% of the future earnings of the business until the total
payments equal $1.6 million. Such payments, if any, will be recorded as
additional gains when earned. The Company retained all accounts receivable for
services provided prior to May 29, 2009.
The net loss for the
Industrial Staffing discontinued operations was $1,791,000.
Liquidity and Capital Resources
During the first
quarter 2010, the Company finalized the sale of its HHE, industrial staffing and
pharmacy software businesses. Subsequent to these divestitures, the Company
narrowed its focus to a single vision of “Keeping People at Home and Healthier
Longer” and to improving the performance of its two remaining core business
units: Home Care/Medical Staffing (Services) and Pharmacy. Management has been
focused on growing revenues and improving the profitability within each segment,
implementing cost reductions to better align the Company’s selling, general and
administrative (“SG&A”) expenses with current business levels and ensuring
the Company has adequate financial resources and liquidity to fund its business
plans.
Within the Pharmacy
segment, revenue increased by more than 150% year-over-year to $15.2 million in
fiscal 2010. In June 2009, the Company entered into an agreement with WellPoint
whereby the Company will provide its DailyMed medication management program to
WellPoint’s high-risk Medicaid members in five states where WellPoint companies
provide Medicaid managed care benefits through its State Sponsored Business
division. The program was launched to WellPoint’s high-risk members in Virginia
in August 2009. The program is being rolled out to WellPoint’s California and
South Carolina patients, and enrollment in Kansas and New York is expected to
begin the first half of fiscal 2011.
The WellPoint
agreement, combined with the Company’s relationship with the Indiana Medicaid
program and other payers, provides the Company with a significant growth
opportunity within its Pharmacy segment. As the Pharmacy business grows,
management expects more payers will become aware of and interested in the unique
benefits of the DailyMed program. Additionally, the national focus on healthcare
has increased awareness of the importance of medication adherence and the need
for solutions that reduce costs by enabling people to take medications properly
and safely while remaining in their homes. As a result, management believes that
the Pharmacy segment will establish additional payer relationships over the next
several years, which will drive revenue growth well in excess of that generated
from the existing payer relationships.
40
The long-term success
of the Pharmacy business depends heavily on the continued growth in revenue,
improvement in margins, the ability to reduce SG&A expenses as a percentage
of revenue, and additional revenue from cost sharing agreements. Management
believes that the Company’s continued focus on reducing healthcare costs and
establishing relationships with payers will ultimately provide the necessary
revenue growth to allow the Company to leverage its current SG&A structure.
The Pharmacy segment entered into a new prime vendor agreement in April 2010.
This new agreement combined with various on-going operational initiatives and
software enhancements is expected to improve gross margins during fiscal 2011.
SG&A expenses are expected to decline as a percentage of revenue due to
operational improvements, investments in new operating systems and technology,
and leveraging more fixed expenses over a larger revenue base. The combination
of revenue growth, improved margins and lower SG&A expenses is expected to
reduce the operating losses and cash needed to fund the Pharmacy business.
However, it is expected that the Pharmacy segment will continue to be a net user
of cash through most of fiscal 2011.
Within the Services
segment, the Company has maintained its Home Care revenue despite challenging
economic conditions and high levels of unemployment, which both negatively
impacted Home Care demand in the short-term. Management continues to explore
cost-effective ways to organically grow the Home Care revenue. At the same time,
the Company has seen a significant reduction in Medical Staffing revenue
consistent with overall staffing industry trends. The Company has reduced the
SG&A in this segment over the last 12 months and will continue to look for
additional cost-saving opportunities. Management expects these on-going
initiatives to improve the Service segment results during fiscal 2011. At
current levels of revenue, it is unlikely that the profitability of the Services
segment will be sufficient to offset the losses and cash usage in the Pharmacy
segment. However, when revenues return to more historic levels as the Home Care
business grows and the Medical Staffing market recovers, the Services segment is
expected to see an improvement in operating income and cash flow.
The Company continues
to have a negative cash flow on a monthly basis as the Pharmacy losses and
Corporate expenses exceed the cash flows generated by the Services segment. In
addition, certain financial covenants exist with lenders that could limit the
Company’s flexibility and financing options. While management believes that the
Company’s financial performance will improve during fiscal 2011 and move toward
profitability and positive cash flow in fiscal 2012, there are many actions that
must be successfully implemented by the management team in order to achieve
these goals.
In November 2009, the
Company finalized an equity financing transaction and raised $10,243,000 in net
cash proceeds. Consistent with the terms of the debt agreement dated September
10, 2009, the Company used $2,400,000 of the proceeds to pay off the outstanding
balance. The remaining $7,815,000 is being used to fund on-going operations.
In April 2010, and in
conjunction with the Pharmacy’s new prime vendor agreement, the Company executed
a $5.0 million Line of Credit and Security Agreement with its new vendor. The
interest rate is the greater of 7% and the prime rate plus 3%, and the term of
the loan is for three years. The total amount available under this financing
arrangement is $5.0 million less amounts due for normal vendor payables and for
accrued interest. No interest payments are due during the first 12 months of the
agreement. Beginning in April 2011, no additional advances will be made if the
Pharmacy segment’s borrowing base does not exceed certain
thresholds.
Management believes
that the additional cash raised over the last six months will provide the
Company with the capital necessary to support operating cash requirements in the
near term as the financial performance improves. If and when necessary,
management believes that it would be able to raise additional capital to support
on-going operations and to fund growth opportunities. This capital could be in
the form of debt or equity financing.
While there are some
synergies between the Services and Pharmacy businesses, each could operate as
standalone businesses and each could be sold to, or have investment made by,
strategic or financial investors to fund operations and other growth
opportunities. In addition to the normal financing opportunities as described
above, this provides further financing flexibility should there be a need for
additional capital to support the growth within one or both
segments.
The above discussion
represents management’s intentions as of June 2010. There can be no assurances
that any actions contemplated or available will be successfully undertaken or
that management will not change its plans.
41
The following
summarizes the Company’s cash flows for all operations for the fiscal years
ended March 31, (in thousands):
| 2010 | 2009 | 2008 | ||||||||||
| Net loss | $ | (31,086 | ) | $ | (46,470 | ) | $ | (23,398 | ) | |||
| Net cash provided by (used in) operating activities | (5,881 | ) | 778 | (7,121 | ) | |||||||
| Net cash provided by (used in) investing activities | 8,143 | (1,286 | ) | 4,000 | ||||||||
| Net cash provided by (used in) financing activities | 1,660 | (4,321 | ) | 6,478 | ||||||||
| Net change in cash and cash equivalents | 3,922 | (4,829 | ) | 3,357 | ||||||||
| Cash and cash equivalents, end of year | 5,444 | 1,522 | 6,351 | |||||||||
| Availability under line of credit agreement | $ | 389 | $ | 2,945 | $ | - | ||||||
At March 31, 2010,
the Company had $5,833,000 in cash and line of credit availability compared to
$4,467,000 at March 31, 2009, an increase of $1,366,000. The line of credit
balance fluctuates based on working capital needs. The increase in cash plus
line of credit availability reflects the net increase in cash provided by
investing and financing activities, specifically the cash raised in conjunction
with an equity financing transaction in November 2009 as more fully described
below. The line of credit availability is based on the eligible accounts
receivable within the Services segment.
Net cash provided by
(used in) operating activities was ($5,881,000) and $778,000 for the years ended
March 31, 2010 and 2009, respectively. The decrease in cash flows from
operations was primarily driven by the operating losses generated by the
Pharmacy segment and the loss of earnings generated from the operations of the
businesses disposed of during the fiscal first quarter 2010. These losses were
partially offset by the increase in operating assets and liabilities in fiscal
2010 of $3,690,000 compared to a decrease of $656,000 in fiscal 2009. This
working capital improvement in fiscal 2010 was primarily driven by the
collection of the receivables retained subsequent to the sale of the HHE and
Industrial Staffing businesses during fiscal first quarter 2010 and the improved
collection efforts of accounts receivable in the Services segment.
Cash provided by
investing activities for fiscal 2010 of $8,143,000 included $9,498,000 of cash
proceeds from the various business disposals in early fiscal 2010. These cash
proceeds were offset by $574,000 in capital expenditures, $281,000 in cash paid
relating to certain business acquisitions, and $500,000 of cash used to
establish a restricted cash account at Comerica Bank used as additional security
for the Services segment line of credit. Cash used in investing activities for
fiscal 2009 totaled $1,286,000. This amount included $1,281,000 of capital
expenditures, primarily relating to the HHE business which was disposed of in
May 2009, and $675,000 used for business acquisitions offset by $670,000 of
proceeds from business disposals. The $675,000 used for business acquisitions
includes $274,000 for fiscal 2009 acquisitions while the remaining $401,000
represents payments associated with acquisitions made in previous periods.
Proceeds from business disposals includes the proceeds from the sale of the
California HHE operations in January 2009 of $314,000 and a final payment of
$356,000 relating to the sale of its Florida HHE operations during fiscal 2008.
Cash provided by investing activities for fiscal 2008 included $5,781,000
received upon the sale of the Florida and Colorado HHE operations, offset by
$507,000 of cash used for acquisitions, primarily the $384,000 used to purchase
JASCORP, LLC in July 2007. Capital expenditures for fiscal 2008 of $1,274,000
were consistent with fiscal 2009 capital expenditures.
Net cash provided by
financing activities for fiscal 2010 was $1,660,000. In November 2009, the
Company raised $10,243,000 in additional equity financing, net of fees paid in
cash of $857,000. In September 2009, the Company received $2,142,000 in
additional debt financing, net of fees, and this amount was paid in full upon
completion of the equity financing in November. During fiscal 2010, the Company
made $9,375,000 in debt and capital lease payments. The majority of these
payments were made subsequent to the various business divestitures during fiscal
first quarter 2010 and consistent with terms in the certain debt agreements. The
Company also reduced its outstanding line of credit balance by $1,351,000 during
fiscal 2010. Cash used in financing activities for fiscal 2009 consisted of a
$6,416,000 reduction in the outstanding line of credit balance and $705,000 in
principal payments on outstanding notes payable and capital leases. In March
2009, the Company secured an additional $3,000,000 in debt financing. Net cash
provided by financing activities for fiscal 2008 was $6,478,000. In May 2007,
The Company raised $12,442,000 in cash through a private placement of its common
stock. A significant portion of the proceeds from the private placement and the
disposal of the Florida and Colorado HHE locations was used to pay down
outstanding debt.
42
As of March 31, 2010,
the Company had total debt obligations of $33,993,000, of which $17,580,000 and
$6,505,000 were payable to JANA and Vicis, respectively, and mature in April
2012. Both JANA and Vicis own approximately 15% of the Company’s
outstanding common stock. Additionally, the Company had outstanding balances of
$7,774,000 due to Comerica Bank and $750,000 due to AmerisourceBergen Drug
Corporation. The balance due AmerisourceBergen Drug Corporation was paid in full
in April 2010. See Notes 7 and 8 to the Consolidated Financial Statements
included in this report for more detail on these debt agreements.
On April 23, 2010,
the Company executed a Line of Credit and Security Agreement with H.D. Smith
Wholesale Drug Co. (“H.D. Smith”), its new primary supplier of pharmaceutical
products. Under terms of the agreement, the Company can borrow up to $5,000,000,
including amounts payable under normal product purchasing terms. Beginning April
1, 2011, borrowings under the agreement will be limited based upon a borrowing
base of the assets of the Pharmacy business. The debt accrues interest at the
greater of 7% and the prime rate plus 3%, and it matures on April 23, 2013.
Interest during the first 12 months of the agreement will be capitalized and
then interest only payments are required from May 2011 through April 2012.
Beginning with May 2012, the Company will make monthly payments of $75,000 plus
interest. Borrowing may be prepaid at any time without penalty. The agreement
includes certain financial covenants beginning in fiscal 2012. In conjunction
with the financing, the Company issued H.D. Smith warrants to purchase common
stock, and the warrant terms are more fully described in Note 16.
The debt agreements
with JANA, Vicis and LSP Partners require the lenders’ consent for debt
transactions which are senior or pari passu to the debt due them. Additionally,
the lenders also require consent for equity transactions. The Company received
the lenders consent in conjunction with the equity financing in November 2009
and the H.D. Smith debt financing in April 2010.
The Comerica Bank
line of credit agreement includes certain financial covenants. These covenants
are specific to Arcadia Services, Inc., a wholly-owned subsidiary of the
Company, which is the legal entity that operates the Company’s Services segment.
As of March 31, 2010, the financial covenants are as follows: tangible effective
net worth of $2 million as of June 30, 2009 and gradually increasing on a
quarterly basis to $2.8 million by September 2011; minimum quarterly net income
of $400,000; and, minimum subordination of indebtedness of Arcadia Resources,
Inc. of $15.5 million. In the event of default of any one of the financial
covenants, the bank may declare all outstanding indebtedness due and payable,
and the bank shall not be obligated to make any further advances to Arcadia
Services, Inc. If this were to occur, the Company would need to obtain
alternative financing, if possible, and the terms of this alternative financing
would presumably be less attractive than those of the current line of credit
agreement. Arcadia Services, Inc. was not in compliance with the minimum
quarterly net income covenant for the fiscal fourth quarter ending March 31,
2010 due to the goodwill impairment expense recognized during the quarter. In
June 2010, the Company entered into an amendment whereby the bank waived the
event of default. Based on the Company’s projections for the fiscal year ending
March 31, 2011, management does not anticipate that Arcadia Services, Inc. will
violate its financial covenants during the fiscal year. These projections
include various assumptions about future performance of the Services segment,
and actual results may differ materially from these projections. Additionally,
Arcadia Services, Inc. ability to meet its minimum subordination of indebtedness
covenant could be impacted by the parent company’s available cash necessary to
fund the early stage Pharmacy operations.
The H.D Smith line of
credit agreement includes certain financial covenants specific to PrairieStone
Pharmacy, LLC, a wholly-owned subsidiary of the Company, which is the legal
entity that operates the Company’s Pharmacy segment. Specifically, the financial
covenants are as follows: positive quarterly earnings before income tax,
depreciation, and amortization (“EBITDA”) and current assets divided by current
liabilities of greater than .75. These financial covenants do not take affect
until the fiscal quarter ending March 31, 2012. The Company’s ability to meet
these financial covenants in the future will depend on the Pharmacy segment’s
ability to improve its financial performance over the next seven fiscal
quarters.
Net accounts
receivable from continuing operations were $12,366,000 at March 31, 2010
compared to $15,679,000 at March 31, 2009. The Services segment account for 89%
and 95% at March 31, 2010 and 2009, respectively.
The Company has a
limited number of customers with individually large amounts due at any given
balance sheet date. The Company’s payer mix for the year ended March 31, 2010
was as follows:
| Medicare | <0.5 | % |
| Medicaid/other government | 30 | % |
| Commercial insurance | 18 | % |
| Institution/facilities | 30 | % |
| Private pay | 22 | % |
43
Off-Balance Sheet
Arrangements
The Company has no
off-balance sheet arrangements.
Contractual Obligations and Commercial
Commitments
As of March 31, 2010,
the Company had contractual obligations, in the form of non-cancelable debt and
lease agreements, as follows (in thousands):
| Payments due by period | ||||||||||||||
| More | ||||||||||||||
| Less than 1 | than 5 | |||||||||||||
| Total | year | 2 - 3 years | 4 - 5 years | years | ||||||||||
| Operating leases | $ | 4,421 | $ | 962 | $ | 1,522 | $ | 1,112 | $ | 825 | ||||
| Capital leases | $ | 88 | 69 | 19 | - | - | ||||||||
| Long-term obligations | $ | 26,131 | 939 | 25,192 | - | - | ||||||||
| Lines of credit (1) | $ | 7,774 | - | 7,774 | - | - | ||||||||
| Interest (2) | $ | 6,132 | 3,088 | 3,044 | - | - | ||||||||
| Total | $ | 44,546 | $ | 5,058 | $ | 37,551 | $ | 1,112 | $ | 825 | ||||
|
(1)
|
Balance
represents the amount due to Comerica Bank at March 31, 2010 under its
working capital line of credit agreement. This balance fluctuates on a
daily balance depending on working capital needs.
|
||
|
(2)
|
Future interest
amounts for variable interest obligations are based on the interest rate
in effect as of March 31, 2010. The debt agreements with JANA Master Fund,
Ltd., Vicis Capital Master Fund, and LSP Partners, LP provide for the
Company to elect to either pay the quarterly interest in cash or to add
the amount to the principal balance. The future payment schedule assumes
that these amounts are paid in cash. The aggregate amounts due to these
three lenders in the above schedule are: less than 1 year - $2,615,000 and
2 to 3 years - $2,890,000.
|
Recent Accounting Pronouncements
On July 1, 2009, the
Financial Accounting Standards Board (“FASB”) issued the FASB Accounting
Standards Codification (the “Codification”). The Codification became the single
source of authoritative nongovernmental U.S. GAAP, superseding existing
accounting pronouncements issued by the FASB, American Institute of Certified
Public Accountants (“AICPA”), and the Emerging Issues Task Force (“EITF”). The
Codification eliminates the previous U.S. GAAP hierarchy and establishes one
level of authoritative GAAP. All other literature is considered
non-authoritative. The Codification is effective for interim and annual periods
ending after September 15, 2009. The Company adopted the Codification during its
fiscal second quarter 2010. There was no impact to the consolidated financial
results as this change is disclosure-only in nature.
In April 2009, the
FASB issued additional requirements regarding interim disclosures about the fair
value of financial instruments which were previously only disclosed on an annual
basis. Entities are now required to disclose the fair value of financial
instruments which are not recorded at fair value in the financial statements in
both their interim and annual financial statements. The new requirements were
effective for interim and annual periods ending after June 15, 2009 on a
prospective basis. The Company adopted these requirements in the fiscal first
quarter 2010. The recorded amounts of the Company’s financial instruments at
March 31, 2010 approximate fair value.
On April 1, 2009, the
Company adopted the revised FASB guidance regarding business combinations which
was required to be applied to business combinations on a prospective basis. The
revised guidance requires that the acquisition method of accounting be applied
to a broader set of business combinations, amends the definition of a business
combination, provides a definition of a business, requires an acquirer to
recognize an acquired business at its fair value at the acquisition date and
requires the assets and liabilities assumed in a business combination to be
measured and recognized at their fair values as of the acquisition date (with
limited exceptions). There was no impact upon adoption and the effects of this
guidance will depend on the nature and significance of business combinations
occurring after the effective date.
44
In June 2008, the
FASB ratified consensus which addresses how an entity should evaluate whether an
instrument is indexed to its own stock. The consensus is effective for fiscal
years (and interim periods) beginning after December 15, 2008 and must be
applied to outstanding instruments as of the beginning of the fiscal year in
which the consensus is adopted and should be treated as a cumulative-effect
adjustment to the opening balance of retained earnings. Early adoption was not
permitted. As of April 1, 2009, the adoption of this consensus did not have an
impact on the Company’s financial statement as of the beginning of the fiscal
year. However, as described in Note 9, the Company issued warrants in November
2009 which have been accounted for under this guidance. See Note 9 for a
discussion on the impact that the adoption of this guidance had on the Company’s
financial statements.
ITEM 7A. QUANTITATIVE AND QUALITATIVE
DISCLOSURES ABOUT MARKET RISK
The majority of our
cash balances and cash equivalents are held primarily in highly liquid
commercial bank accounts. The Company utilizes a line of credit to fund
operational cash needs. The risk associated with fluctuating interest rates is
limited to our cash equivalents and our borrowings. We do not believe that a 10%
change in interest rates would have a significant effect on our results of
operations or cash flows. All revenues since inception have been in the U.S. and
in U.S. Dollars; therefore, management has not yet adopted a strategy for
foreign currency rate exposure as it is not anticipated that foreign revenues
are likely to occur in the near future.
ITEM 8. FINANCIAL STATEMENTS AND SUPPLEMENTARY
DATA
The financial
statements follow Item 15 beginning at page F-4 and are incorporated by
reference in response to this item.
ITEM 9. CHANGES IN AND DISAGREEMENTS WITH
ACCOUNTANTS ON ACCOUNTING AND FINANCIAL DISCLOSURE
None.
ITEM 9A. CONTROLS AND PROCEDURES
Disclosure Controls and
Procedures
The Company maintains
disclosure controls and procedures designed to provide reasonable assurance that
information required to be disclosed in its reports filed pursuant to the
Securities Exchange Act of 1934, as amended (the “Exchange Act”), is recorded,
processed, summarized and reported within the time periods specified in the
Securities and Exchange Commission’s rules and forms. Such information is
accumulated and communicated to management, including our Chief Executive
Officer and Chief Financial Officer as appropriate, to allow timely decisions
regarding required disclosure. A control system, no matter how well designed and
implemented, can provide only reasonable, not absolute, assurance the objectives
of the control system are met.
As of March 31, 2010,
our management, with the participation of our Chief Executive Officer and Chief
Financial Officer, conducted an evaluation of the effectiveness of our
disclosure controls and procedures as such term is defined in Rule 13a-15(e) and
15d-15(e) under the Exchange Act. Based on this evaluation, the Chief Executive
Officer and Chief Financial Officer concluded that the Company’s disclosure
controls and procedures were effective as of March 31, 2010.
Management’s Report on Internal Control over
Financial Reporting
The Company’s
management is responsible for establishing and maintaining adequate internal
control over financial reporting for the Company. Internal control over
financial reporting, as defined in Rule 13a-15(f) under the Exchange Act, is a
set of processes designed by, or under the supervision of, the Company’s CEO and
CFO, to provide reasonable assurance regarding the reliability of financial
reporting and the preparation of financial statements for external purposes in
accordance with GAAP and includes those policies and procedures that:
- Pertain to the maintenance of
records that in reasonable detail accurately and fairly reflect our
transactions and dispositions of our assets;
- Provide reasonable assurance our
transactions are recorded as necessary to permit preparation of our financial
statements in accordance with
GAAP, and that receipts and expenditures are being made only in accordance
with authorizations of our management and directors; and
- Provide reasonable assurance regarding prevention or timely detection of unauthorized acquisition, use or disposition of our assets that could have a material effect on the financial statement.
45
Because of its
inherent limitations, internal control over financial reporting may not prevent
or detect all misstatements. It should be noted that any system of internal
control, however well designed and operated, can provide only reasonable, and
not absolute, assurance that the objectives of the system will be met. Also,
projections of any evaluation of effectiveness to future periods are subject to
the risk that controls may become inadequate because of changes in conditions,
or that the degree of compliance with the policies or procedures may
deteriorate.
Under the supervision
and with the participation of the Company’s management, including the Company’s
CEO and CFO, the Company conducted an assessment of the effectiveness of its
internal control over financial reporting based on criteria established in
“Internal Control-Integrated Framework” issued by the Committee of Sponsoring
Organizations of the Treadway Commission (COSO), as of March 31, 2010.
Based on this
assessment, we assert that, as of March 31, 2010 and based on the specific
criteria, the Company maintained effective internal control over financial
reporting, involving the preparation and reporting of the Company’s consolidated
financial statements presented in uniformity with U.S. GAAP.
The effectiveness of
the Company’s internal control over financial reporting as of March 31, 2010 has
been audited by BDO Seidman, LLP, an independent registered public accounting
firm, as stated in its report which is included under the “Report of
Independent Registered Public Accounting Firm on Internal Controls Over
Financial Reporting” in this Annual
Report on Form 10-K.
Changes in Internal Control Over Financial
Reporting
There has been no
change in the internal control over financial reporting (as defined in
Securities Exchange Act Rule 13a-15(f)) that occurred during the fourth quarter
of the fiscal year covered by this annual report that has materially affected,
or is reasonably likely to materially affect, the internal control over
financial reporting.
ITEM 9B. OTHER INFORMATION
None.
Part III
ITEM 10. DIRECTORS, EXECUTIVE OFFICERS AND
CORPORATE GOVERNANCE
Information regarding
our board of directors, audit committee, and audit committee financial expert is
set forth under the caption “Board of Directors and Committees of the Board” and
“Governance of the Company” in our definitive Proxy Statement to be filed
in connection with our 2010 Annual Meeting of Stockholders and such information
is incorporated herein by reference. Information regarding Section 16(a)
beneficial ownership compliance is set forth under the caption “Section 16(a)
Beneficial Ownership Reporting Compliance” in our definitive Proxy Statement to
be filed in connection with our 2010 Annual Meeting of Stockholders and such
information is incorporated by reference. A list of our executive officers is
included in Part I Item 1 of this Report under the heading “Executive Officers.”
We have adopted a
Code of Business Conduct and Ethics that applies to each of our directors,
officers, employees and principal contractors, including our principal executive
officer, principal financial officer, principal accounting officer or
controller, or persons performing similar functions. The Code of Business
Conduct and Ethics is posted on the Company’s website (www
arcadiahealthcare.com). The Company will provide a copy of the Amended and
Restated Code of Ethics, without charge, to any person who sends a written
request addressed to the Chairman and CEO at Arcadia Resources, Inc. at 9320
Priority Way West Drive, Indianapolis, Indiana 46240. The Company intends to
disclose any waivers or amendments to its Amended and Restated Code of Ethics by
disclosure on its website (www.arcadiahealthcare.com) rather than in a report on
Form 8-K Item 5.05, filing.
ITEM 11. EXECUTIVE
COMPENSATION
The information
required by this item is set forth under the captions “Compensation Tables” and
“Director Compensation” in our definitive Proxy Statement to be filed in
connection with our 2010 Annual Meeting of Stockholders and such information is
incorporated herein by reference.
46
ITEM 12. SECURITY OWNERSHIP OF CERTAIN
BENEFICIAL OWNERS AND MANAGEMENT AND RELATED STOCKHOLDER MATTERS
The information
required by this item is set forth under the captions “Security Ownership of
Certain Beneficial Owners and Management” and “Equity Compensation Plan
Information” in our definitive Proxy Statement to be filed in connection with
our 2010 Annual Meeting of Stockholders and such information is incorporated
herein by reference.
ITEM 13. CERTAIN RELATIONSHIPS AND RELATED
TRANSACTIONS, AND DIRECTOR INDEPENDENCE
The information
required by this item is set forth under the captions “Certain Relationships and
Related Transactions” and “Compensation Committee Interlocks and Insider
Participation” in our definitive Proxy Statement to be filed in connection with
our 2010 Annual Meeting of Stockholders and such information is incorporated
herein by reference.
ITEM 14. PRINCIPAL ACCOUNTANT FEES AND
SERVICES
The information
required by this item is set forth under the caption “Fees Paid to Independent
Registered Auditors” in our definitive Proxy Statement to be filed in connection
with our 2010 Annual Meeting of Stockholders and such information is
incorporated herein by reference.
PART IV
ITEM 15. EXHIBITS AND FINANCIAL STATEMENT
SCHEDULES
(a) Documents filed
as part of this report:
| 1. | Financial Statements: | ||
| Reports of Independent Registered Public Accounting Firm | |||
| Consolidated Balance Sheets as of March 31, 2010 and 2009 | |||
| Consolidated Statements of Operations for the years ended March 31, 2010, 2009 and 2008 | |||
| Consolidated Statements of Stockholders’ Equity (Deficit) for the years ended March 31, 2010, 2009 and 2008 | |||
| Consolidated Statements of Cash Flows for the years ended March 31, 2010, 2009 and 2008 | |||
| Notes to Consolidated Financial Statements | |||
| 2. | Financial Statement Schedules: | ||
| Schedule I – Consolidated Financial Information of Registrant | |||
| Schedule II – Valuation and Qualifying Accounts | |||
| All other schedules for which provision is made in Regulation S-X either (i) are not required under the related instructions or are inapplicable and, therefore, have been omitted, or (ii) the information required is included in the Consolidated Financial Statements or the Notes thereto that are a part hereof. | |||
| 3. | Exhibits: | ||
| The exhibits included as part of this report are listed in the attached Exhibit Index, which is incorporated herein by reference. | |||
47
ARCADIA RESOURCES, INC. AND
SUBSIDIARIES
INDEX TO FINANCIAL STATEMENTS AND FINANCIAL STATEMENT SCHEDULE
INDEX TO FINANCIAL STATEMENTS AND FINANCIAL STATEMENT SCHEDULE
| Reports of Independent Registered Public Accounting Firm | F-2 |
| Consolidated Balance Sheets as of March 31, 2010 and 2009 | F-4 |
| Consolidated Statements of Operations for the years ended March 31, 2010, 2009 and 2008 | F-5 |
| Consolidated Statements of Stockholders’ Equity (Deficit) for the years ended March 31, 2010, 2009 and 2008 | F-6 |
| Consolidated Statements of Cash Flows for the years ended March 31, 2010, 2009 and 2008 | F-7 |
| Notes to Consolidated Financial Statements | F-9 |
| Schedule I – Consolidated Financial Information of Registrant | F-40 |
| Schedule II – Valuation and Qualifying Accounts | F-44 |
48
SIGNATURES
In accordance with Section 13 or 15(d) of the
Exchange Act, the registrant caused this report to be signed on its behalf by
the undersigned, thereunto duly authorized.
| June 10, 2010 | By: | /s/ Marvin R. Richardson | |
| Marvin R. Richardson | |||
| Chief Executive Officer (Principal | |||
| Executive Officer) and a Director | |||
| June 10, 2010 | By: | /s/ Matthew R. Middendorf | |
| Matthew R. Middendorf | |||
| Treasurer and Chief Financial Officer | |||
| (Principal Financial and Accounting Officer) | |||
In accordance with the Exchange Act, this
report has been signed below by the following persons on behalf of the
registrant and in the capacities and on the dates indicated.
| June 10 , 2010 | By: | /s/ Marvin R. Richardson | |
| Marvin R. Richardson | |||
| President, Chief Executive Officer and Director | |||
| June 10, 2010 | By: | /s/ John T. Thornton | |
| John T. Thornton | |||
| Director | |||
| June 10, 2010 | By: | /s/ Peter A. Brusca, M.D. | |
| Peter A. Brusca, M.D. | |||
| Director | |||
| June 10, 2010 | By: | /s/ Joseph Mauriello | |
| Joseph Mauriello | |||
| Director | |||
| June 10 , 2010 | By: | /s/ Daniel Eisenstadt | |
| Daniel Eisenstadt | |||
| Director | |||
49
Exhibit Index
The following
Exhibits are filed herewith and made a part hereof:
| Exhibit | ||
| Number | Description of Exhibit | |
| 3.1 | Amended and Restated Articles of Incorporation (incorporated by reference to Exhibit 3.1 of Form 8-K filed November 9, 2009) | |
| 3.2 | Amended and Restated Bylaws of Arcadia Resources, Inc. (Nov. 5, 2008) (incorporated by reference to Exhibit 3.2 of Form 10-Q filed on November 6, 2008) | |
| 4.1 | Form of Regulation D Class A Common Stock Purchase Warrant (incorporated by reference to Exhibit 4.1 of Form 8-K filed on May 24, 2004) | |
| 4.2 | Class A Warrant issued to John E. Elliott, II (incorporated by reference to Exhibit 4.2 of Form 8-K filed on May 24, 2004) | |
| 4.3 | Class A Warrant issued to Lawrence Kuhnert (incorporated by reference to Exhibit 4.3 of Form 8-K filed on May 24, 2004) | |
| 4.4 | John E. Elliot, II and Lawrence Kuhnert Registration Rights Agreement, dated May 7, 2004 (incorporated by reference to Exhibit 4.6 of Form S-1/A, Amendment No. 1, filed August 27, 2004) | |
| 4.5 | Form Note Purchase Agreement (incorporated by reference to Exhibit 4.7 of Form S-1/A, Amendment No. 1, filed August 27, 2004) | |
| 4.6 | Cleveland Overseas Settlement Agreement, dated June 16, 2004 (incorporated by reference to Exhibit 4.11 of Form S-1/A, Amendment No. 1, filed August 27, 2004) | |
| 4.7 | Cleveland Overseas Warrant for Purchase of 100,000 Shares of Common Stock (incorporated by reference to Exhibit 4.12 of Form S-1/A, Amendment No. 1, filed August 27, 2004) | |
| 4.8 | Cleveland Overseas Registration Rights Agreement, dated February 28, 2003 (incorporated by reference to Exhibit 4.13 of Form S-1/A, Amendment No. 1, filed August 27, 2004) | |
| 4.9 | Stephen Garchik Option to Acquire 500,000 Shares, dated February 3, 2004, between Critical Home Care, Inc. and Jana Master Fund, Ltd. (incorporated by reference to Exhibit 4.14 of Form S-1/A, Amendment No. 1, filed August 27, 2004) | |
| 4.10 | Stephen Garchik Registration Rights Agreement, dated February 3, 2004 (incorporated by reference to Exhibit 4.15 of Form S-1/A, Amendment No. 1, filed August 27, 2004) | |
| 4.11 | Global Asset Management Settlement Agreement which includes provision regarding registration rights (to be filed by amendment) (incorporated by reference to Exhibit 4.16 of Form S-1/A, Amendment No. 1, filed August 27, 2004) | |
| 4.12 | Stanley Scholsohn Family Partnership Stock Option Agreement, dated February 22, 2003 (incorporated by reference to Exhibit 4.17 of Form S-1/A, Amendment No. 1, filed August 27, 2004) | |
| 4.13 | Stanley Scholsohn Family Partnership Registration Rights Agreement, dated February 22, 2004 (incorporated by reference to Exhibit 4.18 of Form S-1/A, Amendment No. 1, filed August 27, 2004) | |
| 4.14 | Form of Regulation D Registration Rights Agreement (incorporated by reference to Exhibit 4.19 of Form S-1/A, Amendment No. 1, filed August 27, 2004) | |
| 4.15 | Form of stock purchase agreement (incorporated by reference to Exhibit 4.1 of Form 8-K/A filed on May 2, 2005) | |
| 4.16 | Warrant Purchase and Registration Rights Agreement dated September 26, 2005 (incorporated by reference to Exhibit 4.1 of Form 8-K filed on September 30, 2005) | |
| 4.17 | Warrant Purchase and Registration Rights Agreement dated September 28, 2005 (incorporated by reference to Exhibit 4.2 of Form 8-K filed on September 30, 2005) | |
| 4.18 | Form of B-1 Warrant (incorporated by reference to Exhibit 4.3 of Form 8-K filed on September 30, 2005) | |
| 4.19 | Form of B-2 Warrant (incorporated by reference to Exhibit 4.4 of Form 8-K filed on September 30, 2005) | |
| 4.20 | Private Stock Purchase Agreement SICAV 1 dated November 28, 2005 (incorporated by reference to Exhibit 4.1 of Form 10-Q on February 14, 2006) | |
| 4.21 | Private Stock Purchase Agreement SICAV 2 dated November 28, 2005 (incorporated by reference to Exhibit 4.2 of Form 10-Q on February 14, 2006) | |
| 4.22 | Master Exchange Agreement among JANA Master Fund, Ltd., Vicis Capital Master Fund, LSP Partners, LP and Arcadia Resources, Inc. dated March 25, 2009 (incorporated by reference to Exhibit 10.1 of Form 8-K filed on March 31, 2009) | |
| 4.23 | JANA Master Fund, Ltd. Promissory Note dated March 25, 2009 (incorporated by reference to Exhibit 10.2 of Form 8-K filed on March 31, 2009) | |
| 4.24 | Vicis Capital Master Fund Promissory Note dated March 25, 2009 (incorporated by reference to Exhibit 10.3 of Form 8-K filed on March 31, 2009) |
50
| 4.25 | LSP Partners, LP Promissory Note dated March 25, 2009 (incorporated by reference to Exhibit 10.4 of Form 8-K filed on March 31, 2009) | |
| 4.26 | Assignment and Assumption Agreement among JANA Master Fund, Ltd., Vicis Capital Master Fund, LSP Partners, LP and Arcadia Resources, Inc. dated March 25, 2009 (incorporated by reference to Exhibit 10.5 of Form 8-K filed on March 31, 2009) | |
| 4.27 | Form of Subscription Agreement (incorporated by reference to Exhibit 4.1 of Form 8-K filed on November 9, 2009) | |
| 4.28 | Form of Warrant to Purchase Common Stock (incorporated by reference to Exhibit 4.2 of Form 8-K filed on November 9, 2009) | |
| 4.29 | Common Stock Purchase Warrant No. 99 dated April 23, 2010 issued to H. D. Smith Wholesale Drug Co. (incorporated by reference to Exhibit 2.5 of Form 8-K filed on April 23, 2010) | |
| 4.30 | Common Stock Purchase Warrant No. 100 dated April 23, 2010 issued to H. D. Smith Wholesale Drug Co. (incorporated by reference to Exhibit 2.5 of Form 8-K filed on April 23, 2010) | |
| 9.1 | Form of Voting Agreement (incorporated by reference to Exhibit 9.1 of Form 8-K filed on May 24, 2004) | |
| 10.1 | 2006 Equity Incentive Plan as Amended (incorporated by reference to Appendix B to the Company’s Proxy Statement on Schedule 14A filed on September 18, 2009) | |
| 10.2 | Agreement and Plan of Merger dated May 7, 2004 by and among RKDA, Inc., CHC Sub, Inc., Critical Home Care, Inc., John E. Elliott, II, Lawrence Kuhnert and David Bensol (incorporated by reference to Exhibit 2.1 of Form 8-K filed on May 24, 2004) | |
| 10.3 | Stock Purchase Agreement dated as of May 7, 2004 by and among RKDA, Inc., Arcadia Services, Inc., Addus Healthcare, Inc. and W. Andrew Wright (incorporated by reference to Exhibit 2.3 of Form 8-K filed on May 24, 2004) | |
| 10.4 | Escrow Agreement made as of May 7, 2004, by and among Critical Home Care, Inc., David Bensol and Nathan Neuman & Nathan P.C. (incorporated by reference to Exhibit 10.6 of Form 8-K filed on May 24, 2004) | |
| 10.5 | Stock Option Agreement dated May 7, 2004, between Critical Home Care, Inc. and John E. Elliott, II (incorporated by reference to Exhibit 10.7 of Form 8-K filed on May 24, 2004) | |
| 10.6 | Stock Option Agreement dated May 7, 2004, between Critical Home Care, Inc. and Lawrence Kuhnert (incorporated by reference to Exhibit 10.8 of Form 8-K filed on May 24, 2004) | |
| 10.7 | Agreement of Modification (without exhibits) dated May 6, 2004, among Critical Home Care, Inc. and David Bensol and All Care Medical Products Corp., Luigi Piccione and S&L Realty, LLC (incorporated by reference to Exhibit 10.9 of Form 8-K filed on May 24, 2004) | |
| 10.8 | Lease of City Center Office Park—South Building (incorporated by reference to Exhibit 10.38 of Form S-1/A, Amendment No. 1, filed August 27, 2004) | |
| 10.9 | Critical Home Care, Inc. Common Stock Purchase Warrant to Purchase up to 3,150,000 Shares of the Common Stock of Critical Home Care, Inc., dated September 21, 2004 (incorporated by reference to Exhibit 10.3 of Form 8-K filed on September 27, 2004) | |
| 10.10 | Investor Rights Agreement by and among Critical Home Care, Inc. and BayStar Capital II, L.P. dated September 21, 2004 (incorporated by reference to Exhibit 10.4 of Form 8-K filed on September 27, 2004) | |
| 10.11 | Asset Purchase Agreement dated August 30, 2004 by and between Arcadia Health Services, Inc., Second Solutions, Inc., Merit Staffing Resources, Inc. and Harriette Hunter (incorporated by reference to Exhibit 99.1 of Form 8-K filed on September 2, 2004) | |
| 10.12 | Agreement and Plan of Merger between Critical Home Care, Inc. and Arcadia Resources, Inc. (incorporated by reference to Exhibit 10.1 of Form 8-K filed on November 16, 2004) | |
| 10.13 | Form Stock Purchase Agreement (incorporated by reference to Exhibit 4.1 of Form 8-K filed on February 8, 2005) | |
| 10.14 | Stock Option Agreement dated March 22, 2005 (incorporated by reference to Exhibit 10.2 of Form 8-K filed on March 28, 2005) | |
| 10.15 | Stock Purchase Agreement dated April 29, 2005, by and among Arcadia Health Services of Michigan, Inc., Home Health Professionals, Inc., and the selling shareholders (incorporated by reference to Exhibit 10.1 of Form 8-K/A filed on May 2, 2005) | |
| 10.16 | Form of Director Compensation Agreement (incorporated by reference to Exhibit 10.62 of Form 10-K filed on June 29, 2006) | |
| 10.17 | Form of Director Stock Option Agreement (incorporated by reference to Exhibit 10.63 of Form 10-K filed on June 29, 2006) | |
| 10.18 | Form of Stock Grant Agreement dated June 22, 2006 (incorporated by reference to Exhibit 10.64 of Form 10-K filed on June 29, 2006) | |
| 10.19 | Amended and Restated Employment Agreement dated August 12, 2009, by and between Arcadia Resources, Inc. and Marvin Richardson (incorporated by reference to Exhibit 10.1 of Form 10-Q filed on August 13, 2009) | |
| 10.20 | Severance and Release Agreement dated February 21, 2007 by and between Arcadia Resources, Inc. and Lawrence R. Kuhnert (incorporated by reference to Exhibit 10.68 of Form 10-K filed on June 29, 2007) |
51
| 10.21 | Limited Liability Company Ownership Interest Purchase Agreement dated January 28, 2007 by and among Arcadia Resources, Inc., PrairieStone Pharmacy, LLC, and the selling shareholders of PrairieStone Pharmacy, LLC (incorporated by reference to Exhibit 10.1 of Form 10-Q filed on February 14, 2007) | |
| 10.22 | Registration Rights Agreement dated February 16, 2007 by and among Arcadia Resources, Inc., PrairieStone Pharmacy, LLC, and the selling shareholders of PrairieStone Pharmacy, LLC (incorporated by reference to Exhibit 10.70 of Form 10-K filed on June 29, 2007) | |
| 10.23 | Form of Securities Purchase Agreement from December 2006 Private Placement (incorporated by reference to Exhibit 10.1 of Form 8-K filed on January 4, 2007) | |
| 10.24 | Form of Registration Rights Agreement from December 2006 Private Placement (incorporated by reference to Exhibit 10.2 of Form 8-K filed on January 4, 2007) | |
| 10.25 | Form of Restricted Stock Award Agreement (incorporated by reference to Exhibit 10.1 of the Company’s Registration Statement on Form S-8 on October 4, 2006) | |
| 10.26 | Form of Stock Option Agreement (incorporated by reference to Exhibit 10.2 of the Company’s Registration Statement on Form S-8 on October 4, 2006) | |
| 10.27 | Lynn Fetterman Project Agreement (incorporated by reference to Exhibit 10.2 of Form 10-Q filed on February 14, 2007) | |
| 10.28 | Severance and Release Agreement between Arcadia Resources, Inc. and John E. Elliott, II, dated July 12, 2007 (incorporated by reference to Exhibit 10.1 of Form 8-K filed on July 17, 2007) | |
| 10.29 | Employment Agreement dated February 15, 2007 between PrairieStone Pharmacy, LLC and John J. Brady (incorporated by reference to Exhibit 10.1 of Form 8-K filed on July 19, 2007) | |
| 10.30 | Employment Agreement dated November 13, 2006 between Care Clinic, Inc. and Harry Travis (incorporated by reference to Exhibit 10.2 of Form 8-K filed on July 19, 2007) | |
| 10.31 | Amendment to Severance and Release Agreement between Arcadia Resources, Inc. and Lawrence R. Kuhnert, dated August 29, 2007 (incorporated by reference to Exhibit 10.1 of Form 8-K filed on September 4, 2007) | |
| 10.32 | Stock Purchase Agreement between Arcadia Products, Inc. and AeroCare Holdings, Inc. dated September 10, 2007 (incorporated by reference to Exhibit 10.1 of Form 8-K filed on September 14, 2007) | |
| 10.33 | Amended and Restated Employment Agreement between Arcadia Resources, Inc. and Steven L. Zeller dated August 12, 2009 (incorporated by reference to Exhibit 10.3 of Form 10-Q filed on August 13, 2009) | |
| 10.34 | Employment Agreement between Arcadia Resources, Inc. and Michelle M. Molin dated October 22, 2007 (incorporated by reference to Exhibit 10.2 of Form 10-Q filed on November 9, 2007) | |
| 10.35 | Escrow Release Agreement relating to the sale of the Florida Durable Medical Equipment Division of Arcadia Resources, Inc. dated July 19, 2007 (incorporated by reference to Exhibit 10.3 of Form 10-Q filed on November 9, 2007) | |
| 10.36 | Amended and Restated Employment Agreement between Arcadia Resources, Inc. and Matthew R. Middendorf, dated August 12, 2009 (incorporated by reference to Exhibit 10.2 of Form 10-Q filed on August 13, 2009) | |
| 10.37 | Arcadia Resources, Inc. 2008 Executive Performance Based Compensation Plan (incorporated by reference to Exhibit 10.1 of Form 8-K filed on July 17, 2008) | |
| 10.38 | Amendment No. One to the Arcadia Resources, Inc. 2008 Executive Performance Based Compensation Plan (incorporated by reference to Exhibit 10.2 of Form 8-K filed on July 17, 2008) | |
| 10.39 | Stock Purchase Agreement between Arcadia Products, Inc. and Aerocare Holdings, Inc. dated May 16, 2009 (incorporated by reference to Exhibit 10.1 of Form 8-K filed on May 21, 2009) | |
| 10.40 | Asset Purchase Agreement among Braden Partners, L.P., American Oxygen and Medical Equipment, Inc., Arcadia Home Oxygen and Medical Equipment, Inc., Arcadia Products, Inc., RKDA, Inc. and Arcadia Resources, Inc. dated May 19, 2009 (incorporated by reference to Exhibit 10.2 of Form 8-K filed on May 21, 2009) | |
| 10.41 | Amended and Restated Credit Agreement by and among Arcadia Services, Inc., Arcadia Health Services, Inc., Grayrose, Inc., Arcadia Health Services of Michigan, Inc., Arcadia Employee Services, Inc. and Comerica Bank dated July 13, 2009 ((incorporated by reference to Exhibit 10.42 of Form 10-K filed on July 14, 2009) | |
| 10.42 | Comerica Revolving Credit Note dated July 13, 2009 (incorporated by reference to Exhibit 10.43 of Form 10-K filed on July 14, 2009) | |
| 10.43 | Placement Agent Agreement between Arcadia Resources, Inc. and Burnham Hill Partners dated November 6, 2009 (incorporated by reference to Exhibit 1.1 of Form 8-k filed on November 9, 2009) | |
| 10.44 | Line of Credit and Security Agreement dated April 23, 2010 by and between PrairieStone Pharmacy, LLC and H.D. Smith Wholesale Drug Co. (incorporated by reference to Exhibit 2.1 of Form 8-K filed on April 28, 2010) | |
| 10.46 | Line of Credit Note dated April 23, 2010 made in favor of H. D. Smith by PrairieStone Pharmacy, LLC (incorporated by reference to Exhibit 2.2 of Form 8-K filed on April 28, 2010) |
52
| 10.47 | Guaranty Agreement dated April 23, 2010 by Arcadia Resources, Inc. in favor of H. D. Smith Wholesale Drug Co. (incorporated by reference to Exhibit 2.3 on April 28, 2010) | |
| 10.48 | Pledge Agreement dated April 23, 2010 by and between Arcadia Resources, Inc., and H. D. Smith Wholesale Drug Co. (incorporated by reference to Exhibit 2.4 of Form 8-K filed on April 28, 2010) | |
| 14.1 | Arcadia Resources, Inc. Code of Ethics and Conduct as Amended and Restated Effective April 1, 2009 (incorporated by reference to Exhibit 14.1 of Form 10-K filed on July 14, 2009) | |
| 21.1 | Subsidiaries of Arcadia Resources, Inc. (filed herewith) | |
| 23.1 | Consent of Independent Registered Public Accounting Firm (filed herewith) | |
| 31.1 | Section 302 CEO Certification (filed herewith) | |
| 31.2 | Section 302 Principal Financial and Accounting Officer Certification (filed herewith) | |
| 32.1 | Section 906 CEO Certification (filed herewith) | |
| 32.2 | Section 906 Principal Financial and Accounting Officer Certification (filed herewith) |
53
ARCADIA RESOURCES, INC. AND SUBSIDIARIES
INDEX TO FINANCIAL STATEMENTS AND FINANCIAL STATEMENT SCHEDULE
INDEX TO FINANCIAL STATEMENTS AND FINANCIAL STATEMENT SCHEDULE
| Reports of Independent Registered Public Accounting Firm | F-2 |
| Consolidated Balance Sheets as of March 31, 2010 and 2009 | F-4 |
| Consolidated Statements of Operations for the years ended March 31, 2010, 2009 and 2008 | F-5 |
| Consolidated Statements of Stockholders’ Equity (Deficit) for the years ended March 31, 2010, 2009 and 2008 | F-6 |
| Consolidated Statements of Cash Flows for the years ended March 31, 2010, 2009 and 2008 | F-7 |
| Notes to Consolidated Financial Statements | F-9 |
| Schedule I – Consolidated Financial Information of Registrant | F-40 |
| Schedule II – Valuation and Qualifying Accounts | F-44 |
F-1
Report of Independent Registered Public
Accounting Firm
Board of Directors
and Shareholders
Arcadia Resources, Inc.
Indianapolis, Indiana
Arcadia Resources, Inc.
Indianapolis, Indiana
We have audited the
accompanying consolidated balance sheets of Arcadia Resources, Inc. as of March
31, 2010 and 2009 and the related consolidated statements of operations,
stockholders’ equity (deficit), and cash flows for each of the three years in
the period ended March 31, 2010. In connection with our audits of the financial
statements, we have also audited the financial statement schedules listed in the
accompanying index. These financial statements and schedules are the
responsibility of Arcadia Resources, Inc.’s management. Our responsibility is to
express an opinion on these financial statements and schedules based on our
audits.
We conducted our
audits in accordance with the standards of the Public Company Accounting
Oversight Board (United States). Those standards require that we plan and
perform the audit to obtain reasonable assurance about whether the financial
statements and schedules are free of material misstatement. An audit includes
examining, on a test basis, evidence supporting the amounts and disclosures in
the financial statements, assessing the accounting principles used and
significant estimates made by management, as well as evaluating the overall
presentation of the financial statements and schedules. We believe that our
audits provide a reasonable basis for our opinion.
In our opinion, the
consolidated financial statements referred to above present fairly, in all
material respects, the financial position of Arcadia Resources, Inc. at March
31, 2010 and 2009, and the results of its operations and its cash flows for each
of the three years in the period ended March 31, 2010, in conformity
with accounting principles generally accepted in the United States of America.
Also, in our opinion,
the financial statement schedules, when considered in relation to the basic
consolidated financial statements taken as a whole, present fairly, in all
material respects, the information set forth therein.
We also have audited,
in accordance with the standards of the Public Company Accounting Oversight
Board (United States), Arcadia Resources, Inc.’s internal control over financial
reporting as of March 31, 2010, based on criteria established in Internal Control – Integrated Framework issued by the Committee of Sponsoring
Organizations of the Treadway Commission (COSO) and our report dated June 10,
2010 expressed an unqualified opinion thereon.
/s/BDO Seidman, LLP
Troy, Michigan
June 10, 2010
June 10, 2010
F-2
Report of Independent Registered Public
Accounting Firm on Internal Controls Over Financial Reporting
Board of Directors
and Shareholders
Arcadia Resources, Inc.
Indianapolis, Indiana
Arcadia Resources, Inc.
Indianapolis, Indiana
We have audited
Arcadia Resources Inc.’s internal control over financial reporting as of March
31, 2010, based on criteria established in Internal Control – Integrated Framework issued by the Committee of Sponsoring
Organizations of the Treadway Commission (the COSO criteria). Arcadia Resources
Inc.’s management is responsible for maintaining effective internal control over
financial reporting and for its assessment of the effectiveness of internal
control over financial reporting, included in the accompanying “Item 9A –
Controls and Procedures.” Our responsibility is to express an opinion on the
company’s internal control over financial reporting based on our audit.
We conducted our
audit in accordance with the standards of the Public Company Accounting
Oversight Board (United States). Those standards require that we plan and
perform the audit to obtain reasonable assurance about whether effective
internal control over financial reporting was maintained in all material
respects. Our audit included obtaining an understanding of internal control over
financial reporting, assessing the risk that a material weakness exists, and
testing and evaluating the design and operating effectiveness of internal
control based on the assessed risk. Our audit also included performing such
other procedures as we considered necessary in the circumstances. We believe
that our audit provides a reasonable basis for our opinion.
A company’s internal
control over financial reporting is a process designed to provide reasonable
assurance regarding the reliability of financial reporting and the preparation
of financial statements for external purposes in accordance with generally
accepted accounting principles. A company’s internal control over financial
reporting includes those policies and procedures that (1) pertain to the
maintenance of records that, in reasonable detail, accurately and fairly reflect
the transactions and dispositions of the assets of the company; (2) provide
reasonable assurance that transactions are recorded as necessary to permit
preparation of financial statements in accordance with generally accepted
accounting principles, and that receipts and expenditures of the company are
being made only in accordance with authorizations of management and directors of
the company; and (3) provide reasonable assurance regarding prevention or timely
detection of unauthorized acquisition, use, or disposition of the company’s
assets that could have a material effect on the financial
statements.
Because of its
inherent limitations, internal control over financial reporting may not prevent
or detect misstatements. Also, projections of any evaluation of effectiveness to
future periods are subject to the risk that controls may become inadequate
because of changes in conditions, or that the degree of compliance with the
policies or procedures may deteriorate.
In our opinion,
Arcadia Resources, Inc. maintained, in all material respects, effective internal
control over financial reporting as of March 31, 2010, based on the COSO
criteria.
We also have audited,
in accordance with the standards of the Public Company Accounting Oversight
Board (United States), the consolidated balance sheets of Arcadia Resources,
Inc. as of March 31, 2010 and 2009, and the related consolidated statements of
operations, stockholders’ equity (deficit), and cash flows for each of the three
years in the period ended March 31, 2010 and our report dated June 10, 2010
expressed an unqualified opinion thereon.
/s/BDO Seidman, LLP
Troy, Michigan
June 10, 2010
June 10, 2010
F-3
ARCADIA RESOURCES,
INC.
CONSOLIDATED BALANCE SHEETS
(IN THOUSANDS, EXCEPT PER SHARE AND SHARE AMOUNTS)
CONSOLIDATED BALANCE SHEETS
(IN THOUSANDS, EXCEPT PER SHARE AND SHARE AMOUNTS)
| March 31, | |||||||
| 2010 | 2009 | ||||||
| ASSETS | |||||||
| Current assets: | |||||||
| Cash and cash equivalents | $ | 5,444 | $ | 1,522 | |||
| Accounts receivable, net of allowance of $2,623 and $3,386, respectively | 12,366 | 15,679 | |||||
| Inventories, net | 934 | 863 | |||||
| Prepaid expenses and other current assets | 1,632 | 1,764 | |||||
| Current assets of discontinued operations | - | 5,458 | |||||
| Total current assets | 20,376 | 25,286 | |||||
| Property and equipment, net | 1,738 | 2,308 | |||||
| Goodwill | 2,500 | 17,053 | |||||
| Acquired intangible assets, net | 7,670 | 8,305 | |||||
| Other assets | 412 | 590 | |||||
| Restricted cash | 500 | - | |||||
| Assets of discontinued operations | - | 5,850 | |||||
| Total assets | $ | 33,196 | $ | 59,392 | |||
| LIABILITIES AND STOCKHOLDERS’ EQUITY | |||||||
| Current liabilities: | |||||||
| Lines of credit, current portion | $ | - | $ | 437 | |||
| Accounts payable | 3,159 | 2,765 | |||||
| Accrued expenses: | |||||||
| Compensation and related taxes | 3,191 | 2,986 | |||||
| Interest | 82 | 89 | |||||
| Health insurance | 463 | 545 | |||||
| Other | 1,508 | 917 | |||||
| Fair value of warrant liability | 1,499 | - | |||||
| Payable to affiliated agencies | 1,076 | 1,284 | |||||
| Long-term obligations, current portion | 939 | 596 | |||||
| Capital lease obligations, current portion | 69 | 59 | |||||
| Liabilities of discontinued operations | - | 2,037 | |||||
| Total current liabilities | 11,986 | 11,715 | |||||
| Lines of credit, less current portion | 7,774 | 10,889 | |||||
| Long-term obligations, less current portion | 25,192 | 26,918 | |||||
| Capital lease obligations, less current portion | 19 | 37 | |||||
| Total liabilities | 44,971 | 49,559 | |||||
| Commitments and contingencies | |||||||
| STOCKHOLDERS’ EQUITY (DEFICIT) | |||||||
| Preferred stock, $.001 par value, 5,000,000 shares authorized, none outstanding | - | - | |||||
| Common stock, $.001 par value, 300,000,000 shares authorized; 177,918,044 shares | |||||||
| and 161,249,529 shares issued, respectively | 178 | 161 | |||||
| Additional paid-in capital | 145,381 | 135,920 | |||||
| Accumulated deficit | (157,334 | ) | (126,248 | ) | |||
| Total stockholders’ equity (deficit) | (11,775 | ) | 9,833 | ||||
| Total liabilities and stockholders’ equity (deficit) | $ | 33,196 | $ | 59,392 | |||
See accompanying notes to these consolidated
financial statements.
F-4
ARCADIA RESOURCES,
INC.
CONSOLIDATED STATEMENTS OF OPERATIONS
(IN THOUSANDS, EXCEPT PER SHARE AMOUNTS)
CONSOLIDATED STATEMENTS OF OPERATIONS
(IN THOUSANDS, EXCEPT PER SHARE AMOUNTS)
| Year Ended March 31, | |||||||||||
| 2010 | 2009 | 2008 | |||||||||
| Revenues, net | $ | 103,602 | $ | 106,132 | $ | 104,819 | |||||
| Cost of revenues | 74,374 | 74,370 | 74,230 | ||||||||
| Gross profit | 29,228 | 31,762 | 30,589 | ||||||||
| Selling, general and administrative | 40,279 | 40,483 | 37,976 | ||||||||
| Depreciation and amortization | 1,850 | 2,016 | 1,860 | ||||||||
| Goodwill and intangibile asset impairment | 14,599 | 23,511 | - | ||||||||
| Total operating expenses | 56,728 | 66,010 | 39,836 | ||||||||
| Operating loss | (27,500 | ) | (34,248 | ) | (9,247 | ) | |||||
| Other expenses (income): | |||||||||||
| Interest expense, net | 3,371 | 4,072 | 4,317 | ||||||||
| Loss on extinguishment of debt | - | 4,487 | - | ||||||||
| Change in fair value of warrant liability | (979 | ) | - | - | |||||||
| Other | 30 | 75 | 129 | ||||||||
| Total other expenses (income) | 2,422 | 8,634 | 4,446 | ||||||||
| Loss from continuing operations before income taxes | (29,922 | ) | (42,882 | ) | (13,693 | ) | |||||
| Current income tax expense | 29 | 122 | 535 | ||||||||
| Loss from continuing operations | (29,951 | ) | (43,004 | ) | (14,228 | ) | |||||
| Discontinued operations: | |||||||||||
| Loss from discontinued operations | (1,692 | ) | (2,208 | ) | (6,781 | ) | |||||
| Net gain (loss) on disposal | 557 | (1,258 | ) | (2,389 | ) | ||||||
| (1,135 | ) | (3,466 | ) | (9,170 | ) | ||||||
| NET LOSS | $ | (31,086 | ) | $ | (46,470 | ) | $ | (23,398 | ) | ||
| Weighted average number of common shares outstanding | 166,840 | 134,583 | 122,828 | ||||||||
| Basic and diluted net loss per share: | |||||||||||
| Loss from continuing operations | $ | (0.18 | ) | $ | (0.32 | ) | $ | (0.12 | ) | ||
| Loss from discontinued operations | (0.01 | ) | (0.03 | ) | (0.07 | ) | |||||
| Net loss per share | $ | (0.19 | ) | $ | (0.35 | ) | $ | (0.19 | ) | ||
See accompanying notes to these consolidated
financial statements.
F-5
ARCADIA RESOURCES,
INC.
CONSOLIDATED STATEMENTS OF STOCKHOLDERS’ EQUITY (DEFICIT)
(IN THOUSANDS, EXCEPT SHARE AMOUNTS)
CONSOLIDATED STATEMENTS OF STOCKHOLDERS’ EQUITY (DEFICIT)
(IN THOUSANDS, EXCEPT SHARE AMOUNTS)
| Additional | Total | |||||||||||||||||
| Common Stock | Paid-In | Accumulated | Stockholders’ | |||||||||||||||
| Shares | Amount | Capital | Deficit | Equity (Deficit) | ||||||||||||||
| Balance, April 1, 2007 | 121,059,177 | $ | 121 | $ | 110,343 | $ | (56,380 | ) | $ | 54,084 | ||||||||
| Sale of common stock, net of $670 in fees | 11,018,905 | 11 | 12,431 | - | 12,442 | |||||||||||||
| Stock issued for current year acquisition | 1,814,883 | 2 | 1,798 | - | 1,800 | |||||||||||||
| Fees for services related to disposal of business | - | - | 876 | - | 876 | |||||||||||||
| Return of stock as consideration for an asset sale | (200,000 | ) | - | (252 | ) | - | (252 | ) | ||||||||||
| Conversion of debt | 1,129,555 | 1 | 1,451 | - | 1,452 | |||||||||||||
| Stock-based compensation expense | 1,590,056 | 1 | 3,013 | - | 3,014 | |||||||||||||
| Escrowed shares cancelled | (9,600,000 | ) | (10 | ) | 10 | - | - | |||||||||||
| Warrants repriced in conjunction with debt | - | - | 1,202 | - | 1,202 | |||||||||||||
| Contingent consideration relating to prior year acquisitions | 2,793,509 | 3 | (1,426 | ) | - | (1,423 | ) | |||||||||||
| Cashless exercise of stock options | 3,507,355 | 4 | (4 | ) | - | - | ||||||||||||
| Net loss for the year | - | - | - | (23,398 | ) | (23,398 | ) | |||||||||||
| Balance, March 31, 2008 | 133,113,440 | 133 | 129,442 | (79,778 | ) | 49,797 | ||||||||||||
| Issuance of warrants | - | - | 248 | - | 248 | |||||||||||||
| Stock-based compensation expense | 1,159,694 | 1 | 1,653 | - | 1,654 | |||||||||||||
| Contingent consideration relating to prior year acquisitions | 3,316,893 | 3 | 692 | - | 695 | |||||||||||||
| Cashless exercise of warrants | 8,545,833 | 9 | (9 | ) | - | - | ||||||||||||
| Equity issued in conjunction with debt refinancing | 15,113,669 | 15 | 3,894 | 3,909 | ||||||||||||||
| Net loss for the year | - | - | - | (46,470 | ) | (46,470 | ) | |||||||||||
| Balance, March 31, 2009 | 161,249,529 | 161 | 135,920 | (126,248 | ) | 9,833 | ||||||||||||
| Sale of common stock and warrants, net of $902 in fees | 15,857,141 | 16 | 7,704 | - | 7,720 | |||||||||||||
| Stock-based compensation expense | 323,125 | - | 1,758 | - | 1,758 | |||||||||||||
| Cashless exercise of warrants | 488,249 | 1 | (1 | ) | - | - | ||||||||||||
| Net loss for the year | - | - | - | (31,086 | ) | (31,086 | ) | |||||||||||
| Balance, March 31, 2010 | 177,918,044 | $ | 178 | $ | 145,381 | $ | (157,334 | ) | $ | (11,775 | ) | |||||||
See accompanying notes to consolidated
financial statements.
F-6
ARCADIA RESOURCES,
INC.
CONSOLIDATED STATEMENTS OF CASH FLOWS
(IN THOUSANDS)
CONSOLIDATED STATEMENTS OF CASH FLOWS
(IN THOUSANDS)
| Year Ended March 31, | |||||||||||
| 2010 | 2009 | 2008 | |||||||||
| Operating activities | |||||||||||
| Net loss for the year | $ | (31,086 | ) | $ | (46,470 | ) | $ | (23,398 | ) | ||
| Adjustments to reconcile net loss to net cash used in operating activities: | |||||||||||
| Provision for doubtful accounts | 1,736 | 4,433 | 3,309 | ||||||||
| Depreciation and amortization of property and equipment | 1,507 | 4,505 | 4,569 | ||||||||
| Amortization of intangible assets | 722 | 1,850 | 2,519 | ||||||||
| Goodwill and intangible asset impairment | 14,599 | 26,455 | 1,900 | ||||||||
| Loss on extinguishment of debt | - | 4,487 | - | ||||||||
| Non-cash interest expense | 2,397 | 2,215 | 218 | ||||||||
| (Gain) loss on business disposals | (557 | ) | 1,258 | 2,389 | |||||||
| Loss on disposal of property and equipment | - | 75 | 128 | ||||||||
| Gain on settlement of debt with common stock | - | - | (121 | ) | |||||||
| Reduction in expense due to return of common stock previously issued | - | - | (252 | ) | |||||||
| Amortization and write off of debt discount and deferred financing costs | 332 | 972 | - | ||||||||
| Change in fair value of warrant liability | (979 | ) | - | - | |||||||
| Stock-based compensation expense | 1,758 | 1,654 | 3,014 | ||||||||
| Changes in operating assets and liabilities, net of acquisitions: | |||||||||||
| Accounts receivable | 3,895 | (856 | ) | 6,188 | |||||||
| Inventories | 546 | (1,652 | ) | (1,269 | ) | ||||||
| Other assets | 558 | 515 | (536 | ) | |||||||
| Accounts payable | (596 | ) | 1,278 | (5,189 | ) | ||||||
| Accrued expenses | (694 | ) | 7 | (32 | ) | ||||||
| Due to affiliated agencies | (19 | ) | 81 | 175 | |||||||
| Deferred revenue | - | (29 | ) | (733 | ) | ||||||
| Net cash provided by (used in) operating activities | (5,881 | ) | 778 | (7,121 | ) | ||||||
| Investing activities | |||||||||||
| Business acquisitions, net of cash acquired | (281 | ) | (675 | ) | (507 | ) | |||||
| Proceeds from business disposals | 9,498 | 670 | 5,781 | ||||||||
| Increase in restricted cash | (500 | ) | - | - | |||||||
| Purchases of property and equipment | (574 | ) | (1,281 | ) | (1,274 | ) | |||||
| Net cash provided by (used in) investing activities | 8,143 | (1,286 | ) | 4,000 | |||||||
| Financing activities | |||||||||||
| Proceeds from notes payables, net of fees | 2,142 | 2,800 | - | ||||||||
| Net payments on lines of credit | (3,550 | ) | (6,416 | ) | (214 | ) | |||||
| Payments on notes payable and capital lease obligations | (7,175 | ) | (705 | ) | (5,750 | ) | |||||
| Proceeds from equity financing, net cash fess of $857 in fiscal 2010 and $670 | |||||||||||
| in fiscal 2008 | 10,243 | - | 12,442 | ||||||||
| Net cash provided by (used in) financing activities | 1,660 | (4,321 | ) | 6,478 | |||||||
| Net change in cash and cash equivalents | 3,922 | (4,829 | ) | 3,357 | |||||||
| Cash and cash equivalents, beginning of year | 1,522 | 6,351 | 2,994 | ||||||||
| Cash and cash equivalents, end of year | $ | 5,444 | $ | 1,522 | $ | 6,351 | |||||
F-7
| 2010 | 2009 | 2008 | ||||||
| Supplementary information: | ||||||||
| Cash paid during the period for: | ||||||||
| Interest | $ | 623 | $ | 904 | $ | 3,842 | ||
| Income taxes | 35 | 49 | 354 | |||||
| Non-cash investing / financing activities: | ||||||||
| Accounts payable converted to notes payable | 750 | - | - | |||||
| Line of credit converted to note payable in conjunction with refinancing | - | 5,000 | - | |||||
| Accrued interest converted to debt | 2,397 | 2,215 | - | |||||
| Conversion of debt into common stock | - | - | 1,452 | |||||
| Common stock issued in conjunction with purchase of businesses | - | - | 1,800 | |||||
| Non-cash equity financing fee | 45 | - | - | |||||
| Fee for service related to disposal of business paid in common stock | - | - | 876 | |||||
| Contingent consideration relating to prior year acquisition settled with issuance of | ||||||||
| common stock | - | 695 | 1,452 | |||||
| Stock price guarantee relating to prior year acquisition settled with issuance of | ||||||||
| notes payable | - | - | 715 | |||||
| Financing of equipment with notes payable / capital lease obligations | 70 | - | - | |||||
| Equity issued in conjunction with debt financing | - | 3,909 | - | |||||
See accompanying notes to these consolidated
financial statements.
F-8
ARCADIA RESOURCES,
INC.
NOTES TO CONSOLIDATED FINANCIAL STATEMENTS
NOTES TO CONSOLIDATED FINANCIAL STATEMENTS
Note 1 – Description of Company and
Significant Accounting Policies
Description of Company
Arcadia Resources,
Inc., a Nevada corporation, together with its wholly-owned subsidiaries (the
“Company”), is a national provider of home care, medical staffing, home health
products and pharmacy services operating under the service mark Arcadia
HealthCare. In May and June 2009, the Company disposed of its Home Health
Equipment (“HHE”), retail pharmacy software and industrial staffing businesses.
Subsequent to these divestitures, the Company operates in three reportable
business segments: Home Care/Medical Staffing Services (“Services”), Pharmacy
and Catalog. The Company’s corporate headquarters are located in Indianapolis,
Indiana. The Company conducts its business from approximately 70 facilities
located in 18 states. The Company operates pharmacies in Indiana, California and
Minnesota and has customer service centers in Michigan and Indiana.
Principles of Consolidation
The consolidated
financial statements include the accounts of Arcadia Resources, Inc. and its
wholly-owned subsidiaries. The earnings of the subsidiaries are included from
the dates of acquisition. All intercompany accounts and transactions have been
eliminated in consolidation.
Use of Estimates
The preparation of
financial statements in conformity with accounting principles generally accepted
in the United States of America (“U.S. GAAP”) require management to make
estimates and assumptions that affect the reported amounts of assets and
liabilities and the disclosure of contingent assets and liabilities as of the
date of the financial statements and revenue and expenses during the reporting
period. Changes in these estimates and assumptions may have a material impact on
the financial statements and accompanying notes.
Cash and Cash Equivalents
The Company considers
cash in banks and all highly liquid investments with terms to maturity at
acquisition of three months or less to be cash and cash equivalents.
Affiliated Agencies
The Services segment
operates independently and through a network of affiliated agencies throughout
the United States. These affiliated agencies are independently-owned,
owner-managed businesses, which have been contracted by the Company to sell
services under the Arcadia name. The arrangements with affiliated agencies are
formalized through a standard contractual agreement. The affiliated agencies
operate in particular regions and are responsible for recruiting and training
field service employees and marketing their services to potential customers
within the region. The field service employees are employees of the Company and
the related employee costs are included in cost of revenues. The Company
maintains the relationship with the customer and the payer and, as such,
recognizes the revenue. The affiliated agency’s commission is based on a
percentage of gross profit. The Company provides sales and marketing support to
the affiliated agencies and develops and maintains policies and procedures
related to certain aspects of the affiliate’s business. The contractual
agreements require a specific, timed, calculable flow of funds and expenses
between the affiliated agencies and the Company. The payments to affiliated
agencies are considered a selling expense and are classified as selling, general
and administrative expenses on the Company’s Statements of Operations. The
agreements may be terminated by the affiliate upon advance notice to the
Company. The Company may terminate the agreement only under specified
conditions. The agreements provide the Company with the first right of refusal
to purchase the affiliates’ contractual rights and interests.
Revenue generated
through the affiliate agencies represented approximately 57%, 63%, and 71% of
total revenue from continuing operations during the years ended March 31, 2010,
2009 and 2008, respectively. Related commission expense was $10,973,000,
$12,313,000, and $13,057,000 during the years ended March 31, 2010, 2009 and
2008, respectively.
F-9
Allowance for Doubtful
Accounts
The Company reviews
its accounts receivable balances on a periodic basis. Accounts receivable have
been reduced by the estimated allowance for doubtful accounts.
The provision for
doubtful accounts is primarily based on historical analysis of the Company’s
records. The analysis is based on patient and institutional client payment
histories, the aging of the accounts receivable, and specific review of patient
and institutional client records. As actual collection experience changes,
revisions to the allowance may be required. Any unanticipated change in
customers’ creditworthiness or other matters affecting the collectability of
amounts due from customers could have a material effect on the results of
operations in the period in which such changes or events occur. After all
reasonable attempts to collect a receivable have failed, the receivable is
written off against the allowance.
Inventories
Inventories are
stated at a cost that approximates the lower of cost or market method utilizing
the first in, first out (FIFO) approach. Inventories include products and
supplies held for sale at the Company’s individual locations. The pharmacy
operations possess the majority of the inventory. Inventories are evaluated
periodically for obsolescence and shrinkage.
Property and Equipment
Property and
equipment is stated at cost and is depreciated on a straight-line basis over the
estimated useful lives of the assets.
The Company generally
provides for depreciation over the following estimated useful service lives:
| Equipment | 5 years |
| Software | 3 years |
| Furniture and fixtures | 5 years |
| Vehicles | 5 years |
| Leasehold improvements | Lesser of life of lease or expected useful life |
Goodwill
The Company has
acquired several entities resulting in the recording of intangible assets,
including goodwill, which represents the excess of the purchase price over the
fair value of the net assets of businesses acquired.
The Company has three
reporting units included in continuing operations: Services, Pharmacy and
Catalog. As of March 31, 2010, the Services and Catalog reporting units had no
remaining goodwill or other amortizable intangible assets. These reporting units
are also the Company’s three reportable business segments.
The Company conducts
its annual goodwill impairment assessment during its fiscal fourth quarter.
Management would test for impairment between annual goodwill impairment
assessments if events occur or circumstances change that would more likely than
not reduce the fair value of a reporting unit below its carrying amount.
Examples of such events or circumstances include, but are not limited to, the
following: (i) a significant adverse change in business climate; (ii) an adverse
action or assessment by a regulator; (iii) unanticipated competition; or (iv) a
decline in the market capitalization below net book value.
Goodwill is tested
using a two-step process. The first step of the goodwill impairment assessment,
used to identify potential impairment, compares the fair value of a reporting
unit with its carrying amount, including goodwill (“net book value”). If the
fair value of a reporting unit exceeds its net book value, goodwill of the
reporting unit is considered not impaired, thus the second step of the
impairment test is unnecessary. If net book value of a reporting unit exceeds
its fair value, the second step of the goodwill impairment test will be
performed to measure the amount of impairment loss, if any. The second step of
the goodwill impairment assessment, used to measure the amount of impairment
loss, if any, compares the implied fair value of reporting unit goodwill, which
is determined in the same manner as the amount of goodwill recognized in a
business combination, with the carrying amount of that goodwill. If the carrying
amount of reporting unit goodwill exceeds the implied fair value of that
goodwill, an impairment loss shall be recognized in an amount equal to that
excess.
F-10
In the first step of
the goodwill impairment assessment, the Company uses an income approach to
derive a present value of the reporting unit's projected future annual cash
flows and the present residual value of the reporting unit. The fair value is
calculated as the sum of the projected discounted cash flows of the reporting
unit over the next five years and the terminal value at the end of those five
years. The Company uses a variety of underlying assumptions to estimate these
future cash flows, which vary for each of the reporting units and include (i)
future revenue growth rates, (ii) future operating profitability, (iii) the
weighted-average cost of capital and (iv) a terminal growth rate. In addition,
the Company makes certain judgments about the allocation of corporate overhead
costs in order to calculate the fair values of each of the Company’s reporting
units. Estimates of future revenue and expenses associated with each reporting
unit are the most sensitive of estimates related to the fair value calculations.
Other factors considered in the fair value calculations include assumptions as
to the business climate, industry and economic conditions. The assumptions are
subjective and different estimates could have a significant impact on the
results of the impairment analyses. In determining the appropriate assumptions,
management considers historic trends as well as current activities and
initiatives. If the Company’s estimates and assumptions used in the discounted
future cash flows should change at some future date, the Company could incur an
impairment charge which could have a material adverse effect on the results of
operations for the period in which the impairment occurs.
In addition to
estimating fair value of the Company’s reporting units using the income
approach, the Company also estimates fair value using a market-based approach
which relies on values based on market multiples derived from comparable public
companies. The Company uses the estimated fair value of the reporting units
under the market-based approach to validate the estimated fair value of the
reporting units under the income approach.
Intangible Assets
Acquired finite-lived
intangible assets are amortized using the economic benefit method when reliable
information regarding future cash flows is available and the straight-line
method when this information is unavailable. The estimated useful lives are as
follows:
| Trade name | 30 years |
| Customer relationships (depending on the type of business purchased) | 5 to 15 years |
Impairment of Long-Lived
Assets
The Company reviews
its depreciable and amortizable long-lived assets for impairment whenever
changes in circumstances indicate that the carrying amount of an asset may not
be recoverable. To determine if impairment exists, the Company compares the
estimated future undiscounted cash flows from the related long-lived assets to
the net carrying amount of such assets. If the carrying amount of an asset
exceeds its estimated future cash flows, an impairment charge is recognized for
the amount by which the carrying amount of the asset exceeds the estimated fair
value of the asset, generally determined by discounting the estimated future
cash flows.
Deferred Financing Costs
Deferred financing
costs include cash and equity-based fees paid for services provided in
conjunction with securing and negotiating debt arrangements. These costs are
amortized to interest expense over the life of the related debt.
Income Taxes
The Company provides
for deferred income taxes based on enacted income tax rates in effect on the
dates temporary differences between the financial reporting and tax bases of
assets and liabilities are expected to reverse and tax credit carryforwards are
expected to be utilized. The effect on deferred tax assets and liabilities of a
change in income tax rates is recognized in income in the period that includes
the enactment date. A valuation allowance is recorded to reduce the carrying
amounts of deferred tax assets to amounts that are more likely than not to be
realized.
Revenue Recognition and Concentration of
Credit Risk
Revenues for services
are recorded in the period the services are rendered. Revenues for products are
recorded in the period delivered based on sales prices established with the
client or its insurer prior to delivery.
Revenues recognized
under arrangements with Medicare, Medicaid and other governmental-funded
organizations were approximately 36%, 29%, and 24% of total revenues from
continuing operations for the years ended March 31, 2010, 2009 and 2008,
respectively. No customer represents more than 10% of the Company’s revenues for
the years presented.
F-11
Earnings (Loss) Per Share
Basic earnings per
share is computed by dividing net income (loss) available to common stockholders
by the weighted average number of common shares outstanding for the period.
Diluted earnings per share reflects the potential dilution that could occur if
securities, or other contracts to issue common stock, were exercised or
converted into shares of common stock. Shares held in escrow that are
contingently issuable upon a future outcome are not included in earnings per
share until they are released. Outstanding stock options, unvested restricted
stock, warrants to acquire common shares and escrowed shares have not been
considered in the computation of dilutive losses per share since their effect
would be anti-dilutive for all applicable periods shown. As of March 31, 2010,
2009 and 2008, there were approximately 20,365,000, 11,769,000, and 25,640,000
potentially dilutive shares outstanding, respectively.
Fair Value of Financial
Instruments
The carrying amounts
of the Company’s financial instruments, including cash and cash equivalents,
accounts receivable, accounts payable, and accrued expenses, approximate their
fair values due to their short maturities. Based on borrowing rates currently
available to the Company for similar terms, the carrying value of the lines of
credit, capital lease obligations, and long-term obligations approximate fair
value.
Advertising Expense
Advertising costs are
expensed as incurred. For the years ended March 31, 2010, 2009 and 2008,
advertising expenses for continuing operations were $740,000, $747,000, and
$1,039,000, respectively.
Reclassifications
Certain amounts
presented in prior years have been reclassified to conform to current year
presentations including the reflection of discontinued operations separately
from continuing operations.
Management’s Plan
During the first
quarter 2010, the Company finalized the sale of its HHE, industrial staffing and
pharmacy software businesses. Subsequent to these divestitures, the Company
narrowed its focus to a single vision of “Keeping People at Home and Healthier
Longer” and to improving the performance of its two remaining core business
units: Home Care/Medical Staffing (Services) and Pharmacy. Management has been
focused on growing revenues and improving the profitability within each segment,
implementing cost reductions to better align the Company’s selling, general and
administrative (“SG&A”) expenses with current business levels and ensuring
the Company has adequate financial resources and liquidity to fund its business
plans.
Within the Pharmacy
segment, revenue increased by more than 150% year-over-year to $15.2 million in
fiscal 2010. In June 2009, the Company entered into an agreement with WellPoint
whereby the Company will provide its DailyMed medication management program to
WellPoint’s high-risk Medicaid members in five states where WellPoint companies
provide Medicaid managed care benefits through its State Sponsored Business
division. The program was launched to WellPoint’s high risk members in Virginia
in August 2009. The program is being rolled out to WellPoint’s California and
South Carolina patients, and enrollment in Kansas and New York is expected to
begin the first half of fiscal 2011.
The WellPoint
agreement, combined with the Company’s relationship with the Indiana Medicaid
program and other payers, provides the Company with a significant growth
opportunity within its Pharmacy segment. As the Pharmacy business grows,
management expects more payers will become aware of and interested in the unique
benefits of the DailyMed program. Additionally, the national focus on healthcare
has increased awareness to the importance of medication adherence and the need
for solutions that reduce costs by enabling people to take medications properly
and safely while remaining in their homes. As a result, management believes that
the Pharmacy segment will establish additional payer relationships over the next
several years, which will drive revenue growth well in excess of that generated
from the existing payer relationships.
F-12
The long-term success
of the Pharmacy business depends heavily on the continued growth in revenue,
improvement in margins, the ability to reduce SG&A expenses as a percentage
of revenue, and additional revenue from cost sharing agreements. Management
believes that the Company’s continued focus on reducing healthcare costs and
establishing relationships with payers will ultimately provide the necessary
revenue growth to allow the Company to leverage its current SG&A structure.
The Pharmacy segment entered into a new prime vendor agreement in April 2010.
This new agreement combined with various on-going operational initiatives and
software enhancements is expected to improve gross margins during fiscal 2011.
SG&A expenses are expected to decline as a percentage of revenue due to
operational improvements, investments in new operating systems and technology,
and leveraging more fixed expenses over a larger revenue base. The combination
of revenue growth, improved margins and lower SG&A expenses is expected to
reduce the operating losses and cash needed to fund the Pharmacy business.
However, it is expected that the Pharmacy segment will continue to be a net user
of cash through most of fiscal 2011.
Within the Services
segment, the Company has maintained its Home Care revenue despite challenging
economic conditions and high levels of unemployment, which both negatively
impacted Home Care demand in the short-term. Management continues to explore
cost-effective ways to organically grow the Home Care revenue. At the same time,
the Company has seen a significant reduction in Medical Staffing revenue
consistent with overall staffing industry trends. The Company has reduced the
SG&A in this segment over the last 12 months and will continue to look for
additional cost-saving opportunities. Management expects these on-going
initiatives to improve the Service segment results during fiscal 2011. At
current levels of revenue, it is unlikely that the profitability of the Services
segment will be sufficient to offset the losses and cash usage in the Pharmacy
segment. However, when revenues return to more historic levels as the Home Care
business grows and the Medical Staffing market recovers, the Services segment is
expected to see an improvement in operating income and cash flow.
The Company continues
to have a negative cash flow on a monthly basis as the Pharmacy losses and
Corporate expenses exceed the cash flows generated by the Services segment. In
addition, certain financial covenants exist with lenders that could limit the
Company’s flexibility and financing options. While management believes that the
Company’s financial performance will improve during fiscal 2011 and move toward
profitability and positive cash flow in fiscal 2012, there are many actions that
must be successfully implemented by the management team in order to achieve
these goals.
In November 2009, the
Company finalized an equity financing transaction and raised $10,243,000 in net
cash proceeds. Consistent with the terms of the debt agreement dated September
10, 2009, the Company used $2,400,000 of the proceeds to pay off the outstanding
balance. The remaining $7,815,000 is being used to fund on-going
operations.
In April 2010, and in
conjunction with the Pharmacy’s new prime vendor agreement, the Company executed
a $5 million Line of Credit and Security Agreement with its new vendor. The
interest rate is the greater of 7% and the prime rate plus 3%, and the term of
the loan is for three years. The total amount available under this financing
arrangement is $5 million less amounts due for normal vendor payables and for
accrued interest. No interest payments are due during the first 12 months of the
agreement. Beginning in April 2011, no additional advances will be made if the
Pharmacy segment’s borrowing base does not exceed certain
thresholds.
Management believes
that the additional cash raised over the last six months will provide the
Company with the capital necessary to support operating cash requirements in the
near term as the financial performance improves. If and when necessary,
management believes that it would be able to raise additional capital to support
on-going operations and to fund growth opportunities. This capital could be in
the form of debt or equity financing.
While there are some
synergies between the Services and Pharmacy businesses, each could operate as
standalone businesses and each could be sold to, or have investment made by,
strategic or financial investors to fund operations and other growth
opportunities. In addition to the normal financing opportunities as described
above, this provides further financing flexibility should there be a need for
additional capital to support the growth within one or both
segments.
The above discussion
represents management’s intentions as of June 2010. There can be no assurances
that any actions contemplated or available will be successfully undertaken or
that management will not change its plans.
Recent Accounting
Pronouncements
On July 1, 2009, the
Financial Accounting Standards Board (“FASB”) issued the FASB Accounting
Standards Codification (the “Codification”). The Codification became the single
source of authoritative nongovernmental U.S. GAAP, superseding existing
accounting pronouncements issued by the FASB, American Institute of Certified
Public Accountants (“AICPA”), and the Emerging Issues Task Force (“EITF”). The
Codification eliminates the previous U.S. GAAP hierarchy and establishes one
level of authoritative GAAP. All other literature is considered
non-authoritative. The Codification is effective for interim and annual periods
ending after September 15, 2009. The Company adopted the Codification during its
fiscal second quarter 2010. There was no impact to the consolidated financial
results as this change is disclosure-only in nature.
F-13
In April 2009, the
FASB issued additional requirements regarding interim disclosures about the fair
value of financial instruments which were previously only disclosed on an annual
basis. Entities are now required to disclose the fair value of financial
instruments which are not recorded at fair value in the financial statements in
both their interim and annual financial statements. The new requirements were
effective for interim and annual periods ending after June 15, 2009 on a
prospective basis. The Company adopted these requirements in the fiscal first
quarter 2010. The recorded amounts of the Company’s financial instruments at
March 31, 2010 approximate fair value.
On April 1, 2009, the
Company adopted the revised FASB guidance regarding business combinations which
was required to be applied to business combinations on a prospective basis. The
revised guidance requires that the acquisition method of accounting be applied
to a broader set of business combinations, amends the definition of a business
combination, provides a definition of a business, requires an acquirer to
recognize an acquired business at its fair value at the acquisition date and
requires the assets and liabilities assumed in a business combination to be
measured and recognized at their fair values as of the acquisition date (with
limited exceptions). There was no impact upon adoption and the effects of this
guidance will depend on the nature and significance of business combinations
occurring after the effective date.
In June 2008, the
FASB ratified consensus which addresses how an entity should evaluate whether an
instrument is indexed to its own stock. The consensus is effective for fiscal
years (and interim periods) beginning after December 15, 2008 and must be
applied to outstanding instruments as of the beginning of the fiscal year in
which the consensus is adopted and should be treated as a cumulative-effect
adjustment to the opening balance of retained earnings. Early adoption was not
permitted. As of April 1, 2009, the adoption of this consensus did not have an
impact on the Company’s financial statement as of the beginning of the fiscal
year. However, as described in Note 9, the Company issued warrants in November
2009 which have been accounted for under this guidance. See Note 9 for a
discussion on the impact that the adoption of this guidance had on the Company’s
financial statements.
Note 2 – Discontinued
Operations
HHE Operations
Fiscal 2010
On May 18, 2009, the
Company completed the sale of its ownership interest in Lovell Medical Supply,
Inc., Beacon Respiratory Services of Georgia, Inc., and Trinity Healthcare of
Winston-Salem, Inc. to Aerocare Holdings, Inc. for total proceeds of $4,750,000,
less fees of $150,000. At the time of closing, $475,000 of the purchase price
was held by the buyer to cover the Company’s contingent obligations. During
fiscal 2010, the buyer released $267,000 of this amount, which was recognized as
an additional gain on the sale. In May 2010, the Company received the final
payment of $155,000. A total of $53,000 was retained by the buyer to cover
certain obligations of the Company. The entities sold represented the Southeast
region of the Company’s HHE business.
On May 19, 2009, the
Company entered into an Asset Purchase Agreement with Braden Partners, L.P. to
sell the assets of its Midwest region of the Company’s HHE business. Total
proceeds were $4,000,000, less fees of $150,000. $1,000,000 of the purchase
price was held by the buyer to cover the Company’s contingent obligations. The
Company retained all accounts receivable for services provided prior to May
2009. Subsequent to the transaction date, the buyer made certain claims, and in
June 2010, the buyer and the Company agreed to a final settlement to resolve
these claims. On June 7, 2010, a final payment relating to this transaction of
$500,000 was released to the Company.
Based on the combined
sales price of the HHE business, the Company recorded an impairment charge of
$540,000 in the fourth quarter of fiscal 2009.
As of May 2009, the
Company had sold all of its HHE operations.
Fiscal 2009
In October 2008, the
Company recognized $696,000 in additional loss on the sale of its ownership
interest in Beacon Respiratory Services, Inc. (“Beacon”), which was divested of
in September 2007. See Note 9 – “Stockholders’ Equity” for a more detailed
discussion of this transaction.
On January 5, 2009,
the Company entered into an Asset Purchase Agreement with Braden Partners, L.P.
to sell the assets of its HHE business in San Fernando, California. Total
proceeds were originally estimated to be $503,000, less fees of $24,000. The
Company retained all accounts receivables for services provided prior to January
2009. Total proceeds included $126,000 that was held back by the buyer to cover
certain contingent obligations of the Company. During fiscal 2010, the Company
and the buyer resolved certain claims, and the entire holdback amount was
forfeited by the Company.
F-14
Fiscal 2008
On September 10,
2007, the Company completed the sale of Beacon to Aerocare Holdings, Inc. for
cash proceeds of $6,500,000, less fees of $457,500. $750,000 of the purchase
price was originally held by the buyer to cover the Company’s contingent
obligations. In March 2008, $375,000 was released to the Company, and an
additional $356,000 was released to the Company in September 2008. The Company
retained all accounts receivable for services provided prior to August 2007. The
entity sold represented the Florida region of the Company’s HHE
business.
On September 10,
2007, the Company completed the sale of substantially all of the assets of
Beacon Respiratory Services of Colorado, Inc. to an affiliate of AeroCare
Holdings, Inc. for cash proceeds of $1,200,000, less fees of $83,000. The
Company retained all accounts receivable for services provided prior to August
2007. This transaction had no hold back provisions. The assets sold represented
the Colorado region of the Company’s HHE business.
Pharmacy Operations
Fiscal 2010
On June 11, 2009, the
Company entered into an Asset Purchase Agreement with a leading pharmacy
management company to sell substantially all of the assets of JASCORP, LLC
(“JASCORP”) for proceeds of $2,200,000, less fees of $185,000. $220,000 of the
purchase price is being held back by the buyer until December 2011 in order to
cover the Company’s contingent obligations. JASCORP operated the retail pharmacy
software business that the Company acquired in July 2007. As part of the
divestiture, the Company entered into a License and Services Agreement with the
buyer which provides the Company the right to continue to use the software for
internal purposes.
Fiscal 2008
During the year ended
March 31, 2008, the Company ceased its operations at its Hollywood, Florida
pharmacy, which were part of the Pharmacy segment.
Industrial Staffing
Operations
Fiscal 2010
On May 29, 2009, the
Company finalized the sale of substantially all of the assets of its industrial
and non-medical staffing business for cash proceeds of $250,000, which was paid
in five equal installments through September 2009. Additionally, the Company is
to receive 50% of the future earnings of the business until the total payments
equal $1,600,000. During fiscal 2010, the Company received $72,000 in earn out
payments and recorded this amount as an additional gain on the transaction. The
Company retained all accounts receivable for services provided prior to May 29,
2009.
Based on the original
sales price, the Company recorded an impairment charge of $2,403,000 in the
fourth quarter of fiscal 2009.
Retail Operations
Fiscal 2008
On July 31, 2007, the
Company entered into an Asset Purchase Agreement with an entity controlled by a
former employee of the Company. Based on the terms of the agreement, the Company
sold the retail operations located within certain Sears stores for $216,000.
$25,000 of the purchase price was paid with a deposit previously received by the
Company, and the parties entered into a 12-month promissory note, which bears
interest at an annual rate of 8%, for the remaining purchase price balance. The
Sears retail operations were part of the HHE segment.
F-15
During the year ended
March 31, 2008, the Company ceased its operations at all seven of its retail
operations located within certain Wal-Mart stores in Florida, Texas and New
Mexico. The Wal-Mart retail operations were part of the HHE
segment.
Care Clinic Operations
Fiscal 2008
In December 2006,
Care Clinic, Inc., a subsidiary of the Company, entered into a Staffing and
Support Services Agreement with Metro Health Basic Care (“Metro”) to operate
non-emergency health care clinics in Michigan and Indiana (the “Clinic”
segment). Under the agreement, Metro provided medical management services to the
non-emergency care clinics, including the oversight of physician credentialing
and employment, as well as clinic licensing. Care Clinic, Inc. provided staffing
and support services, including the oversight of billing, collections, and
third-party contract negotiations, as well as the credentialing and employment
of non-physician practitioners and other administrative personnel. The initial
term of the agreement was five years, although either party could terminate
without cause on 180 days written notice. During the year ended March 31, 2008,
the Company terminated this agreement and ceased its non-emergency health care
clinics initiative. In October 2007, the Company and Metro finalized a
settlement relating to the Company’s early termination of the agreement. The
Company recognized approximately $770,000 of expense relating to the settlement
and closure of the Clinics. The Clinic segment was a separate reporting
segment.
Prior to their actual
disposal, the assets and liabilities associated with these discontinued business
operations have been classified as assets and liabilities of discontinued
operations in the accompanying consolidated balance sheets. The results of the
above are reported in discontinued operations in the accompanying consolidated
statements of operations, and the prior period consolidated statements of
operations have been recast to conform to this presentation. The segment results
in Note 15 also reflect the reclassification of the discontinued operations. The
discontinued operations do not reflect the costs of certain services provided to
these operations by the Company. Such costs, which were not allocated by the
Company to the various operations, included internal employee costs associated
with administrative functions, including accounting, information technology,
human resources, compliance and contracting as well as external costs for legal
fees, insurance, audit fees, payroll processing, and various public-company
expenses. The Company uses a centralized approach to cash management and
financing of its operations, and, accordingly, debt and the related interest
expense were also not allocated specifically to these operations. The
consolidated statements of cash flows do not separately report the cash flows of
the discontinued operations.
F-16
There were no assets
or liabilities of the discontinued operations at March 31, 2010. The components
of the assets and liabilities of the discontinued operations as of March 31,
2009 are presented below (in thousands):
| March 31, 2009 | ||||||||||||
| Services - | ||||||||||||
| Industrial | Pharmacy - | |||||||||||
| Staffing | HHE | Software | Total | |||||||||
| Assets | ||||||||||||
| Accounts receivable, net of allowance of $968 | $ | 972 | $ | 3,199 | $ | 138 | $ | 4,309 | ||||
| Inventory, net | - | 829 | 20 | 849 | ||||||||
| Prepaid expenses and other current assets | 35 | 175 | 90 | 300 | ||||||||
| Total current assets of discontinued operations | 1,007 | 4,203 | 248 | 5,458 | ||||||||
| Property and equipment, net | 17 | 1,716 | 132 | 1,865 | ||||||||
| Goodwill | - | 507 | 923 | 1,430 | ||||||||
| Acquired intangibles assets, net | - | 1,822 | 733 | 2,555 | ||||||||
| Total assets of discontinued operations | $ | 1,024 | $ | 8,248 | $ | 2,036 | $ | 11,308 | ||||
| Liabilities | ||||||||||||
| Accounts payable | $ | 4 | $ | 986 | $ | 74 | $ | 1,064 | ||||
| Accrued compensation and related taxes | 228 | 350 | 93 | 671 | ||||||||
| Accrued other | 84 | 64 | 60 | 208 | ||||||||
| Long-term obligations, current portion | - | 94 | - | 94 | ||||||||
| Capital lease obligations, current portion | - | - | - | - | ||||||||
| Total current liabilities of discontinued operations | $ | 316 | $ | 1,494 | $ | 227 | $ | 2,037 | ||||
F-17
The components of the
earnings/(loss) from discontinued operations are presented below (in thousands):
| Year Ended March 31, | ||||||||||||
| 2010 | 2009 | 2008 | ||||||||||
| Revenues, net: | ||||||||||||
| Services - Industrial Staffing | $ | 1,223 | $ | 15,842 | $ | 26,119 | ||||||
| Home Health Equipment | 1,423 | 17,643 | 22,841 | |||||||||
| Pharmacy - Software / Florida | 348 | 2,133 | 3,313 | |||||||||
| Retail operations | - | - | 377 | |||||||||
| Care Clinic, Inc. | - | - | 202 | |||||||||
| $ | 2,994 | $ | 35,618 | $ | 52,852 | |||||||
| Earnings (loss) from operations: | ||||||||||||
| Services - Industrial Staffing | $ | (85 | ) | $ | (1,791 | ) | $ | 1,766 | ||||
| Home Health Equipment | (1,425 | ) | (352 | ) | (1,081 | ) | ||||||
| Pharmacy - Software / Florida | (182 | ) | (65 | ) | (1,207 | ) | ||||||
| Retail operations | - | - | (597 | ) | ||||||||
| Care Clinic, Inc. | - | - | (5,662 | ) | ||||||||
| $ | (1,692 | ) | $ | (2,208 | ) | $ | (6,781 | ) | ||||
| Gain (loss) on disposal: | ||||||||||||
| Services - Industrial Staffing | $ | 201 | $ | - | $ | - | ||||||
| Home Health Equipment | 386 | (1,258 | ) | (1,458 | ) | |||||||
| Pharmacy - Software / Florida | (30 | ) | - | - | ||||||||
| Retail operations | - | - | (161 | ) | ||||||||
| Care Clinic, Inc. | - | - | (770 | ) | ||||||||
| $ | 557 | $ | (1,258 | ) | $ | (2,389 | ) | |||||
| Earnings (loss) from discontinued operations: | ||||||||||||
| Services - Industrial Staffing | $ | 116 | $ | (1,791 | ) | $ | 1,766 | |||||
| Home Health Equipment | (1,039 | ) | (1,610 | ) | (2,539 | ) | ||||||
| Pharmacy - Software / Florida | (212 | ) | (65 | ) | (1,207 | ) | ||||||
| Retail operations | - | - | (758 | ) | ||||||||
| Care Clinic, Inc. | - | - | (6,432 | ) | ||||||||
| $ | (1,135 | ) | $ | (3,466 | ) | $ | (9,170 | ) | ||||
Note 3 – Fair Value
Effective April 1,
2008, the Company adopted accounting guidance that established a framework for
measuring fair value and expanded disclosures about fair value measurements.
Fair value is an exit price, representing the amount that would be received to
sell an asset, or paid to transfer a liability, in an orderly transaction
between market participants. Fair value is to be determined based on assumptions
that market participants would use in pricing an asset or liability. Current
authoritative accounting guidance uses a three-tier hierarchy that classifies
assets and liabilities based on the inputs used in the valuation methodologies.
In accordance with this guidance, the Company measures its warrant liability at
fair value. Management classified these as level 3 liabilities, as they are
based on unobservable inputs and involve management judgement.
F-18
The following table
presents a reconciliation of warrant liabilities measured at fair value on a
recurring basis at March 31, 2010 (in thousands):
| Fair Value | ||||
| Measurements | ||||
| Using Significant | ||||
| Unobservable | ||||
| Inputs (Level 3) | ||||
| Warrant Liability | ||||
| Balance at April 1, 2009 | $ | - | ||
| Warrants issued | 2,478 | |||
| Decrease in market value | (979 | ) | ||
| Balance at March 31, 2010 | $ | 1,499 | ||
For the year ended
March 31, 2010 the Company recognized an impairment charge of $14,599,000 of the
remaining goodwill associated with the Services segment. For the year ended
March 31, 2009, the Company wrote down the fair value of the Pharmacy segment
goodwill to $2,500,000, resulting in an impairment charge of $13,217,000, which
was included in the operating loss for fiscal 2009. In conjunction with the
goodwill impairment, the Company recognized an impairment expense relating to
the Pharmacy segment’s customer relationships of $9,402,000. The asset’s fair
value was determined based on an income approach but also considered a
market-based approach to validate the estimated fair value.
Note 4 – Business
Acquisitions
Fiscal 2010
During the year ended
March 31, 2010, the Company paid a total of $281,000 relating to various
business acquisitions within the Services segment, of which $50,000 was for an
acquisition in December 2009 and $231,000 represented current year installment
payments for prior year acquisitions.
Fiscal 2009
On April 25, 2008,
the Company acquired substantially all of the assets of Carolina Care, LLC
(“Carolina Care”). Carolina Care is a provider of home health care services in
North Carolina. The total purchase price was $400,000, of which $274,000 was
paid in cash during fiscal 2009 and $100,000 was paid in fiscal 2010, plus a
potential earn-out payment not to exceed $125,000 if the business’s gross margin
exceeded certain established during the first 12-month period. These criteria
were not met and no additional amounts were paid. The acquired business is
included in the Services segment.
Fiscal 2008
On July 11, 2007, the
Company acquired 100% of the membership interests of JASCORP, LLC (“JASCORP”).
JASCORP provided a range of retail pharmacy management services and systems,
including dispensing and billing software. The primary reason for the
acquisition was to improve the software offered to retailers through the
pharmacy licensed service model. The total purchase price of $2,225,000 included
cash payments of $384,000 and the issuance of 3,327,286 shares of common stock.
The Company issued 1,814,883 shares of common stock at closing and then issued
an additional 1,512,403 shares of common stock at the one-year anniversary day
of the transaction in order to satisfy a guaranteed stock price obligation. The
Company divested of substantially all of the assets of JASCORP on June 11, 2009,
and the results of operations of JASCORP from July 12, 2007 through June 10,
2009 are included in discontinued operations. The acquired business was included
in the Pharmacy segment.
F-19
The following
summarizes the purchase price allocation relating to the JASCORP acquisition (in
thousands):
| Share consideration | $ | 1,800 | ||
| Cash consideration | 384 | |||
| Acquisition costs | 41 | |||
| Total purchase price | $ | 2,225 | ||
| Current assets | $ | 501 | ||
| Fixed assets | 228 | |||
| Liabilities | (237 | ) | ||
| Intangible assets: | ||||
| Customer relationships | 720 | |||
| Acquired technology | 90 | |||
| Goodwill | 923 | |||
| Total net identifiable assets | $ | 2,225 | ||
The useful
lives of customer relationships and acquired technology associated with the
JASCORP acquisition were 25 and 2 years, respectively.
F-20
Note 5 – Property and
Equipment
Property and
equipment consists of the following at March 31 (in thousands):
| 2010 | 2009 | |||||||||||||
| Accumulated | Accumulated | |||||||||||||
| Depreciation/ | Depreciation/ | |||||||||||||
| Cost | Amortization | Cost | Amortization | |||||||||||
| Equipment | $ | 1,921 | $ | 1,048 | $ | 1,427 | $ | 654 | ||||||
| Software | 2,750 | 2,160 | 2,619 | 1,359 | ||||||||||
| Furniture and fixtures | 859 | 659 | 692 | 517 | ||||||||||
| Vehicles | 49 | 33 | 49 | 24 | ||||||||||
| Leasehold improvements | 100 | 41 | 100 | 25 | ||||||||||
| 5,679 | $ | 3,941 | 4,887 | $ | 2,579 | |||||||||
| Less accumulated depreciation and amortization | (3,941 | ) | (2,579 | ) | ||||||||||
| Net property and equipment | $ | 1,738 | $ | 2,308 | ||||||||||
Total depreciation
and amortization expense for property and equipment included in continuing
operations was $1,215,000, $1,066,000, and $732,000 for the years ended March
31, 2010, 2009 and 2008, respectively.
Note 6 – Goodwill and Acquired Intangible
Assets
The following table
presents the detail of the changes in goodwill by segment for the years ended
March 31, 2010 and 2009 (in thousands):
| Services | Pharmacy | Catalog | Total | |||||||||||||
| Goodwill at April 1, 2008 | $ | 13,996 | $ | 15,717 | $ | 811 | $ | 30,524 | ||||||||
| Acquisitions during the year | 557 | - | - | 557 | ||||||||||||
| Impairment expense | - | (13,217 | ) | (811 | ) | (14,028 | ) | |||||||||
| Goodwill at March 31, 2009 | 14,553 | 2,500 | - | 17,053 | ||||||||||||
| Acquisitions during the year | 46 | - | - | 46 | ||||||||||||
| Impairment expense | (14,599 | ) | - | - | (14,599 | ) | ||||||||||
| Goodwill at March 31, 2010 | $ | - | $ | 2,500 | $ | - | $ | 2,500 | ||||||||
Prior to the goodwill
impairment expense recognized in fiscal 2009 for Pharmacy and Catalog and in
fiscal 2010 for Services, the Company had not previously recognized any goodwill
impairment expense for continuing operations.
For tax purposes
goodwill of approximately $16.4 million is amortizable over 15 years while the
remainder of the Company’s goodwill is not amortizable for tax purposes as the
acquisitions related to the purchase of common stock rather than of assets or
net assets.
F-21
Acquired intangible
assets consist of the following at March 31 (in thousands):
| 2010 | 2009 | |||||||||||||
| Accumulated | Accumulated | |||||||||||||
| Cost | Amortization | Cost | Amortization | |||||||||||
| Trade name | $ | 6,664 | $ | 847 | $ | 6,664 | $ | 682 | ||||||
| Customer relationships | 4,720 | 2,867 | 4,720 | 2,397 | ||||||||||
| 11,384 | $ | 3,714 | 11,384 | $ | 3,079 | |||||||||
| Less accumulated amortization | (3,714 | ) | (3,079 | ) | ||||||||||
| Net acquired intangible assets | $ | 7,670 | $ | 8,305 | ||||||||||
Amortization expense
for acquired intangible assets included in continuing operations was $635,000,
$952,000, and $1,132,000 for the years ended March 31, 2010, 2009 and 2008,
respectively. On March 31, 2009, the Company recognized certain impairment
charges relating to its Pharmacy and Catalog customer relationship balances that
reduced the costs by $9,720,000 and $230,000, respectively. The net impact of
the impairment charges are discussed below. The customer relationship cost
increased by $335,000 during fiscal 2009 upon the acquisition of Carolina Care,
LLC (see Note 4 – “Business Acquisitions”).
The estimated
amortization expense related to acquired intangible assets in existence as of
March 31, 2010 is as follows (in thousands):
| Fiscal 2011 | $ | 571 | |
| Fiscal 2012 | 518 | ||
| Fiscal 2013 | 476 | ||
| Fiscal 2014 | 382 | ||
| Fiscal 2015 | 350 | ||
| Thereafter | 5,373 | ||
| Total | $ | 7,670 | |
Impairment Expense
In accordance with
our policy, the Company performs its annual impairment review during the fiscal
fourth quarter.
Continuing Operations
Fiscal 2010
As of the end of
fiscal year 2010, the Company performed the first step of the goodwill
impairment analysis for the two reporting units with remaining goodwill balances
at that time: Services and Pharmacy.
The Home Care /
Medical Staffing segment is a mature business that has been in existence for
more than 30 years. Over this period of time, the business has experienced
periods of growth and decline, similar to other businesses and industries. Over
the last two years, the segment as a whole has seen declining revenue, and this
decline has been primarily driven by a decline in the medical staffing and
travel staffing businesses. Many of the Service’s segments locations provide
both home care and medical staffing services. During fiscal 2010, home care
accounted for 79% of total segment revenue and medical staffing and travel
staffing, in the aggregate, accounted for the remaining 21% of revenue. The
medical staffing and travel staffing business experienced a 46% decline in
revenue from fiscal 2008 to fiscal 2010. During this same period, home care
revenue increased by 9%, but fiscal 2010 revenue was approximately 1% lower than
fiscal 2009. While management believes that the market for temporary medical
staffing services will eventually improve, the timing and extent of such
improvement is uncertain and there could be further declines before such
recovery occurs. In addition, while management believes that its home care
business will grow as population demographics drive increased demand, in the
near-term, such growth will depend in part on the improvement in the overall
U.S. economy and the extent to which state-funded programs experience additional
funding cut-backs. Because management’s ability to predict the timing and extent
of these factors is subject to some uncertainty, it has focused on more recent
trends in its annual impairment analysis, which resulted in lower future cash
flow projections than in prior years’ analysis. The impairment analysis resulted
in a $14,599,000 goodwill impairment charge for fiscal 2010, and subsequent to
this charge, there is no remaining goodwill associated with the Services
segment.
F-22
In conjunction with
the fiscal 2009 goodwill impairment analysis (as described below), the Company
recognized a $13,217,000 goodwill impairment charge in the Pharmacy reporting
unit. Subsequent to the impairment charge, the Pharmacy segment has $2,500,000
of remaining goodwill. As evidenced by the growth in its year-over-year revenue
from $6.0 million in fiscal 2009 to $15.2 million in fiscal 2010, the Pharmacy
segment continued to advance its DailyMed business during fiscal 2010, but it
continues to be in the early stages of development. Management believes that the
DailyMed program will be the primary growth driver for the Company as a whole
over the next several years. In performing the goodwill impairment analysis for
the Pharmacy reporting unit during the fiscal fourth quarter 2010, management
relied on recent trends and future expectations based on these trends and
industry experience to project future operating results. The fiscal 2011 revenue
estimates were based on payer relationships that existed as of the time of the
analysis. The revenue estimates in the future years assume new payer
relationships similar to the WellPoint relationship. Additionally, management
assumed margin improvement over the next five years due to increased volume,
operational improvements and additional revenue from medication adherence
services, which will generate higher margins than drug revenue. Management also
estimated that SG&A as a percentage of revenue will improve due to software
and technological enhancements as well as efficiencies gained through volume and
experience. As of March 31, 2010, the Pharmacy reporting unit analysis indicated
that its fair value was in excess of it carrying value by approximately 40% so
the second step of the analysis was not considered necessary. The primary events
that could negatively affect the Pharmacy assumptions would be the inability to:
add additional payer relationships; improve margins; and/or reduce the labor
costs as much as expected.
Fiscal 2009
As of the end of
fiscal year 2009, the Company performed the first step of the goodwill
impairment analysis for all three of its reporting units: Services, Catalog and
Pharmacy.
In the impairment
analysis of the Services reporting unit performed as of March 31, 2009,
management assumed a revenue growth rate of 4.6% for the year ended March 31,
2010 and between 4.7% and 5.0% for the years thereafter. Additionally,
management assumed that margins over the next five years would remain consistent
at between 30.0% and 30.5% compared to margins of 30.5% for the year ended March
31, 2009. With regards to total SG&A for the Services reporting unit,
management assumed that it would decrease by approximately 2% for the year ended
March 31, 2010 and then modestly increase in the years thereafter. The decrease
in SG&A expenses in the first year of the projections reflects the impact of
certain charges taken in the year ended March 31, 2009 as well as the benefits
of various cost reduction initiatives. In the projections, the total SG&A is
impacted by the amount of corporate allocation charged to the Services segment.
The Company believes that the Pharmacy segment will grow significantly over the
next several years, and as this growth occurs, the amount of fixed corporate
overhead allocated to the Pharmacy will increase with a corresponding decrease
to the Services segment. As of March 31, 2009, the Services reporting unit
analysis indicated that its fair value was in excess of it carrying value by
approximately 5% so the second step of the analysis was not considered
necessary.
The Pharmacy goodwill
was originally recognized during the fiscal year ended March 31, 2007 in
conjunction with the PrairieStone Pharmacy, LLC acquisition in February 2007. At
the time of the acquisition, PrairieStone marketed several pharmacy-related
products and services, including the DailyMed medication management system and a
license service model whereby it contracted with regional retail chain
pharmacies to provide pharmacy expertise and access to a restricted third party
network. The various PrairieStone offerings were in the early stages of
development, and Company management believed that they could complement the
goods and services being offered by Arcadia Resources, Inc. at the time.
Subsequent to the acquisition, management began to focus on the DailyMed product
because of its perceived potential, and, to date, the Company has not worked to
expand the other PrairieStone offerings. As of March 31, 2009, the DailyMed
business was in its early stages and lacked meaningful historic financial
trends. Additionally, the anticipated growth in the Pharmacy reporting unit had
experienced several delays. In performing the goodwill impairment analysis for
the Pharmacy unit during fiscal fourth quarter 2009, management acknowledged
these issues and the difficulty in projecting the timing and amount of future
revenue and cash flow streams, which are the basis for the fair value estimates
of the reporting unit. Management was obligated to temper its estimates of
future cash flows from the Pharmacy business until such time as those cash flows
have started to actually be realized with sustained regularity. The impairment
analysis resulted in a $13,217,000 impairment charge for fiscal 2009. Subsequent
to the impairment charge, $2,500,000 of goodwill remains in the Pharmacy
reporting unit.
F-23
During the fourth
quarter fiscal 2009, the Company performed the goodwill impairment analysis for
the Catalog reporting unit. The analysis indicated that the carrying value was
in excess of the fair value due to the financial performance of this business
unit falling short of original projections and the general expectation that the
Catalog business may not grow significantly in the near term due to management’s
focus on the other lines of business. The Company recorded an impairment charge
relating to the Catalog reporting unit of $811,000. Subsequent to the impairment
charge, no goodwill remains related to the Catalog reporting unit. The Company
also recognized a $81,000 impairment of the Catalog’s customer
relationships.
Discontinued Operations
Fiscal 2009
The Company finalized
the sale of its HHE and Industrial Staffing business units in May 2009. Based on
the sales prices for these businesses, the Company recognized an impairment
expense relating to the Industrial Staffing business unit’s acquired intangible
assets of $2,403,000 and also recognized an impairment expense relating to the
HHE business unit’s goodwill of $541,000.
Fiscal 2008
During the quarter
ended June 30, 2007, the Company recognized an impairment expense of $1,900,000
related to the write-down of computer software and leasehold improvements
associated with the retail non-emergency care clinics initiative. During the
quarter ended September 30, 2007, the Company ceased operations of the
non-emergency care clinics and began classifying the initiative as discontinued
operations in the Statement of Operations.
Note 7 – Lines of Credit
The following table
summarizes the lines of credit for the Company (in thousands):
| At March 31, 2010 | |||||||||||||
| Maximum | |||||||||||||
| Available | March 31, | ||||||||||||
| Lending Institution | Maturity date | Borrowing | Balance | 2009 | Interest rate | ||||||||
| Comerica Bank | August 1, 2011 | $ | 8,164 | $ | 7,774 | $ | 9,126 | Prime plus 2.75% | |||||
| AmerisourceBergen Drug Corporation | N/A | - | - | 2,200 | 10% | ||||||||
| Total lines of credit obligations | $ | 8,164 | 7,774 | 11,326 | |||||||||
| Less current portion | - | (437 | ) | ||||||||||
| Long-term portion | $ | 7,774 | $ | 10,889 | |||||||||
Comerica Bank
Arcadia Services,
Inc. (“ASI”), a wholly-owned subsidiary of the Company, and three of ASI’s
wholly-owned subsidiaries have an outstanding line of credit agreement with
Comerica Bank. Advances under the line of credit agreement cannot exceed the
revolving credit commitment amount or the aggregate principal amount of
indebtedness permitted under the advance formula amount at any one time. On July
13, 2009, ASI executed an amendment to this line of credit agreement, which
reduced the total available advances from $19 million to $14 million. The
advance formula base is 85% of the eligible accounts receivable, plus the lesser
of 85% of eligible unbilled accounts or $3,000,000. The line of credit agreement
contains a subjective acceleration clause and requires the Company to maintain a
lockbox. However, the Company has the ability to control the funds in the
deposit account and to determine the amount used to pay down the line of credit
balance. As such, the line of credit is not automatically classified as a
current obligation in the consolidated balance sheets. Arcadia Services, Inc.
agreed to various financial covenant ratios (as described below), to have any
person who acquires Arcadia Services, Inc.’s capital stock to pledge such stock
to Comerica Bank, and to customary negative covenants. The amendment to the line
of credit agreement also requires the Company to maintain a deposit account with
a minimum balance of $500,000, and this amount is classified as restricted cash
on the Company’s balance sheet. If an event of default occurs, Comerica Bank
may, at its option, accelerate the maturity of the debt and exercise its right
to foreclose on the issued and outstanding capital stock of Arcadia Services,
Inc. and on all of the assets of Arcadia Services, Inc. and its subsidiaries. On
March 31, 2010, the interest rate
on this line of credit agreement was the bank’s prime rate plus 2.75% (6.0%),
and the availability under the line was $390,000.
F-24
RKDA, Inc. (“RKDA”),
a wholly-owned subsidiary of the Company and the holding company of Arcadia
Services, Inc. and Arcadia Products, Inc., granted Comerica Bank a first
priority security interest in all of the issued and outstanding capital stock of
Arcadia Services, Inc. Arcadia Services, Inc. granted Comerica Bank a first
priority security interest in all of its assets. The subsidiaries of Arcadia
Services, Inc. granted the bank security interests in all of their assets. RDKA
is restricted from paying dividends to the Company. RKDA executed a guaranty to
Comerica Bank for all indebtedness of Arcadia Services, Inc. and its
subsidiaries. Any such default and resulting foreclosure would have a material
adverse effect on the Company’s financial condition.
The July 2009
amendment to the line of credit agreement includes the following financial
covenants: tangible effective net worth of $2 million as of September 30, 2009
and gradually increasing on a quarterly basis to $2.8 million by September 2011;
minimum quarterly net income of $400,000; and, minimum subordination of
indebtedness to Arcadia Resources, Inc. of $15.5 million. As of March 31, 2010,
the Company was not in compliance with the quarterly net income covenant due to
the Services segment goodwill impairment charge recognized during the fiscal
fourth quarter 2010. The Company received a covenant waiver from Comerica Bank
on June 9, 2010.
AmerisourceBergen Drug Corporation
In connection with
the acquisition of PrairieStone in February 2007, PrairieStone entered into a
line of credit agreement with AmerisourceBergen Drug Corporation (“ABDC”), which
previously maintained an ownership interest in PrairieStone. The line of credit
was secured by a security interest in all of the assets of PrairieStone and
SSAC, LLC, a wholly-owned subsidiary of the Company, and was guaranteed by the
Company.
On June 10, 2009, the
Company entered into an amendment to the line of credit agreement, which
converted the line of credit to a term loan. The amendment included terms
whereby if the Company paid down the remaining balance outstanding on the line
of credit, ABDC would defer the payment of certain inventory purchases up to
$750,000 until April 1, 2010, and the deferred balance would accrue interest at
8.0%. On June 11, 2009 and simultaneous with the divestiture of JASCORP, the
Company paid ABDC a total of $2,125,000 in order to pay off the line of credit
balance. During June 2009, the Company deferred $750,000 in inventory purchasing
payments. As of March 31, 2010, the $750,000 due to ABDC is included in current
liabilities on the accompanying consolidated balance sheets (see also “Note 8 –
Long-term Obligations”). The balance was paid in full in April 2010.
F-25
Note 8 – Long-Term
Obligations
Long-term obligations
consist of the following at March 31 (in thousands):
| March 31, | March 31, | |||||||
| 2010 | 2009 | |||||||
| Note payable to JANA Master Fund, Ltd. ("JANA") in the original amount of $18.0 million, dated March 25, 2009 bearing an effective interest rate of 10% with unpaid accrued interest and principal due in full on April 1, 2012. Cash interest that would otherwise be payable on such quarterly interest payment dates may be added to the principal balance of the note payable at the Company's option. The note payable is unsecured. | $ | 17,581 | $ | 18,035 | ||||
| Note payable to Vicis Capital Master Fund ("Vicis") in the original amount of $7.8 million, dated March 25, 2009 bearing an effective interest rate of 10% with unpaid accrued interest and principal due in full on April 1, 2012. Cash interest that would otherwise be payable on such quarterly interest payment dates may be added to the principal balance of the note payable at the Company's option. The note payable is unsecured. | 6,505 | 7,882 | ||||||
| Note payable to LSP Partners, LP ("LSP") in the amount of $1.0 million, dated March 25, 2009 bearing an effective interest rate of 10% with unpaid accrued interest and principal due in full on April 1, 2012. Cash interest that would otherwise be payable on such quarterly interest payment dates may be added to the principal balance of the note payable at the Company's option. The note payable is unsecured. | 1,106 | 1,000 | ||||||
| Payable due to AmerisourceBergen Drug Corporation consistent with the terms of an amendment to a line of credit agreement dated June 10, 2009 bearing an effective interest rate of 8.0%. The unpaid accrued interest and principal was paid in full in April 2010. The debt was secured by the assets of the Pharmacy segment. (see also "Note 7 - Lines of Credit") | 750 | - | ||||||
| Post-closing risk share obligation relating to the PrairieStone acquisition, bearing an effective interest rate of 10%. | - | 408 | ||||||
| Other | 189 | 189 | ||||||
| Total long-term obligations | 26,131 | 27,514 | ||||||
| Less current portion of long-term obligations | (939 | ) | (596 | ) | ||||
| Long-term obligations, less current portion | $ | 25,192 | $ | 26,918 | ||||
On September 10,
2009, the Company entered into note payable agreements in the aggregate amount
of $2,400,000 with an original maturity date of April 1, 2012. The notes
included a mandatory repayment provision whereby if the Company raised in excess
of $5,000,000 in a debt or equity transaction, the notes would be paid in full.
In November 2009, the Company finalized an equity transaction with gross
proceeds of $11,100,000. Consistent with the terms of the debt agreements, the
Company used a portion of the proceeds to pay off the $2,400,000 balance.
On March 25, 2009,
the Company entered into a Master Exchange Agreement with JANA (related entity),
Vicis (related entity) and LSP. Pursuant to the agreement, Vicis purchased
$2,000,000 of the principal balance of promissory note held by JANA.
Additionally, JANA and LSP advanced the Company $2,000,000 and $1,000,000 of
cash, respectively. JANA and Vicis then exchanged their previously outstanding
promissory notes for new notes with terms as described above. The new promissory
notes due to JANA, Vicis, and LSP include covenants relating to, among other
items, limitations of additional indebtedness, issuance of new equity securities
and the application of proceeds from future asset sales. Specifically, the notes
provide that the first $2,000,000 in proceeds would be retained by the Company. Additional proceeds are then
paid to JANA, Vicis and LSP as provided in the promissory notes. After these
promissory note prepayments are made, proceeds up to $20,000,000 are split 50%
to the Company and 50% to be paid pro-rata to these three lenders. Thereafter,
proceeds are split 25% to the Company and 75% to the lenders. As of March 31,
2010, the Company owes these lenders $800,000 before additional proceeds are
split between the Company and the lenders.
F-26
As of March 31, 2010
future maturities of long-term obligations are as follows (in thousands):
| Fiscal 2011 | $ | 939 |
| Fiscal 2012 | - | |
| Fiscal 2013 | 25,192 | |
| Total | $ | 26,131 |
The weighted average
interest rate of outstanding long-term obligations as of March 31, 2010 and 2009
was 9.9% and 10.0%, respectively.
Note 9 – Stockholders’ Equity
(Deficit)
General
On October 14, 2009,
the Company’s shareholders approved an amendment to the Company’s Articles of
Incorporation to increase the number of authorized shares of the Company’s
common stock to 300,000,000, $0.001 par value per share, from 200,000,000,
$0.001 par value per share.
Common Stock Transactions – Fiscal
2010
On November 17, 2009,
the Company finalized an equity financing transaction whereby it raised
$11,100,000 in gross proceeds. Under the terms of the agreements with the
investors, the Company sold 15,857,141 units for $0.70 per unit. Each unit
consists of one share of common stock and a warrant to purchase 0.45 shares of
common stock. The Company issued an aggregate of 15,857,141 shares of common
stock and 7,135,713 warrants to purchase common stock.
The warrants, which
have an exercise price of $0.95, cannot be exercised until six months and one
day after the original issuance date and expire five years after they first
become exercisable.
Expenses associated
with the transaction, which include a 6.5% placement agent fee, were $902,000
resulting in net cash proceeds of $10,243,000. Consistent with the terms of the
debt agreements entered into in September 2009, the Company used $2,400,000 of
the net proceeds to pay off certain outstanding debt.
Common Stock Transactions – Fiscal
2009
In July 2007, the
Company acquired 100% of the membership interest of JASCORP. As partial
consideration, the Company issued 1,814,883 shares of common stock. The Company
guaranteed the share price of $0.99 per share at the one-year anniversary date
of the acquisition. In July 2008, the Company issued 1,512,402 shares of common
stock to the former owner of JASCORP in order to satisfy the guaranteed stock
price obligation. Because the share price guarantee was contemplated and
accounted for at the time of the acquisition, the issuance of additional shares
of common stock did not impact the original purchase price
allocation.
In September 2007 and
simultaneous with the Company’s sale of its Florida and Colorado home health
equipment businesses, the Company released 1,068,140 shares of common stock to
the former owners of Alliance Oxygen & Medical Equipment, Inc. (“Alliance”),
an entity acquired by the Company in July 2006. The release of the shares was
consistent with the terms of an Escrow Release Agreement entered into on July
19, 2007. In the agreement, the Company guaranteed the share price of $0.70 per
share. In October 2008, the Company issued 1,804,491 shares of common stock to
the former owners of Alliance in order to satisfy the guaranteed stock price
obligation. The value of these shares was determined to be $695,000. This amount
was recognized as an additional
loss on the disposal of the Florida HHE divestiture and is included in
discontinued operations for the year ended March 31, 2009 (see “Note 3 -
Discontinued Operations”).
F-27
On March 25, 2009 and
in conjunction with the debt refinancing described in Note 8, the Company issued
6,056,499 shares of common stock valued at $2,059,000 to the lenders as
consideration for providing the additional financing and extending the maturity
date of the previously existing debt. The Company also exchanged 4,683,111
warrants held by two of the lenders (Vicis and JANA) for 5,616,444 shares of
common stock with an incremental fair value of $1,145,000. Finally, a total of
8,545,833 warrants with a strike price of $.001 per share held by these two
lenders were exercised on a cashless basis, and an additional 1,555,555 warrants
held by one of the lenders were canceled. The aggregate amount of $3,204,000 is
included in “Loss on Extinguishment of Debt”.
Concurrent with the
March 25, 2009 debt refinancing, the holders of the warrants issued in
conjunction with the May 2007 private placement transaction agreed to exchange a
total of 2,754,726 warrants for 2,754,726 shares of common stock with an
incremental fair value of $566,000, which is also included in “Loss on
Extinguishment of Debt”. The Company also issued 50,000 shares of common stock
valued at $17,000 to a financial advisor as compensation for assistance in the
communication with the warrant holders.
As partial
consideration for the assistance with the debt refinancing from an investment
bank, the Company exchanged 636,000 Class A warrants held by an affiliate of the
investment bank for 636,000 shares of common stock with an incremental fair
value of $107,000. As further consideration, the Company repriced 1,070,796
Class A warrants, and the incremental fair value was immaterial.
On March 31, 2009,
the Company issued 409,287 shares of common stock valued at $172,000 to its
Board of Directors as partial consideration for their fees for the period
October 1, 2008 through September 30, 2009.
Common Stock Transactions – Fiscal
2008
In April and July
2007, the Company issued a total of 850,456 shares of common stock as
consideration for the quarterly debt payments due on April 12, 2007 and July 12,
2007 totaling $1,050,000 related to the acquisition of Alliance Oxygen &
Medical Equipment. The shares were valued as of the dates of the debt payment
agreements. On January 9, 2008, the Company issued an additional 202,281 shares
of common stock valued at $218,000, recorded as interest expense, to the former
owners of Alliance Oxygen & Medical Equipment to satisfy a guaranteed stock
price provision relating to the shares issued as debt payments.
In May and August
2007, the Company issued a total of 279,099 shares of common stock as
consideration for the quarterly debt payments due on January 27, 2007, April 27,
2007, July 27, 2007 and October 27, 2007 totaling $303,000 related to the
acquisition of Remedy Therapeutics, Inc. The shares were valued as of the dates
of the debt payment agreements.
In May 2007, the
Company issued an aggregate of 11,018,905 shares of common stock at $1.19 per
share and warrants to purchase 2,754,726 shares of common stock at an exercise
price of $1.75 per share in a private placement resulting in aggregate proceeds
of $13,112,000. The fair value of the warrants was estimated using the
Black-Scholes pricing model and was determined to be $2,163,000. The assumptions
used were as follows: risk free interest rate of 4.79%, expected dividend yield
of 0%, expected volatility of 63%, and expected life of 7 years. If the Company
sells shares of stock at a price less than $1.19 per share before May 2010, then
the exercise price of the warrants will decrease to the new offering price, and
the number of warrants will increase such that the total aggregate exercise
price remains unchanged. This warrant re-pricing provision excludes certain
common stock offerings, including offerings under the Company’s equity incentive
plan, previously existing shareholder rights, and stock splits. Under the
accompanying registration rights agreements, the Company agreed to file, within
60 days of closing, a registration statement to register the resale of the
shares and use its best efforts to cause the registration statement to be
declared effective within 120 days after the registration statement is filed.
The registration statement was filed on July 6, 2007 and was declared effective
on July 13, 2007, which was within the required time-period.
In conjunction with
the private placement, the Company paid fees totaling $670,000.
On June 26, 2007, the
Company entered into a Securities Redemption Agreement with the minority
interest holders of Pinnacle EasyCare, LLC (“Pinnacle”). Pursuant to the
agreement, the Company sold its 75% interest in Pinnacle, which was originally
acquired in November 2006, to the minority interest holders for the return of
200,000 shares of the Company’s common stock valued at $252,000 that were issued
to the minority interest holders as partial consideration in the original
transaction. The shares were returned to the Company and cancelled.
F-28
On September 10, 2007
and simultaneous with the Company’s sale of its Florida and Colorado home health
equipment businesses, the Company released 1,068,140 shares of common stock to
the former owners of Alliance Oxygen & Medical Equipment, Inc., an entity
acquired by the Company in July 2006. The release of the shares was consistent
with the terms of an Escrow Release Agreement entered into on July 19, 2007. The
value of the shares of $876,000 was determined based on the stock price on
September 10, 2007. The release of the shares increased the loss on the disposal
of the HHE operations.
On February 16, 2008,
which is the one year anniversary of the PrairieStone acquisition, the Company
became obligated to issue 2,635,386 shares of common stock to the former owners
of PrairieStone to satisfy a guaranteed stock price provision included in the
original purchase agreement. Because this provision was contemplated in the
purchase price at the time of acquisition, the issuance of the additional shares
had no impact on the purchase price allocation for accounting purposes. In
addition, the Company issued the former owners of PrairieStone 158,123 shares of
common stock valued at $162,000 to settle a one-year anniversary price
adjustment liability.
Warrants
The following
represents warrants outstanding as of March 31:
| Exercise Price | Granted | Expiration | 2010 | 2009 | |||||
| $ | 0.001 | September 2005 | September 2010 | - | 444,444 | ||||
| $ | 0.41 | April 2009 | April 2014 | 52,800 | - | ||||
| $ | 0.50 | various | May 2011 | 2,301,774 | 2,438,385 | ||||
| $ | 0.50 | May 2004 | March 2014 | 1,070,796 | 1,070,796 | ||||
| $ | 0.75 | June 2008 | June 2015 | 490,000 | 490,000 | ||||
| $ | 0.95 | November 2009 | May 2015 | 7,135,713 | - | ||||
| $ | 2.25 | September 2005 | September 2010 | 44,444 | 44,444 | ||||
| 11,095,527 | 4,488,069 | ||||||||
The outstanding
warrants have no voting rights and provide the holder with the right to convert
one warrant for one share of the Company’s common stock at the stated exercise
price. The majority of the outstanding warrants have a cashless exercise
feature.
The 7,135,713
warrants issued in November 2009 in conjunction with the equity financing
transaction did not meet all of the criteria for equity classification. As a
result, on November 17, 2009, the Company recorded the warrants in accordance
with ASC Topic 815-40, “Derivatives and Hedging”, as a warrant
liability at its then fair value of $2,477,000. The Company will mark the
warrant liability to market at the end of each period until the Company complies
with the requirements of equity classification of the warrant, at which time the
warrant liability will be reclassified to equity. As of March 31, 2010, the
Company recorded $979,000 as other income. This amount represents the change in
the fair value of the warrant liability from the time of the equity financing
transaction to March 31, 2010.
The fair value of
warrant liability was calculated under the Black-Scholes pricing model using the
Company’s stock price on the date of the warrant grant, the warrant exercise
price, the Company’s expected volatility, and the risk free interest rate
matched to the warrants’ expected life. The Company does not anticipate paying
dividends during the term of the warrants. The Company uses historical data to
estimate volatility assumptions used in the valuation model. The expected term
of warrants is equal to the contract life. The risk-free rate for periods within
the contractual life of the warrant is based on the U.S. Treasury yield curve in
effect at the time of grant.
F-29
The specific
assumptions used to determine the fair value of the warrants are as
follows:
| Weighted-average | November 17, 2009 | March 31, 2010 | ||
| Expected volatility | 86% | 84% | ||
| Expected dividend yields | 0% | 0% | ||
| Expected terms (in years) | 5.5 | 5.1 | ||
| Risk-free interest rate | 2.19% | 2.69% |
During the year ended
March 31, 2010, 581,055 warrants were exercised on a cashless basis resulting in
the issuance of 510,738 shares of common stock. Additionally, in April 2009, the
Company accounted for 22,489 shares of common stock forfeited to the Company as
part of the cashless exercise of 8,545,833 warrants.
On March 25, 2009,
and in conjunction with the debt refinancing described in Note 8, certain
warrants were exercised, canceled, repriced and/or exchanged for shares of
common stock as more fully described above.
No warrants were
exercised during the fiscal year ended March 31, 2008.
On March 31, 2008 and
in conjunction with the note payable entered into with Vicis Capital Master
Fund, the Company amended a warrant agreement held by Vicis. The amendment
reduced the exercise price and extended the maturity date. The value associated
with the re-pricing of the 3,111,111 warrants was determined to be $1,202,000
and was recorded as a debt discount on March 31, 2008. On March 25, 2009, and in
conjunction with the debt refinancing described in Note 8, these warrants were
exchanged for shares of common stock.
As discussed in Note
7, in June 2008 and as partial consideration for the amendment of the line of
credit agreement with ABDC, the Company issued 490,000 warrants to purchase
common stock at an exercise price of $0.75 per share. The fair value of the
warrants was estimated using the Black-Scholes pricing model and was determined
to be $248,000. This was recorded as a “loss on extinguishment of debt” in the
accompanying Consolidated Statements of Operations. The assumptions used were as
follows: risk free interest rate of 3.63%, expected dividend yield of 0%,
expected volatility of 76%, and expected life of 7 years.
F-30
Note 10 — Commitments and
Contingencies
Lease Commitments
The Company leases
office space under several operating lease agreements, which expire through
2014. Rent expense for continuing operations relating to these leases amounted
to approximately $1,020,000, $1,046,000, and $934,000 for the years ended March
31, 2010, 2009 and 2008, respectively.
The following is a
schedule of approximate future minimum lease payments, exclusive of real estate
taxes and other operating expenses, required under operating and capital leases
that have initial or remaining non-cancelable lease terms in excess of one year
(in thousands):
| Capital | Operating | |||||
| Leases | Leases | |||||
| Year ending March 31: | ||||||
| 2011 | $ | 70 | $ | 962 | ||
| 2012 | 26 | 801 | ||||
| 2013 | - | 721 | ||||
| 2014 | - | 670 | ||||
| 2015 | - | 442 | ||||
| Thereafter | - | 825 | ||||
| Total minimum lease payments | 96 | $ | 4,421 | |||
| Less amount representing interest | (8 | ) | ||||
| Total principal payments | 88 | |||||
| Less current maturities | (69 | ) | ||||
| $ | 19 | |||||
Contingencies
As a health care
provider, the Company is subject to extensive federal and state government
regulation, including numerous laws directed at preventing fraud and abuse and
laws regulating reimbursement under various government programs. The marketing,
billing, documenting and other practices of health care companies are all
subject to government scrutiny. To ensure compliance with Medicare and other
regulations, audits may be conducted, with requests for patient records and
other documents to support claims submitted for payment of services rendered to
customers, beneficiaries of the government programs. Violations of federal and
state regulations can result in severe criminal, civil and administrative
penalties and sanctions, including disqualification from Medicare and other
reimbursement programs.
The Company is
subject to various legal proceedings and claims which arise in the ordinary
course of business. The Company does not believe that the resolution of such
actions will materially affect the Company’s business, results of operations or
financial condition.
Note 11 – Stock-Based
Compensation
On August 18, 2006,
the Board of Directors unanimously approved the Arcadia Resources, Inc. 2006
Equity Incentive Plan (the “2006 Plan”), which was subsequently approved by the
stockholders on September 26, 2006. The 2006 Plan provides for grants of
incentive stock options, non-qualified stock options, stock appreciation rights
and restricted shares (collectively “Awards”). The 2006 Plan will terminate and
no more Awards will be granted after August 2, 2016, unless terminated by the
Board of Directors sooner. The termination of the 2006 Plan will not affect
previously granted Awards. All non-employee directors, executive officers and
employees of the Company and its subsidiaries are eligible to receive Awards
under the 2006 Plan.
On January 27, 2009,
the Board of Directors approved and adopted the Second Amendment (the
"Amendment") to the 2006 Plan, and the Amendment was approved by the
stockholders on October 14, 2009. The Amendment increased the number of shares
available to be issued under the Plan to 5% of the Company's authorized shares
of common stock, or 15 million shares.
F-31
As of March 31, 2010,
approximately 5.1 million shares were available for grant under the amended 2006
Plan.
Following are the
specific valuation assumptions used for each respective years:
| Weighted-average | 2010 | 2009 | 2008 | ||
| Expected volatility | 92% | 77% | 68% | ||
| Expected dividend yields | 0% | 0% | 0% | ||
| Expected terms (in years) | 4.38 | 4.65 | 7.00 | ||
| Risk-free interest rate | 1.81% | 2.67% | 4.28% |
Stock option activity
for the years ended March 31, 2010 and 2009 is summarized below:
| Weighted- | ||||||||||
| Weighted- | Average | Aggregate | ||||||||
| Average | Remaining | Intrinsic | ||||||||
| Exercise | Contractual | Value | ||||||||
| Options | Shares | Price | Term (Years) | (thousands) | ||||||
| Outstanding at April 1, 2008 | 1,872,989 | $ | 1.09 | |||||||
| Granted | 2,524,236 | 0.53 | ||||||||
| Exercised | (626,000 | ) | 1.14 | |||||||
| Outstanding at March 31, 2009 | 3,771,225 | 0.76 | ||||||||
| Granted | 4,961,572 | 0.60 | ||||||||
| Forfeited or expired | (396,613 | ) | 1.03 | |||||||
| Outstanding at March 31, 2010 | 8,336,184 | $ | 0.65 | 5.7 | $ | 102 | ||||
| Exercisable at March 31, 2010 | 6,325,294 | $ | 0.65 | 5.5 | $ | 99 | ||||
In fiscal 2009, the
Board determined that certain members of executive management would be granted
an aggregate of 3,380,001 options which would vest over three years. On April 3,
2008, the Board authorized the issuance of one-third of this total, or 1,126,667
options, for executive management (such portion which vested quarterly over
fiscal 2009) and determined that the remaining two-thirds were to be issued as
soon as the Company had option shares available in its equity incentive plan to
do so. Following approval of the Amendment of the Plan as described above, on
January 27, 2009, the Board of Directors granted the remaining two-thirds of
these options to the executives (an aggregate of 2,253,334 options), such
options (i) having an exercise price of $0.72 per share (the closing share price
on April 2, 2008), (ii) vesting in equal installments on March 31, 2010 and
2011, and (iii) expiring on January 26, 2016. At the annual meeting on October
14, 2009, the shareholders approved the Amendment to the Plan. Therefore, the
2,253,334 options were granted for accounting purposes in fiscal 2010 and are so
included in the above table.
F-32
The following table
summarizes information about stock options outstanding at March 31, 2010:
| Options Outstanding | Options Exercisable | |||||||||||
| Weighted | ||||||||||||
| Average | Weighted | Weighted | ||||||||||
| Remaining | Average | Average | ||||||||||
| Number | Contractual | Exercise | Number | Exercise | ||||||||
| Range of Exercise Prices | Outstanding | Life | Price | Exercisable | Price | |||||||
| $0.18 -$0.25 | 516,000 | 3.7 | $ | 0.25 | 512,000 | $ | 0.25 | |||||
| $0.26 - $1.00 | 7,251,604 | 4.3 | $ | 0.59 | 5,244,714 | $ | 0.60 | |||||
| $1.01 - $1.50 | 450,967 | 2.9 | $ | 1.34 | 450,967 | $ | 1.34 | |||||
| $1.51 - $2.25 | 43,000 | 3.1 | $ | 2.22 | 43,000 | $ | 2.22 | |||||
| 2.92 | 74,613 | 3.3 | $ | 2.92 | 74,613 | $ | 2.92 | |||||
| Outstanding at March 31, 2009 | 8,336,184 | $ | 0.65 | 6,325,294 | $ | 0.65 | ||||||
The weighted-average
grant-date fair value of options granted during the years ended March 31, 2010
and 2009 was $0.43 and $0.35, respectively. The total intrinsic value of options
exercised during the year ended March 31, 2008 was $3.0 million. No stock
options were exercised during the years ended March 31, 2010 and
2009.
The Company
recognized $1,354,000, $766,000, and $910,000 in stock-based compensation
expense from all operations relating to stock options during the years ended
March 31, 2010, 2009, and 2008, respectively.
As of March 31, 2010,
total unrecognized stock-based compensation expense related to stock options was
$940,000, which is expected to be expensed through March 31, 2012.
Restricted Stock
Restricted stock is
measured at fair value on the date of the grant, based on the number of shares
granted and the quoted price of the Company’s common stock. The value is
recognized as compensation expense ratably over the corresponding employee’s
specified service period. Restricted stock vests upon the employees’ fulfillment
of specified performance and service-based conditions.
The following table
summarizes the activity for restricted stock awards during the years ended March
31, 2010 and 2009:
| Weighted- | |||||
| Average | |||||
| Grant Date | |||||
| Fair Value | |||||
| Shares | per Share | ||||
| Unvested at April 1, 2008 | 961,801 | $ | 1.47 | ||
| Granted | 31,750 | 0.60 | |||
| Vested | (481,709 | ) | 1.46 | ||
| Forfeited | (35,750 | ) | 1.19 | ||
| Unvested at March 31, 2009 | 476,092 | 1.45 | |||
| Granted | 100,000 | 0.52 | |||
| Vested | (233,125 | ) | 1.67 | ||
| Forfeited | (10,000 | ) | 1.48 | ||
| Unvested at March 31, 2010 | 332,967 | $ | 1.10 | ||
F-33
During the years
ended March 31, 2010, 2009 and 2008, the Company recognized $360,000, $565,000,
and $1,900,000, respectively, of stock-based compensation expense from all
operations related to restricted stock.
During the years
ended March 31, 2010, 2009 and 2008, the total fair value of restricted stock
vested was $595,000, $701,000, and $2.9 million, respectively.
As of March 31, 2010,
total unrecognized stock-based compensation expense related to unvested
restricted stock awards was $360,000, which is expected to be expensed over a
weighted-average period of approximately 1.4 years.
Note 12 – Income Taxes
The Company incurred
$29,000, $122,000, and $535,000 of state and local income tax expense during the
years ended March 31, 2010, 2009, and 2008, respectively.
Our provision for
income taxes differs from the amount computed by applying the statutory federal
income tax rate to net loss before taxes. The sources of the tax effects of the
differences are as follows:
| 2010 | 2009 | 2008 | |||||||
| Income tax benefit at 34% | -34.0 | % | -34.0 | % | -34.0 | % | |||
| State and local income taxes | -3.3 | % | -2.6 | % | 1.1 | % | |||
| Goodwill amortization/impairment | 9.1 | % | 1.1 | % | 15.8 | % | |||
| Non-deductible other items | -0.8 | % | 0.1 | % | 1.7 | % | |||
| Other | 0.4 | % | 7.5 | % | -4.7 | % | |||
| Valuation allowance | 28.7 | % | 28.2 | % | 22.4 | % | |||
| Effective tax rate | 0.1 | % | 0.3 | % | 2.3 | % | |||
Significant
components of the Company’s deferred income tax assets and liabilities are
comprised of the following at March 31 (in thousands):
| 2010 | 2009 | |||||||
| Net operating losses | $ | 28,477 | $ | 19,641 | ||||
| Allowance for doubtful accounts | 1,096 | 1,731 | ||||||
| Depreciation and amortization | 4,659 | 8,346 | ||||||
| Other temporary differences | 2,644 | 2,508 | ||||||
| Total | 36,876 | 32,226 | ||||||
| Valuation allowance | (36,876 | ) | (32,226 | ) | ||||
| Net deferred income taxes | $ | - | $ | - | ||||
F-34
NOL’s that will be
available to offset future taxable income as of March 31, 2010 through the dates
shown below are as follows (in thousands):
| September 30, 2022 | $ | 58 | |
| September 30, 2023 | 1,066 | ||
| September 30, 2024 | 795 | ||
| March 31, 2025 | 1,944 | ||
| March 31, 2026 | 2,080 | ||
| March 31, 2027 | 11,498 | ||
| March 31, 2028 | 21,834 | ||
| March 31, 2029 | 20,090 | ||
| March 31, 2030 | 19,726 | ||
| $ | 79,091 | ||
Goodwill related to
asset purchases is amortized over 15 years for tax purposes, and goodwill
related to the purchase of stock of corporations is not amortized for tax
purposes.
As a result of
certain realization requirements of ASC Topic 718, the table of deferred tax
assets and liabilities shown above does not include certain deferred tax assets
at March 31, 2010 and 2009 that arose directly from tax deductions related to
equity compensation in excess of compensation recognized for financial
reporting. Equity will be increased by $789,000 if and when such deferred tax
assets are ultimately realized. The Company uses tax law ordering for purposes
of determining when excess tax benefits have been realized.
ASC Topic 740
requires that a valuation allowance be established when it is more likely than
not that all or a portion of deferred income tax assets will not be realized. A
review of all available positive and negative evidence needs to be considered,
including a company’s performance, the market environment in which the company
operates, the length of carryback and carryforward periods, and expectation of
future profits. The relevant guidance further states, that forming a conclusion
that a valuation allowance is not needed is difficult when there is negative
evidence such as the cumulative losses in recent years. Therefore, cumulative
losses weigh heavily in the overall assessment. The Company will provide a full
valuation allowance on future tax benefits until it can sustain a level of
profitability that demonstrates its ability to utilize the assets, or other
significant positive evidence arises that suggests the Company’s ability to
utilize such assets.
Effective April 1,
2007, the Company adopted FIN 48, Accounting for Uncertainty in Income Taxes (codified primarily in FASB ASC Topic 740,
Income Taxes). Upon adoption and the conclusion of the
initial evaluation of the Company’s uncertain tax positions (“UTP’s”) under FIN
48, no adjustments were recorded in the accounts. Consistent with past practice,
the Company recognizes interest and penalties related to unrecognized tax
benefits through interest and operating expenses, respectively. No amounts were
accrued as of March 31, 2010 and there was no current year activity related to
unrecognized tax benefits. In the major jurisdictions in which the Company
operates, which includes the United States and various individual states
therein, returns for various tax years from 2006 forward remain subject to
audit. The Company is not currently under examination for federal or state
income tax purposes. The Company does not expect a significant increase or
decrease in unrecognized tax benefits during the next 12 months.
Management judgment
is required in determining the provision for income taxes, the deferred tax
assets and liabilities and any valuation allowance recorded against deferred tax
assets. Management judgment is also required in evaluating whether tax benefits
meet the more-likely-than-not threshold for recognition under ASC Topic
740.
Note 13 – Employee Benefit
Plans
The Company has a
401(K) defined contribution plan, whereby eligible employees may defer a
percentage of compensation up to Internal Revenue Services limits. The Company
may make discretionary employer contributions. The Company made no contributions
on the employees’ behalf for any of the years ended March 31, 2010, 2009 and
2008.
F-35
Note 14 – Related Party
Transactions
On March 31, 2010,
the Company had an outstanding balance of $17,581,000 related to a note payable
with JANA dated March 25, 2009. JANA held approximately 15% of the
outstanding shares of Company common stock on March 31, 2010. The Company
incurred interest expense relating to the debt due JANA in the amounts of
$1,682,000, $1,688,000, and $2,300,000 during the years ended March 31, 2010,
2009 and 2008. See “Note 8 – Long-term Obligations” for additional information
pertaining to the balances of these debt instruments.
On March 31, 2010,
the Company had an outstanding balance of $6,505,000 related to a note payable
with Vicis Capital Master Fund dated March 25, 2009. Vicis held greater than 15%
of the outstanding shares of Company common stock on March 31, 2010. The Company
incurred interest expense relating to the debt in the amount of $610,000 and
$1,753,000 during the years ended March 31, 2010 and 2009, respectively. See
“Note 8 – Long-term Obligations” for additional information pertaining to the
balances of this debt instrument.
The Company’s Chief
Operating Officer has a beneficial ownership interest in an affiliated agency
and thereby has an interest in the affiliate’s transactions with the Company,
including the payments of commissions to the affiliate based on a specified
percentage of gross margin. The affiliate is responsible to pay its selling,
general and administrative expenses. Commissions totaled $844,000, $1,361,000
and $1,514,000 for fiscal 2010, 2009 and 2008, respectively. In addition, the
Company has an agreement with this affiliate, which is terminable under certain
circumstances, to purchase the business under certain events, but in no event
later than 2011.
Note 15 – Segment
Information
The Company reports
net revenue from continuing operations and operating income/(loss) from
continuing operations by reportable segment. Reportable segments are components
of the Company for which separate financial information is available that is
evaluated on a regular basis by the chief operating decision maker in deciding
how to allocate resources and in assessing performance.
The Company’s
continuing operations include three segments: Services, Pharmacy and Catalog.
Segments include operations engaged in similar lines of business and in some
cases, may utilize common back office support services.
The Services segment
is a national provider of home care services, including skilled and personal
care, and medical staffing services (per diem and travel nursing) to numerous
types of acute care and sub-acute care medical facilities. In May 2009, the
Company sold its industrial staffing business, which has since been included in
discontinued operations.
The Catalog segment
operates a home-health oriented mail-order catalog and related website. In May
2009, the Company sold its HHE business, which sold respiratory and medical
equipment throughout the United States. The Catalog and HHE businesses were
previously combined as one segment. The HHE business has since been included in
discontinued operations.
The Pharmacy segment
includes the Company’s proprietary medication management system called
DailyMed™. The Company’s pharmacies in Indiana and Minnesota dispense patient’s
prescriptions, over-the-counter medications and vitamins, and organize them into
pre-sorted packets clearly marked with the date and time they should be taken.
The DailyMed™ approach is designed to improve the safety and efficacy of the
medications being dispensed. In June 2009, the Company sold its pharmacy
dispensing and billing software business, which has since been included in
discontinued operations.
F-36
The accounting
policies of each of the reportable segments are the same as those described in
the Summary of Significant Accounting Policies. Management evaluates performance
based on profit or loss from operations, excluding corporate, general and
administrative expenses, as follows (in thousands):
| Year Ended March 31, | ||||||||||||
| 2010 | 2009 | 2008 | ||||||||||
| Revenue, net: | ||||||||||||
| Services | $ | 86,635 | $ | 97,537 | $ | 96,589 | ||||||
| Pharmacy | 15,154 | 6,019 | 5,071 | |||||||||
| Catalog | 1,813 | 2,576 | 3,159 | |||||||||
| Total revenue | $ | 103,602 | $ | 106,132 | $ | 104,819 | ||||||
| Operating income (loss): | ||||||||||||
| Services | $ | (10,938 | ) | $ | 3,706 | $ | 2,196 | |||||
| Pharmacy | (6,634 | ) | (26,850 | ) | (1,588 | ) | ||||||
| Catalog | (77 | ) | (1,093 | ) | (370 | ) | ||||||
| Unallocated corporate overhead | (9,851 | ) | (10,011 | ) | (9,485 | ) | ||||||
| Total operating loss | (27,500 | ) | (34,248 | ) | (9,247 | ) | ||||||
| Other income (expenses): | ||||||||||||
| Interest expense, net | 3,371 | 4,072 | 4,317 | |||||||||
| Loss on extinguishment of debt | - | 4,487 | - | |||||||||
| Change in fair value of warrant liability | (979 | ) | - | - | ||||||||
| Other | 30 | 75 | 129 | |||||||||
| Net loss before income tax expense | (29,922 | ) | (42,882 | ) | (13,693 | ) | ||||||
| Income tax expense | 29 | 122 | 535 | |||||||||
| Net loss from continuing operations | $ | (29,951 | ) | $ | (43,004 | ) | $ | (14,228 | ) | |||
| Depreciation and amortization: | ||||||||||||
| Services | $ | 758 | $ | 859 | $ | 932 | ||||||
| Pharmacy | 668 | 732 | 376 | |||||||||
| Catalog | - | 51 | 49 | |||||||||
| Corporate | 424 | 374 | 503 | |||||||||
| Total depreciation and amortization | $ | 1,850 | $ | 2,016 | $ | 1,860 | ||||||
| Goodwill and intangible asset impairment: | ||||||||||||
| Services | $ | 14,599 | $ | - | $ | - | ||||||
| Pharmacy | - | 22,618 | - | |||||||||
| Catalog | - | 893 | - | |||||||||
| Total goodwill and intangible asset impairment | $ | 14,599 | $ | 23,511 | $ | - | ||||||
| March 31, | ||||||||||||
| 2010 | 2009 | 2008 | ||||||||||
| Capital expenditures: | ||||||||||||
| Services | $ | 63 | $ | 75 | $ | 173 | ||||||
| Pharmacy | 457 | 850 | - | |||||||||
| Catalog | - | - | 43 | |||||||||
| Corporate | 54 | 150 | 106 | |||||||||
| Total capital expenditures | $ | 574 | $ | 1,075 | $ | 322 | ||||||
| March 31, | ||||||||||||
| 2010 | 2009 | |||||||||||
| Assets: | ||||||||||||
| Services | $ | 25,007 | $ | 39,183 | ||||||||
| Pharmacy | 6,107 | 5,514 | ||||||||||
| Catalog | 201 | 221 | ||||||||||
| Unallocated corporate assets | 1,881 | 3,166 | ||||||||||
| Assets of discontinued operations | - | 11,308 | ||||||||||
| Total assets | $ | 33,196 | $ | 59,392 | ||||||||
F-37
Note 16 – Subsequent Event
On April 23, 2010,
the Company executed a Line of Credit and Security Agreement with H.D. Smith
Wholesale Drug Co. (“H.D. Smith”), its new primary supplier of pharmaceutical
products. Under terms of the agreement, the Company can borrow up to $5,000,000,
including amounts payable under normal product purchasing terms. Beginning April
1, 2011, borrowings under the agreement will be limited based upon a borrowing
base of the assets of the Pharmacy business. The debt accrues interest at the
greater of 7% and the prime rate plus 3%, and it matures on April 23, 2013.
Interest during the first 12 months of the agreement will be capitalized and
then interest only payments are required from May 2011 through April 2012.
Beginning with May 2012, the Company will make monthly payments of $75,000 plus
interest. Borrowing may be prepaid at any time without penalty. The agreement
includes certain financial covenants beginning in fiscal 2012.
In conjunction with
the credit agreement, the Company granted H. D. Smith 500,000 warrants to
purchase common stock at an exercise price of $0.40 per share and a 5-year
life.
The Company also
granted H.D. Smith up to an additional 500,000 warrants to purchase common
stock. These warrants vest on March 31, 2011 if the value of the Pharmacy
segment’s borrowing base does not exceed certain thresholds. The number of
warrants that vest depend on the computed borrowing base amount at that time.
The exercise price will be the lower of $0.40 or the preceding 10-day average of
the closing prices per shares on March 31, 2011. The warrants have a 5-year
life.
Note 17 — Quarterly Results
(Unaudited)
The following table
summarizes selected quarterly data of the Company for the years ended March 31,
2010 and 2009 (in thousands, except per share data):
| Quarter Ended | ||||||||||||||||
| June 30, | September 30, | December 31, | March 31, | |||||||||||||
| 2009 | 2009 | 2009 | 2010 | |||||||||||||
| Revenues, net | $ | 26,409 | $ | 25,616 | $ | 26,106 | $ | 25,471 | ||||||||
| Gross profit | 7,448 | 7,406 | 7,467 | 6,907 | ||||||||||||
| Loss from continuing operations | (3,596 | ) | (4,054 | ) | (3,021 | ) | (19,280 | ) | ||||||||
| Income (loss) from discontinued operations | (977 | ) | (92 | ) | (132 | ) | 66 | |||||||||
| Net loss | (4,573 | ) | (4,146 | ) | (3,153 | ) | (19,214 | ) | ||||||||
| Basic and diluted net loss per share: | ||||||||||||||||
| (1) Loss from continuing operations | (0.02 | ) | (0.03 | ) | (0.02 | ) | (0.11 | ) | ||||||||
| (1) Loss from discontinued operations | (0.01 | ) | - | - | - | |||||||||||
| $ | (0.03 | ) | $ | (0.03 | ) | $ | (0.02 | ) | $ | (0.11 | ) | |||||
| Quarter Ended | ||||||||||||||||
| June 30, | September 30, | December 31, | March 31, | |||||||||||||
| 2008 | 2008 | 2008 | 2009 | |||||||||||||
| Revenues, net | $ | 26,778 | $ | 26,719 | $ | 26,692 | $ | 25,943 | ||||||||
| Gross profit | 8,110 | 8,215 | 7,874 | 7,564 | ||||||||||||
| Loss from continuing operations | (4,003 | ) | (3,775 | ) | (2,871 | ) | (32,666 | ) | ||||||||
| Income (loss) from discontinued operations | 717 | 540 | (366 | ) | (4,046 | ) | ||||||||||
| Net loss | (3,286 | ) | (3,235 | ) | (3,237 | ) | (36,712 | ) | ||||||||
| Basic and diluted net loss per share: | ||||||||||||||||
| (1) Loss from continuing operations | (0.03 | ) | (0.03 | ) | (0.02 | ) | (0.24 | ) | ||||||||
| (1) Income (loss) from discontinued operations | - | 0.01 | - | (0.03 | ) | |||||||||||
| $ | (0.03 | ) | $ | (0.02 | ) | $ | (0.02 | ) | $ | (0.27 | ) | |||||
| (1) |
Because of the method used in
calculating per share data, the quarterly per share data may not
necessarily total to the per share data as computed for the entire
year.
|
F-38
The increase in the
loss from continuing operations in the fiscal fourth quarter 2010 compared to
the three previous quarters was due to the following:
- Total goodwill impairment expense recognized in the fiscal fourth quarter 2009 of $14,599,000.
The increase in the
loss from continuing operations in the fiscal fourth quarter 2009 compared to
the three previous quarters was due to the following:
- Total goodwill and intangible asset impairment expense recognized in the fiscal fourth quarter 2009 of $23,511,000.
- The loss on extinguishment of debt relating to the March 25, 2009 debt refinancing recognized in the fiscal fourth quarter of $4,237,000.
The increase in the
loss from discontinued operations in the fiscal fourth quarter 2009 compared to
the three previous quarters was due to the following:
- Total goodwill and intangible asset impairment expense recognized in the fiscal fourth quarter 2009 of $2,943,000.
F-39
ARCADIA RESOURCES, INC. AND SUBSIDIARIES
SCHEDULE I — CONSOLIDATED FINANCIAL INFORMATION OF REGISTRANT
SCHEDULE I — CONSOLIDATED FINANCIAL INFORMATION OF REGISTRANT
CONDENSED PARENT
COMPANY BALANCE SHEETS
(In Thousands)
(In Thousands)
| March 31, | |||||||
| 2010 | 2009 | ||||||
| ASSETS | |||||||
| Current assets: | |||||||
| Cash and cash equivalents | $ | 300 | $ | 1,022 | |||
| Prepaid expenses and other current assets | 574 | 395 | |||||
| Total current assets | 874 | 1,417 | |||||
| Property and equipment, net | 596 | 901 | |||||
| Other assets | 412 | 531 | |||||
| Investment in subsidiaries | 15,367 | 35,751 | |||||
| Total assets | $ | 17,249 | $ | 38,600 | |||
| LIABILITIES AND STOCKHOLDERS’ EQUITY (DEFICIT) | |||||||
| Current liabilities: | |||||||
| Accounts payable | 1,099 | 1,031 | |||||
| Accrued expenses | 1,234 | 818 | |||||
| Fair value of warrant liability | 1,499 | - | |||||
| Total current liabilities | 3,832 | 1,849 | |||||
| Long-term obligations | 25,192 | 26,918 | |||||
| Total liabilities | 29,024 | 28,767 | |||||
| STOCKHOLDERS’ EQUITY (DEFICIT) | |||||||
| Total stockholders’ equity (deficit) | (11,775 | ) | 9,833 | ||||
| Total liabilities and stockholders’ equity (deficit) | $ | 17,249 | $ | 38,600 | |||
See accompanying note to these financial
statements.
F-40
ARCADIA RESOURCES, INC. AND SUBSIDIARIES
SCHEDULE I — CONSOLIDATED FINANCIAL INFORMATION OF REGISTRANT
SCHEDULE I — CONSOLIDATED FINANCIAL INFORMATION OF REGISTRANT
CONDENSED PARENT
COMPANY STATEMENTS OF OPERATIONS
(In Thousands)
(In Thousands)
| Year Ended March 31, | ||||||||||||
| 2010 | 2009 | 2008 | ||||||||||
| Loss from operations | $ | (9,852 | ) | $ | (10,011 | ) | $ | (9,488 | ) | |||
| Interest expense | 2,760 | 3,146 | 2,536 | |||||||||
| Loss on extinguishment of debt | - | 4,239 | - | |||||||||
| Change in fair value of warrant liability | (979 | ) | - | - | ||||||||
| Loss before equity in consolidated subsidiaries | (11,633 | ) | (17,396 | ) | (12,024 | ) | ||||||
| Equity in consolidated subsidiaries | (19,453 | ) | (29,074 | ) | (11,374 | ) | ||||||
| NET LOSS | $ | (31,086 | ) | $ | (46,470 | ) | $ | (23,398 | ) | |||
See accompanying note to these financial
statements.
F-41
ARCADIA RESOURCES, INC. AND SUBSIDIARIES
SCHEDULE I — CONSOLIDATED FINANCIAL INFORMATION OF REGISTRANT
SCHEDULE I — CONSOLIDATED FINANCIAL INFORMATION OF REGISTRANT
CONDENSED PARENT
CONSOLIDATED STATEMENTS OF CASH FLOWS
(In Thousands)
(In Thousands)
| Year Ended March 31, | ||||||||||||
| 2010 | 2009 | 2008 | ||||||||||
| Operating activities | ||||||||||||
| Net cash used in operating activities | $ | (6,529 | ) | $ | (6,039 | ) | $ | (10,086 | ) | |||
| Investing activities | ||||||||||||
| Purchases of property and equipment | (54 | ) | (440 | ) | (370 | ) | ||||||
| Net cash used in investing activities | (54 | ) | (440 | ) | (370 | ) | ||||||
| Financing activities | ||||||||||||
| Proceeds from the issuance of notes payable / line of credit, net of fees | 2,142 | 2,800 | 5,000 | |||||||||
| Payments on notes payable | (6,524 | ) | - | (3,917 | ) | |||||||
| Proceeds from the issuance of common stock, net of fees | 10,243 | - | 12,442 | |||||||||
| Net cash provided by financing activities | 5,861 | 2,800 | 13,525 | |||||||||
| Net change in cash and cash equivalents | (722 | ) | (3,679 | ) | 3,069 | |||||||
| Cash and cash equivalents, beginning of year | 1,022 | 4,701 | 1,632 | |||||||||
| Cash and cash equivalents, end of year | $ | 300 | $ | 1,022 | $ | 4,701 | ||||||
See accompanying note to these financial
statements.
F-42
ARCADIA RESOURCES, INC. AND SUBSIDIARIES
NOTE TO CONDENSED PARENT COMPANY FINANCIAL STATEMENTS
NOTE TO CONDENSED PARENT COMPANY FINANCIAL STATEMENTS
These condensed
parent company financial statements have been prepared in accordance with Rule
12-04, Schedule 1 of Regulation S-X and included herein because the restricted
net assets of the consolidated subsidiaries of Arcadia Resources, Inc. (the
“Parent Company”) exceed 25% of consolidated net assets. In order to repay its
obligations, the Parent Company is dependent upon cash flows from certain
subsidiaries without restrictions or through a refinancing or equity
transaction. The Parent Company’s 100% investment in its subsidiaries has been
recorded using the equity basis of accounting in the accompanying condensed
Parent Company financial statements.
F-43
ARCADIA RESOURCES, INC. AND SUBSIDIARIES
FINANCIAL STATEMENT SCHEDULE
SCHEDULE II — VALUATION AND QUALIFYING ACCOUNTS
FINANCIAL STATEMENT SCHEDULE
SCHEDULE II — VALUATION AND QUALIFYING ACCOUNTS
The following table
summarizes the activity and ending balances in the allowance for doubtful
accounts from continuing operations (amounts in thousands) for the years ended
March 31,:
| Balance at | Charged to | Balance at | ||||||||||||||
| Beginning | Costs and | End | ||||||||||||||
| of Period | Expenses | Recoveries | Deductions | of Period | ||||||||||||
| 2010 | $ | 3,386 | $ | 1,171 | $ | 22 | $ | (1,956 | ) | $ | 2,623 | |||||
| 2009 | 2,507 | 1,458 | 204 | (783 | ) | 3,386 | ||||||||||
| 2008 | 2,091 | 663 | 71 | (318 | ) | 2,507 | ||||||||||
F-44